Technologies To Sustain Forest Resources (Part 6 of 21)
22
Transcript of Technologies To Sustain Forest Resources (Part 6 of 21)


Highlights . . . . . . . . . . . . . . . . . . . . . . . . . . . . . . . . . . . . . . . . . . . . . . . . . . . . . . . . . . . . . . .
The Data Base. . . . . . . . . . . . . . . . . . . . . . . . . . . . . . . . . . . . . . . . . . . . . . . . . . . . . . . . . . . .
Extent of Remaining Tropical Forest . . . . . . . . . . . . . . . . . . . . . . . . . . . . . . . . . . . . . . . .Closed Forest.. . . . . . . . . . . . . . . . . . . . . . . . . . . . . . . . . . . . . . . . . . . . . . . . . . . . . . . . . .Open Forests and Shrublands . . . . . . . . . . . . . . . . . . . . . . . . . . . . . . . . . . . . . . . . . . . . .Forest Fallow. . . . . . . . . . . . . . . . . . . . . . . . . . . . . . . . . . . . . . . . . . . . . . . . . . . . . . . . . .
Forest Management . . . . . . . . . . . . . . . . . . . . . . . . . . . . . . . . . . . . . . . . . . . . . . . . . . . . . . .Forest Legislation and Policy . . . . . . . . . . . . . . . . . . . . . . . . . . . . . . . . . . . . . . . . . . . . .Forest Ownership . . . . . . . . . . . . . . . . . . . . . . . . . . . . . . . . . . . . . . . . . . . . . . . . . . . . . . .Wood Production . . . . . . . . . . . . . . . . . . . . . . . . . . . . . . . . . . . . . . . . . . . . . . . . . . . . . . .Natural Forest Management . . . . . . . . . . . . . . . . . . . . . . . . . . . . . . . . . . . . . . . . . . . . . .Plantations .. .. .. .. .. .. .. . . $ . . . . . . . . . . . . . . . . . . . . . . . . . . . . . . . . . . . . . . . . . . . .
Destruction of Forest Resources . . . . . . . . . . . . . . . . . . . . . . . . . . . . . . . . . . . . . . . . . . . .Deforestation . . . . . . . . . . . . . . . . . . . . . . . . . . . . . . . . . . . . . . . . . . . . . . . . . . . . . . . . . . .Resource Degradation . . . . . . . . . . . . . . . . . . . . . . . . . . . . . . . . . . . . . . . . . . . . . . . . . . .
projection of Changes . . . . . . . . . . . . . . . . . . . . . . . . . . . . . . . . . . . . . . . . . . . . . . . . . . . . .
Chapter 3 References . . . . . . . . . . . . . . . . . . . . . . . . . . . . . . . . . . . . . . . . . . . . . . . . . . . . . .
List of Tables
63
63
64646768
6970707374
757578
79
82
Table No. Page3. Estimates of Per Capita Closed Forest Areas and Deforestation Rates in
Tropical Africa, America, and Asia . . . . . . . . . . . . . . . . . . . . . . . . . . . . . . . . . . . . . . . 765. Annual Deforestation, 1981-85 . . . . . . . . . . . . . . . . . . . . . . . . . . . . . . . . . . . . . . . . . . . . 796. Forest Area Projections . . . . . . . . . . . . . . . . . . . . . . . . . . . . . . . . . . . . . . . . . . . . . . . . . . 81
List of Figures
Figure No. Page12. Classification of Woody Vegetation . . . . . . . . . . . . . . . . . . . . . . . . . . . . . . . . . . . . . 6613. Areas of Woody Vegetation in 76 Tropical Nations . . . . . . . . . . . . . . . . . . . . . . . 6714. Overall Area of Tropical Woody Vegetation . . . . . . . . . . . . . . . . . . . . . . . . . . . . . . 6915. Comparative Production of Wood, 1980 . . . . . . . . . . . . . . . . . . . . . . . . . . . . . . . . . 71
16A. Wood Production in Tropical Africa, 1969-80 . . . . . . . . . . . . . . . . . . . . . . . . . . . . 7216B. Wood Production in Tropical America, 1969-80 . . . . . . . . . . . . . . . . . . . . . . . . . . 7216C. Wood Production in Tropical Asia, 1969-80 . . . . . . . . . . . . . . . . . . . . . . . . . . . . . . 73
17. Plant Nutrient Loss Caused by Logging in Tropical v. Temperate Forests.. . . 80

Chapter 3
Status of Tropical Forests
●
●
●
●
HIGHLIGHTS
The area planted with trees in tropical re-gions each year is only about one-tenth ofthe forest area cleared.
Gradual resource degradation, especially inthe drier open forest areas, may have agreater long-term impact on human welfarethan deforestation.
Landsat imagery has greatly improvedknowledge of closed tropical forests and thisis enhancing forest management. However,data on open forests and forest resourcedegradation are still imprecise.
Forest data aggregated by region may sug-gest that no global problem exists. However,country-by-country analyses show that ratesof deforestation are high and forest area percapita is already low in many tropical na-tions.
Ž
●
●
The acreage within tropical forests that isfallowed or abandoned is growing rapidly.Some of this will naturally return to forestcover, but most of it does not regain produc-tivity without a concerted reforestationeffort.
Most tropical forest is owned by national orState governments, but locally recognizedrights to use the resources greatly complicatemanagement efforts.
Tropical forestry historically has tended toneglect the basic needs of people who livein and near the forests. This is changing aslaws, policies, and forestry professionals’ at-titudes give more attention to fuelwood, andto relationships between forestry and agri-culture.
THE DATA BASE
Data on the extent and condition of tropicalforest areas are abundant but widely scatteredand frequently inaccurate. Some of this infor-mation is based on old, imprecise measure-ments or estimates that have been updatedthrough simple extrapolation. Accuracy is fur-ther impaired by lack of standard definitionsand classifications of forest types; thus, the dataare difficult to compare across studies. Micro-level studies of project areas or watersheds con-tain some of the most reliable and detailed in-formation on forest resources and land use, yetthis information is hard to obtain because it ispoorly distributed,
A comprehensive synthesis of data about theworld’s tropical forest resources was con-ducted by the United Nations Food and Ag-riculture Organization (FAO) with the assist-ance of the United Nations Environment Pro-
gramme (UNEP) (3,4). The FAO/UNEP studyis the first where the definitions of forest typesand conditions are consistent across countries.It covers 76 nations; 73 nations are tropical orpartly tropical, and 3 nations are outside theTropics but are directly influenced by tropicalmonsoons. It does not include the tropicalregions of China, Australia, islands off thecoasts of Africa, the Pacific islands, or PuertoRico. Some of the forests included are in placeswhere the climate is more temperate than trop-ical.
The FAO/UNEP study relies mainly on datasupplied by governments. Most measurementsand estimates in various categories of forestwere made in the 1970’s. Then, using theestimated rates of change from one categoryto another, the figures were projected to rep-resent the situation in each nation as of 1980.
63

64 ● Technologies to Sustain Tropical Forest Resources
Several nations did not have complete data,and for 13 of these FAO commissioned newLandsat analyses. Some of the governmentestimates used by FAO are also based on Land-sat data.
Data gathered from the U.S. Landsat pro-gram has greatly enhanced the accuracy of in-formation on the extent of forests. By usingcomputers to study Landsat data, investigatorscan distinguish primary forests from second-ary forests, closed forests from open forestsand grasslands, and dominant types of trees(e.g., broadleaved, coniferous, mangroves).
forest cover over time. Hence, only a few ofthe estimated deforestation rates given in theFAO/UNEP study, presented later in this chap-ter, are based on remote sensing data. The restare mainly subjective estimates. In addition,since expertise and computers to analyze Land-sat data are not available in some tropical na-tions, many analyses have relied on visual in-terpretation of images, This method is moresubjective and less sensitive to small-scalechanges in forest area boundaries. In somecases, images cannot be used because of cloudcover,
Unfortunately, Landsat data have not beencollected long enough to reveal trends in the
EXTENT OF REMAINING TROPICAL FOREST
Closed Forest
Tropical nations contained some 1.2 billionhectares [ha) of closed forest at the end of 1980,Tropical America has 57 percent of the world’sclosed tropical forests, while Asia has 25 per-cent, and Africa has 18 percent (fig. 13). Theseforests are unevenly distributed among thetropical nations, Brazil alone has nearly two-fifths of the world’s total closed tropical forestsand Indonesia and Zaire each account for near-ly another tenth (table A-1 in app. A).
The condition of closed tropical forests maybe divided into several categories: undisturbed,logged, managed, physically unproductive, andprotected areas. Table A-2 in appendix Ashows the percent of forest in each categoryfor each of the 76 nations.
Over half (56 percent) of the total tropicalclosed forest is classified as undisturbed forest.This forest has commercial potential, but mostof it is relatively inaccessible to human popula-tions. When Brazil and Zaire with their enor-mous remote forests are excluded, the remain-ing tropical nations have two-fifths (41 percent)of their closed forest in the undisturbed cate-gory.
Another 14 percent of the total closed forestis productive forest that has been logged butis not under active forestry management. IvoryCoast, Togo, Benin, Sri Lanka, and Belize allhave at least 60 percent of their closed forestin this condition. Some other countries havehad extensive logging but register little forestin the logged condition because farmers quick-ly convert the logged forest to temporary orpermanent cropland. A prime example is Thai-land, which has had extensive logging butshows no forest in the logged condition.
Only about 3 percent of the total closed trop-ical forest is classified as managed. Much ofthis is in logged-over condition, but significantinvestments are being made to manage naturalregeneration. India classifies 63 percent of itsclosed forest as managed; Burma and Malaysiaeach classify about 12 percent as managed. Ex-cluding these three countries, only 0.3 percentof the rest of the tropical closed forest isclassified as managed. Most of that is in Ghana,Uganda, Kenya, Sudan, and Zambia.
Another one-quarter (23 percent) of theclosed forest is unproductive for physicalreasons. Much of this has not been disturbed
Ch. 3—Status of Troplca/ Forests ● 65
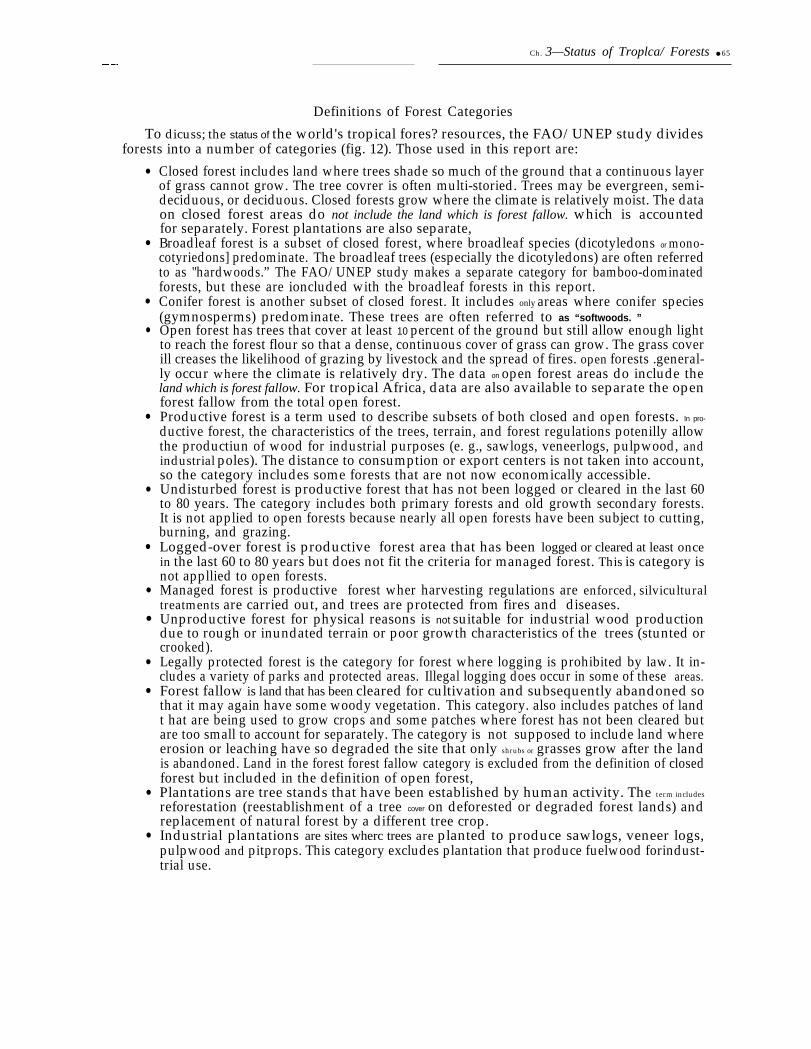
Definitions of Forest Categories
To dicuss; the status of the world's tropical fores? resources, the FAO/UNEP study dividesforests into a number of categories (fig. 12). Those used in this report are:
●
●
●
●
●
●
●
●
●
●
●
●
●
Closed forest includes land where trees shade so much of the ground that a continuous layerof grass cannot grow. The tree covrer is often multi-storied. Trees may be evergreen, semi-deciduous, or deciduous. Closed forests grow where the climate is relatively moist. The dataon closed forest areas do not include the land which is forest fallow. which is accountedfor separately. Forest plantations are also separate,Broadleaf forest is a subset of closed forest, where broadleaf species (dicotyledons or mono-cotyriedons] predominate. The broadleaf trees (especially the dicotyledons) are often referredto as "hardwoods.” The FAO/UNEP study makes a separate category for bamboo-dominatedforests, but these are ioncluded with the broadleaf forests in this report.Conifer forest is another subset of closed forest. It includes only areas where conifer species(gymnosperms) predominate. These trees are often referred to as “softwoods. ”Open forest has trees that cover at least 10 percent of the ground but still allow enough lightto reach the forest flour so that a dense, continuous cover of grass can grow. The grass coverill creases the likelihood of grazing by livestock and the spread of fires. open forests .general-ly occur where the climate is relatively dry. The data on open forest areas do include theland which is forest fallow. For tropical Africa, data are also available to separate the openforest fallow from the total open forest.Productive forest is a term used to describe subsets of both closed and open forests. In pro-
ductive forest, the characteristics of the trees, terrain, and forest regulations potenilly allowthe productiun of wood for industrial purposes (e. g., sawlogs, veneerlogs, pulpwood, andindustrial poles). The distance to consumption or export centers is not taken into account,so the category includes some forests that are not now economically accessible.Undisturbed forest is productive forest that has not been logged or cleared in the last 60to 80 years. The category includes both primary forests and old growth secondary forests.It is not applied to open forests because nearly all open forests have been subject to cutting,burning, and grazing.Logged-over forest is productive forest area that has been logged or cleared at least oncein the last 60 to 80 years but does not fit the criteria for managed forest. This is category isnot appllied to open forests.Managed forest is productive forest wher harvesting regulations are enforced, silviculturaltreatments are carried out, and trees are protected from fires and diseases.Unproductive forest for physical reasons is not suitable for industrial wood productiondue to rough or inundated terrain or poor growth characteristics of the trees (stunted orcrooked).Legally protected forest is the category for forest where logging is prohibited by law. It in-cludes a variety of parks and protected areas. Illegal logging does occur in some of these areas.Forest fallow is land that has been cleared for cultivation and subsequently abandoned sothat it may again have some woody vegetation. This category. also includes patches of landt hat are being used to grow crops and some patches where forest has not been cleared butare too small to account for separately. The category is not supposed to include land whereerosion or leaching have so degraded the site that only shrubs or grasses grow after the landis abandoned. Land in the forest forest fallow category is excluded from the definition of closedforest but included in the definition of open forest,Plantations are tree stands that have been established by human activity. The term includes
reforestation (reestablishment of a tree cover on deforested or degraded forest lands) andreplacement of natural forest by a different tree crop.Industrial plantations are sites wherc trees are planted to produce sawlogs, veneer logs,pulpwood and pitprops. This category excludes plantation that produce fuelwood forindust-trial use.

66 Ž Technologies to Sustain Tropical Forest Resources
• Social and environmental plantations are designed for soil and water protection or to pro-duce fuelwood and charcoal, polewood or construction wood for local use, or nonwood prod-ucts, such as gum arabics. The category excludes plantations for nonwood commodities suchas rubber, palm oil, coconuts, cloves, coffee, and cocoa. It also excludes trees planted toshade agricultural crops.
● Shrubland has woody vegetation covering at least 10 percent of the ground, but the mainwoody plants are bushy species with a height at maturity of 0.5 to 7 meters. Shrubland maybe the natural vegetation under dry or otherwise stressful conditions, or it may result fromsevere degradation of open or closed forest land. The data on shrubland areas include somefallow agricultural land.
Figure 12.—Classification of Woody Vegetation
by cutting; it is either too steep or too wet forlogging or farming, However, this category alsoincludes forest where the trees have no poten-tial for industrial wood production, in somecases due to excessive cutting and consequentresource degradation, Brazil, Indonesia, Peru,Mexico, New Guinea, and Zaire each have atleast 20 million ha of forest unproductive forphysical reasons. The name of this category is
misleading, since much of’ this forest can beproductive for fuelwood and other nonin-dustrial products and for essential environmen-tal services such as watershed protection,
Finally, about 3 percent of the closed tropicalforest has been given park or other legal pro-tection status. Again, the percentage of thetotal hides an unequal distribution. Over half

Ch. 3—Status of Tropical Forests • 67
Figure 13.—Areas of Woody Vegetationa in 76 Tropical Nations by Region(thousands of hectares, 1980 estimates)
Tropical America
P l a n t a t i o n
sed forestfallow108,612
61,650 Open woodlands216,997
Tropical Africa
Tropical Asia
Open woodlfallow104,335
Closed forestfallow. , 61,646
P l a n t a t i o n
f o r e s t s
1,780
Clo
and
sed fofallow69,225
rest
St ands
P l a n t a t i o n Open woodlandforests fallow5,111 3,990
(55 percent) of the protected forests are located land, grassland, or desert primarily depends onin just four countries—India, Zaire, Indonesia, how dry the climate is and on the moisture-and Brazil. Despite the legal status of park holding capacity of the soil. To an increasinglands on paper, many of these forests in fact extent, however, it also depends on human-do not receive much protection (3). caused factors (11).
Generally, closed forests grow where averageOpen Forest and ShrubIands annual rainfall is above 1,600 millimeters (mm).
Open forests are found where rain is from 900Tropical nations contain some 746 million to l,200 mm. In areas with 1,200 to 1,600 mm
ha of open forest and 624 million ha of shrub- of rain, the natural cover may be either openland. Whether the natural vegetation of a trop- or closed forest, depending on fire history, soil,ical area is closed forest, open forest, shrub- frequency of drought, and other environmen-

68 . Technologies to Sustain Tropical Forest Resources
tal factors. Shrublands grow where rain isbelow 900 mm. In transitional areas, fires andlivestock grazing can convert closed forest toopen forest and open forest to shrubland. Con-versely, closed or open forests can be reestab-lished in some places when fire and other pres-sures are eliminated (4,11).
Open forest and shrubland areas are uneven-ly distributed among tropical nations. The datadescribing these types of forests are much lessaccurate than for closed forests. This is partlybecause boundaries between open forest,shrubland, grassland, and fallow agriculturalland are difficult to determine. It is also be-cause there has been less interest in measur-ing or monitoring open forests and shrubland.Table A-3 in appendix A shows estimates forareas of open forest and shrubland in each ofthe 76 nations. Together, the African nationshave most (65 percent) of the tropical open for-ests, but Brazil again dominates with 157 mil-lion ha. Zaire has 71 million ha; Angola has 51million ha.
Shrublands also are mainly (7 I percent)found in Africa. Sudan has 87 million ha ofshrubland, and other African nations withlarge expanses of shrubland include Tanzania,Central African Republic, Zambia, andEthiopia. In tropical America, Brazil has 61million ha; Paraguay, Bolivia, and Mexico alsohave extensive shrublands. Among the tropicalAsian nations, Thailand, Kampuchea, Laos,and Indonesia all have substantial shrublandareas.
Since open tropical forests are more easilypenetrable than closed forests, nearly all ofthem have been cut, burned, or grazed bylivestock. Hence, no open forests are classifiedas undisturbed. Two-thirds of tropicalAmerica’s open forest is classified asproductive—having potential to produce woodfor industry, In Africa, where these forests aregenerally drier, only one-third is classified asproductive; just over one-fourth is classifiedproductive in tropical Asia.
Although few open forests fit the FAO/UNEPdefinition for “productive,” these woodlands
are important for nonindustrial products andservices. Much, perhaps most, of the openforest is used for livestock grazing andfuelwood collecting. These forests protect soilsand watersheds in the semiarid regions andtheir wildlife is important as food. Further,many of the trees are legumes capable of con-verting atmospheric nitrogen to fertilizer, andso they are important for restoring the fertili-ty of abandoned croplands.
Parks and protected areas account for 9 per-cent of the African tropical nations’ open for-ests. Tropical America has given protected areastatus to just 1 percent, and tropical Asia hasdesignated 2 percent for protection.
Forest Fallw
The closed tropical forest regions includesome 240 million ha of land in forest fallow.Overall about 1 in 6 ha in the closed forests arebeing used for shifting agriculture. But in manynations, shifting agriculture has claimed a larg-er part of the closed forest. Sierra Leone hasfive times as much forest fallow as closed for-est, Five other nations in tropical Africa, fourin tropical Asia, and four in tropical Americahave from 50 to 100 percent as much forest fal-low as closed forest, Table A-4 in appendix Ashows the ratio of forest fallow to forest foreach of the 76 nations. It is likely that muchof this fallow land will not be returned to forestuses. Under unfavorable site conditions andshort fallow periods, much of this land mayeventually become unproductive for agricul-ture as well.
Estimates of forest fallow areas are not ac-curate. However, shifting agriculture is by nomeans limited to moist areas. In dry regions,fallow serves to restore moisture as well asorganic matter and plant nutrients to the soil.The FAO/UNEP report estimates that aboutone-fifth of the land reported to be open forestis in fact forest fallow. Livestock graze on boththe forest fallow and the open forest that hasnot yet been used for crops.
Figure 14 shows relative areas of each vegeta-tion type for the 76 nations as a whole.

Ch. 3—Status of Tropical Forests Ž 69—
Figure 14.—Overall Area of TropicalWoody VegetationLand surface of the Earth
Land surface of the 76 countries studied
Coni fer -
\forests Plantat ions
SOURCE: Food and Agriculture Organization/United Nations EnvironmentProgramme, Tropical forest Resources Assessment Project (GEMS):Tropical Africa, Tropical Asia, Tropical America, 4 VOIS. (Rome: FAO,1981)
FOREST
Forest Logislation and Policy
Forest legislation and policy are evolving intropical countries to reflect a growing aware-ness of the social and environmental implica-tions of forestry decisions. Many tropical na-tions substantially revised their forestry lawsduring the 1960’s and 1970’s. In many cases,however, the laws look good on paper, but arenot well-enforced (7).
Some issues have become more prominentin the last 5 to 10 years. For example, manycountries have revised their logging laws andpolicies to be more restrictive regarding timberallocation from public land, lease terms, con-cession fees and taxes, annual allowable cutlimits, regeneration methods, and export of un-processed logs.
MANAGEMENTOther prominent policy issues include accel-
erating reforestation on degraded lands, pro-tecting watersheds, increasing incentives forindustrial plantations and farm forestry, andlegislative support for reforesting communalland. Social issues, too, increasingly are beingrecognized (e.g., the needs of slash-and-burncultivators and nomadic grazers, domestic fuel-wood requirements, and release of forest landsto settled agriculture). Many tropical countriesnow view conservation as important to eco-nomic development and, thus, are more awareof the need to sustain multiple-use of forests,preserve biological diversity, maintain parksand protected areas, and guard against the lossof mangroves.
Some gaps, however, still need to be ad-dressed. There is a need to evaluate tropical

70 ● Technologies to Sustain Tropical Forest Resources
forest resource policy, but no organization hassuch a program. The connection betweenforests and policies in other sectors such asland tenure and agrarian reform also needs tobe assessed.
Forest Ownership
In order to understand the use and loss offorest resources and to devise effective policiesfor managing forests, it is important to knowthe legal and de facto ownership of forest landsand trees. The legal status of land may not in-dicate who has practical control of land use.For example, owners of large properties mayappropriate adjoining public lands. Also, slash-and-burn cultivators and other landless poormay occupy communal forests. In fact, tree ten-ure may differ from land tenure.
The FAO/UNEP report (3) summarizes forestownership by regions and provides some de-tails at the national level. In tropical America,forest ownerships may be public, private, orcommunal. Most conifer forests in Brazil andin Central American nations are privatelyowned. The much larger broadleaved forestsare public property, but national laws regard-ing forest ownership often are contradicted bylocal practice.
The situation is more complex in tropical Af-rica where private ownership of forests is rare.Traditional use rights in most forest areas are rec-ognized for hunting, gathering nonwood prod-ucts, acquisition of fuelwood and constructionwood, and shifting cultivation or grazing. Peo-ple may have exclusive rights over trees thatthey plant on communal lands. Local com-munity ownership of forest lands in many for-mer British colonies is recognized in nationalforestry laws. In former French colonies, localrights are not recognized at the national leveland all forests are considered state property.
In tropical Asia, 80 to 90 percent of the forestland is state-owned and under the legal con-trol of the forest departments. However, a largepart of this land is illegally occupied by forestfarmers, both those who practice traditionalshifting agriculture and those who try to use
the forest land for continuous cropping andgrazing. State control over forest lands hasbeen a gradual process, taking place mainlyover the past 30 years. The central governmentin Nepal and some states in India such as WestBengal took control of all forested land fromthe villages in the 1950’s. Papua New Guineaand most of the Pacific Islands are exceptionsto this general rule. There, forests are ownedby clans and tribes and the government has tonegotiate with them for the right to use forestresources.
Wood Production
The 76 nations covered by the FAO/UNEPstudy of tropical forests produce 1.4 billioncubic meters of wood annually (measured asround logs extracted from the forest). As fig-ure 15 indicates, this is about half of all thewood production in the world, and most (86percent) of it is used for firewood or charcoal.The rest is “industrial wood” used for domesticand export production of sawlogs, veneer logs,lumber, poles, pulpwood, wood panels, andother processed products. Figure 16 indicateschanges in wood production for each of thetropical regions over a 12-year period.
The production of industrial wood varieswith economic conditions. Generally economicdevelopment during the 1970’s, resulted in in-creasing demand for industrial wood in all thetropical regions. Industrial wood productionincreased most rapidly in tropical Asia and inWest Africa with the growth of markets forsawlogs and veneer logs from those regions.More recently, slowing economies have con-strained the growth in production. If rapideconomic growth resumes, tropical Americamay experience substantial industrial woodproduction increases.
Significant investments were made in millsand infrastructure during the 1970’s, but thesehave operated below capacity because of weakmarkets. In Asia and West Africa, depletion ofresources is likely to constrain sawlog andveneer log production, but resurgence ofeconomic growth should create domestic

Ch. 3—Status of Tropical Forests ● 71
5.—Comparative
Fuelwood
Production of Wood, 1980
/ Other \
3%Tropica l Amer
5010
Tropical Asia6 %
i c a
Total roundwoodSOURCE: Adapted from Food and Agriculture Organization/United Nations Environment Programme, Tropical Forest Resources, Forestry Paper No
30 (Rome: FAO, 1982)
markets for wood chips to produce pulp and dominance will become greater where eco-other wood products made from a wider varie- nomic growth continues to be slow.ty of trees,
The increase in total wood production isdriven by a steady increase in fuelwood pro-duction. However, the data on fuelwood appar-ently are obtained by multiplying unchangingestimates of per capita consumption by eachcountry’s population. Thus, the growth in pro-duction is probably not so steady as figure 16suggests. Nevertheless, fuel is certainly thedominant use for wood in the Tropics and that
Looking at figure 16, one might expect thattropical forestry efforts would be concentratedmainly on fuelwood production. However, un-til recently forestry departments in tropicalcountries, international assistance agencies,and multilateral development banks have con-centrated most of their efforts on industrialwood production. Industrial production at-tracts investment in the forestry sector becauseit can earn foreign exchange and concessionfees, and it can be taxed. Thus, industrial wood

72 ● Technologies to Sustain Tropical Forest Resources
Figure 16/L-Wood Production in Tropical Africa, 1969-80
400,000
350,000
Fuelwood Sawlogs and Other Industrialveneer logs roundwood
I I
300,000 -
250,000 -
200,000 -
150,000 -
100,000 -
50,000 -
01970 1971 1972 1973 1974 1975 1976 1977 1978 198019791969
Years
SOURCE Adapted from Food and Agriculture Organization/United Nations Environment Programme, Tropical Forest Resources, Forestry Paper No.
30 (Rome: FAO, 1982)
Figure 16 B.–Wood Production in Tropical America, 1969.80450,000t
I Fuelwood Sawlogs and Other Industrialveneer logs
400,000
roundwood
350,000
300,000
t250,000 -
200,000 -
150,000 -
1oo,ooo -
50,000 -
0 -19801969 1970 1971 1972 1973 1974 1975 1976 1977 1978 1979
Years
SOURCE’ Adapted from Food and Agriculture Organization/United Nations Environment Programme, Tropical Forest Resources, Forestry Paper No,
30 (Rome: FAO, 1982)

Ch. 3—Status of Tropical Forests Ž 73
Figure 16C.–Wood Production in Tropical Asia, 1969-80700,000 -
600,000
500,000
400,000
300,000
200,000
100,000
o
Fuelwood
[
Sawloas and Other Industrialveneer logs roundwood
19751970 1971 1972 I 973 1974 1976 1977 1979 19801969I
Years
SOURCE dated from Food and Agriculture Organlzatlon/United Nations Environment Program me, Tropical Foresf Resources Forestry Paper No30 (Rome FAO. 1982) -
production probably will continue to dominatetropical forestry activities.
The problem of ensuring an adequate indus-trial wood supply for international trade* ismore tractable than problems associated withfuelwood supply, impacts of deforestation onsoil and water resources, or maintenance ofbiological diversity. First, nearly 75 percent ofthe world’s industrial wood is now producedin the temperate zone. Second, industrial woodsupplies have grown at reasonably stable ratesfor 30 years (9). And third, a large proportionof the world’s future consumption of industrialwood can come from plantations. One recentestimate is that 140 million ha of well-managedplantations could, theoretically, supply all theindustrial wood consumed in the world in theyear 2000 (8). That would be an area equal to5 percent of the present forested area in theworld.
Much more wood is consumed in tropicalcountries for fuelwood, however. Serious short-ages of fuelwood, lumber, poles, paper, andother forest products within nations are not be-ing met through international trade because ofhigh transportation costs and persistent pover-ty. Furthermore, conflicts between forest andagricultural land usescountries.
Natural Forest
are critical in many
Management
Only small areas of tropical forests are underintensive management (3). In tropical America,management is increasing. For example, Mex-ico is managing watershed forests through con-trolled logging. Belize, Brazil, Guatemala, andParaguay are designing management plans fornatural resources. Silvicultural trials andresearch efforts to develop suitable technolo-gies for managing natural forests are underway in Brazil, Costa Rica, French Guyana,Mexico, Peru, and Venezuela.
25-287 0 - 84 - 6

74 ● Technologies to Sustain Tropical Forest Resources
Some African nations, when they were Brit-ish and Belgian colonies, had developed har-vesting regulations and working plans for man-aging natural forests, but these have been aban-doned over the past two decades. Nigeria,Zaire, and Tanzania previously managed largeareas of natural forest, but no longer do so.Uganda reports a large managed area, althoughit is doubtful that the management plans havebeen implemented. The Congo also is prepar-ing plans that set the allowable cut for naturalforests and indicate appropriate silviculturalpractices.
The deciduous and conifer forests of SouthAsia—Burma, Bangladesh, India, and Paki-stan—have a long history of intensive forestmanagement. India alone contains 60 percentof all the managed forest in the 76 tropical na-tions. However, the remaining tropical forestsof South Asia and the forests of Southeast Asiaare not intensively managed for a number ofreasons. Information on forest ecology and dy-namics is scarce. Forestry departments lacktrained personnel to manage the forests. Theemphasis in forestry has been on commercialexploitation so that little attention has beengiven to silvicultural treatments (3).
About 11.5 million ha of tree plantations hadbeen established in the 76 nations by the endof 1980 (table A-5 in app. A). Most (68 percent)of these are in just three countries: Brazil, In-dia, and Indonesia. About 7 million ha are in-tended to produce sawlogs, veneerlogs, pulp-wood, or industrial poles. Only 4.4 million hahave been planted for fuelwood and charcoal,for environmental protection, and for nonwoodproducts such as gum arabic.
The estimated rate of planting in the tropicalnations is about 1.1 million ha/yr (4). Currentplanting is intended mainly (53 percent) forlumber, paper, and industrial poles, but a grad-ual shift to fast-growing trees to produce fuel-wood and charcoal is occurring as a result ofchanging objectives in tropical forestry.
Forestry plantations are usually monocul-ture, often of exotic species, planted not whereforest cutting is occurring, but rather on landthat has been cleared for some time, such asabandoned farmland (5). Most industrial woodplantations in East Africa are softwoods (pinesand cypress), while in West Africa hardwoods(principally teak) are planted. In tropicalAmerica, pines are usually grown for saw tim-ber, while eucalyptus and gmelina are plantedfor pulpwood. Eucalyptus frequently is grownfor pulpwood in India, while teak is grown fortimber in India and Indonesia.
Two-thirds of nonindustrial plantations inAfrica are for fuelwood; the rest are mainly forgum arabic production or watershed protec-tion. In tropical America, three-quarters of theplantations classified as nonindustrial are euca-lyptus trees planted to supply charcoal to theiron and steel industry in the Brazilian Stateof Minas Gerais. Most of the rest is for produc-tion of forest fruit, such as “palmito.” Onlyabout 100,000 ha of plantations in tropicalAmerica are intended primarily for soil andwatershed protection; Mexico has most ofthese. In Asia, most nonindustrial plantationsare intended to produce locally consumed fire-wood and these are being planted at a rate ofabout 1 million ha/yr.
The rate of forest plantation establishmentis much too low to replace the amount of forestbeing cleared. In tropical America, the ratio ofarea planted to area deforested annually isabout 1 to 10.5; in tropical Africa it is 1 to 29;and in tropical Asia it is 1 to 4.5 (4). Further-more, most reforestation programs are not car-ried out where deforestation takes place. InBrazil, for example, plantations are concen-trated in the South, whereas forest clearing oc-curs mainly in the North.
The greatest discrepancy between reforesta-tion rates and the demand for wood and otherforest products is in Africa. In Asia, reforesta-tion is closer to deforestation becausedeforestation rates level off as the remainingforest is left only in inaccessible areas andbecause severe wood shortages in heavilypopulated areas are leading to greater plantingefforts (4).
Ch. 3—Stafus of Tropical Forests Ž 75
DESTRUCTION OF
Distinguishing between deforestation (alsocalled “clearing” in this report) and degrada-tion of forest resources is important. The FAO/UNEP study estimates deforestation rates for1976-80 and projects rate estimates for 1981-85.It does not, however, estimate degradationrates. Unlike deforestation, degradation is noteasy to identify through time-series Landsat orother remote-sensing analyses.
Deforestation
Each year about 0.5 percent of the remain-ing closed tropical forests and 0.6 percent ofthe remaining open tropical forests are con-verted to nonforest land uses or to wasteland.This is an aggregation of estimated deforesta-tion rates from the 76 countries covered by theFAO/UNEP report. In some countries, the de-forestation rate has been estimated by compar-ing Landsat or other remote-sensing data fromtwo time periods; for some, information onpopulation growth, farming, and animal hus-
Deforestation and Degradation
Much of the confusion over rates of changein forest areas stems from the failure to dis-tinguish between deforestation and degrada-tion. As defined here and in the FAO/UNEPreport:
● Deforestation is the conversion of foreststo land uses that have a tree cover of lessthan 10 percent. Thus, logged-over areas,including clear-cut areas, are not classi-fied as deforested if the forest is in theprocess of regenerating.
● Degradation of forests refers to biologi-cal, physical, and chemical processes thatresult in loss of the productive potentialof natural resources in areas that remainclassified as forest. Soil erosion and Iossof valuable or potentially valuable genetictypes are examples of degradation. Insome cases, forests can recover naturallyfrom degradation within a few decades.In other cases recovery may take muchlonger, if it occurs at all.
FOREST RESOURCES
bandry practices were considered as well.Table A-6 in appendix A shows estimated areasof closed forest converted to nonforest annu-ally for each of the 76 countries.
The overall tropical deforestation rate isstrongly affected by the status of the forests ina few tropical nations that have very large for-est areas relative to their population. Thus, the0.5 and 0.6 percent/yr figures obscure both sub-stantial differences among nations and theoverall severity of tropical deforestation.Closed forest area per capita is already lessthan O.O5 ha in 17 of the 76 nations. Over halfthe rest have deforestation rates between 1 and6.5 percent/yr. Table 3 indicates forest areasper capita and deforestation rate estimates foreach country.
Table 4 shows the 76 nations divided intonine categories of closed forest area and popu-lation size. Several countries, including Gabon,Congo, French Guiana, Surinam, and Guyana,have such large forests and so few people thattheir deforestation rates are very low. Clearly,closed tropical forests will exist in these na-tions for many decades, although even arelatively small population can cause resourcedegradation over large areas. Other nations,such as Liberia and Honduras, have largeamounts of forest but also have high deforesta-tion rates. If current rates of deforestation andpopulation growth were to continue, these twonations would, in just 15 years, reduce theirforest area per capita to half what it is. In somenations, deforestation can be expected to slowas the forests are reduced to inaccessible areasthat are unattractive to farmers. However, ex-perience in nations such as Haiti, El Salvador,Jamaica, Costa Rica, Nepal, Sri Lanka, Angola,and Ghana indicate that deforestation can con-tinue rapidly even when only limited forestsremain.
In tropical Africa, deforestation rates arehighest in the West African nations. Nigeriaand Ivory Coast together incur almost half (45percent) of the continent’s total annual defor-estation of closed forests, About 4 percent ofthe closed forests of the West African nations

76 . Technologies to Sustain Tropical Forest Resources
Table 3.—Estimates of Per Capita Closed Forest Areas and Deforestation Ratesin Tropical Africa, America, and Asia
Closed forest Closed forest Percent Closed forest Closed forest Percentarea area (ha) deforested area area (ha) deforested
Country (1,000 ha) per capita per yeara Country (1,000 ha) per capita per yeara
Tropicai Africa:Ivory Coast . . . . . . . . . .Nigeria. . . . . . . . . . . . . .Rwanda . . . . . . . . . . . . .Burundi . . . . . . . . . . . . .Benin . . . . . . . . . . . . . . .Guinea-Bissau . . . . . . .Liberia . . . . . . . . . . . . . .Guinea. . . . . . . . . . . . . .Kenya. . . . . . . . . . . . . . .Madagascar . . . . . . . . .Angola . . . . . . . . . . . . . .Uganda . . . . . . . . . . . . .Zambia. . . . . . . . . . . . . .Ghana . . . . . . . . . . . . . .Mozambique . . . . . . . . .Sierra Leone . . . . . . . . .Tanzania . . . . . . . . . . . .Togo. . . . . . . . . . . . . . . .Sudan . . . . . . . . . . . . . .Chad . . . . . . . . . . . . . . .Cameroon . . . . . . . . . . .Ethiopia . . . . . . . . . . . . .Somalia . . . . . . . . . . . . .Equatorial Guinea . . . .Zaire . . . . . . . . . . . . . . . .Central African
Republic . . . . . . . . . .Gabon . . . . . . . . . . . . . .Congo . . . . . . . . . . . . . .Zimbabwe . . . . . . . . . . .Namibia . . . . . . . . . . . . .Botswana . . . . . . . . . . .Mali . . . . . . . . . . . . . . . .Upper Volta . . . . . . . . . .Niger . . . . . . . . . . . . . . .Senegal . . . . . . . . . . . . .Malawi . . . . . . . . . . . . . .Gambia . . . . . . . . . . . . .
4,4585,950
1202647
6602,0002,0501,105
10,3002,900
7653,0101,718
935740
1,440304650500
17,9204,3501,5401,295
105,750
0.5O.7
bb
0.81.00.40.11.10.40.10.50.10.10.20.1O.l0.12.00.10.34.33.4
6.55.02.72.72.62.62.31.81.71.51.51.31.31.31.10.80.70.70.60.40.40.20.20.20.2
3,590 1.4 0.120,500 29.3 0.121.340 12.6 0.1
’200c
bb
cc
c b cc b cc b cc b c
220 b c
186 b c
65 0.1 c
El Salvador . . . . . . . . . .Jamaica . . . . . . . . . . . . .Nicaragua . . . . . . . . . . .Ecuador . . . . . . . . . . . . .Honduras . . . . . . . . . . .Guatemala . . . . . . . . . . .Colombia . . . . . . . . . . . .Mexico . . . . . . . . . . . . . .Panama . . . . . . . . . . . . .Belize . . . . . . . . . . . . . . .Dominican Republic . .Trinidad and Tobago..Peru . . . . . . . . . . . . . . . .Brazil . . . . . . . . . . . . . . .Venezuela . . . . . . . . . . .Bolivia . . . . . . . . . . . . . .Cuba . . . . . . . . . . . . . . .French Guiana . . . . . . .Surinam . . . . . . . . . . . .Guyana . . . . . . . . . . . . .
Totals . . . . . . . . . . . . .
Tropical Asia:Nepal . . . . . . . . . . . . . . .Sri Lanka . . . . . . . . . . . .Thailand . . . . . . . . . . . .Brunei . . . . . . . . . . . . . .Malaysia . . . . . . . . . . . .Laos . . . . . . . . . . . . . . . .Philippines . . . . . . . . . .Bangladesh . . . . . . . . . .Viet Nab . . . . . . . . . . . .Indonesia . . . . . . . . . . .Pakistan . . . . . . . . . . . .Burma . . . . . . . . . . . . . .
Totals . . . . . . . . . . . . . . 216.634 0.6 0.61 Kampuchea. . . . . . . . . .
Tropical America:Paraguay . . . . . . . . . . . . 4,070Costa Rica . . . . . . . . . . 1,638Haiti . . . . . . . . . . . . . . . . 48
1.2O.7
4.74.03.8
India . . . . . . . . . . . . . . . .Bhutan . . . . . . . . . . . . . .Papua New Guinea . . .
Totals . . . . . . . . . . . . .
141
67
4,496
14,250
3,797
4,442
46,400
46,250
4,165
1,354
629
208
69,680
357,480
31,870
44,0101,4558,900
14,83018,475
678,655
1,9411,6599,235
32320,995
8,4109,510
9278,770
113,8952,185
31,9417,548
51,8412,100
34,230
305,510
1.61.60.90.61.70.62.05.00.10.23.62.71.87.50.1
129.137.123.1
3.23.02.72.42.42.01.81.30.90.70.60.40.40.40.40.20.1
cc
c
2.1
0.10.10.21.21.42.30.2
b
0.20.7
b
0.81.30.11.5
11.0
0.2
0.6
4.33.52.71.51.21.21.00.90.70.50.30.30.30.30.10.1
0.6
aFrom 1981-85.bLessthan 0.05 forest hectares per capita.cNo data; in most cases this is where the areas are very small.
SOURCES: Population Reference Bureau, World Population Data Sheet Washington, D.C; Food and Agriculture Organization/United Nations Environment Programme,Tropical Forest Resources AssessrnenfF’reject (GEMS): Tropical Africa, Tropical Asia, Tropical Arnerica,4 vols. (Rome: FAO, 1981)
are deforested each year. Other African regionswith high deforestation rates include East Afri-ca, where 1.4 percent of the closed forest ca-pable of producing industrial wood is clearedeach year, and the nations of Burundi andRwanda, where the rate is 2.7 percent/yr. Largeareas of closed forest in Zaire and Cameroonare cleared—262,000 ha/yr together—but likeBrazil these countries are forest-rich so therates do not seem so alarming as in the otherAfrican nations.
Five nations in tropical America (Paraguay,Costa Rica, Haiti, El Salvador, and Jamaica)have deforestation rates of at least 3 percent/yr,while another six (Nicaragua, Ecuador, Hon-duras, Guatemala, Columbia, and Mexico)con-vert atleast l percent/yr of their closed forestto other uses or to unforested wasteland. Al-though deforestation in Brazil is low when ex-pressed as a percent of the remaining forest(0.4percent), it affects a large area—about l.5 mil-lion ha/yr. That is one-third of all the closed

Ch. 3—Status of Tropical Forests ● 7 7
Table 4.—Comparison of Tropical Countries’ Closed Forest Sizes, population Sizes, and Deforestation Rates—C l o s e d f o r e s t P o p u l a t i o n D e f o r e s t a t i o n
—
Region/country s l z ea s l z eb r a t ec
Tropical Africa:Kenya, . . . ., SmallUganda SmallGhana . . SmallMozambique SmallTanzania ., ., SmallSudan ... ., Small
B u r u n d i . ,Rwanda ., ., .,Benin . . . . . . . . . . . .Sierra Leone . . .C h a dU p p e r V o l t aZ i m b a b w e . . . . Mali . . . . ,,Niger . . . .S e n e g a l .M a l a w i , , . . , . . , , . . , , .
SmalISmallSmalISmallSmalISmallSmalISmalISmalISmalISmalI
Guinea-Bissau . . SmallTogo, . . . . . SmallEquatorial Guinea . . . . . SmallBotswana . . SmallGambia . . . . . . . . . . . SmallNamibia. , . . . . SmalI. . . . . . . . . . . . . . . . . . . . . . . . . . . . . . . . . . . . . . . . . . . . . . . . . . . . . . . . . . . .I v o r y C o a s t . MediurnN i g e r i a , . Med iumA n g o l a . . , . . Med iumEthiopia . Medium
Guinea . . . . . . . MediumZ a m b i a . . . . Med iumSomalia Medium
Liberia . . . ., . MediumCentra l Af r ican Republ ic Medium
Madagascar LargeCameroon LargeZaire . . . . . . . . . . LargeGabon ,., . LargeCongo, . . . . . . . . . . . . . . Large
Tropica l Amer ica:Cuba . Small
LargeLargeLargeLargeLargeLarge
Med iumMed iumMed iumMed iumMed iumMed iumMed iumMed iumMed iumMed iumMed ium
SmalISmalISmallSmalISmallSmall
. . . . . . . . . . . . . . . . .
LargeLargeLargeLarge
Med iumMed iumMed ium
SmallSmalI
. . . . . . . . . . . . . . . . .LargeLargeLargeSmallSmalI
Large
Med iumMed iumMed ium
1 ,7%1,31.31.10706272.7260804dddddd
2.6070.2ddd
655.015021.81.3022.30.1
1,50.40,20.101
01383206
Tropica/

78 • Technologies to Sustain Tropical Forest Resources
forest clearing each year in tropical America.Colombia and Mexico together account foranother third.
Three-fifths of the closed forest cleared intropical Asia each year is logged-over produc-tive forest and about one-quarter is previouslyundisturbed forests. The highest deforestationrate in Asia is 4.3 percent/yr in Nepal, and asignificant portion of this cutting occurs intemperate forests on mountain watersheds. InSri Lanka, deforestation is 3.5 percent/yr, andin Thailand it is 2.7 percent. Brunei, the Philip-pines, and Bangladesh also have very highdeforestation rates.
Rates of deforestation are calculated as theestimated area deforested per year divided bythe estimated 1980 forest area. Thus, theserates should not be confused with geometricrates of change, such as population growthrates. Acceleration or deceleration of deforesta-tion rates are influenced not only by popula-tion growth but also by many other factors suchas rural to urban migration rates, land tenurechanges, and especially road-building activi-ties. Much too little is known about how thesefactors interact to predict how deforestationrates will change over any long period.
The FAO/UNEP study does draw some infer-ences about changes in the accessibility of theremaining forests. The area of closed tropicalforest cleared each year may be decreasingslightly for tropical Africa as a whole duringthe first half of the 1980’s, since during the
, previous decade the closed forests in heavilypopulated countries of West Africa generallywere reduced to sites that are unattractive tofarmers. However, the rate probably is ac-celerating in some nations. Deforestation inLatin America, on the other hand, probably isincreasing because additional forested areasare becoming accessible as new roads andbridges are built. In tropical Asia, deforesta-tion is also thought to be increasing, but therate probably will level off in the 1990’s as theforests are reduced to inaccessible areas orsites where agricultural clearing is not worth-while.
Based on current and planned rates of treeplantation establishment, the areas reforestedin the Tropics as a whole are about one-tenthof the areas deforested.
Deforestation also occurs in open tropicalforests, Trees are cut and burned both by tradi-tional shifting agriculturists and by farmers in-tending to establish permanent croplands. Ex-tracting wood for fuel or industrial use, fires,and excessive grazing all cause deforestationby reducing tree cover to less than 10 percent.The open forest area data are poor, however,and the estimates of deforestation rates areeven less precise. Deforestation in the dry openforests is typically a gradual process and thusis more difficult to see than in moist areaswhere the tree canopies are more dense. Fur-ther, the open forest lands are often under thejurisdiction of agencies that consider grazingto be the main use of this land. Thus, the landis likely to be classified by its herbaceous coverrather than its tree cover.
The FAO/UNEP study does not list country-specific deforestation rates for open forests, butit does provide overall estimates of open forestclearing for tropical Africa, America, and Asia.These are shown in table 5. As a rough indi-cator of the pressure on open forest resources,table A-7 in appendix A indicates open forestarea per capita for each of the 76 nations.
Resource Degradation
Resource degradation, the long-term loss ofproductive potential, is much more difficult tomeasure than deforestation. Reduction of soilquality and loss of superior genetic types oftrees have been documented for specific forestlocations (6). But so little is known about theecology of the tropical forests or the economicpotential of the many tropical forest species thatdegradation can be a highly subjective term.Forest resource degradation is undoubtedly oc-curring (3,6) and, especially in the drier openforests where recovery is slower, it may be amore important change than deforestation (12),

Ch. 3—Status of Tropical Forests . 79
Table 5.—Annual Deforestation, 1981-85
Closed forests OpenUndisturbed Productive, logged Unproductive forests
(1,000 ha) (o/o) (1,000 ha) (0/ 0 ) (1,000 ha) (%) ( 1 , 0 0 0 h a )
AreaTotal open and reforestedclosed forests annually
0 / 0 ) ( 1-,000 ha) ( % ) (1,000 ha)
Tropical America . 1,299 0.29 1,867 2.78 1,173 0.74 1,272 0.59 5,611 0.63 535Tropical Africa . . . 226 0.19 1,032 2.31 73 0.14 2,345 0.98 3,676 0.52 126Tropical Asia. . . . . 395 0.39 1,278 1.28 153 0.15 190 0.61 2,016 0.60 438
Total . . . . . . . . . . 1,920 0.28 4,177 1.98 1,399 0.45 3,807 0.52 11,303 0.58 1,099SOURCE Calculated from Food and Agriculture Organlz~lon/United Nations Ennvironment Programme, Tropical Forest Resources, Forestry Paper No 30 (Rome FAO, 1982)
Forest resource degradation has multiplecauses. Logging practices can cause degrada-tion by damaging residual trees, damaging soil,or failing to create an environment where nat-ural regeneration of valuable forest species canoccur. Forests in tropical America and Africatypically contain a large number of tree speciesper hectare, but just a few are commerciallyvaluable for timber. Logging in these areas usu-ally means felling and extracting only the best-shaped, large individuals of selected species.Yet, substantial and lasting damage is oftendone to the residual trees as a result of mech-anized logging and skidding operations (10). Asmuch as one-half of the residual stand may bedamaged (e.g., broken stems and branches ordisturbed roots) and one-third of the loggedarea may undergo soil damage (2).
Some tropical forests, such as the Diptero-carp forests of South and Southeast Asia, havea large number of commercially valuable spe-cies per hectare and are clearcut. This cancause soil erosion that reduces the potential fornatural regeneration. In tropical moist forestsa large proportion of the ecosystem’s nutrientsare tied up within the biomass of trees ratherthan the soils (fig. 17). Thus, a large share ofthe nutrients may be exported from the forest
with the logs. Machinery is available to harvestwhole trees and to use multiple species to pro-duce pulpwood. Although these technologiesare not yet widely used in the Tropics, theycould accelerate the loss of soil fertility (2). Fur-thermore, many tropical tree species seed irreg-ularly or at long intervals (once in 5 to 7 years).If clearcutting is practiced, natural regenera-tion of these species may not occur. Clearcut-ting also reduces regeneration of trees, suchas Dipterocarps, whose seedlings need to growin partial shade (l).
Conifer and mangrove forests in all threetropical regions and certain other forests intropical America (e.g., “cativo” and “sanjo”forests of Panama and Colombia) also have alow diversity and often are clearcut or cutoverso severely that soil conditions are unable tosupport natural regeneration.
Even where clearcutting is not practiced, log-ging roads can lead to degradation, For exam-ple, in Sabah and the Philippines, approximate-ly 14 percent of forest concession areas arecleared for logging roads (3). Poorly designedor constructed roads cause erosion and waterdrainage problems and may increase the sever-ity of Landslides,
Pro ject ion OF CHANGES
The FAO/UNEP study provides someestimates of rates at which forests are beingchanged from one category to another duringthe period 1980-85, although quantitative dataon natural resource degradation in areas thatremain classified as forest are not available. A
straight-line projection of the FAO/UNEP esti-mates, while not a forecast, can provide anunderstandable way to describe the magnitudeof resource changes that may occur. Table 6shows the projected forest areas for each of thethree tropical regions.

80 ● Technologies to Sustain Tropical Forest Resources
Figure 17.—Plant Nutrient Loss Caused by Logging in Tropical v. Temperate Forests
Tropical Temperate
Nitrogen10 ”/0
harvestloss
Phosphorus
Potassium
2 %
390/0
280/o 14 ”/0
Calcium 20% 50/0
57 ”/0
7 “/0

Ch. 3—Status of Tropical Forests • 81
Table 6.–Forest Area Projections (1,000 ha)
Tropical Africa Tropical America Tropical AsiaChange Change Changeover 20 over 20 over 20
Forest Category 1980a 1985a 2 0 0 0b years (O/. ) 1980a 1985 a
2 0 0 0b years (o/o) 1980 a 1985 a 2 0 0 0b y e a r s ( 0 / 0 )
Closed forests :U n d i s t u r b e d , p r o d u c t i v e . , 1 1 8 , 4 5 0 1 1 4 , 1 3 4 1 0 1 , 1 8 6 – 1 5 454,507 438,119 388,995 – 1 4 1 0 1 , 3 5 2 8 9 , 0 8 7 5 2 , 2 9 2 – 4 8L o g g e d , p r o d u c t i v e . , . , 4 2 , 8 4 8 4 0 , 9 1 1 3 5 , 1 0 0 – 1 8 66,622 67,281 69,258 +4 5 9 , 8 4 7 6 0 , 4 2 4 6 2 , 1 5 5 + 4M a n a g e d , p r o d u c t i v e . . . . 1,735 1,689 1,551 – 1 1 522 522 522 0 39.790 40,032 40,758 + 2Fallow In closed forests 61,646 66,705 81,882 +33 108.612 116,303 139,376 +28 69,225 73.729 87.241 +26Physically unproductive or
parks and protected areas 53,601 53,236 52,141 –3 157,004 151,140 133,548 –15 104,521 106,836 113,781 +9Open forests:Productive ., ., . . . . 169,218 159,555 130,566 – 2 3 142,887 136,787 118,487 – 1 7 8,530 8,075 6,710 –21Unproductive ... ., ., . 317,227 315,167 308,987 – 3 74,110 73,850 73,070 – 1 22,418 21,923 20,438 -9F a l l o w I n o p e n f o r e s t s , 1 0 4 , 3 3 5 1 1 1 , 5 2 0 1 3 3 , 0 7 5 + 2 8 6 1 , 6 5 0 6 2 , 9 5 0 6 6 , 8 5 0 + 8 3,990 4,100 4.430 + 1 1
aSOURCE Food and Agriculture Organ!zat!on/United Nat Ions Environment Program me, Tropica/ Forest Resources, Forestry Paper No 30 (Rome FAO, 1982)‘Extrapolated from current rates of change excludes plantations
This 20-year projection suggests that at cur-rent rates of logging and deforestation in trop-ical Africa, the area of undisturbed forestwould decline 15 percent by the year 2000.Some of this is because timber harvest will con-vert undisturbed forest to logged forest. Thelogged forest category also includes secondaryforest on land that is recovering from use forshifting agriculture. However, in spite of theseadditions, the logged forest area is decreasingbecause this category incurs most of the defor-estation for agriculture, Since the land does notsustain continuous cropping, the forest fallowarea is expected to increase over the 20-yearperiod by one-third. Changes in the open for-ests of Africa would be even greater. The openforest fallow is already larger than the fallowarea in Africa’s closed tropical forests. It wouldincrease by another 28 million ha as produc-tive open forest is degraded to the unpro-ductive category and both are cleared for shift-ing agriculture.
The projection shows a 14-percent reductionin the area of productive undisturbed forest intropical America, It also shows a 4 percent in-crease in the area of logged forest, which sug-gests that logging of undisturbed forest out-paces clearing of logged forest only slightly.Meanwhile, the forest fallow area in tropicalAmerica would increase by only about half asmany hectares as are lost from the forest cate-gories, implying that large areas are being con-verted to nonforest uses other than shifting ag-riculture. The main reason for converting for-
est land in tropical America in recent years hasbeen to make cattle pasture, although this usegenerally is not sustainable in moist forestareas. The area of closed forest that is unpro-ductive for physical or legal reasons is also de-clining significantly, suggesting that this landis not so inaccessible as its definition implies.
The change rates for tropical America’s openforests imply degradation of forest from theproductive category, simultaneous clearing ofthe unproductive forest, and a net increase inopen forest fallow that can account for only afraction of the reduction in the forest catego-ries. Again, this means a net conversion ofopen forest into cropland, grazing land, anddegraded land where forests do not regeneratenaturally, and it means a substantial declinein the quality of the remaining open forest.
Tropical Asia shows the highest reduction(21 percent) in undisturbed productive forest,although such forest has already been reduc-ed to an area much smaller than in tropicalAfrica and America. The logged-over area isincreasing slightly, probably because forestrydepartments in several Asian nations havesome control over the spontaneous clearing forcropland that follows logging operations, Thearea of forests unproductive for physical orlegal reasons is increasing in tropical Asia,though whether this is a result of more parksbeing established or of severe degradation ofthe logged-over forests is not clear. Open for-ests in tropical Asia are not so extensive as in

82 . Technologies to Sustain Tropical Forest Resources—
the other regions, but the pattern of degrada-tion and deforestation is similar.
Reviewing the FAO/UNEP study’s findingson deforestation and resource degradation,westoby (12) declares that the situation is mostalarming in the drier areas, where the data areleast precise:
Among the one and a half thousand millionor so hectares of open forest and shrub land,there is an infinite gradation of forest andshrub, ranging from less dry and reasonablywooded forests at one end to extremely aridshrub formations at the other, with the bor-derline between what can still be regarded asforest and what is irretrievably lost, vague, dif-
1. Abraham, F., “Practices and Experience ofNASIPIT Lumber Co., Inc., and Affiliates in ItsNatural and Artificial Regeneration of Forestsand Plantations, ” Proceedings of a Conferenceon Improved Utilization of Tropical Forests(Madison, Wis: U.S. Forest Service Forest Prod-~~cts Laboratory, 1978).
2. Ewel, J., “Environmental Implications of Trop-ical Forest Utilization, ” InternaticmaZ Sympo-sium on Tropical Forests Utilization and Con-servation, F. Mergen (cd.) (New Haven, Corm.:Yale University Press, 1981), pp. 156-167.
3. Food and Agriculture Organization/United Na-tions Environment Programme, Tropical ForestResources Assessment Project (GEMS): Tropi-cal Africa, Tropical Asia, Tropical America (4vols.) (Rome: FAO, 1981).
4. Food and Agriculture Organization/United Na-tions Environment Programme, TropicaZ ForestResources, Forestry Paper No. 30 (Rome: FAO,1982).
5. Gallegos, C,, et al., “Technologies for Reforesta-tion of Degraded Lands in the Tropics, ” OTAcommissioned paper, 1982.
ficult to identify from aerial photography orsatellite imagery, and by no means easy to besure about when one is actually there standingin it. What is happening to these forests to-day, under the impact of a variety of pres-sures, can best be visualized as a steady push-ing along the spectrum, a general downgrad-ing, with the result that very substantial areasevery year slide out of sight and can no longerbe considered as forest on even the most gen-erous definition. But what should be givingconcern is not so much the 4 million or so hec-tares that are sliding off the visible spectrumas the general degradation which is sappingaway at the drier tropical forests through thewhole spectrum,
REFERENCES
6, Myers, N., Conversion of Tropical Moist For-ests (Washington, D. C.: National Academy ofSciences, 1980),
7. Schmithusen, F., “Recent Trends of ForestLegislation in Developing Countries,” Pro-ceedings: XVII IUFRO World Congress, Divi-sion 4 (Vienna: International Union of ForestResearch Organizations, 1981).
8. Sedjo, R., and Clawson, M., GZobaZ Forests(Washington, D, C,: Resources for the Future,1983).
9. Spears, J., Tropical Reforestation: An AchievableGoaZ? (Washington, D. C,: World Bank, 1983).
10. United Nations Economic, Social, and CulturalOrganization, Tropical Forest Ecosystems (Par-is: UNESCO/UNEP/FAO, 1978).
11. Weber, F., “Combating Desertification WithTrees,” OTA commissioned paper, 1982.
12, Westoby, J., “Halting Tropical Deforestation:The Role of Technology,” OTA commissiorltxlpaper, 1982,