Technological Competition and Strategic Alliances · PDF fileTechnological Competition and...
60
Technological Competition and Strategic Alliances * Kai Li Sauder School of Business University of British Columbia 2053 Main Mall, Vancouver, BC V6T 1Z2 604.822.8353 [email protected] Jiaping Qiu DeGroote School of Business McMaster University 1280 Main Street West, Hamilton, ON L8S 4M4 905.525.9140 [email protected] Jin Wang School of Business and Economics Wilfrid Laurier University 75 University Avenue West, Waterloo, ON N2L 3C5 519.884.0710 ext. 2660 [email protected] First version: August, 2014 This version: September, 2014 Abstract Using a large unique patent-strategic alliance dataset over the period 1990 to 2004, we first show that firms faced with greater technological competition are more likely to form alliances. Technological competition is captured by a cosine similarity measure between a firm’s own patent output and the patent output of all other firms in the economy. We further show that alliances lead to more patents afterwards at both client and partner firms, especially for partner firms faced with greater technological competition. Finally, we show that related patents increase significantly at both client and partner firms, whereas innovative efficiency and the productivity of individual inventors increase significantly only at partner firms. Our results are robust to endogeneity concerns. We conclude that technological competition is an important impetus for redrawing the boundaries of the firm in order to accelerate corporate innovation. Keywords: innovation, patents, R&D expenditures, strategic alliances, technological competition, technological overlap JEL classification: G34, O32 * We thank Steve Dimmock, Chuan Yang Hwang, Nengjiu Ju, Roger Loh, Ting Xu, and seminar participants at Carleton University, Nanyang Technological University, Shanghai Advanced Institute of Finance, Singapore Management University, and Wilfrid Laurier University for helpful comments. We also thank Andriy Bodnaruk for providing data on combined reporting and Alice Guo for excellent research assistance. We acknowledge financial support from the Social Sciences and Humanities Research Council of Canada (SSHRC). Li acknowledges financial support from the Sauder exploratory research grant program. All errors are our own.
Transcript of Technological Competition and Strategic Alliances · PDF fileTechnological Competition and...

Technological Competition and Strategic Alliances*
Kai Li Sauder School of Business
University of British Columbia 2053 Main Mall, Vancouver, BC V6T 1Z2
604.822.8353 [email protected]
Jiaping Qiu
DeGroote School of Business McMaster University
1280 Main Street West, Hamilton, ON L8S 4M4 905.525.9140
Jin Wang School of Business and Economics
Wilfrid Laurier University 75 University Avenue West, Waterloo, ON N2L 3C5
519.884.0710 ext. 2660 [email protected]
First version: August, 2014 This version: September, 2014
Abstract
Using a large unique patent-strategic alliance dataset over the period 1990 to 2004, we first show that firms faced with greater technological competition are more likely to form alliances. Technological competition is captured by a cosine similarity measure between a firm’s own patent output and the patent output of all other firms in the economy. We further show that alliances lead to more patents afterwards at both client and partner firms, especially for partner firms faced with greater technological competition. Finally, we show that related patents increase significantly at both client and partner firms, whereas innovative efficiency and the productivity of individual inventors increase significantly only at partner firms. Our results are robust to endogeneity concerns. We conclude that technological competition is an important impetus for redrawing the boundaries of the firm in order to accelerate corporate innovation.
Keywords: innovation, patents, R&D expenditures, strategic alliances, technological competition, technological overlap
JEL classification: G34, O32
* We thank Steve Dimmock, Chuan Yang Hwang, Nengjiu Ju, Roger Loh, Ting Xu, and seminar participants at Carleton University, Nanyang Technological University, Shanghai Advanced Institute of Finance, Singapore Management University, and Wilfrid Laurier University for helpful comments. We also thank Andriy Bodnaruk for providing data on combined reporting and Alice Guo for excellent research assistance. We acknowledge financial support from the Social Sciences and Humanities Research Council of Canada (SSHRC). Li acknowledges financial support from the Sauder exploratory research grant program. All errors are our own.

Technological Competition and Strategic Alliances
Abstract
Using a large unique patent-strategic alliance dataset over the period 1990 to 2004, we first show that firms faced with greater technological competition are more likely to form alliances. Technological competition is captured by a cosine similarity measure between a firm’s own patent output and the patent output of all other firms in the economy. We further show that alliances lead to more patents afterwards at both client and partner firms, especially for partner firms faced with greater technological competition. Finally, we show that related patents increase significantly at both client and partner firms, whereas innovative efficiency and the productivity of individual inventors increase significantly only at partner firms. Our results are robust to endogeneity concerns. We conclude that technological competition is an important impetus for redrawing the boundaries of the firm in order to accelerate corporate innovation.
Keywords: innovation, patents, R&D expenditures, strategic alliances, technological competition, technological overlap
JEL classification: G34, O32

1
1. Introduction
Corporate innovation is a key factor in determining firm comparative advantages, competitiveness, and
long-term productivity growth. In this paper, we examine the relation between one organizational form—
strategic alliances—and corporate innovation in the face of technological competition.
Strategic alliances are long-term contracts between legally distinct organizations, typically a small
entrepreneurial firm (partner) and a large established firm (client), that provide for the sharing of the costs
and benefits of mutually beneficial activities (Robinson, 2008). According to Jensen and Meckling (1992),
alliances are the so-called “network organization” that lies between arm’s length market transactions and
integrated hierarchical organization structures, blurring the boundaries of the firm. Robinson (2008) notes
that since 1985, the number of alliance transactions surpassed that of mergers and acquisitions (M&As).
More importantly, while alliances frequently take place in a broad range of industries, they tend to cluster
in risky, high-R&D settings (Robinson and Stuart, 2007). Given the importance of alliances as an
organizational form to facilitate corporate R&D, it is crucial to understand the role of competition in the
technological space in the formation of alliances and their joint impact on corporate innovation outcome.
This paper fills a void in the literature, providing new empirical evidence on the interplay among
organizational form, technological competition, and corporate innovation.
The following example illustrates some key aspects of the relation between technological
competition and strategic alliances examined in this paper. Incyte Corporation is a biotech company
developing inhibitors for JAK, a causative factor in majority of myeloproliferative disorders that affect the
levels of blood cells in human body. Its JAK inhibitor (INCB18424) entered phase III trial in July 2009. In
October 2009, another biotech company YM BioSciences initiated a phase I/II trial of a new JAK inhibitor
(CTYT387) that had a key potential advantage over INCB18424 in improving patients’ anemia symptoms.
In November 2009, Incyte formed a strategic alliance with the pharmaceutical giant Novartis to jointly
develop INCB18424. Under the terms of the alliance agreement, Novartis was responsible for development
of the drug outside of the US, while Incyte retained rights in the US. In exchange for these rights, Incyte
received an upfront payment of $150 million and was eligible for up to a $60 million milestone payment in
the future. INCB18424 succeeded in its phase III trial and was approved by the US Food and Drug
Administration (FDA) for the treatment of intermediate or high-risk myelofibrosis in November 2011.
2
The above example highlights one important consideration in firms’ decisions to form alliances—
the presence of fierce technological competition faced by both the two small biotech companies and the
large pharmaceutical company. In November 2009 when Incyte and Norvatis formed an alliance, Incyte
faced competition from YM BioSciences Inc. in advancing INCB18424, the first JAK inhibitor that reached
the pivotal phase III trial. In the meantime, many large pharmaceutical companies including Novartis face
fierce competition from biotech companies and the threat of “patent cliff”—a term signifying the sharp
drop-off in revenues from blockbuster drugs that face generic competition once their patents expire. By
joining forces with the pharmaceutical giant Novartis, Incyte was able to accelerate its innovation capacity
and received the FDA approval ahead of its competitor. This example illustrates that alliances are an
important vehicle through which firms gain access to knowledge and capacities outside their own
boundaries in order to accelerate their innovation effort; and most importantly, the alliance decision and its
success hinge on technological threats and opportunities.
In this paper, we argue that strategic alliances, as an organizational form fostering commitment to
long-term risky investments (Robinson, 2008), naturally arise when firms face intensive technological
competition. When faced with technological competition, the speed of innovation is crucial for firms to
succeed in a technological race. Close collaboration via alliances facilitates the transferring of existing
know-how and the pooling of specialized knowledge to generate new knowledge (Gomes-Casseres,
Hagedoorn, and Jaffe, 2006). Further, the flexibility inherent in alliances facilitates experimentation with
new ideas and new combinations of participants in the pursuit of new knowledge (Mody, 1993). Finally,
the presence of technological competition serves as an effective disciplinary device to prevent participant
firms from shirking and self-dealing, leading to better innovation outcome than cases without such
competitive pressure.
To examine whether and how technological considerations drive alliance formation, we first
develop a new measure to capture competition in the technological space and then provide large-sample
analyses on determinants of alliance formation and its impact on corporate innovation outcome. Our
empirical investigation addresses the following two questions: What is the role of technological competition
in affecting a firm’s likelihood of joining alliances? How do alliances and technological competition change
the innovation outcome of alliance participants?

3
We capture technological competition faced by an innovative firm as a cosine similarity measure
between its own patent output, measured by the number of patents across different technological classes,
and the patent output of all other firms in the economy. This cosine measure builds on the firm-to-firm
technological proximity measure of Jaffe (1986). The higher value is this cosine measure, the greater is the
extent of overlap in technological innovation between a firm and all other firms in the economy. Intuitively,
this measure captures two key features of technological competition: threats and opportunities. On the one
hand, greater overlaps between a firm’s patent portfolio and the aggregate patent portfolio of all other firms
in the economy indicate that this firm’s technologies are faced with greater threats from other firms’ similar
technologies and thus have a higher obsolescence risk. On the other hand, greater overlaps with aggregate
innovative activities in the economy suggests that this firm’s technologies attracts interest from other firms
and thus have a higher upside potential. Our cosine similarity measure captures both threats and
opportunities faced by a firm’s technologies (i.e., a greater obsolescence risk as well as a greater
opportunity), which we call technological competition. In a similar vein, Hoberg, Phillips, and Prabhala
(2014) use new product overlaps between a firm and its industry peers to capture product market threats.
Using a large unique patent-strategic alliance dataset over the period 1990 to 2004, we start by
examining whether and how technological considerations are related to alliance formation. Using our new
measure of technological competition and a panel dataset of innovative Compustat firms, we first show that
technological competition faced by a firm is positively associated with the likelihood of that firm joining
an alliance. We further show that more innovative firms, as captured by both patent count and R&D
expenditures, are more likely to form alliances. In terms of the economic significance of these effects, when
increasing the measure of technological competition by one standard deviation, the number of alliances
formed per year increases by 0.12; when increasing the number of patents (in logarithms) by one standard
deviation, the number of alliances formed per year increases by 0.14; and when increasing R&D
expenditures by one standard deviation, the number of alliances formed per year increases by 0.21. Given
that the average number of alliances formed by innovative sample firms is 0.78, these effects on alliance
formation are economically significant. Using either industry- and size-matched or randomly drawn control
firms, we again show that alliance participants are faced with significantly greater technological
competition, have significantly more patents and higher R&D expenditures. Taken together, these results
suggest that technological considerations have a significant bearing on the rising popularity of alliances.

4
Next, we examine the roles of technological competition and alliances in post-alliance innovation
outcome. Following convention, we call the larger firm in a bilateral alliance as a client firm and the smaller
firm as a partner firm. Using both the difference-in-differences specification and the treatment regression
with an instrumental variable, we find that after alliance formation, innovation output of alliance
participants is significantly improved, especially for partner firms faced with greater technological
competition.
Once we establish the positive effects of technological competition and alliance on post-alliance
innovation outcome, we explore possible underlying mechanisms through which these effects take place.
We first find that both client and partner firms significantly increase their R&D expenditures after alliance
formation, supporting the view that strategic alliances provide an effective commitment mechanism for
developing risky long-term projects (Robinson, 2008). Moreover, partner firms significantly increase
innovative efficiency when faced with greater technological competition, consistent with the typical
practice in alliances that clients provide funding while partners focus on developing technologies. We then
find that related patents significantly increase at both client and partner firms after alliance formation,
suggesting effective information flows between alliance participants. We note that unrelated patents also
significantly increase at alliance partner firms (but not at client firms). Finally, using inventor-level data,
we find that the productivity of individual inventors at alliance partner firms improves significantly in the
face of technological competition, consistent with the increased innovative efficiency results. In contrast,
we do not observe any significant improvement in the productivity of individual inventors at client firms
after alliance formation. We conclude that technological competition is an important impetus for redrawing
the boundaries of the firm—forming alliances—in order to accelerate corporate innovation.
In our additional investigation, we find that technological competition does not play the same role
in the formation of joint ventures (JVs) as it does in alliance formation, nor does it have any impact on post-
JV innovation output. We offer a number of explanations for the difference in findings. First, alliances and
JVs are formed for different purposes—the former to developing new ideas while the latter to developing
and marketing new products. Second, alliances are a much more flexible organizational form that is suited
to developing new ideas, while JVs are a relatively more rigid organizational form that is costly to form
and to unwind.

5
Our paper makes a number of important contributions to the literature. First, we develop a novel
firm-level measure of technological competition that captures threats and opportunities faced by innovative
firms in the technological space. Given the crucial role of technology in our knowledge-based economy, it
is important to be able to quantify the amount of technological competition faced by individual firms,
complementing the well-established measure of product market competition (see Hoberg and Phillips, 2010
for the latest development of this measure). Like product market competition, we expect technological
competition to have important implications for corporate policies.
Second, this paper contributes to the long-standing literature on the boundaries of the firm
(Grossman and Hart, 1986; Hart and Moore, 1990; Hart, 1995). A firm can be viewed as the nexus of
contracts (Jensen and Meckling, 1976); alliances are part of the contracts that surround the firm and blur its
boundaries. Although the importance of alliances in facilitating knowledge transfer and technological
innovation has been well recognized (Chan, Kensinger, Keown, and Martin, 1997; Fulghieri and Sevilir,
2003; Gomes-Casseres et al., 2006), there is little large-sample evidence on the role of technological factors
in the formation of alliances. Robinson (2008) finds that the risk of alliance activities outside a client firm
is greater than the risk of activities that are conducted inside the firm. Bodnaruk, Massa, and Simonov
(2013) show that firms with higher quality of governance are more likely to form alliances and also are
better able to reap the benefits of alliances. While strategic alliances are a common phenomenon among
technology firms, prior studies are silent on one important question: How do technological factors affect
firms’ decisions to join alliances? Our paper fills a void in the literature by addressing this question.
Third, our study provides a fresh new perspective on the relation between competition and
innovation. The Schumpeterian theory predicts that intense product market competition deters innovation
of new entrants, as more competition accelerates the obsolescence of new technologies and hence reduces
the monopolistic rents of innovators (Aghion and Howitt, 1992; Caballero and Jaffe, 1993). However,
empirical studies mostly find a positive effect of product market competition on innovative output (Geroski,
1995; Nickell, 1996; Blundell, Griffith, and Van Reenen, 1999). To reconcile theory with empirical
evidence, recent papers emphasize competition faced by incumbent firms (e.g., Aghion, Harris, Howitt, and
Vickers, 2001; Aghion, Bloom, Blundell, Griffith, and Howitt, 2005). In these models, opportunity costs
of innovation failure faced by incumbent firms could be higher when competition is fierce, leading to a
positive relation between competition and innovative output. While most papers in this literature focus on

6
how (product market) competition affects the monopolistic rents of innovators, which in turn affects firms’
incentives to pursue innovation, our study looks at the effect of competition on innovation from a very
different perspective: How does competition affect firms’ choices of organizational forms that foster
commitment to innovation and accelerate innovation? Our findings suggest that competition affects
innovation not only through economic incentives but also through the choice of organizational forms.
Finally, this paper extends Coase’s (1937) original insight that different organizational forms have
important implications for investment performance by focusing on the relation between alliances and
corporate innovation. Prior studies including Allen and Phillips (2000), Lindsay (2008), Robinson (2008),
Hoberg and Phillips (2010), Beshears (2013), Bodnaruk et al. (2013), Bena and Li (2014), and Seru (2014)
have examined whether and how alliances, JVs, and M&As take place to address agency problems and
information asymmetry, reallocate decision rights, and combine firms’ capabilities to create synergies. A
central issue in this strand of the literature is to understand the economic implications of these changes of
firm boundaries. In this paper, our findings that one organizational form—strategic alliances—facilitates
the development of new knowledge (i.e., patents) in the face of fierce technological competition highlight
the complex relation between organizational form, technological competition, and corporate innovation.
Our results suggest that the right organizational form is crucial for firms to succeed in their innovation
effort, especially in the presence of fierce technological competition.
The rest of the paper proceeds as follows. Section 2 develops our hypotheses. Section 3 describes
the sample and key variables used in this study. Section 4 examines whether and how technological
considerations affect alliance formation. Section 5 presents innovation outcome after alliance formation
and examines the underlying mechanisms. Section 6 conducts additional investigation. Section 7 concludes.
2. Hypothesis Development
When there is great technological competition, firms are faced with a great threat of technology
obsolescence as well as a great opportunity. The speed of innovation is thus crucial for firms to succeed in
a technological race. Strategic alliances provide an effective organizational form for otherwise independent
firms to pool resources in accelerating the development of new technology. Forging an alliance enables a
firm to focus resources on its core competencies while acquiring other skills or capabilities from the market

7
place. Chan et al. (1997) note that alliances are becoming increasingly important as competitive pressures
force firms to adopt flexible and more focused organizational structures.
Alliances also offer an effective mechanism for firms to commit to technological innovation that is
characterized by a low likelihood of success but high payoffs (“longshot projects” as modeled in Robinson,
2008). Internal capital markets are prone to the practice of “winner-picking,” whereby headquarters have
incentives to divert resources to short-term projects with a greater likelihood of success but low payoffs
conditional on success. The possibility of reallocating resources ex post dis-incentivizes divisional
managers from undertaking long-term risky investment ex ante. Robinson (2008) suggests that alliances as
enforceable contracts between participant firms help resolve such an incentive problem because they
mitigate winner-picking. Such a commitment is critical when faced with great technological competition
as the consequence of diverging resource from innovation could be dire—obsolete technologies and missed
opportunities.
Finally, compared to other organizational forms such as joint ventures and acquisitions, the
flexibility inherent in alliances facilitates experimentation with new ideas and new combinations of
participants in the pursuit of new knowledge (Mody, 1993). This flexibility of alliances is particularly
valuable when technological competition intensifies and the future of innovation outcome is uncertain (e.g.,
Dixit and Pindyck, 1994; Trigeorgis, 1996; Seth and Chi, 2005).
The above discussions lead to our first hypothesis:
Hypothesis 1: Technological competition increases the likelihood of alliance formation.
Jensen and Meckling (1992) refer alliances as a network organization. They argue that such an
organizational form can add value to participant firms by aligning decision authority with decision
knowledge. In an alliance, such alignment is achieved when each participant has specific decision
responsibility allocated according to its expertise and business objective. The benefits of forming an alliance
are especially high for innovative firms because innovation requires both highly specialized knowledge and
decision authority allocated to experts equipped with such knowledge.
Further, a network organization provides participant firms with organizational flexibility, allowing
them to divest failed investments at relatively low costs. In contrast, Jensen (1993) argues that traditional
8
corporate form destroys value because of its inability to divest assets. The high uncertainty faced by
innovative firms further enhances the value-added from adopting an organizational form whose low
divestiture costs encourage undertaking risky investments.
On the other hand, there are also costs associated with network organizations like alliances that do
not happen in integrated firms or arm’s length transactions. These costs arise out of the potential for
opportunistic behavior by participant firms (Klein, Crawford, and Alchian, 1978; Kranton, 1996).
Innovative projects call for specialized knowledge, then it becomes difficult, if not impossible, to monitor
and control participants’ opportunistic behavior. The costs associated with opportunistic behavior are likely
to be high when alliances involve innovative projects. Ultimately, it is an empirical question whether
alliances enhance corporate innovation.
The above discussions lead to the first part of our second hypothesis:
Hypothesis 2A: Alliances lead to improved post-alliance innovation outcome.
One important advantage of forming an alliance is that participant firms can pool knowledge and
resources for pursuing a common goal. Gomes-Casseres et al. (2006) note that closer collaboration via
alliances than the arm’s length market transaction facilitates not only the transferring of existing know-how
but also the pooling of specialized knowledge to generate new knowledge. Thus, if an alliance does improve
post-alliance innovation outcome of participant firms, we would expect that some of the improved
innovation outcome builds on the shared expertise of participant firms. This conjecture leads to the second
part of our second hypothesis:
Hypothesis 2B: Alliances lead to improved post-alliance innovation outcome that builds on participants’ shared expertise.
To mitigate the costs associated with a network organization, Jensen and Meckling (1992) suggest
establishing an internal control system to provide performance measurement and a reward and punishment
system to reduce opportunistic behavior. Parkhe (1993) recommend alliance participants to commit to
relationship-specific investments that are of little value outside the alliance.
We posit that technological competition provides an external solution to limit alliance participants’
opportunistic behavior. The presence of fierce technological competition, through either the threats of

9
lagging behind or the risk of missed opportunities, as our motivating example demonstrated, could serve as
an effective disciplinary device to prevent alliance participants from shirking and self-dealing and press for
efficiency improvement. Further, given that technological alliances typically have clients as capital
providers and partners as technology owners/developers, we thus expect that partners are likely to benefit
more from the positive effect of technological competition-induced alliances on their innovation outcome.
The above discussions lead to our final hypothesis:
Hypothesis 3: Technological competition strengthens the positive impact of alliances on post-alliance innovation outcome, especially for partners. In our empirical investigation, we test the above hypotheses, and also attempt to control for several
alternative explanations for why alliances take place. In the next section, we describe our sample, define
key innovation variables, and present a sample overview.
3. Sample Formation and Variable Constructions
3.1. Our Sample
We obtain data on Compustat firms’ patenting activity from the National Bureau of Economics
Research (NBER) Patent Citations Data File. This database contains detailed information on patents and
citations for US publicly-listed firms, including patent ID, patent assignee, number of citations made and
the cited patent IDs, number of citations received and the citing patent IDs, patent application year, and
patent award year (see Hall, Jaffe, and Trajtenberg, 2001 for details).
Our alliance sample comes from the Thomson Financial’s SDC database on Joint Ventures and
Strategic Alliances, which covers “agreements where two or more entities have combined resources to form
a new, mutually advantageous business arrangement to achieve predetermined objectives.” The database
contains detailed information on alliance participants and the deal announcement date. It has been used in
recent studies (e.g., Allen and Phillips, 2000; Fee, Hadlock, and Thomas, 2006; Lindsey, 2008; Boone and
Ivanov, 2012; Bodnaruk et al., 2013) given its comprehensive coverage.
Our sample period starts in 1990 because it is the first year when the data quality in the SDC
database became good. Our sample period ends in 2004 because the year 2006 is the last year when the

10
patenting information from the NBER database was available. Due to the well-known patent approval lag
between application and final award of a patent to be two to three years, the data coverage of patents in
2005-2006 was poor. For any bilateral alliance deal in our sample, we define the participant with a larger
(smaller) value of total assets as the client (partner).
Our alliance sample includes all deals where the form of deal is coded as “strategic alliance” by the
SDC. We require that: 1) the alliance involves at least one US public firm or a subsidiary to a US public
firm as covered by Compustat/CRSP; and 2) the US public firm involved is not from the financial sector
(SIC 6000-6999). These filters yield 29,981 alliances for our sample period 1990-2004.
3.2. Measuring Technological Competition
Our central idea is that technological competition-driven alliances enhance corporate innovation
output. The concept of technological competition is new so there is no off-the-shelf measure for our
purpose.
3.2.1. Definition
We capture technological competition faced by an innovative firm at a point in time as a cosine
similarity measure between its own patent output, measured by the number of patents across different
technological classes, and the similarly measured patent output of all other firms in the economy. Innovative
firms are firms with at least one awarded patent over the period 1976-2006 by the US Patent and Trademark
Office (USPTO).1 Our measure of technological competition captures technological threats and uncertainty
that a firm faces, similar to the product market fluidity measure of Hoberg et al. (2014) capturing
competitive threats in the product market.
To construct the variable, we first capture the scope of innovation activity through patent output of
firm i using the technology vector Si,t = (si,t,1, ..., si,t,K), and the scope of innovation activity through patent
output of all other firms in the economy using the aggregate technology vector S-i,t = (s-i,t,1, ..., s-i,t,K). The
subscript k(1,K) is the technology class index.2 The scalar si,t,k (s-i,t,k) is the ratio of the number of awarded
patents to firm i (all other firms in the economy except firm i) in technology class k with application years
1 About half of the Compustat firms over the period 1976-2006 are innovative based on our definition. 2 The US Patent and Trademark Office classifies each patent into 426 technology classes.

11
from t-2 to t (in year t) to the total number of awarded patents to firm i (all other firms in the economy)
applied over the same three-year period (the same year t).
Our technological competition measure is then computed as
,S , S ,
S , S , S , S ,
.
(1)
This cosine measure ranges from zero to one. The higher value is this cosine measure, the more similar of
a particular firm’s innovation output to that of all other firms in the economy.
We believe that our measure is particularly suited to capture technological competition, which by
construction, has two important components—threats and opportunities. On the one hand, a greater overlap
with the aggregate innovative activities in the economy posts threats to the firm’s existing patents,
increasing their obsolescence risk. On the other hand, a firm with patents that have a greater overlap with
the aggregate innovative activities is the one that owns technologies that are of great interest to other firms,
and hence having a higher upside potential but also facing more competitive pressure. As such, our measure
of technological competition captures both threats and opportunities (i.e., greater downside risks as well as
higher upside potentials) for the technologies owned by the firm.
3.2.2. Validation from 10-K Filings
Our measure for technological competition is based on the patent portfolio of a focal firm. Given
that it is a new measure, it is important to check if this measure does capture the threats and opportunities
faced by companies in the technological space.
Firms are required to disclose potential risk factors that might adversely affect future performance
in the Management Discussion & Analysis section (MD&A, typically item 7) or in the risk factor section
(typically item 1 or item 1.A) of their 10-K filings. We examine whether firms faced with greater
technological competition based on our measure in Equation (1) are also more likely to talk about it in their
10-K filings. We employ a machine-based algorithm to search the entire text of 10-K filings for the
following keywords: technology competition, technological competition, technology competitiveness,
technological competitiveness, technology risk, technological risk, technology risks, technological risks,
technology threat, technological threat, technology threats, technological threats, technology uncertainty,

12
technological uncertainty, technology change, technological change, technology changes, technological
changes, changes in technology. We record the number of times any of the above keywords show up in 10-
K filings. As a robustness check, we also search for the above keywords specifically within the MD&A
section, the risk factors section, and the combination of these two sections.
Table 1 provides summary statistics from the above exercise. Panel A presents the mean and median
values of our technological competition measure and the four measures based on text search of the keywords
over different sections of 10-K filings. Panel B presents the correlation matrix between our technological
competition measure and the 10-K based measures. We find that firms faced with high technological
competition are more likely to talk about technological competition in their 10-K filings, not limited to the
MD&A section or the risk factors section. This exercise provides some validating evidence in support of
our measure for technological competition.
To corroborate with the machine-based search results, we randomly pick 300 firms and ask a
research assistant (without any prior knowledge of our technological competition measure) to go over their
10K filings and verify the machine-based count of the number of times any of the 15 keywords show up.
Further, we also ask the research assistant to assign a score of 0 (no competition), 1 (lowest) to 3 (highest)
to each of these 300 firms, based on personal assessment of the degree of technological competition that a
firm is faced with. The correlation between the research assistant’s scores and values of our technological
competition measure is 0.47.
3.2.3. Examples
Table 1 Panel C lists the top twenty firms faced with the greatest technological competition in 1980,
1990, and 2000. We find that over the past twenty years, firms faced with the greatest technological
competition shift from manufacturing and resources to IT and computers in the last decade. Figure 1 plots
the time series of our technological competition measure averaged across innovative firms over the sample
period 1990-2004. We observe a gradual rise in the average value of technological competition until the
burst of the Internet bubble and a gradual decline after, likely due to the patent approval lag.
3.3. Summary Statistics
13
Table 2 presents the temporal distribution of alliances over our sample period 1990-2004. Panel A
presents different samples without imposing the requirement that alliance participants have at least one
patent in the NBER patent database. We show that the numbers of alliance deals peaked during the late
1990s and declined after the burst of the Internet bubble in the early 2000s. The evidence that alliances
were most active during the technological golden age around the Internet bubble is consistent with the view
that technological innovation is a key driver. We further show that there were close to 30,000 alliances
involving at least one US public firm. Over 90% of the alliances are bilateral arrangements involving at
least one US public firm or a subsidiary to a US public firm. The sample size drastically drops when we
require both alliance participants to be US public firms.
Panel B presents different samples used in our multivariate analysis after imposing the requirement
that alliance participants have at least one patent over the period 1976-2006. Comparing column (1) across
Panels A and B, we show that close to 80% of the alliances involve innovative US public firms, and over
90% of these alliances are bilateral arrangements involving at least one innovative US public firm. When
we require both alliance participants to be innovative US public firms (not a subsidiary to a US public firm
as covered in column (3)), only a fifth of the full sample (as shown in column (1)) meet the requirement. It
is clear that alliances are a common phenomenon among innovative firms that are publicly listed or
subsidiaries of publicly listed firms. Bilateral alliances with one client and one partner are the prevailing
practice.
To capture innovation output as well as the strength of intellectual property rights, we use patent
count, constructed as the year- and technology-class adjusted number of patents over the three-year period
preceding the formation of an alliance. Patents grant assignees property rights and hence clearly delineate
their contractual rights. Gans, Hsu, and Stern (2002) argue that the presence of patents reduces the
transaction costs associated with collaborative arrangements like alliances. Detailed variable definitions
and constructions can be found in Appendix 1.
Table 3 presents the summary statistics for the panel data sample that consists of innovative non-
financial firms covered by Compustat/CRSP over the period 1989-2003. All continuous variables are
winsorized at the 1st and 99th percentiles. All dollar values are measured in 2004 dollars.

14
In Panel A, we show that on average an innovative US public firm forms 0.78 alliances every year.
Once we exclude alliances involving subsidiaries of a public firm, the average number of alliances drops to
0.60 per year. The mean (median) value of technological competition is 0.09 (0.04). The mean (median)
number of patents in the three-year period preceding alliance formation is 25 (1.5). The rest of firm
characteristics are typical of Compustat public firms.
In Panel B, we present pair-wise correlation coefficients. We show that there is a positive and
significant correlation between the number of alliances and technological competition. More general
examination of the correlation matrix suggests little problem of multicolinearity. Since biases due to omitted
variables in univariate correlations can mask the true relations between the variables, we rely on
multivariate analysis to examine the factors associated with alliance formation.
4. Technological Competition and Strategic Alliances
Our empirical investigation in this section helps answer the following question: What is the role of
technological competition in affecting a firm’s likelihood of joining alliances?
4.1. Panel Data Evidence
To test our first hypothesis relating alliance formation to technological competition, we look at the
relation between a firm’s measure of technological competition and the number of alliances it enters in the
subsequent year. We estimate a set of Tobit regressions:
1 # , , , & ,
, , . (2)
The dependent variable is the logarithm of one plus the number of alliances a firm enters in year t. The set
of firm innovation characteristics includes technological competition, patent count (in logarithms), and
R&D expenditures. Other firm characteristics to explain alliance formation following prior literature (e.g.,
Gomes-Casseres et al., 2006; Boone and Ivanov, 2012; Bodnaruk et al., 2013) include firm size (the
logarithm of total assets), leverage, ROA, cash holdings, Tobin’s Q, sales growth, and capital expenditures.
To control for industry- and time-clustering in alliances, we include both industry (defined by the two-digit

15
SIC codes) and year fixed effects. For this analysis, we employ the panel data sample (as shown in Table
2) merged with the SDC’s database on Joint Ventures and Strategic Alliances to obtain the number of
alliances formed by these firms or their subsidiaries each year over the sample period 1990-2004. Table 4
presents the results.
We first show that firms faced with greater technological competition are more likely to form
alliances, consistent with our first hypothesis. When a firm’s patent portfolio is under threat, that firm is
more likely to form alliances to fend off the threat and tap into the opportunity. We then show that
innovative firms with more patents are more likely to form alliances, consistent with Gans et al. (2002) who
argue that the strength of intellectual property rights is important for alliances. We further show that firms
with more R&D expenditures are also more likely to form alliances.
In terms of the economic significance of these innovation variables on the number of alliances
formed (based on column (1) estimates), when increasing the measure of technological competition by one
standard deviation, the number of alliances formed per year increases by 0.12; when increasing the number
of patents (in logarithms) by one standard deviation, the number of alliances formed per year increases by
0.14; and when increasing R&D expenditures by one standard deviation, the number of alliances formed
per year increases by 0.21. Given that the sample average number of alliances formed is 0.78, the effects
of these technological factors on alliance formation are economically significant.
Table 4 also provides some other interesting results. We find that large firms, firms with low
leverage, high cash holdings, high Tobin’s Q, and fast sales growth are more likely to form alliances. We
conclude that alliance participants are characterized as large fast-growing innovative firms faced with great
technological competition.
4.2. Matching Firm Evidence
The pros of using the panel data sample is that it provides large sample evidence on the importance
of technological competition in the formation of alliances. The cons is that there are many public firms that
are totally different from alliance participants included in the analysis, raising the hurdle to reject our
hypotheses. For example, firms at different stages of the technological life cycle are included and compared.
Further, the panel data analysis in Table 4 does not differentiate alliance clients and partners.

16
To further examine whether and how technological competition affects a firm’s likelihood of
joining alliances, we follow Bena and Li’s (2014) methodology by identifying matching firms for
participants in alliance deals. For each participant of an alliance deal announced in year t, we find up to five
control firms matched by industry and size, where the industry is defined by the two-digit SIC code. We
move up to the one-digit SIC industry if we cannot identify three valid control firms at the two-digit SIC
industry level. We require a valid control firm to satisfy the following conditions: 1) it is an innovative firm
with at least one awarded patent over the period 1976-2006 (as covered by the NBER Patent Database); 2)
it shares at least one-digit SIC code with the sample firm; 3) its total assets in year t-1 falls between 50%
and 150% of the sample firm’s total assets; and 4) it is not an alliance or JV participant in the three-year
period prior to and one-year period after the alliance deal announcement. As noted by Bena and Li (2014),
the matching creates a pool of potential alliance participants that captures clustering not only in time, but
also by industry. Further, industry-matching controls for product market competition and size-matching
partially controls for technological life cycles. In addition to industry- and size-matching to obtain control
firms for alliance participants, we also obtain random-matched control firms by randomly drawing five
firms for each sample firm that are not an alliance or JV participant in the three-year period prior to and
one-year period after the alliance deal announcement.
Table 5 presents two-sample comparison of alliance clients and partners, alliance clients and their
industry- and size-matched peers, and alliance partners and their industry- and size-matched peers. The
sample is limited to bilateral alliances formed by US public firms (not their subsidiaries) with available
financial information.
Panel A compares alliance clients and partners. We find that alliance clients are faced with
significantly greater technological competition than are alliance partners. In terms of innovative activities,
alliance clients have more patents but a lower R&D to assets ratio as compared to their partners. Further,
we find that alliance clients are much larger than their partners, consistent with the pattern documented in
Lerner and Merges (1998) and Robinson and Stuart (2007). Finally, alliance clients employ higher leverage,
are more profitable, have lower cash holdings (normalized by total assets), lower Tobin’s Q, much slower
sales growth but higher capital expenditures than their partners.

17
Panel B compares alliance clients with their industry- and size-matched peer firms. We find that
alliance clients are faced with greater technological competition, and are significantly more innovative in
terms of patent count and R&D expenditures than their matching firms. Panel C compares alliance partners
with their industry- and size-matched peer firms. Again, we find that alliance partners are faced with greater
technological competition, and are significantly more innovative in terms of patent count and R&D
expenditures than their matching firms. The evidence strongly supports the view that technological factors
are important considerations for joining alliances.
We run a conditional logit regression using cross-sectional data that combines the alliance client
(partner) sample and their industry- and size-matching control sample (or the randomly- drawn control
sample): 3
, , , & ,
, , . (3)
The dependent variable, Event Firmim,t, takes the value of one if firm i is the client (partner) in alliance deal
m, and zero otherwise. All control variables are defined as before and measured at the fiscal year end prior
to the alliance deal announcement. For each alliance deal, there is one observation for the client (partner),
and multiple observations for the client (partner) control firms. Finally, Deal FEm is the fixed effect for
each client (partner) and its control firms.4 Table 6 Panel A presents the results.
Columns (1) and (2) report the results when the dependent variable is the alliance client indicator
variable and the control firms are either industry- and size-matched or randomly drawn as described earlier.
We find that technological competition is positively associated with the likelihood of a firm becoming an
alliance client. We further find that innovative firms with a large number of patents and high R&D
expenditures are more likely to be an alliance client. Finally, we find that large firms with low leverage,
3 See McFadden (1974) for an introduction to the conditional logit regression, and Bena and Li (2014) for a recent application in finance. 4 We do not include industry-level competition measures such as the Herfindahl index based on sales or product market fluidity (Hoberg and Phillips, 2010; Hoberg et al., 2014), for the following reasons. First, our central hypothesis is about the role of technological competition in alliance formation and in improving innovation output, which is quite different from the role of product market competition in improving sales and profitability. Second, we account for industry differences in alliance formation by employing control firms based on industry classifications.

18
good operating performance, high cash holdings, high Tobin’s Q, and high sales growth are more likely to
be an alliance client.
Columns (3) and (4) reports the results when the dependent variable is the alliance partner indicator
variable and the control firms are either industry- and size-matched or randomly drawn. We again find that
technological competition is positively associated with the likelihood of a firm becoming an alliance
partner. We further find that alliance partners tend to possess similar characteristics as alliance clients with
one notable exception. Compared with the industry- and size-matched control firms, a firm’s operating
performance is not significantly associated with the likelihood of it becoming an alliance partner. This is
not surprising, as alliances are typically formed between a client with deep pockets and a partner with
innovative ideas but limited access to financing (Lerner and Merges, 1998).
In summary, the firm-level results in Table 6 Panel A are largely consistent with the panel data
evidence and provide strong support for our first hypothesis (H1) that technological competition is an
important force behind firms’ decisions to form alliances, regardless of their specific role in the alliance.
4.3. Matching Pair Evidence
So far, our multivariate analysis focuses on using (unilateral) firm characteristics to explain alliance
formation, without accounting for the possibility that firms with complementary technologies, or firms in
the same industry may also be more likely to form alliances. For this investigation, we need a sample of
actual alliance pairs and multiple control pairs. We form the client (partner) industry- and size-matched
control (pseudo) pair sample using the actual client (partner) paired with up to five industry- and size-
matched control firms of the actual partner (client). Alternatively, we also form the control pairs using five
randomly drawn control partners (clients) that are not part of an alliance or JV deal in the three-year period
prior to and one-year period after the alliance deal announcement as discussed earlier. Thus, for each
alliance deal, our client (partner) pair sample includes the actual alliance pair and up to five pseudo pairs
where the actual client (partner) is paired with the industry- and size-matched or randomly-drawn control
firms of the actual partner (client).
We introduce three new bilateral measures in this pair-level analysis. Technological proximity from
Jaffe (1986) measures the correlation of alliance participants’ patent portfolios. Same industry is an

19
indicator variable that takes the value of one if the two participants of an alliance operate in the same two-
digit SIC industry, and zero otherwise. Same state is an indicator variable that takes the value of one if the
two participants of an alliance headquarter in the same state, and zero otherwise. Table 5 Panel D compares
these bilateral measures between the alliance pairs and their control pairs. We show that there is significant
difference in all three measures—technological proximity, same industry, and same state—across the two
types of firm pairs: Actual alliance pairs have greater technological overlap, are more likely to be in the
same industry and headquartered in the same state compared to their control pairs.
We then run a conditional logit regression using cross-sectional data of the client (partner) pair
sample, where the control firms are either industry- and size-matched or randomly drawn:
, ,
,
,
, . (4)
The dependent variable, Pairijm,t, takes the value of one if the firm pair ij is the actual pair in alliance deal
m, and zero otherwise. If the client (partner) pair sample is used for the regression, the counterparty is the
partner (client); we do not include characteristics of the actual client (partner) as explanatory variables
because these variables are invariant within a deal and are differenced out by deal fixed effects. In addition
to (unilateral) counterparty characteristics as included in Table 6 Panel A, we control for the three (bilateral)
firm-pair characteristics as defined above. Table 6 Panel B presents the results.
We find that the pair-level evidence is largely consistent with the firm-level results. New in this
analysis, we show that technological proximity between two firms is positively and significantly associated
with the likelihood of them forming an alliance. This finding holds despite the fact that we control for same
industry and same state effects. We further show that two firms from the same industry or in the same state
are also more likely to form alliances.
We conclude that technological competition faced by innovative firms prompts alliance formation.
Next, we examine the innovation outcome after forming alliances.

20
5. Strategic Alliances, Technological Competition, and Post-Alliance Innovation Outcome
In this section we answer the question: How do alliances and technological competition change the
innovation capacity of alliance participants? We posit that alliances foster commitment to long-term risky
projects and allow effective pooling of resources, leading to improved innovation outcome.5 Technological
competition helps rein in opportunistic behavior among alliance participants, further strengthening the
positive effect of alliances on innovation outcome. Due to the patent approval lag noted before, for this
investigation, we limit to alliances formed by 2000.
5.1. The Difference-in-Differences Approach
To test our second set of hypotheses, we estimate the following regression using a panel data set
that contains alliance participants and their industry- and size-matched control firms from three years before
to three years after the formation of alliances:
. (5)
The dependent variable is client (partner) patent count. Samplei takes the value of one if firm i is an actual
client (partner) in deal m, and zero otherwise. Afterit takes the value of one for the alliance participant firm
i and its control firms in the years after alliance formation, and zero otherwise. Samplei Afterit captures
the difference in the change of innovation outcome before and after alliance formation between the alliance
participant firm and its control firms. The difference-in-differences approach allows us to control for
selection (to be in an alliance or not) based on time-invariant unobservable firm characteristics. Table 7
columns (1) and (3) presents the results.
5 The extent to which corporate innovation leads to improvement in operating performance and enhanced firm value has been extensively studied in the literature (Pakes, 1985; Austin, 1993; Hall, Jaffe, and Trajtenberg, 2005; Nicholas, 2008; Kogan, Papanikolaou, Seru, and Stoffman, 2012.). In this paper, we examine innovation outcome rather than operating performance because the focus of our study is on how firms optimally choose organizational form to facilitate innovation. In untabulated analyses, we find that both clients and partners faced with fierce technological competition experience an increase in Tobin’s Q subsequent to alliance formation.
21
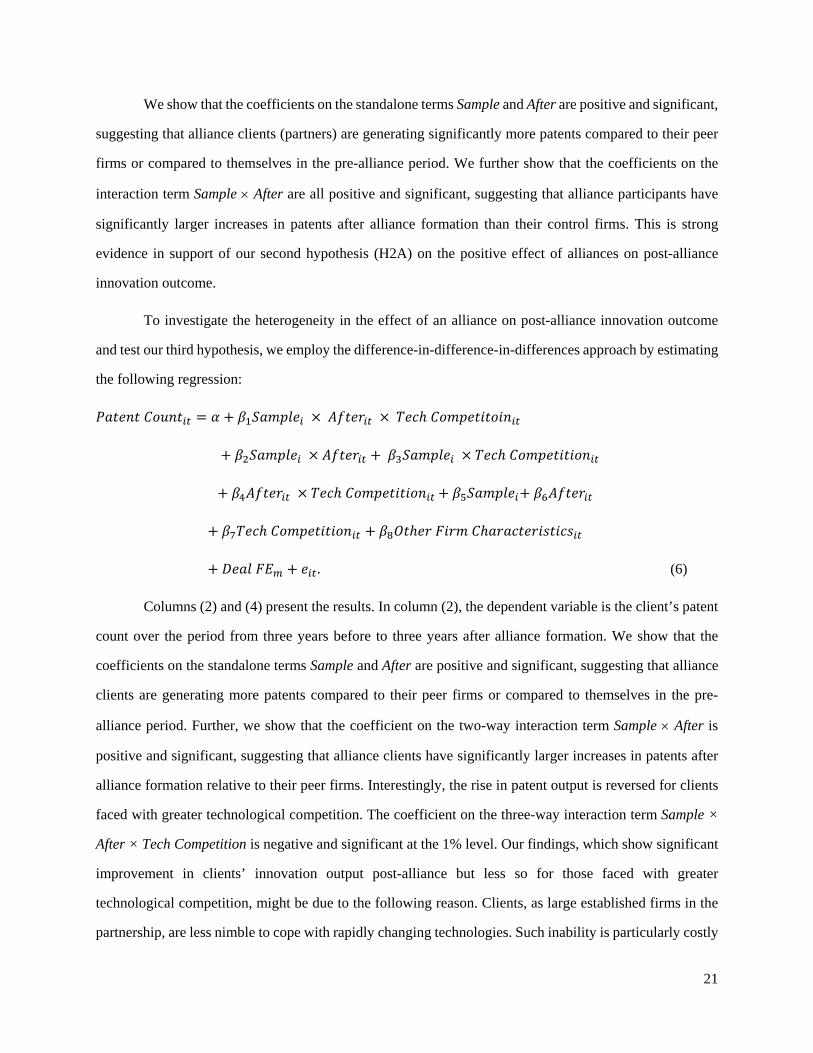
We show that the coefficients on the standalone terms Sample and After are positive and significant,
suggesting that alliance clients (partners) are generating significantly more patents compared to their peer
firms or compared to themselves in the pre-alliance period. We further show that the coefficients on the
interaction term Sample After are all positive and significant, suggesting that alliance participants have
significantly larger increases in patents after alliance formation than their control firms. This is strong
evidence in support of our second hypothesis (H2A) on the positive effect of alliances on post-alliance
innovation outcome.
To investigate the heterogeneity in the effect of an alliance on post-alliance innovation outcome
and test our third hypothesis, we employ the difference-in-difference-in-differences approach by estimating
the following regression:
. (6)
Columns (2) and (4) present the results. In column (2), the dependent variable is the client’s patent
count over the period from three years before to three years after alliance formation. We show that the
coefficients on the standalone terms Sample and After are positive and significant, suggesting that alliance
clients are generating more patents compared to their peer firms or compared to themselves in the pre-
alliance period. Further, we show that the coefficient on the two-way interaction term Sample After is
positive and significant, suggesting that alliance clients have significantly larger increases in patents after
alliance formation relative to their peer firms. Interestingly, the rise in patent output is reversed for clients
faced with greater technological competition. The coefficient on the three-way interaction term Sample ×
After × Tech Competition is negative and significant at the 1% level. Our findings, which show significant
improvement in clients’ innovation output post-alliance but less so for those faced with greater
technological competition, might be due to the following reason. Clients, as large established firms in the
partnership, are less nimble to cope with rapidly changing technologies. Such inability is particularly costly

22
when faced with big threats and/or big opportunities. As a result, they choose to form alliance to improve
innovation. While clients’ innovation output does improve after alliance, the negative competitive pressure
on innovation dominates the positive disciplinary role of competition, leading to a negative competition
effect which offsets the positive effect of alliance on clients’ innovation output.
In column (4), the dependent variable is the partner’s patent count over the period from three years
before to three years after alliance formation. We show that the coefficient on the standalone term After is
significantly positive, suggesting that there is an increasing trend in patent output for both alliance partner
firms and their peer firms. Further, we show that the coefficient on the two-way interaction term Sample
After is positive and significant, suggesting that alliance partners have significantly greater increases in
patents post-alliance formation than their peer firms, consistent with our second hypothesis (H2A). The
coefficient on Sample Tech Competition is also positive and significant, suggesting that technological
competition has a stronger positive impact on the innovation output of alliance partners than on their peer
firms. However, the coefficient on After Tech Competition is negative and significant, showing that peers
faced with greater technological competition do worse over time. Put differently, this finding suggests that
firms faced with technological competition but without forming alliances actual do worse on innovation
output over time compared to their alliance peers. Importantly, the coefficient on the three-way interaction
term Sample × After × Tech Competition is positive and significant at the 1% level, indicating that the
positive effect of alliances on the innovation output of partner firms become even stronger in the face of
fierce technological competition. These findings offer strong support for our third hypothesis (H3) that
greater technological competition enhances innovation output in alliance partners.
5.2. The Treatment Regression
So far we have shown that technological competition leads to alliance formation, which in turn
enhances innovation output, especially for alliance partners. However, the above results are subject to
reverse causality concerns, i.e., firms expected to improve patenting output choose to form alliances, so our
findings thus far may be driven by selection, instead of the treatment effect of alliances on innovation
output. To address this concern, we employ the treatment regression framework and for identification, we

23
employ an instrumental variable that clearly drives alliance formation decisions but has nothing to do with
the innovation outcome other than through the channel of forming alliances.6
For this purpose, we use a “natural experiment”—changes to US states requiring combined
reporting of corporate income (Mazerov, 2009) to help pin down the direction of causality (Bodnaruk et
al., 2013). We consider situations where the opportunity costs of forming alliances differ due to exogenous
reasons that are not firm specific, and examine how the differential reaction to this variation is related to
patent outcome. To do so, we rely on the differences in corporate income reporting rules across US states.
There are two types of corporate income reporting for the purpose of state-level taxation: combined
reporting and separate reporting. Under separate reporting rules, a multi-state firm can reduce its taxable
income by isolating highly profitable parts of its business in an affiliate that is not subject to state taxes.
Combined reporting rules, however, require firms to report their overall income generated in the US and
pay state corporate income tax on the basis of the proportion of income attributable to activity in each state
where these firms have business activities. Thus, combined reporting rules reduce the benefits of using non-
arm’s-length transactions between the subsidiaries of a firm located in different states—internal capital
markets—to reduce tax burden. This suggests that combined reporting reduces the opportunity cost of
forming alliances to commit assets. We thus expect that firms form more alliances in states with combined
reporting.
To construct the combined reporting index for each firm that covers all of the states in which it has
business operations, we need to collect data on the location of the firm’s subsidiaries and then aggregate at
the firm level. The detailed information on the construction of the variable is covered in Bodnaruk et al.
(2013) and their Appendix D. The data we have on firm-level combined reporting index is available for
1998, 2000, 2002, and 2004. We use the 1998 data for alliances formed between 1990-1998; the 2000 data
for alliances formed between 1999-2000; the 2002 data for alliances formed between 2001-2002; and
finally the 2004 data for alliances formed between 2003-2004. Our instrumental variable is a firm’s
combined reporting index, where a higher value of the index indicates that more of the firm’s operation is
located in states that require combined reporting.
6 See Li and Prabhala (2007) for an overview of dealing with selection issues versus treatment effects in corporate finance.

24
Table 8 presents the cross-sectional treatment regression results. The sample for columns (1)-(2)
and (5)-(6) contains both the clients and their industry- and size-matched control firms. The sample for
columns (3)-(4) and (7)-(8) contains both the partners and their industry- and size-matched control firms.
Column (1) ((3)) presents the first-stage regression results where the dependent variable is the alliance client
(partner) indicator variable in year t, and the instrumental variable is based on a firm’s headquarter location.
The variable of interest is the firm’s combined reporting index. We show that indeed when a firm has a
higher value of the combined reporting index, that firm is more likely to enter an alliance (either as a client
or a partner). We also show that technological competition faced by a firm is positively associated with the
likelihood of that firm entering an alliance.
Column (2) presents the second-stage regression results where the dependent variable is the patent
count of the client from year t+1 to year t+3. The coefficient on Sample is positive and significant,
supporting our second hypothesis (H2A) that alliances lead to improved innovation outcome. Consistent
with the findings from the difference-in-difference analyses, the coefficient on the interaction term Sample
Tech Competition is negative and significant, suggesting that clients do not generate significantly more
patents in the face of fierce technological competition. Column (4) presents the second-stage regression
results where the dependent variable is the patent count of the partner from year t+1 to year t+3. The
coefficient on Sample is significantly positive, supporting our second hypothesis (H2A) that alliances lead
to improved innovation outcome. Importantly, the coefficient on the interaction term Sample Tech
Competition is positive and significant, suggesting that alliances and technological competition reinforcing
each other in generating more patent output for partners. This finding thus supports our third hypothesis
(H3).
Columns (5)-(8) repeat the analysis in columns (1)-(4) except that the instrumental variable—the
combined reporting index for each firm is based on information on the locations of both its headquarter and
subsidiaries. It is worth noting that our main findings remain unchanged.
In summary, our results in Tables 7 and 8 suggest that technological competition-driven alliances
are associated with improved innovation output, especially for those partners faced with greater
technological competition, consistent with our third hypothesis (H3).

25
5.3. The Underlying Mechanisms
In this section, we explore a number of possible underlying economic mechanisms through which
the improvement in innovation output at alliance participant firms takes place.
5.3.1. Innovative Efficiency
We conjecture that one direct benefit of technological competition-driven alliances is improvement
in innovative efficiency; the competitive pressure may also push alliance participant firms to increase R&D
expenditures.
Following Hirshleifer, Hsu, and Li (2013, p. 637, Equation (1)), innovative efficiency is constructed
as the ratio of the number of patents applied in year t to the R&D capital stock accumulated over year t-6
to year t-2, assuming an annual straight-line depreciation rate of 20%. The two-year gap between the
numerator and the denominator is due to the fact that it takes time to generate patents from R&D
expenditures. Table 9 Panel A presents the results.
Columns (1)-(2) and (5)-(6) present the regression results when the dependent variable is the dollar
amount of R&D expenditures (in logarithm). The coefficients on Sample × After are positive and significant
in both columns (1) and (5), suggesting that alliance participants increase their R&D expenditures after the
formation of alliance. The coefficients on the three-way interaction term Sample × After × Tech competition
is negative and significant in column (2), whereas insignificant in column (6), suggesting that in the face of
fierce technological competition clients reduce their R&D expenditures. The results are consistent with our
findings in Tables 7 and 8 that when faced with fierce technological competition, only partner firms are
associated with improved innovation outcome after alliance formation.
Columns (3)-(4) and (7)-(8) present the regression results when the dependent variable is innovative
efficiency. The coefficients on Sample × After are insignificant in columns (3) and (7), suggesting that
alliance itself does not lead to significant improvement in innovative efficiency. In columns (4) and (8), we
find that in the face of fierce technological competition, there is little change in innovative efficiency of
clients (an insignificant coefficient on Sample × After × Tech competition), but there is significant
improvement in innovative efficiency of partners (a positive and significant coefficient on Sample × After
× Tech competition). The results again are consistent with our prior findings that when faced with fierce
technological competition, partner firms experience significant improvement in post-alliance innovation

26
outcome. More importantly, the results also support our conjecture that technological competition could
play a discipline role and improve innovative efficiency by limiting the opportunistic behaviors of alliance
participants.
In a nutshell, the evidence in Panel A suggests that both clients and partners increase R&D
expenditures post-alliance formation, supporting Robinson’s (2008) view that alliance is an effective
“commitment technology” for developing longshot projects. The evidence that technological competition
improves partner firms’ innovative efficiency further supports our conjecture that competition strengthens
the positive effect of strategic alliances on innovation outcome.
5.3.2. Unrelated and Related Patents
Gomes-Casseres et al. (2006) find that one immediate impact of alliances is enhanced knowledge
flow between participant firms, which might in turn lead to improved patenting output. For a client (partner)
in year t, we define related patents as those patents that are applied in year t and cite patents of the partner
(client) and unrelated patents as those patents that are applied in year t and do not cite patents of the partner
(client). We employ similar model specifications as the difference-in-differences models of Equations (5)
and (6). Table 9 Panel B presents the results.
Columns (1)-(2) and (3)-(4) present the regression results when the dependent variable is the
client’s unrelated and related patent count, respectively. We do not find post-alliance improvement for
unrelated innovation (an insignificant coefficient on Sample × After in column (1)). In contrast, such
improvement occurs for related innovation (a positive and significant coefficient on Sample × After in
column (3)). Further, we find that in the face of fierce technological competition, clients significantly reduce
their unrelated patent output (a negative and significant coefficient on Sample × After × Tech competition
in column (2)), while significantly increase their related patent output (a positive and significant coefficient
on Sample × After × Tech competition in column (4)), suggesting that knowledge flows occur between
alliance participants, consistent with our second hypothesis (H2B). This finding is also consistent with our
earlier observations that clients faced with greater technological competition generate fewer patents; while
enhanced knowledge flow via alliances help those clients to generate significantly more patents that are
related to partners.

27
Columns (5)-(6) and (7)-(8) present the regression results when the dependent variable is the
partner’s unrelated and related patent count, respectively. We find that partners exhibit significant
improvement in both unrelated and related innovation (columns (5) and (7)). Further, we find that the
improvement for both unrelated and related innovation are stronger in the face of fierce technological
competition (columns (6) and (8)), supporting our second hypothesis (H2B) that enhanced knowledge flow
via alliances leads to improved innovation output.
5.3.3. Inventor-Level Evidence
Finally, we examine the productivity of individual investors associated with alliance participant
firms. For this analysis, the sample consists of inventors working either in the alliance firms or their
industry- and size-matched control firms. We obtain information about patent inventors from the Harvard
Business School (HBS) Patent and Inventor Database. For a particular alliance firm (or its matched control
firm), stayers are inventors who apply at least one patent with the firm in the three-year period prior to the
alliance deal and at least one patent with the same firm in the three-year period after the deal and they do
not have any patents outside the firm over these two periods. For a particular alliance firm (or its matched
control firm), new hires are inventors who do not have any patent with the firm in the three-year period
prior to the alliance and at least one patent with the firm in the three-year period after and they do not have
any patents outside the firm over the post-alliance period. Table 9 Panel C presents the results.
The dependent variable is the logarithm of the number of patents an inventor applied, taken at the
end of two three-year periods: year t-3 to t-1 and year t+1 to t+3 relative to the deal announcement in year
t. Firm characteristics are measured at the end of the respective three-year period. We find that both stayers
and new hires in alliance partners exhibit significantly improved productivity post alliance and such
improvement is stronger in the face of fierce technological competition.7 While both stayers and new hires
in alliance clients also exhibit significantly improved productivity, there is no evidence that such
improvement is stronger when clients faced with fierce technological competition. The above findings are
consistent with the evidence in Tables 7 and 8, suggesting that only partners experience significant
improvement in post-alliance patent output when faced with fierce technological competition.
7 In untabulated analyses, we show that both stayers and new hires, respectively, exhibit significant improvement in productivity in alliance partner firms in the face of fierce technological competition.

28
In summary, we conclude that technological competition is positively associated with both the
likelihood of firms joining alliances and the subsequent improved innovation output for alliance partners.
6. Additional Investigation
Robinson and Stuart (2007) note that both alliances and JVs are commonly employed by large firms
to engage in R&D. A joint venture takes place when two or more firms form a new firm to undertake the
activity in common. Like alliances, JVs also involve significant negotiations to divide the income and
intellectual/physical assets stemming from the venture. The key differences are that alliances are
cooperative arrangements between distinct firms to reach a common goal, whereas JVs create a new legal
entity that operates separately from the contributing firms’ core operations.
Our JV sample also comes from the Thomson Financial’s SDC database on Joint Ventures and
Strategic Alliances, and we use the flag “joint venture” to identify JV deals. We impose similar filters as
we did for alliances. We end up with 7,641 JVs involving at least one US publicly listed firms (or their
subsidiaries) over the period 1990-2004. To conduct firm-level and pair-level analysis, we further require
JV deals to be bilateral, involving two innovative US public firms covered by Compustat/CRSP. Client
(partner) is defined as the participant in the JV deals with a higher (lower) value of total assets.
In unreported analyses, we find that compared with alliance clients, JV clients are faced with less
technological competition, have fewer patents, and spend less on R&D. In terms of other firm
characteristics, JV clients are larger, have higher leverage, lower cash holdings, lower Tobin’s Q, and lower
sales growth than alliance clients. Compared with alliance partners, JV partners are faced with less
technological competition, have more patents, and spend less on R&D. In terms of other firm
characteristics, JV partners are larger firms with lower growth opportunities. The comparison between
alliance participants and JV participants suggest that relative to their JV counterparts, alliance participants
are more innovative and have better growth opportunities. Thus, alliances and JVs are likely formed for
different purposes—the former to developing new ideas while the latter to developing and marketing new
products. Further, alliances are more fluid with the market conditions and easier and quicker to form and
to unwind, which are particularly desirable for firms faced with high level of technological uncertainty. In
contrast, JVs have clear boundaries insulating their assets from the contributing firms, but involve more

29
costs and time to form and rely heavily on the full participation of each partner. For these reasons, we expect
that technological factors, including technological competition, might play a less important role in the
formation of JVs compared to alliances.
Table 10 Panel A replicates the specification in Table 4 but using the number of JVs formed in year
t as the dependent variable and a panel data sample of innovative US public firms (excluding the financials).
We find that neither technological competition nor R&D spending is significantly associated with the
number of JVs formed. These findings further support the conjecture that alliances and JVs are
organizational forms serving for different purposes—alliances are mainly formed to develop new ideas,
whereas JVs are formed to develop and market new products.
Table 10 Panel B replicates the specification in Table 7 but using the patent output of JV
participants as the dependent variable. Reinforcing the results in Panel A, technological competition does
not significantly affect the patent output of JV participants after forming JVs as compared to the matched
firms. We conclude that technological competition is not a key consideration in firms’ decision to form
JVs.
7. Conclusions
Alliances are an important organizational structure through which a firm enhances its technological
capacity, product market competitiveness, and long-term productivity growth. However, little is known
about whether and how technological considerations affect firms’ decision to form alliances, and their joint
effects on the subsequent innovation outcome of alliance participants. This paper fills a gap in the literature
by first developing a novel measure of technological competition and then relating it to alliance formation
and subsequent innovation outcome.
Using a large unique patent-strategic alliance dataset over the period 1990 to 2004, we show that
innovative firms faced with greater technological competition are more likely to form alliances.
Technological competition faced by an innovative firm is captured by a cosine similarity measure between
its own patent output and the patent output of all other firms in the economy. We further show that alliances
lead to more patents afterwards in participant firms, especially for partners faced with greater technological
competition. Finally, we show that related patents increase significantly at participant firms, while

30
innovative efficiency and productivity of individual inventors increase significantly only at partner firms.
We do not observe the same effects of technological competition on joint ventures and their innovation
output. Our results are robust to endogeneity concerns. We conclude that technological competition is an
important impetus for redrawing the boundaries of the firm in order to accelerate corporate innovation.
Given the increasing importance of alliances in facilitating corporate innovation activities, gaining
a better understanding of the ways in which alliances interact with firms’ innovation activities and reshape
the boundaries of the firm could be a fruitful area for future research.
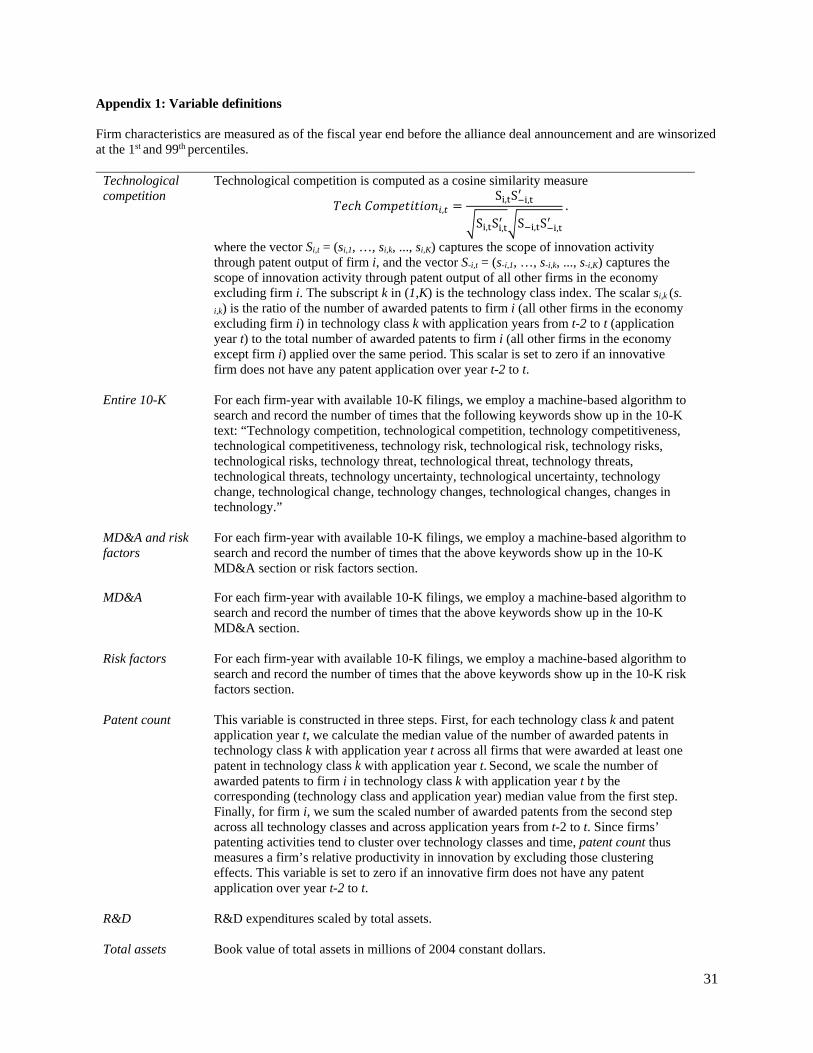
31
Appendix 1: Variable definitions Firm characteristics are measured as of the fiscal year end before the alliance deal announcement and are winsorized at the 1st and 99th percentiles.
Technological competition
Technological competition is computed as a cosine similarity measure
,S , S ,
S , S , S , S ,
.
where the vector Si,t = (si,1, …, si,k, ..., si,K) captures the scope of innovation activity through patent output of firm i, and the vector S-i,t = (s-i,1, …, s-i,k, ..., s-i,K) captures the scope of innovation activity through patent output of all other firms in the economy excluding firm i. The subscript k in (1,K) is the technology class index. The scalar si,k (s-
i,k) is the ratio of the number of awarded patents to firm i (all other firms in the economy excluding firm i) in technology class k with application years from t-2 to t (application year t) to the total number of awarded patents to firm i (all other firms in the economy except firm i) applied over the same period. This scalar is set to zero if an innovative firm does not have any patent application over year t-2 to t.
Entire 10-K For each firm-year with available 10-K filings, we employ a machine-based algorithm to search and record the number of times that the following keywords show up in the 10-K text: “Technology competition, technological competition, technology competitiveness, technological competitiveness, technology risk, technological risk, technology risks, technological risks, technology threat, technological threat, technology threats, technological threats, technology uncertainty, technological uncertainty, technology change, technological change, technology changes, technological changes, changes in technology.”
MD&A and risk factors
For each firm-year with available 10-K filings, we employ a machine-based algorithm to search and record the number of times that the above keywords show up in the 10-K MD&A section or risk factors section.
MD&A For each firm-year with available 10-K filings, we employ a machine-based algorithm to search and record the number of times that the above keywords show up in the 10-K MD&A section.
Risk factors For each firm-year with available 10-K filings, we employ a machine-based algorithm to search and record the number of times that the above keywords show up in the 10-K risk factors section.
Patent count This variable is constructed in three steps. First, for each technology class k and patent application year t, we calculate the median value of the number of awarded patents in technology class k with application year t across all firms that were awarded at least one patent in technology class k with application year t. Second, we scale the number of awarded patents to firm i in technology class k with application year t by the corresponding (technology class and application year) median value from the first step. Finally, for firm i, we sum the scaled number of awarded patents from the second step across all technology classes and across application years from t-2 to t. Since firms’ patenting activities tend to cluster over technology classes and time, patent count thus measures a firm’s relative productivity in innovation by excluding those clustering effects. This variable is set to zero if an innovative firm does not have any patent application over year t-2 to t.
R&D R&D expenditures scaled by total assets.
Total assets Book value of total assets in millions of 2004 constant dollars.

32
Leverage Total debt scaled by total assets, where total debt is the sum of short-term debt and long-
term debt.
ROA Earnings before interest, taxes, depreciation, and amortization scaled by total assets.
Cash holdings Cash and short-term investment scaled by total assets.
Tobin’s Q Market value of total assets scaled by book value of total assets, where market value of total assets is computed as book value of total assets minus book value of common equity plus market value of common equity.
Sales growth The ratio of sales in year t to sales in year t-1 minus one.
Capex Capital expenditures scaled by total assets.
Technological proximity
Following Jaffe (1986), the correlation coefficient is computed as S S
√S S √S S,
where the vector Si = (si,1, …, si,k, ..., si,K) captures the scope of innovation activity through patent output of firm i, and the vector Sj = (sj,1, …, sj,k, ..., sj,K) captures the scope of innovation activity through patent output of firm j. The subscript k in (1,K) is the technology class index. The scalar si,k (sj,k) is the ratio of the number of awarded patents to firm i (j) in technology class k with application years from t-2 to t to the total number of awarded patents to firm i (j) applied over the same period.
Same industry Equal to one if the client and the partner operate in the same two-digit SIC industry, and zero otherwise.
Same state Equal to one if the client and the partner are incorporated in the same state, and zero otherwise.
Sample Equal to one if it is an alliance participant, and zero otherwise.
After Equal to one if it is after the alliance deal announcement, and zero otherwise.
R&D amount
R&D expenditures in millions of 2004 constant dollars.
Innovative efficiency
Following Hirshleifer et al. (2013), as # patentst / (R&Dt-2 + 0.8*R&Dt-3 + 0.6*R&Dt-4 + 0.4*R&Dt-5 + 0.2*R&Dt-6), where R&D is the dollar amount of R&D expenditures.
Unrelated patent
For a client (partner), unrelated patents are those patents applied in year t that do not cite patents of the partner (client).
Related patent
For a client (partner), related patents are those patents applied in year t that cite patents of the partner (client).
Combined reporting index (headquarters)
The construction of this variable follows Bodnaruk et al. (2013). For each firm, the combined reporting indicator variable is set to one if its headquarter is located in a state that imposes the combined reporting rule, and zero otherwise.
Combined reporting index (headquarters and subsidiaries)
The construction of this variable follows Bodnaruk et al. (2013). For each subsidiary (including the headquarter) of a firm, the combined reporting indicator variable is set to one if the subsidiary (or the headquarter) is located in a state that imposes the combined reporting rule, and zero otherwise. The firm’s combined reporting index is the average

33
value of the combined reporting indicator variable across all of its subsidiaries (including the headquarter) when the information on subsidiary location is available, and the value of the combined reporting indicator variable based on headquarter location otherwise.

34
References:
Aghion, Philippe, Nick Bloom, Richard Blundell, Rachel Griffith, and Peter Howitt, 2005. Competition and innovation: An inversed-U relationship, Quarterly Journal of Economics 120, 701-728.
Aghion, Philippe, Christopher Harris, Peter Howitt, and John Vickers, 2001. Competition, imitation and
growth with step-by-step innovation, Review of Economic Studies 68, 467-492. Aghion, Philippe, and Peter Howitt, 1992. A model of growth through creative destruction, Econometrica
60, 323-351. Allen, Jeffrey W., and Gordon M. Phillips, 2000. Corporate equity ownership, strategic alliances, and
product market relationships, Journal of Finance 55, 2791-2815. Austin, David H., 1993. An event-study approach to measuring innovative output: The case of
biotechnology, American Economic Review 83, 253-258. Bena, Jan, and Kai Li, 2014. Corporate innovations and mergers and acquisitions, Journal of Finance in
press. Beshears, John, 2013. The performance of corporate alliances: Evidence from oil and gas drilling in the
Gulf of Mexico, Journal of Financial Economics 110, 324-346. Blundell, Richard, Griffith, Rachel, and John van Reenen, 1999. Market share, market value and
innovation in a panel of British manufacturing firms, Review of Economic Studies 66, 529-554. Bodnaruk, Andriy, Massimo Massa, and Andrei Simonov, 2013. Alliances and corporate governance,
Journal of Financial Economics 107, 671-693. Boone, Audra L., and Vladimir I. Ivanov, 2012. Bankruptcy spillover effects on strategic alliance partners,
Journal of Financial Economics 103, 551-569. Brown, Graham, and Thanos Mergoupis, 2010. Treatment interactions with non-experimental data in Stata,
Bath Economics Research Paper No. 10/10. Chan, Su Han, John W. Kensinger, Arthur J. Keown, and John D. Martin, 1997. Do strategic alliances
create value? Journal of Financial Economics 46, 199-221. Coase, R.H., 1937. The nature of the firm, Economica 4, 386-405. Dixit, Avinash, and Robert Pindyck, 1994. Investment under Uncertainty. Princeton: Princeton University
Press. Fee, C. Edward, Charles J. Hadlock, and Shawn Thomas, 2006. Corporate equity ownership and the
governance of product market relationship, Journal of Finance 61, 1217-1250. Fulghieri, Paolo, and Merih Sevilir, 2003. The ownership and financing of innovation in R&D races,
University of North Carolina working paper.

35
Gans, Joshua S., David Hsu, and Scott Stern, 2002. When does start-up innovation spur the gale of creative destruction? RAND Journal of Economics 33, 571-586.
Geroski, Paul, 1995. Market structure, corporate performance and innovative activity, Oxford: Oxford
University Press. Gomes-Casseres, Benjamin, John Hagedoorn, and Adam B. Jaffe, 2006. Do alliances promote knowledge
flows? Journal of Financial Economics 80, 5-33. Grossman, Sanford J., and Oliver D. Hart, 1986. The costs and benefits of ownership: A theory of vertical
and lateral integration, Journal of Political Economy 94, 691-719. Hall, Bronwyn H., Adam B. Jaffe, and Manuel Trajtenberg, 2001. The NBER Patent Citation Data File:
Lessons, insights and methodological tools, NBER working paper. Hall, Bronwyn H., Adam B. Jaffe, and Manuel Trajtenberg, 2005. Market value and patent citations, Rand
Journal of Economics 36, 16-38. Hart, Oliver, 1995. A natural-resource-based view of the firm, Academy of Management Review 20, 986-
1014. Hart, Oliver, and John Moore, 1990. Property rights and the nature of the firm, Journal of Political Economy
98, 1119-1158. Hirshleifer, David, Po-Hsuan Hsu, and Dongmei Li, 2013. Innovative efficiency and stock returns, Journal
of Financial Economics 107, 632-654. Hoberg, Gerard, and Gordon Phillips, 2010, Product market synergies and competition in mergers and
acquisitions: A text-based analysis, Review of Financial Studies 23, 3773-3811. Hoberg, Gerard, Gordon Phillips, and Nagpurnanand Prabhala, 2014. Product market threats, payouts, and
financial flexibility, Journal of Finance 69, 293-324. Jaffe, Adam B., 1986, Technological opportunity and spillovers of R&D: Evidence from firms’ patents,
profits, and market value, American Economic Review 76, 984-1001. Jensen, Michael C., 1993. The modern industrial revolution, exit, and the failure of internal control systems,
Journal of Finance 48, 831-880. Jensen, Michael C., and William H. Meckling, 1976, Theory of the firm: Managerial behavior, agency costs
and ownership structure, Journal of Financial Economics 3, 305-360. Jensen, Michael C., and William H. Meckling, 1992. Specific and general knowledge, and organizational
structure, in: Lars Werin and Hans Wijkander, eds., Contract Economics, Blackwell, Oxford, 251-274. Klein, Benjamin, Roberts G. Crawford, and Armen A. Alchian, 1978. Vertical integration, appropriable
rents, and the competitive contracting process, Journal of Law and Economics 21, 297-326. Kogan, Leonid, Dimitris Papanikolaou, Amit Seru, and Noah Stoffman, 2012. Technological innovation,
resource allocation, and growth, MIT working paper.

36
Kranton, Rachel E, 1996. Reciprocal exchange: A self-sustaining system, American Economic Review 86, 830-851.
Lerner, Josh, and Roberts P. Merges, 1998. The control of strategic alliances: An empirical analysis of
biotechnology collaborations, Journal of Industrial Economics 46,125-156. Li, Kai, and N. R. Prabhala, 2007, Self-selection models in corporate finance, in Eckbo, B.E., ed.: Handbook
of Corporate Finance: Empirical Corporate Finance, The Netherlands: Elsevier/North-Holland. Lindsey, Laura, 2008. Blurring firm boundaries: The role of venture capital in strategic alliances, Journal
of Finance 63, 1137-1168. Mazerov, Michael, 2009. A majority of states have now adopted a key corporate tax reform – “combined
reporting”, Center on Budget and Policy Priority working paper. McFadden, Daniel, 1974. Conditional logit analysis of qualitative choice behavior, in: Zarembka, P., ed.,
Frontiers of Econometrics, Academic Press. Mody, Ashoka, 1993. Learning through alliances, Journal of Economic Behavior and Organization 20,
151-170. Nickell, Stephen, 1996. Competition and corporate performance, Journal of Political Economy 104, 724-
746. Nicholas, Tom, 2008. Does innovation cause stock market runups? Evidence from the great crash,
American Economic Review 98, 1370-1396. Pakes, Ariel, 1985. On patents, R&D, and the stock market rate of return, Journal of Political Economy 93,
390-409. Parkhe, Arvind, 1993. Strategic alliance structuring: A game theoretic and transaction cost examination of
interfirm cooperation, Academy of Management Journal 36, 794-829. Robinson, David T., 2008. Strategic alliances and the boundaries of the firm, Review of Financial Studies
21, 649-681. Robinson, David T., and Toby E. Stuart, 2002. Financial contracting in biotech strategic alliances, Journal
of Law and Economics 50, 559-596. Seru, Amit, 2014. Firm boundaries matter: Evidence from conglomerates and R&D activity, Journal of
Financial Economics 111, 381-405. Seth, Anju, and Tailan Chi, 2005. What does a real options perspective add to the understanding of strategic
alliances? in: Shenkar, O., and J.J. Reuer, eds., Handbook of Strategic Alliances, Sage Publications, Thousand Oaks, CA.
Trigeorgis, Lenos, 1996. Real Options: Managerial Flexibility and Strategy in Resource Allocation.
Cambridge: The MIT Press.

37
Figure 1: Technological competition over time This figure shows the average level of technological competition over the period 1980-2003. The sample includes innovative US public firms covered by Compustat/CRSP. Innovative firms are firms with at least one awarded patent over the period 1976 to 2006 by the US Patent and Trademark Office (USPTO).
0
0.02
0.04
0.06
0.08
0.1
0.12
Technological competition

38
Table 1 Measuring technological competition
This table reports summary statistics of our technological competition measure and the number of word hits from 10-K search for all Compustat firms with non-zero value for our technological competition measure over the period 1996 to 2003. Panel A presents the summary statistics. Panel B presents the correlation matrix. Panel C provides a list of top 20 firms with the highest level of technological competition in 1980, 1990, and 2000. Definitions of the variables are provided in Appendix 1. The numbers in parentheses in Panel B are the p-value of Pearson correlation. Panel A: Summary statistics Mean S.D. Median
Technological competition 0.124 0.117 0.094 # of word hits from 10-K search Entire 10-K 0.630 1.368 0.000 MD&A and risk factors 0.260 0.792 0.000 MD&A 0.186 0.663 0.000 Risk factors 0.074 0.418 0.000 Number of firm-year observations 19,352
Panel B: Correlations
(1) (2) (3) (4)
(1) Technological competition
# of word hits from 10-K search
(2) Entire 10-K 0.191 (0.00)
(3) MD&A and risk factors 0.137 0.743 (0.00) (0.00)
(4) MD&A 0.116 0.647 0.850 (0.00) (0.00) (0.00)
(5) Risk factors 0.075 0.381 0.547 0.023 (0.00) (0.00) (0.00) (0.00)
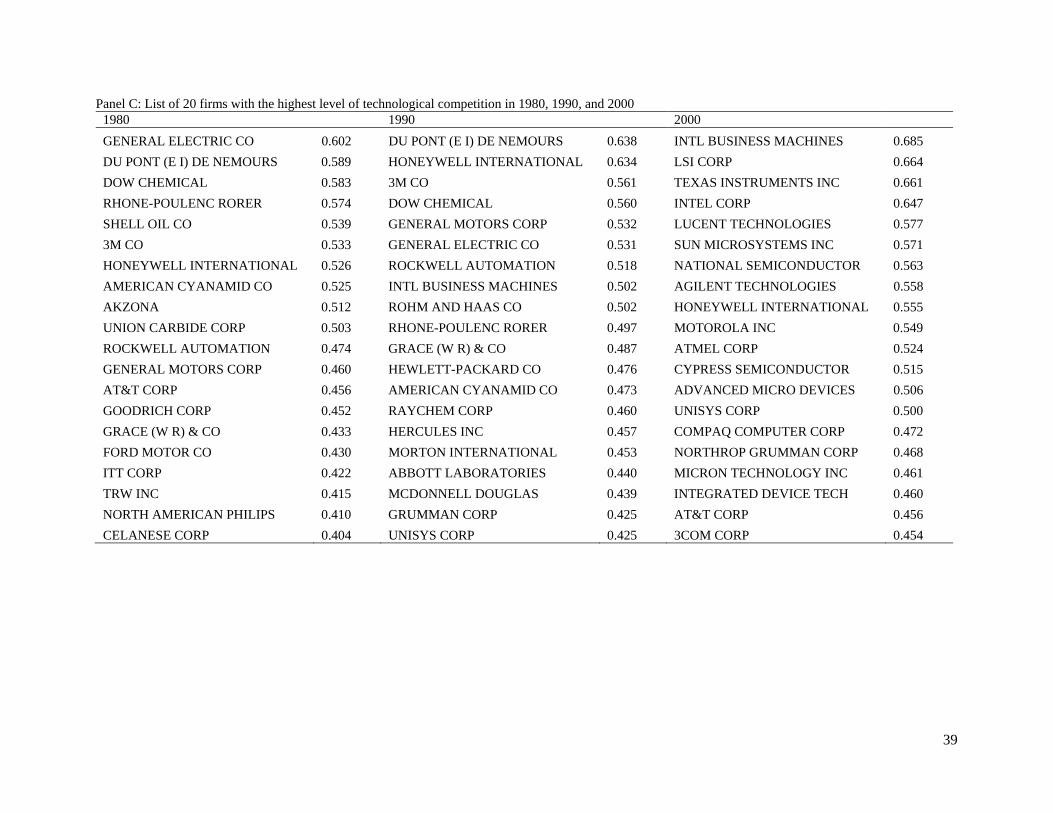
39
Panel C: List of 20 firms with the highest level of technological competition in 1980, 1990, and 2000 1980 1990 2000
GENERAL ELECTRIC CO 0.602 DU PONT (E I) DE NEMOURS 0.638 INTL BUSINESS MACHINES 0.685
DU PONT (E I) DE NEMOURS 0.589 HONEYWELL INTERNATIONAL 0.634 LSI CORP 0.664
DOW CHEMICAL 0.583 3M CO 0.561 TEXAS INSTRUMENTS INC 0.661
RHONE-POULENC RORER 0.574 DOW CHEMICAL 0.560 INTEL CORP 0.647
SHELL OIL CO 0.539 GENERAL MOTORS CORP 0.532 LUCENT TECHNOLOGIES 0.577
3M CO 0.533 GENERAL ELECTRIC CO 0.531 SUN MICROSYSTEMS INC 0.571
HONEYWELL INTERNATIONAL 0.526 ROCKWELL AUTOMATION 0.518 NATIONAL SEMICONDUCTOR 0.563
AMERICAN CYANAMID CO 0.525 INTL BUSINESS MACHINES 0.502 AGILENT TECHNOLOGIES 0.558
AKZONA 0.512 ROHM AND HAAS CO 0.502 HONEYWELL INTERNATIONAL 0.555
UNION CARBIDE CORP 0.503 RHONE-POULENC RORER 0.497 MOTOROLA INC 0.549
ROCKWELL AUTOMATION 0.474 GRACE (W R) & CO 0.487 ATMEL CORP 0.524
GENERAL MOTORS CORP 0.460 HEWLETT-PACKARD CO 0.476 CYPRESS SEMICONDUCTOR 0.515
AT&T CORP 0.456 AMERICAN CYANAMID CO 0.473 ADVANCED MICRO DEVICES 0.506
GOODRICH CORP 0.452 RAYCHEM CORP 0.460 UNISYS CORP 0.500
GRACE (W R) & CO 0.433 HERCULES INC 0.457 COMPAQ COMPUTER CORP 0.472
FORD MOTOR CO 0.430 MORTON INTERNATIONAL 0.453 NORTHROP GRUMMAN CORP 0.468
ITT CORP 0.422 ABBOTT LABORATORIES 0.440 MICRON TECHNOLOGY INC 0.461
TRW INC 0.415 MCDONNELL DOUGLAS 0.439 INTEGRATED DEVICE TECH 0.460
NORTH AMERICAN PHILIPS 0.410 GRUMMAN CORP 0.425 AT&T CORP 0.456
CELANESE CORP 0.404 UNISYS CORP 0.425 3COM CORP 0.454

40
Table 2 Strategic alliances over time, 1990–2004
This table reports the number of strategic alliances involving US public firms by the year of alliance deal announcement over the period 1990 to 2004. In Panel A, a deal enters the sample if at least one of the alliance participants or their parent firms is covered by Compustat/CRSP and the alliance participants (or their parent firms) are not financial firms (SIC code between 6000 and 6999). In Panel B, we further require that alliance participants (or their parent firms) be innovative. Innovative firms are firms with at least one awarded patent over the period 1976 to 2006 by the US Patent and Trademark Office (USPTO). Panel A: Different forms of alliances over time
Year Alliances involving at least one public
firm
Bilateral alliances involving at least one
public firm
Bilateral alliances between public firms or their subsidiaries
Bilateral alliances between public
firms
(1) (2) (3) (4)
1990 967 914 197 110 1991 1,784 1,672 403 275 1992 2,252 2,132 596 372 1993 2,348 2,148 560 370 1994 2,481 2,269 594 354 1995 2,209 2,041 593 368 1996 1,536 1,434 480 349 1997 2,180 1,998 670 472 1998 2,650 2,444 700 450 1999 3,065 2,833 890 633 2000 2,640 2,420 474 296 2001 1,691 1,594 340 195 2002 1,200 1,142 230 143 2003 1,622 1,554 302 184 2004 1,356 1,303 231 139
Total 29,981 27,898 7,260 4,710
Panel B: Alliances involving innovative firms
1990 862 815 191 107 1991 1,558 1,463 391 270 1992 1,900 1,794 554 353 1993 1,999 1,822 524 348 1994 2,045 1,858 560 336 1995 1,731 1,606 543 340 1996 1,192 1,108 440 319 1997 1,666 1,515 609 441 1998 1,906 1,736 596 387 1999 2,205 2,023 751 539 2000 1,848 1,678 400 250 2001 1,320 1,239 303 177 2002 913 870 209 132 2003 1,267 1,214 270 165 2004 1,039 999 218 135
Total 23,451 21,740 6,559 4,299
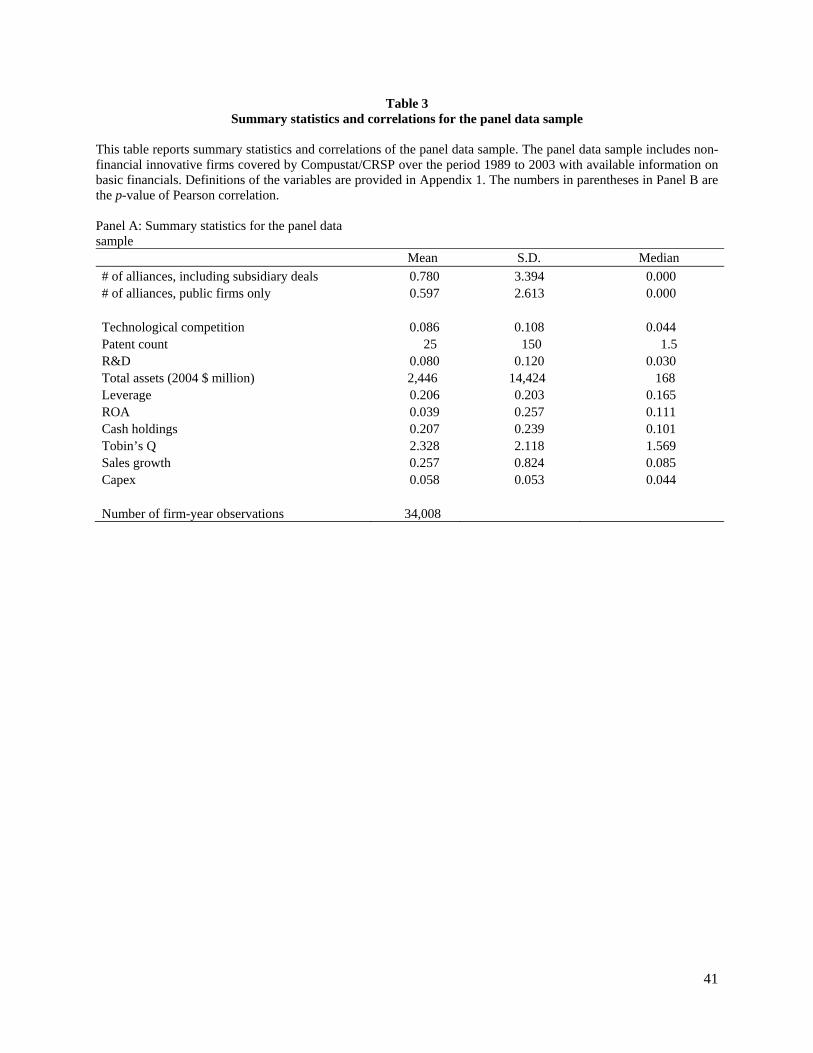
41
Table 3 Summary statistics and correlations for the panel data sample
This table reports summary statistics and correlations of the panel data sample. The panel data sample includes non-financial innovative firms covered by Compustat/CRSP over the period 1989 to 2003 with available information on basic financials. Definitions of the variables are provided in Appendix 1. The numbers in parentheses in Panel B are the p-value of Pearson correlation. Panel A: Summary statistics for the panel data sample
Mean S.D. Median
# of alliances, including subsidiary deals 0.780 3.394 0.000 # of alliances, public firms only 0.597 2.613 0.000 Technological competition 0.086 0.108 0.044 Patent count 25 150 1.5 R&D 0.080 0.120 0.030 Total assets (2004 $ million) 2,446 14,424 168 Leverage 0.206 0.203 0.165 ROA 0.039 0.257 0.111 Cash holdings 0.207 0.239 0.101 Tobin’s Q 2.328 2.118 1.569 Sales growth 0.257 0.824 0.085 Capex 0.058 0.053 0.044 Number of firm-year observations 34,008

42
Panel B: Correlations
(1) (2) (3) (4) (5) (6) (7) (8) (9) (10) (11)
(1) Log (1 + # of alliances, including subsidiary deals)
(2) Log (1+ # of alliances, 0.876 public firms only (0.00)
(3) Technological competition 0.387 0.372
(0.00) (0.00)
(4) Log (1 + patent count) 0.349 0.278 0.660
(0.00) (0.00) (0.00)
(5) R&D 0.119 0.211 0.275 0.058
(0.00) (0.00) (0.00) (0.00)
(6) Log (total assets) 0.248 0.077 0.229 0.477 -0.385
(0.00) (0.00) (0.00) (0.00) (0.00)
(7) Leverage -0.114 -0.183 -0.118 -0.011 -0.225 0.217
(0.00) (0.00) (0.00) (0.04) (0.00) (0.00)
(8) ROA 0.042 -0.020 -0.090 0.090 -0.659 0.436 0.028
(0.00) (0.04) (0.00) (0.00) (0.00) (0.00) (0.00)
(9) Cash holdings 0.111 0.218 0.219 -0.013 0.503 -0.325 -0.443 -0.388
(0.00) (0.00) (0.00) (0.02) (0.00) (0.00) (0.00) (0.00)
(10) Tobin’s Q 0.156 0.217 0.155 0.036 0.390 -0.218 -0.195 -0.295 0.421
(0.00) (0.00) (0.00) (0.00) (0.00) (0.00) (0.00) (0.00) (0.00)
(11) Sales growth 0.048 0.087 0.050 -0.031 0.133 -0.089 -0.095 -0.131 0.226 0.275
(0.00) (0.00) (0.00) (0.00) (0.00) (0.00) (0.00) (0.00) (0.00) (0.00)
(12) Capex 0.002 0.016 0.027 0.033 -0.030 0.103 0.044 0.070 -0.152 0.040 0.054 (0.87) (0.09) (0.00) (0.00) (0.00) (0.00) (0.00) (0.00) (0.00) (0.00) (0.00)

43
Table 4 Tobit regressions
This table reports coefficient estimates from Tobit models in Equation (2). The panel data sample includes non-financial innovative firms covered by Compustat/CRSP over the period 1989 to 2003 with available information on basic financials. The dependent variable is the logarithm of one plus the number of alliance deals announced in year t. In column (1), alliance deals involving public firm subsidiaries are included, whereas such deals are excluded in column (2). Definitions of the variables are provided in Appendix 1. Robust standard errors that allow for clustering at the firm level are reported in parentheses. *, **, and *** denote significance at the 10%, 5%, and 1% level, respectively.
Log (1 + # of alliances,
including subsidiary deals) Log (1 + # of alliances,
public firms only)
(1) (2)
Technological competition 1.114*** 1.282*** (0.159) (0.164)
Patent count 0.095*** 0.101***
(0.015) (0.015)
R&D 1.781*** 1.787*** (0.153) (0.153)
Firm size 0.316*** 0.258*** (0.012) (0.013)
Leverage -0.423*** -0.446*** (0.079) (0.084)
ROA -0.155** -0.052 (0.070) (0.071)
Cash holdings 0.490*** 0.631*** (0.065) (0.068)
Tobin’s Q 0.076*** 0.076*** (0.006) (0.006)
Sales growth 0.072*** 0.079*** (0.011) (0.011)
Capex 0.061 0.603** (0.249) (0.261)
Intercept -3.275*** -3.123*** (0.254) (0.239)
Industry fixed effects Yes Yes
Year fixed effects Yes Yes
Number of observations 34,008 34,008
Pseudo R-squared 0.18 0.17

44
Table 5 Summary statistics for the firm-level and pair-level samples
This table reports summary statistics of the firm-level and pair-level samples, as well as their industry- and size-matched control firm and control pair samples. The firm-level client (partner) sample contains innovative clients (partners) in bilateral alliance deals. The client (partner) in an alliance deal is identified by the firm with a higher (lower) value of total assets. To form the firm-level control sample, for each sample client (partner), we identify up to five control firms that satisfy the following conditions: 1) they are innovative; 2) they share at least one-digit SIC code with the sample firm; 3) their total assets in year t falls between 50% and 150% of the sample firm’s total assets; and 4) they are not part of an alliance or JV deal in the three-year period prior to and one-year period after the alliance deal announcement. The pair-level sample contains actual pairs formed by merging the firm-level client sample with the firm-level partner sample. The pair-level control sample is obtained by pairing the actual partner with up to five of the closest matches to the client, and by pairing the actual client with up to five of the closest matches to the partner. Panels A, B, and C report summary statistics for the firm-level client (partner) sample and its industry- and size-matched control sample. Panel D reports summary statistics of pair-level characteristics for the pair-level sample and the pair-level control sample. Definitions of the variables are provided in Appendix 1. p-values of the t-test and Wilcoxon test are reported in the last two columns. Panel A: Alliance clients versus partners Clients Partners t-test Wilcoxon Mean S.D. Median Mean S.D. Median Technological competition 0.264 0.164 0.267 0.152 0.135 0.135 (0.00) (0.00) Patent count 267 434 65 50 187 3 (0.00) (0.00) R&D 0.102 0.082 0.098 0.153 0.135 0.124 (0.00) (0.00) Total assets (2004 $ million) 8,670 10,969 4,162 1,739 4,928 190 (0.00) (0.00) Leverage 0.153 0.154 0.127 0.119 0.169 0.044 (0.00) (0.00) ROA 0.151 0.143 0.166 0.011 0.286 0.091 (0.00) (0.00) Cash holdings 0.233 0.212 0.161 0.383 0.257 0.365 (0.00) (0.00) Tobin’s Q 3.179 2.517 2.314 3.878 3.125 2.706 (0.00) (0.00) Sales growth 0.328 0.766 0.144 0.614 1.228 0.236 (0.00) (0.00) Capex 0.072 0.047 0.062 0.063 0.049 0.051 (0.00) (0.00) Number of observations 2,516 2,686 Panel B: Firm-level alliance clients versus their industry- and size-matched firms
Clients Client matches t-test Wilcoxon Mean S.D. Median Mean S.D. Median Technological competition 0.264 0.164 0.267 0.098 0.137 0.045 (0.00) (0.00) Patent count 267 434 65 56 182 3 (0.00) (0.00) R&D 0.102 0.082 0.098 0.034 0.062 0.012 (0.00) (0.00) Total assets (2004 $ million) 8,670 10,969 4,162 4,535 6,100 1,633 (0.00) (0.00)

45
Leverage 0.153 0.154 0.127 0.264 0.192 0.250 (0.00) (0.00) ROA 0.151 0.143 0.166 0.129 0.102 0.131 (0.00) (0.00) Cash holdings 0.233 0.212 0.161 0.107 0.161 0.044 (0.00) (0.00) Tobin’s Q 3.179 2.517 2.314 1.844 1.394 1.409 (0.00) (0.00) Sales growth 0.328 0.766 0.144 0.184 0.608 0.068 (0.00) (0.00) Capex 0.072 0.047 0.062 0.055 0.042 0.047 (0.00) (0.00) Number of observations 2,516 9,196 Panel C: Firm-level alliance partners versus their industry- and size-matched firms
Partners Partner matches t-test Wilcoxon Mean S.D. Median Mean S.D. Median Technological competition 0.152 0.135 0.135 0.065 0.096 0.020 (0.00) (0.00) Patent count 50 187 3 12 68 1 (0.00) (0.00) R&D 0.153 0.135 0.124 0.065 0.103 0.023 (0.00) (0.00) Total assets (2004 $ million) 1,739 4,928 190 975 2,778 163 (0.00) (0.01) Leverage 0.119 0.169 0.044 0.202 0.206 0.145 (0.00) (0.00) ROA 0.011 0.286 0.091 0.084 0.202 0.125 (0.00) (0.00) Cash holdings 0.383 0.257 0.365 0.203 0.237 0.097 (0.00) (0.00) Tobin’s Q 3.878 3.125 2.706 2.288 1.973 1.560 (0.00) (0.00) Sales growth 0.614 1.228 0.236 0.262 0.763 0.094 (0.00) (0.00) Capex 0.063 0.049 0.051 0.054 0.051 0.039 (0.00) (0.00) Number of observations 2,686 12,147 Panel D: The pair-level sample versus the pair-level control sample
Alliance pairs Matching pairs t-test Wilcoxon
Mean S.D. Median Mean S.D. Median Technological proximity 0.208 0.269 0.075 0.039 0.130 0.000 (0.00) (0.00) Same industry 0.464 0.499 0.000 0.406 0.491 0.000 (0.00) (0.00) Same state 0.231 0.422 0.000 0.088 0.283 0.000 (0.00) (0.00) Number of observations 1,791 14,843

46
Table 6 Firm- and Pair-level conditional logit regressions
This table reports coefficient estimates from conditional logit models in Equations (3) and (4). In Panel A, the dependent variable is equal to one for the actual client (partner), and zero for the client (partner) control firms. Column (1) uses the firm-level client sample and its industry- and size-matched control firm sample described in Table 5 Panel B. Column (2) uses the firm-level client sample and up to five randomly drawn control firms for each actual client that are not part of an alliance or JV deal in the three-year period prior to and one-year period after the alliance deal announcement. Column (3) uses the firm-level partner sample and its industry- and size-matched control firm sample described in Table 5 Panel C. Column (4) uses the firm-level partner sample and up to five randomly drawn control firms for each actual partner. In columns (2) and (4), we repeat the regression in Equation (3) 500 times by drawing with replacement at the deal cluster level to obtain standard errors of the coefficient estimates. In Panel B, the dependent variable is equal to one for the actual pair, and zero for the control (pseudo) pairs. Column (1) uses the pair-level sample and the client industry- and size-matched control (pseudo) pair sample formed by using the actual client paired with up to five industry- and size-matched control firms of the actual partner. Column (2) uses the pair-level sample and the partner industry- and size-matched control (pseudo) pair sample formed by using the actual partner paired with up to five industry- and size-matched control firms of the actual client. Column (3) uses the pair-level sample and the client randomly drawn control (pseudo) pairs formed by using the actual client paired with five randomly drawn firms that are not part of an alliance or JV deal in the three-year period prior to and one-year period after the alliance deal announcement. Column (4) uses the pair-level sample and the partner randomly drawn control (pseudo) pairs formed by using the actual partner paired with five randomly drawn firms that are not part of an alliance or JV deal in the three-year period prior to and one-year period after the alliance deal announcement. In columns (2) and (4), we repeat the regression in Equation (4) 500 times by drawing with replacement at the deal cluster level to obtain standard errors of the coefficient estimates. Robust standard errors that allow for clustering at the deal level are reported in parentheses. *, **, and *** denote significance at the 10%, 5%, and 1% level, respectively.

47
Panel A: Firm-level conditional logit regressions
Client = 1, client match = 0 Partner = 1, partner match = 0
Industry- and
size-match Random match
Industry- and size-match
Random match
(1) (2) (3) (4)
Technological competition 2.298*** 4.474*** 3.519*** 3.064*** (0.390) (0.539) (0.348) (0.370)
Patent count 0.319*** 0.121*** 0.136*** 0.052* (0.034) (0.040) (0.032) (0.029)
R&D 10.946*** 8.333*** 5.563*** 6.910*** (0.761) (0.692) (0.350) (0.367)
Firm size 3.542*** 1.038*** 2.941*** 0.515*** (0.152) (0.041) (0.127) (0.022)
Leverage -1.914*** -1.330*** -1.284*** -0.746*** (0.305) (0.307) (0.197) (0.180)
ROA 0.825* 2.105*** -0.299 0.707*** (0.450) (0.347) (0.194) (0.166)
Cash holdings 3.604*** 2.273*** 2.229*** 2.837*** (0.312) (0.289) (0.155) (0.156)
Tobin’s Q 0.097*** 0.169*** 0.138*** 0.179*** (0.027) (0.025) (0.015) (0.015)
Sales growth 0.247*** 0.199*** 0.206*** 0.183*** (0.056) (0.056) (0.030) (0.034)
Capex 5.557*** -0.498 2.346*** 0.642 (0.836) (1.104) (0.574) (0.579)
Deal fixed effects Yes Yes Yes Yes
Number of observations 11,382 15,667 14,274 16,962
Pseudo R-squared 0.59 0.78 0.39 0.47

48
Panel B: Pair-level conditional logit regressions
Alliance pair = 1, pair match = 0
Industry- and size-match Random match
Clients Partners Clients Partners
(1) (2) (3) (4)
Counterparty’s characteristics
Technological competition 1.618*** 1.612*** 0.576 3.744*** (0.494) (0.502) (0.603) (0.802)
Patent count 0.094** 0.322*** 0.004 0.191*** (0.042) (0.045) (0.046) (0.063)
R&D 5.316*** 10.059*** 6.406*** 7.009*** (0.429) (1.022) (0.533) (1.070)
Firm size 2.881*** 3.692*** 0.459*** 1.056*** (0.164) (0.213) (0.029) (0.066)
Leverage -1.200*** -1.747*** -0.772*** -1.919*** (0.252) (0.405) (0.269) (0.528)
ROA -0.151 0.942 0.949*** 1.562*** (0.236) (0.623) (0.236) (0.571)
Cash holdings 2.159*** 3.277*** 2.491*** 2.171*** (0.190) (0.411) (0.228) (0.479)
Tobin’s Q 0.142*** 0.091** 0.178*** 0.094** (0.019) (0.037) (0.022) (0.045)
Sales growth 0.170*** 0.176** 0.159*** 0.164* (0.042) (0.072) (0.055) (0.092)
Capex 1.561** 5.788*** 0.529 0.202 (0.735) (1.090) (0.862) (2.023)
Bilateral characteristics Technological proximity 2.840*** 4.232*** 5.816*** 5.195***
(0.235) (0.421) (0.626) (0.741)
Same industry 0.686** 1.807*** 1.641*** 2.467*** (0.341) (0.224) (0.109) (0.203)
Same state 0.611*** 1.046*** 0.804*** 0.940*** (0.101) (0.154) (0.126) (0.223)
Deal fixed effects Yes Yes Yes Yes
Number of observations 9,661 8,128 10,789 10,511
Pseudo R-squared 0.44 0.68 0.62 0.87

49
Table 7 Difference-in-differences regressions
This table reports the ex-post treatment effect of alliances on subsequent innovation output of clients and partners using a difference-in-differences approach. The sample is a panel data tracking alliance clients (partners) in the firm-level sample and their industry- and size-matched control firms from three years prior to the alliance deal announcement (year t-3) to three years after the alliance deal announcement (year t+3). The dependent variable is client (partner) innovation output as measured by the logarithm of one plus patent count. Columns (1) and (3) present estimates from the difference-in-differences regressions in Equation (5). Columns (2) and (4) present estimates from the difference-in-difference-in-differences regressions in Equation (6). Definitions of the variables are provided in Appendix 1. Robust standard errors that allow for clustering at the deal level are reported in parentheses. *, **, and *** denote significance at the 10%, 5%, and 1% level, respectively.

50
Log (1 + patent count)
Clients and their industry- and size-
matched control firms Partners and their industry- and size-
matched control firms
(1) (2) (3) (4)
Sample × After × Tech competition -0.821*** 0.813*** (0.13) (0.15)
Sample × After 0.050** 0.292*** 0.144*** 0.049** (0.02) (0.04) (0.02) (0.02)
Sample × Tech competition 0.149 0.517*** (0.13) (0.14)
After × Tech competition -0.005 -0.658*** (0.06) (0.09)
Sample 0.407*** 0.355*** 0.083*** 0.001 (0.03) (0.05) (0.02) (0.02)
After 0.113*** 0.114*** 0.017*** 0.064*** (0.01) (0.01) (0.01) (0.01)
Technological competition 9.077*** 9.130*** 6.629*** 6.644*** (0.08) (0.09) (0.11) (0.12)
R&D 0.141 0.133 0.564*** 0.578*** (0.16) (0.16) (0.08) (0.08)
Firm size 0.152*** 0.151*** 0.168*** 0.168*** (0.02) (0.02) (0.01) (0.01)
Leverage 0.126* 0.121* -0.127*** -0.128*** (0.07) (0.07) (0.04) (0.04)
ROA 0.725*** 0.724*** 0.117*** 0.109*** (0.07) (0.07) (0.03) (0.03)
Cash holdings -0.607*** -0.607*** -0.094*** -0.092*** (0.07) (0.07) (0.03) (0.03)
Tobin’s Q 0.070*** 0.071*** 0.015*** 0.016*** (0.01) (0.01) (0.00) (0.00)
Sales growth -0.065*** -0.063*** -0.021*** -0.020*** (0.01) (0.01) (0.00) (0.00)
Capex -0.557*** -0.527*** 0.441*** 0.421*** (0.17) (0.17) (0.09) (0.09)
Intercept -0.355*** -0.359*** -0.316*** -0.316*** (0.13) (0.13) (0.05) (0.05)
Deal fixed effects Yes Yes Yes Yes
Number of observations 64,456 64,456 77,682 77,682
Pseudo R-squared 0.80 0.80 0.73 0.73

51
Table 8 Treatment regressions
This table reports the ex-post treatment effect of alliances on subsequent innovation output of clients and partners using the treatment regression with an instrumental variable. The sample includes clients (partners) in the firm-level sample and their industry- and size-matched control firms. In the 1st-stage regressions, the dependent variable is an indicator variable that equals to one if a firm is the client (partner), and zero otherwise. In the 2nd-stage regressions, the dependent variable is the logarithm of one plus the firm’s patent count over the period year t+1 to t+3, where year t is the alliance announcement year. Firm characteristics are measured at the end of the fiscal year end immediately before the alliance announcement year. We use the client (partner) combined reporting index as the instrumental variable in the 1st stage regressions. The construction of this instrumental variable follows Bodnaruk et al. (2013). The combined reporting index is constructed either using information on a firm’s headquarter location (columns (1) and (3)) or using information on locations of both the firm’s headquarter and its subsidiaries (columns (5) and (7)). The estimation of the two-stage regressions allows for the endogeneity of the interaction term between the indicator variable for sample firms and technological competition using Stata command itreatreg (Brown and Mergoupis, 2010). Definitions of the variables are provided in Appendix 1. *, **, and *** denote significance at the 10%, 5%, and 1% level, respectively.

52
Clients and their industry- and size-
matched control firms Partners and their industry- and size-
matched control firms Clients and their industry- and size-
matched control firms Partners and their industry- and size-
matched control firms 1st-stage 2nd-stage 1st-stage 2nd-stage 1st-stage 2nd-stage 1st-stage 2nd-stage
(1) (2) (3) (4) (5) (6) (7) (8)
Sample × Tech competition -0.403** 0.841*** -0.458** 0.823*** (0.200) (0.185) (0.199) (0.185)
Sample 0.550*** 0.296*** 0.654*** 0.326*** (0.098) (0.062) (0.099) (0.062)
Combined reporting index 0.260*** 0.197*** (headquarters) (0.037) (0.030)
Combined reporting index 0.311*** 0.260*** (headquarters and subsidiaries) (0.045) (0.032)
Technological competition 0.921*** 0.826*** 2.061*** -0.277** 0.714*** 0.807*** 2.022*** -0.290** (0.185) (0.156) (0.183) (0.138) (0.183) (0.156) (0.183) (0.138)
Patent count 0.146*** 0.704*** 0.047*** 0.722*** 0.155*** 0.701*** 0.049*** 0.721*** (0.015) (0.011) (0.016) (0.010) (0.015) (0.011) (0.016) (0.010)
R&D 4.809*** 1.172*** 2.509*** 0.563*** 4.761*** 1.048*** 2.468*** 0.544*** (0.247) (0.237) (0.154) (0.111) (0.248) (0.238) (0.154) (0.111)
Firm size 0.159*** 0.189*** 0.110*** 0.080*** 0.154*** 0.187*** 0.108*** 0.079*** (0.014) (0.009) (0.011) (0.006) (0.014) (0.009) (0.011) (0.006)
Leverage -0.862*** -0.569*** -0.490*** -0.411*** -0.837*** -0.561*** -0.479*** -0.409*** (0.123) (0.079) (0.098) (0.052) (0.123) (0.079) (0.098) (0.052)
ROA 1.323*** 1.786*** 0.134* 0.622*** 1.280*** 1.759*** 0.113 0.621*** (0.163) (0.134) (0.079) (0.052) (0.164) (0.134) (0.079) (0.052)
Cash holdings 1.895*** 0.115 0.993*** 0.035 1.889*** 0.074 0.987*** 0.028 (0.135) (0.109) (0.078) (0.051) (0.135) (0.109) (0.078) (0.051)
Tobin’s Q 0.059*** -0.003 0.053*** 0.014*** 0.058*** -0.004 0.053*** 0.013*** (0.011) (0.009) (0.006) (0.005) (0.011) (0.009) (0.006) (0.005)
Sales growth 0.116*** 0.039* 0.098*** -0.006 0.117*** 0.037* 0.098*** -0.007 (0.026) (0.021) (0.017) (0.011) (0.027) (0.021) (0.017) (0.011)
Capex 3.857*** 0.387 1.408*** 0.767*** 3.810*** 0.308 1.389*** 0.759*** (0.392) (0.298) (0.285) (0.172) (0.393) (0.299) (0.286) (0.172)
Number of observations 9,984 12,608 9,984 12,608

53
Table 9 The underlying mechanisms
This table examines possible underlying mechanisms through which the improvement in innovation output as shown in Table 7 takes place. In Panel A, the dependent variables are the logarithm of one plus R&D amount (columns (1), (2), (5), and (6)) and the logarithm of one plus innovative efficiency (columns (3), (4), (7), and (8)). The sample is a panel data tracking alliance clients (partners) in the firm-level sample and their industry- and size-matched control firms from three years prior to the alliance deal announcement (year t-3) to three years after the alliance deal announcement (year t+3). Columns (1), (3), (5), and (7) present estimates from the difference-in-differences regressions in Equation (5). Columns (2), (4), (6), and (8) present estimates from the difference-in-difference-in-differences regressions in Equation (6). In Panel B, the dependent variables are the logarithm of one plus the number of unrelated patents (columns (1), (2), (5), and (6)) and the logarithm of one plus the number of related patents (columns (3), (4), (7), and (8)). For a client (partner) or its matching firm, related patents are those patents applied in year t that cite patents of the partner (client); unrelated patents are those patents applied in year t that do not cite patents of the partner (client). The model specification follows Equations (5) and (6). In Panel C, the dependent variable is the logarithm of one plus the number of patents an inventor applied in the three-year period prior to (year t-3 to t-1) or the three-year period after (year t+1 to t+3) the alliance. The sample consists of inventors working either in the alliance sample firms or their industry- and size-matched control firms. For a particular sample firm or its matched control firm, stayers are inventors who apply at least one patent with the firm in the three-year period prior to and at least one patent with the same firm in the three-year period after the alliance and they do not have any patents outside the firm over these two periods. For a particular sample firm or its matched control firm, new hires are inventors who do not have any patent with the firm in the three-year period prior to but at least one patent with the firm in the three-year period after and they do not have any patents outside the firm over the post-alliance period. Firm characteristics are measured at the end of the three-year period before alliance formation and at the end of the three-year period after alliance formation. Definitions of the variables are provided in Appendix 1. Robust standard errors that allow for clustering at the deal level are reported in parentheses. *, **, and *** denote significance at the 10%, 5%, and 1% level, respectively.

54
Panel A: R&D expenditures and innovative efficiency Log (1 + R&D amount) Log (1 + Innovative efficiency) Log(1 + R&D amount) Log (1 + Innovative efficiency)
Clients and their industry- and size-matched control firms Partners and their industry- and size-matched control firms
(1) (2) (3) (4) (5) (6) (7) (8)
Sample × After × Tech competition -1.041*** -0.107*** -0.055 0.202** (0.13) (0.04) (0.15) (0.09)
Sample × After 0.036* 0.339*** 0.007 0.029** 0.075*** 0.088*** 0.011 -0.046* (0.02) (0.04) (0.01) (0.01) (0.02) (0.03) (0.01) (0.03)
Sample × Tech competition 0.918*** 0.047 0.021 0.308*** (0.17) (0.05) (0.19) (0.09)
After × Tech competition -0.083 0.092*** -0.025 0.018 (0.06) (0.02) (0.10) (0.04)
Sample 1.105*** 0.869*** 0.038*** 0.028 0.804*** 0.800*** 0.069*** 0.007 (0.04) (0.06) (0.01) (0.02) (0.03) (0.04) (0.02) (0.03)
After -0.055*** -0.045*** -0.020*** -0.038*** 0.009 0.011 -0.040*** -0.044*** (0.01) (0.01) (0.00) (0.01) (0.01) (0.01) (0.01) (0.01)
Technological competition 3.340*** 3.258*** 0.474*** 0.437*** 3.978*** 3.991*** 0.357*** 0.223*** (0.12) (0.12) (0.02) (0.02) (0.12) (0.14) (0.04) (0.04)
R&D amount -0.080*** -0.080*** -0.118*** -0.118*** (0.00) (0.00) (0.01) (0.01)
Firm size 0.574*** 0.570*** 0.051*** 0.050*** 0.435*** 0.435*** 0.071*** 0.071*** (0.02) (0.02) (0.01) (0.01) (0.01) (0.01) (0.01) (0.01)
Leverage -1.441*** -1.439*** 0.019 0.021 -0.417*** -0.417*** -0.002 0.000 (0.09) (0.09) (0.02) (0.02) (0.06) (0.06) (0.03) (0.03)
ROA -0.284*** -0.300*** 0.252*** 0.250*** -0.703*** -0.703*** 0.252*** 0.242*** (0.10) (0.10) (0.03) (0.03) (0.04) (0.04) (0.03) (0.03)
Cash holdings 0.241** 0.249** -0.100*** -0.100*** 0.670*** 0.670*** -0.144*** -0.143*** (0.11) (0.11) (0.02) (0.02) (0.05) (0.05) (0.03) (0.03)
Tobin’s Q 0.150*** 0.154*** 0.011*** 0.011*** 0.064*** 0.064*** 0.009*** 0.009*** (0.01) (0.01) (0.00) (0.00) (0.00) (0.00) (0.00) (0.00)
Sales growth -0.086*** -0.080*** 0.048*** 0.047*** -0.041*** -0.041*** 0.011 0.012 (0.01) (0.01) (0.01) (0.01) (0.01) (0.01) (0.01) (0.01)
Capex -1.615*** -1.662*** 0.408*** 0.420*** 0.313* 0.312* 0.603*** 0.584*** (0.32) (0.32) (0.07) (0.07) (0.18) (0.18) (0.09) (0.09)
Intercept -1.632*** -1.595*** -0.050 -0.035 -1.056*** -1.057*** 0.103** 0.124** (0.18) (0.18) (0.06) (0.06) (0.08) (0.08) (0.05) (0.05)
Deal fixed effects Yes Yes Yes Yes Yes Yes Yes Yes
Number of observations 64,456 64,456 32,892 32,892 77,682 77,682 24,252 24,252
Pseudo R-squared 0.75 0.75 0.34 0.35 0.65 0.65 0.38 0.39
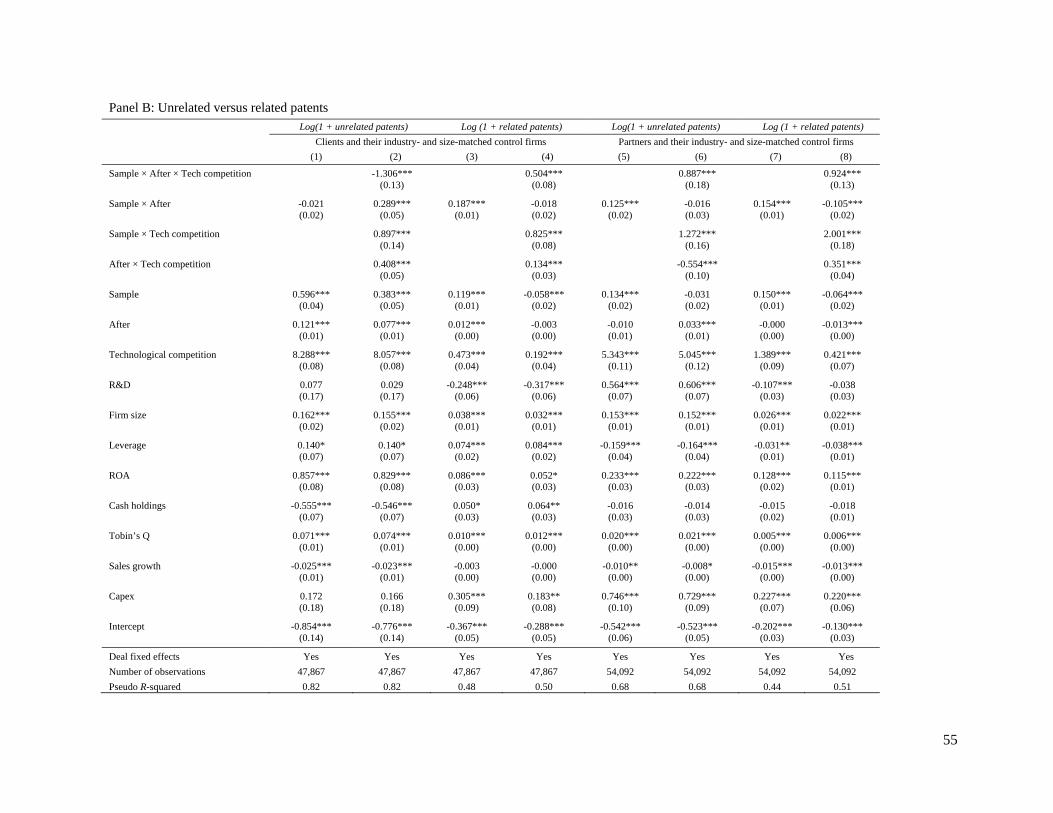
55
Panel B: Unrelated versus related patents Log(1 + unrelated patents) Log (1 + related patents) Log(1 + unrelated patents) Log (1 + related patents)
Clients and their industry- and size-matched control firms Partners and their industry- and size-matched control firms
(1) (2) (3) (4) (5) (6) (7) (8)
Sample × After × Tech competition -1.306*** 0.504*** 0.887*** 0.924*** (0.13) (0.08) (0.18) (0.13)
Sample × After -0.021 0.289*** 0.187*** -0.018 0.125*** -0.016 0.154*** -0.105*** (0.02) (0.05) (0.01) (0.02) (0.02) (0.03) (0.01) (0.02)
Sample × Tech competition 0.897*** 0.825*** 1.272*** 2.001*** (0.14) (0.08) (0.16) (0.18)
After × Tech competition 0.408*** 0.134*** -0.554*** 0.351*** (0.05) (0.03) (0.10) (0.04)
Sample 0.596*** 0.383*** 0.119*** -0.058*** 0.134*** -0.031 0.150*** -0.064*** (0.04) (0.05) (0.01) (0.02) (0.02) (0.02) (0.01) (0.02)
After 0.121*** 0.077*** 0.012*** -0.003 -0.010 0.033*** -0.000 -0.013*** (0.01) (0.01) (0.00) (0.00) (0.01) (0.01) (0.00) (0.00)
Technological competition 8.288*** 8.057*** 0.473*** 0.192*** 5.343*** 5.045*** 1.389*** 0.421*** (0.08) (0.08) (0.04) (0.04) (0.11) (0.12) (0.09) (0.07)
R&D 0.077 0.029 -0.248*** -0.317*** 0.564*** 0.606*** -0.107*** -0.038 (0.17) (0.17) (0.06) (0.06) (0.07) (0.07) (0.03) (0.03)
Firm size 0.162*** 0.155*** 0.038*** 0.032*** 0.153*** 0.152*** 0.026*** 0.022*** (0.02) (0.02) (0.01) (0.01) (0.01) (0.01) (0.01) (0.01)
Leverage 0.140* 0.140* 0.074*** 0.084*** -0.159*** -0.164*** -0.031** -0.038*** (0.07) (0.07) (0.02) (0.02) (0.04) (0.04) (0.01) (0.01)
ROA 0.857*** 0.829*** 0.086*** 0.052* 0.233*** 0.222*** 0.128*** 0.115*** (0.08) (0.08) (0.03) (0.03) (0.03) (0.03) (0.02) (0.01)
Cash holdings -0.555*** -0.546*** 0.050* 0.064** -0.016 -0.014 -0.015 -0.018 (0.07) (0.07) (0.03) (0.03) (0.03) (0.03) (0.02) (0.01)
Tobin’s Q 0.071*** 0.074*** 0.010*** 0.012*** 0.020*** 0.021*** 0.005*** 0.006*** (0.01) (0.01) (0.00) (0.00) (0.00) (0.00) (0.00) (0.00)
Sales growth -0.025*** -0.023*** -0.003 -0.000 -0.010** -0.008* -0.015*** -0.013*** (0.01) (0.01) (0.00) (0.00) (0.00) (0.00) (0.00) (0.00)
Capex 0.172 0.166 0.305*** 0.183** 0.746*** 0.729*** 0.227*** 0.220*** (0.18) (0.18) (0.09) (0.08) (0.10) (0.09) (0.07) (0.06)
Intercept -0.854*** -0.776*** -0.367*** -0.288*** -0.542*** -0.523*** -0.202*** -0.130*** (0.14) (0.14) (0.05) (0.05) (0.06) (0.05) (0.03) (0.03)
Deal fixed effects Yes Yes Yes Yes Yes Yes Yes Yes
Number of observations 47,867 47,867 47,867 47,867 54,092 54,092 54,092 54,092
Pseudo R-squared 0.82 0.82 0.48 0.50 0.68 0.68 0.44 0.51

56
Panel C: Stayers and new hires
Log (1 + # of patents)
Clients and their industry- and size-
matched control firms Partners and their industry- and size-
matched control firms
(1) (2) (3) (4)
Sample × After × Tech competition -0.006 0.274*** (0.05) (0.09)
Sample × After 0.072*** 0.072*** 0.078*** -0.015 (0.01) (0.02) (0.01) (0.03)
Sample × Tech competition -0.023 -0.113 (0.05) (0.08)
After × Tech competition -0.086*** -0.158*** (0.02) (0.03)
Sample 0.054*** 0.065*** 0.054*** 0.093** (0.01) (0.03) (0.02) (0.04)
After -0.058*** -0.021*** -0.049*** 0.002 (0.01) (0.01) (0.01) (0.01)
Technological competition 0.097*** 0.147*** 0.095 0.155** (0.02) (0.02) (0.07) (0.06)
R&D 0.262*** 0.262*** 0.308*** 0.328*** (0.09) (0.09) (0.11) (0.12)
Firm size 0.047*** 0.050*** 0.046*** 0.046*** (0.01) (0.01) (0.01) (0.01)
Leverage 0.077*** 0.076*** 0.043 0.040 (0.03) (0.03) (0.04) (0.04)
ROA 0.065* 0.056* -0.083 -0.064 (0.03) (0.03) (0.06) (0.06)
Cash holdings -0.120*** -0.119*** -0.031 -0.036 (0.03) (0.03) (0.04) (0.04)
Tobin’s Q 0.011*** 0.012*** 0.017*** 0.016*** (0.00) (0.00) (0.00) (0.00)
Sales growth -0.056*** -0.054*** -0.020*** -0.017*** (0.01) (0.01) (0.01) (0.01)
Capex 0.608*** 0.599*** 0.654*** 0.603*** (0.07) (0.07) (0.13) (0.13)
Intercept 0.844*** 0.796*** 0.905*** 0.887*** (0.06) (0.06) (0.08) (0.09)
Deal fixed effects Yes Yes Yes Yes
Number of observations 936,178 936,178 196,452 196,452
Pseudo R-squared 0.04 0.04 0.05 0.05

57
Table 10 Forming JVs and their effects on innovation output
This table reports coefficient estimates from Tobit models in Equation (2) and the ex-post treatment effect of joint ventures on subsequent innovation output of clients and partners using a difference-in-differences approach. In Panel A, the dependent variable is the logarithm of one plus the number of JV deals announced in year t. The panel data sample includes non-financial innovative firms covered by Compustat/CRSP over the period 1989 to 2003 with available information on basic financials. In column (1), JV deals involving public firm subsidiaries are included, whereas such deals are excluded in column (2). In Panel B, the dependent variable is a firm’s innovation output as measured by the logarithm of one plus patent count. The sample is a panel data tracking the JV clients (partners) in the firm-level sample and their industry- and size-matched control firms from three years prior to the JV deal announcement (year t-3) to three years after the JV deal announcement (year t+3). Columns (1) and (3) present estimates from the difference-in-differences regressions in Equation (5). Columns (2) and (4) present estimates from the difference-in-difference-in-differences regressions in Equation (6). Definitions of the variables are provided in Appendix 1. Robust standard errors that allow for clustering at the deal level are reported in parentheses. *, **, and *** denote significance at the 10%, 5%, and 1% level, respectively. Panel A: Tobit regressions
Log of (1 + # of JVs),
including subsidiary deals Log of (1 + # of JVs),
public firms only
(1) (2)
Technological competition 0.030 0.172 (0.201) (0.199)
Patent count 0.112*** 0.114***
(0.018) (0.018)
R&D -0.107 -0.057
(0.235) (0.240)
Firm size 0.380*** 0.327***
(0.016) (0.015)
Leverage -0.310*** -0.259***
(0.096) (0.099)
ROA -0.806*** -0.617***
(0.102) (0.104)
Cash holdings -0.483*** -0.340***
(0.102) (0.107)
Tobin’s Q 0.053*** 0.055***
(0.009) (0.010)
Sales growth 0.055*** 0.055***
(0.017) (0.018)
Capex 1.000*** 1.431***
(0.327) (0.318)
Intercept -3.666*** -3.597***
(0.362) (0.315)
Industry fixed effects Yes Yes
Year fixed effects Yes Yes
Number of observations 34,008 34,008
Pseudo R-squared 0.23 0.20

58
Panel B: Difference-in-difference regressions
Log (1 + patent count)
JV clients and their industry- and size-
matched control firms JV partners and their industry- and
size-matched control firms
(1) (2) (3) (4)
Sample × After × Tech competition 0.049 0.308 (0.36) (0.41)
Sample × After 0.101* 0.073 0.071 0.045 (0.05) (0.07) (0.05) (0.06)
Sample × Tech competition 0.192 1.100** (0.37) (0.44)
After × Tech competition 0.230 -0.399* (0.17) (0.23)
Sample 0.299*** 0.281*** 0.403*** 0.264*** (0.08) (0.09) (0.07) (0.08)
After 0.084*** 0.065*** 0.040* 0.069*** (0.02) (0.02) (0.02) (0.02)
Technological competition 9.282*** 9.139*** 8.211*** 8.029*** (0.27) (0.27) (0.33) (0.35)
R&D 2.155*** 2.094*** 0.523 0.446 (0.67) (0.70) (0.33) (0.33)
Firm size 0.134** 0.131** 0.143*** 0.143*** (0.06) (0.06) (0.04) (0.04)
Leverage -0.011 -0.013 -0.170 -0.169 (0.19) (0.19) (0.12) (0.12)
ROA 1.509*** 1.493*** 0.628*** 0.590*** (0.31) (0.31) (0.15) (0.15)
Cash holdings -0.703*** -0.711*** -0.338** -0.354*** (0.22) (0.22) (0.13) (0.13)
Tobin’s Q 0.122*** 0.122*** 0.049*** 0.051*** (0.03) (0.03) (0.01) (0.01)
Sales growth -0.079** -0.078** -0.067*** -0.064*** (0.03) (0.03) (0.02) (0.02)
Capex -0.874* -0.851* -0.431 -0.458* (0.45) (0.45) (0.27) (0.28)
Intercept -0.569 -0.534 -0.294 -0.277 (0.42) (0.43) (0.24) (0.24)
Deal fixed effects Yes Yes Yes Yes
Number of observations 8,255 8,255 9,880 9,880
Pseudo R-squared 0.80 0.80 0.75 0.76