Techniques in Cell Necrobiology
68
Cell Necrobiology Living, Dead, or Both?
Transcript of Techniques in Cell Necrobiology

Cell Necrobiology
Living, Dead, or Both?

Table of Contents
• Background – Summary of apoptosis and necrosis
• Methods for detection of apoptosis – Plasma membrane associated assays
– Intracellular cascade
– DNA damage associated assays
• Summary/ Take home messages

What is Cell Necrobiology and why are we interested in it?
• The biological changes which predispose, precede, and accompany cell death, as well as the consequences and tissue response to cell death
• Apoptosis vs Accidental cell death (Necrosis) • Apoptosis is an active and regulated mode of cell death. • The regulation consists of several checkpoints at which a
plethora of interacting molecules either promote or prevent apoptosis.
• This presents an opportunity to interact with the regulatory machinery and thereby modulate/measure the cells propensity to respond to the signals of death.
Zbigniew Darzynkiewcz

Who is interested in Cell Necrobiology?
• Molecular biology
• Oncology
• Immunology
• Embryology
• Endocrinology
• Hematology
• Neurology
• Fertility clinics

Why is flow cytometry a leading methodology for studying necrobiology?
• Multiparametric analysis:
– The most attractive feature of flow cytometry is that it provides the possibility to measure several cellular attributes simultaneously in a large number of individual cells.
– With direct correlations between these attributes measured within
the same cell.
• Measurement of cell subsets =Heterogeneity
• Fast
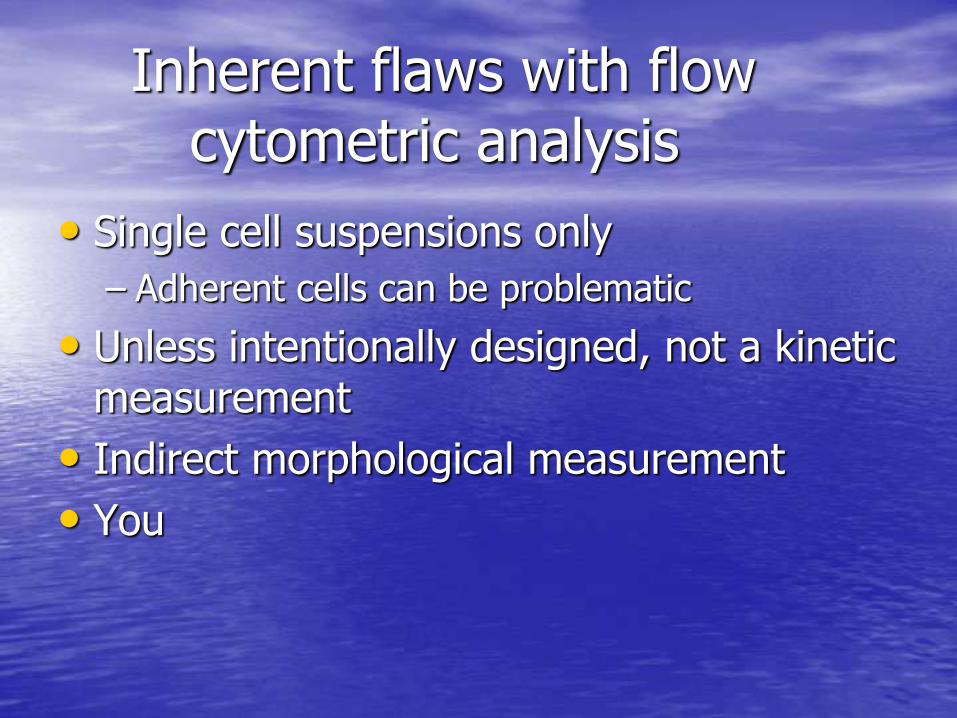
Inherent flaws with flow cytometric analysis
• Single cell suspensions only
– Adherent cells can be problematic
• Unless intentionally designed, not a kinetic measurement
• Indirect morphological measurement
• You

Apoptosis
• Programmed cell death
• Cell itself designs and executes the program of its own demise and subsequent body disposal.
• Regulation of this process involves the presence of at least two distinct checkpoints controlled by
1. bcl-/bax family of proteins
2. Cysteine and serine proteases
Darzynkiewicz et al

Timeline of apoptotic death
Addition of
apoptotic
stimulus Dead
Point of no
return???
Chromatin
condensation
Nuclear envelope
disintegrates Apoptotic
bodies
Loss of plasma
membrane integrity
Rate of apoptosis •Extremely variable •When is the proper time to probe for apoptosis? •Choice of particular assay

Why does apoptosis occur?
• Cells lost regulation of growth
• DNA damage through radiation, drug action etc.
• Self reactive T cells
• Inappropriately stimulated cells.
• Virus infected cells recognized by T- cells.
• Contraction phase after infection.
• Embryonic development
• Death of end differentiated cells
• Not to mention all the ways you engineer cells to die in order to study a gene or protein of interest

Necrosis
• Generally represents a cells response to gross injury and induced by an overdose of cytotoxic agents.
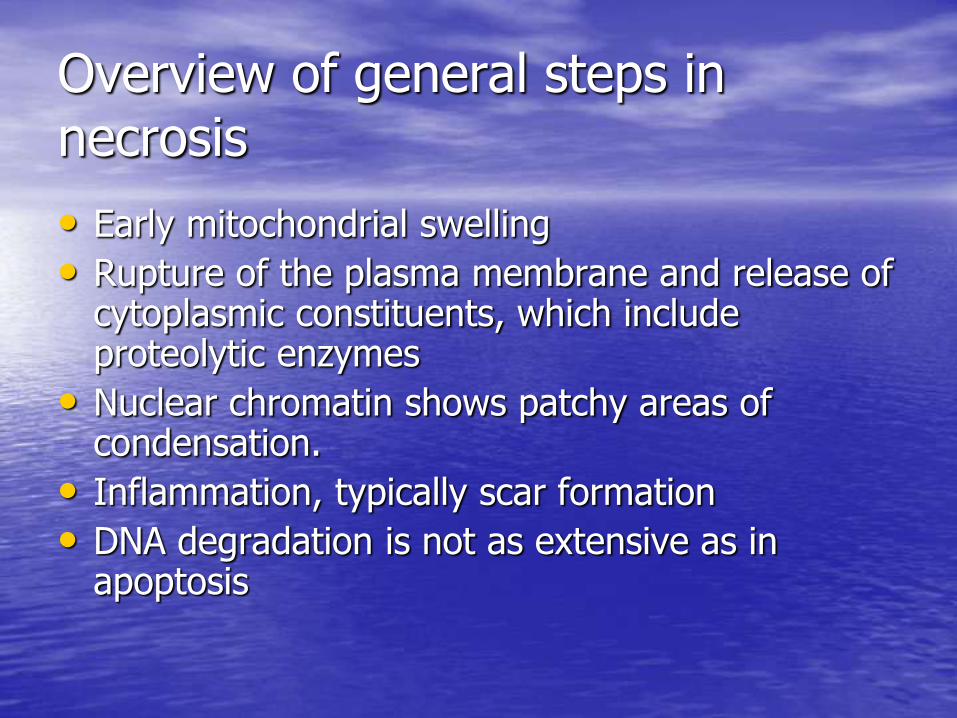
Overview of general steps in necrosis
• Early mitochondrial swelling
• Rupture of the plasma membrane and release of cytoplasmic constituents, which include proteolytic enzymes
• Nuclear chromatin shows patchy areas of condensation.
• Inflammation, typically scar formation
• DNA degradation is not as extensive as in apoptosis

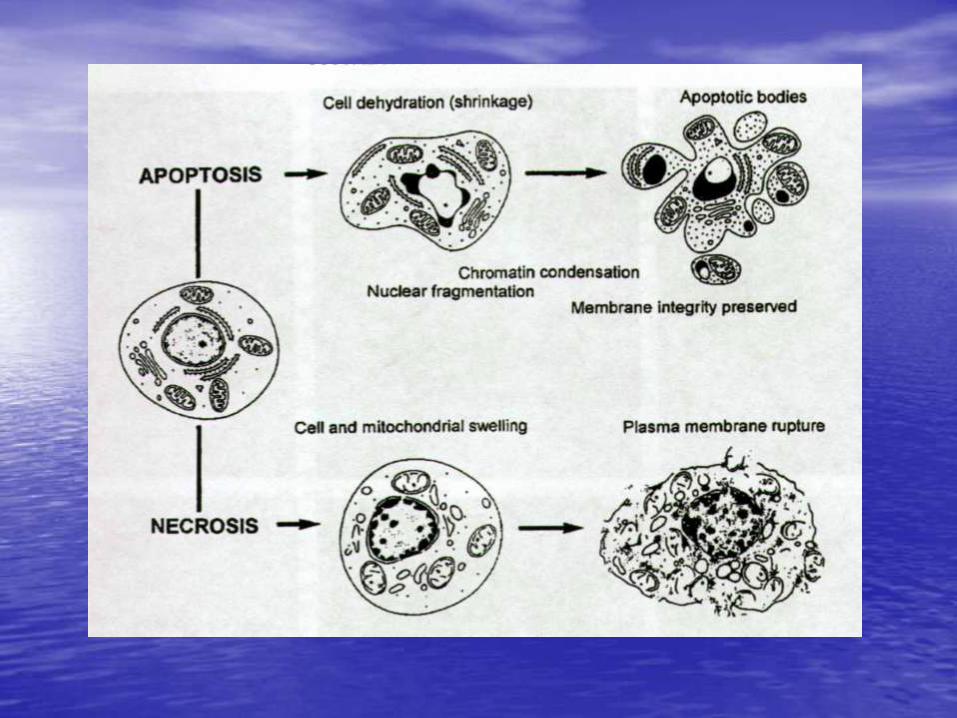
Apoptosis vs Necrosis
Necrosis •Cell and nuclear swelling •Patchy chromatin condensation •Swelling of mitochondria •Vacuolization in cytoplasm •Plasma membrane rupture •Dissolution of nuclear chromatin •Attraction of inflammatory cells
Apoptosis •Reduced cell size, convoluted shape •Plasma membrane undulations (blebbing/budding) •Chromatin condensation •Loss of the structural features of the nucleus •Nuclear fragmentation •Presence of apoptotic bodies •Dilation of the endoplasmic reticulum •Relatively unchanged cell organelles •Shedding of apoptotic bodies •Phagocytosis of the cell remnants •Cell detachment from tissue culture flasks

Published methods for apoptosis analysis • Apoptotic cells activate a cascade of molecular events which lead to its total
destruction. Many of these pathways are unique to apoptosis, making them good targets, some however, are not so unique.
– Cell morphology, light scatter characteristics – Rapid uptake of Hoechst 33342 – Annexin V – TUNEL – Caspase detection – Mitochondrial membrane potential – Changes in reactive oxygen species – Sub G1 – F-actin reduction – MC540 – Fluorescein diacetate – Increased influx of EB – Surface antigen staining – NA dyes stain dimmer, LDS-751, PY B some SYTO dyes – SNARF-1 – Increased autoflourescence when excited with UV laser – AO-Sensitivity of DNA to denaturation – Lysosomal proton pump activity – DNA vs total protein content – Cytochrome C Release
– And many many more!!!!
How to we pick a particular assay?
• Usually hallmark or key step in apoptotic process
• Simple to measure
• If cells need to be alive
• Other aspects of experiment only allow certain assays – Retention of GFP
• Information desired – Cell cycle specificity
– Specific caspase of interest

Table of Contents
• Background – Description of Cell Necrobiology
– Review of apoptosis
• Methods for detection of apoptosis – Plasma membrane associated assay
– Intracellular cascade and mitochondrial related proteins
– DNA damage associated assays
• Pitfalls

Light scatter properties of dying cells
• Know your cells. Valuable information can be obtained just from a FSC vs SSC plot
• FSC=Very complex measurement. Mostly attributed to size but also refractive index of cell.
• SSC= granularity, or the presence of intracellular structures that can deflect light.
• Please be aware that light scatter changes are not specific to apoptosis. Broken cells, isolate cell nuclei, and necrotic cells also have diminished ability to scatter light.

Light scatter plots
Healthy
FSC
SSC
DEAD
James Marvin unpublished data

Labeling dead cells
• Extremely helpful in distinguishing dead from apoptotic cells. • Intact membrane of live cells excludes charged cationic dyes like
trypan blue, PI, EB and 7-AAD, short incubation with these dyes results in selective labeling of dead cells, while live cells show minimal dye uptake.
• Confounding factors contributed by dead cells
– High autofluorescence
– Nonspecific binding of antibodies
– Many necrotic cells may express similar traits of apoptotic cells so they will artificially increase apoptotic index
Nucleic acid binding dyes excluded by intact cells and enters dead cells • Ethidium bromide,Ex/Em= 518/605
– Single pos charge – Will enter live cells slowly, especially with high pH – Also binds RNA
• Propidium iodide PI, Ex/Em 535/617 – 2 pos charges – PI binding is reversible so it must be maintained in the extracellular medium during
analysis – Also binds RNA
• Ethidium homodimer-1, Ex/Em 528/617;ethidium homodimer-2, Ex/Em=535/624 – 4 pos charges – Higher binding affinity than PI= lower [conc] used – Affinity of EthD-2 for DNA is so high that it is suitable for staining dead cells within
a population which is to be washed and then fixed – Also binds RNA
• DAPI, Ex/Em=350 or 405/475 – Doesn’t bind RNA – UV excited

Nucleic dyes cont’d •Ethidium monoazide (EMA), Ex/Em=510/600
-One pos charge
-After entering cells with damaged membranes and binding to nucleic acid, it can be covalently bound to nucleic acids by illumination of the cells with visible light. This allows these cells to be stained with additional antibodies and fixed, then at a later time determine which cells were dead before staining with antibodies.
•7-AAD, Ex/Em=546/647 -Uncharged at neutral pH
-Notice longer emmision wavelength
•Sytox Green, Ex/Em=504/523 -3 pos charge
-Possibly much better than PI for live dead discrimination in bacteria
•Yo-Pro-1, Ex/Em=491/509; ToPro-3, Ex/Em=642/6614 -2 of 11 of To-Pro series whose absorption and emission spectra span the visible to near-IR
spectrum -2 pos charges
•Sytox Red Ex/Em=633/660
•Invitrogen Live/Dead Fixable stains (Red/Green…..)

Plasma Membrane integrity/structure
• Assays based on the fact that the permeability and structure of the plasma membrane of apoptotic cells progressively deteriorates
– The degree of permeability of the plasma membrane to either charged or uncharged fluorochromes varies with the stage of apoptosis, cell type, and method to induce apoptosis (eg, DNA damage vs. engagement of Fas receptor).
– Phosphatidylserine flipped to outside of membrane detected with Annexin V
Nucleic acid dyes for detection of apoptosis in live cells
• Probes permeability of cell membrane
• Rapid uptake of Hoechst 33342 after short exposure but exclusion of PI
• SYTO-16
• LDS-751
• YoPro-1
• PoPro

Cancer Research UK
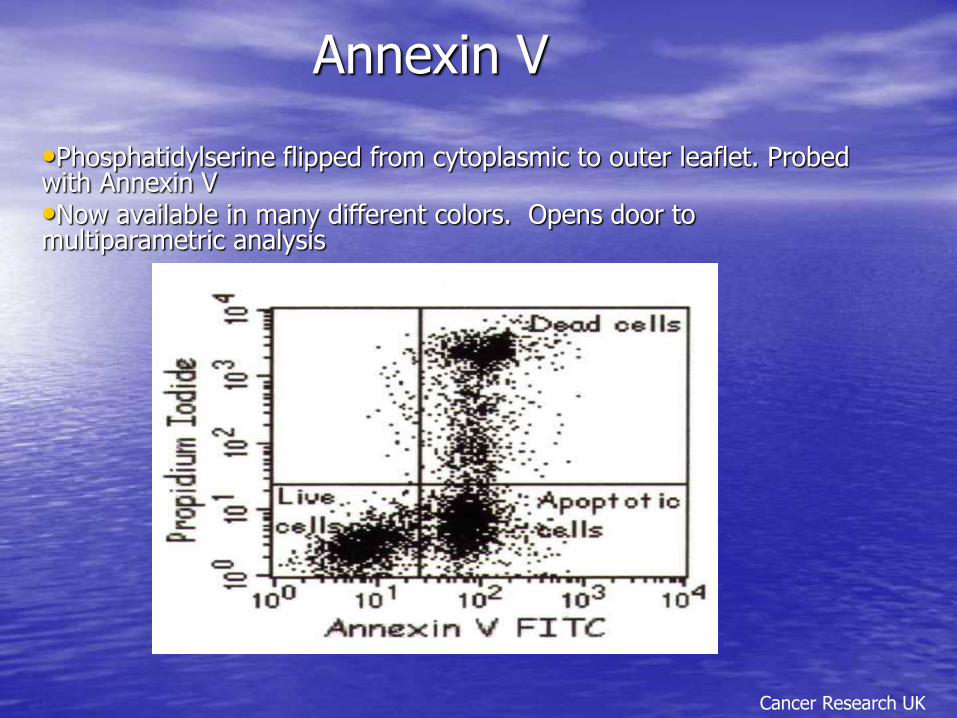
Annexin V
Cancer Research UK
•Phosphatidylserine flipped from cytoplasmic to outer leaflet. Probed with Annexin V •Now available in many different colors. Opens door to multiparametric analysis

Blebs with membrane integrity assays
• Cell preparation can effect permeability and asymmetry of plasma membrane
• The assumption that live cells are not leaky, apoptotic cells are somewhat leaky and that dead cells are very leaky to dyes like PI and 7 AAD is not universal.
• Time, Temp, and [conc] can alter results
• Lack of specificity of these assays
• Some cells (I.e. megakaryocytes, platelets, some myeloid lineage cells) can have large amounts of PS on there surface.
Probing mitochondria and the intracellular apoptotic cascade
• Decreased mitochondrial transmembrane potential
• ROS detection
• Caspase detection
• Detection of specific PARP cleavage products

Mitochondrial role in apoptosis
Smac/DIABLO
HtrA/Omi
IAPs
Cytochrome c
Inactive
Caspase 9 +
Cytochrome C
+ APAF-1
Caspase 3 activation
Execution phase of apoptosis
AIF
Endonuclease G
Induction of
chromatin
condensation,
DNA fragmentation
Apoptosome
dATP
<-150mv
Gulbins et al
See ref #3

• Choice of dye
– Determined primarily by the excitation wavelengths available and the emission wavelengths desired.
– Some dyes may have better specificity for mitochondria
• Cyanine dyes DiYCn (2m+1)(see below for examples) (Sims et al)
• Y= isopropyl member of the ring structure, usually O,S,I
• N=length of alkyl side chains
• M= number of methyl groups
• All these probes gives the advantages of both high sensitivity to small changes in membrane potential and rapid response
– Dyes affected by pH and self-quenching so quantitative measurements difficult, not impossible
Mitochondrial membrane potential
Rhodamine 123 488nm 530nm
MTR 488nm or 633nm 670nm
MTDeep Red 633nm 740nm
DiOC5(6) 488nm 530nm
DiIC(5) 633nm 670nm
JC-1 488nm Mono=530nm/
aggrs=>570nm
TMRE 488nm-530nm 580nm
Excitation Emission
Y Y
CH2(CHCH)m
N N (CH2)nCH3 CH3(CH2)n


Mitochondrial Membrane potential
8-(4’-chloromethyl) phenyl-2,3,5,6,11,12,14,15-octahydro-1H,,4H,10H,13H-diquinolozino-8H-xanthylium chloride (CMXRos, MTR)
Poot et al
Live
Apoptotic
Dead
MitoTracker Red
DAPI
Live
Apoptotic MitoTra
cker
Red
MitoTracker Green
Unpublished data

Better yet!!!
SSC
DA
PI
Annexin V
Live
Apoptotic
Unpublished data
1. Light scatter 2. Live/Dead discriminator-DAPI 3. Membrane structure-Annexin V 4. Mitochondrial membrane potential- MitoTracker Red
1
2
3
4

“Potential” problems
• Mitochondrial membrane potential is sensitive to minor changes in cell environment – Samples to be compared should be treated and
measured under identical conditions. • Time, temp, pH,
• Must use correct concentration of dye • Mitochondrial probes lack absolute specificity
and may accumulate in cytosol – Specificity increases with lower concentrations
• Dissipation of membrane potential may not follow expected time-frame

ROS role in apoptosis
• Diverse roles
– Still lots of questions.
• 1. Chandra, J., A. Samali, and S. Orrenius, Triggering and modulation of
apoptosis by oxidative stress. Free Radical Biology and Medicine, 2000. 29: p. 323-333.
• 2. Churg, A., Interactions of Exogenougs or Evoked Agents and Particles: The Role of Reactive Oxygen Species. Free Radical Biology and Medicine, 2003. 34(10): p. 1230-1235.
• 3. Halliwell, B., Mechanisms involoved in the generation of free radicals. Pathologie Biologie, 1996. 44(1): p. 6-13.
• 4. Mikkelsen, R. and P. Wardman, Biological chemistry of reactive oxygen and nitrogen and radiation-induced signal trasduction mechanisms. Oncogene, 2003. 22: p. 5734-5754.
Petit et al

How do ROS cause damage?
O O
Oxygen
O2
O O
Superoxide
anion
O2-
O H
Hydroxyl
Radical
OH
O H
Hydroxyl ion
OH-
O O
H
H
Hydrogen
Peroxide
H2O2
O Cl
Hypochlorite ion
OCl-
C C C
H
H
O H
H20
C C C
H
H
H
Carbon centered Radical
Now what is most likely to happen is a molecule of oxygen will react with this carbon centered molecule.
This will form a peroxyl radical which might then steal a hydrogen atom from a nearby side chain making it
now a radical. This process repeats until two radicals meet each other and each contributes its unpaired
electron to form a covalent bond linking the two
This might be a fatty acid side chain of
any number of cellular membranes

Common ROS detecting fluorochromes
• Dichlorofluorescin diacetate(DCFH-DA)H2O2 • Dihydrorhodamine 123- H2O2 • Hydroethidine-superoxide anion (O2-), NADPH oxidase activity

O-C-CH3 CH3-C-O
O O
H C-OH
O
Cl
O
OH
H C-OH
O
Cl
O HO
DCFH-DA
Intracellular esterases
O
H C-O
O
Cl
O O
H2O2
DCF
DCFH2
HE
N H
Ch2CH3
N H
Ch2CH3
O O
Superoxide
Cl
Cl
Cl

ROS detection with DCFH-DA
Curtin et al

Caspase-8 Bid
Caspase-9
Cyt c
APAF-1
Caspase 3
6
8
2
10
Caspase 7
Proteolysis of substrates
Initiation
Commitment
Amplification
Demolition
Death Receptors Constituents of cytotoxic T and NK cell granules
General cellular insults
EA Slee et al
DED

Methods of caspase detection • Immunocytochemical detection of the epitope of these enzymes that is
characteristic of their active form. – Cleavage of nonfluorescent substrates leading to fluorescent compounds
– Caspase specific monoclonals
– Use of Florochrome Labeled Inhibitors of Caspases (FLICA)
– PhiPhiLux (OncoImmunin, Inc
VAD
DVAD
DEVD
VEID
YVAD
LETD
LEHD
AEVD
Caspase detected
1,3,4,5,7,8,9
2
3
6
1
8
9
10
Residue sequence

Earnshaw et al
FLICA binding to caspases

Stathmo-apoptosis
• Cumulative apoptotic index (CAI)
• Add FAM-VAD-FMK into culture at the same time inducer of apoptosis is applied.
• Shows frequency of cells that become committed to and entered apoptosis during the time interval between administration of FAM-VAD-FMK and termination of the culture
Smolewski et al

Stathmo Control
Smolewski et al
Bottom Row FAM-VAD-FMK added at beginning of assay
Propidium Iodide
FAM
-VAD
-FM
K
3hr 6hr
Top Row FAM-VAD-FMK added for last hour of assay
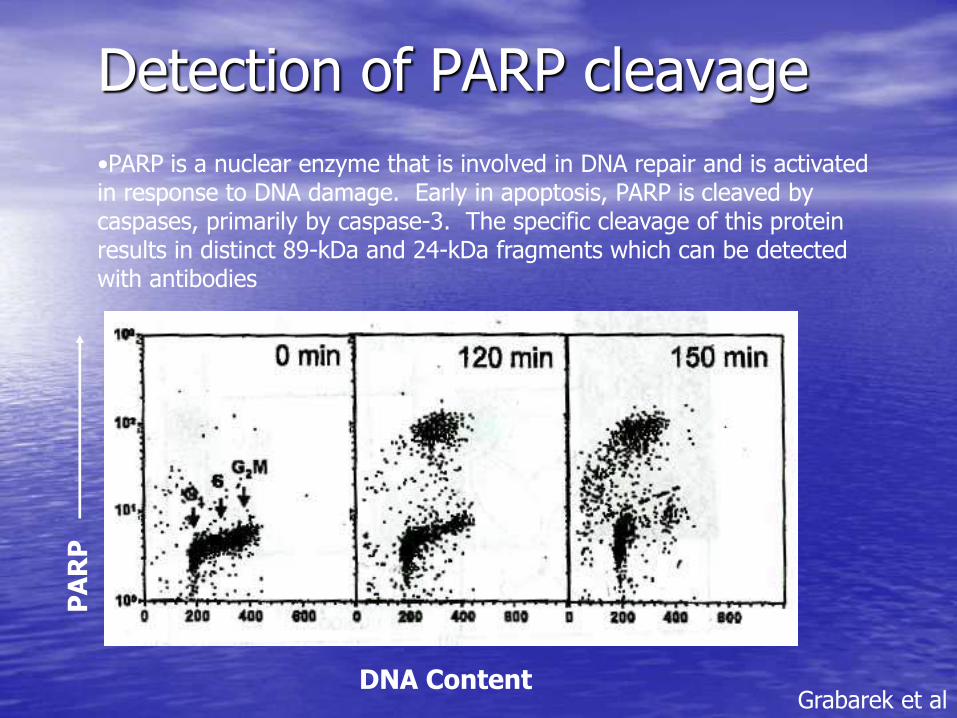
Detection of PARP cleavage
•PARP is a nuclear enzyme that is involved in DNA repair and is activated in response to DNA damage. Early in apoptosis, PARP is cleaved by caspases, primarily by caspase-3. The specific cleavage of this protein results in distinct 89-kDa and 24-kDa fragments which can be detected with antibodies
Grabarek et al DNA Content
PA
RP

Measurement of cellular DNA damage
• Extensive DNA cleavage is a characteristic feature of apoptosis.
– Sub G1
• Extraction of low MW DNA prior to cell staining
– Tunel
• Fluorochrome labeling of DNA strand breaks in situ
Sub G1
• Extensive DNA cleavage is a characteristic of apoptosis
• Cellular DNA content is measured following fixation with precipitating fixatives like alcohols
• Cell fixation does not preserve the degraded DNA – This fraction of DNA leaks out during rinsing and
staining steps
• The result is a population of cells that has reduced DNA “stainability”.

http://www.accessexcellence.org/AB/GG/nucleosome.html

Sub G1 Apoptotic cells
Wash Wash
Fixed Nonapoptotic cells Fixed Apoptotic cell
Stain Stain
DNA Content
Go/G1
S G2/M
Sub G1
Sub G1 population comprises a population of WHOLE intact cells with decreased amount of DNA, not fragments of apoptotoic cells

Sub G1
B histogram- cells were extracted with Hanks balances salt solution C histogram- cells were extracted with .2M phosphate-citrate buffer at pH 7.8
Darzynkiewicz et al

Gated Ungated
Isolated chromosomes from mitotic cells Micronuclei Cellular Debris

Sub G1
• Pitfalls – Misclassification of nuclear fragments and individual
apoptotic bodies as single apoptotic cells
– Necrotic cells often do not show decreased stainability of DNA
– Fractional DNA content (SubG1) does not correspond to the apoptotic index.
• Limitations – Low specificity in the detection of apoptosis.
• Critical points of Sub G1 – Don’t lyse unfixed cells using detergents or hypotonic
solutions
– Don’t use log scale
– Don’t collect stats on all “cells” below the G1 peak.

In Situ labeling of DNA strand breaks
(TUNEL)
A
G
T
C
G
T
A
C
C G
T
A
A
A
T
C
G
T
A
A
C A
T
A TdT + dUTP
•This method seems to be the most specific in terms of positive ID of apoptotic cells
•Negative results may not mean the absence of DNA strand breaks but may be a result of some methodological problems such as the loss of TdT activity, degradation of triphosphonucleotides,etc.
•Identifies DNA damage at an earlier stage than “sub-Go/G1” techniques
A
G
T
C
G
T
A
C
C G
T
A UUUUUUUU
UUUUUUUU
UUUUUUUU
UUUUUUUU
UUUUUUUU
UUUUUUUU
UUUUUUUU
UUUUUUUU
Fluorochrome conjugated Avidin, Anti-digoxygenin antiBrdu
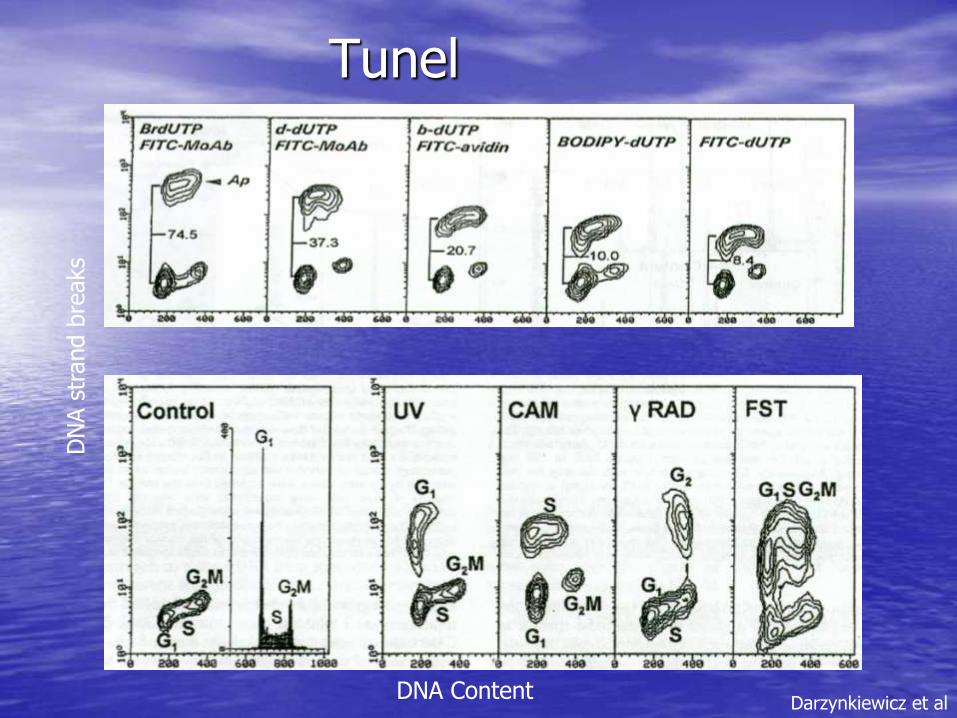
Tunel
DNA Content
DN
A s
trand b
reaks
Darzynkiewicz et al

Table of Contents
• Background – Description of cell necrobiology
– Review of apoptosis
• Methods for detection of apoptosis – Plasma membrane associated assay
– Intracellular cascade and mitochondrial related proteins
– DNA damage associated assays
• Closing remarks

Type II programmed cell death
• AO-acid vesicles
• F-actin- cytoskeleton
F-actin
SSC
AO Ratio Red/Green

Picking the right detection assay
• Depends on: – Cell system
– Nature of the inducer
– Interest in specific mode of cell death
– Particular information that is being sought (eg.specificity of apoptosis with respect to cell cycle phase or DNA ploidy)
– Technical restrictions
• Instrumentation (excitation source)
• Transportation of samples
• Sample storage (fixation)
• Other info desired
• Cost
Labeling of dead cells in fixed samples
• EMA- labels dead and late apoptotic cells. This dye can be photochemically crosslinked to DNA by exposure to visible light. This covalently links dye to DNA.
• Label with EMA, then fix cells. Then you can determine which cells were already dead at time of fixation
• Absorb 488nm, emit 600nm

Know your drugs, stimulus, cells
• Are drugs inducing apoptosis in particular phase of cell cycle (DNA topoisomerase I inhibitor Camptothecin affects S phase)?
• What is effect of adding too much drug?
• Are drugs causing specific damage on some part of cell?
• Is the stimulus fast acting?
• Is there increased autoflourescence with your drug or is your drug fluorescent itself?

Controls
• Positive controls
– Pos control cells can be prepared in large quantity and stored in aliquots.
• Neg controls

PITFALLS
• Assumption that percentage of apoptotic cells represents the rate of cells dying by apoptosis
• Assumption that apoptotic cells must exhibit all typical features of apoptosis
• Incorrect identification of late apoptotic cells as necrotic cells.
• Selective loss of apoptotic cells during sample preparation – Engulfment of apoptotic cells by other cells – Density gradient, not saving suspended cells, spinning, vortexing
• Use of new untested commercial kits • Use of flow cytometry without morphological examination
of the sample • AI may not be correlated with incidence of cell death
– Most of time not kinetic measurement

Pitfalls continued
• Some drugs which cause apoptosis may additionally confuse the pattern of cell death due to the drug-induced secondary effects on the cell.
• False positives
• Abundance of extractable fragmented DNA is not a quantitative measure of apoptosis
• Estimating frequency of apoptosis (AI) by analysis of DNA fragmentation
• False positive recognition of apoptosis may occur when internucleosomal degradation accompanies necrosis.

Take home messages
• The most specific assays appear to be based on the detection of DNA strand breaks.
• For best results, time points and multiparameter flow.
– Plasma membrane integrity( exclusion of charged fluorchromes or hydrolysis of FDA PLUS
– Membrane permeability, mitochondrial transmembrane potential, or DNA cleavage offer a more certain means of identification of the mode of cell death than each of these methods alone
• Regardless of particular method, apoptosis should be confirmed by light or electron microscopy.

Useful websites
• Molecular Probes • http://www.probes.com/ • Cell Signaling Technology • http://www.cellsignal.com/index.asp?cookie%5Ftest=1 • Chemicon • www.chemicon.com • Serotec • www.serotec.com • Alexis Biochemicals • www.alexis-e.biz • Oncogene • www.apoptosis.com • Amersham Biosciences • www.amershambiosceinces.cie

References • Bedner, E., et al., Activation of caspases measured in situ by binding of fluorochrome
labeled inhibitors of caspases (FLICA): Corrrelation with DNA fragmentation. Experimental Cell Research, 2000. 259: p. 308-313.
• 2. Belloc, F., et al., A flow cytometric Method using H 33342 and PI for simultaneous cell cycle analysis and apoptosis determination in unfixed cells. Cytometry, 1994. 17: p. 59-65.
• 3. Bernardi, P., et al., Mitochondira and cell death: Mechanistic aspects and methodological issues. Eurpean J. of Biochemistry, 1999. 264: p. 687-701.
• 4. Buckman, J. and I. Reynolds, Spontaneous changes in mitochondrial membrane potential in cultrued neurons. The Journal of Neuroscience, 2001. 21(14): p. 5054-5065.
• 5. Carter, W., P. Narayanan, and J.P. Robinson, Intracellular hydrogen peroxide and superoxide anion detection in endothelial cells. Journal of Leukocyte Biology, 1994. 55: p. 253-258.
• 6. Chen, L. and S. Smiley, Probing mitochondrial membrane potential in living cells by a J-aggregate forming dye. Ch 9: p. 125-131.
• 7. Chiu, L., et al., Flow Cytometric ratio analysis of the Hoechst 33342 emission spectrum: multiparametric characterization of apoptotic lymphocytes. Journal of Immunological Methods, 1996. 189: p. 157-171.
• 8. Choucroun, p., et al., Comet assay and early apoptosis. Mutation Research, 2001. 478: p. 89-96.
• 9. Churg, A., Interactions of Exogenougs or Evoked Agents and Particles: The Role of Reactive Oxygen Species. Free Radical Biology and Medicine, 2003. 34(10): p. 1230-1235.
• 10. Cohen, G., et al., Identification of a transitional preapoptotic population of thymocytes. Journal of Immunolgy, 1993. 151: p. 566-574.
• 11. Darzynkiewicz, Z., et al., Cytometry in Cell Necrobiology: Analysis of Apoptosis and Accidental Cell Death (Necrosis). Cytometry, 1997. 27: p. 1-20.
• 12. Darzynkiewicz, Z., E. Bedner, and F. Traganos, Difficulties and pitfalls in analysis of apoptosis. Methods in Cell Biology, 2001. 63: p. 527-545.

• Earnshaw, W., L. Martins, and S. Kaufmann, Mammalian caspases: Structure, activation, substrated, and functions during apoptosis. Annual Rev. Biochem., 1999. 68: p. 383-424.
• 14. Ekert, P., J. Silke, and D. Vaux, Caspase inhibitors. Cell Death and Differentiation, 1999. 6: p. 1081-1086.
• 15. Ellwart, J.W., J.-P. Kremer, and P. Dormer, Drug Testing in Established Cell Lines by Flow Cytometric Vitality Measuremnt versus Clonogenic Assay. Cancer Research, 1988. 48: p. 5722-5725.
• 16. Emaus, R., R. Grunwald, and J. Lemasters, Rhodamine 123 as a probe of transmembrane potential in isolated reat-liver mitochondria: spectral and metabolic properties. Biochimica et Biophysica Acta, 1986. 850: p. 436-448.
• 17. Endresen, P., P. Prytz, and J. Aarbakke, A new flow cytometric method for discrimination of apoptotic cells and detection of their cell cycle specificity through staining of F-actin and DNA. Cytometry, 1995. 20: p. 162-171.
• 18. Engeland, M.v., et al., A Novel Assay to Measure Loss of Plasma Membrane Asymmetry During Apoptosis of Adherent Cells in Culture. Cytometry, 1996. 24: p. 131-139.
• 19. Fadok, V., et al., Exposure of phophatidylserine on the surface of apoptotic lymphocytes triggers specific recognition and removal by macrophages. Journal of Immunolgy, 1992. 148: p. 2207-2216.
• 20. Ferlini, C., et al., Flow cytometric analysis of the early phases of apoptosis by cellular and nuclear techniques. Cytometry, 1996. 24: p. 106-115.
• 21. Frey, T., Nucleic Acid Cyes for Detection of Apoptosis in Live Cells. Cytometry, 1995. 21: p. 265-274.
• 22. Frey, T., Correlated flow cytometric analysis of terminal events in apoptosis reveals the absence of some changes in some model systems. Cytometry, 1997. 28: p. 253-263.
• 23. Ganitkevich, V.Y., The Role of Mitochondria in Cytoplasmic Ca Cycling. Experimental Physiology, 2003. 88.1: p. 91-97.
• 24. Gulbins, E., S. Dreschers, and J. Bock, Role of Mitochondria in Apoptosis. Experimental Physiology, 2003. 88.1: p. 85-90.
• 25. Hotz, M., et al., Flow cytometric detection of apoptosis: Comparison of the assays of in situ DNA degradation and chromatin changes. Cytometry, 1994. 15: p. 237-244.

• Ivanovska, I., et al., Regulation of cell death in the lymphoid system by Bcl-2 Family proteins. Acta Haematologica, 2004. 111: p. 42-55.
• 28. Jacobberger, J., Flow Cytometric Analysis of Intracellular Protein Epitopes. Immunophenotyping, 2000: p. 361-405.
• 29. King, M.A., Detection of Dead Cells and Measurement of Cell Killing by Flow Cyometry. Journal of Immunological Methods, 2000. 243: p. 155-166.
• 30. Kohler, C., s. Orrenius, and M. Zhivotovsky, Evaluation of caspase activty in apoptotic cells. Journal of Immunological Methods, 2002. 265: p. 97-110.
• 31. Li, X. and A. Darzynkiewicz, Labeling DNA strand breaks with Brd-UTP. Detection of apoptosis and cell proliferation. Cell Proliferation, 1995. 28: p. 572-579.
• 32. Li, X., et al., Single step procedure for labeling DNA strand breaks with fluorescein or BODIPY conjugated Deoxynucleotides: detection of apoptosis and bromodeoxyuridine incorpoation. Cytometry, 1995. 20: p. 172-180.
• 33. Li, X., et al., Application of Biotin, Digoxigenin or Fluorescein Conjugated Deoxynucleotides to Label DNA Strand Breaks for Analysis of Cell Proliferation and Apoptosis Using Flow Cytometry. Biotechnic & Histochemistry, 1995. 70(5): p. 234-242.
• 34. LIsa, F.D., et al., Mitochondrial membrane potential in single living adult rat cardiac myocytes exposed to anoxia or metabolic inhibition. J. physiol, 1995. 486: p. 1-13.
• 35. Magno, G. and I. Joris, Apoptosis, Oncosis, and Necrosis. American Journal of Pathology, 1995. 146(1): p. 3-.
• 36. Marchetti, P., et al., Mitochondrial Permeability Transition Triggers Lymphocyte Apoptosis. Journal of Immunolgy, 1996. 157: p. 4830-4836.
• 37. Maria Genova, M.M. Pich, and G. Lenaz, Mitochondrial Production of Oxygen Radical Species and the Role of Coenzyme Q as an Antioxidant. Exp Biol Med, 2003. 228: p. 506-513.
• 38. Matteucci, C., et al., Identification of Nuclei from apoptotic, necrotic, and viable lymphoid cells by using multiparamater flow cytometry. Cytometry, 1999. 35(145-153).
• 39. Mikkelsen, R. and P. Wardman, Biological chemistry of reactive oxygen and nitrogen and radiation-induced signal trasduction mechanisms. Oncogene, 2003. 22: p. 5734-5754.
• 40. Mower, D., et al., Decreased membrane phopholipid packing and decreased cell size precede DNA cleavage in mature mouse B cell apoptosis. Journal of Immunology, 1994. 152: p. 47832-4842.

• Nieminen, A.-L., Apoptosis and Necrosis in Health and Disease: Role of Mitochondria. International Review of Cytology, 2003. 224: p. 29-55.
• 42. Ormerod, M., et al., Increased membrane permeability of apoptotic thymocytes: A flow cytometric study. Cytometry, 1993. 14: p. 595-602.
• 43. Ormerod, M., Investigating the relationship between the cell cycle and apoptosis using flow cytometry. Journal of Immunological Methods, 2002. 265: p. 73-80.
• 44. Paglin, S., et al., A novel response of cancer cells to radiation involves autophagy and formation of acidic vesicles. Cancer Research, 2001. 61: p. 439-444.
• 45. Papadopoulos, N., et al., An improved fluorescence assay fro the determination of lymphocyte-mediated cytotoxicity using flow cytometry. Journal of Immunological Methods, 1994. 177: p. 101-111.
• 46. Poot, M. and R. Pierce, Detection of Changes in Mitochondrial Function During Apoptosis by Simultaneous Staining With Multiple Fluorescent Dyes and Correlated Multiparameter Flow Cytometry. Cytometry, 1999. 35: p. 311-317.
• 47. Poot, M. and R. Pierce, Detection of Apoptosisi and changes in mitchondrial membrane potential with CMX Ros. Cytometry, 1999. 36: p. 359-360.
• 48. Poot, M., J. Silber, and P. Rabinovitch, A novel flow cytometric technique for drug cytotoxicity gives results comparable to colony-forming assays. Cytometry, 2002. 48: p. 1-5.
• 49. Potter, A., et al., Flow cytometric analysis of the cell cycle phase specificity of DNA damage induced by radiation, hydrogen peroxide and doxorubicin. Carcinogenesis, 2002. 22(3): p. 389-401.
• 50. Pozarowski, P., et al., Interactions of Fluorochromed Labeled Caspase Inhibitorys with Apoptotic Cells: A caution in Data Interpretation. Cytometry, 2003. 55A: p. 50-60.
• 51. Rasola, A. and M. Geuna, A flow cytometry assay simultaneously detects independent apoptotic parameters. Cytometry, 2001. 45: p. 151-157.
• 52. Reers, M., T. Smith, and L.B. Chen, J-Aggregate Formation of a carbocyanine as a quantitative fluorescent indicator of membrane potential. Biochemistry, 1991. 30: p. 4480-4486.
• 53. Roos, A., et al., A pivotal role for innate immunity in the clearance of apoptotic cells. Eurpean J. of Immunology, 2004. 34: p. 921-929.
• 54. Rottenberg, H. and S. Wu, Quantitiative assay by flow cytometry of the mitochondrial membrane potential in intact cells. Biochimica et Biophysica Acta, 1998. 1404: p. 393-404.

• 55. Ross, D., et al., Estimation of cell survival by flow cytometric quantification of fluorescein diacetate/Propidium iodid biable cell number. Cancer Research, 1989. 49: p. 3776-3782.
• 56. Schmid, I., C. Uittenbogaart, and J. Giorgi, Sensitive Method for measuring apoptosis and cell surface phenotype in human Thymocytes by flow cytometry. Cytometry, 1994. 15: p. 12-20.
• 57. Shapiro, H., Cell Membrane potential analysis. Methods in Cell Biology, 1994. 41: p. 121-133.
• 58. Slee, E., C. Adrain, and S. Martin, Serial killers: ordering caspase activation events in apoptosis. Cell Death and Differentiation, 1999. 6: p. 1067-1074.
• 59. Smolewski, P., et al., Assay of caspase activation in situ combined with probing plasma membrane integrity to detect three distinct stages of apoptosis. Journal of Immunological Methods, 2002. 265: p. 11-121.
• 60. Stahnke, K., et al., Identification of deficient mitochondrial signaling in apoptosis resistant leukemia cells by flow cytometric canalysis of intracellular cytochrome c, caspase-3 and apoptosis. Apoptosis, 2004. 9: p. 457-465.
• 61. Such, L., et al., Flow Cytometric Analysis of Peroxidative Activity in Granulocytes from coronary and peripheral blood in acute myocardial ischemia and reperfusion in dogs: Protective effect of methionine. Cytometry, 1999. 37: p. 140-146.
• 62. Tao, D., et al., New Method for the analysis of cell cycle specific apoptosis. Cytometry, 2004. 57A: p. 70-74.
• 63. Telford, W., L. King, and P. Fraker, Comparative Evaluation of Several DNA Binding Dyes in the Detection of Apoptosis-Associated Chromatin Degradation by Flow Cytometry. Cytometry, 1991. 13: p. 137-143.
• 64. Voronina, S., et al., Effects of secretagogues and bile acids on mitochondrial membrane potential of pancreatec acinar cells. The Journal of Bilogical Chemistry, 2004. 279(26): p.
• 27327-27338. • 65. Wolbers, F., et al., Apoptotic cell death kinetics in vitro depend on the cell types and the
inducers used. Apoptosis, 2004. 9(385-392). • 66. Weir, I.E., Analysis of Apoptosis in Plant cells. Methods in Cell Biology, 2001. 63: p. 505-
526. • 67. Waldker, R.P., et al., Detection of the initial stages of DNA fragmentation in apoptosis.
Biotechni, 1993. ues(15).