TECHNICALTECHNICAL SCIENCE - Ukuqonda s cience grade 10 teacher guide teacher guideteacher guide...
200
TECHNICAL SCIENCE GRADE 10 TEACHER GUIDE TEACHER GUIDE TEACHER GUIDE GRADE 10 GRADE 10 TECHNICAL TECHNICAL SCIENCE SCIENCE 2186 TechSci G10_Eng_Cover TG.indd 1-3 2015/12/14 11:45 AM
Transcript of TECHNICALTECHNICAL SCIENCE - Ukuqonda s cience grade 10 teacher guide teacher guideteacher guide...
TECH
NIC
AL SC
IENC
E GR
AD
E 10 TEAC
HER G
UID
E
TEACHER GUIDETEACHER GUIDEGRADE 10GRADE 10
TECHNICALTECHNICAL
SCIENCESCIENCE
2186 TechSci G10_Eng_Cover TG.indd 1-3 2015/12/14 11:45 AM

Technical
Grade 10science
Developed and funded as an ongoing project by the Sasol Inzalo Foundation in partnership with the Ukuqonda Institute
Teacher Guide
Published by The Ukuqonda Institute: http://www.ukuqonda.org.za
9 Neale Street, Rietondale 0084; Title 21 company, reg. no. 2006/026363/08;
Public Benefit Organisation, PBO Nr. 930035134
© 2015. Copyright in the work is vested in the publisher.
Copyright in the text remains vested in the authors.
ISBN: 978-1-4315-2284-2
This book was developed with the participation of the Department of Basic Education of South Africa (DBE)
with funding from the Sasol Inzalo Foundation (SaIF).
authors: Andre Goosen, Peter Moodie
Text editors: Carol MacDonald, Lynne Owen-Smith
Project managers: Andrew Hofmeyr, Rod Sherwood
contributors from the ukuqonda institute:
Chris Human, Carol MacDonald, Karen van Niekerk, Leonora van Staden
independent reviewers:
Prof. John Bradley, Prof. Diane Grayson, Ms Maria Lycoudi
contributors from the department of Basic education:
Sivuyile Kutu, Desiree Letswiti, Veena Maharaj, Morongwa Masemola, Willie Monoreng, Thandi Oane,
Modiba Phosa
The sequencing of topics and the nature of activities was determined by the requirement to comply with the CAPS for Technical Science.
illustrations and computer graphics: Lisa Steyn Illustration, Mark de Lange, Melany Pietersen (Happy Artworks Studio), Tina Nel, Rod Sherwood, Leonora van Staden, Paddy Bouma
Photographers: Kim Stevens, Rebekah Swanepoel, Leonora van Staden, Maria van Koersveld (Vivid Milieu), Martin van Niekerk Photography
cover photograph: Kim Stevens
Printed by: [printer name and address]
acknowledgements: Thanks to John Orr Technical High School, Johannesburg, for participating in piloting some of the learning material in this book in the classroom, while the book was being written.
Thanks to the Concrete Materials and Structural Integrity Research Unit (CoMSIRU), Department of Civil Engineering, University of Cape Town (http://www.comsiru.uct.ac.za) for free sharing of photos of structural testing and structural failure, specifically, Figure 3.21, Figure 5.25, Figure 5.31a and Figure 5.31b.
Thanks to Tomson Motors and Stellenbosch Auto Clinic, Stellenbosch who helped with photographing certain machinery.
Your freedom to legally copy this bookThis work is published under a Creative Commons Attribution-NonCommercial 4.0 Unported License (CC BY-NC 4.0). http://creativecommons.org/licenses/by-nc/4.0/
You are allowed to freely copy this book subject to the qualifications below. You can photocopy, print and distribute it as you like. You may download it onto any electronic device, distribute it via email, and upload it to your website, at no charge. You may also adapt the text and illustrations.
attribution: When doing any of the above, you should provide clear acknowledgement of the license/copyright holders (‘attribute the original work’). This attribution should include the name(s) of the original book(s) and the publisher, as the names of the Sasol Inzalo Foundation and the Department of Basic Education of South Africa. You should also provide the Creative Commons web address which explains this type of license: http://creativecommons.org/licenses/by-nc/4.0.
If you made changes to the material, you must indicate what changes you have made. You may not in any way suggests that the licensor endorses you or your use of your material or your changes to the material.
restrictions: You may not make copies of this book or a part of this book – in printed or electronic or audio or video or whatever form – for a profit-seeking purpose.
restriction in addition to cc-BY-nc/4.0 – limited rights on use of photos containing recognisable persons or trademarks: Photographs in the book that show a person or trade mark emblem/insignia in an even slightly recognisable manner may be not used out of its learning context, and may not be used for an intended audience other than learners/students and teachers. A photo containing a person or trade mark emblem/insignia may only be used in a web page or in print or in a slide show (or in any other media) if it is for a not-for-profit teaching/learning purpose, and if the photo on that page/web page/slide/other media is accompanied by related learning material(s) that is at least as big as the photo itself.
No photograph in the book, or on the cover, may be used for promotional or advertising purposes, even if such promotion or advertising is not for a profit-seeking purpose.
No photograph in the book that shows a person may be used on the cover of any derived work, or in any media in a way equally prominent to the cover of a book.
rights of other copyright holders: All reasonable efforts have been made to ensure that materials included are not already copyrighted to other entities, or in a small number of cases, to seek permission from and acknowledge copyright holders. In some cases this may not have been possible. The publishers welcome the opportunity for redress with any unacknowledged copyright holders.

Table of Contents
Chapter 1 Maths skills for Science 1
Chapter 2 Motion in one dimension 19
Chapter 3 Forces 32
Chapter 4 Moment of a force 51
Chapter 5 Beams 58
Chapter 6 Simple machines 81
Chapter 7 Energy 95
Chapter 8 Properties of materials 111
Chapter 9 Elements and compounds 118
Chapter 10 Reactions and equations 124
Chapter 11 Thermal and electrical properties 131
Chapter 12 Electrostatics 139
Chapter 13 Circuits and potential difference 143
Chapter 14 Resistance and factors that change it 153
Chapter 15 Series and parallel circuits 170
Chapter 16 Heat and temperature 187
Chapter 1 Maths skills for Science
1
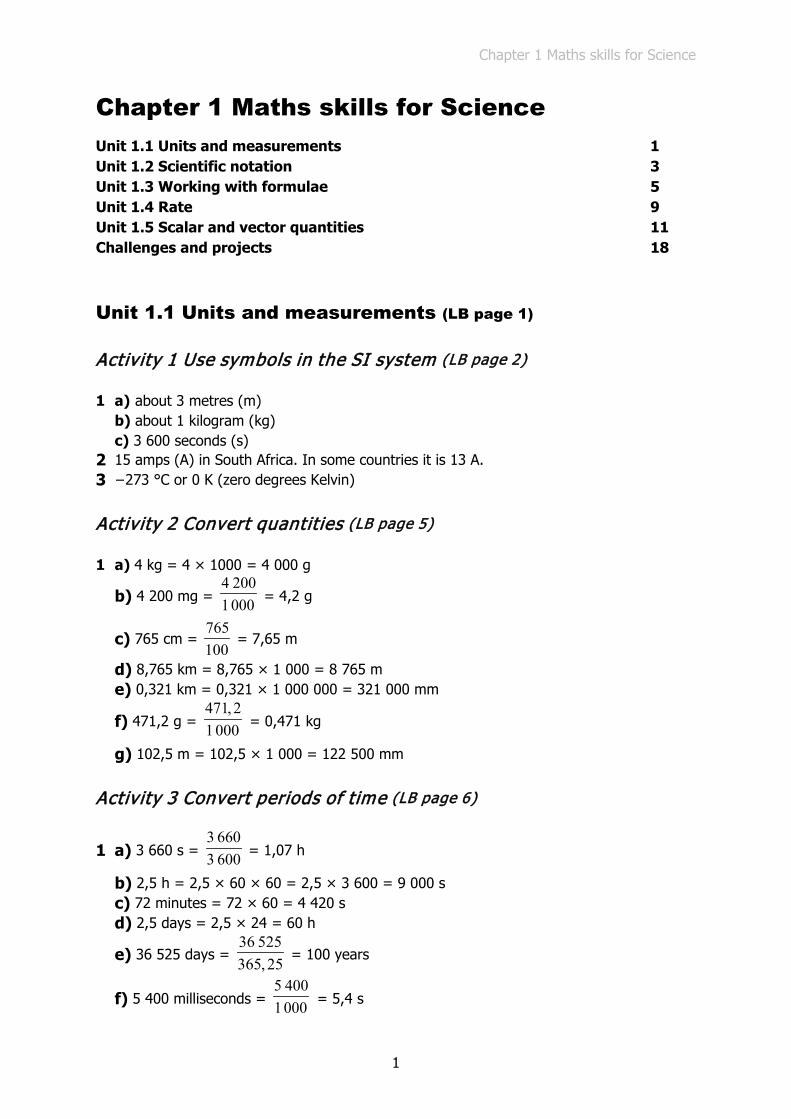
Chapter 1 Maths skills for Science Unit 1.1 Units and measurements 1 Unit 1.2 Scientific notation 3 Unit 1.3 Working with formulae 5 Unit 1.4 Rate 9 Unit 1.5 Scalar and vector quantities 11 Challenges and projects 18
Unit 1.1 Units and measurements (LB page 1)
Activity 1 Use symbols in the SI system (LB page 2)
1 a) about 3 metres (m) b) about 1 kilogram (kg) c) 3 600 seconds (s)
2 15 amps (A) in South Africa. In some countries it is 13 A. 3 −273 °C or 0 K (zero degrees Kelvin)
Activity 2 Convert quantities (LB page 5)
1 a) 4 kg = 4 × 1000 = 4 000 g
b) 4 200 mg = 4 2001000 = 4,2 g
c) 765 cm = 765100
= 7,65 m
d) 8,765 km = 8,765 × 1 000 = 8 765 m e) 0,321 km = 0,321 × 1 000 000 = 321 000 mm
f) 471,2 g = 471,21000 = 0,471 kg
g) 102,5 m = 102,5 × 1 000 = 122 500 mm
Activity 3 Convert periods of time (LB page 6)
1 a) 3 660 s = 3 6603 600 = 1,07 h
b) 2,5 h = 2,5 × 60 × 60 = 2,5 × 3 600 = 9 000 s c) 72 minutes = 72 × 60 = 4 420 s d) 2,5 days = 2,5 × 24 = 60 h
e) 36 525 days = 36 525365,25 = 100 years
f) 5 400 milliseconds = 5 4001000 = 5,4 s
Chapter 1 Maths skills for Science
2
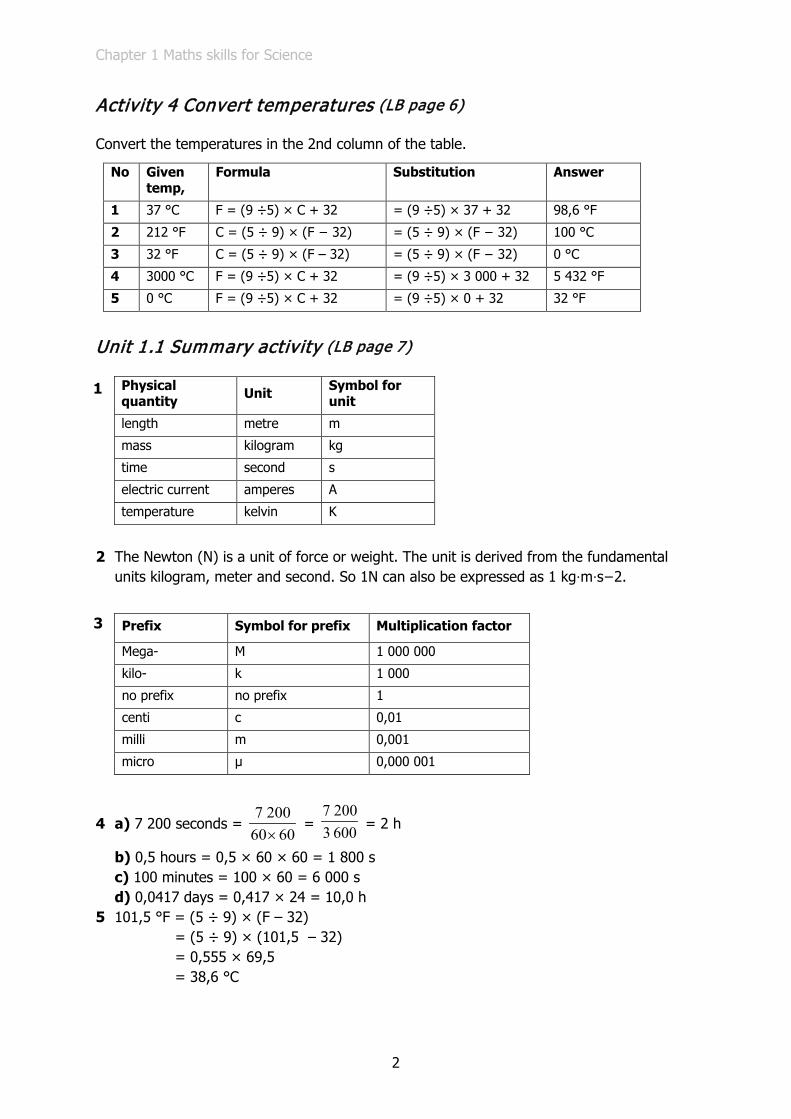
Activity 4 Convert temperatures (LB page 6)
Convert the temperatures in the 2nd column of the table.
No Given temp,
Formula Substitution Answer
1 37 °C F = (9 ÷5) × C + 32 = (9 ÷5) × 37 + 32 98,6 °F
2 212 °F C = (5 ÷ 9) × (F − 32) = (5 ÷ 9) × (F − 32) 100 °C
3 32 °F C = (5 ÷ 9) × (F – 32) = (5 ÷ 9) × (F − 32) 0 °C
4 3000 °C F = (9 ÷5) × C + 32 = (9 ÷5) × 3 000 + 32 5 432 °F
5 0 °C F = (9 ÷5) × C + 32 = (9 ÷5) × 0 + 32 32 °F
Unit 1.1 Summary activity (LB page 7)
1 Physical quantity Unit Symbol for
unit
length metre m
mass kilogram kg
time second s
electric current amperes A
temperature kelvin K
2 The Newton (N) is a unit of force or weight. The unit is derived from the fundamental
units kilogram, meter and second. So 1N can also be expressed as 1 kg⋅m⋅s−2.
3 Prefix Symbol for prefix Multiplication factor
Mega- M 1 000 000
kilo- k 1 000
no prefix no prefix 1
centi c 0,01
milli m 0,001
micro µ 0,000 001
4 a) 7 200 seconds = 7 200
60 60× =
7 2003 600 = 2 h
b) 0,5 hours = 0,5 × 60 × 60 = 1 800 s c) 100 minutes = 100 × 60 = 6 000 s d) 0,0417 days = 0,417 × 24 = 10,0 h
5 101,5 °F = (5 ÷ 9) × (F – 32) = (5 ÷ 9) × (101,5 – 32) = 0,555 × 69,5 = 38,6 °C

Chapter 1 Maths skills for Science
3
Unit 1.2 Scientific notation (LB page 8)
Quick Activity (LB page 9)
1 The exponent of a number that is very small is negative. 2 The exponent of a very large number is positive.
Activity 5 Convert numbers from standard notation to scientific notation (LB page 9)
Write the numbers with the correct symbols for the units:
1 Speed of electromagnetic radiation = 300 000 000 m/s = 3,0 × 10⁸ m/s 2 Annual radiation = 2400 kilowatt hours per square metre = 2,4 × 10³ kWh/m2 3 The diameter of the atom = 0,000 000 000 1 metres = 1,0 × 10⁻¹⁰ m 4 The charge of a single electron = −0,000 000 000 000 000 000 160 2 coulombs = −1,602 × 10−19
Activity 6 Convert numbers from scientific notation to standard notation (LB page 10)
1 7,1 × 10⁷ joules = 71 000 000 J 2 7,5 × 10⁵ volt-amps = 750 000 VA 3 5,5 × 10⁻⁶ m = 0,000 005 5 m or 5,5 µm 4 6,6 × 10⁻⁷ m = 0,000 000 66 m or 0,66 µm
Activity 7 Multiply and divide large numbers in scientific notation (LB page 11)
1 125 × 2 000 = 1,25 × 102 × 2,0 × 103 = 2,50 × 10⁵
2 4 000 × 750 000 = 4,0 × 103 × 7,5 × 105 = 30 × 108 = 3,0 × 10⁹
3 90 000 000
1 500 =
7
3
9,0 101,5 10
××
= 6 × 10⁴
Chapter 1 Maths skills for Science
4
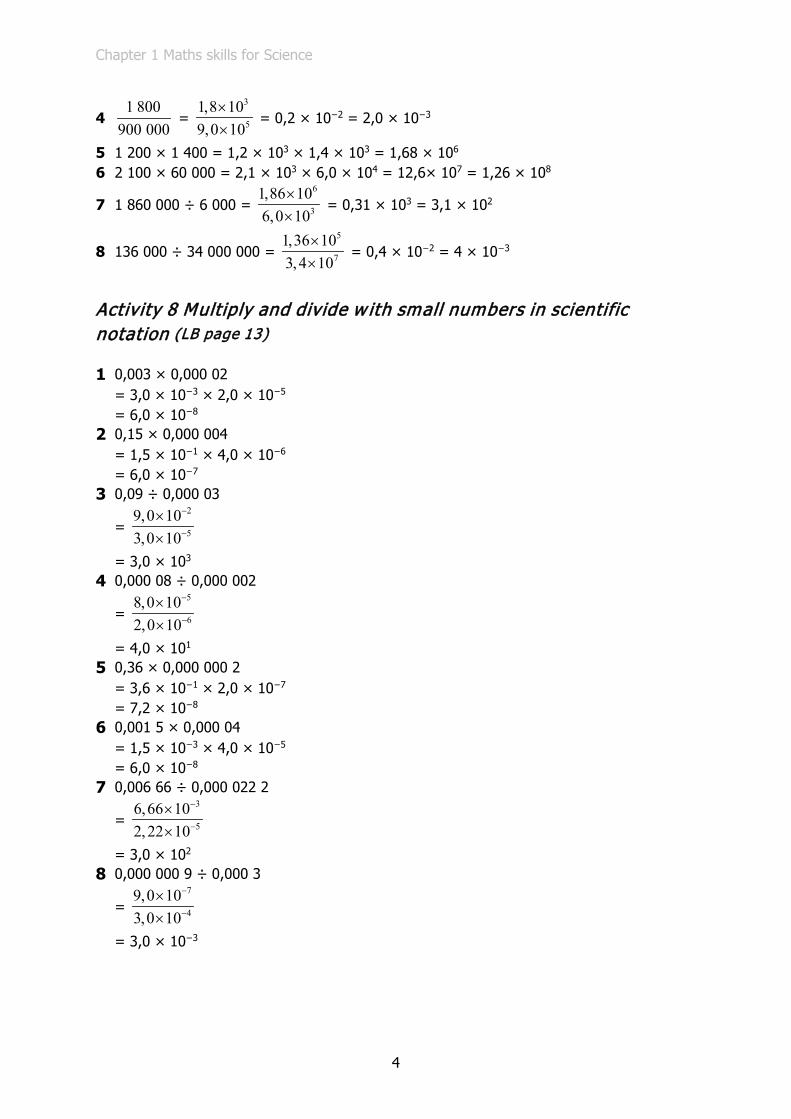
4 1 800
900 000 =
3
5
1,8 109,0 10
××
= 0,2 × 10−2 = 2,0 × 10⁻³
5 1 200 × 1 400 = 1,2 × 103 × 1,4 × 103 = 1,68 × 10⁶ 6 2 100 × 60 000 = 2,1 × 103 × 6,0 × 104 = 12,6× 107 = 1,26 × 10⁸
7 1 860 000 ÷ 6 000 = 6
3
1,86 106,0 10
××
= 0,31 × 103 = 3,1 × 10²
8 136 000 ÷ 34 000 000 = 5
7
1,36 103,4 10
××
= 0,4 × 10−2 = 4 × 10⁻³
Activity 8 Multiply and divide w ith small numbers in scientific notation (LB page 13)
1 0,003 × 0,000 02 = 3,0 × 10−3 × 2,0 × 10−5 = 6,0 × 10⁻⁸ 2 0,15 × 0,000 004 = 1,5 × 10−1 × 4,0 × 10−6 = 6,0 × 10⁻⁷ 3 0,09 ÷ 0,000 03
= 2
5
9,0 103,0 10
−
−
××
= 3,0 × 10³ 4 0,000 08 ÷ 0,000 002
= 5
6
8,0 102,0 10
−
−
××
= 4,0 × 101 5 0,36 × 0,000 000 2 = 3,6 × 10−1 × 2,0 × 10−7 = 7,2 × 10⁻⁸ 6 0,001 5 × 0,000 04 = 1,5 × 10−3 × 4,0 × 10−5
= 6,0 × 10⁻⁸ 7 0,006 66 ÷ 0,000 022 2
= 3
5
6,66 102,22 10
−
−
××
= 3,0 × 10² 8 0,000 000 9 ÷ 0,000 3
= 7
4
9,0 103,0 10
−
−
××
= 3,0 × 10⁻³
Chapter 1 Maths skills for Science
5
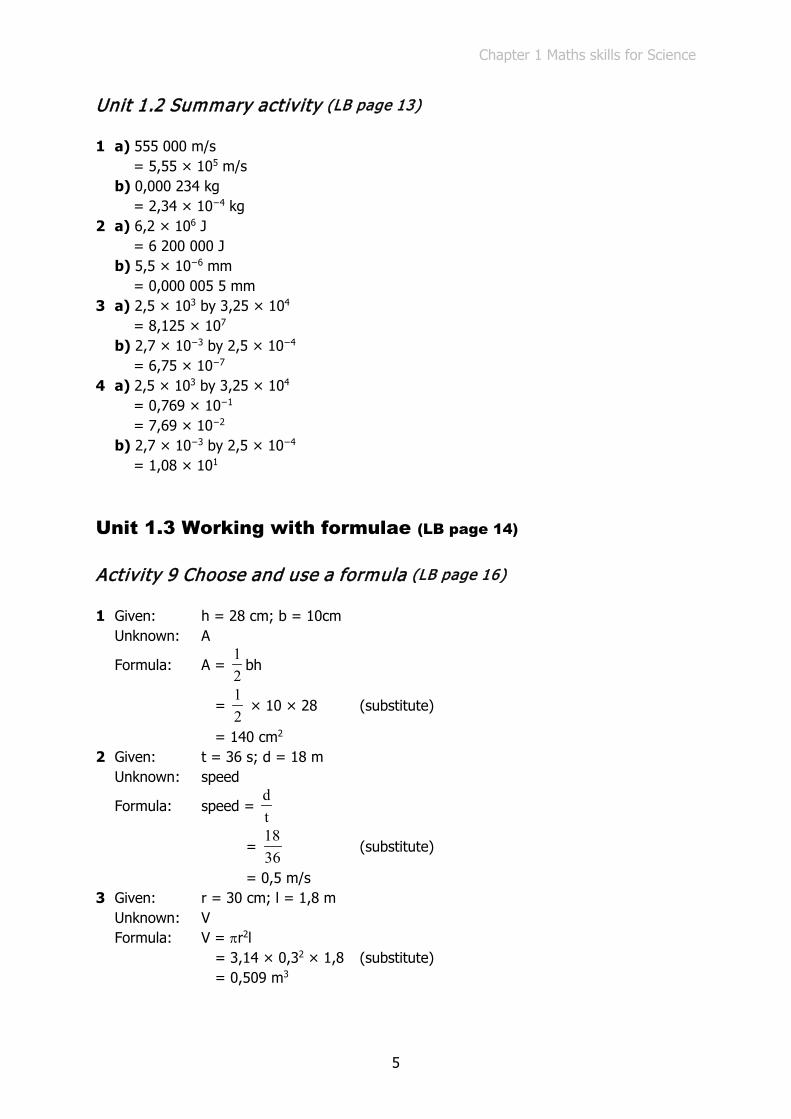
Unit 1.2 Summary activity (LB page 13)
1 a) 555 000 m/s = 5,55 × 10⁵ m/s b) 0,000 234 kg = 2,34 × 10⁻⁴ kg
2 a) 6,2 × 10⁶ J = 6 200 000 J b) 5,5 × 10⁻⁶ mm = 0,000 005 5 mm
3 a) 2,5 × 103 by 3,25 × 104 = 8,125 × 107 b) 2,7 × 10−3 by 2,5 × 10−4 = 6,75 × 10⁻⁷
4 a) 2,5 × 103 by 3,25 × 104 = 0,769 × 10−1 = 7,69 × 10⁻² b) 2,7 × 10−3 by 2,5 × 10−4 = 1,08 × 101
Unit 1.3 Working with formulae (LB page 14)
Activity 9 Choose and use a formula (LB page 16)
1 Given: h = 28 cm; b = 10cm Unknown: A
Formula: A = 12
bh
= 12
× 10 × 28 (substitute)
= 140 cm2
2 Given: t = 36 s; d = 18 m Unknown : speed
Formula: speed = dt
= 1836
(substitute)
= 0,5 m/s 3 Given: r = 30 cm; l = 1,8 m Unknown : V Formula: V = πr2l = 3,14 × 0,32 × 1,8 (substitute) = 0,509 m3
Chapter 1 Maths skills for Science
6
4 Given: FE = 100 N; FL = 700 N Unknown : MA
Formula: MA = L
E
FF
= 700100
(substitute)
= 7 5 Given: V = 6 V; I = 0,3 A Unknown: R
Formula: I = VR
R = VI
(change subject)
= 6
0,3 (substitute)
= 20 Ω 6 Given: a = 120 mm; b = 160 mm Unknown: c Formula: c = 2 2a b+
= 2 2120 160+ (substitute)
= 200 mm 7 Given: FE = 150 N; FL = 600 N Unknown: MA
Formula: MA = L
E
FF
= 600150
(substitute)
= 4 8 Given: l = 25 m; b = 10 m; dS = 1,2; dD = 2,4 m
a) Unknown: volume of water Formula: V = area of the side × breadth
= 12
(1,2 + 2,4) × 25 × 10 (area of a trapezium)
= 45 × 10 = 450 m3 b) Unknown: area of tiles Formula: area of both sides = 2 × area of side = 2 × 45 = 90 m2 area of both ends = bdS + bdD = 10 × 1,2 + 10 × 2,4 = 36 m2

Chapter 1 Maths skills for Science
7
area of bottom = sloping length × breadth
= 2 21, 2 25+ × 10
= 25,03 × 10 = 250,3 m2
total area = areas of sides + ends + bottom = 90 + 36 + 250,3 = 376,3 m2
Activity 10 Change the subject of the formula (LB page 18)
These activities are based on Activity 9, but the subject of the formula needs to be changed.
1 Given: A = 60 cm2; b = 15 cm Unknown: h
Formula: A = 12
bh
h = 2Ab
(change subject)
= 2 60
15×
(substitute)
= 8 cm 2 Given: t = 32 s; s = 1,5 m/s Unknown: d
Formula: speed = dt
d = t × speed (change subject) = 32 × 1,5 = 48 (substitute) = 48 m 3 Given: r = 20 cm = 0,2 m; V = 0,2 m3 Unknown: h Formula: V = πr2h
h = 2
Vπr
(change subject)
= 2
0, 23,14 0,2×
(substitute)
= 1,59 m 4 Given: load = 700N; MA = 5 Unknown : effort
Formula: MA = load
effort
effort = loadMA
(change subject)
= 700
5 (substitute)
= 140 N
Chapter 1 Maths skills for Science
8
5 Given: I = 0,3 A; R = 36 Ω Unknown : V
Formula: I = VR
V = IR (change subject) = 0,3 × 36 (substitute) = 10,8 V 6 Given: side h = 24 cm; side a = 16 cm Unknown : side b Formula: h2 = a2 + b2 b = 2 2h a− (change subject)
= 2 224 −16 (substitute)
= 17,9 cm 7 Given: MA =5; dE = 600 mm Unknown: dL
Formula: MA = E
L
dd (change subject)
dL = EdMA
(substitute)
= 6005
= 120 mm
Unit 1.3 Summary activity (LB page 19)
1 Given: A = 75 cm2; h = 15cm Unknown: h
Formula: A = 12
bh
h = 2Ab
(change subject)
= 2 75
15×
(substitute)
= 10 mm 2 Given: t = 7 s; speed = 0,5 m/s Unknown: d
Formula: speed = dt
d = speed × t (change subject) = 7 × 0,5 (substitute) = 3,5 m
Chapter 1 Maths skills for Science
9
3 Given: base is 40 cm × 100 cm or 0,4 m × 1 m; V = 0,75 m3 Unknown: h Formula: V = ABh
h = B
VA (change subject)
= 0,75
0,4 1× (substitute)
= 1,88 m 4 Given: P = 220 m; l = 40 m Unknown: b Formula: P = 2l + 2b
b = P 2l
2−
(change subject)
= 220 (2 40)
2− ×
(substitute)
= 70 m
Unit 1.4 Rate (LB page 19)
Activity 11 Calibrate a candle: make a candle clock (LB page 20)
A Plan the activity a few days ahead as it might take most of the day to complete. AND… plan a strategy to convince the principal to use your candle to run the school for a day.
B Decide what marks you will make on the candle. You might choose, for example to make marks for 15 minute periods of time. Thin candles burn faster than thick candles.
C Place the candles firmly in the candle holders. D Put the candles holders close together and check that the candles are the same height. E Light one candle. After the chosen period of time make a mark on the second candle
opposite the top of the burning candle. Carry on marking the second candle until about one third of the candle has burned.
F Find the average (mean) distance between the marks you have made and continue marking the second candle at that spacing. 1 time and distance
2 time
distance; speed
3 mm/min; mm/h; cm/min; cm/h
Chapter 1 Maths skills for Science
10
Activity 12 Calculate rates (LB page 22)
1 Given: d = 42,2 km = 42,2 × 1000 = 42 200 m t = 2 h 12 min 36 s = 2 × 3 600 + 12 × 60 + 36 = 7 956 s Unknown: average speed
Formula: average speed = dt
= 42 2007 956 (substitute)
= 5,3 m/s 2 Given: mass loss = 99 – 91 = 8 kg; time = 60 days Unknown: rate of loss
Formula: rate of loss = mass loss
time
= 860
(substitute)
= 0,133 kg/day 3 Given: d = 1,4 – 1 = 0,9 m; t = 1,2 s Unknown: average velocity
Formula: v = dt
= 0,91, 2 (substitute)
= 0,75 m/s down the slope 4 Given: rate of charge = 0,9 C/s; total charge = 3 000 Unknown: time taken to nearest hour
Formula: rate = total chargetime taken
time taken = total charge
rate (change subject)
= 3 0000,9 (substitute)
= 3 333 seconds or = 3 3333 600 = 0,926 h
The time taken to the nearest hour is 1 hour.
Unit 1.4 Summary activity (LB page 23)
1 When you compare two quantities of different kinds you describe a rate. 2 The sentence is correct: In describing a rate, the word "per" is always used to separate
the units of the two measurements. 3 For example: kilometres per hour, pedestrians per minute, cell-phone messages per
second.

Chapter 1 Maths skills for Science
11
Unit 1.5 Scalar and vector quantities (LB page 23)
Quick Activity (LB page 23)
No, it does not have direction. Examples: time, level of sound, brightness of light, mass of a car, cookies in a jar.
Quick Activity (LB page 24)
Direction: lifted up Magnitude: 20 kN
Activity 13 Recognise the difference between scalars and vectors (LB page 24)
Example Physical quantity Scalar or vector
A typical bakkie has a 2 000 cm3 engine 2 000 cm3 scalar
The lion roamed 20 km in a north-westerly direction before it was spotted.
20 km in a north-westerly direction
vector
A diesel bakkie can travel 600 km on one tank of fuel.
600 km scalar
The hook of the truck-mounted crane can reach a height of 5,4 m above road level.
5,4 m above road level
vector
Activity 14 Sketch vectors (LB page 25)
Answers will vary, but each vector must:
• show direction • be labelled • be in proportion to the other vectors in the answer.
Activity 15 Draw accurate diagrams and displacement vectors (LB page 26)
Answers will vary, but each vector must:
• be drawn to scale • indicate the scale • show direction • be the right length • be labelled.
Chapter 1 Maths skills for Science
12
Activity 16 Displacement and force vectors (LB page 27)
Each sketched vector must:
• show direction • be labelled • be in proportion to the other vectors in the answer.
Each drawn vector must:
• be drawn to scale • indicate the scale • show direction • be the right length • be labelled.
Activity 17 Measure and describe the magnitude and direction of vectors (LB page 28)
Name of vector
Magnitude of vector (mm)
Compass direction
Bearing (degrees from North)
1 45 north 0
2 20 east 90
3 35 north-east 45
4 55 west 270
5 10 north-west 315
6 35 north-east 45
7 35 south-west 225
8 50 south 180
Activity 18 Design your own vectors (LB page 29)
Answers will vary.
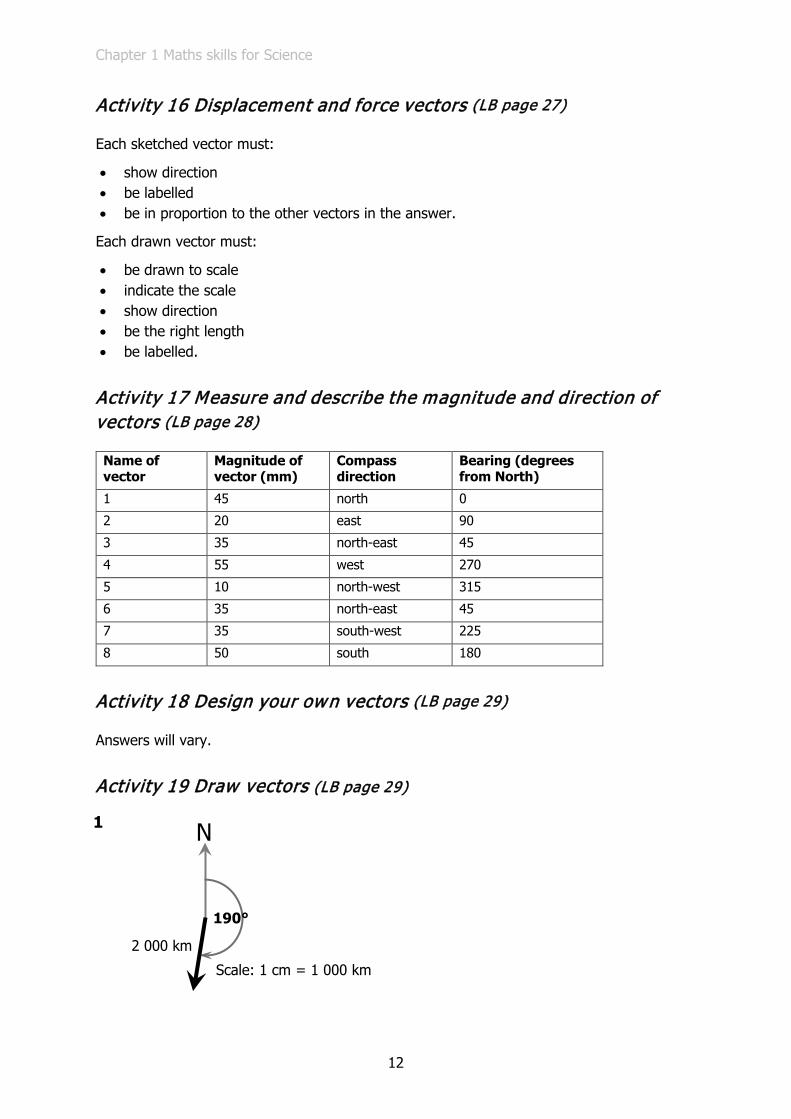
Activity 19 Draw vectors (LB page 29)
1
190°
2 000 km Scale: 1 cm = 1 000 km
N
Chapter 1 Maths skills for Science
13
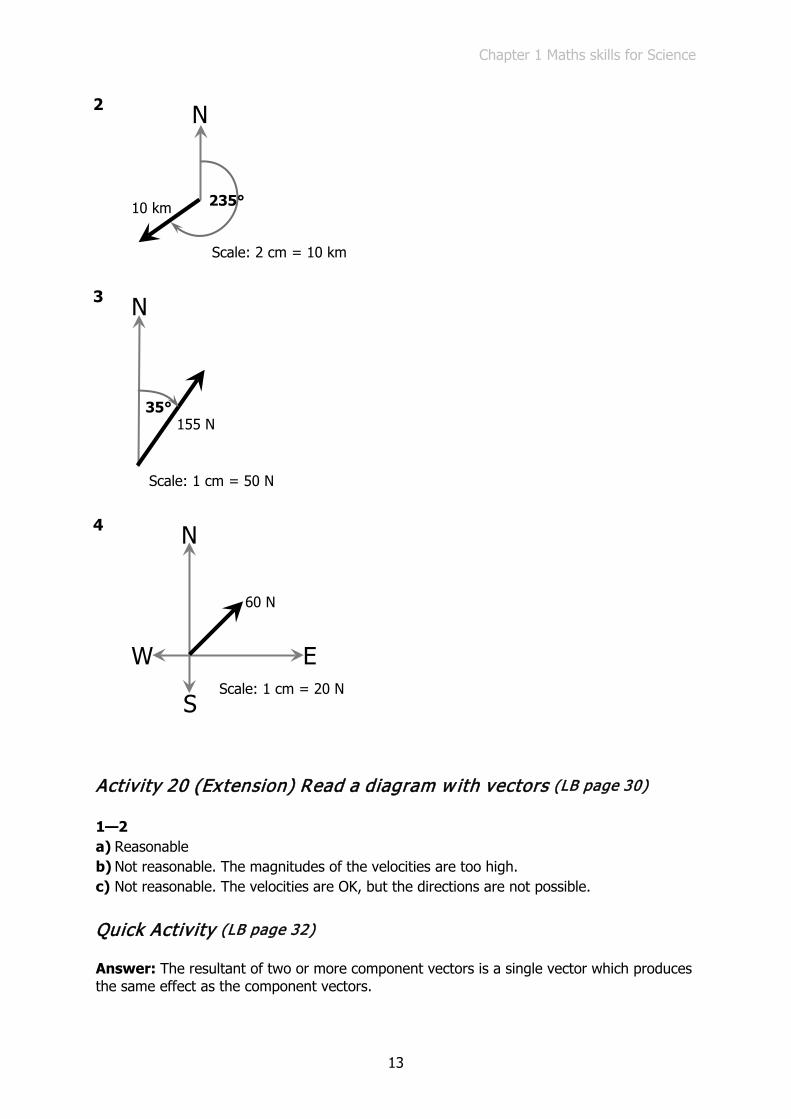
2
3
4
Activity 20 (Extension) Read a diagram w ith vectors (LB page 30)
1—2 a) Reasonable b) Not reasonable. The magnitudes of the velocities are too high. c) Not reasonable. The velocities are OK, but the directions are not possible.
Quick Activity (LB page 32)
Answer: The resultant of two or more component vectors is a single vector which produces the same effect as the component vectors.
235° 10 km
Scale: 2 cm = 10 km
N
35° 155 N
Scale: 1 cm = 50 N
N
N
S
W E Scale: 1 cm = 20 N
60 N

Chapter 1 Maths skills for Science
14
Activity 21 Addition by calculation and by the graphical method (LB page 32)
1 a) 32 mm up the page; 47 mm up the page; 101 mm up the page 32 mm + 47 mm + 101 mm = 180 mm up the page b) 7,6 m up; 13,7 m down; 3,6 m up; 1,7 m down 7,6 m up + 3,6 m up + 13,7 m down + 1,7 m down = (7,6 m + 3,6 m) up + (13,7 m + 1,7 m) down = 11,2 m up + 15,4 m down = 4,4 m down c) 4 cm to the right; 2 cm to the right; 30 mm to the right; 0,02 m to the right 4 cm + 2 cm + 30 mm + 0,02 m = 4 cm + 2 cm + 3 cm + 2 cm = 11 cm to the right d) +1 200 mm; –2,3 m; +76 cm; +0,5 m +1,2 m – 2,3 m + 0,76 m +0,5 m = +0,16 m
2 a) Scale: 1 mm = 1 mm
Resultant = 155 mm left b) Scale: 1cm = 1cm
Resultant = +15 cm c) Scale: 1 cm = 0,25 m
Resultant = +4,2 m d) Scale: 1 cm = 200 mm
Resultant = +500mm
Activity 22 The effect of the order of vectors (LB page 32)
1 Draw the four small force vectors again (190 N; 130 N; 150 N; 200 N), all pointing in the same direction, all along the same straight line, but put them in a different order. Take care to draw them to scale (19 mm; 13 mm; 15 mm and 20 mm).
2 Find the resultant of the four vectors graphically. Scale: 1 cm = 100 N
Answer: The order of the component vectors does not affect the size of the resultant vector.

Chapter 1 Maths skills for Science
15
Activity 23 The effect of the direction of vectors (LB page 33)
1 Draw three light lines right across the page, all at different angles. 2 On each of the lines, at any point on the line, in any order, draw the same four vectors
nose to tail. 3 Draw the resultant vector for each of the three sets of four small vectors. Each resultant
vector must be parallel and close to the vectors it represents.
Answer: The direction of a resultant vector depends on the direction of the component vectors.
Activity 24 Addition of vectors (LB page 35)
1 a) 4,5 + 5,5 + 3,5 + 2,5 = 16 cm NE b) +9 − 5 + 7 − 2 = +9 cm
2 a) Scale: Full scale
b) Scale: Full scale
Chapter 1 Maths skills for Science
16
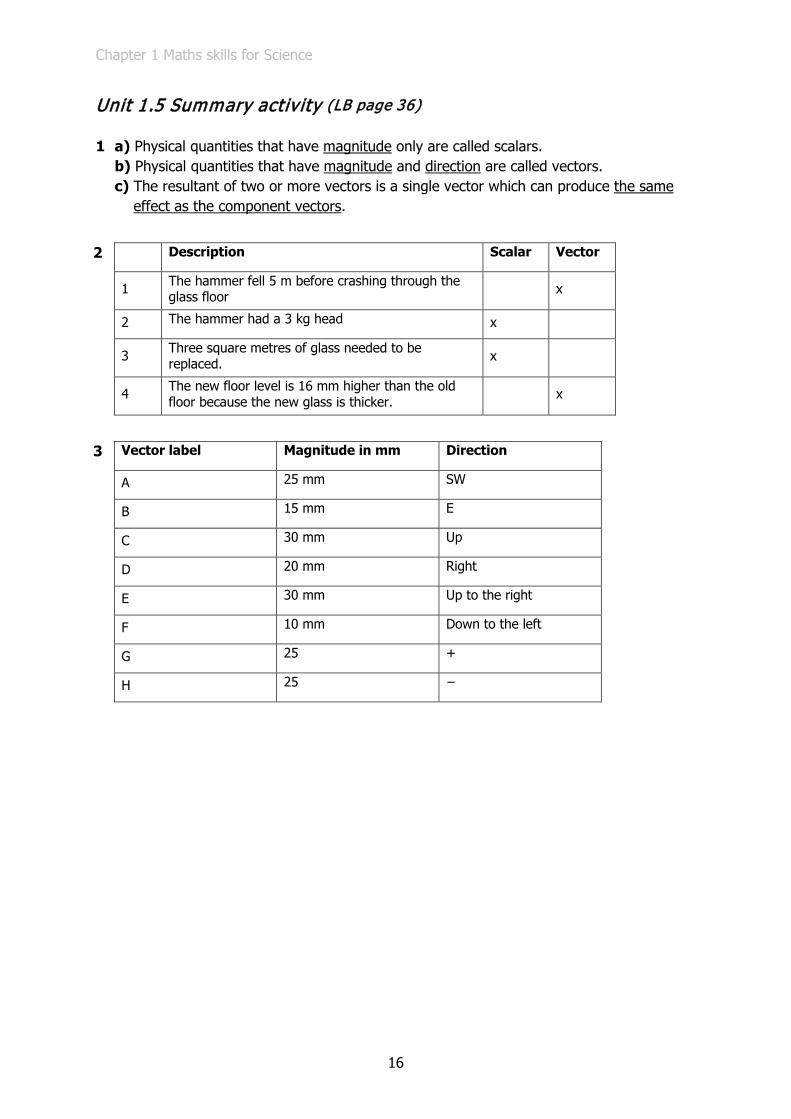
Unit 1.5 Summary activity (LB page 36)
1 a) Physical quantities that have magnitude only are called scalars. b) Physical quantities that have magnitude and direction are called vectors. c) The resultant of two or more vectors is a single vector which can produce the same
effect as the component vectors.
2 Description Scalar Vector
1 The hammer fell 5 m before crashing through the glass floor x
2 The hammer had a 3 kg head x
3 Three square metres of glass needed to be replaced. x
4 The new floor level is 16 mm higher than the old floor because the new glass is thicker. x
3 Vector label Magnitude in mm Direction
A 25 mm SW
B 15 mm E
C 30 mm Up
D 20 mm Right
E 30 mm Up to the right
F 10 mm Down to the left
G 25 +
H 25 −

Chapter 1 Maths skills for Science
17
4 a) If the positive direction is to the right: 88 mm; ‒99mm Scale: Full scale
b) If the positive direction is up the page: ‒66 mm; 77 mm Scale: Full scale
5 a) 33 mm + 2,2 cm + 0,04 m + 15 mm
Scale: Full scale
Resultant = 11 cm b) 35 mm ‒ 31 mm + 76 mm – 14 mm Scale: Full scale
Resultant = 66 mm 6 a) 2 000 + 2 + 0,02 + 0,002 = 2 002,022 m
b) 35 + 76 – 31 – 14 = 66 mm

Chapter 1 Maths skills for Science
18
Challenges and projects (LB page 39)
1 Rate of flow Given: maximum time allowed = 8 seconds maximum allowed speed of water = 0,8 m/s distance = 9 m Unknown : time
Formula: speed = dt
t = d
speed (change the formula)
= 9
0,8 (substitute)
= 11,25 s The hot water will not get to the tap in 8 seconds. 2 Here is a rate problem that is not included in the Technical Sciences curriculum
but which you would be expected to do in Maths Given: mass at start = 65 kg; mass at end = 77 kg; time = 200 days Unknown: rate of gain of mass
Formula: rate of gain of mass = ( )mass at the end mass at the start
time−
= 77 65
200−
(substitute)
= 12200
= 0,06 kg per day
3 Investigate the rate of heat energy transfer along a metal rod
This is the first investigation in the book. It builds on work that learners have covered in Natural Sciences: in the senior phase learners observe conduction in a metal, here they can investigate the rate of heat transfer in the metal.
When learners reflect on their results they will see that the rate of heat transfer decreases along the bar. This is a good opportunity to talk informally about heat loss, radiation and the conservation of energy.
When learners reflect on how to improve the experiment, they should be guided towards thinking about:
a) the source of heat b) the layout of the apparatus c) the diameter, length and type of metal of the bar; perhaps, the type of wax d) the spacing of the paperclips
Chapter 2 Motion in one dimension
19
Chapter 2 Motion in one dimension Unit 2.1 Origin, position, distance and displacement 19 Unit 2.2 Speed and velocity 21 Unit 2.3 Acceleration 22 Experiment 1: Determine the velocity of alley 26 Challenges and projects 29
Unit 2.1 Origin, position, distance and displacement (LB page 41)
Activity 1 Position and reference points (LB page 42)
The positions must be given in relation to the reference point.
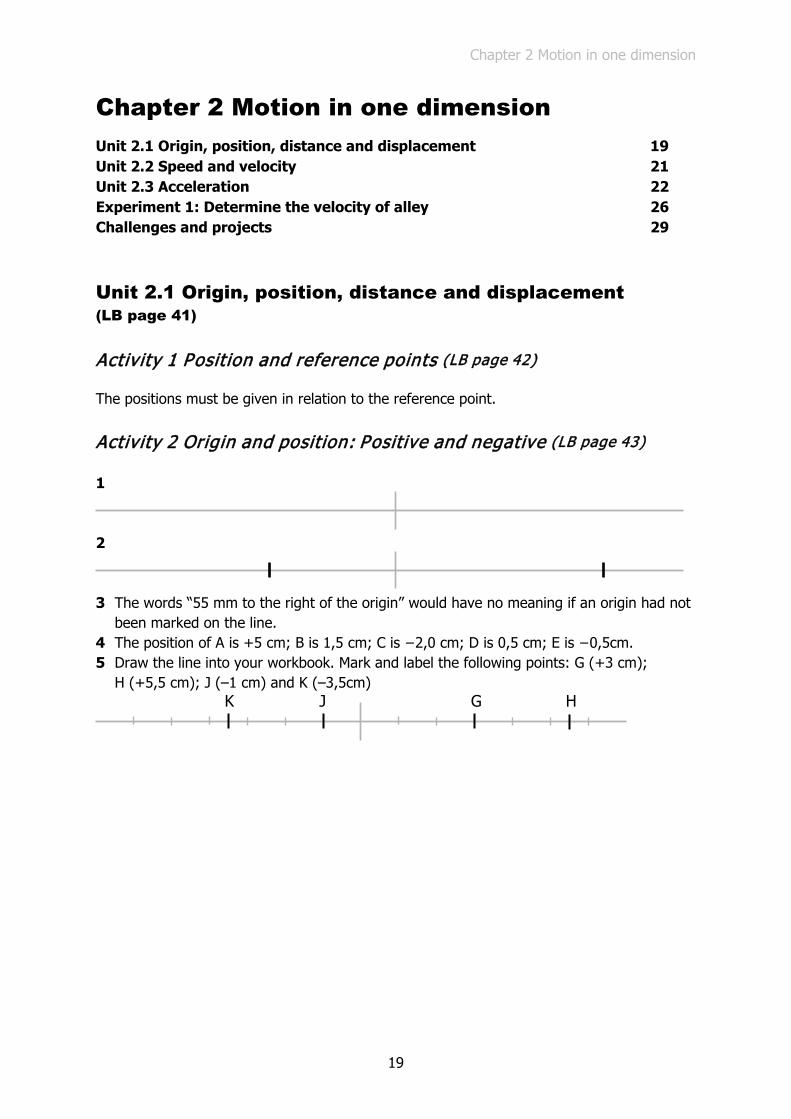
Activity 2 Origin and position: Positive and negative (LB page 43)
1
2
3 The words “55 mm to the right of the origin” would have no meaning if an origin had not been marked on the line.
4 The position of A is +5 cm; B is 1,5 cm; C is −2,0 cm; D is 0,5 cm; E is −0,5cm. 5 Draw the line into your workbook. Mark and label the following points: G (+3 cm);
H (+5,5 cm); J (‒1 cm) and K (‒3,5cm) K J G H
Chapter 2 Motion in one dimension
20
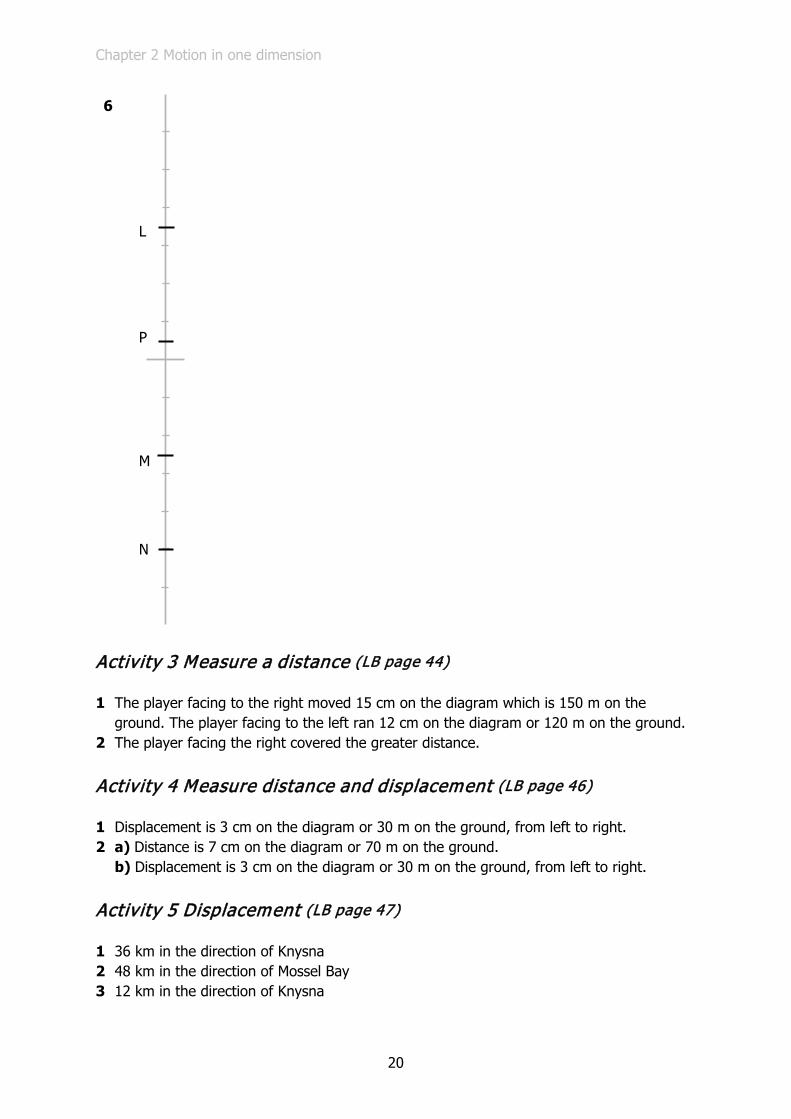
6
Activity 3 Measure a distance (LB page 44)
1 The player facing to the right moved 15 cm on the diagram which is 150 m on the ground. The player facing to the left ran 12 cm on the diagram or 120 m on the ground.
2 The player facing the right covered the greater distance.
Activity 4 Measure distance and displacement (LB page 46)
1 Displacement is 3 cm on the diagram or 30 m on the ground, from left to right. 2 a) Distance is 7 cm on the diagram or 70 m on the ground.
b) Displacement is 3 cm on the diagram or 30 m on the ground, from left to right.
Activity 5 Displacement (LB page 47)
1 36 km in the direction of Knysna 2 48 km in the direction of Mossel Bay 3 12 km in the direction of Knysna
L P M N

Chapter 2 Motion in one dimension
21
Unit 2.2 Speed and velocity (LB page 48)
Activity 6 Calculate speed (LB page 49)
1 Speed = distance
time =
40048
= 8,33 m/s
2 Speed = distance
time =
802
= 40 km/h
3 Time taken = 24 h and 23 min = 24 × 60 + 23 = 1 463 min Time in motion = 1 463 – 59 = 1 404 min or 23,4 h
Average speed = 1 46323,4 = 62,52 km/h
Activity 7 Calculate velocity, time and displacement (LB page 52)
1 v = dt
= 1,55
= 0,3 m/s forwards
2 d = vt = 4,2 × 5 = 21 m to the left
3 v = dt
= 2416
= 1,5 m/s to the right
4 t = dv
= 7619
= 4 s
5 d = vt = 0,75 × 20 = 15 m to the left
Activity 8 Use vector diagrams (LB page 53)
1 Scale: 1 cm = 2 m
Displacement is 7 cm to the left.
Velocity = dt
= 7
5+9 =
714
= 0,5 m/s to the left
2 Scale: 1 cm = 20 m
Displacement is 170 m forward.
Velocity = dt
= 170
20 16 12 18 22+ + + + = 1,93 m/s forward
3 a) Scale: 1 cm = 100 m
Displacement is 950 m north.

Chapter 2 Motion in one dimension
22
b) Total distance walking: d = 4 × 50 = 200 m
Time walking: t = dv
= 2002,5
= 80 s Total running distance: d = 950 – 200 = 750 m north
Time running: t = dv
= 7505
= 150 s Total time: t = 80 + 150
= 230 s
4 Month 1 1 1 1 1
About 10% 10 9 8,1 rounded down to 8
7,3 rounded down to 7
6,6 rounded up to 7
Remainder 90 81 73 66 59
Scale: 1 cm = 10%
The vector diagram illustrates that it will take between 4 and 5 years to reach 65%.
Unit 2.3 Acceleration (LB page 54)
Activity 9 Find the similarities and differences between some physical quantities (LB page 54)
1 All the physical quantities have magnitude but they don’t all have direction. 2 a) Distance and displacement are similar because they are measured in metres and they
both have magnitude. b) Distance and displacement are different because distance does not have direction
while displacement does have direction. c) Speed and velocity are similar because they are measured in metres per second and
they both have magnitude. d) Speed and velocity are different because speed does not have direction while velocity
does have direction.

Chapter 2 Motion in one dimension
23
e) Displacement, velocity and acceleration are similar because they all have magnitude and direction.
Activity 10 Calculate acceleration (LB page 56)
1 a = f iv vt−
= 72 24
12−
= 4812
= 4 m/s
2 a = f iv vt−
= 9 72 60−×
= 2
120 = 0,016 7 m/s
3 a = f iv vt−
= 9 01,5−
= 6 m/s
4 Given: d = 28 m; t = 5,6 s Unknown : v and a
Formula v = dt
= 285,6
= 5 m/s
Formula: a = f iv vt−
= 5 02,8−
= 1,79 m/s2
5 Convert: 120 km/h = 120 1000
3 600×
= 33,3 m/s
210 km/h = 210 1000
3 600×
= 58,3 m/s
Formula: a = f iv vt−
= ( )58,3 – 33,3
3,2
= 7,81 m/s2
6 a = f iv vt−
= 1000 00,001 2
− = 833 333,33 m/s2
Activity 11 Calculate time from the acceleration (LB page 57)
1 t = f iv va−
= 14 – 4
2 =
102
= 5 s
2 t = f iv va−
= 42,5 27,5
0,5−
= 150,5 = 30 s

Chapter 2 Motion in one dimension
24
3 Conversion: 100 km/h = 100 1000
3 600×
= 27,8 m/s
t = f iv va−
= 27,8 0
10−
=2,78 s
4 Conversion: 10 000 km/h = 10 000 1000
3 600×
= 2 780 m/s
t = f iv va−
= 2 780 0
30−
= 92,7 s
5 Conversion: 140 km/h = 140 1000
3 600×
= 38,9 m/s
280 km/h = 280 1000
3 600×
= 77,8 m/s
t = f iv va−
= 77,8
35−38,9
= 1,11 s
6 a = f iv vt−
= 60 00,01−
= 6 000 m/s
Activity 12 Calculate velocity from the acceleration (LB page 58)
1 vf = vi + at = 17 + 8,5 × 0,75 = 17 + 6,38 = 23,38 m/s 2 vi = vf – at = 2,75 – 0,25 × 2,5 = 2,75 – 0,625 = 2,125 m/s 3 vf = vi + at = 0 + 5 × 3,5 = 17,5 m/s 4 vf = vi + at = 0 + 3 × 10 = 30 m/s 5 vf = vi + at = 0 + 5,5 × 10 = 55 m/s 6 vf = vi + at = 0 + 200 × 0,2 = 40 m/s
Activity 13 Calculation w ith conversion (LB page 59)
1 a) 879 mm = 879
1000 = 0,879 m
b) 1 001 001 m = 1001001
1000 = 1 001 km
c) 2345 cm = 2 345100
= 23,45 m
d) 9 009 009 cm = 9 009 009100 1000× = 90,090 09 km
e) 1009 km = 1009 × 1000 = 1 009 000 m f) 0,019 km = 0,019 × 1 000 = 19 m g) 6,5 h = 6,5 × 60 = 390 min h) 6 h + 20 min = 6 × 60 × 60 + 20 × 60 = 22 800 s i) 87 min = 1 h + 27 min
j) 197 min = 19760
= 3,28 h
Chapter 2 Motion in one dimension
25
2 a) 10 km/h = 10 1000
3 600×
= 2,78 m/s
b) 141 km/h = 141 1000
3 600×
= 39,17 m/s
c) 50,25 km/h = 50,25 1000
3 600×
= 13,96 m/s
3 a) 13 m/s = 13 600
1000×3
= 46,8 km/h
b) 149 m/s = 149 600
1000×3
= 536,4 km/h
c) 15,15 m/s = 15,15 600
1000×3
= 54,54 km/h
4 30 km/h = 30 1000
3 600×
= 8,33 m/s
330 km/h = 330 1000
3 600×
= 91,6 m/s
a = f iv vt−
= 91,6 8,33
10−
= 8, 33 m/s2
5 Convert: 10 km/h = 10 1000
3 600×
= 2,78 m/s
vi = vf – at = 2,78 – (0,3 × 5) = 1,28 m/s 6 vf = vi + at = 0 + (0,2 × 42) = 8,4 m/s
Convert: 8,4 m/s = 8,4 3 600
1000×
= 30,24 km/h
7 vf = vi + at = 0 + (0,5 × 30) = 15 m/s
Convert: 15 m/s = 3 600
100015×
= 54 km/h
8 vf = vi + at = 0 + (2,5 × 12) = 30 m/s
Convert: 30 m/s = 3 600
100030×
= 108 km/h
Activity 14 Acceleration can be positive or negative (LB page 62)
1 a = f iv vt−
= 2,1
17,5−0,5
= 0,091 4 m/s2
2 t = f iv va−
= 12,5
2,5−175
− = 65 s
3 vf = vi + at = 16 + (−2,0 × 8) = 16 – 16 = 0 m/s
4 a = f iv vt−
= 2 0,5)
17− − (−
= 2 0,5
17− +
= 0,088 2 m/s2
Chapter 2 Motion in one dimension
26
5 t = f iv va−
= 15 ( 3)
1,5− − −
− =
121,5−−
= 8 s
6 a = f iv vt−
= 2,5
5−15,5
= 135−
= −2,6 m/s
7 Convert: 45 km/h = 45 1000
3 600×
= 12,5 m/s
a = f iv vt−
= 0 16,2
2−
= 16,22
− = −8,1 m/s
8 Negative acceleration of the taxi in front is greatest, therefore it slowed down fastest, so there probably was an accident.
Activity 15 Work w ith ticker-tape (LB page 65)
1 a) Each strip represents 0,5 s b) It means that the object was moving at a constant speed.
c) It means that the objects started slowly and that its speed increased. d) It means that the object slowed down near the end of its journey.
2 The tape might have got stuck. The slope of the board might have changed.
Experiment 1: Determine the velocity of a trolley (LB page 66)
This is the first of ten experiments that will be assessed informally using the Record of Assessment and the Assessment Rubric for Experiments on the following pages.
At this stage of the year the learners must be encouraged/enabled to:
• work independently of other groups and the teacher
• buy into the scientific process as a mode of working when doing experiments and investigations
• understand the need satisfy the requirements of the Record of Assessment and the Assessment Rubric for Experiments
This apparatus is more usually used to determine acceleration so the educator should be wary about making assumptions about the method.
Learners must understand how to work out velocity from a strip of ticker-tape, so the previous activity (Work with ticker-tape) can be revisited with different input data until leaners understand.

Chapter 2 Motion in one dimension
27
Record of Assessment of Experiment 1: Determine the velocity of a trolley
Work assessed Checklist
for tick or cross
Mark
awarded
1 to 4
Weighting of the mark
Possible mark Mark
1 Describe the experiment 0,5 2
Give the experiment a name
Describe the concept you intend to prove
Describe what you need to do to prove the theory
2 Plan the experiment 0,5 2
Describe the variables and the constants
Write a list the materials, equipment or other resources
Write the method
Share the tasks amongst the group
Draw up a table for the results
Decide how to use the data
3 Do the experiment 2 8
Do the experiment as planned
Work safely, considerately and conservatively
4 Capture the data to create information: observe, record and comment 1 4
5 Draw a conclusion 0.5 2
6 Recommend improvements 0,5 2
Total 20

Chapter 2 Motion in one dimension
28
Assessment Rubric for Experiments
Work assessed Level 1 Level 2 Level 3 Level 4
1 Describe the experiment
Fails to identify the concept to be proved clearly enough to proceed.
Identifies the concept to be proved vaguely or inaccurately.
Identifies the concept to be proved clearly.
Identifies the concept to be proved unambiguously.
2 Plan the experiment
Plans materials, equipment and steps required to prove the concept with omissions or errors that will rule out a successful investigation.
Plans materials, equipment and steps required to prove the concept with workable errors or omissions.
Plans materials, equipment and steps required to prove the concept well.
Plans materials, equipment and steps required to prove the concept meticulously.
3 Do the experiment
Fails to carry out the experiment effectively.
Carries out the experiment with acceptable errors or omissions.
Carries out the experiment effectively.
Carries out the experiment effectively and efficiently.
4 Capture the data to create information: observe, record and comment
Observes erratically and comments insignificantly about phenomena.
Observes with insufficient care and offers limited comment about phenomena.
Observes carefully and comments significantly about phenomena.
Observes perceptively and comments extensively about phenomena.
5 Draw a conclusion
Fails to draw a meaningful conclusion supported by the results.
Draws a vague conclusion or one that is not well supported by the results.
Draws a conclusion that is supported by the results.
Draws a comprehensive or insightful conclusion that is supported by the results.
6 Recommend improvements
Makes unconsidered or flippant recommendations.
Makes reasonable recommendations.
Makes well-reasoned, realistic recommendations.
Makes recommendations that reflect insight regarding both the concept and the scientific process.

Chapter 2 Motion in one dimension
29
Challenges and projects (LB page 68)
Challenge number 1
1 Given: total time = 30 s Unknown: fast time Formula: total time = 2 × slow time + 2 × medium time + fast time fast time = total time – 2 × slow time ‒ 2 × medium time (change the subject) fast time = 30 – 2 × 4 − 2 × 6 (substitute) = 10 s 2 Given: v = 0,4 m/s; t = 10 s; direction from A to B Unknown : displacement
Formula: v = dt
d = v t (change the subject) = 0,4 × 10 (substitute) = 4 m in direction A to B 3 Given: vslow = 0,05 m/s; tslow = 4 s; vmedium = 0,2 m/s; tmedium = 6 s; dfast = 4 m Unknown: displacement Formula: dAB = 2 × dslow + 2 × dmedium + dfast = 2 × vslow tslow + 2 × vmedium tmedium + dfast = 2 × 0,05 × 4 + 2 × 0,2 × 6 + 4 (substitute) = 6,8 m in the direction from A to B 4 Given: t = 30; dAB = 6,8 m; direction A to B Unknown: velocity
Formula: v = dt
= 6,830
(substitute)
= 0,23 m/s in the direction A to B
Challenge number 2
1 Given: vAB = 80 mm/min; tAB = 4 min; vBC = 60 mm/min; tBC = 2 min Unknown: dAC Formula: d = v × t dAB = vAB × tAB
= 80 × 4 dBC = vBC × tBC
= 60 × 2 = 120 mm So: dAC = 120 + 320 = 440mm
Chapter 2 Motion in one dimension
30
2 Given: dAC = 440 mm; tAB = 4 min; tBC = 2 min Unknown: v
Formula: v = dt
= AC
AB BC
dt t+
= 4404 2+
= 73,3 mm/min 3 We do not know time from C to B. Given: dCB = dBC = 120 mm; vCB = 100 mm/min Unknown: tCB
Formula: tCB = CB
CB
dv
= 120100
= 1,2 min The velocity of the whole process is the displacement from A to B (which we know), over
the total time.
Unknown: vProcess = Final
Process
dt
= AB
AB BC CB
dt t t+ +
= 320
4 2 1, 2+ +
= 44,4 mm/min
Challenge number 3
1 a) From origin to the start of the line b) From pen up to pen down c) From start of line to end of the line d) From pen up to pen up. e) From end of the line to the start of the line
2 a) about 2 cm b) about 8 cm c) about 10 cm
3 a) 2 cm to the right b) 2cm down c) 8cm to the right d) 2cm up e) 10 cm to the left

Chapter 2 Motion in one dimension
31
4 a) distance = 2 cm = 20 mm
steps to draw a 20 mm line = 2030
× 200 = 133,3 steps
b) distance = 8 cm = 80 mm
steps to move 80 mm = 8030
× 200 = 534 steps
c) distance = 10 cm = 100 mm
steps to draw a 100 mm line = 10030
× 200 = 666 steps

Chapter 3 Forces
32
Chapter 3 Forces Unit 3.1 Introduction to forces 32 Unit 3.2 Kinds of forces 32 Experiment 2: Estimate and measure the weight of various objects 33 Unit 3.3 Force diagrams and free body diagrams 35 Unit 3.4 Resultant, equilibrant and equilibrium 40 Experiment 3: Show that the resultant and equilibrant are equal 47
Unit 3.1 Introduction to forces (LB page 71)
Quick Activity (LB page 72)
The aim of this activity is to demystify forces: all forces are either pushes or pulls.
Activity 1 Practise measuring masses using different scales (LB page 74)
The objective of this activity is to give practice in using appropriately sized scales.
Activity 2 Calculate weight (LB page 77)
1 A trailer with a mass of 1 000 kilograms weighs 1 000 × 9,8 = 9 800 N = 9,8 kN 2 A first team prop forward of mass 101,9 kilograms weighs 101,9 × 9,8 = 998,62 N 3 1 gram= 0,001 kilograms, so 50 g = 50 × 0,001 kg. Then 50 grams of sugar weighs
50 × 0,001 × 9,8 = 0,490 N. Remind learners: always convert grams to kilograms. In general, they must remember to convert smaller units to their fundamental units in the metre-kilogram-second system (the MKS system).
4 8 milligrams of any substance has a mass of 8 × 0,000 001 kg. Therefore 8 milligrams of sodium bicarbonate weighs 8 × 10−6 × 9,8 = 7,84 N × 10−5
5 A 4 525 kg drop forge weighs 4 525 × 9,8 = 44 345 N = 44,345 kN 6 An 8 tonne truck (1 tonne = 1 000 kg) = 8 × 1 000 × 9,8 = 78 400 N = 78,4 kN 7 1 milligram of anything has a mass of 0,000 001 kg or 10−6 kg. Therefore 0,1 milligrams
of arsenic = 0,1 × 10−6 × 9,8 = 9,8 × 10⁻⁷ N 8 My own mass (about 65 kg) = 65 × 9,8 = 637 N or 640 N
Unit 3.2 Kinds of forces (LB page 78)
Activity 3 Review how to use a spring balance (LB page 88)
The objective of this activity is to enable learners to use scales without supervision and get reliable results.

Chapter 3 Forces
33
Experiment 2: Estimate and measure the weight of various objects (LB page 88)
This is the second of ten experiments that will be assessed informally.
Record of Assessment of Experiment 2: Measure the weight of various objects using a spring balance
Work assessed Checklist for tick or cross
Mark awarded 1 to 4
Weighting of the mark
Possible mark Mark
1 Describe the experiment 0,5 2
Give the experiment a name
Describe the concept you intend to prove
Describe what you need to do to prove the theory
2 Plan the experiment 0,5 2
Describe the variables and the constants
Write a list the materials, equipment or other resources
Write the method
Share the tasks amongst the group
Draw up a table for the results
Decide how to use the data
3 Do the experiment 2 8
Do the experiment as planned
Work safely, considerately and conservatively
4 Capture the data to create information: observe, record and comment 1 4
5 Draw a conclusion 0,5 2
6 Recommend improvements 0,5 2
Total 20

Chapter 3 Forces
34
Assessment Rubric for Experiments
Work assessed Level 1 Level 2 Level 3 Level 4
1 Describe the experiment
Fails to identify the concept to be proved clearly enough to proceed.
Identifies the concept to be proved vaguely or inaccurately.
Identifies the concept to be proved clearly.
Identifies the concept to be proved unambiguously.
2 Plan the experiment
Plans materials, equipment and steps required to prove the concept with omissions or errors that will rule out a successful investigation.
Plans materials, equipment and steps required to prove the concept with workable errors or omissions.
Plans materials, equipment and steps required to prove the concept well.
Plans materials, equipment and steps required to prove the concept meticulously.
3 Do the experiment
Fails to carry out the experiment effectively.
Carries out the experiment with acceptable errors or omissions.
Carries out the experiment effectively.
Carries out the experiment effectively and efficiently.
4 Capture the data to create information: observe, record and comment
Observes erratically and comments insignificantly about phenomena.
Observes with insufficient care and offers limited comment about phenomena.
Observes carefully and comments significantly about phenomena.
Observes perceptively and comments extensively about phenomena.
5 Draw a conclusion
Fails to draw a meaningful conclusion supported by the results.
Draws a vague conclusion or one that is not well supported by the results.
Draws a conclusion that is supported by the results.
Draws a comprehensive or insightful conclusion that is supported by the results.
6 Recommend improvements
Makes unconsidered or flippant recommendations.
Makes reasonable recommendations.
Makes well-reasoned, realistic recommendations.
Makes recommendations that reflect insight regarding both the concept and the scientific process.
Chapter 3 Forces
35
Activity 4 Compare the weight to the mass of various objects (LB page 89)
The magnitude of weight is the magnitude of mass × 9,8.
Or, the weight of an object in newtons is equal to 9,8 times the mass in kilograms.
Unit 3.3 Force diagrams and free body diagrams (LB page 90)
How to construct a force diagram
• Draw the physical situation. • Identify all the forces that act on the object of interest – if just one force is not
identified, the diagram is not accurate. • Determine the magnitude and direction of each force. • Draw an arrow to represent each force. Each arrow must:
o point in the right direction o have its tail at the point of application o act along the right line (usually normal/perpendicular to one of the surfaces) o be the right size (the bigger the force, the longer the arrow) o have an appropriate descriptive name.
How to construct a free body diagram
• A free body diagram is drawn to scale and is based on the force diagram, but it is drawn only for the object of interest.
• The object of interest is represented by a dot. • Arrows are drawn with their tails on the dot, pointing outwards in.
Online resource for free body diagrams: http://www.physicsclassroom.com/Physics-Interactives/Newtons-Laws/Free body-Diagrams
Chapter 3 Forces
36
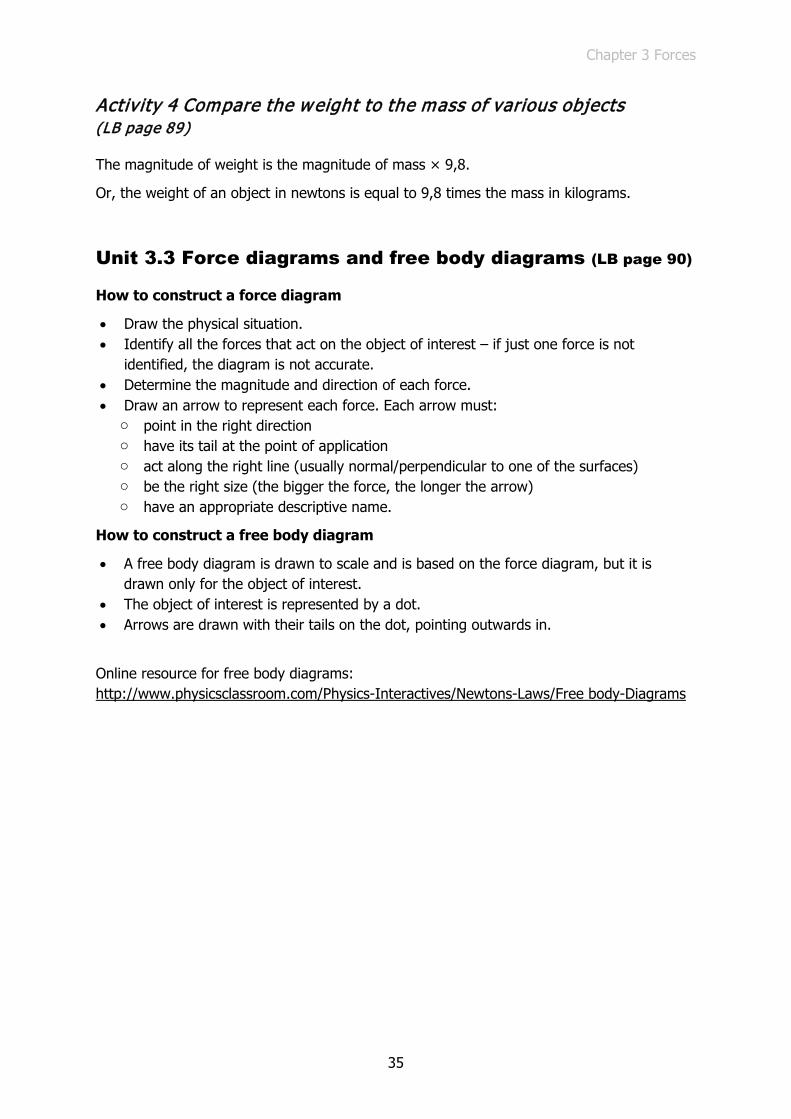
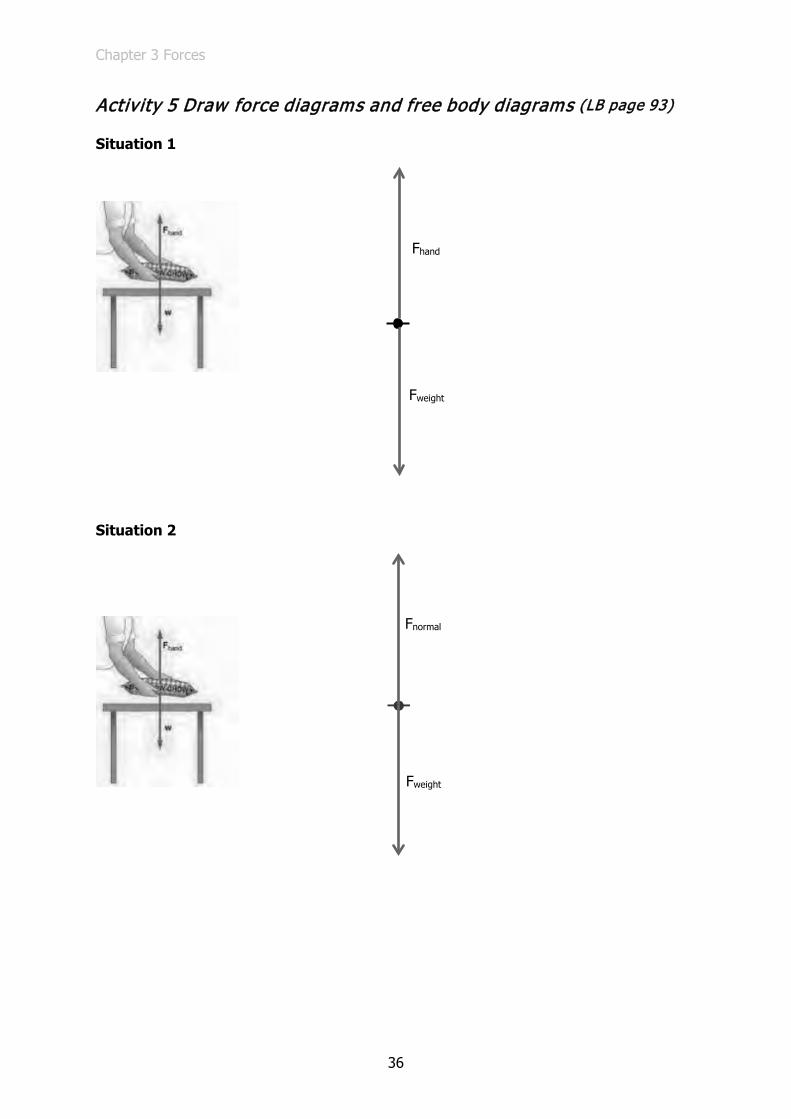
Activity 5 Draw force diagrams and free body diagrams (LB page 93)
Situation 1
Situation 2
Fhand
Fweight
Fweight
Fnormal

Chapter 3 Forces
37
Situation 3
Activity 6 Draw free body diagrams (LB page 93)
1
Ftable contact
Fweight battery
Fweight bag
Fcontact floor
Fweight table
Fweight table
Fcontact floor
Fweight bag

Chapter 3 Forces
38
2
3 a)
b)
Fupthrust force of water
Fweight egg
Fcontact small on big
Fweight little box
Fcontact big box on scale
Fweight big box
Fweight little box
Chapter 3 Forces
39
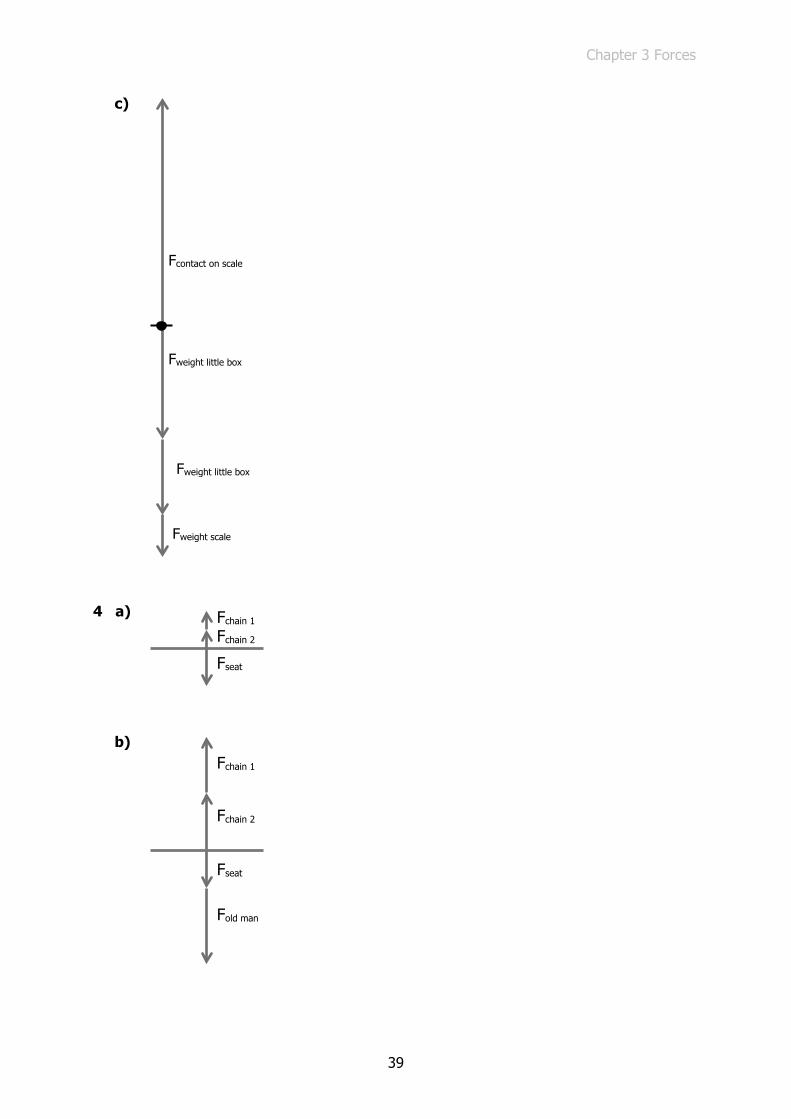
c)
4 a)
b)
Fcontact on scale
Fweight little box
Fweight little box
Fweight scale
Fchain 2 Fchain 1
Fseat
Fchain 2
Fchain 1
Fseat
Fold man

Chapter 3 Forces
40
5 a)
b)
Unit 3.4 Resultant, equilibrant and equilibrium (LB page 94)
Activity 7 Determine resultant force (LB page 95)
1 a) Graphical: Scale 1cm = 5 N
b) Calculation: Resultant = 5 N
Fbar reaction
Fgymnast
Frope 2
Frope 1
Fbar
Fgymnast
Chapter 3 Forces
41
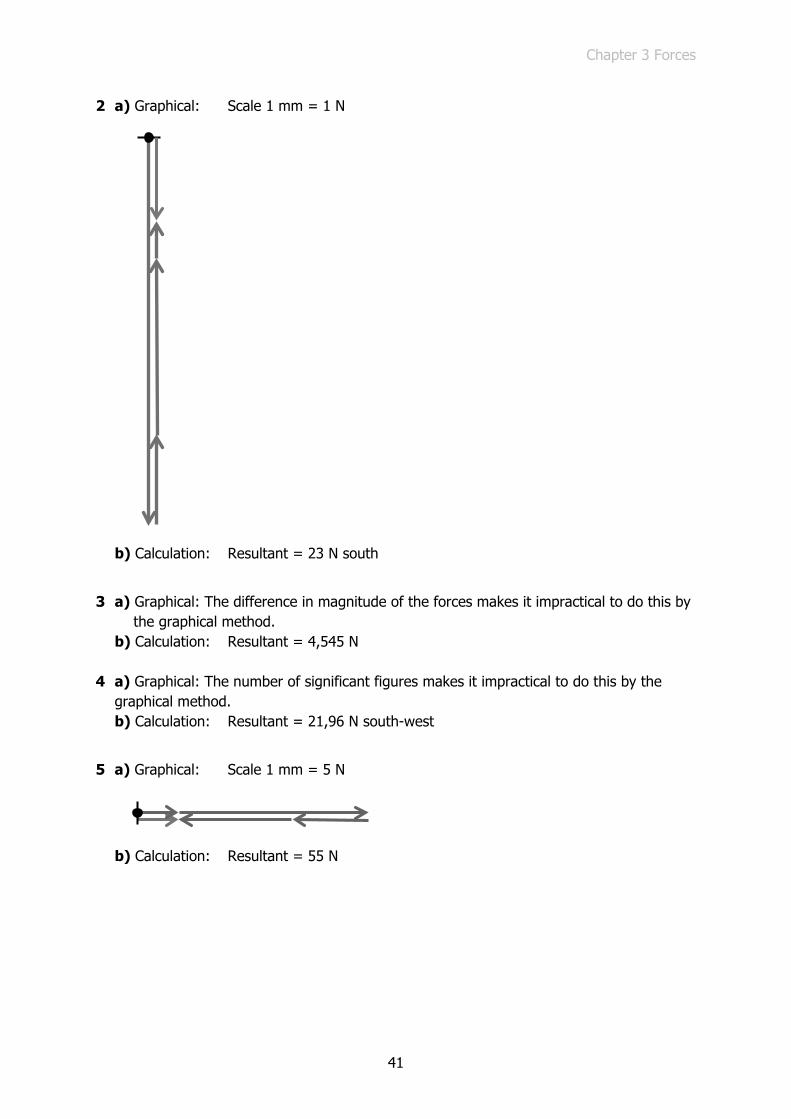
2 a) Graphical: Scale 1 mm = 1 N
b) Calculation: Resultant = 23 N south
3 a) Graphical: The difference in magnitude of the forces makes it impractical to do this by the graphical method.
b) Calculation: Resultant = 4,545 N
4 a) Graphical: The number of significant figures makes it impractical to do this by the graphical method. b) Calculation: Resultant = 21,96 N south-west
5 a) Graphical: Scale 1 mm = 5 N
b) Calculation: Resultant = 55 N

Chapter 3 Forces
42
6 a) Graphical: Scale 1mm = 0,01 N
b) Calculation: Resultant = 0,37 N north-east
Chapter 3 Forces
43
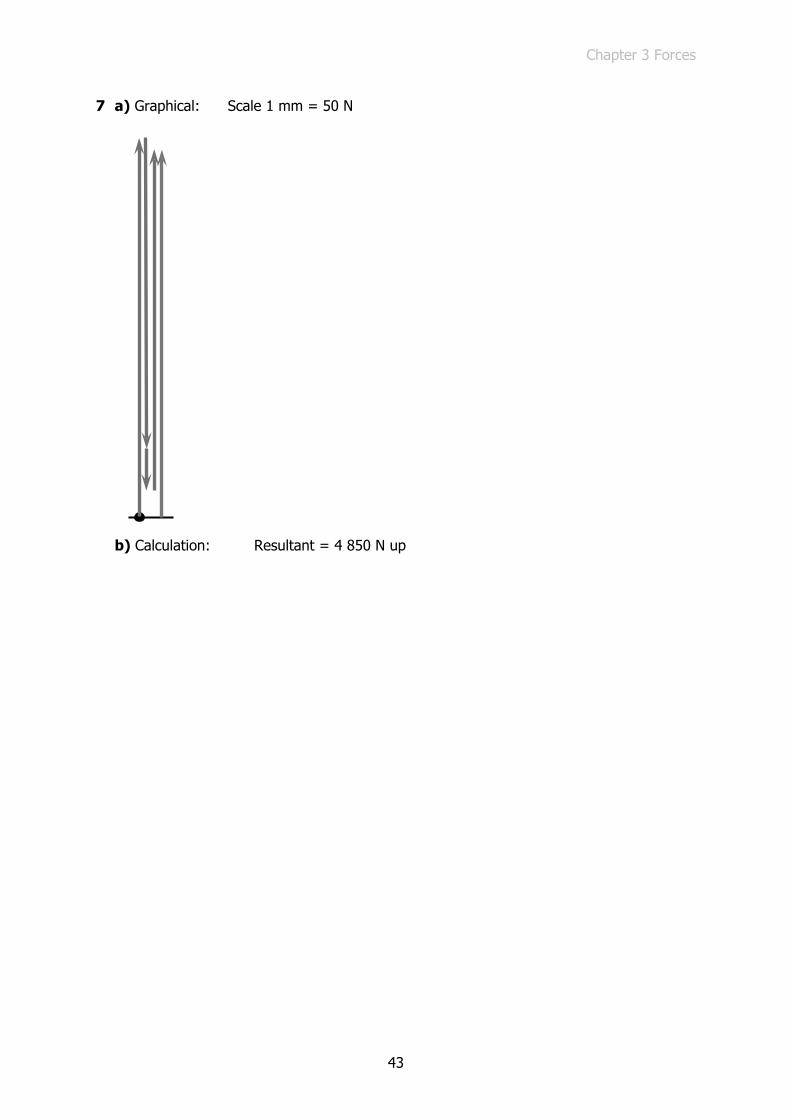
7 a) Graphical: Scale 1 mm = 50 N
b) Calculation: Resultant = 4 850 N up

Chapter 3 Forces
44
8 a) Graphical: Scale 1 cm = 1 N
b) Calculation: Resultant = 10 N north
Activity 8 Determine the equilibrant (LB page 96)
1 a) Graphical: Scale 1 cm = 4 N
b) Calculation: Equilibrant = +4 N
Chapter 3 Forces
45
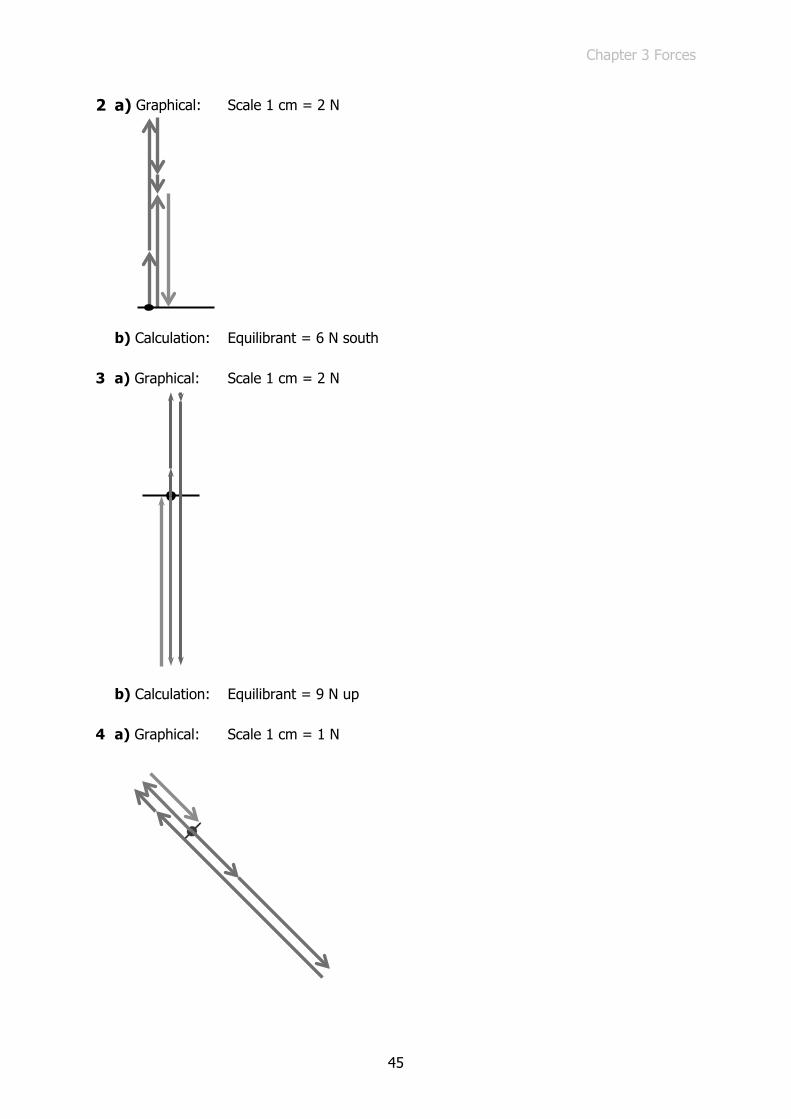
2 a) Graphical: Scale 1 cm = 2 N
b) Calculation: Equilibrant = 6 N south 3 a) Graphical: Scale 1 cm = 2 N
b) Calculation: Equilibrant = 9 N up 4 a) Graphical: Scale 1 cm = 1 N

Chapter 3 Forces
46
b) Calculation: Equilibrant = 1,8 N south-east
5 a) Graphical: Scale 1 cm = 0,2 N
b) Calculation: +0,4 N
6 a) Graphical: Scale 1 cm = 2 N
b) Calculation: Equilibrant = 2,2 N south 7 a) Graphical: Scale 1 cm = 100 N
b) Calculation: Equilibrant = 340 N south
Chapter 3 Forces
47
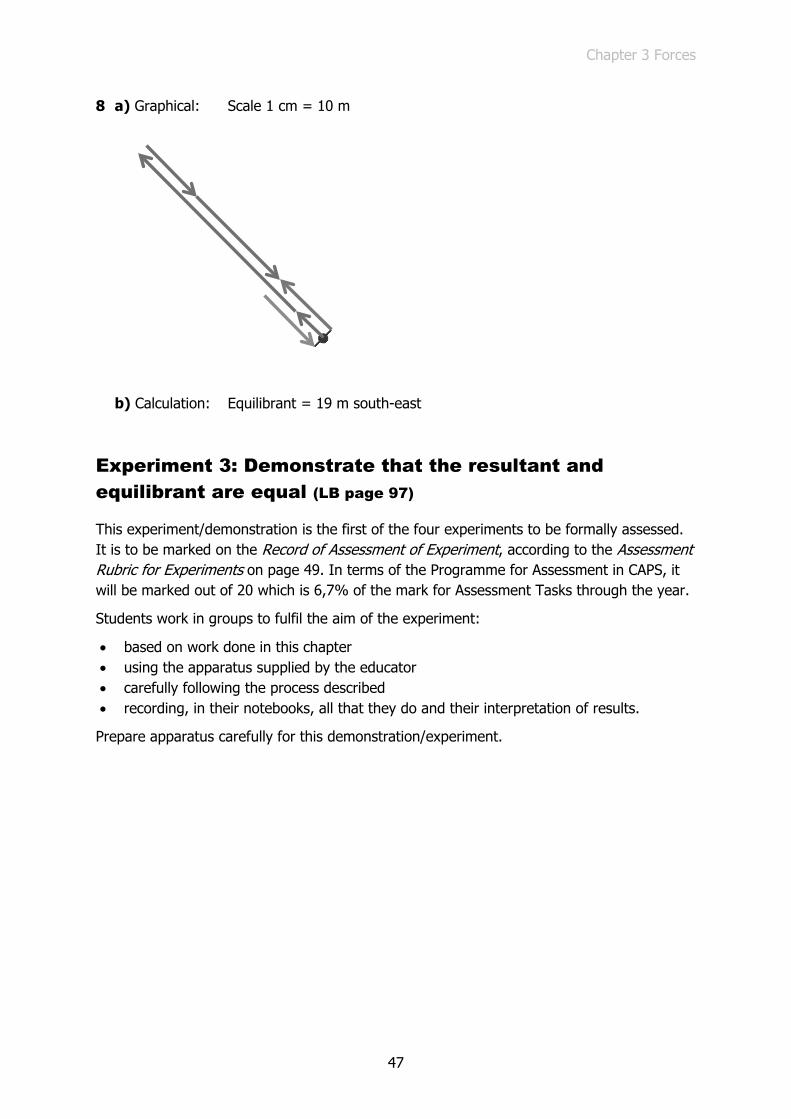
8 a) Graphical: Scale 1 cm = 10 m
b) Calculation: Equilibrant = 19 m south-east
Experiment 3: Demonstrate that the resultant and equilibrant are equal (LB page 97)
This experiment/demonstration is the first of the four experiments to be formally assessed. It is to be marked on the Record of Assessment of Experiment, according to the Assessment Rubric for Experiments on page 49. In terms of the Programme for Assessment in CAPS, it will be marked out of 20 which is 6,7% of the mark for Assessment Tasks through the year.
Students work in groups to fulfil the aim of the experiment:
• based on work done in this chapter • using the apparatus supplied by the educator • carefully following the process described • recording, in their notebooks, all that they do and their interpretation of results.
Prepare apparatus carefully for this demonstration/experiment.
Chapter 3 Forces
48
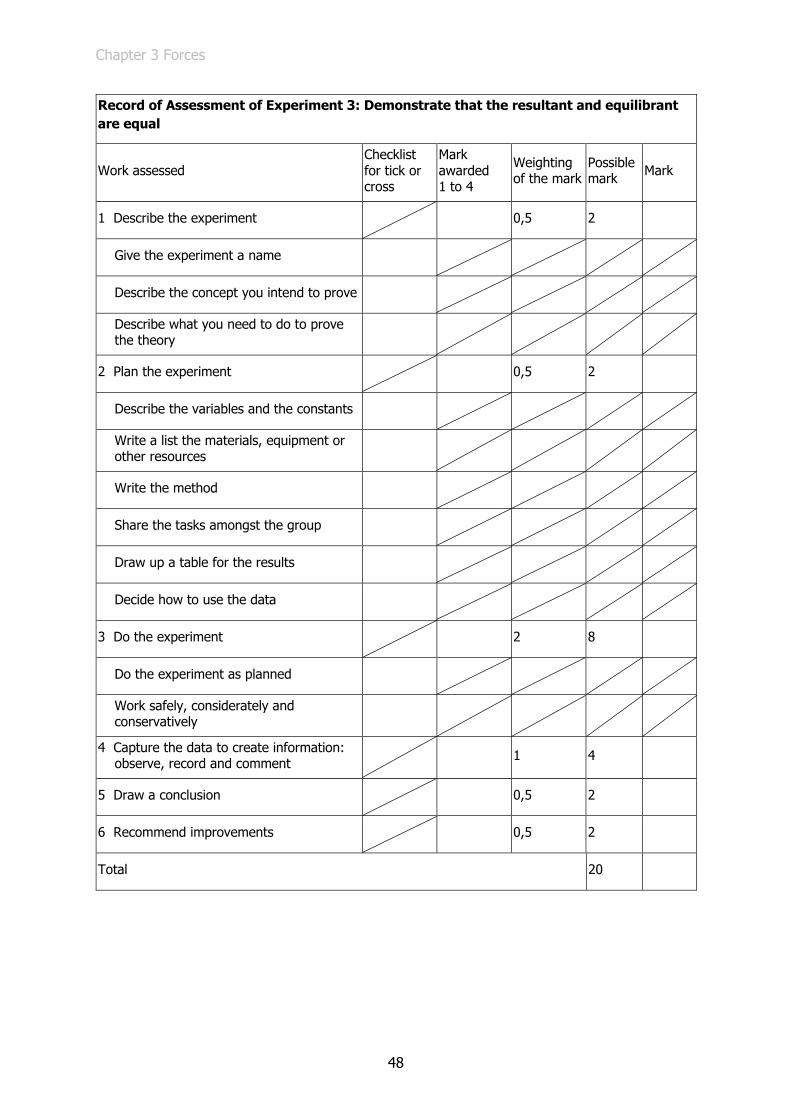
Record of Assessment of Experiment 3: Demonstrate that the resultant and equilibrant are equal
Work assessed Checklist for tick or cross
Mark awarded 1 to 4
Weighting of the mark
Possible mark Mark
1 Describe the experiment 0,5 2
Give the experiment a name
Describe the concept you intend to prove
Describe what you need to do to prove the theory
2 Plan the experiment 0,5 2
Describe the variables and the constants
Write a list the materials, equipment or other resources
Write the method
Share the tasks amongst the group
Draw up a table for the results
Decide how to use the data
3 Do the experiment 2 8
Do the experiment as planned
Work safely, considerately and conservatively
4 Capture the data to create information: observe, record and comment 1 4
5 Draw a conclusion 0,5 2
6 Recommend improvements 0,5 2
Total 20
Chapter 3 Forces
49
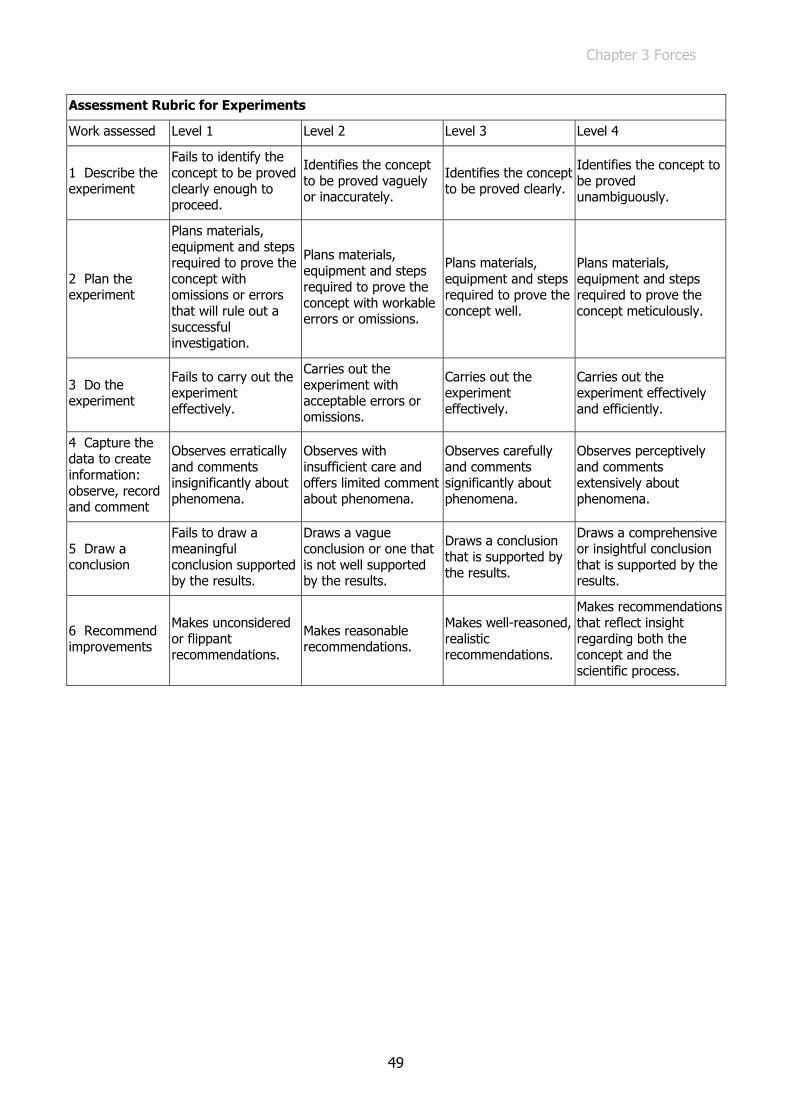
Assessment Rubric for Experiments
Work assessed Level 1 Level 2 Level 3 Level 4
1 Describe the experiment
Fails to identify the concept to be proved clearly enough to proceed.
Identifies the concept to be proved vaguely or inaccurately.
Identifies the concept to be proved clearly.
Identifies the concept to be proved unambiguously.
2 Plan the experiment
Plans materials, equipment and steps required to prove the concept with omissions or errors that will rule out a successful investigation.
Plans materials, equipment and steps required to prove the concept with workable errors or omissions.
Plans materials, equipment and steps required to prove the concept well.
Plans materials, equipment and steps required to prove the concept meticulously.
3 Do the experiment
Fails to carry out the experiment effectively.
Carries out the experiment with acceptable errors or omissions.
Carries out the experiment effectively.
Carries out the experiment effectively and efficiently.
4 Capture the data to create information: observe, record and comment
Observes erratically and comments insignificantly about phenomena.
Observes with insufficient care and offers limited comment about phenomena.
Observes carefully and comments significantly about phenomena.
Observes perceptively and comments extensively about phenomena.
5 Draw a conclusion
Fails to draw a meaningful conclusion supported by the results.
Draws a vague conclusion or one that is not well supported by the results.
Draws a conclusion that is supported by the results.
Draws a comprehensive or insightful conclusion that is supported by the results.
6 Recommend improvements
Makes unconsidered or flippant recommendations.
Makes reasonable recommendations.
Makes well-reasoned, realistic recommendations.
Makes recommendations that reflect insight regarding both the concept and the scientific process.
Chapter 3 Forces
50
Activity 9 Demonstrate equilibrium (in two dimensions) (LB page 100)
The aim of this demonstration is to give learners an opportunity to “feel” when a system of forces in two dimensions is in equilibrium, to “feel” when it is out of equilibrium, and to “feel” when it returns to equilibrium again.
Activity 10 Demonstrate equilibrium in one dimension (LB page 101)
The aim of this demonstration is to give learners an opportunity to use their experience of Activity 9 to design a demonstration of equilibrium of forces on one dimension.
Activity 11 Calculate the equilibrant (LB page 101)
1 a) 5 N down b) −1 N c) 2 N south d) 1,6 N south-east e) −20 N f) 15 N down g) 820 N north-west h) 0,9 N north
Chapter 4 Moment of a force
51
Chapter 4 Moment of a force Unit 4.1 Moment: The turning effect of a force 51 Unit 4.2 Torque 52 Unit 4.3 Law of Moments 53 Experiment 4: Prove the Law of Moments 55
Unit 4.1 Moment: The turning effect of a force (LB page 103)
Quick Act iv ity: Feel a turning effect (LB page 103)
The objective of this Quick Activity is to give learners an intuitive understanding of the turning effect of a force: that the greater the distance from the fulcrum to the force, the greater the turning effect.
Act iv ity 1 Calculate Moments (LB page 109)
1 a) M = F × d = 400 × 0,2 = 80 Nm anti-clockwise b) M = F × d = 1 200 × 2,5 = 3 000 Nm anti-clockwise c) M = F × d = 0,03 × 0,05 = 0,001 5 Nm clockwise
2 M = F × d = 0,33 × 303 = 0,999 9 Nm anti-clockwise
3 M = F × d = 15 × 3,33 = 49,95 Nm clockwise
4 M = F × d = 0,25 × 0,25 = 0,062 5 Nm anti-clockwise
5 a) M = F × d = 2 × 2 = 4 kNm clockwise b) M = F × d = 0,4 × 0,8 = 0,32 kNm anti-clockwise c) M = F × d = 2 002 × 1,1 = 2 202,2 Nm clockwise d) M = F × d = 0,01 × 0,1 = 0,001 kNm anti-clockwise
6 a) MCW = 50 × 3 = 150 Nm clockwise MACW = 60 × 2 = 120 Nm anti-clockwise The beam will rotate clockwise
b) MCW = 1 100 × 1 = 1 100 Nm clockwise MACW = 600 × 2 = 1 200 Nm anti-clockwise The beam will rotate anti-clockwise.
7 Tell the learners to first work out the turning moment that keeps the trapdoor closed: Mdoor = F × d = 300 × 0,4 = 120 Nm The turning moment that will open the door must be greater than 120 Nm.
MD = F × d = 210 × 0,55 = 115,5 Nm ME = F × d = 190 × 0,65 = 123,4 Nm Therefore FE will have the biggest turning effect, and FE will be able to open the trapdoor.

Chapter 4 Moment of a force
52
8 a) MCW = MACW
W × 0,3 = 25 × 0,4
W = 25 × 0,40,3
= 33,33 N
b) MCW = MACW y × 22 = 47 × 0,26
y = 47 0,26
22×
y = 0,56 m
9 The board will get blown over if the moment caused by the wind is greater than the moment that can be resisted by the foundations of the board. A very strong wind will cause a greater force on the board, and a greater moment to be resisted by the foundations, than the gentle breeze.
Unit 4.2 Torque (LB page 112)
Activ ity 2 Calculate Torque (LB page 117)
1 a) τ = F × r⊥ = 6 × 0,5 = 3 Nm
b) τ = F × r⊥ = 3,33 × 0,303 = 1,009 Nm
c) τ = F × r⊥ = 1 230 × 6,5 = 7 995 Nm
d) τ = F × r⊥ = 16 × 0,05 = 0,8 Nm
2 a) r⊥ = τF
= 255
= 5 m
b) F = τr⊥
= 2555,1
= 50 kN
c) F = τr⊥
= 0,660,2
= 3,3 N
d) r⊥ = τF
= 9,6888
= 0,11 m
3 r⊥ = τF
= 70400
= 0,175 m
4 a) τ = F × r⊥ = 200 × 0,8 = 160 Nm b) τ = F × r⊥ = 300 × 0,25 = 75 Nm
5 Tell the learners to imagine the spring as a large newton spring-scale like the ones they have used in their experiment. Assume that the mechanic pulls the spring out to its full extension. That way, the mechanic always knows how much force he is applying (100 N) and he can adjust the length of the torque arm to get the torque he wants. a) r⊥ = τ ÷ F = 25 ÷ 100 = 0,25 m
b) r⊥ = τ ÷ F = 10 ÷ 100 = 0,1 m
Chapter 4 Moment of a force
53
6 a) F = τr⊥
= 300 ÷ 0,5 = 600 N
b) If the bank manager is able to hang onto the handle and lift her feet off the ground, she will be able to open the safe.
7 Given: τ = 1 000 Nm; r⊥ = 0,7 5m; there are 8 blades on the fan Unknown : Force on each blade
Formula: F = τr⊥
F = 10000,75
(substitute)
= 1 333 N
Force exerted by one blade: F1 = 1333
8 = 166,63 N
Unit 4.3 Law of Moments (LB page 118)
Act iv ity 3 Balance moments (LB page 118)
This activity is done in preparation for Experiment 4: Prove the Law of Moments.
The objective of this activity is to give learners an opportunity to physically balance a beam using different combinations of masses; to develop an intuitive understanding of where to position different masses to balance a beam.
NOTE: If the hole for the pivot in the metre-rule is drilled closer to one edge than the other, the rule will balance more easily.
Act iv ity 4 Apply the Law of Moments (LB page 122)
1 MCW = MACW
400 × 3 = F × 2
F = 400 3
2×
= 600 N
Make sure the learners notice that the weight of the beam does not affect the answer.
2 The beam is balanced at its midpoint. Give the learners a clue if they need it: if they can work out the length to the right of the fulcrum then they need only double that answer to get the whole length, L.
MCW = MACW
30 × L2
= 40 × 1,5
L = 40 × 1,5 × 2
30 = 4 m
Chapter 4 Moment of a force
54
3 a) d = 0,5 m b) MCW = MACW
200 × 0,5 = FR × 3
FR = 200 0,5
3×
= 33,3 N upwards
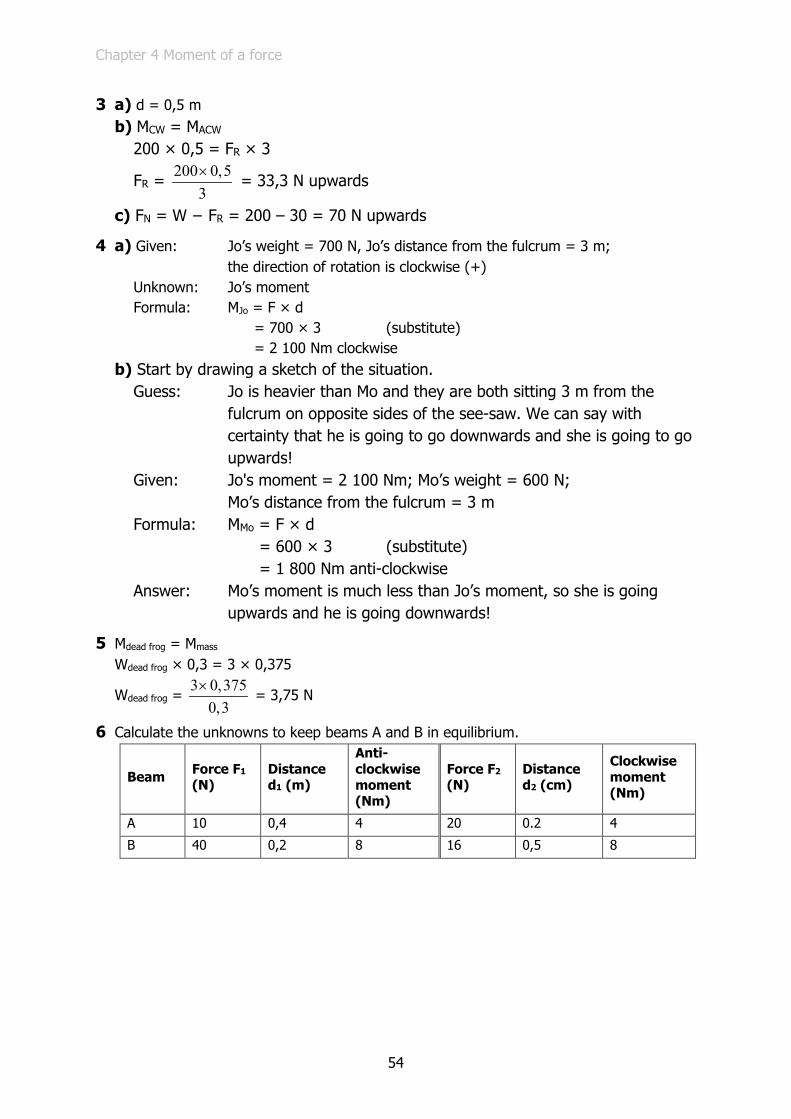
c) FN = W − FR = 200 – 30 = 70 N upwards
4 a) Given: Jo’s weight = 700 N, Jo’s distance from the fulcrum = 3 m; the direction of rotation is clockwise (+) Unknown: Jo’s moment Formula: MJo = F × d = 700 × 3 (substitute) = 2 100 Nm clockwise
b) Start by drawing a sketch of the situation. Guess: Jo is heavier than Mo and they are both sitting 3 m from the
fulcrum on opposite sides of the see-saw. We can say with certainty that he is going to go downwards and she is going to go upwards!
Given: Jo's moment = 2 100 Nm; Mo’s weight = 600 N; Mo’s distance from the fulcrum = 3 m Formula: MMo = F × d = 600 × 3 (substitute) = 1 800 Nm anti-clockwise Answer: Mo’s moment is much less than Jo’s moment, so she is going
upwards and he is going downwards!
5 Mdead frog = Mmass
Wdead frog × 0,3 = 3 × 0,375
Wdead frog = 3 0,375
0,3×
= 3,75 N
6 Calculate the unknowns to keep beams A and B in equilibrium.
Beam Force F1 (N)
Distance d1 (m)
Anti-clockwise moment (Nm)
Force F2 (N)
Distance d2 (cm)
Clockwise moment (Nm)
A 10 0,4 4 20 0.2 4
B 40 0,2 8 16 0,5 8

Chapter 4 Moment of a force
55
Experiment 4: Prove the Law of Moments (LB page 124)
This experiment is the second of the four experiments that will be assessed formally this year. It will be marked on the Record of Assessment of Experiment 4: Prove the Law of Moments, according to the Assessment Rubric for Experiments. It will be marked out of 30 which is 10% of the mark for Assessment Tasks through the year. The task
Working in groups of four and using the given apparatus, learners must follow a scientific process to confirm the Law of Moments.
Their notebooks must reflect their ideas and their understanding. The work in their notebooks must be their own – it is not to be shared in the group. Practise using the apparatus
Prior to the formal activity, the learners are given an opportunity to practise the skill of balancing the beam.

Chapter 4 Moment of a force
56
Record of Assessment of Experiment 4: Prove the Law of Moments
Work assessed Checklist for tick or cross
Mark awarded 1 to 4
Weighting of the mark
Possible mark Mark
1 Describe the experiment 1 4
Give the experiment a name
Describe the concept you intend to prove
Describe what you need to do to prove the theory
2 Plan the experiment 2 8
Describe the variables and the constants
Write a list the materials, equipment or other resources
Write the method
Share the tasks amongst the group
Draw up a table for the results
Decide how to use the data
3 Do the experiment 2 8
Do the experiment as planned
Work safely, considerately and conservatively
4 Capture the data to create information: observe, record and comment 1 4
5 Draw a conclusion 0,5 2
6 Recommend improvements 1 4
Total 30
Chapter 4 Moment of a force
57
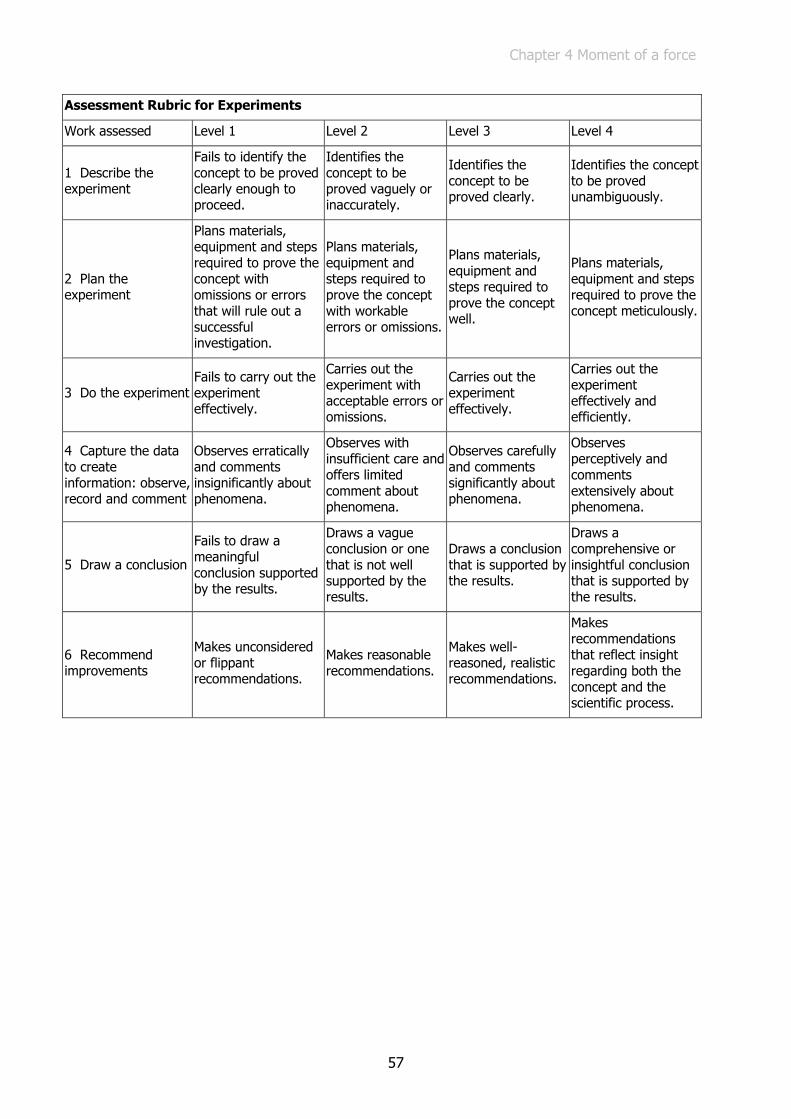
Assessment Rubric for Experiments
Work assessed Level 1 Level 2 Level 3 Level 4
1 Describe the experiment
Fails to identify the concept to be proved clearly enough to proceed.
Identifies the concept to be proved vaguely or inaccurately.
Identifies the concept to be proved clearly.
Identifies the concept to be proved unambiguously.
2 Plan the experiment
Plans materials, equipment and steps required to prove the concept with omissions or errors that will rule out a successful investigation.
Plans materials, equipment and steps required to prove the concept with workable errors or omissions.
Plans materials, equipment and steps required to prove the concept well.
Plans materials, equipment and steps required to prove the concept meticulously.
3 Do the experiment Fails to carry out the experiment effectively.
Carries out the experiment with acceptable errors or omissions.
Carries out the experiment effectively.
Carries out the experiment effectively and efficiently.
4 Capture the data to create information: observe, record and comment
Observes erratically and comments insignificantly about phenomena.
Observes with insufficient care and offers limited comment about phenomena.
Observes carefully and comments significantly about phenomena.
Observes perceptively and comments extensively about phenomena.
5 Draw a conclusion
Fails to draw a meaningful conclusion supported by the results.
Draws a vague conclusion or one that is not well supported by the results.
Draws a conclusion that is supported by the results.
Draws a comprehensive or insightful conclusion that is supported by the results.
6 Recommend improvements
Makes unconsidered or flippant recommendations.
Makes reasonable recommendations.
Makes well-reasoned, realistic recommendations.
Makes recommendations that reflect insight regarding both the concept and the scientific process.

Chapter 5 Beams
58
Chapter 5 Beams Unit 5.1 An introduction to beams Unit 5.2 Simply supported beam with a point load Unit 5.3 Shear forces and shear stresses in beams Unit 5.4 Bending moments and bending stresses in beams Unit 5.5 Cantilever beams
NOTE: The teacher must be sure to write the calculations on the board with vertical lines. Here is an example:
= 1 × 1/2,5 should be written on the board as = 1 × 1
2,5
Chapter preview
At this stage of the year, please start each chapter with a preview exercise. Set this for homework just before you start the section on beams. This helps to orient the learners about what they are going to study. Below are some useful questions.
1 How many Units does this chapter have, and what are they called?
There are four units: • An introduction to beams • Simply supported beam with a point load • Shear forces and shear stresses in beams • Bending moments and bending stresses in beams • Cantilever Beams
2 What is the project in the Challenges section?
The project is: Who can make the strongest beam? 3 Find the section where you will learn to draw a shear force diagram. What does such a
diagram look like?
Example of a shear force diagram:
RS = 225 N W = 300 N
RT = 75 N

Chapter 5 Beams
59
Unit 5.1 An introduction to beams (LB page 129)
Quick Activity: Bending force (LB page 131)
This activity illustrates that the maximum bending moment on a “uniform” beam is at the centre.
You must please control this activity well to avoid over-boisterous behaviour on the part of the learners.
Quick Activity (LB page 131)
Hang from your fingers from a window sill at shoulder height – feel the shear forces in your finger joints.
This activity vividly illustrates that maximum shear force is at the point of support.
Unit 5.2 Simply supported beam with a point load (LB page 132)
Activity 1 Simulate the effect of a point load on a bridge, w ith a pinned joint at one end and a sliding joint at the other end (LB page 134)
This activity illustrates the difference between the action of a pinned joint where horizontal movement is constrained and a sliding joint where horizontal movement is not constrained.
Activity 2 Calculate reactions (LB page 139)
1 a) To find the reaction at Q we take moments about point P: Given: L = 6 m; d = 1 m and W = 100 N Unknown: clockwise moment at P Formula: MCW = W × d
= 100 × 1 (substitute) = 100 Nm Unknown: anti-clockwise moment at P Formula: MACW = RQ × L = RQ × 6 Law of Moments: MACW = MCW RQ × 6 = 100 (substitute) RQ = 16,7 N (divide both sides by 6) The beam is in equilibrium, therefore W = RQ + RP RP = W − RQ (change the subject) = 100 – 16,7

Chapter 5 Beams
60
= 83,3 N
b) To find the reactions at Q and P we use the formulae RQ = WdL
and RP = W – WdL
Given: L = 6 m; d = 1 m and W = 100 N Unknown: RQ
Formula: RQ = WdL
= 100 1
6×
(substitute)
= 16,7 N Unknown: RP
Formula: RP = W – WdL
= 100 – 100 1
6×
(substitute)
` = 83,3 N
2 a) Given: L = 4 m; d = 1 m and W = 300 N Unknown: clockwise moment at P Formula: MCW = W × d = 100 × 1 (substitute) = 100 Nm Unknown: anti-clockwise moment at P Formula: MACW = RQ × L = RQ × 6 Law of Moments: MACW = MCW RQ × 6 = 100 (substitute) RQ = 16,7 N (divide both sides by 6) The beam is in equilibrium, therefore W = RQ + RP RP = W − RQ (change the subject) = 100 – 16,7 = 83,3 N To find the reaction at T we take moments about point S: Given: L = 4 m; d = 1 m and W = 300 N Unknown: RS + RT Clockwise moment at S: MCW = W × (L − d) = 300 × (4 − 1) (substitute) = 900 Nm Anti-clockwise moment at S: MACW = RT × L = RT × 4 Law of Moments: MACW = MCW RT × 4 = 900 (substitute)
RT = 900
4
= 225 N (divide both sides by 4)
Chapter 5 Beams
61
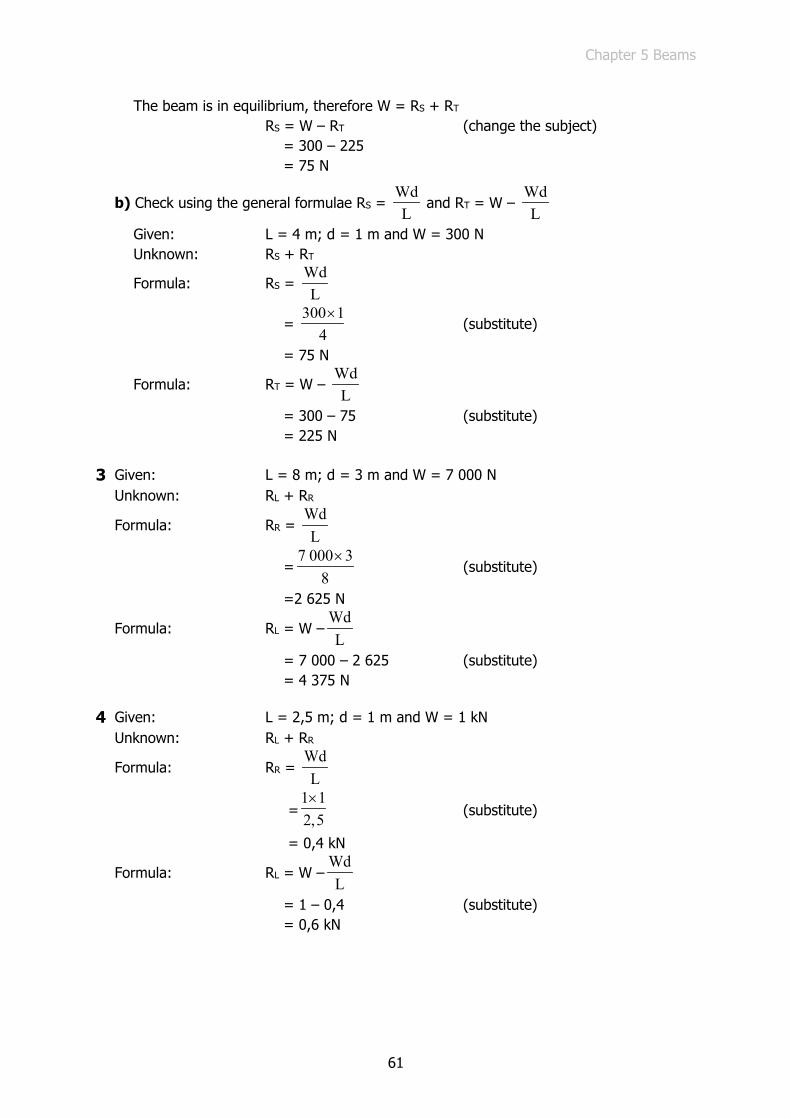
The beam is in equilibrium, therefore W = RS + RT RS = W – RT (change the subject) = 300 – 225 = 75 N
b) Check using the general formulae RS = WdL
and RT = W – WdL
Given: L = 4 m; d = 1 m and W = 300 N Unknown: RS + RT
Formula: RS = WdL
= 300 1
4×
(substitute)
= 75 N
Formula: RT = W – WdL
= 300 – 75 (substitute) = 225 N
3 Given: L = 8 m; d = 3 m and W = 7 000 N Unknown: RL + RR
Formula: RR = WdL
=7 000 3
8×
(substitute)
=2 625 N
Formula: RL = W –WdL
= 7 000 – 2 625 (substitute) = 4 375 N 4 Given: L = 2,5 m; d = 1 m and W = 1 kN Unknown: RL + RR
Formula: RR = WdL
=1 12,5×
(substitute)
= 0,4 kN
Formula: RL = W –WdL
= 1 – 0,4 (substitute) = 0,6 kN

Chapter 5 Beams
62
5 Given: RG = 5 kN; RH = 7 kN; L = 4 m Unknown: W Formula: W = RG + RH = 5 + 7 (substitute) = 12 kN Unknown: d
Formula: RH = WdL
where d = distance from G
d = HR ×LW
(change subject)
= 7 412×
= 2,33 m 6 Given: DF is 7,5 m long; 3,5 kN is 2,5 m from D; 5,6 kN is at the midpoint Unknown: RD and RF Clockwise moment at D: MCW = F1 d1 + F2 d2 = 3,5 × 2,5 + 5,6 × 3,75 = 29,75 kNm Anti-clockwise moment at D: MACW = RF × 7,5 Law of Moments: MACW = MCW RF × 7,5 = 29,75
RF = 29,757,5
= 3,97 kN The beam is in equilibrium, therefore RD + RF = F1 + F2 RD = F1 + F2 − RF
= 3,5 + 5,6 – 3,97 = 5,13 kN
For enrichment
7 Given: Beam LR is 7,1 m long; 3,75 kN is 3 m from the left end; 6,25 kN is at X from left end; RL = 5,5 kN Unknown: RR and X The beam is in equilibrium, therefore RL + RR = L1 + L2 RR = L1 + L2 − RL
= 3,75 + 6,25 – 5,5 = 4,5 kN Clockwise moments at R: MCW = RL × L = 5,5 × 7,1 = 39,05 kNm Anti-clockwise moments at R: MACW = F1 × d1 + F2 × d2 = 3,75 (7,1 – 3) + 6,25 (7,1 – X) = 15,38 + 44,38 – 6,25 × X = 59,76 – 6,25X
Chapter 5 Beams
63
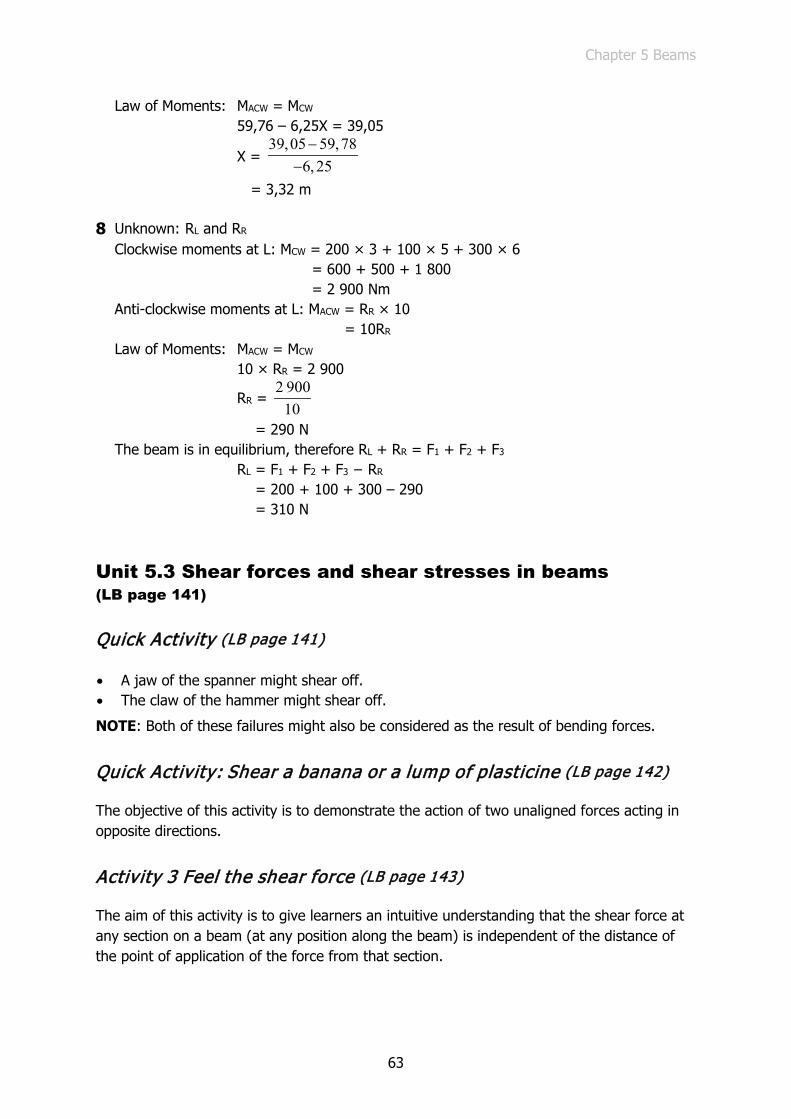
Law of Moments: MACW = MCW
59,76 – 6,25X = 39,05
X = 39,05 59,78
6,25−
−
= 3,32 m 8 Unknown: RL and RR
Clockwise moments at L: MCW = 200 × 3 + 100 × 5 + 300 × 6 = 600 + 500 + 1 800 = 2 900 Nm Anti-clockwise moments at L: MACW = RR × 10 = 10RR Law of Moments: MACW = MCW 10 × RR = 2 900
RR = 2 900
10
= 290 N The beam is in equilibrium, therefore RL + RR = F1 + F2 + F3 RL = F1 + F2 + F3 − RR
= 200 + 100 + 300 – 290 = 310 N
Unit 5.3 Shear forces and shear stresses in beams (LB page 141)
Quick Activity (LB page 141)
• A jaw of the spanner might shear off. • The claw of the hammer might shear off.
NOTE: Both of these failures might also be considered as the result of bending forces.
Quick Activity: Shear a banana or a lump of plasticine (LB page 142)
The objective of this activity is to demonstrate the action of two unaligned forces acting in opposite directions.
Activity 3 Feel the shear force (LB page 143)
The aim of this activity is to give learners an intuitive understanding that the shear force at any section on a beam (at any position along the beam) is independent of the distance of the point of application of the force from that section.
Chapter 5 Beams
64
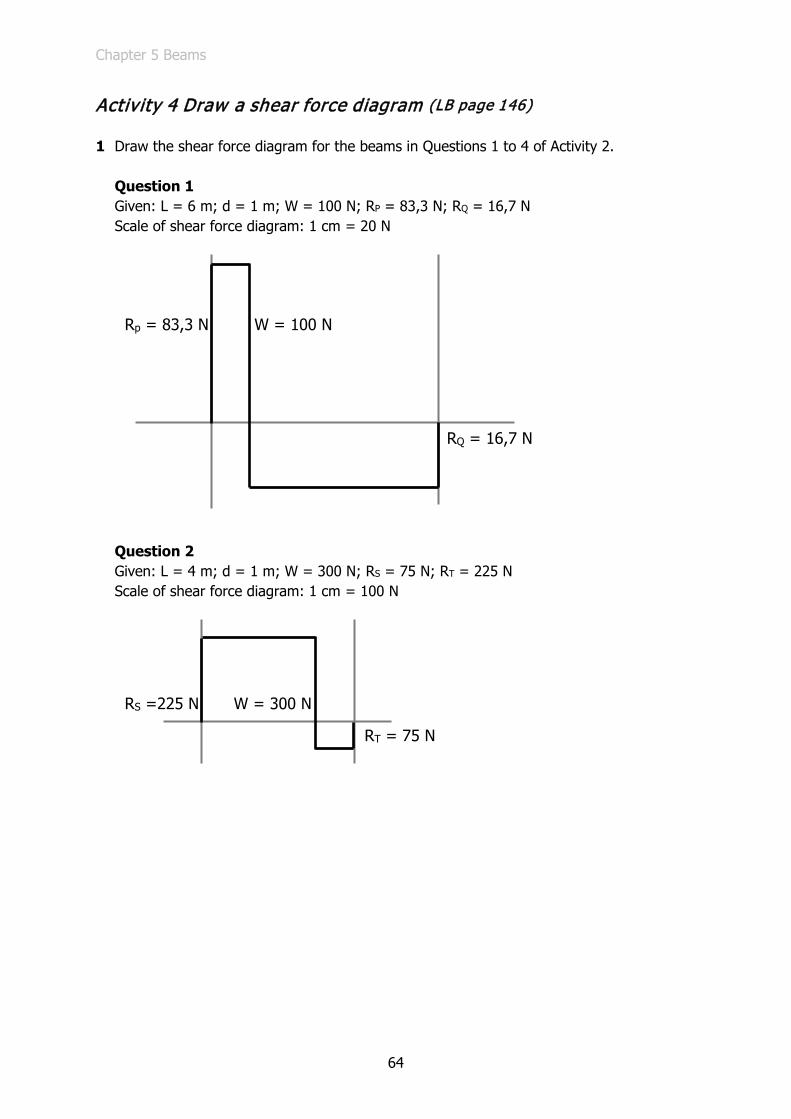
Activity 4 Draw a shear force diagram (LB page 146)
1 Draw the shear force diagram for the beams in Questions 1 to 4 of Activity 2.
Question 1 Given: L = 6 m; d = 1 m; W = 100 N; RP = 83,3 N; RQ = 16,7 N Scale of shear force diagram: 1 cm = 20 N
Question 2 Given: L = 4 m; d = 1 m; W = 300 N; RS = 75 N; RT = 225 N Scale of shear force diagram: 1 cm = 100 N
Rp = 83,3 N W = 100 N
RQ = 16,7 N
RS =225 N W = 300 N
RT = 75 N

Chapter 5 Beams
65
Question 3 Scale of shear force diagram: 1 cm = 1 000 N
Question 4 Given: L = 2,5 m; d = 1 m; W = 1 kN; RN = 0,4 kN; RM = 0,6 kN Scale of shear force diagram: 1cm = 0,2 kN
Rp = 4 375 N
W = 7 000 N
RQ =2 375 N
RM = 0,4 kN W = 1,0 kN
RN = 0,6 kN
Chapter 5 Beams
66
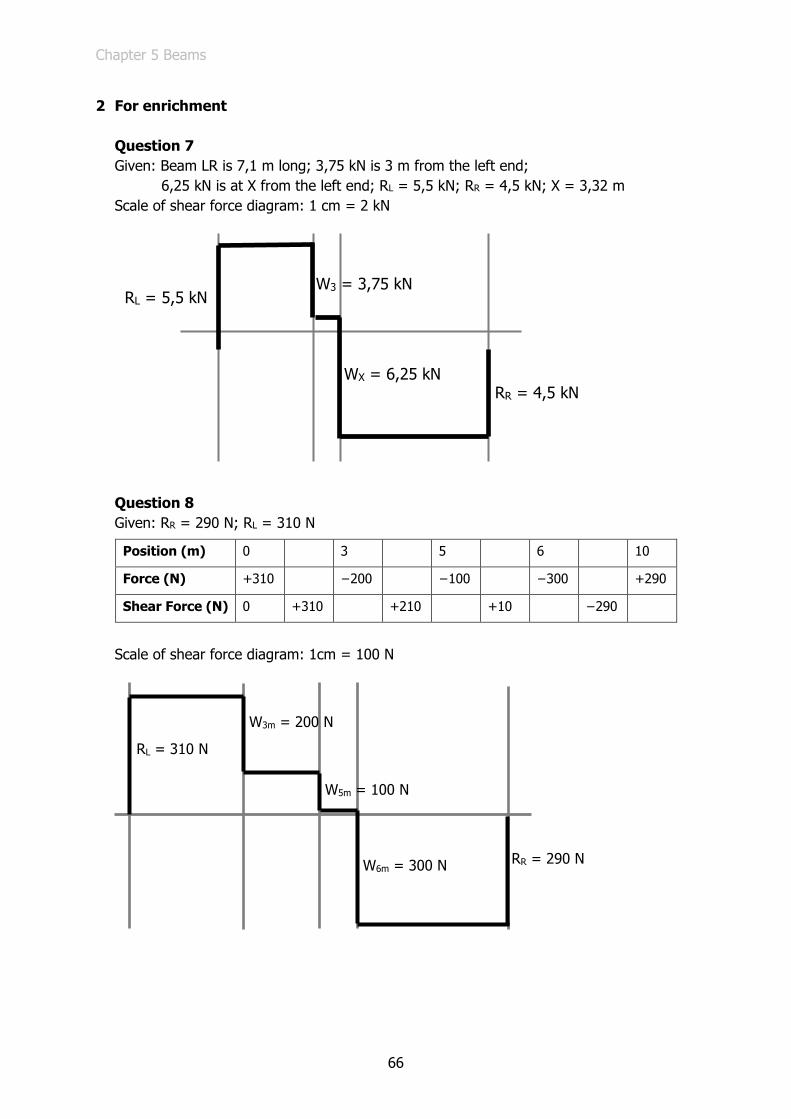
2 For enrichment Question 7 Given: Beam LR is 7,1 m long; 3,75 kN is 3 m from the left end; 6,25 kN is at X from the left end; RL = 5,5 kN; RR = 4,5 kN; X = 3,32 m Scale of shear force diagram: 1 cm = 2 kN
Question 8 Given: RR = 290 N; RL = 310 N
Position (m) 0 3 5 6 10
Force (N) +310 −200 −100 −300 +290
Shear Force (N) 0 +310 +210 +10 −290
Scale of shear force diagram: 1cm = 100 N
RL = 5,5 kN W3 = 3,75 kN
RR = 4,5 kN WX = 6,25 kN
RL = 310 N
RR = 290 N
W3m = 200 N
W5m = 100 N
W6m = 300 N
Chapter 5 Beams
67
Unit 5.4 Bending moments and bending stresses in beams (LB page 147)
Activity 5 Bend a plasticine beam by hand (LB page 147)
The aim of this activity is to give learners an intuitive understanding of the effect that bending has on a beam. For example, if a positive moment is applied to the beam, the top of the beam experiences compression and the bottom of the beam experiences tension. Learners develop understanding by feeling the plasticine bending in their hands.
Activity 6 Bend a plasticine beam by loading it w ith weights (LB page 148)
The aim of this activity is the same as the aim of the previous activity – to give learners an intuitive understanding of the effect that bending has on a beam – but the mode of learning is different. Here, learners develop understanding by observing the bending of the plasticine beam.
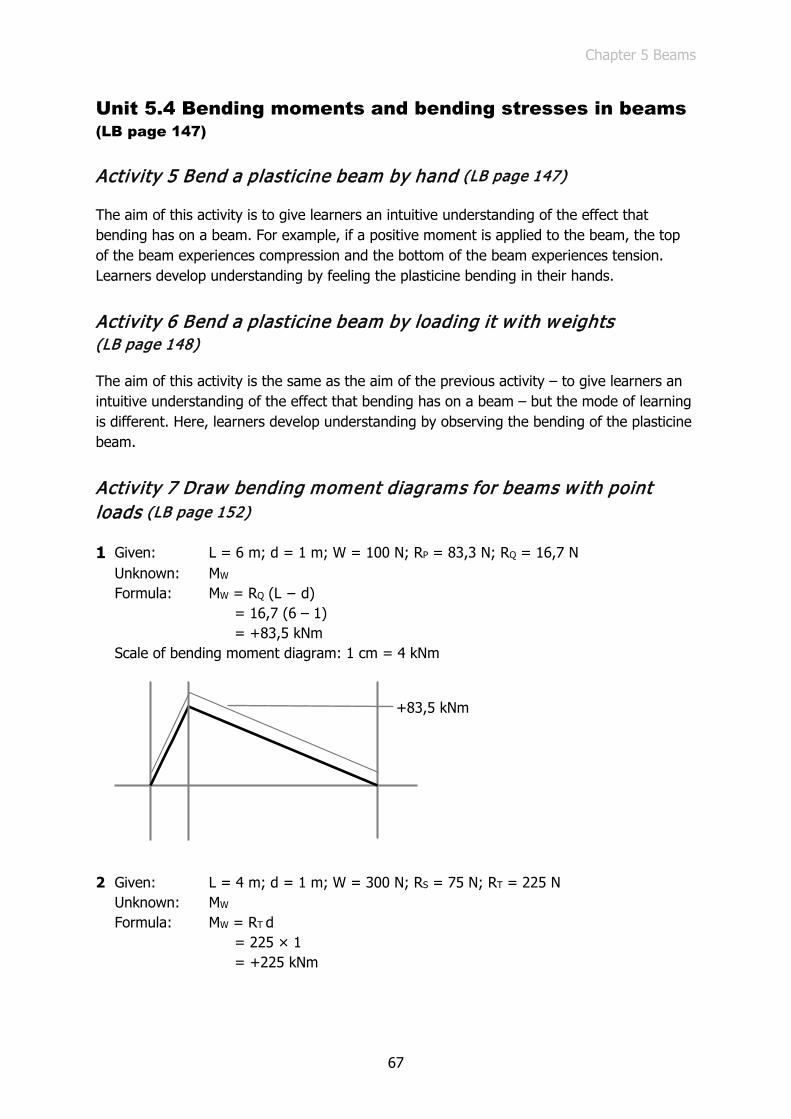
Activity 7 Draw bending moment diagrams for beams w ith point loads (LB page 152)
1 Given: L = 6 m; d = 1 m; W = 100 N; RP = 83,3 N; RQ = 16,7 N Unknown: MW
Formula: MW = RQ (L − d) = 16,7 (6 – 1) = +83,5 kNm
Scale of bending moment diagram: 1 cm = 4 kNm
2 Given: L = 4 m; d = 1 m; W = 300 N; RS = 75 N; RT = 225 N Unknown: MW
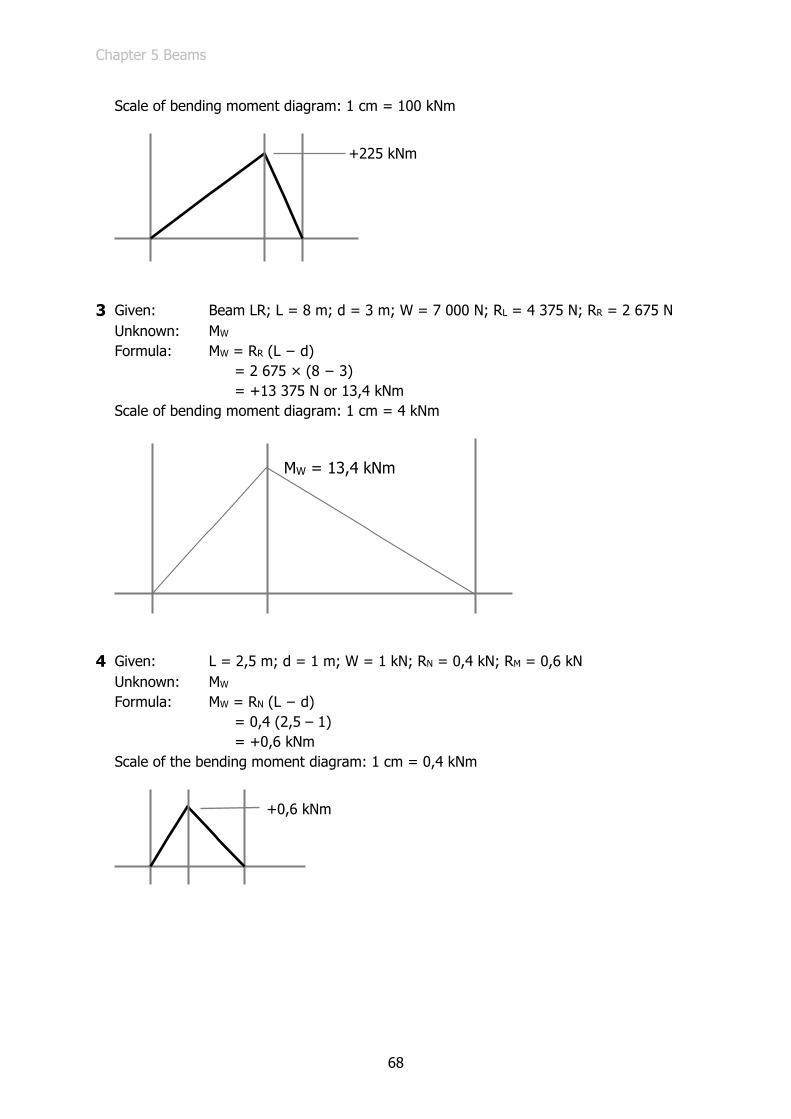
Formula: MW = RT d = 225 × 1 = +225 kNm
+83,5 kNm
Chapter 5 Beams
68
Scale of bending moment diagram: 1 cm = 100 kNm
3 Given: Beam LR; L = 8 m; d = 3 m; W = 7 000 N; RL = 4 375 N; RR = 2 675 N Unknown: MW
Formula: MW = RR (L − d) = 2 675 × (8 − 3) = +13 375 N or 13,4 kNm Scale of bending moment diagram: 1 cm = 4 kNm
4 Given: L = 2,5 m; d = 1 m; W = 1 kN; RN = 0,4 kN; RM = 0,6 kN Unknown: MW
Formula: MW = RN (L − d) = 0,4 (2,5 – 1) = +0,6 kNm
Scale of the bending moment diagram: 1 cm = 0,4 kNm
+225 kNm
MW = 13,4 kNm
+0,6 kNm

Chapter 5 Beams
69
5 Given: RG = 5 kN; RH = 7 kN; L = 4 m; W = 12 kN; d = 2,33 m Unknown: MW
Formula: MW = RH (L − d) = 7,0 (4 – 2,33) = +11,7 kNm
Scale of bending moment diagram: 1 cm = 5 kNm
6 Given: DF is 7,5 m long; 3,5 kN is 2,5 m from D; 5,6 kN is at the midpoint; RF = 3,97 kN; RD = 5,13 kN Unknown: MG and MH At G: MG = +RD × 2,5 = +5,13 × 2,5 (substitute) = +12,83 kNm At H: MH = +RF × 3,75 = +3,97 × 2,5 = 9,93 kNm
Scale of bending moment diagram: 1 cm = 2 N
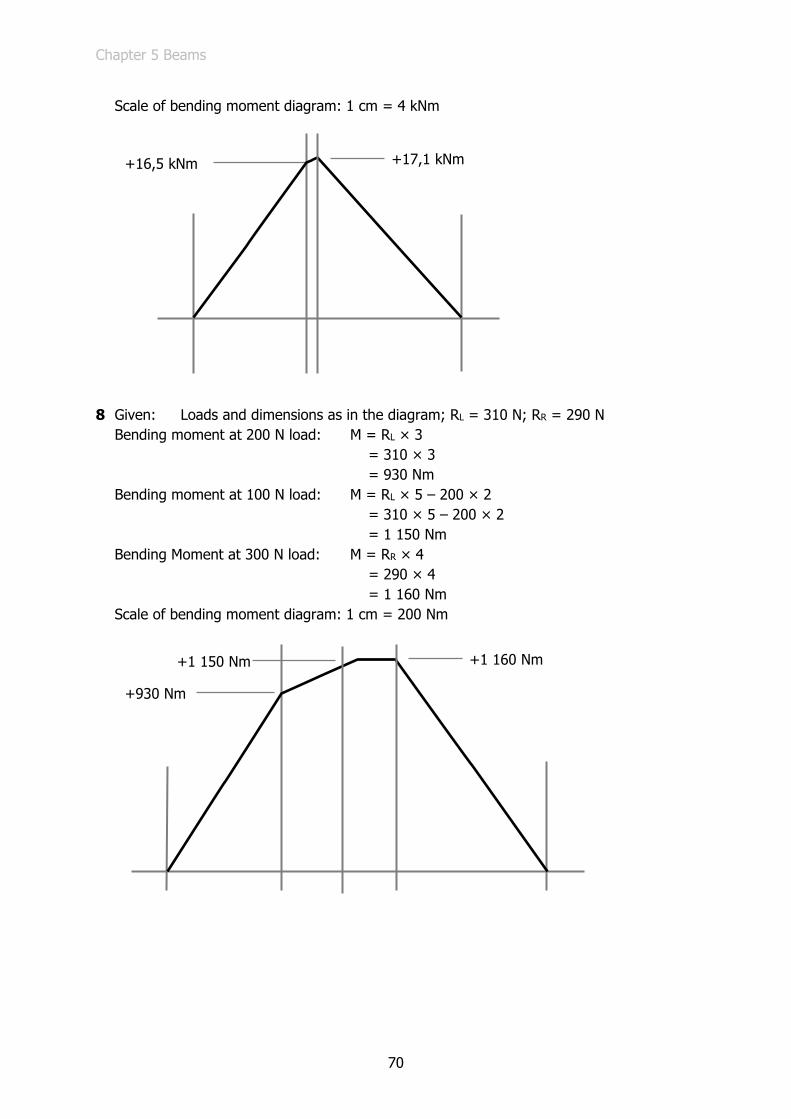
7 Given: Beam LR is 7,1 m long; 3,75 kN is 3 m from the left end; 6,25 kN is at X from left end; RL = 5,5 kN; RR = 4,5 kN; X = 3,3 m Bending moment at P: M = +RL × 3 = 5,5 × 3 = 16,5 kNm Bending moment at Q: M = RR × (7,1 – X) = 4,5 × (7,1 – 3,3) = 17,1 kNm
+11,7 kNm
+9,93 kNm
+12,83 kNm
Chapter 5 Beams
70
Scale of bending moment diagram: 1 cm = 4 kNm
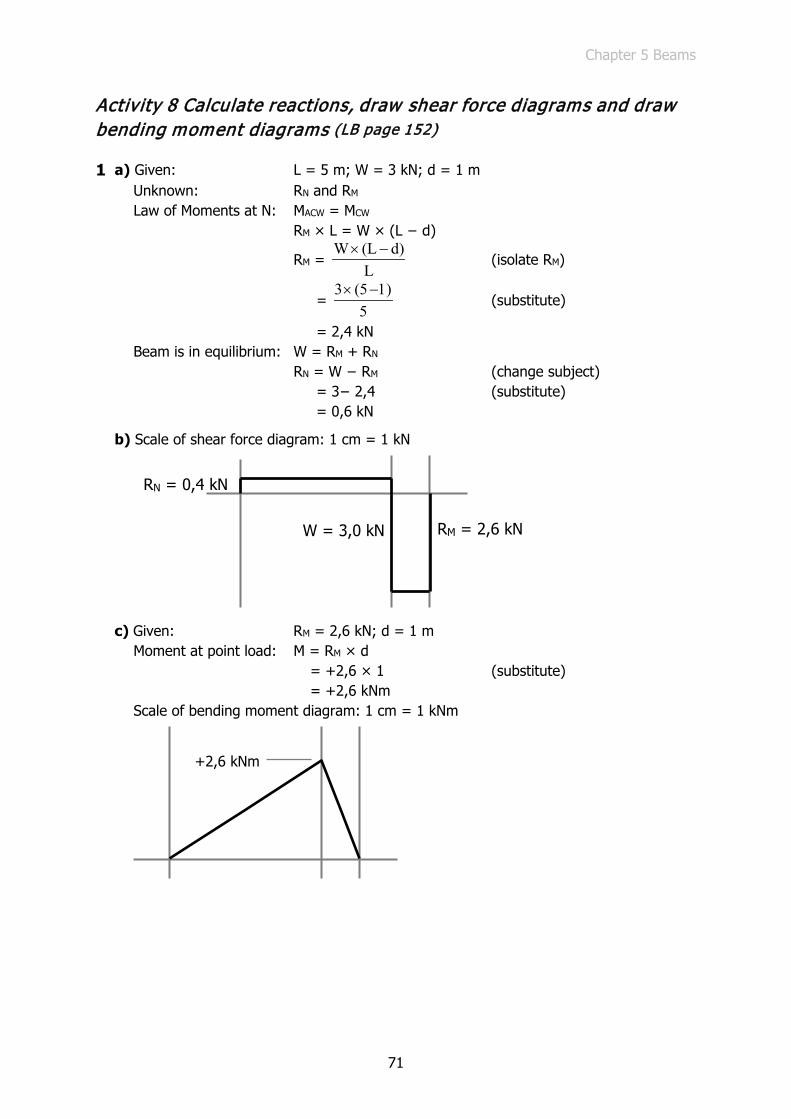
8 Given: Loads and dimensions as in the diagram; RL = 310 N; RR = 290 N Bending moment at 200 N load: M = RL × 3 = 310 × 3 = 930 Nm Bending moment at 100 N load: M = RL × 5 – 200 × 2 = 310 × 5 – 200 × 2 = 1 150 Nm Bending Moment at 300 N load: M = RR × 4 = 290 × 4 = 1 160 Nm Scale of bending moment diagram: 1 cm = 200 Nm
+16,5 kNm
+17,1 kNm
+930 Nm
+1 160 Nm +1 150 Nm
Chapter 5 Beams
71
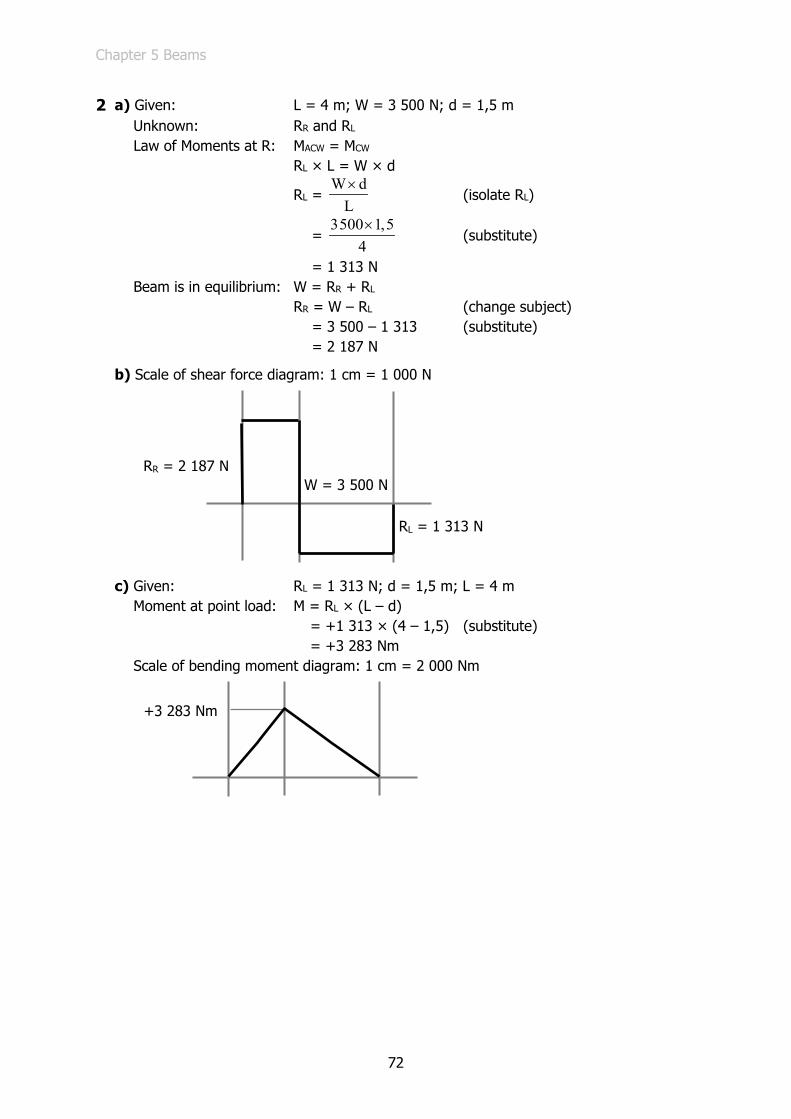
Activity 8 Calculate reactions, draw shear force diagrams and draw bending moment diagrams (LB page 152)
1 a) Given: L = 5 m; W = 3 kN; d = 1 m Unknown: RN and RM Law of Moments at N: MACW = MCW RM × L = W × (L − d)
RM = W (L d)
L× −
(isolate RM)
= (5 )5
3× −1 (substitute)
= 2,4 kN Beam is in equilibrium: W = RM + RN
RN = W − RM (change subject) = 3− 2,4 (substitute) = 0,6 kN
b) Scale of shear force diagram: 1 cm = 1 kN
c) Given: RM = 2,6 kN; d = 1 m Moment at point load: M = RM × d = +2,6 × 1 (substitute) = +2,6 kNm Scale of bending moment diagram: 1 cm = 1 kNm
RN = 0,4 kN
W = 3,0 kN RM = 2,6 kN
+2,6 kNm
Chapter 5 Beams
72
2 a) Given: L = 4 m; W = 3 500 N; d = 1,5 m Unknown: RR and RL Law of Moments at R: MACW = MCW RL × L = W × d
RL = W d
L×
(isolate RL)
= 3500 1,5
4×
(substitute)
= 1 313 N Beam is in equilibrium: W = RR + RL
RR = W – RL (change subject) = 3 500 – 1 313 (substitute) = 2 187 N
b) Scale of shear force diagram: 1 cm = 1 000 N
c) Given: RL = 1 313 N; d = 1,5 m; L = 4 m Moment at point load: M = RL × (L – d) = +1 313 × (4 – 1,5) (substitute) = +3 283 Nm Scale of bending moment diagram: 1 cm = 2 000 Nm
RR = 2 187 N W = 3 500 N
RL = 1 313 N
+3 283 Nm

Chapter 5 Beams
73
3 a) Given: L = 6 mm; RS = 4 kN and RT = 8 kN Unknown: d and W Beam is in equilibrium: W = RS + RT
= 4 + 8 (substitute) = 12 kN Law of Moments at S: MCW = MACW W × d = RT × L
d = TR LW×
(isolate d)
= 8 612×
(substitute)
= 4 m
b) Scale of shear force diagram: 1 cm = 4 kN
c) Given: RT = 1 313 N; d = 4 m; L = 6 m Moment to right of point load: M = RT × (L – d) = +8 × (6 – 4) (substitute) = +16 kNm Scale of bending moment diagram: 1 cm = 10 kNm
RS = 4 kN
W = 12 kN RT = 8 kN
+16 kNm

Chapter 5 Beams
74
Enrichment
4 a) Given: L = 2,5 m; d = 0,5 m; WP = 4,5 kN; WQ = 5,5 kN Moment at A: MACW = MCW
RB × L = WP × d + QW L2×
RB = Q
P
W LW d
2L
×× +
(isolate RB)
= 22,5
5,5×2,54,5×0,5+
(substitute)
= 3,65 kN Beam is in equilibrium: WP + WQ = RA + RB RA = WP + WQ − RB
= 4,5 + 5,5 – 3,65 = 6,35 kN
b) Scale of shear force diagram: 1 cm = 2 kN
c) Bending moment to the right at Q: MQ = RB × L2
= 3,65 × 1,25 (substitute) = +4,56 kNm Bending moment to the left at P: MP = RA × d = 6,35 × 0,5 = +3,175 kNm
WQ = 5,5 kN
RA = 6,35 kN WP = 4,5 kN
RB = 3,65 kN
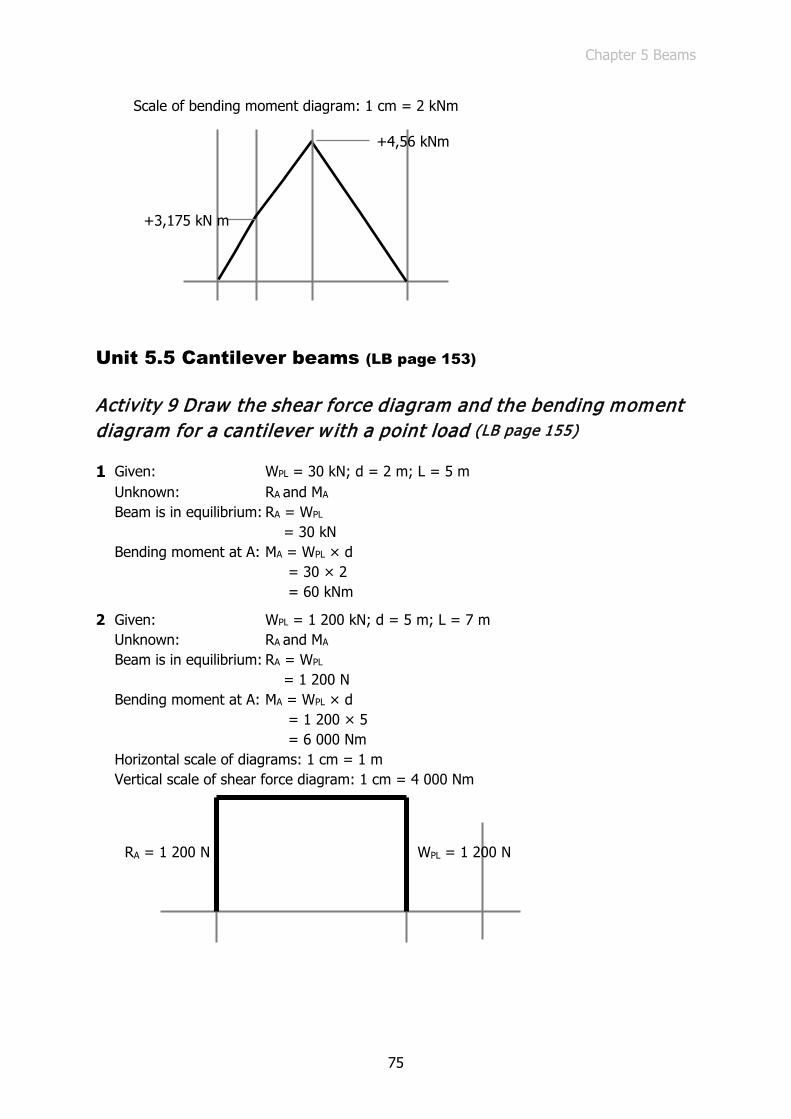
Chapter 5 Beams
75
Scale of bending moment diagram: 1 cm = 2 kNm
Unit 5.5 Cantilever beams (LB page 153)
Activity 9 Draw the shear force diagram and the bending moment diagram for a cantilever w ith a point load (LB page 155)
1 Given: WPL = 30 kN; d = 2 m; L = 5 m Unknown: RA and MA
Beam is in equilibrium: RA = WPL = 30 kN Bending moment at A: MA = WPL × d = 30 × 2 = 60 kNm
2 Given: WPL = 1 200 kN; d = 5 m; L = 7 m Unknown: RA and MA
Beam is in equilibrium: RA = WPL = 1 200 N Bending moment at A: MA = WPL × d = 1 200 × 5 = 6 000 Nm Horizontal scale of diagrams: 1 cm = 1 m
Vertical scale of shear force diagram: 1 cm = 4 000 Nm
+3,175 kN m
+4,56 kNm
RA = 1 200 N WPL = 1 200 N
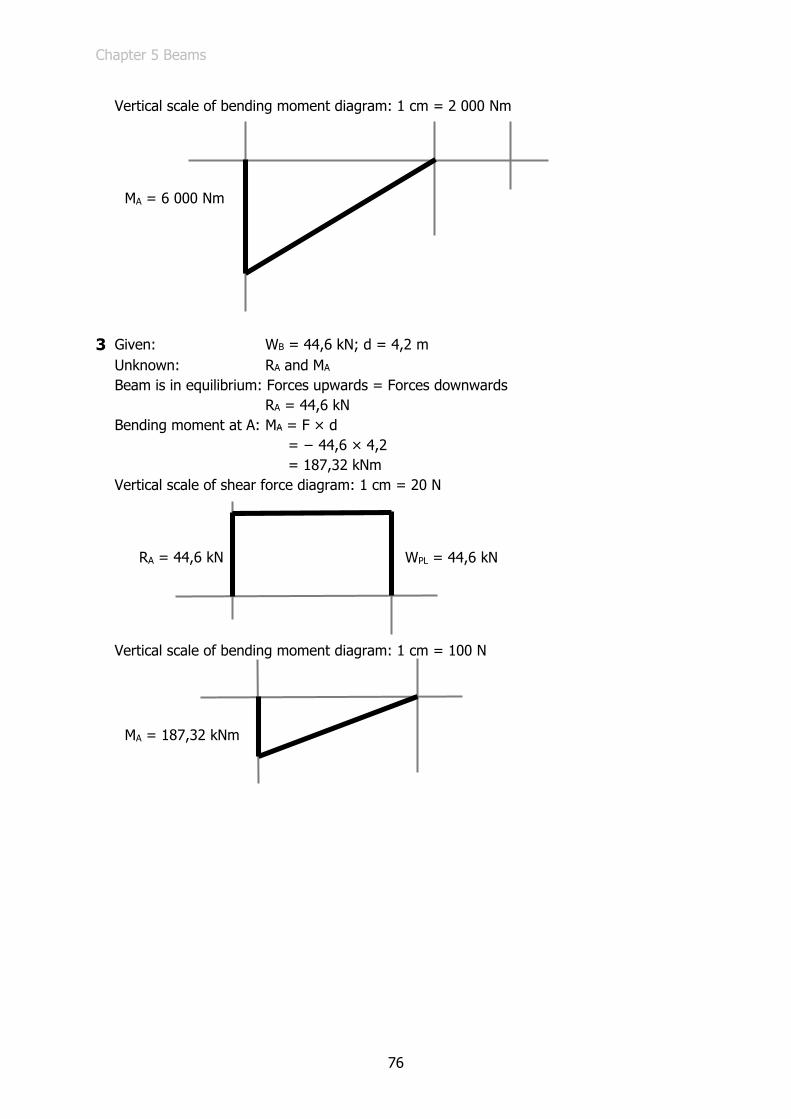
Chapter 5 Beams
76
Vertical scale of bending moment diagram: 1 cm = 2 000 Nm
3 Given: WB = 44,6 kN; d = 4,2 m Unknown: RA and MA Beam is in equilibrium: Forces upwards = Forces downwards RA = 44,6 kN Bending moment at A: MA = F × d = − 44,6 × 4,2 = 187,32 kNm Vertical scale of shear force diagram: 1 cm = 20 N
Vertical scale of bending moment diagram: 1 cm = 100 N
MA = 6 000 Nm
RA = 44,6 kN WPL = 44,6 kN
MA = 187,32 kNm
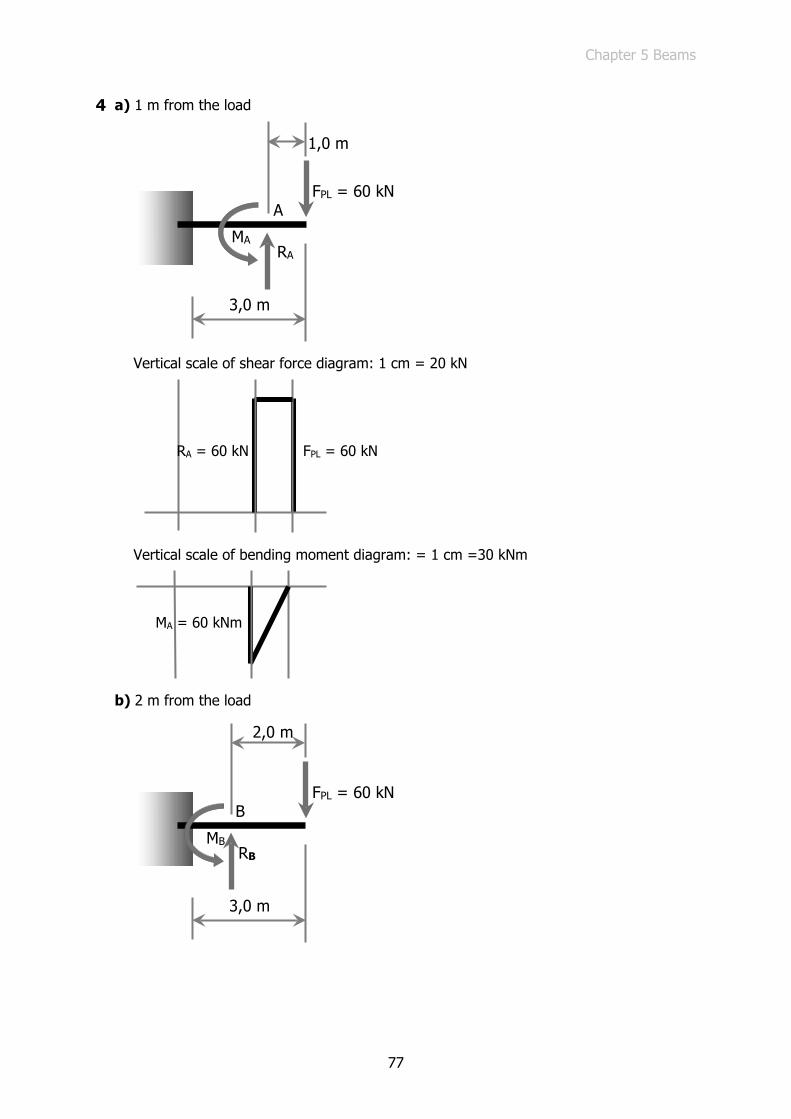
Chapter 5 Beams
77
4 a) 1 m from the load
Vertical scale of shear force diagram: 1 cm = 20 kN
Vertical scale of bending moment diagram: = 1 cm =30 kNm
b) 2 m from the load
1,0 m
FPL = 60 kN A
MA RA
3,0 m
RA = 60 kN FPL = 60 kN
MA = 60 kNm
2,0 m
FPL = 60 kN B
MB RB
3,0 m
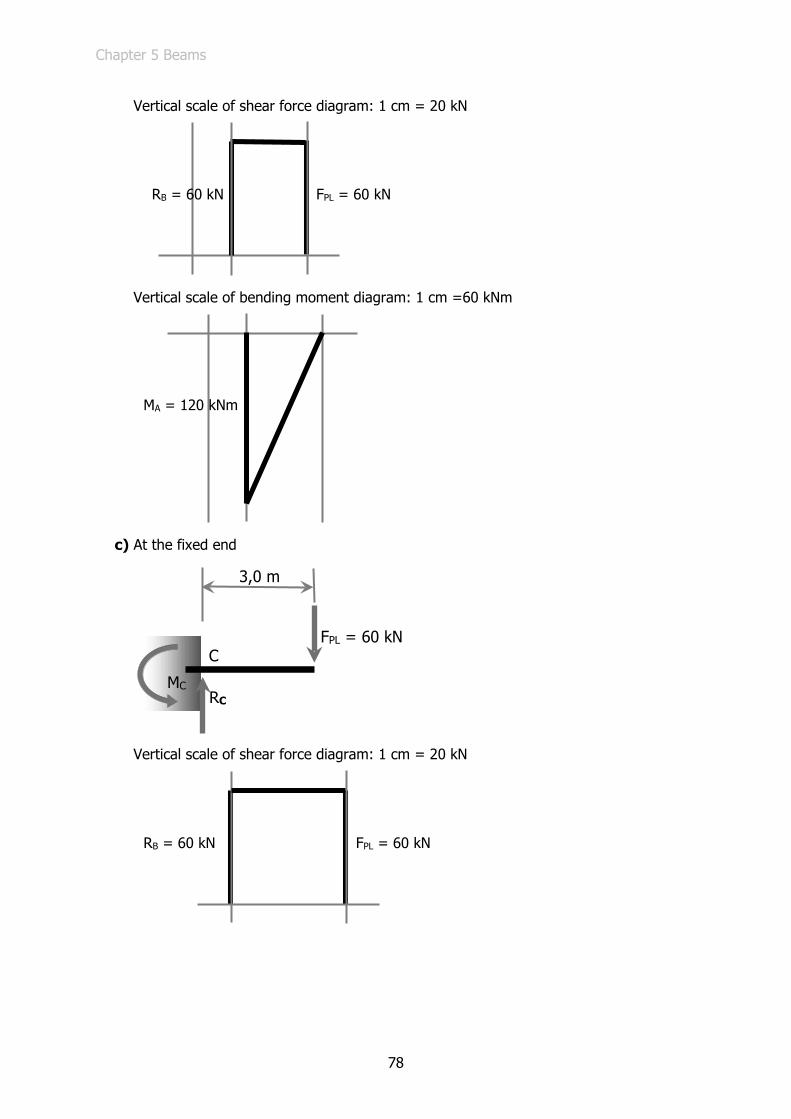
Chapter 5 Beams
78
Vertical scale of shear force diagram: 1 cm = 20 kN
Vertical scale of bending moment diagram: 1 cm =60 kNm
c) At the fixed end
Vertical scale of shear force diagram: 1 cm = 20 kN
RB = 60 kN FPL = 60 kN
MA = 120 kNm
3,0 m
FPL = 60 kN C
MC RC
RB = 60 kN FPL = 60 kN
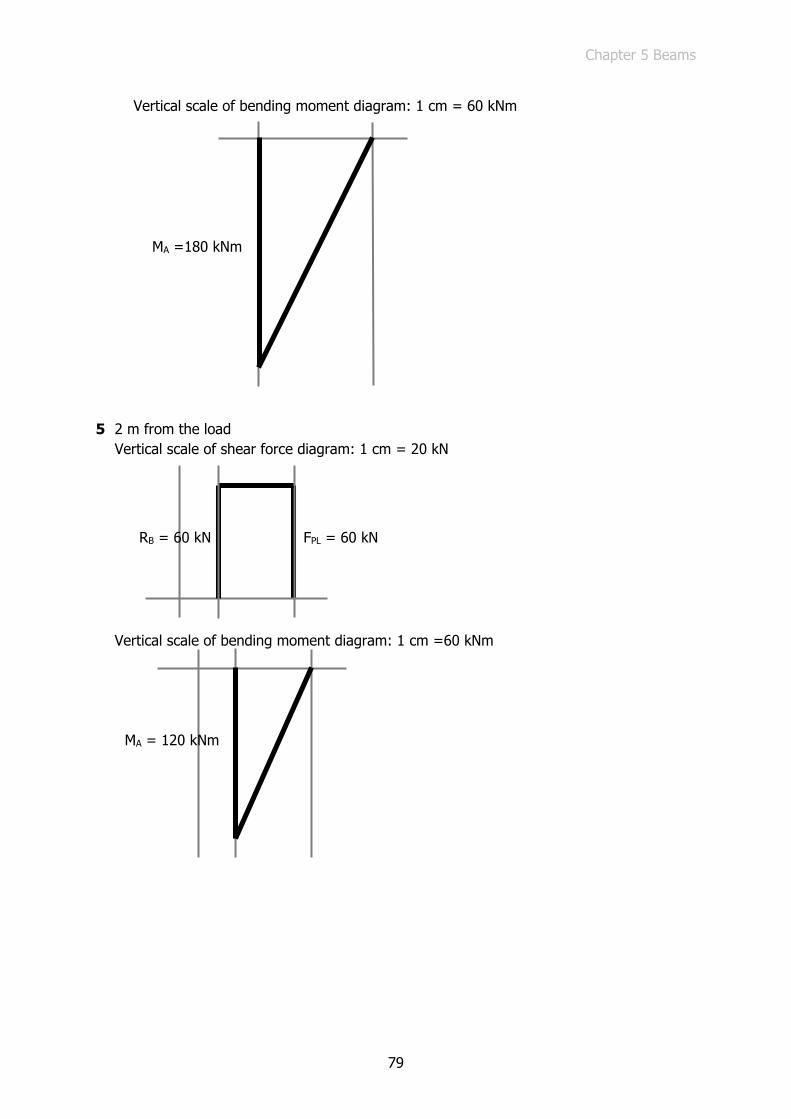
Chapter 5 Beams
79
Vertical scale of bending moment diagram: 1 cm = 60 kNm
5 2 m from the load Vertical scale of shear force diagram: 1 cm = 20 kN
Vertical scale of bending moment diagram: 1 cm =60 kNm
MA =180 kNm
RB = 60 kN FPL = 60 kN
MA = 120 kNm
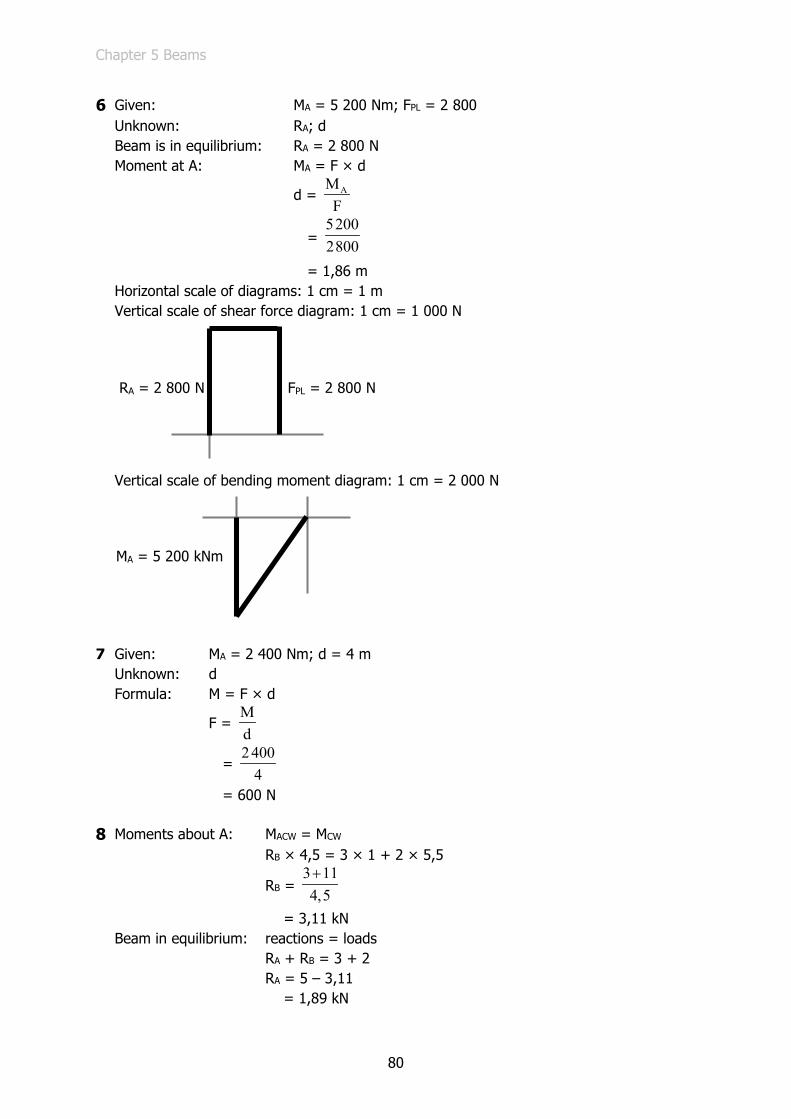
Chapter 5 Beams
80
6 Given: MA = 5 200 Nm; FPL = 2 800 Unknown: RA; d Beam is in equilibrium: RA = 2 800 N Moment at A: MA = F × d
d = AMF
= 52002800
= 1,86 m Horizontal scale of diagrams: 1 cm = 1 m Vertical scale of shear force diagram: 1 cm = 1 000 N
Vertical scale of bending moment diagram: 1 cm = 2 000 N
7 Given: MA = 2 400 Nm; d = 4 m Unknown: d Formula: M = F × d
F = Md
= 2400
4
= 600 N 8 Moments about A: MACW = MCW RB × 4,5 = 3 × 1 + 2 × 5,5
RB = 3 114,5+
= 3,11 kN Beam in equilibrium: reactions = loads RA + RB = 3 + 2 RA = 5 – 3,11 = 1,89 kN
RA = 2 800 N FPL = 2 800 N
MA = 5 200 kNm
Chapter 6 Simple machines
81
Chapter 6 Simple machines Unit 6.1 Levers are simple machines 81 Unit 6.2 The Law of Moments in levers 81 Unit 6.3 Mechanical advantage 84 Experiment 5: Determine the mechanical advantage of a Type 1 Lever 90 Alternative to Experiment 5 93
Unit 6.1 Levers are simple machines (LB page 159)
Quick Activity (LB page 160)
The aim of this activity is to focus learners’ minds on levers. At the end of the activity learners should be aware of levers that they encounter every day.
Expect answers such as: scissors, pliers, paper punch, stapler, etc. Most of the examples will be paired levers.
Quick Activity (LB page 161)
The aim of this activity is to re-activate the concept of paired levers that was learned in Senior Phase Technology.
The objects in the second row are paired levers.
Unit 6.2 The Law of Moments in levers (LB page 162)
Activity 1 Analyse levers using the Law of Moments
NOTE: This activity is missing from the Learner’s Book. Here are the instructions for learners:
1 Calculate the following for Type-1 or Type-2 levers:
a) FE where FL = 10 N; dE = 4 m; dL = 1 m
b) FL where FE = 88 N; dE = 1,6 m; dL = 0,8 m
c) dE where FL = 222 N; FE = 55,5 N; dL = 0,5 m
d) dL where FL = 0,67 N; FE = 0,13 N; dE = 0,05 m
e) FL where FE = 88 N; dE = 0,8 m; dL = 1,6 m
f) dL where FE = 0,67 N; FL = 0,13 N; dE = 0,05 m

Chapter 6 Simple machines
82
2 Do this in groups of three. a) Look at the three worked examples on page 164—165. b) Each of you must choose one of the three examples and design a similar problem, but
with different numbers. For example, if you chose example 3, you might base your example on a fishing rod and specify a larger force, because it takes more force to catch a fish than to hold a little glass tube.
c) Work out the answer to your problem and then give your problem (not your answer) to the second person in your group to do, while you do the problem designed by the third person. Repeat the process so that you all do all three problems.
d) Check your answers and don’t be satisfied until you all get the right answers.
3 a) Repeat Question 1 but with a different device and different numbers. b) Check each other’s answers and be sure that all your answers are correct.
Answers 1 a) Given: FL = 10 N; dE = 4 m; dL = 1 m
Unknown FE
Formula: MA = E
L
dd
= 41
(substitute)
= 4
Formula: MA = L
E
FF
FE = LFMA
(change the subject)
= 104
(substitute)
= 2,5 kN
b) Given: FE = 88 N; dE = 1,6 m; dL = 0,8 m Unknown: FL
Formula: MA = E
L
dd
= 1,60,8
= 2
Formula: MA = L
E
FF
FL = MA × FE (change the subject) = 2 × 88 = 176 N

Chapter 6 Simple machines
83
c) Given: FL = 222 N; FE = 55,5 N; dL = 0,5 m Unknown: dE
Formula: MA = L
E
FF
= 22255,5
= 4
Formula: MA = E
L
dd
dE = MA × dL = 4 × 0,5 = 2 m
d) Given: FL = 0,67 N; FE = 0,13 N; dE = 0,05 m Unknown: dL
Formula: MA = L
E
FF
= 0,670,13
= 5,15
Formula: MA = E
L
dd
dL = EdMA
= 0,055,15
= 0, 01 m
e) Given: FE = 88 N; dE = 0,8 m; dL = 1,6 m Unknown: FL
Formula: MA = E
L
dd
= 0,81,6
= 0,5
Formula: MA = L
E
FF
FL = MA × FE = 0,5 × 88 = 44 N
Chapter 6 Simple machines
84
f) Given: FE = 0,67 N; FL = 0,13 N; dE = 0,05 m Unknown: dL
Formula: MA = L
E
FF
= 0,130,67
= 0,194
Formula: MA = E
L
dd
dL = EdMA
= 0,05
0,194
= 0,258 m 2 Learners’ own examples 3 Learners’ own examples
Unit 6.3 Mechanical advantage (LB page 166)
Activity 2 Calculate the mechanical advantage of a lever (LB page 168)
1 a) MA where FL = 10 N; FE = 2 N
MA = L
E
FF =
102
= 5
and 5 > 1 so it can be Type 1 or Type 2
b) MA where dE = 0,6 m; dL = 1,8 m
MA = E
L
dd =
0,61,8 = 0,33
and 0,33 < 1 so it can be Type 1
c) MA where FL = 0,9 N; FE = 2,7 N
MA = L
E
FF =
0,92,7 = 0,33
and 0,33 < 1 so it can be Type 1
d) MA where dL = 1,6 m; dE = 0,2 m
MA = E
L
dd =
0,21,6 = 0,125
and 0,125 < 1 so it can be Type 1
Chapter 6 Simple machines
85
2 a) MA where FL = 100 N; FE = 200 N
MA = L
E
FF =
100200
= 0,5
and 0,5 < 1 so it can be Type 1 or Type 3
b) MA where dE = 0,03 m; dL = 0,99 m
MA = E
L
dd =
0,030,99 = 0,030
and 0,030 < 1 so it can be Type 1 or Type 3
c) MA where FL = 67 N; FE = 9 N
MA = L
E
FF =
679
= 7,44
and 7,44 > 1 so it can be Type 1
d) MA where dL = 0,03 m; dE = 0,99 m
MA = E
L
dd =
0,990,03 = 33
and 33 > 1 so it can be Type 1 3 a) Given: FL = 400 N; FE = 50 N
Unknown: MA
Formula: MA = L
E
FF
= 40050
= 8
b) Given: dL = 4 cm; dE = 44 cm Unknown: MA
Formula: MA = E
L
dd
= 444
= 11 4 a) Given: FL = 25 N; FE = 50 N
Unknown: MA
Formula: MA = L
E
FF
= 2550
= 0,5
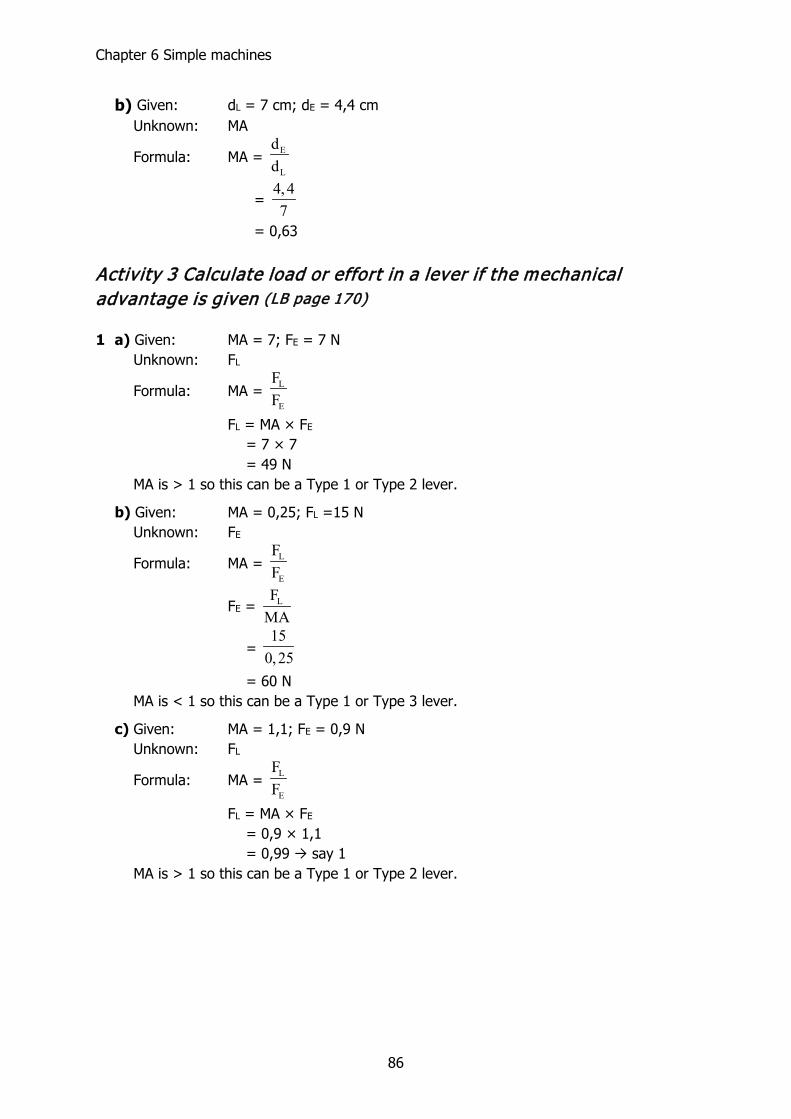
Chapter 6 Simple machines
86
b) Given: dL = 7 cm; dE = 4,4 cm Unknown: MA
Formula: MA = E
L
dd
= 4,47
= 0,63
Activity 3 Calculate load or effort in a lever if the mechanical advantage is given (LB page 170)
1 a) Given: MA = 7; FE = 7 N Unknown: FL
Formula: MA = L
E
FF
FL = MA × FE
= 7 × 7 = 49 N MA is > 1 so this can be a Type 1 or Type 2 lever.
b) Given: MA = 0,25; FL =15 N Unknown: FE
Formula: MA = L
E
FF
FE = LFMA
= 15
0,25
= 60 N MA is < 1 so this can be a Type 1 or Type 3 lever.
c) Given: MA = 1,1; FE = 0,9 N Unknown: FL
Formula: MA = L
E
FF
FL = MA × FE
= 0,9 × 1,1 = 0,99 → say 1 MA is > 1 so this can be a Type 1 or Type 2 lever.

Chapter 6 Simple machines
87
d) Given: MA = 0,5; FL = 15 N Unknown: FE
Formula MA = L
E
FF
FE = LFMA
= 150,5
= 30 N MA is < 1 so this can be a Type 1 or Type 3 lever.
2 Given: FE = 600N; MA = 0,5 Unknown: FL
Formula: MA = L
E
FF
FL = MA × FE
= 0,5 × 600 = 300 N 3 Given: FL = 800N; MA = 1,5 Unknown: FE
Formula: MA = L
E
FF
FE = LFMA
= 8001,5
= 533 N 4 You are able to calculate that the lever will enable you to apply a force of 2,4 N at the
load – that is the force you can apply to hold the steak. But the force you can apply to hold the steak has nothing to do with the force needed to lift the steak out of the fire. So you can find a numerical answer to satisfy the numbers you are given, but you are not given enough information to solve the problem.

Chapter 6 Simple machines
88
Activity 4 Calculate the length of the load arm or effort arm in a lever if the MA is given (LB page 171)
1 a) Given: MA = 0,4; dL = 0,6 m Unknown: dE
Formula: MA = E
L
dd
dE = MA × dL = 0,4 × 0,6 = 0,24 m MA is < 1 so this can be a Type 1 or Type 3 lever.
b) Given: MA = 0,8; dE = 1,33 m Unknown: dL
Formula: MA = E
L
dd
dL = EdMA
= 1,330,8
= 1,66 m MA is < 1 so this can be a Type 1 or Type 3 lever.
c) Given: MA = 3,5; dL = 0,25 m Unknown: dE
Formula: MA = E
L
dd
dE = MA × dL = 3,5 × 0,25 = 0,875 m MA is > 1 so this can be a Type 1 or Type 2 lever.
d) Given: MA = 1,2; dE = 1,33 m Unknown: dL
Formula: MA = E
L
dd
dL = EdMA
= 1,331,2
= 1,11 m MA is > 1 so this can be a Type 1 or Type 2 lever.

Chapter 6 Simple machines
89
2 Given: MA = 2; dE = 36 mm Unknown: dL
Formula: MA = E
L
dd
dL = EdMA
= 362
= 18 mm 3 Given: MA = 0,5; dL = 18 mm
Unknown: dE
Formula: MA = E
L
dd
dE = MA × dL = 0,5 × 18 = 9 mm
4 Given: FE = 40 N; FL = 100 N; dL = 0,1 m
Unknowns: MA and dE
Formula (based on force): MA = L
E
FF
= 10040
= 2,5
Formula (based on arm length); MA = E
L
dd
dE = MA × dL = 2,2 × 0,1 = 0,22 m
Activity 5 Using MA = L
E
FF and MA = E
L
dd (LB page 173)
1 a) Given: dL = 0,1 m; dE = 0,7 m Unknown: MA
Formula: MA = E
L
dd
= 0,70,1
= 7
Chapter 6 Simple machines
90
b) Given: MA = 7; effort = 50 N Unknown: load Formula: load = MA × effort = 7 × 50 = 350 N
Experiment 5: Determine the mechanical advantage of a Type 1 Lever (LB page 174)
NOTE: The wording of this “experiment” in the curriculum gives cause to interrogate the aim of the curriculum writer. To determine the mechanical advantage of a given Type 1 lever you just have to measure the lengths of the lever arms and insert them in the formula
MA = E
L
dd . Clearly the curriculum writer had a greater challenge in mind. The list of
materials in the curriculum document (spring balances, mass pieces, etc.) suggests the experiment set out in the learners’ book.
A simpler approach is offered in the Alternative to Experiment 5 that follows. The educator, however, might wish to follow a different line of reasoning.
This is the third of ten experiments that must be assessed informally.
Learners will work in groups of four to fulfil the aim of the experiment:
• using the given apparatus • following the process described in the learner book.
The following form, Record of Assessment of Experiment 5: Determine the mechanical advantage of a type I lever and the Assessment Rubric for Experiments may be used to guide informal assessment of the learners’ work.
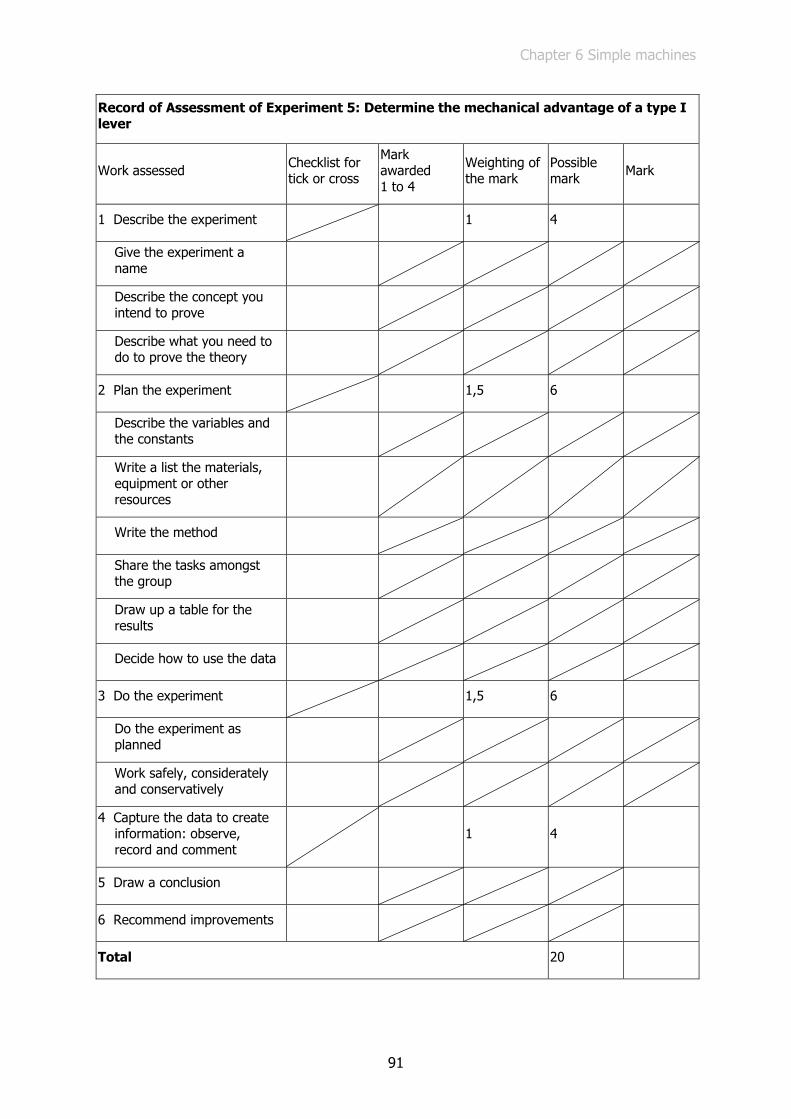
Chapter 6 Simple machines
91
Record of Assessment of Experiment 5: Determine the mechanical advantage of a type I lever
Work assessed Checklist for tick or cross
Mark awarded 1 to 4
Weighting of the mark
Possible mark Mark
1 Describe the experiment 1 4
Give the experiment a name
Describe the concept you intend to prove
Describe what you need to do to prove the theory
2 Plan the experiment 1,5 6
Describe the variables and the constants
Write a list the materials, equipment or other resources
Write the method
Share the tasks amongst the group
Draw up a table for the results
Decide how to use the data
3 Do the experiment 1,5 6
Do the experiment as planned
Work safely, considerately and conservatively
4 Capture the data to create information: observe, record and comment
1 4
5 Draw a conclusion
6 Recommend improvements
Total 20
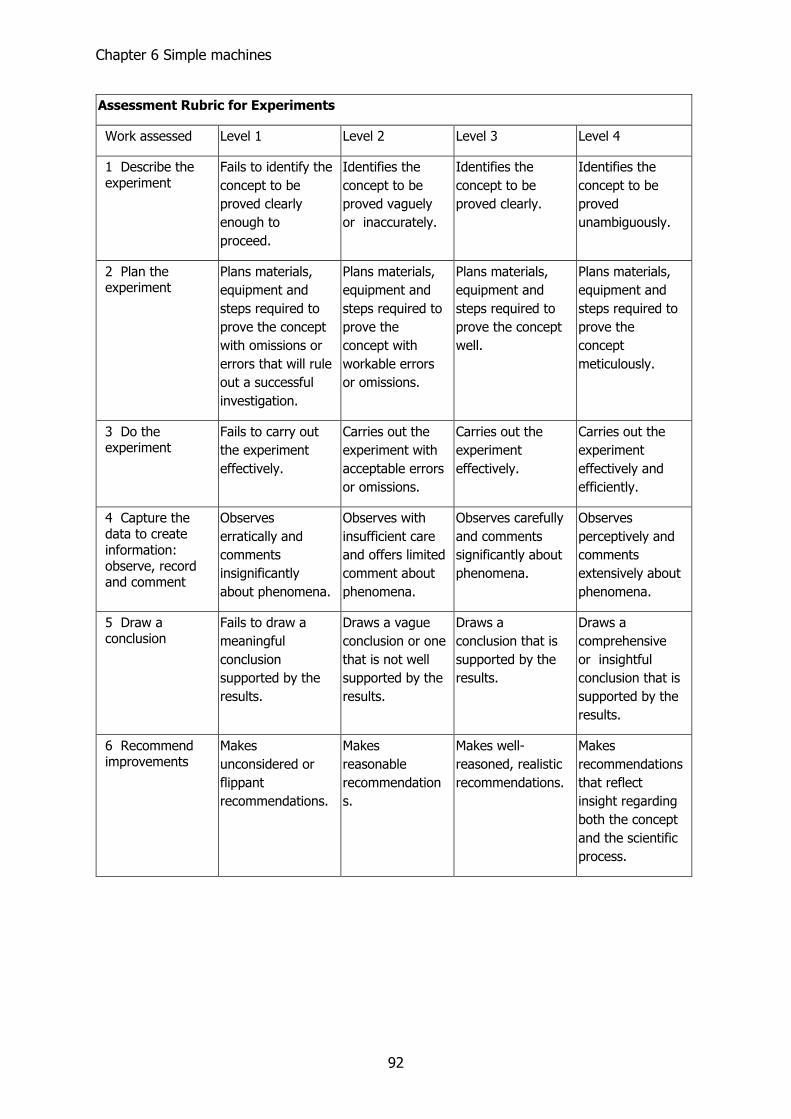
Chapter 6 Simple machines
92
Assessment Rubric for Experiments
Work assessed Level 1 Level 2 Level 3 Level 4
1 Describe the experiment
Fails to identify the concept to be proved clearly enough to proceed.
Identifies the concept to be proved vaguely or inaccurately.
Identifies the concept to be proved clearly.
Identifies the concept to be proved unambiguously.
2 Plan the experiment
Plans materials, equipment and steps required to prove the concept with omissions or errors that will rule out a successful investigation.
Plans materials, equipment and steps required to prove the concept with workable errors or omissions.
Plans materials, equipment and steps required to prove the concept well.
Plans materials, equipment and steps required to prove the concept meticulously.
3 Do the experiment
Fails to carry out the experiment effectively.
Carries out the experiment with acceptable errors or omissions.
Carries out the experiment effectively.
Carries out the experiment effectively and efficiently.
4 Capture the data to create information: observe, record and comment
Observes erratically and comments insignificantly about phenomena.
Observes with insufficient care and offers limited comment about phenomena.
Observes carefully and comments significantly about phenomena.
Observes perceptively and comments extensively about phenomena.
5 Draw a conclusion
Fails to draw a meaningful conclusion supported by the results.
Draws a vague conclusion or one that is not well supported by the results.
Draws a conclusion that is supported by the results.
Draws a comprehensive or insightful conclusion that is supported by the results.
6 Recommend improvements
Makes unconsidered or flippant recommendations.
Makes reasonable recommendations.
Makes well-reasoned, realistic recommendations.
Makes recommendations that reflect insight regarding both the concept and the scientific process.
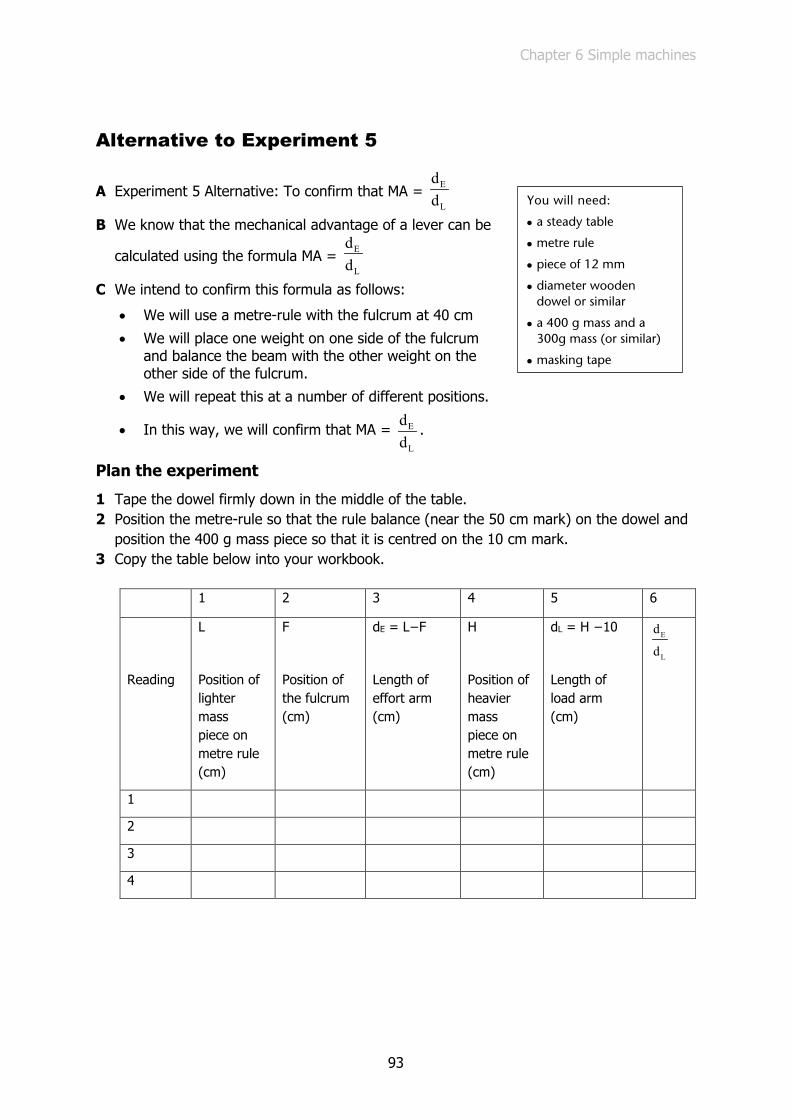
Chapter 6 Simple machines
93
Alternative to Experiment 5
A Experiment 5 Alternative: To confirm that MA = E
L
dd
B We know that the mechanical advantage of a lever can be
calculated using the formula MA = E
L
dd
C We intend to confirm this formula as follows:
• We will use a metre-rule with the fulcrum at 40 cm • We will place one weight on one side of the fulcrum
and balance the beam with the other weight on the other side of the fulcrum.
• We will repeat this at a number of different positions.
• In this way, we will confirm that MA = E
L
dd
.
Plan the experiment
1 Tape the dowel firmly down in the middle of the table. 2 Position the metre-rule so that the rule balance (near the 50 cm mark) on the dowel and
position the 400 g mass piece so that it is centred on the 10 cm mark. 3 Copy the table below into your workbook.
1 2 3 4 5 6
Reading
L
Position of lighter mass piece on metre rule (cm)
F
Position of the fulcrum (cm)
dE = L−F
Length of effort arm (cm)
H
Position of heavier mass piece on metre rule (cm)
dL = H −10
Length of load arm (cm)
E
L
d
d
1
2
3
4
You will need:
• a steady table
• metre rule
• piece of 12 mm
• diameter wooden dowel or similar
• a 400 g mass and a 300g mass (or similar)
• masking tape
Chapter 6 Simple machines
94
Do the experiment
1 Check that the rule is in balance. 2 Position the lighter mass piece on the opposite side of the fulcrum so that the heavier
mass just lifts off the table and the metre rule is in equilibrium. 3 Read the positions of the light mass (L), of the fulcrum (F) and the heavier mass (H)
and record them in the table. 4 Position the heavier mass slightly closer to the fulcrum and adjust the position of the
lighter mass to achieve equilibrium again. Take the three readings and record them in the table.
5 Repeat (4) at two more positions. Use the data to create information
A Compare the values in column 6 for each row of data. B If each of the numbers is “just about the same*”, you have confirmed that for a Type 1
Lever in equilibrium, MA = E
L
dd
C If the numbers are not “just about the same”, then the theory is wrong, or there is something wrong with the experiment. Which do you think it is?
D Experimental error: *When you do an experiment, because the equipment and the conditions are not perfect and because the people doing the experiment might not be careful enough, experimental errors creep in. So experimenters, such as us, have to develop judgement about what is acceptable error.
Draw a conclusion
Describe, in a written sentence, how the information that you have created confirms the concept that you set out to prove, or does not prove it.
Recommendation
Think about the experiment and write down suggestions on how to do it better.

Chapter 7 Energy
95
Chapter 7 Energy Unit 7.1 Gravitational potential energy 95 Experiment 6: Determine the gravitational potential energy of an object at different heights by calculation and by investigation 98 Unit 7.2 Kinetic energy 100 Unit 7.3 Mechanical energy 104 Challenges and projects 108
NOTE: A reminder that when you write calculations on the board, instead of using a forward slash, use vertical fractions.
= 4 000/(9,81 × 15) should be written on the board as = 4 000
9,81 15×
Preview the chapter
Ask the learners to preview the chapter for homework before you begin.
Unit 7.1 Gravitational potential energy (LB page 179)
Activity 1 Investigate the effect of height and mass when a ball rolls down a ramp (LB page 180)
Questions to lead the discussion:
1 What mass ball bearings did you use? How did you represent these on your graph? 2 Think about your results for the three different masses of ball bearings. How far did each
of these roll? 3 What did your graph of mass versus distance show you? 4 What heights did you choose? How did you represent these on your graph? 5 Think about your results for the different heights. What was the relationship between
height and distance?
Challenge: 6 Can you think of a relationship that exists for both height AND mass on the one hand and
distance on the other? How could you say this? 7 Try to write a sentence which includes your thinking about Question 6.
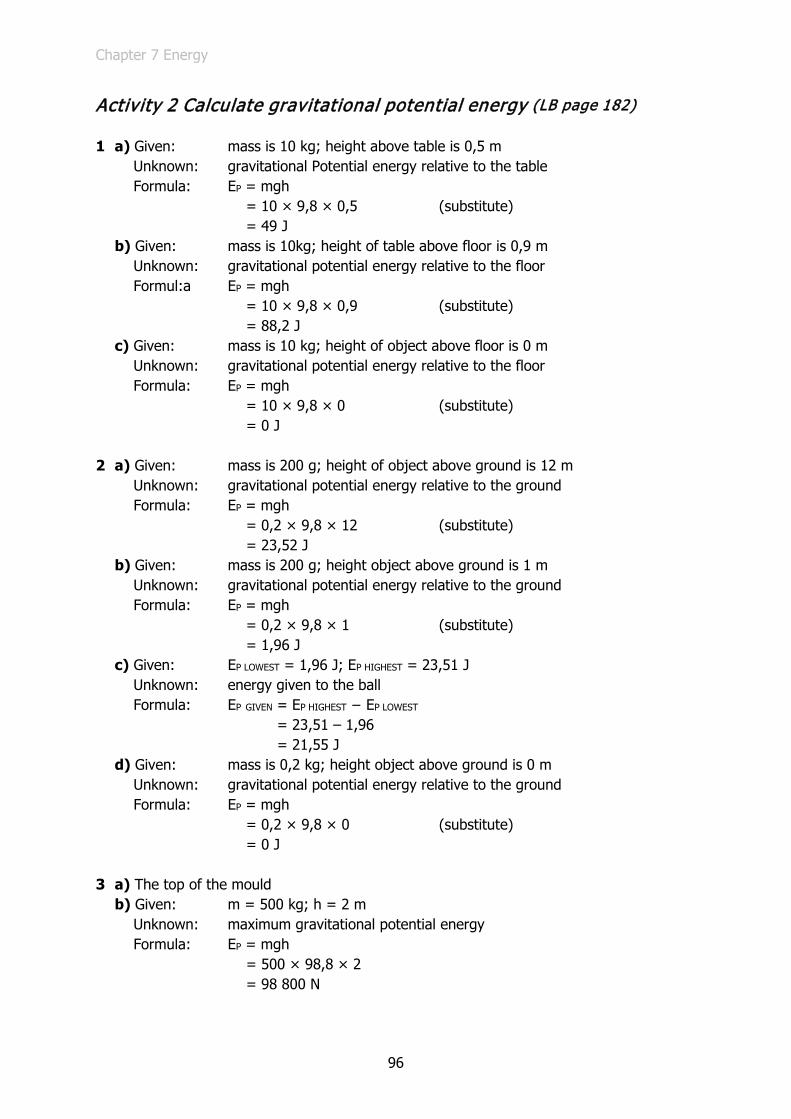
Chapter 7 Energy
96
Activity 2 Calculate gravitational potential energy (LB page 182)
1 a) Given: mass is 10 kg; height above table is 0,5 m Unknown: gravitational Potential energy relative to the table Formula: EP = mgh = 10 × 9,8 × 0,5 (substitute) = 49 J b) Given: mass is 10kg; height of table above floor is 0,9 m Unknown: gravitational potential energy relative to the floor Formul:a EP = mgh = 10 × 9,8 × 0,9 (substitute) = 88,2 J c) Given: mass is 10 kg; height of object above floor is 0 m Unknown: gravitational potential energy relative to the floor Formula: EP = mgh = 10 × 9,8 × 0 (substitute) = 0 J
2 a) Given: mass is 200 g; height of object above ground is 12 m
Unknown: gravitational potential energy relative to the ground Formula: EP = mgh = 0,2 × 9,8 × 12 (substitute) = 23,52 J b) Given: mass is 200 g; height object above ground is 1 m Unknown: gravitational potential energy relative to the ground Formula: EP = mgh = 0,2 × 9,8 × 1 (substitute) = 1,96 J c) Given: EP LOWEST = 1,96 J; EP HIGHEST = 23,51 J Unknown: energy given to the ball Formula: EP GIVEN = EP HIGHEST − EP LOWEST
= 23,51 – 1,96 = 21,55 J d) Given: mass is 0,2 kg; height object above ground is 0 m Unknown: gravitational potential energy relative to the ground Formula: EP = mgh = 0,2 × 9,8 × 0 (substitute) = 0 J
3 a) The top of the mould
b) Given: m = 500 kg; h = 2 m Unknown: maximum gravitational potential energy Formula: EP = mgh = 500 × 98,8 × 2 = 98 800 N
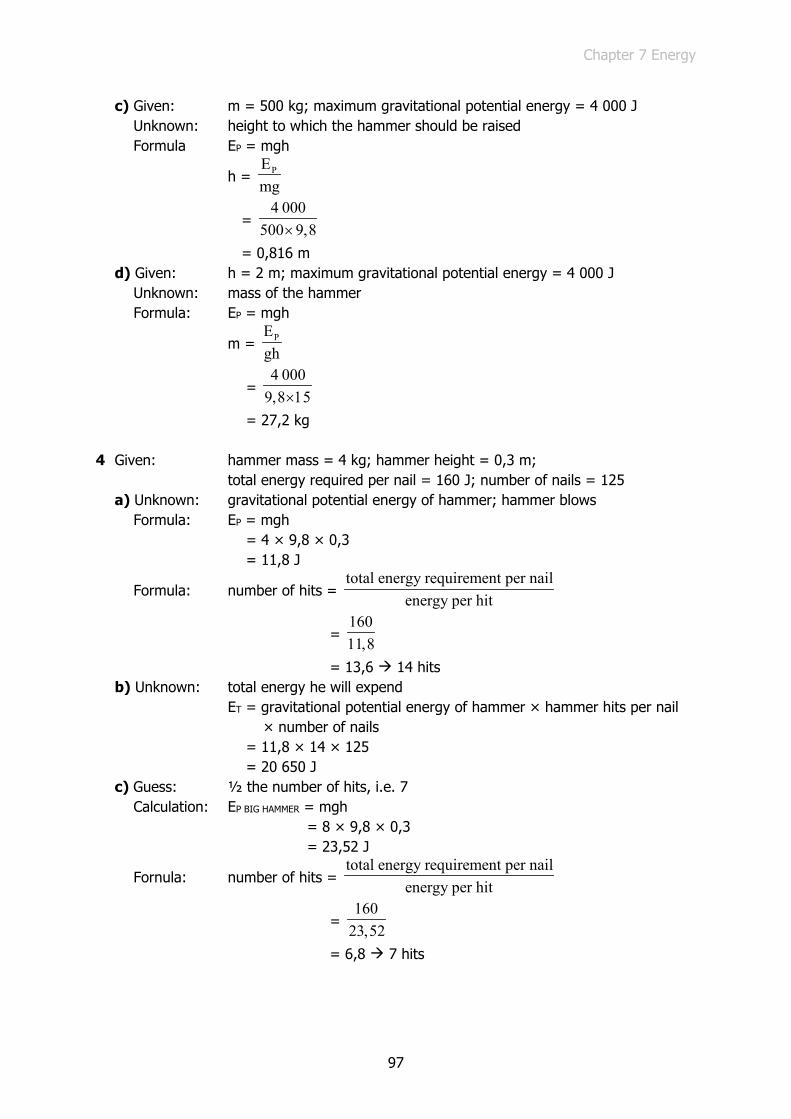
Chapter 7 Energy
97
c) Given: m = 500 kg; maximum gravitational potential energy = 4 000 J Unknown: height to which the hammer should be raised Formula EP = mgh
h = PEmg
= 4 000
500 9,8×
= 0,816 m d) Given: h = 2 m; maximum gravitational potential energy = 4 000 J Unknown: mass of the hammer Formula: EP = mgh
m = PEgh
= 4 000
9,8×15
= 27,2 kg 4 Given: hammer mass = 4 kg; hammer height = 0,3 m; total energy required per nail = 160 J; number of nails = 125
a) Unknown: gravitational potential energy of hammer; hammer blows Formula: EP = mgh = 4 × 9,8 × 0,3 = 11,8 J
Formula: number of hits = total energy requirement per nail
energy per hit
= 16011,8
= 13,6 14 hits b) Unknown: total energy he will expend ET = gravitational potential energy of hammer × hammer hits per nail
× number of nails = 11,8 × 14 × 125 = 20 650 J c) Guess: ½ the number of hits, i.e. 7 Calculation: EP BIG HAMMER = mgh = 8 × 9,8 × 0,3 = 23,52 J
Fornula: number of hits = total energy requirement per nail
energy per hit
= 160
23,52
= 6,8 7 hits

Chapter 7 Energy
98
Experiment 6: Determine the gravitational potential energy of an object at different heights (LB page 184)
This is the fourth of ten experiments that will be assessed informally with the aid of the forms Record of Assessment of Investigation 6: Determine the gravitational potential energy of an object at various heights and Assessment Rubric for Experiments, which you will find on the following pages.
Learners work in groups of four to fulfil the aim of the experiment:
• using the apparatus given • following the process described in the learners’ book.
In their notebooks, learners record:
• what they do • what they observe • comments on their observations.
NOTE: A large steel ball about 30 mm in diameter is often used, but is easily lost. The author used a 10 mm × 200 mm bolt, with nuts to secure a number of 40 mm washers on the bolt. It is easy to drop accurately and the mass can be increased by adding more washers if necessary.
Hints
• The bucket must not be flimsy – if it flexes when the object hits the sand the shape might be destroyed.
• Put sand underneath the bucket to prevent the base from flexing. • The sand in the bucket should be loosened and levelled after each drop (as you would
do in a long-jump pit).
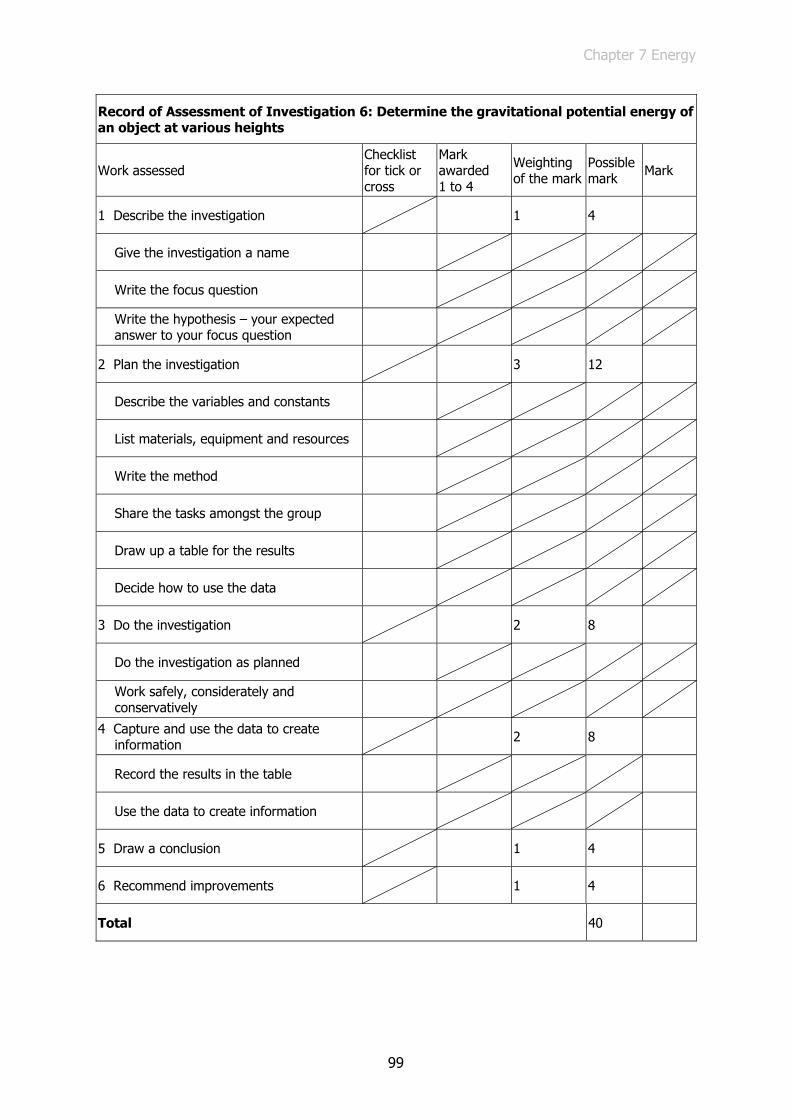
Chapter 7 Energy
99
Record of Assessment of Investigation 6: Determine the gravitational potential energy of an object at various heights
Work assessed Checklist for tick or cross
Mark awarded 1 to 4
Weighting of the mark
Possible mark Mark
1 Describe the investigation 1 4
Give the investigation a name
Write the focus question
Write the hypothesis – your expected answer to your focus question
2 Plan the investigation 3 12
Describe the variables and constants
List materials, equipment and resources
Write the method
Share the tasks amongst the group
Draw up a table for the results
Decide how to use the data
3 Do the investigation 2 8
Do the investigation as planned
Work safely, considerately and conservatively
4 Capture and use the data to create information 2 8
Record the results in the table
Use the data to create information
5 Draw a conclusion 1 4
6 Recommend improvements 1 4
Total 40
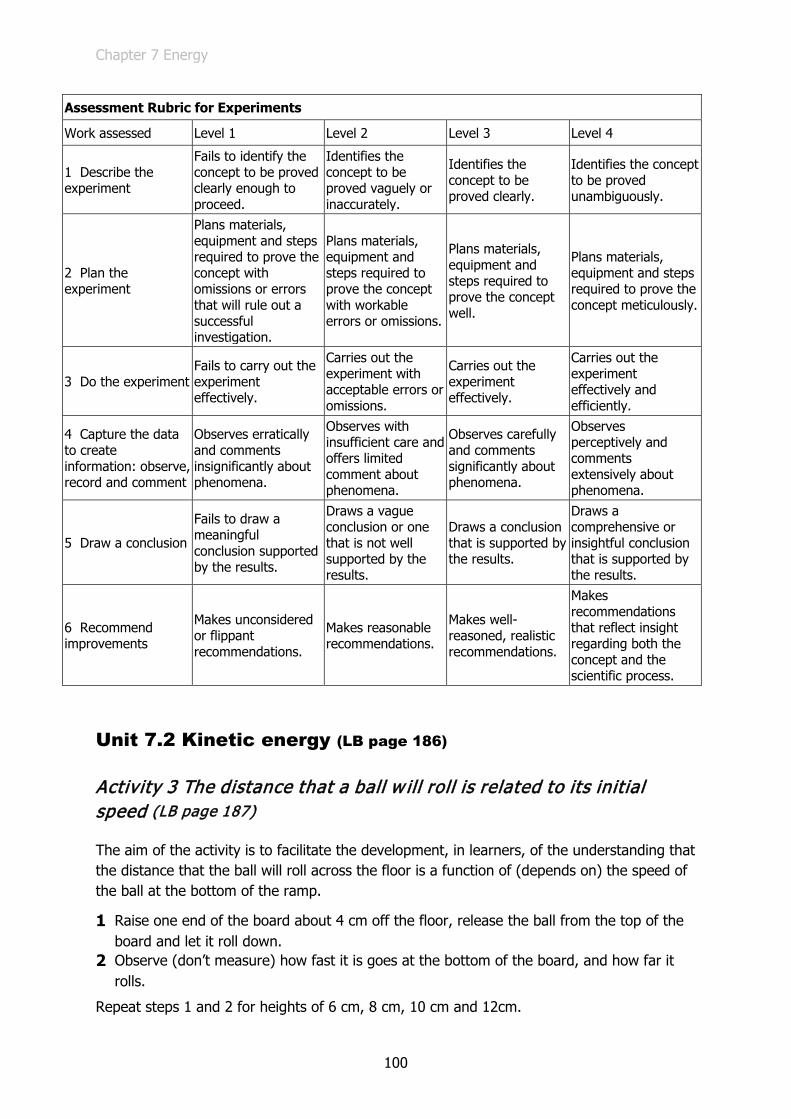
Chapter 7 Energy
100
Assessment Rubric for Experiments
Work assessed Level 1 Level 2 Level 3 Level 4
1 Describe the experiment
Fails to identify the concept to be proved clearly enough to proceed.
Identifies the concept to be proved vaguely or inaccurately.
Identifies the concept to be proved clearly.
Identifies the concept to be proved unambiguously.
2 Plan the experiment
Plans materials, equipment and steps required to prove the concept with omissions or errors that will rule out a successful investigation.
Plans materials, equipment and steps required to prove the concept with workable errors or omissions.
Plans materials, equipment and steps required to prove the concept well.
Plans materials, equipment and steps required to prove the concept meticulously.
3 Do the experiment Fails to carry out the experiment effectively.
Carries out the experiment with acceptable errors or omissions.
Carries out the experiment effectively.
Carries out the experiment effectively and efficiently.
4 Capture the data to create information: observe, record and comment
Observes erratically and comments insignificantly about phenomena.
Observes with insufficient care and offers limited comment about phenomena.
Observes carefully and comments significantly about phenomena.
Observes perceptively and comments extensively about phenomena.
5 Draw a conclusion
Fails to draw a meaningful conclusion supported by the results.
Draws a vague conclusion or one that is not well supported by the results.
Draws a conclusion that is supported by the results.
Draws a comprehensive or insightful conclusion that is supported by the results.
6 Recommend improvements
Makes unconsidered or flippant recommendations.
Makes reasonable recommendations.
Makes well-reasoned, realistic recommendations.
Makes recommendations that reflect insight regarding both the concept and the scientific process.
Unit 7.2 Kinetic energy (LB page 186)
Activity 3 The distance that a ball w ill roll is related to its initial speed (LB page 187)
The aim of the activity is to facilitate the development, in learners, of the understanding that the distance that the ball will roll across the floor is a function of (depends on) the speed of the ball at the bottom of the ramp.
1 Raise one end of the board about 4 cm off the floor, release the ball from the top of the board and let it roll down.
2 Observe (don’t measure) how fast it is goes at the bottom of the board, and how far it rolls.
Repeat steps 1 and 2 for heights of 6 cm, 8 cm, 10 cm and 12cm.

Chapter 7 Energy
101
3 Discuss and describe in writing: the relationship of the speed of the ball at the bottom of the board to the distance the ball rolls.
Activity 4 Calculate k inetic energy (LB page 189)
1 a) Given: m = 10 kg; v = 10 m/s Unknown: EK
Formula: EK = 12
mv2
= 0,5 × 10 × 102
= 500 J
b) Given: m = 1 kg; v = 100 m/s Unknown: EK
Formula EK = 12
mv2
= 0,5 × 1 × 1002
= 5 000 J
c) Given: m = 100 kg; v = 100 m/s Unknown: EK
Formula: EK = 12
mv2
= 0,5 × 100 × 12
= 50 J
d) The effect of the factor ”v2” is much greater than the effect of the factor “m”.
2 Given: m = 4 kg; v = 9,3 m/s Unknown: EK
Formula: EK = 12
mv2
= 0,5 × 4 × 9,32
= 173,0 J 3 Given: m = 700 kg; v = 300 km/h Remind the learners that they must always convert all quantities to SI units.
Conversion: 300 km/h = 300 1000
3 600×
= 83,3 m/s
Unknown : EK
Formula EK = 12
mv2
= 0,5 × 700 × 83,32
= 2 430 000 J

Chapter 7 Energy
102
Given: m = 70 000 kg; v = 30 km/h
Conversion: 30 km/h = 30 1000
3 600×
= 8,33 m/s
Unknown: EK
Formula: EK = 12
mv2
= 0,5 × 70 000 × 8,332
= 2 430 000 J Ask the learners to explain how a small car moving at 300 km/h can have the same
kinetic energy as a large truck, with a mass 100 times greater, going 10 times slower. (The answer is that the kinetic energy depends on the square of the speed.)
4 a) Given: m = 10 kg; v = 2 m/s
Unknown: EK
Formula EK = 12
mv2
= 0,5 × 60 × 22
= 120 J
b) Given: m = 1 000 kg; v = 60 km/h
Conversion: 60 km/h = 60 1000
3 600×
= 16,7 m/s
Unknown: EK
Formula EK = 12
mv2
= 0,5 × 1 000 × 16,72
= 139 400 J
c) Questions 4a and 4b are “normal” situations. These things happen.
Ratio of car’s kinetic energy to person’s kinetic energy = 139 400
120
= 1 162 about 1 000 People walk into doors and cars crash into walls, but the different kinetic energies
have very different consequences. 5 a) Given: m = 0,45 kg; v = 30 m/s
Unknown: EK
Formula: EK = 12
mv2
= 0,5 × 0,45 × 302
= 202,5 J

Chapter 7 Energy
103
b) Given: m = 0,45 kg; v = 15 m/s Unknown: EK
Formula: EK = 12
mv2
= 0,5 × 0,45 × 152
= 50,6 J
c) The ratio of the speeds is 3015
= 2
The ratio of the kinetic energies is 202,550,6 = 4
The difference in the ratios is because the speed is squared.
6 a) Given: m = 0,16 kg; v = 22 m/s Unknown: EK
Formula EK = 12
mv2
= 0,5 × 0,16 × 222
= 38,7 J
b) Given: m = 0,16 kg; KE = 122 J Unknown: v
Formula: EK = 12
mv2
v = K2 Em×
= 2 1220,16×
= 39,1 m/s
c) Given: m = 0,16 kg; v is 50% of 39,1 m/s Unknown: EK
Formula: EK = 12
mv2
= 0,5 × 0,16 × (0,5 × 39,1)2
= 30,7 J

Chapter 7 Energy
104
Unit 7.3 Mechanical energy (LB page 190)
Activity 5 Calculate mechanical energy (LB page 192)
Do these activities in pairs.
1 Given: EP = 30 J; EK = 40 J Unknown : EM Formula: EM = EP + EK
= 30 + 40 = 70 J 2 Given: EP = 4,2 J; EM = 11,5 J Unknown: EK Formula: EM = EP + EK
EK = EM − EP = 11,5 – 4,2 = 7,3 J 3 Given: EK = 44,2 J; EM = 111,5 J Unknown: EP Formula: EM = EP + EK
EP = EM − EK = 111,5 – 44,2 = 67,3 J 4 Given: EM = 200 J; m = 6 kg; h = 4 m Unknown : EP; EK and v Formula for EP: EP = mgh = 6 × 9,8 × 4 = 235,2 J Formula: EM = EP + EK EK = EM − EP (change subject) = 400 – 235,2 (substitute) = 164,8 J
Formula for v: EK = 12
mv2
v = K2 Em×
(change subject)
= 2 164,8
6×
(substitute)
= 7,41 m/s
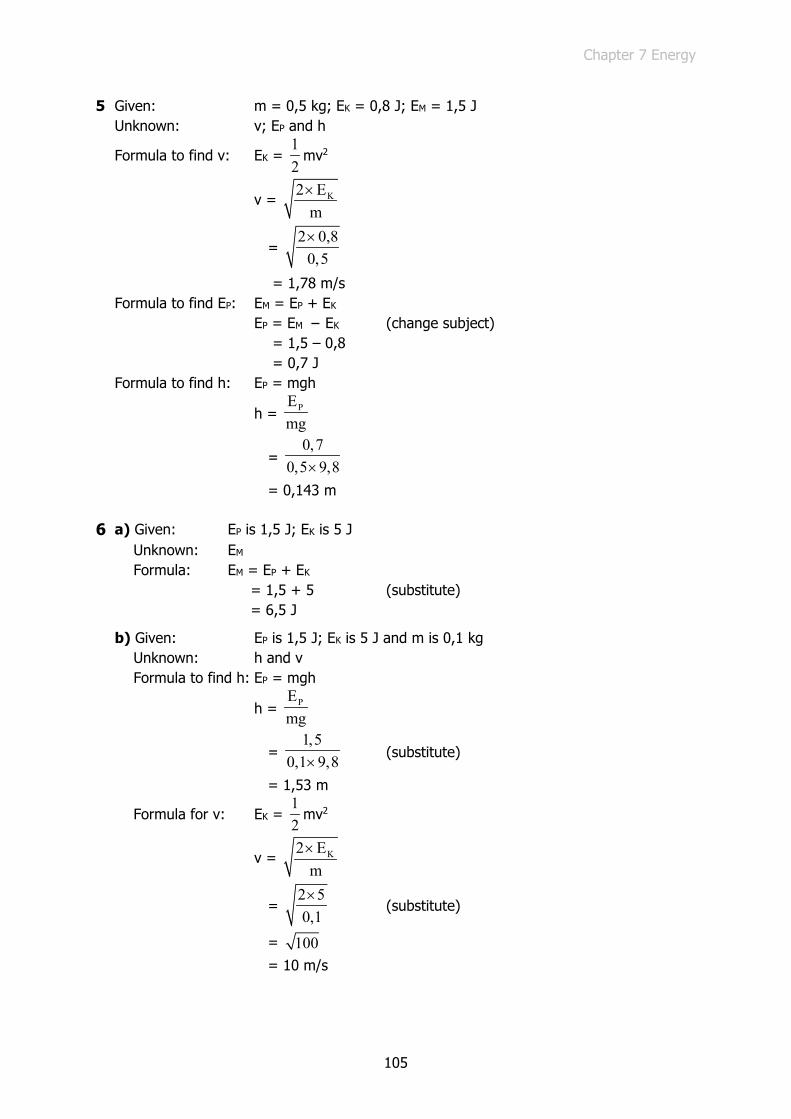
Chapter 7 Energy
105
5 Given: m = 0,5 kg; EK = 0,8 J; EM = 1,5 J Unknown: v; EP and h
Formula to find v: EK = 12
mv2
v = K2 Em×
= 2 0,8
0,5×
= 1,78 m/s Formula to find EP: EM = EP + EK
EP = EM − EK (change subject)
= 1,5 – 0,8 = 0,7 J Formula to find h: EP = mgh
h = PEmg
= 0,7
0,5 9,8×
= 0,143 m 6 a) Given: EP is 1,5 J; EK is 5 J
Unknown: EM Formula: EM = EP + EK = 1,5 + 5 (substitute) = 6,5 J
b) Given: EP is 1,5 J; EK is 5 J and m is 0,1 kg Unknown: h and v Formula to find h: EP = mgh
h = PEmg
= 1,5
0,1 9,8× (substitute)
= 1,53 m
Formula for v: EK = 12
mv2
v = K2 Em×
= 20,1×5
(substitute)
= 100
= 10 m/s

Chapter 7 Energy
106
7 a) Given: h = 1,2m; m = 62 + 12 = 74 kg Unknown: EP
Formula: EP = mgh = 74 × 9,8 × 1,2 = 870 J b) Given: v = 35 km/h; m = 74 kg
Conversion: 35 km/h = 35 1000
3 600×
= 9,7 m/s
Unknown: EK
Formula: EK = 12
mv2
= 0,5 × 74 × 9,72 = 3 481 J
8 a) Given: m = 4 kg; v = 12,2 m/s Unknown: EK
Formula: EK = 12
mv2
= 0,5 × 4 × 12,22
= 297,7 J b) Given: EK = 297,7 J as the brick left the hand; h = 1,8 m when the brick left the hand Unknown: EM of brick as it was thrown Formula: EM = EP + EK
= mgh + 12
mv2
= 4 × 9,8 × 1,8 + 297,7 = 70,6 + 297,7 = 368,3 J At highest point: EM = EP + EK
EP = EM − EK
= 368,3 – 0 = 368,3 Formula for h: EP = mgh
h = PEmg
= 368,34 9,8×
= 9,4 m
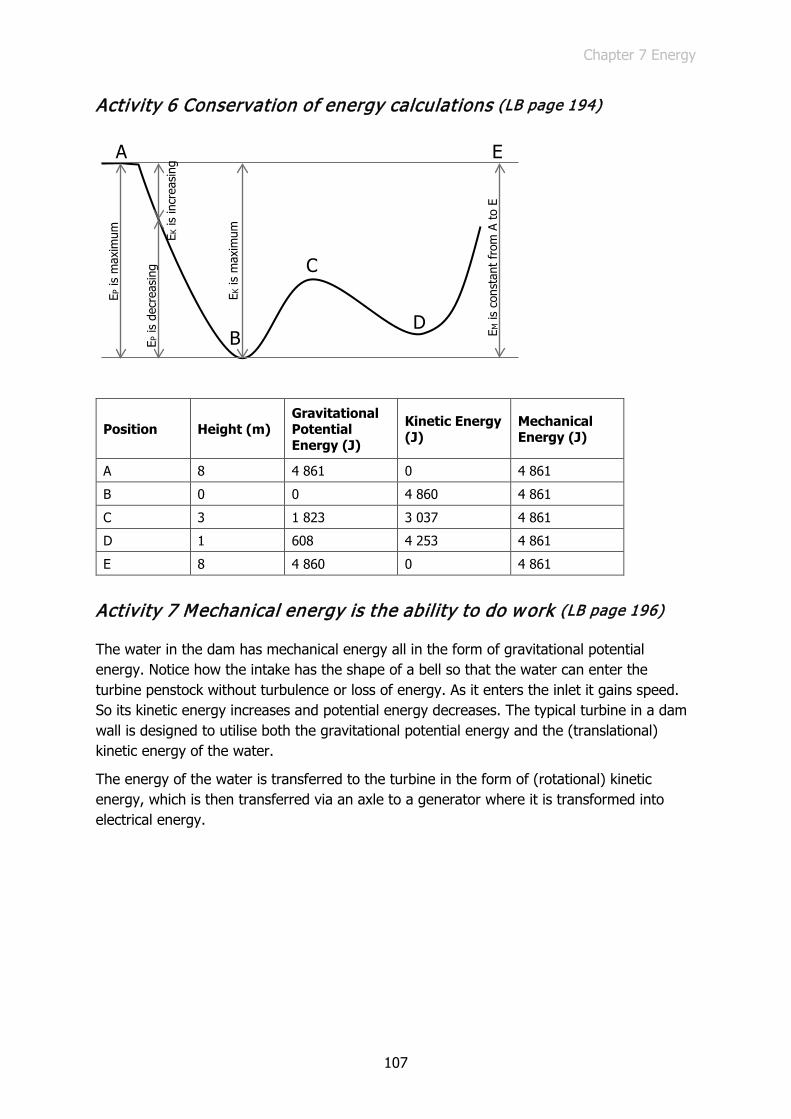
Chapter 7 Energy
107
Activity 6 Conservation of energy calculations (LB page 194)
Position Height (m) Gravitational Potential Energy (J)
Kinetic Energy (J)
Mechanical Energy (J)
A 8 4 861 0 4 861
B 0 0 4 860 4 861
C 3 1 823 3 037 4 861
D 1 608 4 253 4 861
E 8 4 860 0 4 861
Activity 7 Mechanical energy is the ability to do work (LB page 196)
The water in the dam has mechanical energy all in the form of gravitational potential energy. Notice how the intake has the shape of a bell so that the water can enter the turbine penstock without turbulence or loss of energy. As it enters the inlet it gains speed. So its kinetic energy increases and potential energy decreases. The typical turbine in a dam wall is designed to utilise both the gravitational potential energy and the (translational) kinetic energy of the water.
The energy of the water is transferred to the turbine in the form of (rotational) kinetic energy, which is then transferred via an axle to a generator where it is transformed into electrical energy.
B
C
D
A E
E P is
max
imum
E P is
dec
reas
ing
E K is
incr
easi
ng
E K is
max
imum
E M is
con
stan
t fr
om A
to
E

Chapter 7 Energy
108
Challenges and projects (LB page 197)
Challenge 1: Roll balls from a height
1 a) Ep = mgh = 0,2 × 9,8 × 3 = 5,88 J b) EM = EP + Ek = 5,88 + 0 = 5,88 J c) EP = mgh = 0,2 × 9,8 × 0 = 0 J d) EM = 5,88 J (it is constant) e) EK = EM − EP = 5,88 – 0 = 5,88 J
f) EK = 12
mv2
so v = K2×Em
= 2×5,88
0,2
= 7,67 m/s 2 a) Ep = mgh = 0,4 × 9,8 × 3 = 11,76 J
b) EM = EP + EK = 11,76 + 0 = 11,76 J c) EP= mgh = 0,2 × 9,8 × 0 = 0 J d) EM = 11,76 J (it is constant) e) EK = EM − EP = 11,76 – 0 = 11,76 J
f) EK = 12
mv2
so v = K2×Em
= 2×11,76
0,4
= 7,67 m/s
3 There would be no change. The conditions in our experiment are exactly the same as in a free falling experiment.
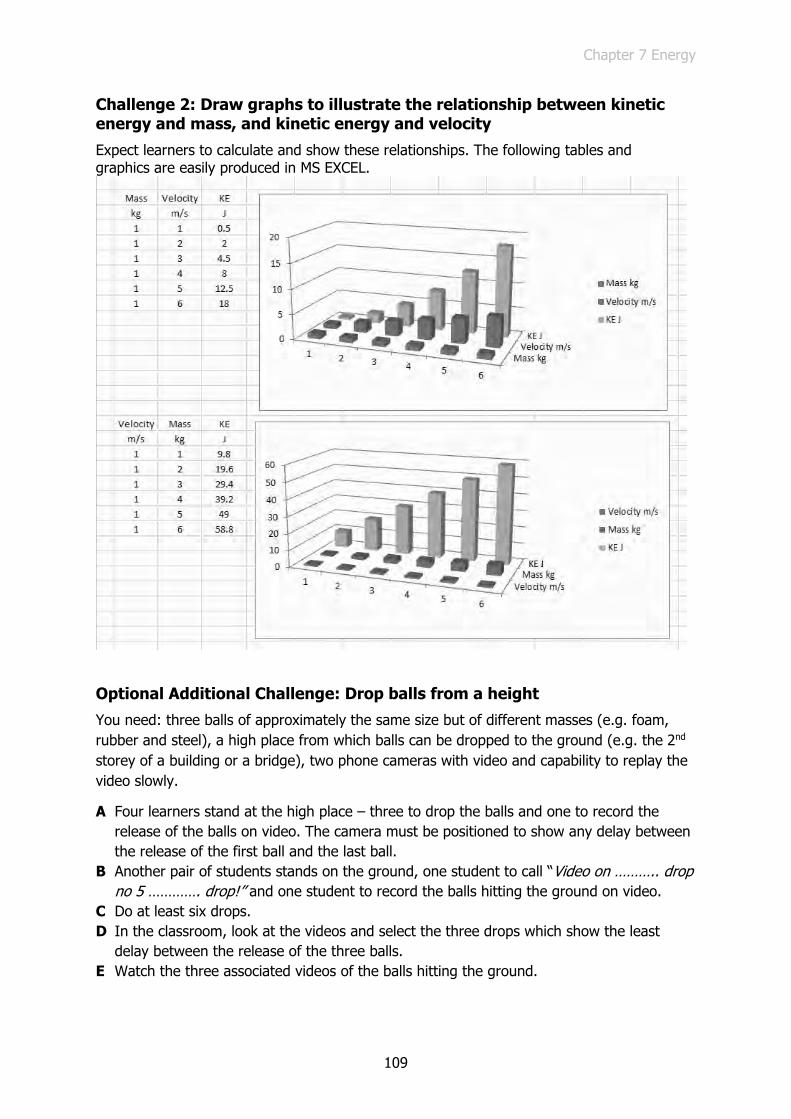
Chapter 7 Energy
109
Challenge 2: Draw graphs to illustrate the relationship between kinetic energy and mass, and kinetic energy and velocity
Expect learners to calculate and show these relationships. The following tables and graphics are easily produced in MS EXCEL.
Optional Additional Challenge: Drop balls from a height
You need: three balls of approximately the same size but of different masses (e.g. foam, rubber and steel), a high place from which balls can be dropped to the ground (e.g. the 2nd storey of a building or a bridge), two phone cameras with video and capability to replay the video slowly.
A Four learners stand at the high place – three to drop the balls and one to record the release of the balls on video. The camera must be positioned to show any delay between the release of the first ball and the last ball.
B Another pair of students stands on the ground, one student to call “Video on ……….. drop no 5 …………. drop!” and one student to record the balls hitting the ground on video.
C Do at least six drops. D In the classroom, look at the videos and select the three drops which show the least
delay between the release of the three balls. E Watch the three associated videos of the balls hitting the ground.

Chapter 7 Energy
110
Questions
1 Discuss the speed with which the three balls fall. Do the results surprise you? 2 On the basis of the observations that you just made, make a statement about the
relationship between the speed of a falling object and: • the height from which it drops • the mass of the object.

Chapter 8 Properties of materials
111
Chapter 8 Properties of materials
Unit 8.1 Strength of materials 111 Unit 8.2 Density of materials 113 Unit 8.3 Magnetic and non-magnetic materials 114 Experiment 9: Which materials are non-magnetic? 114 Unit 8.4 Melting and boiling points 115 Challenges and projects 117
Preview the chapter
1 Unit 8.1 is about strength of materials; what are the sub-headings in the Unit? 2 Unit 8.2 is about density. You see a person carrying an aluminium ladder easily. What is
the difference between steel and aluminium? 3 Are all materials magnetic? Find the unit where you will learn about this.
Notes on the preview activity
• The activity should not take more than about 15 minutes. It can be set for homework. • The purpose of the preview exercise is to develop the learners’ study skills. It is not for
assessment and the questions don’t ask for explanations. However, learners should report on what they find in the chapter as they answer the questions.
• We are teaching learners how to learn; that includes teaching them to read effectively. Effective readers usually preview unfamiliar material to get an idea of what it’s all about. Of course they will not understand some of it because it is new learning material, but they will almost always recognize something that they know from previous learning.
• To learn is to make connections between new content and what one already knows; previewing teaches the learners to begin to look for connections.
• There is another view of learning, which science teachers should not believe: this view says that learners’ existing ideas don’t matter – that learners can add a layer of new knowledge on top of old knowledge without regard to the old knowledge. This view works against meaningful learning.
Unit 8.1 Strength of materials (LB page 200)
Quick activity (LB page 202)
The graph goes upwards even though the force stays constant at F2 on the force-axis.
Activity 1 A tensile strength test of two materials (LB page 203)
The purpose of this activity is to develop learners’ process skills such as measurement, graphing and interpretation of graphs. The content relates to a very useful and common test of the strength of materials and to the modulus of elasticity which the learners will meet in Grade 12.

Chapter 8 Properties of materials
112
1 Learners should have noted that the gauge marks were moving apart. The movement is slight but you are training them to be observant.
2 The distance between the first and the last gauge marks will be more than 150 mm due to the stretching that happens before the specimen fails.
3 On each side of the break, the specimen will be a little narrower. 4 This answer will depend on the kind of plastic the learners used. But you can expect a
force of around 7 newtons. 5 Learners probably did not see the marks moving apart; paper is not ductile. The fibres in
the paper are made of molecules that are quite well bound by covalent bonds and there are hydrogen bonds between fibres.
6 The distance will probably be very close to 150 mm. The paper does not form a “neck” before it breaks, and so the length does not change.
7 The maximum tensile strength will be greater than for the plastic of the same width; expect an answer of about 10 newtons (1 000 g weight) or greater.
8 The graphs will look something like this:
So what have we learned from Activity 1?
You can download a video of a tensile strength test for the class at http://www.mtu.edu/materials/k12/experiments/tensile/ This web resource describes in simple terms how tensile testing informs a designer about the strength of a material.
Also watch www.youtube.com/watch?v=D8U4G5kcpcM This video goes into more detail than the learners’ book and your learners doing Mechanical Technology will find it interesting. You can search for other videos on YouTube using the search phrase “tensile strength test”.
Chapter 8 Properties of materials
113
A note about the graphs
The graph in the learner’s book shows the stretching force on the horizontal axis and the amount of stretch on the vertical axis. This follows our usual convention that you plot the cause of a change (or the input to the system) on the horizontal axis and the effect (or the result, or the output) on the vertical axis.
Learner’s Figure 8.4 includes a note that engineers draw the graph of force vs extension differently. In the challenges section, Figure 8.21, you see the graph drawn with the stretching force on the vertical axis and the length of stretch on the horizontal axis. By doing it this way round, the engineers use the gradient of the graph as an indication of the ratio called Young’s Modulus or the modulus of elasticity. This ratio is the force per unit area of the cross-section, divided by the ratio of the stretch length to the original length. Engineers call this the ratio of stress over strain. Learners will work with this modulus of elasticity in Grade 12.
Unit 8.2 Density of materials (LB page 206)
Quick Activity (LB page 207)
Ask the class, do the bricks have the same volume (the same number of cm3?). Yes, they do. So let’s compare 1 cm3 of each material. How many of the 0,024 g in one cm3 of the polystyrene would you need to make up the 2 g of the cm3 of the cement? You have to divide the 2 g by 0,024 g and see how many times it will go into 2 g. This is 83,3 times.
Activity 2 Work w ith information about density (LB page 208)
Before the learners give their answers, ask them whether they first estimated how much heavier the steel ladder is than the aluminium ladder. Why? Because a few learners put numbers into calculators and get answers that they write down in hope, even if the answers make no sense. You may find learners who get answers like 10,57 or 0,349936143. We must teach them to use whatever existing knowledge they have, and to apply it.
1 For each cm3 of the aluminium ladder, the mass is 2,74 g. But each cm3 of the steel ladder has a mass of 7,83 g. How many times greater is 7,83 than 2,74? You have to divide. The answer then is 2,86 times. The heaviness of the ladders is directly related to the mass of the ladders.
2 Copper: 890 g per 100 cm3 is 8,9 g/cm3 Lead: 1 139 g per 100 cm3 is 11,39 g/cm3 Gold: 966 g per 50 cm3 is 966 divided by 50 or 19,32 g/cm3 Perspex: 240 g per 200 cm3 is 1,2 g/cm3 Alcohol: 0,8 g/cm3
3 The density of each half will still be 2,74 g/cm3 4 The density of each half will still be 11,39 g/cm3

Chapter 8 Properties of materials
114
Questions 3 and 4 are a critical test of learners' understanding: do they understand that density is a property of a material, not of an object?
In scientific terms, density is an “intrinsic property” of a material. You cannot increase or decrease the density by increasing or decreasing the amount of material. Temperature is another example of an intrinsic property: if you have a jug of hot water at 80 °C and you pour it into two insulated cups, the water in each cup is still at 80 °C. The temperature of the water is not 40 °C in each cup. You cannot halve the temperature by halving the quantity of material and so we call temperature an intrinsic property.
An example of an extrinsic property is the mass of an object. If you make the object twice as large, you also make the mass twice as large. Surface area is another extrinsic property.
Unit 8.3 Magnetic and non-magnetic materials (LB page 209)
Experiment 9: Which materials are magnetic? (LB page 210)
1 Objects that a magnet attracts
Materials the object is made from
Objects that a magnet does not attract
Material the object is made from
side of a cold-drink can
steel (with a coating of tin)
bottle-caps, eraser pieces of a straw
plastic
five-cent coins some copper but contain iron
copper pipe copper
one-Rand coins made of nickel and some iron
piece of solder lead and tin
paper-clips steel with a coating of paint or plastic
ring-pulls from drinks cans
aluminium
safety-pins, steel cooking-foil aluminium
drawing pins steel with coating of brass
pencil-sharpener aluminium and magnesium
These are magnetic materials. These are non-magnetic materials.
2 The list is the same as the right-hand column of the table, the material the object is made from. Encourage the class to add to the list.
3 Non-magnetic materials include all the metals elements like aluminium, copper, zinc, etc. and almost all the alloys the learners can obtain, such as brass, duralumin, white metal. Materials that contain iron will usually be magnetic.
Chapter 8 Properties of materials
115
Coins are made of alloys; learners will find that coins that look like copper are magnetic (which means that they have iron in them) and the silvery coins are magnetic too (which means they contain nickel but probably also have iron in them).
4 No, only iron, nickel and cobalt are magnetic. (This is not strictly true, because most other materials do show some response to a magnet, but their response is thousands of times weaker than the response of iron, nickel and cobalt. )
5 Examples are a metal pencil-sharpener, which has a steel blade but a body made of an aluminium-magnesium alloy. Another common example is a coldrink can. The walls are made of thin, tin-coated steel, but the top and the ring-pull are made of an aluminium alloy.
Unit 8.4 Melting and boiling points (LB page 212)
Activity 4 Work w ith tables of data (LB page 213)
1 a) lead: 327 °C b) tin: 232 °C c) solder for electronics circuits: 183 °C d) zinc 419 °C e) silver: 961 °C
2 The alloy of two metals has a lower melting point than either of the two “parent” metals. The skill here is interpreting information. The learners have to look for a pattern in the table of melting points. Ask them to see whether there is a pattern of metals mixing to give an alloy with a lower melting point. For example, ask them to compare the melting point of brass (an alloy of copper and zinc) with the melting points of its parent metals.
In fact, the melting point of an alloy changes, depending on the percentage of each metal in the mixture. By contrast, a very pure substance has a well-defined melting point. Chemists have tables of melting points for many different pure substances, and they sometimes use this information to identify an unknown substance.
3 Melting point of iron is 1 260 °C, boiling point is 2 870 °C. 4 Melting point of tungsten is 3 400 °C, boiling point is 5 550 °C. The high melting point is
the reason why light-bulb filaments are made of tungsten wire. The learners may be surprised to hear that when the filament of an ordinary light-bulb is white-hot; that its temperature can be near 3 000 °C. The boiling point of tungsten is about the same temperature as the surface of the Sun.
Activity 5 Graph the heating and cooling of water (LB page 214)
You should let the learners complete Questions 1 to 3 before they begin heating the water. Then organise 3 roles in each group: one person in the group must be the “clock-watcher”, another must read the temperature and yet another must record the temperature under the correct time. As the seconds-hand sweeps across the 12 on the clock, the clock-watcher calls “Read!” and the person watching the term reads and calls out the temperature, for the recorder to write down.
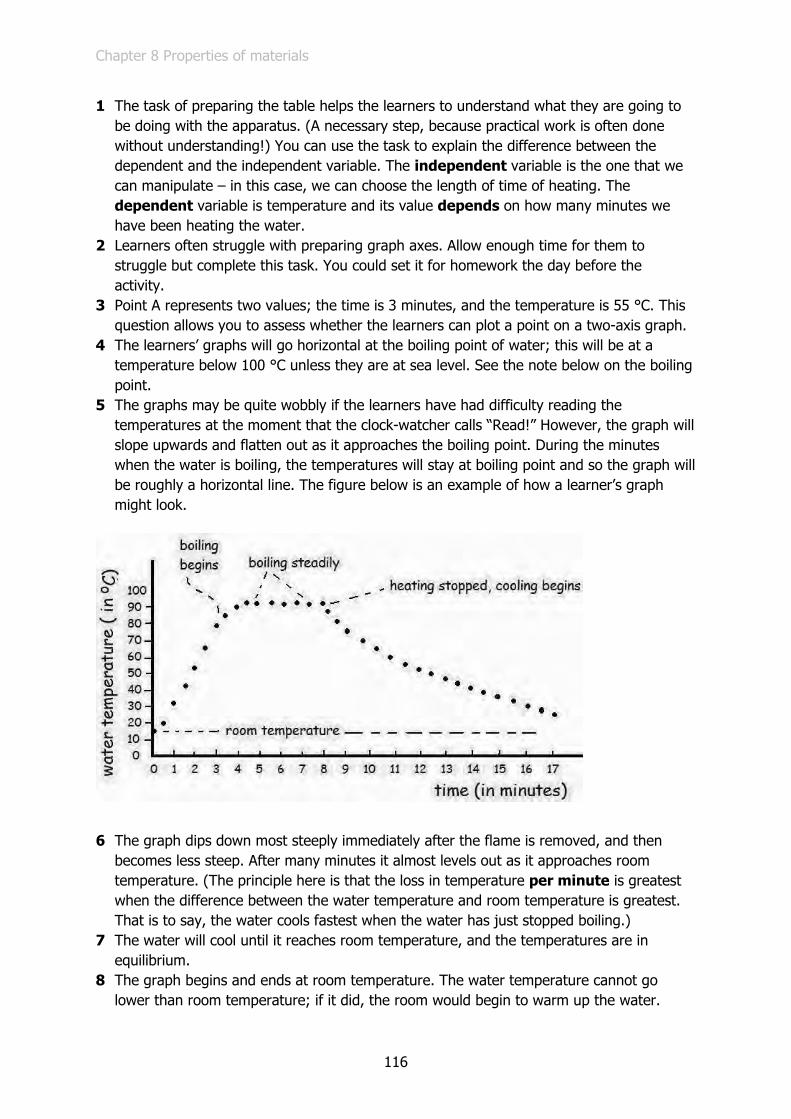
Chapter 8 Properties of materials
116
1 The task of preparing the table helps the learners to understand what they are going to be doing with the apparatus. (A necessary step, because practical work is often done without understanding!) You can use the task to explain the difference between the dependent and the independent variable. The independent variable is the one that we can manipulate – in this case, we can choose the length of time of heating. The dependent variable is temperature and its value depends on how many minutes we have been heating the water.
2 Learners often struggle with preparing graph axes. Allow enough time for them to struggle but complete this task. You could set it for homework the day before the activity.
3 Point A represents two values; the time is 3 minutes, and the temperature is 55 °C. This question allows you to assess whether the learners can plot a point on a two-axis graph.
4 The learners’ graphs will go horizontal at the boiling point of water; this will be at a temperature below 100 °C unless they are at sea level. See the note below on the boiling point.
5 The graphs may be quite wobbly if the learners have had difficulty reading the temperatures at the moment that the clock-watcher calls “Read!” However, the graph will slope upwards and flatten out as it approaches the boiling point. During the minutes when the water is boiling, the temperatures will stay at boiling point and so the graph will be roughly a horizontal line. The figure below is an example of how a learner’s graph might look.
6 The graph dips down most steeply immediately after the flame is removed, and then becomes less steep. After many minutes it almost levels out as it approaches room temperature. (The principle here is that the loss in temperature per minute is greatest when the difference between the water temperature and room temperature is greatest. That is to say, the water cools fastest when the water has just stopped boiling.)
7 The water will cool until it reaches room temperature, and the temperatures are in equilibrium.
8 The graph begins and ends at room temperature. The water temperature cannot go lower than room temperature; if it did, the room would begin to warm up the water.

Chapter 8 Properties of materials
117
9 The time the flame was heating the water is the independent variable; the water temperature is the dependent variable.
Challenges and projects (LB page 217)
1 The ropes will be equally strong; some learners feel that a longer rope has more places to break or it will stretch more and therefore get thinner more easily than a short rope. But if one thinks about, say, 1 cm section of either rope, the material in there will stretch the same as any other short section, and will fail at the same stress as any other short section. (This might not be true if the ropes are hanging vertically from clamps at the top. The long rope will have greater strain where it is clamped at the top than the short rope, due to the greater weight of the long rope below the clamp.)
2 The ringed points on the two graphs refer to the same stages in the stretching of the specimen.
3 The densest metals are osmium (at 22,6 g/cm3 ) and iridium (at 22,4 g/cm3). These two metals are twice as dense as lead. Challenge the learners to work out the mass of a brick-sized block of osmium. Answer: A standard brick is 11 × 22 × 7 cm3 or 1 649 cm3 So this volume of osmium would have a mass of 37,2674 kg!
4 The video is worth watching. 5 This is a simple investigation some learners could try.
Chapter 9 Elements and compounds
118
Chapter 9 Elements and compounds
Unit 9.1 The classification of matter 118 Unit 9.2 The particles that make up elements and compounds 120 Unit 9.3 The structure of the atom 121 Unit 9.4 Electronic configuration 122
Preview the chapter
This is a study skill. Ask the learners to answer questions such as these for homework.
1 Look at Figure 9.1. Why do shops classify their goods like that? 2 What is a pure substance? Find a heading that tells you. 3 What is the difference between elements and compounds? Find headings that tell you. 4 Find the box that explains what John Dalton believed about atoms. 5 Find the periodic table of the elements.
Unit 9.1 The classification of matter (LB page 220)
Quick activity (LB page 221)
1 The solids can be substances like soap, steel, or candlewax. The liquids can be bottled water, meths, dishwashing liquid, shampoo, vinegar, or juice. The gases are more difficult; gases can be air, or oxygen in the air, nitrogen in the air, carbon dioxide in the bubbles of a fizzy drink, or the vapour that comes from liquids like vinegar (which one can smell).
2 Metal solids are steel (spoons, pots), brass (pot-scrapers), etc. Non-metal solids are soap, candle-wax, cheese, etc. as well as powders like salt and sugar.
Quick activity (LB page 222)
The oil filter traps and separates very small solid pieces of matter from the oil so that they do not scratch any moving metal parts in the engine.
Quick activity (LB page 224)
a) sodium and chlorine b) iron and oxygen c) mercury and oxygen d) potassium and chlorine
Chapter 9 Elements and compounds
119
Quick activity (LB page 225)
Answers are in the periodic table; in the learners’ book the full names as well as the symbols are given for each element.
Quick activity (LB page 228)
1 Most of the elements are metals. 2 Metalloids are boron, silicon, germanium, arsenic, antimony, tellurium, astatine. 3 Carbon and silicon
Unit 9.1 Summary activity (LB page 229)
1 Air is a mixture of gases; 78% of it is nitrogen and 21% is oxygen. There are small quantities of carbon dioxide and argon and other gases. When people talk of pure air they usually mean air that is not polluted with dust and products from car exhausts, etc.
2 A mixture that is the same wherever you take a sample is called an even mixture or homogeneous mixture.
3 Yes, a sample of carbon dioxide that contains nothing except carbon dioxide is pure. 4 Elements in a group have similar properties. Groups arrange the similar elements one
below the other; groups run vertically while periods run horizontally. 5 Pure, solid elements are e.g. carbon, copper, sulfur. Pure, solid compounds are e.g. sodium hydroxide, sodium chloride (table salt). Pure liquid elements are mercury and bromine. Pure liquid compounds are e.g. water, ethyl alcohol, sulfuric acid. Pure gaseous elements are e.g. hydrogen, helium, neon, chlorine. Pure gaseous compounds are e.g. hydrogen sulfide (rotten eggs gas), acetylene, carbon
dioxide.
Remind the learners that when we say that the substance is solid, liquid or gaseous, we mean that it is at room temperature. By raising or lowering the temperature we can have all these substances in all their different states. An example the learners may know is solid carbon dioxide, incorrectly called “dry ice” or “steam ice”. Ice-cream sellers keep solid carbon dioxide blocks in their carts to keep the ice-cream cold.

Chapter 9 Elements and compounds
120
Unit 9.2 The particles that make up elements and compounds (LB page 230)
Activity 1 Make a prediction about air molecules (LB page 234)
This is a simple activity that can provoke a lot of good thinking in the learners’ minds. We ask them to imagine that they can see the air in the syringe. Most of them will assume that they will be able to press the piston (the plunger) down to the bottom, and it will be quite a surprise when they find that they cannot. It will confront the kinds of ideas that learners sometimes hold – “air is not really a substance”; “air has no weight”; “air is nothing, really”.
Answers to Questions
These questions are meant for discussion, of course, not written answers.
Ask the learners to imagine they can see the air particles and draw them. The task to draw the particles makes the learners really think about what they are like.
Here are some typical ideas from learners in secondary school:
Figure 9.1 This learner thinks of the air as a continuous jelly
Figure 9.2 This learner thinks of the air as a continuous jelly, which may have particles in it.
Figure 9.3 This learner thinks the air is made of many particles that can be squeezed like a jelly.
The first drawing shows that the learner does not think in terms of particles at all – the air is a continuous substance, like an invisible jelly.
The second learner also sees the air as a continuous invisible jelly, but he decides to include particles because his teacher said the air is made of particles. But for him, the particles are not the air; the particles are in the air (i.e. in the jelly). The air feels springy because it is like a jelly, and the particles don’t have anything to do with the springiness.
The third learner does think that the air is made of particles, but for her the particles themselves are like a jelly. She reasons that the particles must be springy themselves.
What do we do with answers like these? We should not treat them as simply wrong answers – they are giving us valuable insight into the learners’ minds.
Notice that none of the learners’ drawings show the particles moving; for these learners part 4 of the PKMM is not yet a useful, working idea. So we do Activity 2, seeing how coloured crystals spread out faster in water. Activity 2 builds the idea that particles move all the time, and move faster if the water is hotter.
Chapter 9 Elements and compounds
121
After doing Activity 2, you come back to Activity 1, and the problem of why the air pushes back so hard in the syringe.
The answer to the problem is that the air particles are moving fast (around 1 500 km/h on average), and so they have kinetic energy. They collide with each other and with the piston and the bottom and sides of the syringe. As they strike the piston, they bounce off one another and off the bottom and sides of the syringe.
How can they push back so hard that we cannot squeeze them down to fill near zero volume? Well, there are around 5,37 × 10²⁰ or about 500 000 000 000 000 000 000 particles in the 20 ml of air, all bouncing off each other. Together, their collisions cause a big push back against the piston.
Activity 2 Make a prediction about hot and cold water (LB page 235)
1—2 It’s important that every learner makes a prediction about what will happen. If they don’t commit to any prediction, then they are not mentally engaged with the ideas you are teaching. Ask some of the learners why they make one or another prediction.
3—5 The answers to these questions are in the learners’ book, in the section What we have learned about models from Activity 2.
Unit 9.2 Summary activity (LB page 236)
1 The second statement is a statement about iron on the nano-scale. 2 The main difference between elements and compounds is that elements are made of just
one kind of atom (even though these atoms may be joined together as a giant molecule) and compounds are made of molecules that have two or more kinds of atom.
3 The answer is in the learners’ text.
Unit 9.3 The structure of the atom (LB page 237)
Quick activity (LB page 238)
The atomic number of a beryllium atom is 4. The mass number is 9. This is a number that you get by adding the number of protons to the number of neutrons, and so it is not really a mass; the name is confusing. And we don’t actually need the mass number to identify the atom of an element – each different kind of atom has its own atomic number.
Note for teachers: The mass number, 9, is not the relative atomic mass (r.a.m.): the relative atomic mass is 9,0122. This is because a neutron has slightly more mass than a proton.
Now 9,0122 is not a mass in grams, either! The mass of one atom in grams would be a ridiculously small number. So the relative atomic mass is measured in atomic mass units, symbol u. How big is u? Practically, 1 u is the mass of a hydrogen atom. So beryllium has a relative atomic mass 9,0122 times the mass of a hydrogen atom.

Chapter 9 Elements and compounds
122
It would be nice to stop here, but chemists who wanted to be even more accurate agreed that 1 u is one twelth the mass of a carbon-12 atom. Carbon-12 then has a mass of 12 u exactly – that is by international agreement.
The picture gets more complicated for elements other than beryllium: beryllium has only one isotope but in the case of other elements with several isotopes, the relative atomic mass you find in a periodic table is actually an average of the r.a.m. of the most common isotopes.
Quick activity (LB page 238)
1 The atomic number of a lithium atom is 3. 2 No, these atoms with mass number 6 still have the same number of protons and so the
atomic number is still 3.
Activity 3 Work out the basic structure of some atoms (LB page 239)
1 A beryllium atom has 4 electrons. The periodic table gives us the atomic number as 4 which means that the nucleus has 4 protons. There must be 4 negative electrons to neutralise the 4 positive protons.
2 Sodium’s atomic number is 11, so it has 11 protons in the nucleus and 11 electrons around the nucleus.
3 Magnesium: 11 protons and 11 electrons. 4 The nett charge is zero because there’s one electron for every proton.
Unit 9.3 Summary activity (LB page 240)
The answers for Questions 1 to 4 come straight from the text.
5 The electron shell near the nucleus is made of moving electrons with lower energy while the shell on the outside of the atom is made of the movement of electrons with higher energy.
6 These electrons in the outer shell are the ones that are involved in the bonds between atoms.
Unit 9.4 Electronic configuration (LB page 241)
Activity 4 Work out the number of electrons (LB page 241)
1 A carbon atom has two electrons in the core and 4 electrons in the valence shell. 2 The nucleus of a nitrogen atom has 7 protons and the nucleus of an oxygen atom has
8 protons. 3 A fluorine atom has one electron for every proton in the nucleus, so it has 9 electrons. 4 However, it has 7 valence electrons. 5 Fluorine has 7 valence electrons but 2 other electrons in its core. So the total number of
electrons, 9, is the same as the atomic number.
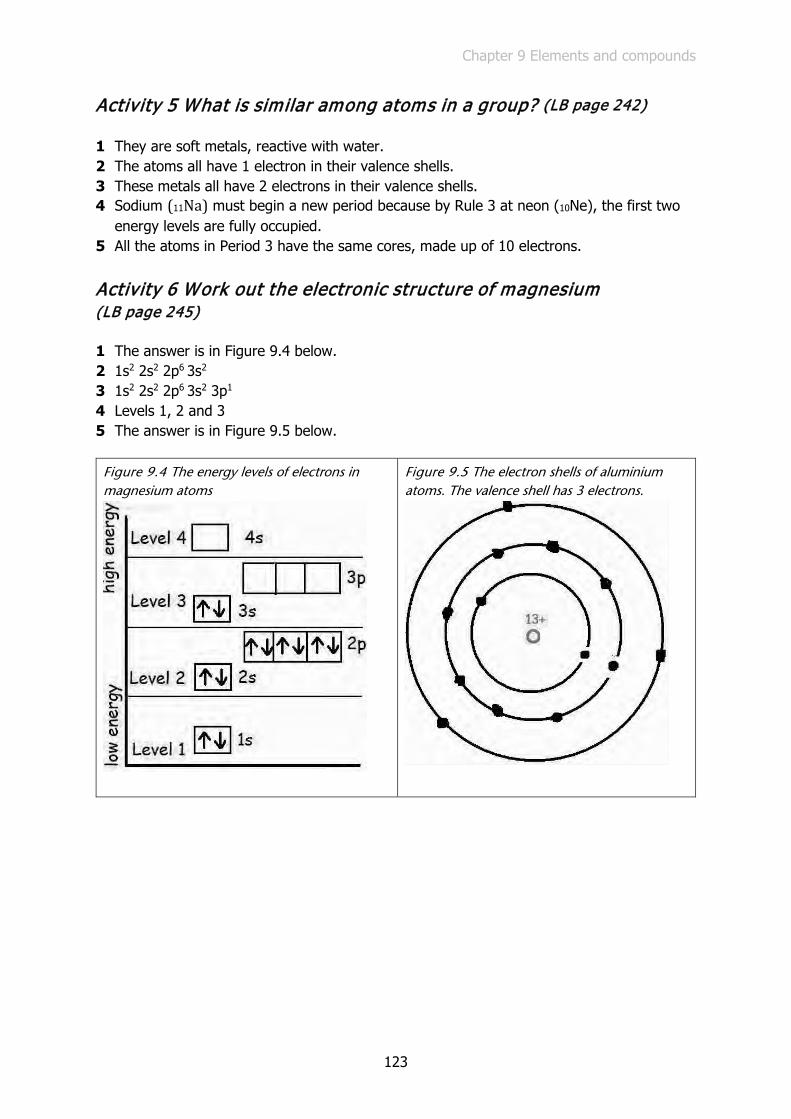
Chapter 9 Elements and compounds
123
Activity 5 What is similar among atoms in a group? (LB page 242)
1 They are soft metals, reactive with water. 2 The atoms all have 1 electron in their valence shells. 3 These metals all have 2 electrons in their valence shells. 4 Sodium (11Na) must begin a new period because by Rule 3 at neon (10Ne), the first two
energy levels are fully occupied. 5 All the atoms in Period 3 have the same cores, made up of 10 electrons.
Activity 6 Work out the electronic structure of magnesium (LB page 245)
1 The answer is in Figure 9.4 below. 2 1s2 2s2 2p6 3s2 3 1s2 2s2 2p6 3s2 3p1 4 Levels 1, 2 and 3 5 The answer is in Figure 9.5 below.
Figure 9.4 The energy levels of electrons in magnesium atoms
Figure 9.5 The electron shells of aluminium atoms. The valence shell has 3 electrons.
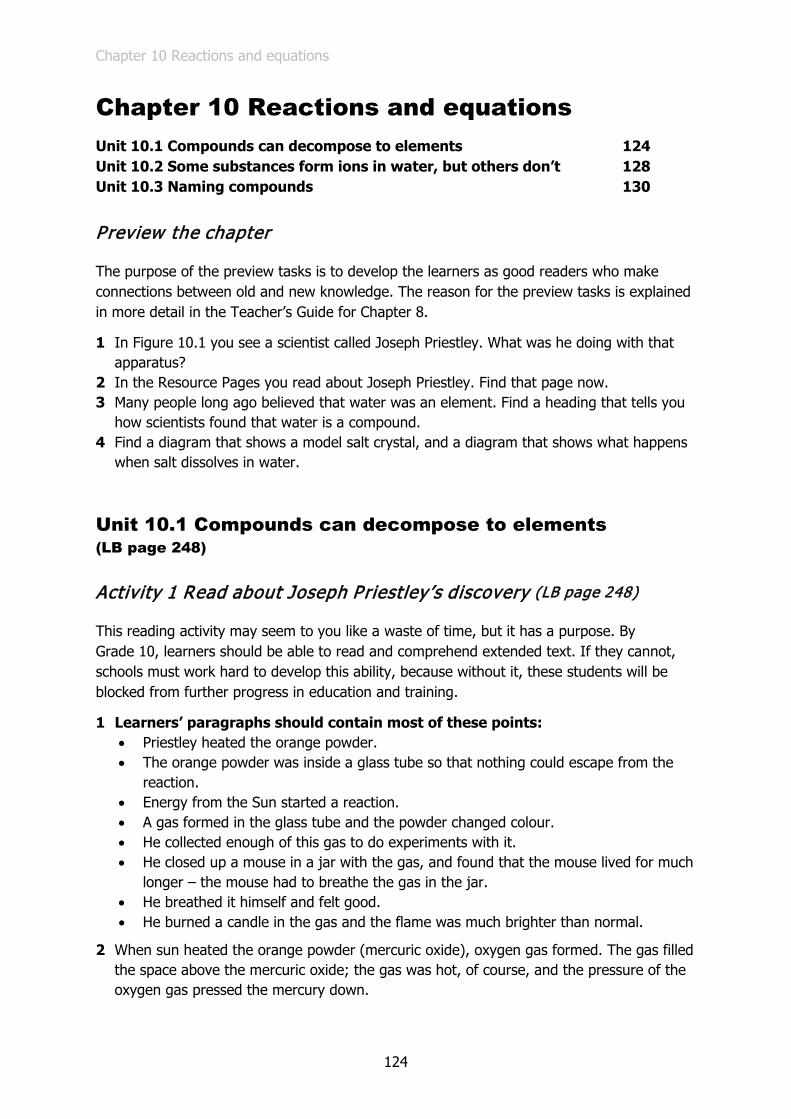
Chapter 10 Reactions and equations
124
Chapter 10 Reactions and equations
Unit 10.1 Compounds can decompose to elements 124 Unit 10.2 Some substances form ions in water, but others don’t 128 Unit 10.3 Naming compounds 130
Preview the chapter
The purpose of the preview tasks is to develop the learners as good readers who make connections between old and new knowledge. The reason for the preview tasks is explained in more detail in the Teacher’s Guide for Chapter 8.
1 In Figure 10.1 you see a scientist called Joseph Priestley. What was he doing with that apparatus?
2 In the Resource Pages you read about Joseph Priestley. Find that page now. 3 Many people long ago believed that water was an element. Find a heading that tells you
how scientists found that water is a compound. 4 Find a diagram that shows a model salt crystal, and a diagram that shows what happens
when salt dissolves in water.
Unit 10.1 Compounds can decompose to elements (LB page 248)
Activity 1 Read about Joseph Priestley’s discovery (LB page 248)
This reading activity may seem to you like a waste of time, but it has a purpose. By Grade 10, learners should be able to read and comprehend extended text. If they cannot, schools must work hard to develop this ability, because without it, these students will be blocked from further progress in education and training.
1 Learners’ paragraphs should contain most of these points: • Priestley heated the orange powder. • The orange powder was inside a glass tube so that nothing could escape from the
reaction. • Energy from the Sun started a reaction. • A gas formed in the glass tube and the powder changed colour. • He collected enough of this gas to do experiments with it. • He closed up a mouse in a jar with the gas, and found that the mouse lived for much
longer – the mouse had to breathe the gas in the jar. • He breathed it himself and felt good. • He burned a candle in the gas and the flame was much brighter than normal.
2 When sun heated the orange powder (mercuric oxide), oxygen gas formed. The gas filled the space above the mercuric oxide; the gas was hot, of course, and the pressure of the oxygen gas pressed the mercury down.
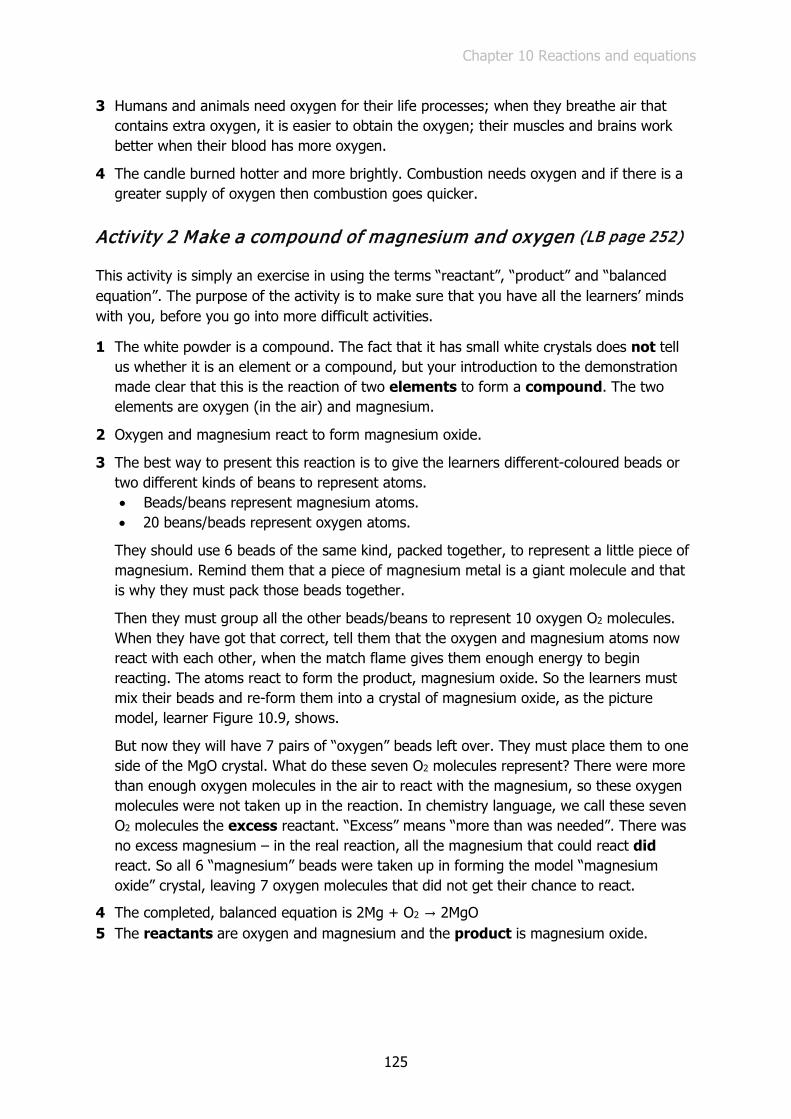
Chapter 10 Reactions and equations
125
3 Humans and animals need oxygen for their life processes; when they breathe air that contains extra oxygen, it is easier to obtain the oxygen; their muscles and brains work better when their blood has more oxygen.
4 The candle burned hotter and more brightly. Combustion needs oxygen and if there is a greater supply of oxygen then combustion goes quicker.
Activity 2 Make a compound of magnesium and oxygen (LB page 252)
This activity is simply an exercise in using the terms “reactant”, “product” and “balanced equation”. The purpose of the activity is to make sure that you have all the learners’ minds with you, before you go into more difficult activities.
1 The white powder is a compound. The fact that it has small white crystals does not tell us whether it is an element or a compound, but your introduction to the demonstration made clear that this is the reaction of two elements to form a compound. The two elements are oxygen (in the air) and magnesium.
2 Oxygen and magnesium react to form magnesium oxide.
3 The best way to present this reaction is to give the learners different-coloured beads or two different kinds of beans to represent atoms. • Beads/beans represent magnesium atoms. • 20 beans/beads represent oxygen atoms.
They should use 6 beads of the same kind, packed together, to represent a little piece of magnesium. Remind them that a piece of magnesium metal is a giant molecule and that is why they must pack those beads together.
Then they must group all the other beads/beans to represent 10 oxygen O2 molecules. When they have got that correct, tell them that the oxygen and magnesium atoms now react with each other, when the match flame gives them enough energy to begin reacting. The atoms react to form the product, magnesium oxide. So the learners must mix their beads and re-form them into a crystal of magnesium oxide, as the picture model, learner Figure 10.9, shows.
But now they will have 7 pairs of “oxygen” beads left over. They must place them to one side of the MgO crystal. What do these seven O2 molecules represent? There were more than enough oxygen molecules in the air to react with the magnesium, so these oxygen molecules were not taken up in the reaction. In chemistry language, we call these seven O2 molecules the excess reactant. “Excess” means “more than was needed”. There was no excess magnesium – in the real reaction, all the magnesium that could react did react. So all 6 “magnesium” beads were taken up in forming the model “magnesium oxide” crystal, leaving 7 oxygen molecules that did not get their chance to react.
4 The completed, balanced equation is 2Mg + O2 → 2MgO 5 The reactants are oxygen and magnesium and the product is magnesium oxide.
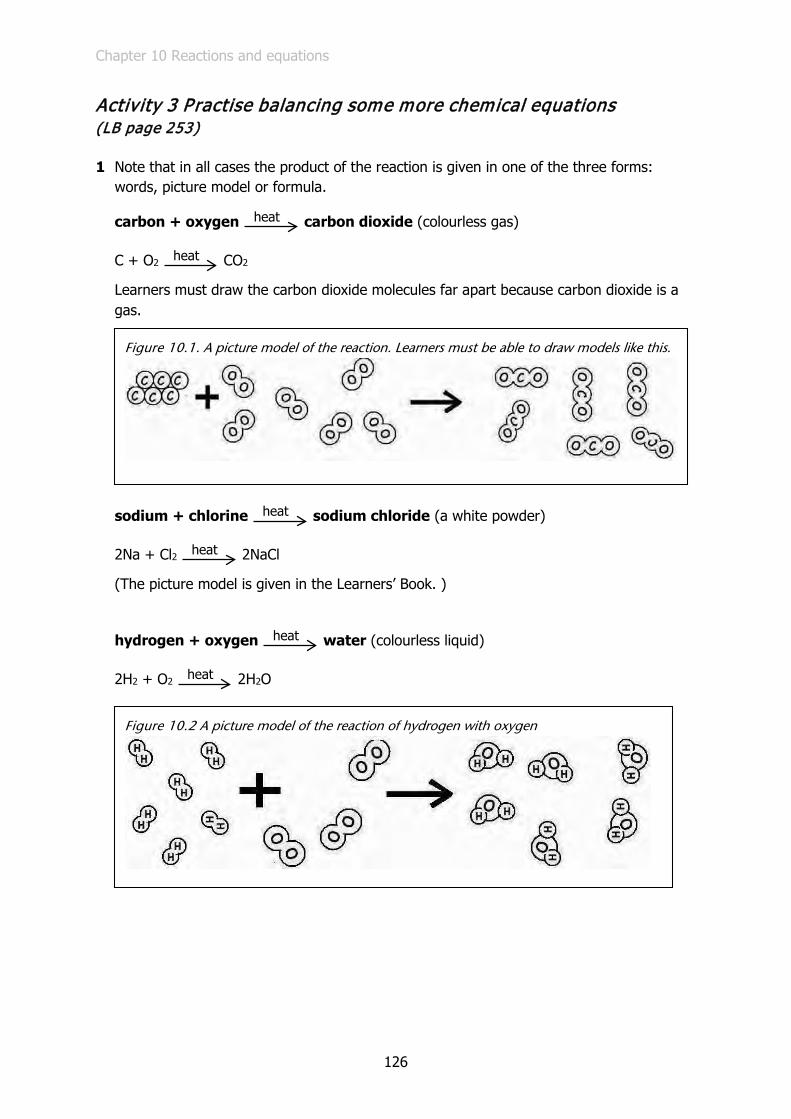
Chapter 10 Reactions and equations
126
Activity 3 Practise balancing some more chemical equations (LB page 253)
1 Note that in all cases the product of the reaction is given in one of the three forms: words, picture model or formula.
carbon + oxygen carbon dioxide (colourless gas)
C + O2 CO2
Learners must draw the carbon dioxide molecules far apart because carbon dioxide is a gas.
sodium + chlorine sodium chloride (a white powder)
2Na + Cl2 2NaCl
(The picture model is given in the Learners’ Book. )
hydrogen + oxygen water (colourless liquid)
2H2 + O2 2H2O
heat
heat
Figure 10.1. A picture model of the reaction. Learners must be able to draw models like this.
heat
heat
heat
heat
Figure 10.2 A picture model of the reaction of hydrogen with oxygen
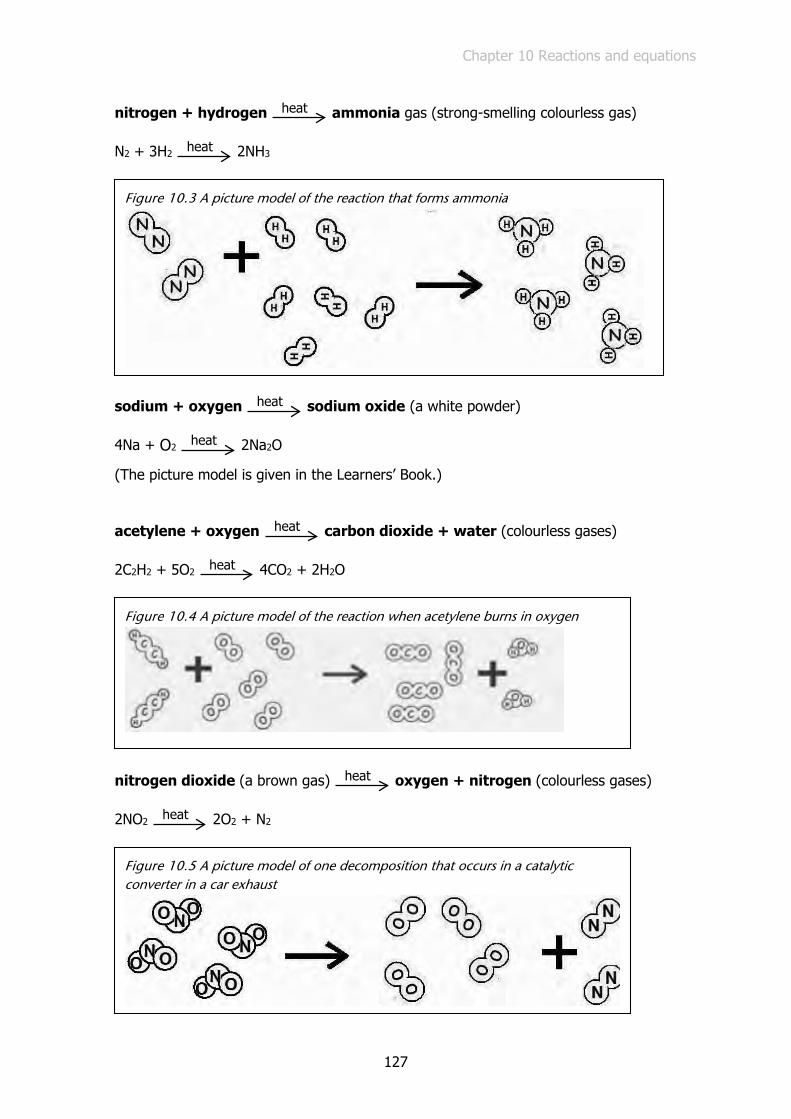
Chapter 10 Reactions and equations
127
nitrogen + hydrogen ammonia gas (strong-smelling colourless gas)
N2 + 3H2 2NH3
sodium + oxygen sodium oxide (a white powder)
4Na + O2 2Na2O
(The picture model is given in the Learners’ Book.)
acetylene + oxygen carbon dioxide + water (colourless gases)
2C2H2 + 5O2 4CO2 + 2H2O
nitrogen dioxide (a brown gas) oxygen + nitrogen (colourless gases)
2NO2 2O2 + N2
heat
heat
Figure 10.3 A picture model of the reaction that forms ammonia
heat
heat
heat
heat
Figure 10.4 A picture model of the reaction when acetylene burns in oxygen
heat
heat
Figure 10.5 A picture model of one decomposition that occurs in a catalytic converter in a car exhaust
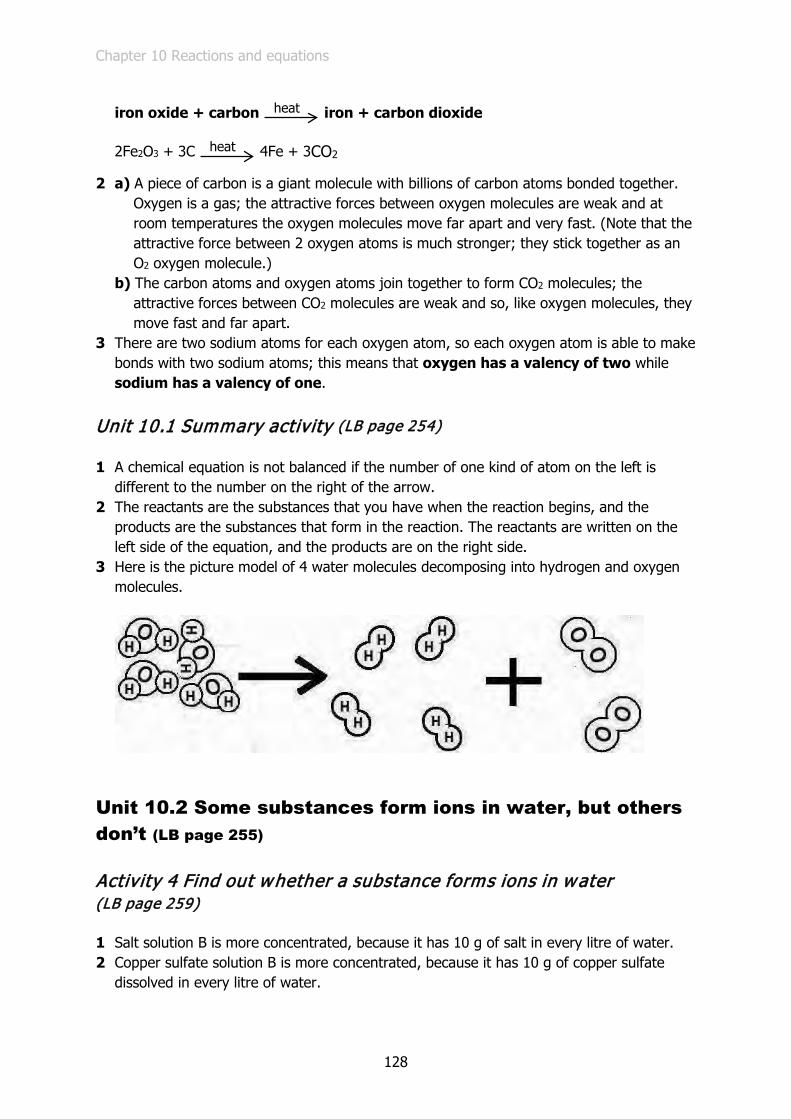
Chapter 10 Reactions and equations
128
iron oxide + carbon iron + carbon dioxide
2Fe2O3 + 3C 4Fe + 3CO2
2 a) A piece of carbon is a giant molecule with billions of carbon atoms bonded together. Oxygen is a gas; the attractive forces between oxygen molecules are weak and at
room temperatures the oxygen molecules move far apart and very fast. (Note that the attractive force between 2 oxygen atoms is much stronger; they stick together as an O2 oxygen molecule.)
b) The carbon atoms and oxygen atoms join together to form CO2 molecules; the attractive forces between CO2 molecules are weak and so, like oxygen molecules, they move fast and far apart.
3 There are two sodium atoms for each oxygen atom, so each oxygen atom is able to make bonds with two sodium atoms; this means that oxygen has a valency of two while sodium has a valency of one.
Unit 10.1 Summary activity (LB page 254)
1 A chemical equation is not balanced if the number of one kind of atom on the left is different to the number on the right of the arrow.
2 The reactants are the substances that you have when the reaction begins, and the products are the substances that form in the reaction. The reactants are written on the left side of the equation, and the products are on the right side.
3 Here is the picture model of 4 water molecules decomposing into hydrogen and oxygen molecules.
Unit 10.2 Some substances form ions in water, but others don’t (LB page 255)
Activity 4 Find out whether a substance forms ions in water (LB page 259)
1 Salt solution B is more concentrated, because it has 10 g of salt in every litre of water. 2 Copper sulfate solution B is more concentrated, because it has 10 g of copper sulfate
dissolved in every litre of water.
heat
heat

Chapter 10 Reactions and equations
129
3 Tap water: does not glow
Sugar A: does not glow
Salt A: dim Copper sulfate A: dim
Sugar B: does not glow
Salt B: bright Copper sulfate B: bright
4 In tap water and sugar solutions, the LED does not glow at all; in salt solutions and copper sulfate solutions the LED was dim if the concentration was low but the LED was bright if the concentration of salt or copper sulfate was high.
5 Tap water and sugar solutions had near zero conductivity.
Solutions with a low concentration of salt and copper sulfate had low conductivity.
Solutions with a high concentration of salt and copper sulfate were the most conductive.
6 The most conductive solutions have the most ions per litre; the less concentrated solutions don’t conduct electricity so well, because they have fewer ions per litre, and the sugar solution and tap water seem to have no ions to conduct electricity.
Unit 10.2 Summary activity (LB page 261)
1
2 If a compound dissolves in water AND the solution conducts an electric current, then we know that the compound breaks into ions in water.

Chapter 10 Reactions and equations
130
Unit 10.3 Naming compounds (LB page 262)
Activity 5 Work out names and formulae of compounds (LB page 264)
Part A: Given the name, work out the formula of the compound
Where you see the name of a compound in boldface, it means that the learners have seen or drawn a bead model of that compound. If they have difficulty working out the formula, refer them back to the bead models in Activity 3.
magnesium oxide
carbon monoxide
carbon dioxide
sodium oxide
sulfur dioxide
MgO
CO
CO2
Na2O
SO2
sulfur tri-oxide
sodium chloride
potassium chloride
copper(II) chloride
iron(III) oxide
SO3
NaCl
KCl
CuCl2
Fe2O3
potassium nitrate
aluminium tri-chloride
copper(II) sulfate
potassium permanganate
sodium hypochlorite
KNO3
AlCl3
CuSO4
KMnO4
NaClO
Potassium permanganate is also known as Condy’s crystals, amanyazine, makganatsohle, or uzifozonke.
Sodium hypochlorite is used as a disinfectant. Calcium hypochlorite is also a disinfectant and is used to chlorinate swimming pools.
Part B: Given the formula, work out the name of the compound
MgO magnesium oxide
CO carbon monoxide
CO2 carbon dioxide
Na2O sodium oxide
Fe2O3 iron(III) oxide
CuCl2 copper(II) chloride
FeCl3 iron(III) chloride
CaCl2 calcium chloride, which should be named calcium di-chloride
CaCO3 calcium carbonate
NaHCO3 sodium hydrogencarbonate
NaCl sodium chloride
HgO mercuric oxide
KMnO4 potassium permanganate
CuSO4 copper(II) sulfate
HgS mercuric sulfide
Mg(OH) magnesium hydroxide
Carbon monoxide is the gas that car exhaust analysers detect and measure the concentration. Iron(III) oxide is the compound that gives some rocks their reddish colour. Iron(III) chloride is also called ferric chloride and it is used, in water solution, for etching the copper on printed circuit boards.
Magnesium hydroxide is the main ingredient in “Milk of Magnesia” which people take to relieve acid indigestion.

Chapter 11 Thermal and electrical properties
131
Chapter 11 Thermal and electrical properties Unit 11.1 Melting points and boiling points of materials 131 Unit 11.2 Thermal insulators and conductors 131 Unit 11.3 Electrical insulators and conductors 137 Challenges and projects 138
Preview the chapter
Here are some questions you might like to give the learners while they preview the chapter:
1 How do materials melt? Find two diagrams that will tell you. 2 In Chapter 8 you heated water to boiling point and drew a graph. In this chapter you
work with that graph again. Find that graph of the temperature of water when it is being heated.
3 You are going to compare polystyrene with steel, for insulating ability. Find the activity where you will do that.
Unit 11.1 Melting points and boiling points of materials (LB page 266)
Unit 11.1 Summary activity (LB page 269)
This is the paragraph the learners should re-construct from the jumbled phrases. Make sure that they read their paragraphs to each other to check that they make sense – you will teach them to peer-assess and self-assess their work. Good learners repeatedly self-assess their own work. If we can develop learners who do this, we will achieve a major goal of education.
A solid object is really made of billions of particles that are held together by attractive forces. In some solids, like wax, the attractive forces are quite weak, but in other solids, like steel, the attractive forces are very strong. This is the reason why wax melts at a low temperature but steel melts at a very high temperature.
Unit 11.2 Thermal insulators and conductors (LB page 270)
Quick activity: A scale of thermal conductivity (LB page 272)
The purpose of this activity is to activate the learners’ knowledge and experience of materials, and to challenge them with some unfamiliar materials. Don’t spend a long time on this, but ask some learners to tell about their experiences with the materials.
Chapter 11 Thermal and electrical properties
132
The materials would line up like this, beginning with the best thermal conductor and going down to the poorest thermal conductor (i.e. the best insulator):
diamond, silver, copper, iron, concrete, blanket-material, ash brick, clay brick, car engine oil, glass, polystyrene, mineral wool (“Aerolite”), wood, air that is not moving
You realise that this is not examination content – keep in mind the purpose of the activity. However, you can find a table of thermal conductivity at http://hyperphysics.phy-astr.gsu.edu/hbase/tables/thrcn.html
Activity 1 Do materials conduct heat equally fast? (LB page 272)
1 The purpose of this question is to make the learners think on the nano-scale about the particles of iron – how do they behave when the iron gets hot? The learners’ answers are assessment information for you, so ask them to elaborate on how they imagine what is happening in the iron. They could draw on the board or use their hands to make their meaning clear.
2 Again, use this question to find out how the learners imagine matter; this is more valuable than them already knowing the correct answer. (The answer, by the way, is that the pins would drop off at much longer intervals. Glass is a poor thermal conductor and so the energy from the flame is transferred only slowly along the rod.)
3 The copper or aluminium rod conducts heat much faster. The Mechanical Technology learners might know this from workshop experience: if you use a drill or hacksaw on steel, the steel heats up at a distance from the tool, but aluminium heats up much faster than steel at a similar distance from the tool.
4 The learners’ pictures should show high temperature reaching the right-hand end of the copper rod, reaching about 2/3 of the length of the iron rod, and reaching about 1/4 the length of the glass rod. The reference to “one minute” is there just to tell the learners that each rod is heated for the same length of time. It has no other significance.
Experiment 8: Test the insulation ability of a polystyrene cup (LB page 275)
This investigation is one of the possibilities for formal assessment in the CAPS. On page 23 it is marked for formal assessment in Term 3, although on page 12 a different formal assessment for Term 3 is named. You will find a mark memo/mark rubric at the end of this section on Experiment 8.
The task of preparing the table helps the learners to understand what they are going to be doing with the apparatus. (This is a necessary step, because practical work is often done without understanding!)
1 You can use the task to explain the difference between the dependent and the independent variable. The independent variable is the one that we can manipulate – in this case, we can choose the number of minutes over which we will measure. The dependent variable is temperature and its value depends on how many minutes the water and container have been cooling.
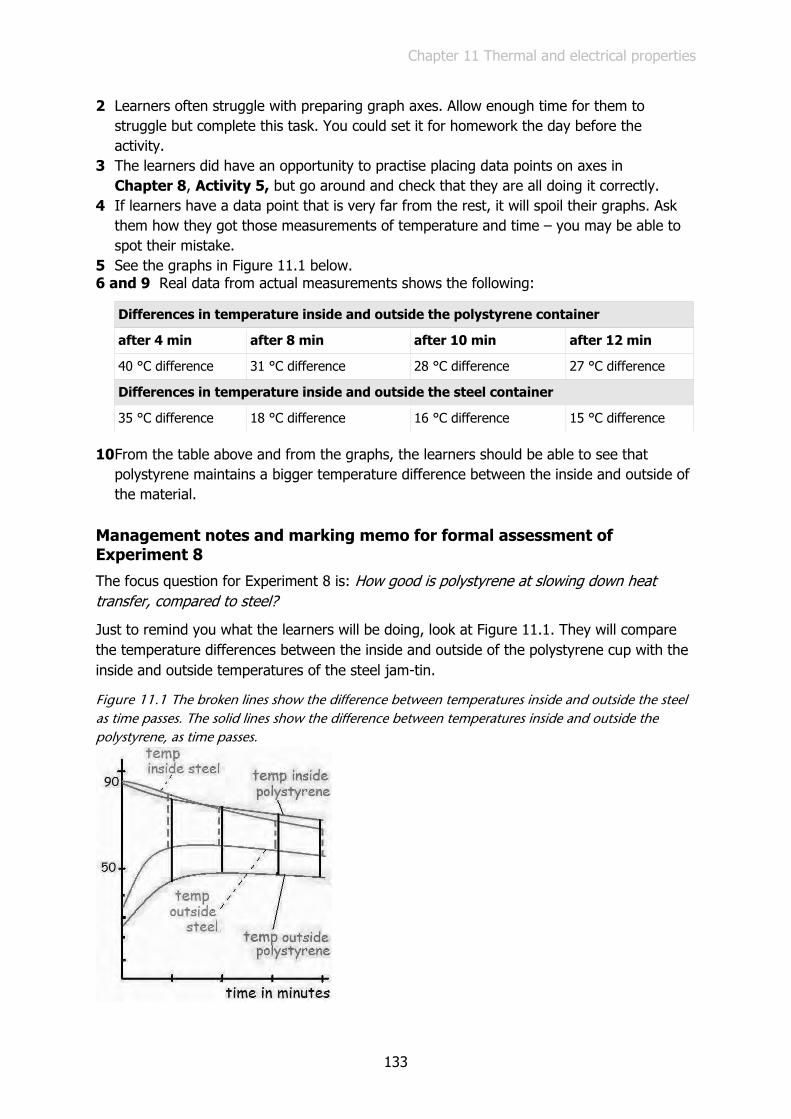
Chapter 11 Thermal and electrical properties
133
2 Learners often struggle with preparing graph axes. Allow enough time for them to struggle but complete this task. You could set it for homework the day before the activity.
3 The learners did have an opportunity to practise placing data points on axes in Chapter 8, Activity 5, but go around and check that they are all doing it correctly.
4 If learners have a data point that is very far from the rest, it will spoil their graphs. Ask them how they got those measurements of temperature and time – you may be able to spot their mistake.
5 See the graphs in Figure 11.1 below. 6 and 9 Real data from actual measurements shows the following:
Differences in temperature inside and outside the polystyrene container
after 4 min after 8 min after 10 min after 12 min
40 °C difference 31 °C difference 28 °C difference 27 °C difference
Differences in temperature inside and outside the steel container
35 °C difference 18 °C difference 16 °C difference 15 °C difference
10 From the table above and from the graphs, the learners should be able to see that polystyrene maintains a bigger temperature difference between the inside and outside of the material.
Management notes and marking memo for formal assessment of Experiment 8
The focus question for Experiment 8 is: How good is polystyrene at slowing down heat transfer, compared to steel?
Just to remind you what the learners will be doing, look at Figure 11.1. They will compare the temperature differences between the inside and outside of the polystyrene cup with the inside and outside temperatures of the steel jam-tin.
Figure 11.1 The broken lines show the difference between temperatures inside and outside the steel as time passes. The solid lines show the difference between temperatures inside and outside the polystyrene, as time passes.

Chapter 11 Thermal and electrical properties
134
In Figure 11.1 you see that the broken lines are shorter than the solid black lines. In other words there is a bigger temperature difference between the inside and outside of the polystyrene cup than between inside and outside of the steel jam-tin. So polystyrene is a better thermal insulator than steel.
This is what the learners will report at the end of the investigation.
You can manage the investigation with learners working in groups of 3, to use the apparatus, and still get written evidence for assessment from individual learners. You can do it in stages.
Stage 1:
Discuss the focus question with the learners and make sure they know what they are going to measure and compare.
The learners prepare their notebooks, tables and graph paper, and you assess their understanding of the investigation by asking them questions as you move around the classroom.
Stage 2:
Split the class into two halves, each half to work in groups of 3 to 4 learners. One half of the class will take temperature measurements from the polystyrene cups, the other half will do the same with the steel jam-tins.
All the groups set up their apparatus (using either the polystyrene cup or the steel jam-tin), ready to take measurements; they call you to check that it is correctly set up. They demonstrate what they are going to do when you will pour in their boiling water. When they can show you this correctly, you (or a learner-assistant) dispense the boiling water from a kettle. They place the cardboard covers over the thermometers as shown in the pictures (learner Figures 11.15 and 11.16). They begin to collect their data from the thermometers and clocks.
In each group there is a learner who is the recorder. He has his data-table correctly prepared and is ready to write.
The second learner watches the clock and calls out “Read!” each time the seconds-hand passes the 6 or the 12 on the clock (so, every half-minute). This begins after you have poured the boiling water into the polystyrene cup or the tin-can.
The third learner watches the “inside” and “outside” thermometers and when she hears “Read!” she reads the temperatures, and calls them out (e.g. “Eighty-eight degrees inside and forty degrees outside”) for the recording learner. The recorder writes the two temperatures in his table.
During this time you move around noting as much as you can about each learner, but without giving marks.
Stage 3: Now the learners work individually. From the data table, they each plot the data points on their graph paper, and draw the best fit lines for the temperatures inside and outside the containers.
Chapter 11 Thermal and electrical properties
135
In groups with polystyrene containers In groups with steel containers
They answer Questions 3, 4 and 5.
They compare their graphs for temperatures inside and outside, and read off the differences at minutes 4, 8, 10 and 12. (They are answering Question 6).
They answer Questions 7 and 8.
They compare their graphs for temperatures inside and outside, and read off the differences at minutes 4, 8, 10 and 12. (They are answering Question 9.)
Stage 4: Now the groups in each half of the class must swop data – the “polystyrene” groups need the data from the “steel” groups, and vice versa.
Select the data from a “polystyrene” group that has taken good measurements and write it on the board so that the “steel” groups can copy it down. Then do the same with data from a good “steel” group, so that the “polystyrene” groups get that data.
Remember that to answer Question 10, and complete their graphs and reports, every learner must have data from both the polystyrene and the steel.
Stage 5: The learners write their reports to answer Question 10. They explain how the graphs show that polystyrene maintains a bigger temperature difference between the inside and outside than steel does.
A marking memorandum / rubric
If you feel that the stages are all too much for your class, then assess just some parts. Remember that we want to develop the learners’ process skills (like measuring, recording, transforming data, comparing, and interpreting information), so you should certainly assess Stages 1 to 3. Assessing Stage 1
Learner has a heading for the investigation and includes the focus question for the investigation
prepares the table for collecting data for polystyrene; table has time with units, inside temperature with units outside temperature with units, runs to at least 15 minutes
prepares the table for collecting data for steel; table has time with units, inside temperature with units, outside temperature with units, runs to at least 15 minutes
Learner has prepared graph paper as shown in Learners’ Book with time on horizontal axis, temperature and vertical axis, has suitable divisions along each axis
You can get a lot of information about learners from the questions you ask them as you move around while they are preparing their notebooks and graph paper.

Chapter 11 Thermal and electrical properties
136
(20 marks)
Assessing Stage 2:
During this stage the learners are taking measurements and you won’t have time to record marks because you will be moving around, checking that the learners are getting sensible readings and taking care of safety issues. However, you will notice many significant things about individual learners and you might make notes later on to remind yourself to follow up with the whole class or with individuals. Assessing Stage 3 in which they draw 2 graphs:
Learner transcribes data accurately from the recorder-learner into his/her table for times and temperatures
Learner plots about 60 data points (inside and outside temperatures with times) accurately on the graph paper and for two graphs
Learner draws best fit lines for both sets of data points
(14 marks)
Assessing Stage 4, in which the “polystyrene” and “steel” groups swop data and draw two more graphs on the same axes:
Learner transcribes data accurately from the recorder-learner into his/her table for time and temperatures
Learner plots about 60 data points (inside and outside temperatures with times) accurately on the graph paper and for two graphs .
Learner draws best fit lines between both sets of data points
(14 marks)
Assessing Stage 5, in which they interpret their results:
Learner compares the inside and outside temperatures for polystyrene and steel containers at least for minute 4 and interprets this to mean that the polystyrene maintains a bigger temperature difference than the steel.
Learner considers temperature differences for minutes 4, 8, 10 and 12 and interprets this to mean that the polystyrene maintains a bigger temperature difference than the steel.
(Max marks for Stage 6 = 6 marks)
[Total = 54 marks ]

Chapter 11 Thermal and electrical properties
137
Unit 11.2 Summary activity (LB page 278)
The paragraphs should read like this:
Heat energy flows through a material from parts with high temperature to parts with lower temperature.
A good thermal insulator can keep a large temperature difference between its hot surface and its cold surface. It can keep this temperature difference because its particles are not good at transferring the kinetic energy of vibration from one particle to the next.
Unit 11.3 Electrical insulators and conductors (LB page 278)
Quick activity (LB page 279)
Answers will be found in the periodic table.
Experiment 7: Formal assessment task (LB page 282)
You will need to assess their ability to “Determine the electrical conductivity of different materials”. This task requires learners to know how to use multimeters or voltmeters and ammeters, so postpone it until Chapter 14, when they have become familiar with the instruments. If you set the task now, you might not get valid assessments.
Unit 11.3 Summary activity (LB page 284)
1 The elements on the left-hand side of the periodic table are mostly metals, and they do not hold their outer electrons very tightly (they have low electronegativity). Their mobile electrons can flow as an electric current. When the atoms of a metal are vibrating fast, the mobile electrons tug at the positive cores of other atoms nearby, making them also vibrate faster. The elements toward the right-hand side hold their electrons more tightly (they have higher electronegativity) and so there are few electrons to move as an electric current and few electrons that can make nearby atoms vibrate faster.
2 No, glass is a very poor electrical conductor (i.e. it is a good insulator). It does conduct heat but not very well. If you touch a glass of hot water, yes, the glass will feel hot on the outside, but if the glass is thick, it will take some time for the heat to travel to the outside surface. Compared to a metal container, glass is a poor thermal conductor.
3 Use a hard steel to make a permanent magnet. Hard steels have carbon atoms between the iron atoms, and these carbon atoms lock the domains (little areas of iron) so that the magnetised domains stay aligned in one direction.

Chapter 11 Thermal and electrical properties
138
Challenges and projects (LB page 286)
These questions and tasks are not meant as material to learn for examinations but they are there to provoke some thinking and argument.
1 Gauteng is the highest part of South Africa where one can go down a mine. At a depth of 4 000 m, the tea-maker will be far below sea-level. Therefore the air pressure on the boiling water will be greater than at sea level. Therefore the water will boil at a higher temperature than if you boiled water in the same pot at sea level.
FOR TEACHERS ONLY: Yes, the inner surface of the pot or cup does affect the boiling point. Water will boil at a higher temperature in a very smooth container. You can read The myth of the boiling point at http://www.hps.cam.ac.uk/boiling/.
2 Let the learners design an investigation to answer this question. They will need burners of different sizes; in general, a burner that uses its fuel faster delivers more energy per second (i.e. it is more powerful)
3 Let the learners design an investigation to find out. They should be able to describe to you which variables they kept the same and which they changed. Press them to go beyond a yes/no answer: they should find a relationship between the quantity of salt and the boiling point.
4 The learners should make the connection between this event – the radiator suddenly boils – and the section above on how the boiling point depends on the pressure on the liquid.
5 The graphs should show the following: a) For the water temperature inside the polystyrene cup, the temperature decreases over
a longer period of time, so the graph will have less of a negative gradient. b) For the temperature on the outside of the polystyrene, the temperature will increase
over a longer time, and so the graph will still curve upward but have smaller positive gradients.
The process skills here are interpreting the previous graphs and making a prediction from the pattern in those graphs. Of course you can push learners further and ask them to design the investigation and collect data, record it, communicate it in the form of more graphs and interpret it. These are more process skills.
6 In the question with the two girls and the jersey, the learners must make the connection between this problem and certain information in the chapter: the information is that a good thermal insulator slows down the transfer of heat from its warm side to its cool side. A good insulator keeps a significant temperature difference between the warm side and the cool side.
The process skill is interpreting information and applying a concept.
7 Encourage learners to test this idea. The main process skill is to interpret the information about the magnetic domains and the way they change if the iron atoms move more energetically.
8 Zinc is a metal but it is not nearly as good a conductor as copper, so we could expect that the average electrical conductivity of the copper-zinc alloy would be a bit less than that of copper.
Chapter 12 Electrostatics
139
Chapter 12 Electrostatics Unit 12.1 Two kinds of charge 139 Experiment 10 with three options 140 Unit 12.2 Charge conservation 141 Recommended resources 142
Preview the chapter
The purpose of the preview tasks is to develop the learners as good readers who make connections between old and new knowledge. The reason for the preview tasks is explained in more detail in the Teacher’s Guide for Chapter 8. Here are some questions you could give the learners.
1 How many units are in this chapter, and what are they called? 2 Why is that child’s hair standing up, in Figure 12.1? 3 In Figure 12.30, why is that man going to get a shock? 4 What challenges can you do at the end of the chapter?
Unit 12.1 Two kinds of charge (LB page 287)
Quick Activity: Say what you know about static electricity (LB page 287)
The purpose of this activity is to activate the learners’ existing ideas about static electricity and give you insight into their thinking. Try to make notes of what the learners say, especially the words they use. Your notes will give you ideas about how to plan the coming lessons.
In Question 3, learners may say they have seen plasma sparks from electric trains, welding, car batteries, or sparks inside wall sockets. Some learners may say that lightning is a spark too. Acknowledge the learners’ ideas and note what they say but tell them that some sparks are not caused by static electricity – we can get sparks from the terminal of a car battery, for example.
But lightning is indeed caused by static electricity.
Activity 1 How can we explain this? (LB page 287)
1 The wiped end of the straw will move towards the fingers. The skill is observing, which means noting everything that happens and that seems relevant. The purpose of the activity is to raise questions in learners’ minds. These questions prepare them to think about forces in the coming lesson.
2 The end of the straw that was not wiped is not attracted to the fingers. The process skill is observing and comparing.

Chapter 12 Electrostatics
140
3 The process skill is hypothesising – perhaps something has been taken from the fingers onto the straw, or from the straw onto the fingers.
4 The process skill is hypothesising – something creates a force between them, which acts at a distance.
5 Bits of paper and dust are attracted to the straw, but it sometimes happens that after a few seconds, the paper is repelled at high speed. This can be quite mysterious and it invites ideas (hypotheses) that could explain it.
An explanation is as follows: Assume the straw has a negative charge. The bit of paper or dust is a non-conductor, so when it is attracted to the straw the paper becomes polarised. That means the electron clouds around each atom in the paper become distorted as the electrons are repelled from the straw, but the electrons cannot move away from their atoms (the paper is a non-conductor). The side of the paper touching the straw gets a nett positive charge and the side farthest from the straw gets a nett negative charge. If something bumps the bit of paper, it might flip over, and the negatively polarised side then comes close to the straw and the paper gets repelled.
Experiment 10 Option 1: Push and pull with the electric force (LB page 290)
1 The straws push away from each other (they repel each other). Also, the forces act without the straws touching, so these forces are distance forces.
2 It is an attractive or pulling force. It acts without the two objects touching. Skill: Observing & comparing.
3 The force acts through space; the objects do not have to touch each other. Skill: making an inference about the charges on the straws.
4 The protons are held firmly deep inside their atoms. The electrons are on the outer surface of the atoms. Note that the straw and the paper are both non-conductors so the electrons do not flow; it is only the electrons from the outer surfaces of the paper that can be displaced from the paper to the straw. Skill: interpreting the observation.
5 The answer sketch must show: a) two repelling forces acting in opposite directions b) two attractive forces acting in opposite directions.
The skill is observing and recording, and interpreting the motion of the straw to infer the direction of the forces.
6 If two objects have the same kind of electric charges on them, they repel each other. If the objects have opposite charges on them, they attract each other.
7 If an object has more negative charges than positive charges, we say the object is negatively charged. If an object has fewer negative than positive charges, we say it is positively charged.
8 Like charges repel each other but unlike charges attract each other.
Chapter 12 Electrostatics
141
Experiment 10 Option 2: Investigate positive and negative charges with Perspex and polythene rods (LB page 292)
1 The Perspex and the polythene attract each other. 2 The charged Perspex rod attracts small pieces of paper. 3 The charged polythene rod attracts small pieces of paper. The nett negative charge on
the polythene repels electrons away from the side of the paper nearest the rod. This leaves an excess of positive charge on that edge. The positively charged edge of the paper is attracted to the negatively charged polythene.
Experiment 10 Option 3: Use a gold-leaf electroscope to identify positive and negative charges (LB page 293)
1 The glass takes a positive charge from the silky cloth and so it will attract more electrons up from the leaves; this means the leaves will be left with even more nett positive charge and they will diverge even more. (Benjamin Franklin chose the name “positive”; he decided to call the electric charge on glass, rubbed with silk, a “positive” charge. Therefore anything else that was repelled by the glass also had positive charge.)
2 The leaves should collapse. This means that electrons are being pushed down to the leaves where they neutralise the positive charge. Therefore the charge on the straw must be negative because it repels electrons down to the leaves.
Activity 2 Investigate electric charge using a van de Graaff generator (LB page 296)
1 Hang the polythene rod to that it can move freely, and bring it near to the dome. Or connect an insulated wire to the dome and bring the end of the wire near to a positively-charged electroscope. Observe the movement of the leaves of the charged electroscope.
2 The point of the lightning-rod concentrates the charge that the thunder-cloud induces in the building. Because the charge is concentrated at the sharp point, electrons are repelled off the rod into the air. This reduces the build-up of charge in the building.
Unit 12.2 Charge conservation (LB page 298)
Activity 3 Calculate charges (LB page 301)
1 The +2 C on sphere 2 will neutralise −2 C of the −5 C on sphere 1. This will leave −3 C on sphere 1. However all those electrons repel each other, and they will spread out over both sphere as much as they can, so that each sphere has –1,5 C of charge on it.
2 The charge Q on each sphere is the average of the nett charge on the two spheres, so on
each sphere Qfinal = 8 02
− + = − 4 C

Chapter 12 Electrostatics
142
3 The golf balls are non-conductors, so the charges will not spread out over the surfaces of the golf balls.
Activity 4 Make a Leyden jar (LB page 303)
This activity, making a very simple capacitor, prepares the ground for learning about capacitors in Electrical Technology. In the Resource Pages the learners can find suggestions for improving their Leyden Jars.
1 18 000 volts 2 This small Leyden jar has only a small foil area and so it cannot store very much charge.
The process skill is hypothesising.
Unit 12.2 Summary activity (LB page 305)
The answers to the questions come almost straight from the text. However, you should assess the learners’ writing for logical connections and clarity – they need to have good writing skills to do well in examinations.
Recommended resources
http://learn.sparkfun.com/tutorials/capacitors http://www.sciencebuddies.org/blog/2011/02/the-shock-of-static-electricity.php
On Franklin and Leyden jars: http://www.worldwideschool.org/library/books/sci/history/AHistoryofScienceVolumeII/chap54.html
Chapter 13 Circuits and potential difference
143
Chapter 13 Circuits and potential difference Learners’ conceptual difficulties with electric circuits 143 Some questions you can use to remediate the misconceptions 144 Unit 13.1 Electric circuit diagrams and components 145 Unit 13.2 How to measure potential difference and current 148 Experiment 11: Measurement of voltage (pd) and current 149 Challenges and projects 150
Preview the chapter
Here are some questions which you could ask the learners.
1 How many Units does this chapter have, and what are they called? 2 What projects can you choose in the Challenges and Projects section? 3 Find the section with the heading The emf of a cell. What is the emf of a cell and how
can you find out how much the emf of a cell is? 4 Where will you learn how to read the voltage on a multimeter?
For the teacher: Learners’ conceptual difficulties w ith electric circuits
This textbook uses the energy-priority approach to teaching circuits; energy and potential difference are the central concepts. Here we explain the reason.
Learners in primary school learn quite quickly how to make bulbs light up, and they find it very satisfying. They learn some simple theory of circuits. In many cases, the lessons emphasise that the battery produces a current that will flow only if the circuit is complete. The children then develop their thinking on the basis that batteries produce current and the current makes bulbs light up and it makes motors run. (Does this sound familiar to you?)
That approach in teaching is called the “current-priority” approach. Current is the central concept.
However, as these learners go deeper into the study of electricity, some bothersome misconceptions about circuits appear, and circuits become difficult for them to understand. Many of the difficulties that learners have with circuits can be avoided if we give priority to the energy concept instead of the current concept.
The “energy-priority” approach to circuits emphasises that a potential difference across a resistor causes a current, and it is not the current that causes a potential difference.
Activity 2, Let cells transfer their potential energy to steel wool in a circuit, in this chapter focuses on the energy that the cells supply to the steel wool.
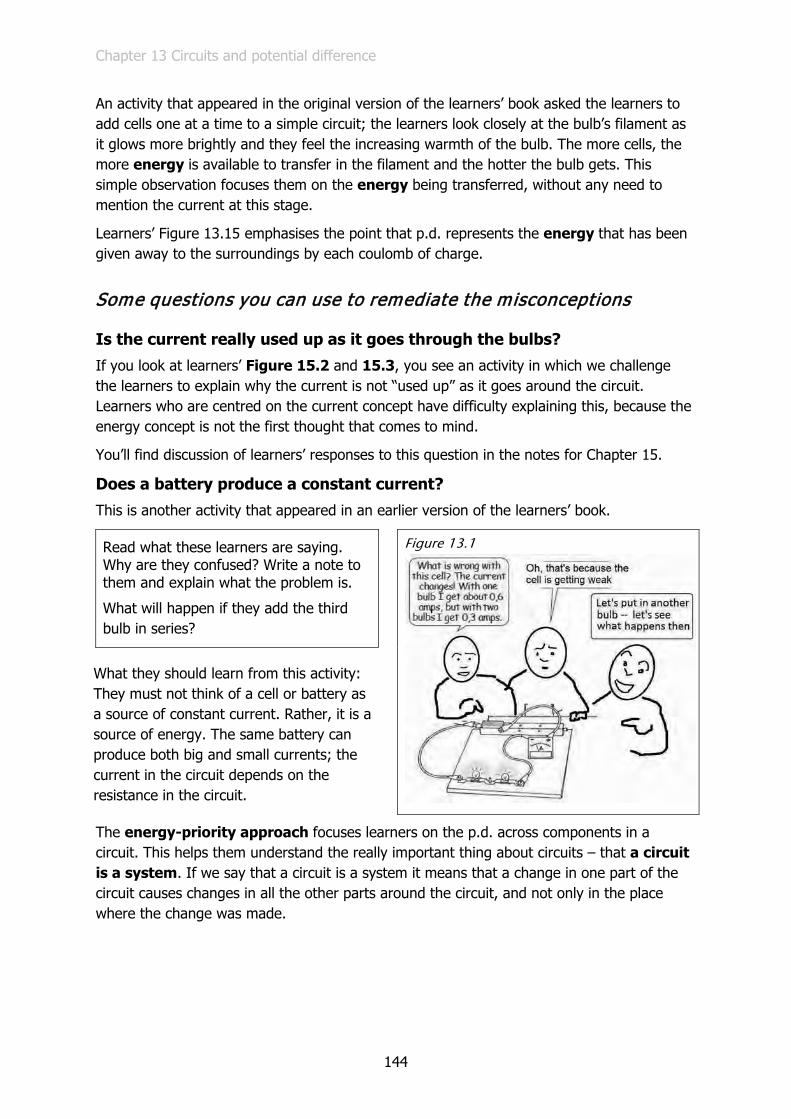
Chapter 13 Circuits and potential difference
144
An activity that appeared in the original version of the learners’ book asked the learners to add cells one at a time to a simple circuit; the learners look closely at the bulb’s filament as it glows more brightly and they feel the increasing warmth of the bulb. The more cells, the more energy is available to transfer in the filament and the hotter the bulb gets. This simple observation focuses them on the energy being transferred, without any need to mention the current at this stage.
Learners’ Figure 13.15 emphasises the point that p.d. represents the energy that has been given away to the surroundings by each coulomb of charge.
Some questions you can use to remediate the misconceptions
Is the current really used up as it goes through the bulbs?
If you look at learners’ Figure 15.2 and 15.3, you see an activity in which we challenge the learners to explain why the current is not “used up” as it goes around the circuit. Learners who are centred on the current concept have difficulty explaining this, because the energy concept is not the first thought that comes to mind.
You’ll find discussion of learners’ responses to this question in the notes for Chapter 15.
Does a battery produce a constant current?
This is another activity that appeared in an earlier version of the learners’ book.
Read what these learners are saying. Why are they confused? Write a note to them and explain what the problem is.
What will happen if they add the third bulb in series?
Figure 13.1
What they should learn from this activity: They must not think of a cell or battery as a source of constant current. Rather, it is a source of energy. The same battery can produce both big and small currents; the current in the circuit depends on the resistance in the circuit.
The energy-priority approach focuses learners on the p.d. across components in a circuit. This helps them understand the really important thing about circuits – that a circuit is a system. If we say that a circuit is a system it means that a change in one part of the circuit causes changes in all the other parts around the circuit, and not only in the place where the change was made.

Chapter 13 Circuits and potential difference
145
To illustrate the point that a circuit is a system, let’s look at this question about the circuit in Figure 13.2:
The cell E has no internal resistance and both bulbs M and N are glowing. Now you remove bulb N from its socket. Which of these happens?
a) Bulb M glows brighter. b) The potential difference (p.d.) across X and Y goes
to zero. c) The p.d. between X and Y stays the same. d) The p.d. between X and Y decreases.
The question comes from research done with groups of top Grade 10 to 12 students and twelve teachers with a B.Sc. degree. The circuit looks simple enough to solve the problem.
Of the students, 35% chose (a), 35% chose (b), 24% chose (c) and 6% chose (d).
Of the teachers, 2% chose (a), 10% chose (b), 47% chose (c) and 22% chose (d).
It seems that the question is not so simple after all. Try this yourself. We’ll come back to the results and discuss them in the Teacher’s Guide for Chapter 15.
In the Teacher’s Guide for Chapter 15, you will find discussion of three of the most common misconceptions about circuits.
Unit 13.1 Electric circuit diagrams and components (LB page 307)
Activity 1 How to draw a circuit diagram (LB page 311)
1 The circuit diagram represents a two-cell battery, a switch, conductors, and a bulb. This is what you see in both real circuits.
2 Figure 13.3 The circuit diagram that represents the circuit in Figure 13.7 in the learners’ book
Figure 13.2 What happens if you remove bulb N?

Chapter 13 Circuits and potential difference
146
3 The diagram shows two cells in series with a switch, two bulbs and an ammeter. The components are all joined with conducting wire. (Notice that Figures 13.7 and 13.8 show essentially the same circuit.) It does not matter whether the ammeter is connected next to the bulb or next to the battery, because the same current flows through all parts in the series circuit.
4—5 Figure 13.4 Answer to Question 4
Figure 13.5 Answer to Question 5
Activity 2 Let cells transfer their potential energy to steel wool in a circuit (LB page 314)
1 The electrons, going round the circuit, tug at the nuclei of the atoms in the steel. This makes them vibrate much faster, so fast that they give out light. (Remind the learners of the section on electrical properties of materials in Chapter 11.)
2 If only one wire touches the steel wool, the circuit is not complete (closed). Note that many learners still believe that one wire should be able to emit a current; their
picture of electric circuits is the idea of the hose and tap. The tap is the battery and the wire is the hose. They will draw a complete circuit as their teacher has shown, but it is likely that some of them still think that one wire should be enough to send out current from the battery.
In the Teacher’s Guide for Chapter 15, you will find a discussion of three of the most common misconceptions about circuits.
3 With one cell in the circuit, the learners will have a current through the steel wool but the current will not be big enough to heat the steel to red-hot temperature. Three cells provide enough energy to cause a bigger current and to transfer enough energy to the steel so that it glows red hot.
4 A strand of the steel wool is very thin, and the current has enough energy to heat up that small amount of steel. The bulb filament is also very thin and glows for the same reason.
5 The bulb filament is much longer – it is coiled and then the coil is coiled again. Learners could see this with a magnifying glass. Also, the filament is made of tungsten, which has a melting point much higher than the melting point of steel. (Remind them that they learned about this in Chapter 11.)

Chapter 13 Circuits and potential difference
147
Activity 3 What is inside a torch bulb? (Enrichment) (LB page 315)
This activity has two purposes: one is to help the learners see how the torch-bulb is part of a complete circuit. The other purpose is to give them an example of a cut-away diagram. This type of diagram is common in technical books and, of course, in engineering drawing. However, here they have a real bulb that they can look inside, and compare it with the cut-away diagram.
1 An exact answer is not needed here; the main idea is that the filament is much longer than the width of the picture, if you could uncoil the main coils and then uncoil the sub-coils. (If you could straighten out the tungsten wire you see in the photo, the new photo would be about 39 times wider than the photo in the book. That’s a photo about 1,95 metres wide.)
Just for fun, you can set a challenge to work out why the photo would be that wide. You’ll find the challenge at the end of these notes for Chapter 13. But don’t side-track the lesson away from the energy-transfer concept right now – rather raise it later.
2 A sentence would read something like this: To make a bulb glow, you must connect wires from the positive terminal of the cell to the solder terminal on the cell. From the negative terminal of the cell you must connect a wire to the screw terminal of the bulb. This sounds like a simple task but the purpose, of course, is for them to exercise their writing skills. Don’t dictate an answer, rather let them write sentences that you can informally assess and give them feedback on.
3—4 The purpose of this question is to make learners look closely at the bulb-holder, and understand why the bulb must be screwed down for the solder knob to reach its metal contact in the holder.
Figure 13.6 A cross-section of the bulb and bulb-holder. The learners should use a coloured pen to show the path of the current through this part of a circuit. Here we can’t show colour, so we use a dotted line.

Chapter 13 Circuits and potential difference
148
Unit 13.1 Summary activity (LB page 317)
1 The learners’ answers should include the words conductor(s), no breaks, cell/battery/source.
2 The learners’ answers should include the words charges or electrons, flow, potential difference.
3 The learners’ answers should include the words energy, transfer, all around the circuit. 4 The sentences should read as follows:
a) The charges coming out of the filament have less energy than the charges going in. b) The energy they have given away is the same energy that heats up the filament. c) This difference in the charges’ energy across the bulb is called the potential difference.
Unit 13.2 How to measure potential difference and current (LB page 317)
Activity 4 Learn how to read voltage on a multimeter (LB page 318)
1 You have to look at the rotating switch and find out what quantity it is set to measure. In learners’ Figure 13.18 the rotating switch is set to read “DCV” or “volts, direct current”.
2 The bulb gets brighter and the voltmeter shows a greater potential difference across the bulb.
3 The voltage across the ends of the connector strip/wire is zero because no energy is being transferred in the connector strip/wire. We know that no energy is being transferred because the strip is cool, and it is not heating up.
4 This is a very important observation – in the next chapter the learners will realise that no energy is being transferred because the connector strip has extremely low resistance.
Spend time on this prediction – ask the learners to remove the bulb and holder, and imagine they are connecting the voltmeter across the gap. (But don’t let them do it yet!) Ask for some predictions of what the voltmeter will show. Some or most of them will predict that the voltmeter will show zero volts.
From Grade 9 they may have the (mis)understanding that potential difference is simply the answer you get when you calculate V= I × R. They may reason that, since there is no current in the circuit, I = 0 and therefore I × R = 0 and so V = 0.
Ask them whether they think the battery still has potential energy to give, even though the circuit is broken. The potential energy per coulomb of charge is measured in volts; can we know how many volts the battery can put across the ends where the bulb was connected? Yes, we can – the maximum voltage is printed on the side of the cells.

Chapter 13 Circuits and potential difference
149
5 Now let them measure the potential difference across the gap where the bulb was. The voltmeter will show about 1,5 volts (or 3 volts if you have two cells in circuit).
At this point you can ask them to note that the voltmeter reading with the open circuit is higher than when the bulb was glowing. The open-circuit reading is the “emf” of the battery while it is not transferring any energy, while the voltage reading across the bulb when the bulb is glowing indicates the energy that the battery is transferring to the bulb.
6 What’s going on, when the voltmeter shows only about 1,4 volts across the bulb? Where is the other 0,1 volt? The answer is that some of the energy from the current is transferred inside the cell itself, and so you might actually feel the cell getting a little warm as it works. In this example, the 0,1 volt difference between the two readings indicates how much energy per coulomb is going to warm up the cell itself.
The whole situation becomes clear if you ask the learners to measure directly across the terminals of a cell – the cell has “1,5 V” printed on its side, and the voltmeter shows approximately the same reading.
Activity 5 Learn how to read the current on a multimeter (LB page 320)
1 You have to look at the position of the rotating switch. In Figure 13.20 in the learners’ book, for example, the switch has been set to measure “DCA” or “amperes, direct current”.
2 The bulb gets brighter and the reading on the ammeter increases to nearly double the previous reading
3 In Figure 13.19 the voltmeter is connected so that the current does not have to flow through the voltmeter; any voltmeter must be connected in parallel with the bulb and the brightness of the bulb does not change when you connect the voltmeter across it. In Figure 13.20, the ammeter is connected so that all the current has to flow through the ammeter; any ammeter must be connected in series with the bulb.
Experiment 11: Measurement of voltage (pd) and current (LB page 320)
In this activity, the learners use both voltmeter and ammeter together, and measure voltage across the bulb and current through the bulb at the same time.
Analogue meters such as the ones in the figure are easier to understand, but if you have only multimeters, try to use two at the same time. Set one to the 20 volt range and set the other to the 10 amp range. Connect them in parallel and in series as the figure indicates.
This experiment is not just about reading the voltmeters and ammeters, of course. Focus the learners on the Focus Question: If the potential difference across the bulb changes, does this cause the current to change?
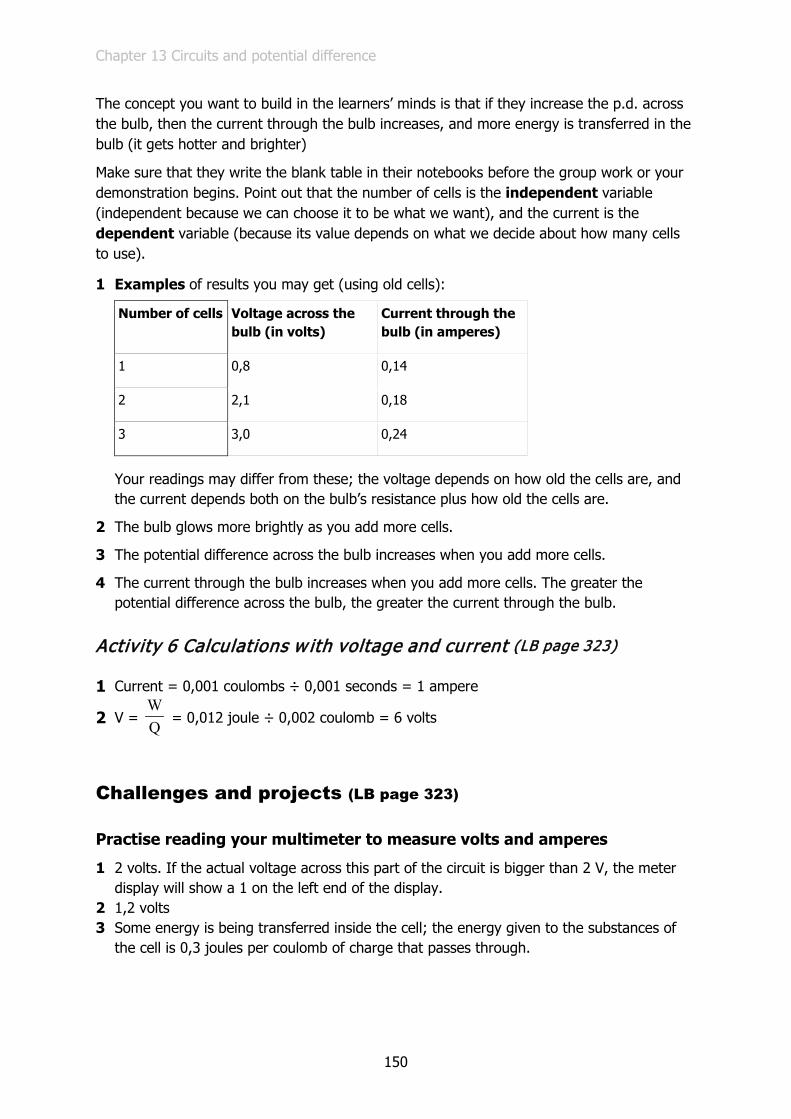
Chapter 13 Circuits and potential difference
150
The concept you want to build in the learners’ minds is that if they increase the p.d. across the bulb, then the current through the bulb increases, and more energy is transferred in the bulb (it gets hotter and brighter)
Make sure that they write the blank table in their notebooks before the group work or your demonstration begins. Point out that the number of cells is the independent variable (independent because we can choose it to be what we want), and the current is the dependent variable (because its value depends on what we decide about how many cells to use).
1 Examples of results you may get (using old cells):
Number of cells Voltage across the bulb (in volts)
Current through the bulb (in amperes)
1 0,8 0,14
2 2,1 0,18
3 3,0 0,24
Your readings may differ from these; the voltage depends on how old the cells are, and the current depends both on the bulb’s resistance plus how old the cells are.
2 The bulb glows more brightly as you add more cells.
3 The potential difference across the bulb increases when you add more cells.
4 The current through the bulb increases when you add more cells. The greater the potential difference across the bulb, the greater the current through the bulb.
Activity 6 Calculations w ith voltage and current (LB page 323)
1 Current = 0,001 coulombs ÷ 0,001 seconds = 1 ampere
2 V = WQ = 0,012 joule ÷ 0,002 coulomb = 6 volts
Challenges and projects (LB page 323)
Practise reading your multimeter to measure volts and amperes
1 2 volts. If the actual voltage across this part of the circuit is bigger than 2 V, the meter display will show a 1 on the left end of the display.
2 1,2 volts 3 Some energy is being transferred inside the cell; the energy given to the substances of
the cell is 0,3 joules per coulomb of charge that passes through.
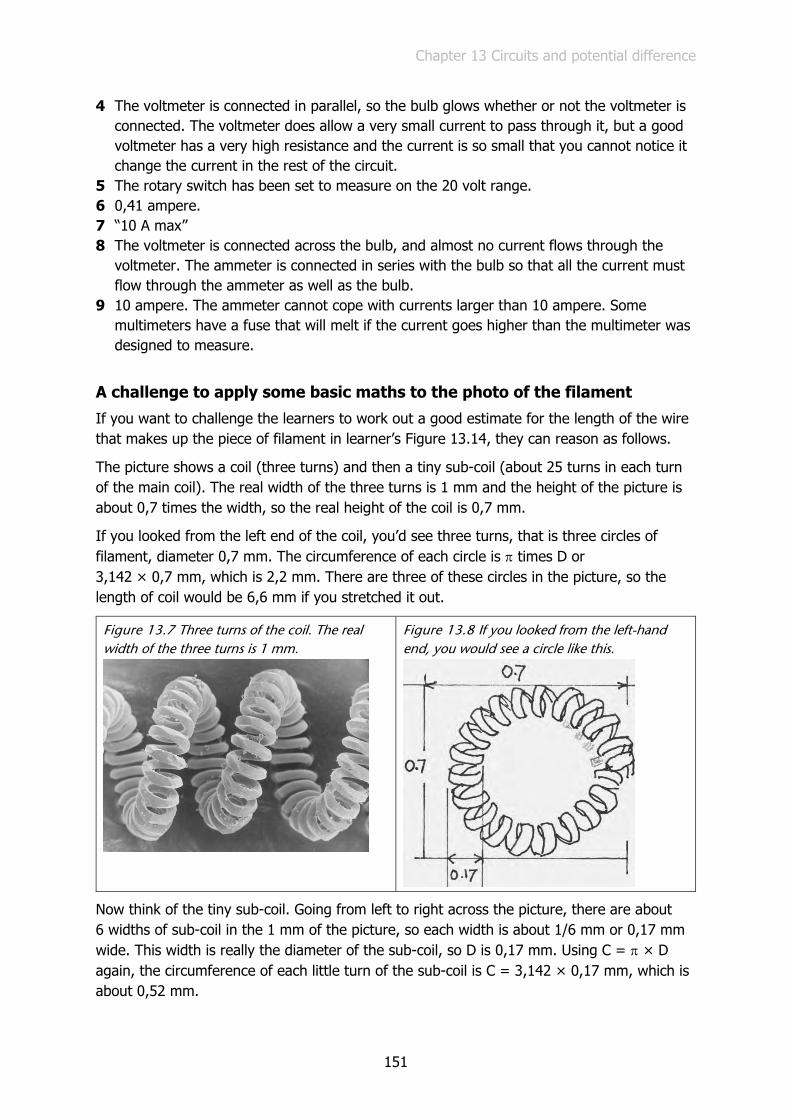
Chapter 13 Circuits and potential difference
151
4 The voltmeter is connected in parallel, so the bulb glows whether or not the voltmeter is connected. The voltmeter does allow a very small current to pass through it, but a good voltmeter has a very high resistance and the current is so small that you cannot notice it change the current in the rest of the circuit.
5 The rotary switch has been set to measure on the 20 volt range. 6 0,41 ampere. 7 “10 A max” 8 The voltmeter is connected across the bulb, and almost no current flows through the
voltmeter. The ammeter is connected in series with the bulb so that all the current must flow through the ammeter as well as the bulb.
9 10 ampere. The ammeter cannot cope with currents larger than 10 ampere. Some multimeters have a fuse that will melt if the current goes higher than the multimeter was designed to measure.
A challenge to apply some basic maths to the photo of the filament
If you want to challenge the learners to work out a good estimate for the length of the wire that makes up the piece of filament in learner’s Figure 13.14, they can reason as follows.
The picture shows a coil (three turns) and then a tiny sub-coil (about 25 turns in each turn of the main coil). The real width of the three turns is 1 mm and the height of the picture is about 0,7 times the width, so the real height of the coil is 0,7 mm.
If you looked from the left end of the coil, you’d see three turns, that is three circles of filament, diameter 0,7 mm. The circumference of each circle is π times D or 3,142 × 0,7 mm, which is 2,2 mm. There are three of these circles in the picture, so the length of coil would be 6,6 mm if you stretched it out.
Figure 13.7 Three turns of the coil. The real width of the three turns is 1 mm.
Figure 13.8 If you looked from the left-hand end, you would see a circle like this.
Now think of the tiny sub-coil. Going from left to right across the picture, there are about 6 widths of sub-coil in the 1 mm of the picture, so each width is about 1/6 mm or 0,17 mm wide. This width is really the diameter of the sub-coil, so D is 0,17 mm. Using C = π × D again, the circumference of each little turn of the sub-coil is C = 3,142 × 0,17 mm, which is about 0,52 mm.
Chapter 13 Circuits and potential difference
152
Within each turn of the coil there are about 25 turns of the sub-coil. The circumference of each turn in the little sub-coil is 0,52 mm, so one circle or turn of the main coil contains 0,52 × 25 mm or 13 mm of wire. Since there are three turns (circles) of the main coil, the length of all the tungsten wire in the photo must be about 39 mm. That is 39 times longer than the width of the photo. The photo in the learners’ book is about 50 mm wide, so a photo of the stretched-out tungsten would be 1 950 mm wide.
What’s the point of all this? To get enough resistance in the filament, the engineers have taken a very long piece of tungsten and coiled it to fit in that small space inside the glass cover of the bulb.
Coiling the tungsten like this has another advantage. The glass cover of the bulb is filled with non-reactive argon gas. Convection in the gas would transfer energy to the glass cover and cool the filament a little and make it less bright. Keeping the hot filament tightly coiled minimises the heat transfer that is caused by convection.

Chapter 14 Resistance and factors that change it
153
Chapter 14 Resistance and factors that change it Unit 14.1 Conductors and resistance 153 Unit 14.2 Design resistors to control currents 155 Experiment 12: Investigate the factors that affect the resistance of a conductor 155 Experiment 7: Alternative formal assessment 167 Challenges and projects 168
Preview the chapter
1 This chapter is about resistance, so you should expect to find a big heading that explains what “resistance” means. Go on and find that heading further on in this chapter. You see a blue box there that tells you about resistance – what does it say?
2 Resistance depends on four factors*; what are the four factors? And where in this book can you find out what "factor" means?
3 What project can you do? Find out in the Challenges and projects section.
Unit 14.1 Conductors and resistance (LB page 325)
Quick Activity: A range of resistivity* from very low to very high (LB page 326)
The purpose of this quick activity is to give you some insight into what the learners already know. They might not know the properties of some of these materials but if a learner in the class has some ideas, let them tell what they know.
A correct sorting of the materials is:
Very good conductors: low
resistivity Good conductors Poor conductors
Very poor conductors: high
resistivity (insulators)
copper, gold, cooking foil (aluminium)
paper wet with salt water, wet human
skin
nichrome wire, pencil graphite, moist air
plastic, glass, dry air, dry paper
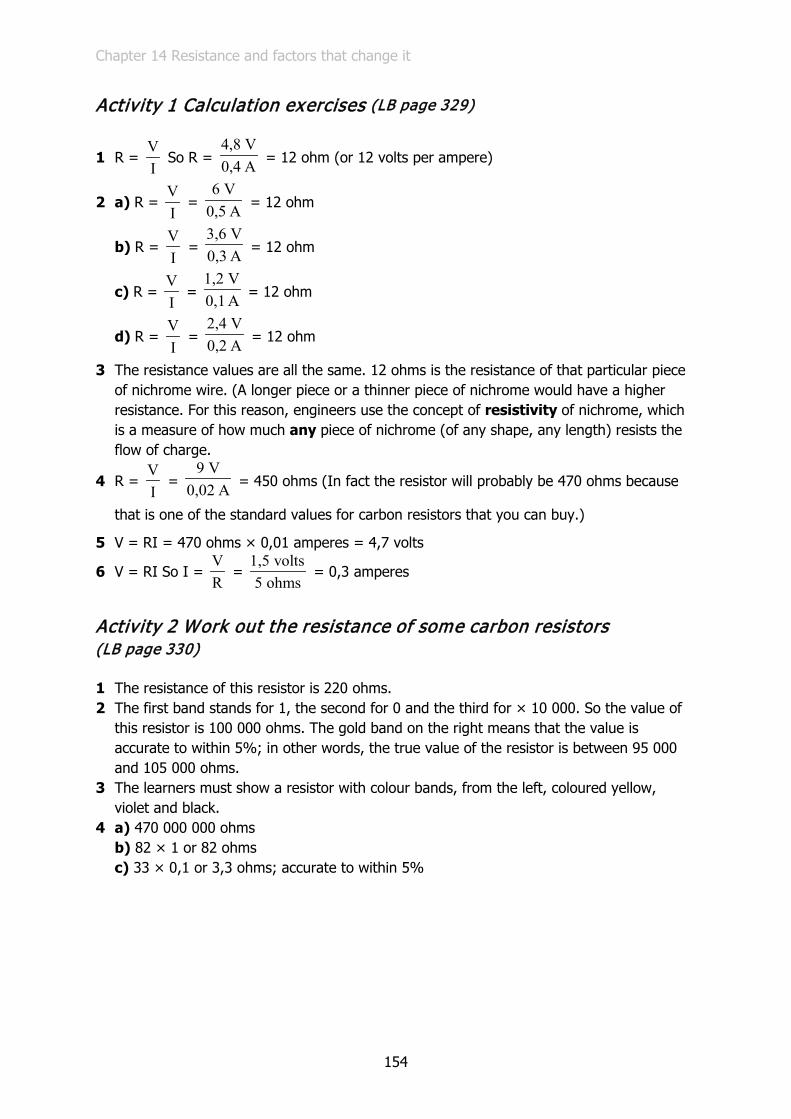
Chapter 14 Resistance and factors that change it
154
Activity 1 Calculation exercises (LB page 329)
1 R = VI
So R = 4,8 V0,4 A = 12 ohm (or 12 volts per ampere)
2 a) R = VI
= 6 V
0,5 A = 12 ohm
b) R = VI
= 3,6 V0,3 A = 12 ohm
c) R = VI
= 1,2 V0,1 A = 12 ohm
d) R = VI
= 2,4 V0,2 A = 12 ohm
3 The resistance values are all the same. 12 ohms is the resistance of that particular piece of nichrome wire. (A longer piece or a thinner piece of nichrome would have a higher resistance. For this reason, engineers use the concept of resistivity of nichrome, which is a measure of how much any piece of nichrome (of any shape, any length) resists the flow of charge.
4 R = VI
= 9 V
0,02 A = 450 ohms (In fact the resistor will probably be 470 ohms because
that is one of the standard values for carbon resistors that you can buy.)
5 V = RI = 470 ohms × 0,01 amperes = 4,7 volts
6 V = RI So I = VR
= 1,5 volts5 ohms
= 0,3 amperes
Activity 2 Work out the resistance of some carbon resistors (LB page 330)
1 The resistance of this resistor is 220 ohms. 2 The first band stands for 1, the second for 0 and the third for × 10 000. So the value of
this resistor is 100 000 ohms. The gold band on the right means that the value is accurate to within 5%; in other words, the true value of the resistor is between 95 000 and 105 000 ohms.
3 The learners must show a resistor with colour bands, from the left, coloured yellow, violet and black.
4 a) 470 000 000 ohms b) 82 × 1 or 82 ohms c) 33 × 0,1 or 3,3 ohms; accurate to within 5%
Chapter 14 Resistance and factors that change it
155
Unit 14.2 Design resistors to control currents (LB page 330)
Activity 3 What factors can change the resistance of conductors? (LB page 331)
1 The current would decrease. Each centimetre of nichrome has resistance, so the more centimetres of nichrome wire the current must pass through, the more resistance it “feels” and the more energy the electrons transfer to the nichrome wire.
2 a) The current would decrease. b) The cross-section area of the thin wire is less than the thick wire, so fewer electrons
can pass through it per second. 3 The current would decrease. The atoms and electrons in the nichrome wire move faster
and further out of their normal positions in the lattice. (Refer the learners to Figure 11.26 which shows electrons moving past metal atoms in a lattice.)
4 a) The current would increase. b) This is because silver is a better conductor than nichrome.
Experiment 12: Investigate the factors that affect the resistance of a conductor (LB page 331)
The textbook in this, its final version, does not give the learners much support in planning and doing these four investigations.
In its original form, the textbook contained four structured activities which guide the learners through the investigation of the four factors. Here, we present those four activities under the headings Experiment 12A, 12B, etc. Learners’ figures are now numbered as Figure T2, T3, etc.
You can use the questions with the learners. It is important that they do their own writing to complete the sentences. They must develop reading and writing skills.
Experiment 12D is the easiest of the four investigations, so you could let slow groups work on this. But you can raise the level of the task if you want to, by giving them Project 2 at the end of the chapter. There they have to investigate the way the resistance of a filament changes as its temperature increases.
You might like to photocopy these pages for the learners (but not the answers).
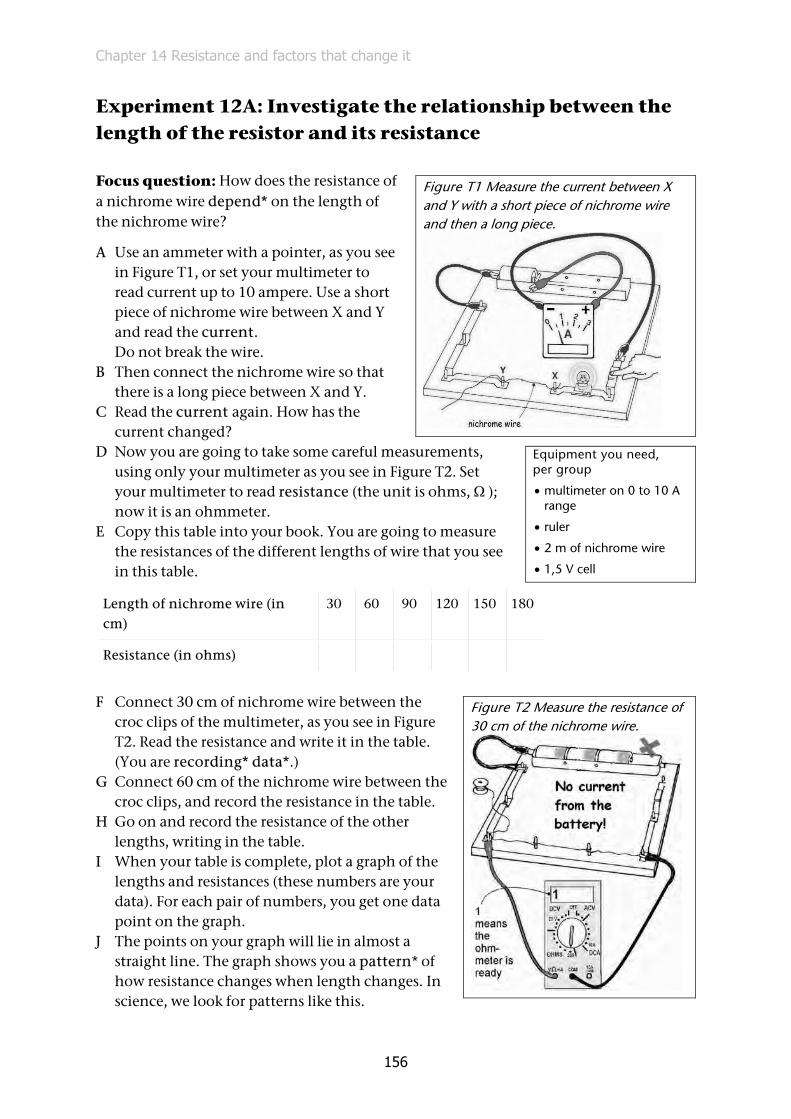
Chapter 14 Resistance and factors that change it
156
Experiment 12A: Investigate the relationship between the length of the resistor and its resistance
Focus question: How does the resistance of a nichrome wire depend* on the length of the nichrome wire?
A Use an ammeter with a pointer, as you see in Figure T1, or set your multimeter to read current up to 10 ampere. Use a short piece of nichrome wire between X and Y and read the current.
Do not break the wire. B Then connect the nichrome wire so that
there is a long piece between X and Y. C Read the current again. How has the
current changed? D Now you are going to take some careful measurements,
using only your multimeter as you see in Figure T2. Set your multimeter to read resistance (the unit is ohms, Ω ); now it is an ohmmeter.
E Copy this table into your book. You are going to measure the resistances of the different lengths of wire that you see in this table.
Length of nichrome wire (in cm)
30 60 90 120 150 180
Resistance (in ohms)
F Connect 30 cm of nichrome wire between the
croc clips of the multimeter, as you see in Figure T2. Read the resistance and write it in the table. (You are recording* data*.)
G Connect 60 cm of the nichrome wire between the croc clips, and record the resistance in the table.
H Go on and record the resistance of the other lengths, writing in the table.
I When your table is complete, plot a graph of the lengths and resistances (these numbers are your data). For each pair of numbers, you get one data point on the graph.
J The points on your graph will lie in almost a straight line. The graph shows you a pattern* of how resistance changes when length changes. In science, we look for patterns like this.
Figure T1 Measure the current between X and Y with a short piece of nichrome wire and then a long piece.
Equipment you need, per group
• multimeter on 0 to 10 A range
• ruler
• 2 m of nichrome wire
• 1,5 V cell
Figure T2 Measure the resistance of 30 cm of the nichrome wire.
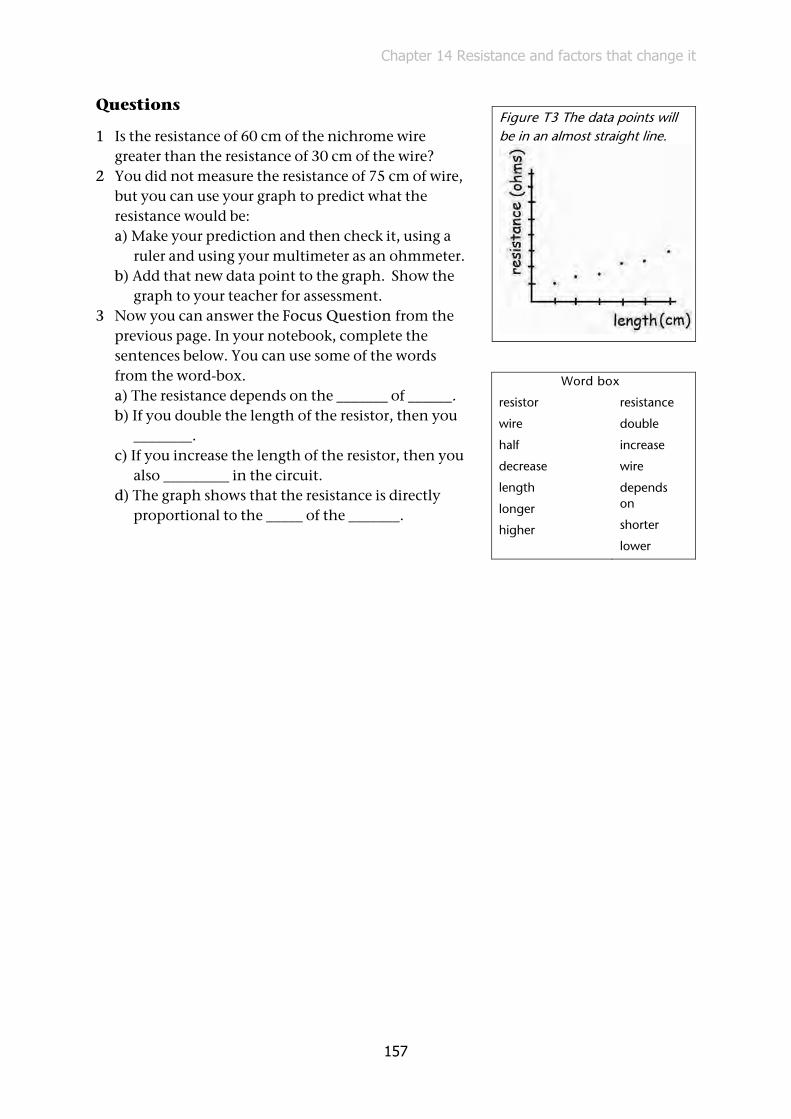
Chapter 14 Resistance and factors that change it
157
Questions
1 Is the resistance of 60 cm of the nichrome wire greater than the resistance of 30 cm of the wire?
2 You did not measure the resistance of 75 cm of wire, but you can use your graph to predict what the resistance would be: a) Make your prediction and then check it, using a
ruler and using your multimeter as an ohmmeter. b) Add that new data point to the graph. Show the
graph to your teacher for assessment. 3 Now you can answer the Focus Question from the
previous page. In your notebook, complete the sentences below. You can use some of the words from the word-box. a) The resistance depends on the _______ of ______. b) If you double the length of the resistor, then you
________. c) If you increase the length of the resistor, then you
also _________ in the circuit. d) The graph shows that the resistance is directly
proportional to the _____ of the _______.
Figure T3 The data points will be in an almost straight line.
Word box
resistor
wire
half
decrease
length
longer
higher
resistance
double
increase
wire
depends on
shorter
lower

Chapter 14 Resistance and factors that change it
158
Answers to 12A
1 Yes. This is intended as an easy starting question. 2 a) (Skill: predicting from a pattern)
b) (Skill: testing a prediction) 3 a) length of the resistor
b) double the resistance c) increase the resistance d) length of the resistance wire

Chapter 14 Resistance and factors that change it
159
Experiment 12B: Investigate the relationship between the diameter (thickness) of a conductor and its resistance
Focus question: How does the resistance of a wire depend on the thickness of the wire? (The thickness of the wire is the diameter* of the wire’s cross-section.)
Procedure
A Connect the 0,2 mm diameter nichrome wire in series, as you see in Figure T4. Read the current on the ammeter.
B Now take away the 0,2 mm diameter wire and connect the 0,4 mm diameter wire in series and read the current again. You must use the same length of wire each time.
Think why you must use the same length each time. C Does the current change when you change the wire
thickness? Answer Question 1.
Figure T4. Measure the current with 0,2 mm nichrome wire in series, and again with 0,4 mm nichrome wire.
Figure T5 Measure the resistance of 0,2 mm nichrome wire, and then of 0,4 mm nichrome wire. Connect the multimeter directly to the nichrome wire.
D Now look at Figure T5. Take the multimeter and set it to measure resistance (the Ω scale). Measure the resistance of 50 cm of nichrome with 0,2 mm diameter and record the resistance in a table like this:
Wire diameter (in mm) 0,2 0,4 0,6
Resistance (in ohms) (Predict what this resistance will be)
Equipment you need, per group
• nichrome wire: 0,2 mm diameter
• nichrome wire: 0,4 mm diameter
• 1,5 volt cells
• ammeter
• multimeter

Chapter 14 Resistance and factors that change it
160
Questions
1 a) How does the current change when you change from 0,2 mm to 0,4 mm diameter wire? b) Is the resistance of the 0,2 mm diameter wire different from the 0,4 mm diameter
wire? Is it the same, lower or higher? 2 Does your table of resistances tell you the same as your answer about current in
Question 1a? 3 The focus question asks: HOW does the resistance of the wire depend on the diameter
of the wire? Now you can answer the focus question. In your notebook, rewrite the sentence; use the parts that you see in the sentence-builder box.
The resistance of a wire depends on the diameter of the wire in the following way... (Now add your sentence, using the sentence-builder box on the right.)
4 What resistance did you predict for nichrome wire of 0,6 mm diameter?
5 Which diameter wire ---- of 0,2 mm, 0,4 mm or 0,6 mm ---- will pass the biggest current if you connect it to a 12 volt battery? Give your reason.
6 Why must you make sure that you always take the same length of each wire?
Show your answers to your teacher for assessment.
Build your sentences from these parts. Use all the parts.
the bigger the resistance
the smaller the resistance
the thinner the wire
the thicker the wire

Chapter 14 Resistance and factors that change it
161
Answers to 12B
1 a) The current increases. b) The 0,2 mm wire has higher resistance than the 0,4 mm wire.
2 The resistances should show the same change ---- as diameter gets smaller, so does the current.
3 The resistance of a wire depends on the diameter of the wire in the following way: The thinner the wire, the bigger the resistance; the thicker the wire, the smaller the resistance.
4 (Individual answers) 5 The 0,6 mm diameter wire will pass the biggest current because it has the lowest
resistance 6 The resistance might depend on the length as well as the diameter, so we must be sure
we are comparing only the effect of changing the diameters. (Skill: designing a fair test, controlling variables.)
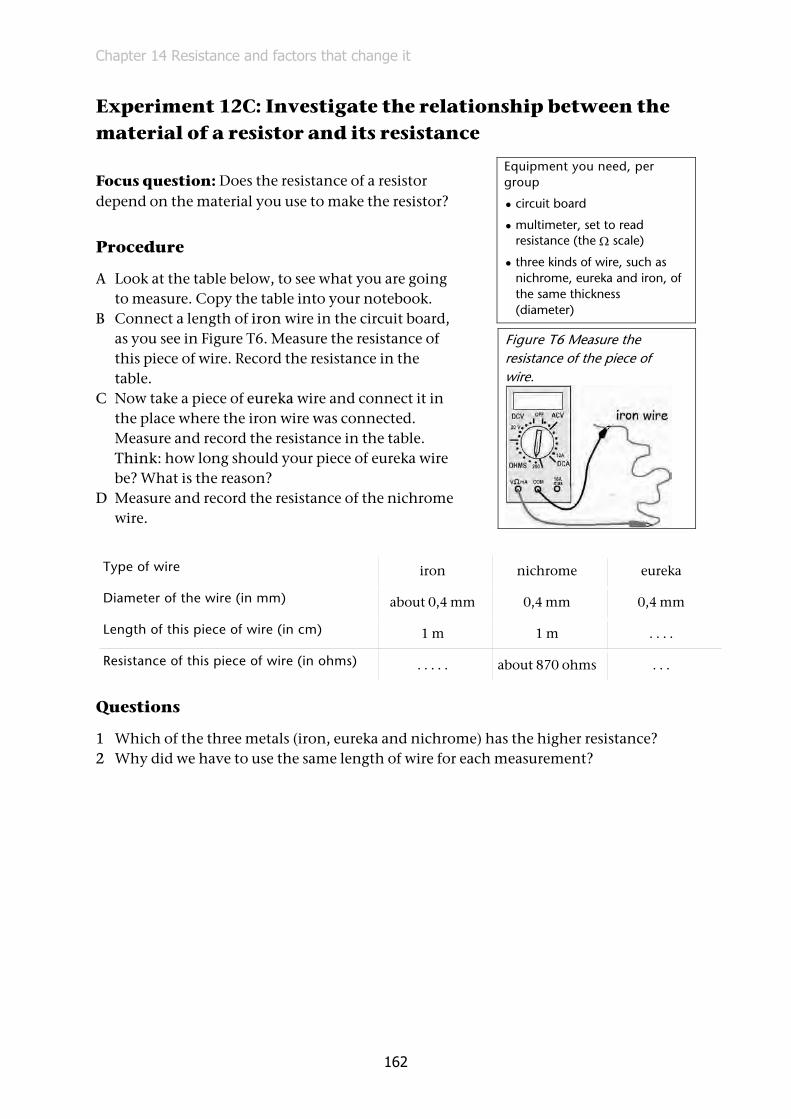
Chapter 14 Resistance and factors that change it
162
Experiment 12C: Investigate the relationship between the material of a resistor and its resistance
Focus question: Does the resistance of a resistor depend on the material you use to make the resistor?
Procedure
A Look at the table below, to see what you are going to measure. Copy the table into your notebook.
B Connect a length of iron wire in the circuit board, as you see in Figure T6. Measure the resistance of this piece of wire. Record the resistance in the table.
C Now take a piece of eureka wire and connect it in the place where the iron wire was connected. Measure and record the resistance in the table. Think: how long should your piece of eureka wire be? What is the reason?
D Measure and record the resistance of the nichrome wire.
Type of wire iron nichrome eureka
Diameter of the wire (in mm) about 0,4 mm 0,4 mm 0,4 mm
Length of this piece of wire (in cm) 1 m 1 m . . . .
Resistance of this piece of wire (in ohms) . . . . . about 870 ohms . . .
Questions
1 Which of the three metals (iron, eureka and nichrome) has the higher resistance? 2 Why did we have to use the same length of wire for each measurement?
Equipment you need, per group
• circuit board
• multimeter, set to read resistance (the Ω scale)
• three kinds of wire, such as nichrome, eureka and iron, of the same thickness (diameter)
Figure T6 Measure the resistance of the piece of wire.

Chapter 14 Resistance and factors that change it
163
Answers to 12C
1 Nichrome has the higher resistance 2 To compare the wires in a fair way, they must be the same length. If we did not use
the same length, a short piece of nichrome wire could have a lower resistance than a long piece of iron wire.

Chapter 14 Resistance and factors that change it
164
Experiment 12D: Investigate the relationship between the temperature of a resistor and its resistance
Focus question: In what way does the resistance change as a resistor gets hotter?
Procedure
A Take about 1 metre of nichrome wire and roll it around a pencil to make a coil.
B Set up the circuit as you see in Figure T7. There is no bulb in the circuit. The circuit must have a switch.
C Set your multimeter to read 10 A maximum. D Now heat the coil of nichrome wire. To do this, hold the
flame of the spirit burner under the coil, so that the coil glows orange. Close the switch and measure the current.
Figure T7 Set up the circuit with a battery and read the current. How does the current change when you heat the nichrome wire?
E If the current is less than 0,2 A, turn the rotary switch to the 200 milliampere scale in DC amperes (the sign for DC on the multimeter is - - - - ). At this range you will see the change in current more easily.
Questions
1 How does the current change when the nichrome wire is red hot? 2 What does the change in current tell you about the change in resistance? 3 Now test your idea as follows: Instead of observing changes in current, measure the
resistance of the nichrome wire directly. To do this, set the multimeter to the resistance scale, connect the nichrome wire, and measure the resistance when the nichrome is cold and when it is hot.
4 Complete this sentence in your notebook: Resistance depends on the temperature of the resistor in the following way: the _____ the _______ of the wire, the ____ the resistance of the wire.
Equipment you need, per group
• circuit board
• multimeter
• 1 meter of nichrome wire (any thickness)
• 3 cells of 1,5 volts each
• spirit burner
Complete the sentences using only some of these words:
• lower
• higher
• greater
• temperature
• resistance
• current

Chapter 14 Resistance and factors that change it
165
Answers to 12D
1 The current decreases. The decrease is quite small, so the learners must observe carefully what happens as the nichrome wire heats up and cools.
2 The learner must make an inference about the resistance. If the current decreases, it means that the resistance has increased.
3 (Learner task) 4 Resistance depends on the temperature of the resistor in the following way: the
higher the temperature of the wire, the greater the resistance of the wire.

Chapter 14 Resistance and factors that change it
166
This is the end of the section that was removed from the first version of the learners’ book. We continue with answers to questions as they are in the present version of the book.
Activity 4 Match the factors to their applications (LB page 332)
1 a) They make a filament that is very long. b) The filament is very long, as long as 1,5 metres. This long length ensures that the
filament has much more resistance than any other part of the circuit. The principle here is: the longer the wire, the higher the resistance.
2 a) Wire with a larger cross-section area (larger diameter, larger thickness) has lower resistance and so it does not heat up when a large current flows through it. The heating resistors in a stove may allow current of 12 ampere or more to flow. However, a 60 watt lamp may take a current of only 0,25 ampere, so the wires that supply the current can be quite thin.
b) The principle here is: the larger the cross-section area, the less the resistance. c) The wires would heat up, which would increase their resistance, which in turn would
cause more heating. d) Learners’ own answers
3 The principle is: the lower the temperature of the conductor, the lower its resistance. 4 The same principle applies here: the lower the temperature, the less the resistance of
the conductors in the computer. In a computer’s circuits, the conductors are already very thin and narrow, so their resistance is a problem from the beginning. Any heating increases their resistance and reduces the power to the components in the computer.
5 The principle here is that the resistance of a conductor depends on the material. Copper and aluminium are both good conductors but copper is better than aluminium. So if you have two pieces of wire of the same length and thickness (cross-section area) but one is made of copper and the other is made of aluminium, the aluminium will have more resistance and will therefore heat up more.
6 a) The starter motor has low resistance and it may need a current of 400 ampere to flow for a few seconds when the driver turns on the ignition. The starter motor will not get the current it needs unless the battery cable has very low resistance.
b) The wire from the desk lamp would heat up and probably burn all its insulation, when the starter motor tries to draw current from the battery.
c) Iron wire of the same thickness would work better than lamp-wire, but it has much higher resistance than copper.
Chapter 14 Resistance and factors that change it
167
Alternative formal assessment
Formal assessment in Term 3 in the CAPS requires one experiment for formal assessment in Term 1, two in Term 2 and one in Term 3. The CAPS on page 12 sets an Experiment to determine the electrical conductivity of different materials. However, the detailed content for Term 3 gives us Experiment 8 (Formal) Investigate the insulation ability of a polystyrene cups. This formal assessment, with marking memo/rubric is in the Teacher’s Guide for Chapter 11, Experiment 8. So you can complete the Term 3 formal assessment requirement by doing Experiment 8. However, you can also do Experiment 7 for formal assessment. The DBE recommends the task on the next page as formal assessment.
Experiment 7: Determine the electrical conductivity of different materials
Aim: Test the conductivity of different materials and measure the resistance.
Procedure
1 Draw a circuit diagram and include the following: Battery, single pole single throw switch, light bulb.
2 Connect a circuit with all the components except the pencils and observe. Write your observations.
3 Take all the pencils and cut out the wood on one side until you can touch the graphite.
4 Draw 3 separate circuits including each type of pencil and predict what you will observe. Record your observations.
5 Connect all three circuits, one at a time. Observe and record your observations.
6 Remove the pencils and replace them with the remaining materials, one at a time. Observe and record your findings.
7 Use the above measurements to draw your conclusion.
A note on the meaning of “conductivity”
The term “conductivity” is used loosely in the CAPS, in the sense of “which materials are the best conductors?”. The technical meaning of conductivity is based on the definition of resistivity which we mentioned in this chapter in the learners’ book, Unit 14.1.
Equipment you need, per group
• wood wax pencil
• HB wood pencil
• 2H wood pencil
• a piece of nichrome wire
• copper wire
• aluminium
• glass
• plastic
• paper
• 2 × 1,5 V cells
• connecting conductors
• single pole single throw switch
• a digital multimeter (calibrated in the ohm scale range)
• light bulb
Chapter 14 Resistance and factors that change it
168
Conductivity is the reciprocal of resistivity – high conductivity means low resistivity and vice versa. Mathematically, the definitions are:
resistivity = resistance cross-section area
length×
(The units are ohms.metres.)
Conductivity is the reciprocal of resistivity, so:
conductivity = 1R
× length
cross-section area
(The units are siemens per metre or siemens per centimetre.)
The conductivity of a material is the measure of how well the material conducts electric current, without regard to the shape or size of the piece of material.
It’s necessary to define conductivity like this because a thick piece of material (e.g. pencil graphite) will conduct more electric current than a thin piece of the same length, and a short piece will conduct more current than a long piece, for the same p.d. across the pieces. Conductivity is an intrinsic property of the material – it does not matter how big the piece of material is, its conductivity is the same. (Density is another example of an intrinsic property – a material’s density is constant, no matter the size of the piece of material.)
In Chapter 10, Unit 10.2, there is an activity to compare the conductivity of tap water and various solutions. The headings are How we measure conductivity and Ions in water: Conductivity testing in industry.
The conductivity of water is an important factor in many industrial processes. For example, the water in ESKOM power-station boilers must be kept as pure as possible, because dissolved substances would soon form clogging deposits inside the hundreds of tubes in a boiler. For this reason, the conductivity of the water is measured (in siemens per centimetre) and monitored all the time.
Challenges and projects (LB page 334)
Project 1: Make a graphite resistor from a pencil
Making a resistor from pencil graphite is an interesting activity and you can easily extend it. Ask the learners to draw a broad pencil line on a piece of cardboard, adding as much graphite from their pencil as they can. Using the multimeter set to the ohms scale, they can read the resistance of the pencil line. Now, with an eraser, they can make the thick pencil line narrower at one point. They will find that the resistance increases when they make the line narrower. This is like using thinner nichrome wire in the circuit in Experiment 12B.

Chapter 14 Resistance and factors that change it
169
Project 2: Is the resistance of a bulb always the same?
In this project the learners will find that a bulb is a non-ohmic resistor. In other words, Ohm’s law applies only while the filament is fairly cold, but not when it gets hot. The graph of voltage vs current is not a straight line but it curves upwards.
Chapter 15 Series and parallel circuits
170
Chapter 15 Series and parallel circuits Learners’ conceptual difficulties with electric circuits 170 Discussion of the problem circuit in the Teacher’s Guide, Chapter 13 172 Experiment 13: Measure the voltage across each resistor in series 174 Unit 15.1 Resistors in series 174 Unit 15.2 Resistors in parallel 176 A note on language use and misconceptions about current dividers 176 Challenges and projects 178 Experiment 14: Formal assessment task 180
Learners’ conceptual difficulties with electric circuits
Learners in countries around the world develop some common misconceptions about electric circuits and you will probably find that some of your learners hold some of these misconceptions. Many of these misconceptions can be minimised if we focus on the potential difference across components in a circuit, instead of the current through the components. This approach to the topic is called the energy-priority approach.
The essential idea in the energy-priority approach is this: a potential difference across a resistor causes a current in the resistor, and it’s not the current that causes the potential difference.
1 The misconception that “the cell is like a water-tank”
Many learners think of a circuit as a tank of water with a tap and hose-pipes. When you open the tap, water flows into the empty hosepipe, and after a short time you see water coming out of the open end. In the same way, these learners think that when you close the switch, current comes from the cell into empty conductors and fills them up, and after a short time the current reaches the bulb. These learners can now reason, from this misconception, that when the cell goes “dead” or “flat”, it means that the cell has poured out all its current.
A scientific view is that the conductors are not empty – each conductor, all around the circuit, has atoms with electrons, which can flow along the conductor. However, the electrons do not flow until the circuit is closed. Then the cell causes an electric force, which pulls the charges along the conductors. As soon as you press the switch, all the charges “feel” the pull of the cell, and they all start to flow at the same time. The cell does not “run empty” because for each charge that leaves the cell, another charge comes into the cell at the other terminal.
However, the reaction of the chemicals in the cell will slow down and then stop when most of the reacting chemicals have been changed into reaction products. As the reaction slows, it can no longer produce the electrons that cause the potential difference across the terminals of the cell. Then we say that the cell is “dead” or “flat”.
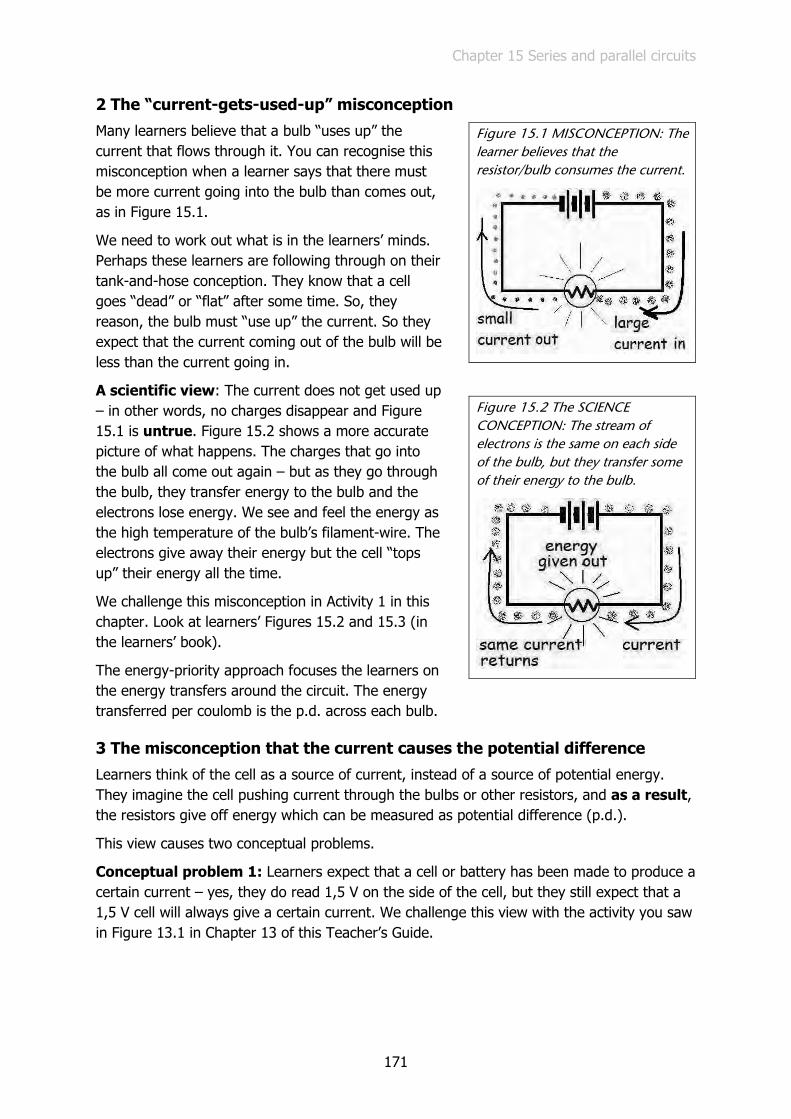
Chapter 15 Series and parallel circuits
171
2 The “current-gets-used-up” misconception
Many learners believe that a bulb “uses up” the current that flows through it. You can recognise this misconception when a learner says that there must be more current going into the bulb than comes out, as in Figure 15.1.
We need to work out what is in the learners’ minds. Perhaps these learners are following through on their tank-and-hose conception. They know that a cell goes “dead” or “flat” after some time. So, they reason, the bulb must “use up” the current. So they expect that the current coming out of the bulb will be less than the current going in.
A scientific view: The current does not get used up – in other words, no charges disappear and Figure 15.1 is untrue. Figure 15.2 shows a more accurate picture of what happens. The charges that go into the bulb all come out again – but as they go through the bulb, they transfer energy to the bulb and the electrons lose energy. We see and feel the energy as the high temperature of the bulb’s filament-wire. The electrons give away their energy but the cell “tops up” their energy all the time.
We challenge this misconception in Activity 1 in this chapter. Look at learners’ Figures 15.2 and 15.3 (in the learners’ book).
The energy-priority approach focuses the learners on the energy transfers around the circuit. The energy transferred per coulomb is the p.d. across each bulb.
3 The misconception that the current causes the potential difference
Learners think of the cell as a source of current, instead of a source of potential energy. They imagine the cell pushing current through the bulbs or other resistors, and as a result, the resistors give off energy which can be measured as potential difference (p.d.).
This view causes two conceptual problems.
Conceptual problem 1: Learners expect that a cell or battery has been made to produce a certain current – yes, they do read 1,5 V on the side of the cell, but they still expect that a 1,5 V cell will always give a certain current. We challenge this view with the activity you saw in Figure 13.1 in Chapter 13 of this Teacher’s Guide.
Figure 15.1 MISCONCEPTION: The learner believes that the resistor/bulb consumes the current.
Figure 15.2 The SCIENCE CONCEPTION: The stream of electrons is the same on each side of the bulb, but they transfer some of their energy to the bulb.

Chapter 15 Series and parallel circuits
172
The scientific view: A cell/battery is made to give a certain emf (i.e. the voltage when the resistance in the external circuit is infinitely high). It will produce a current in a circuit, but how big the current is depends on how high the resistance is. So the same cell can produce big and very small currents – it all depends on the resistance.
(Of course as the external resistance in the circuit goes down to zero, a small 1,5 V cell can’t produce as much current as a physically large 1,5 V cell. This is because the small cell has smaller surfaces for the chemical reactions to take place, compared to the big cell.)
Conceptual problem 2: If learners think first about the currents in a circuit, they may then think that if there is no current in a part of the circuit, there is no p.d. across that part. Their reasoning goes: the formula for p.d. is V = RI. So, they reason, if I = 0, then V = 0.
The scientific view: Mathematically their reasoning is correct, but science is not just a matter of choosing the right formula. Learners need conceptual and physical understanding too. If there is a break in a circuit, the full emf of the battery appears across the ends of the break! Though the current is zero, the p.d. is definitely not zero. With high-voltage power circuits, these learners could have a fatal misconception.
Discussion of the problem circuit in the Teacher’s Guide, Chapter 13
In Chapter 13 there was a problem taken from some research. It was based on the circuit you see here in Figure 15.3, and the problem appears simple.
The cell E has no internal resistance and both bulbs M and N are glowing. Now you remove bulb N from its socket. (The circuit now looks like Figure 15.4 on the next page.) Which of these happens?
a) Bulb M glows brighter. b) The potential difference (p.d.) across X and Y goes to
zero. c) The p.d. between X and Y stays the same. d) The p.d. between X and Y decreases.
The question comes from research done with groups of top Grade 10 to 12 students and twelve teachers with a B.Sc. degree.
Of the students, 35% chose (a), 35% chose (b), 24% chose (c) and 6% chose (d).
Of the teachers, 2% chose (a), 10% chose (b), 47% chose (c) and 22% chose (d).
The reference is: Potential difference and current in simple electric circuits: A study of students’ concepts; R. Cohen, B. Eylon, and U. Ganiel; American Journal of Physics 51, 407 (1983). (View online: http://dx.doi.org/10.1119/1.13226)
Figure 15.3

Chapter 15 Series and parallel circuits
173
Let’s look first at the students’ responses.
One-third of the class chose (a) Bulb M glows brighter, which is correct. Removing N increases the resistance in the parallel part of the circuit, and this means that more of the emf E appears across bulb M and less across R. However, about the same number chose (b). We don’t know their reasoning, but it’s likely that they reasoned that V = RI and since there is no current, I = 0 and so V = 0.
Now let’s look at the teachers’ responses. The majority of the teachers chose (c) The p.d. between X and Y stays the same. Perhaps their reasoning was that if you put back the bulb N in the gap, it would light up, showing that there is still a p.d. across the gap, to make the current flow.
There will certainly be a p.d. across XY but is it the same as before? They are focusing only on the gap at N. They are not thinking about the circuit as a system; the change at N caused changes all around the circuit. The increase in resistance when N was removed meant that the overall current dropped but more of the available voltage E appeared across the bulb M and less across R. So the p.d. across M increased and so M was brighter. The p.d. across M is the same as the p.d. across XY, so the p.d. across XY increased. It did not stay the same and it did not go to zero either.
(You can satisfy yourself about bulb M practically or you can put in some values and calculate the power output of bulb M before and after removing N. For example, let E = 10 V, R = 75 Ω, and let the resistance of each bulb = 50 Ω.)
Preview the chapter
The purpose of the preview tasks is to develop the learners as good readers who make connections between old and new knowledge. The reason for the preview tasks is explained in more detail in the Teacher’s Guide for Chapter 8.
You might like to use these questions.
1 In the Resource Pages there is a table showing many symbols for components. Find that page now.
2 Unit 15.1 is about series circuits. Find that Unit. "In series" means "one after the other". Why are these circuits called series circuits?
3 Unit 15.2 is about parallel circuits. Find that Unit. In maths you learn about parallel lines; does "parallel" mean something different in electric circuits? What is different in the meanings?
Figure 15.4 This is the circuit with bulb N removed.

Chapter 15 Series and parallel circuits
174
Unit 15.1 Resistors in series (LB page 335)
Activity 1 The current in a series circuit (LB page 335)
This activity has a specific purpose.
Question 1 challenges learners’ idea that the current is reduced as it goes around the circuit. Some learners believe that each bulb uses some of the current, and the first bulb after the battery should be the brightest, and the second bulb should be dimmer because the second bulb gets only the left-over current. (They will find that the bulbs are about equally bright – provided that the bulbs are rated for the same max voltage. Torch bulbs have a plastic bead inside the glass to hold the support wires and the colour of the bead indicates the voltage rating.)
Question 2 pushes this a little further – do they think there is still some current that goes back to the negative terminal of the battery, or did the bulbs use it all?
Question 3 asks them to commit to an idea – don’t skip this step. It makes them put their ideas into words, and realise what they actually think. If they don’t commit to their personal ideas, the next step will not change or confirm their ideas.
Question 4 will be answered by the observation that the bulbs are approximately equally bright.
Question 5 asks them to think about reasons why the bulbs are equally bright.
We are leading up to the understanding that the current is the same all around the circuit – Figure 15.3 in the learners’ book shows how they test this idea.
Question 6 should lead to the observation that the current is the same at all points around the circuit. (The measurements might differ slightly at P, Q, S and T because each new connection may have some small resistance that changes the current.)
Question 7 is going to be answered in the section What have we learned from this activity? But ask the question anyway – the learners' answers might tell you whether they have followed the line of thinking in this activity.
Experiment 13: Measure the voltage across each resistor in series (LB page 337)
1 The real measurements of voltages V1 to V3 will be different from the examples. However, the total voltage across three resistors should add up to the measurement Vtotal across all three bulbs.
Your learners might find that the voltages do not add up exactly to Vtotal. The reason is that each time they connect the voltmeter, they might move the bulb connectors and create some small resistance at that point; each such small resistance has a small p.d. across it that affects the voltmeter reading.
Chapter 15 Series and parallel circuits
175
2 Some energy is wasted inside the battery. In this example, the wasted energy per coulomb is 0,3 volts.
3 This answer depends on the length of the nichrome wire and the rating of the bulbs. 4 The voltage across the two bulbs will be different to the previous readings, because the
voltage is split across the three series resistors (i.e. across the nichrome and the two bulbs).
5 However, Vtotal will still be the sum of V1 + V2 + V3
Activity 2 Make a voltage divider (LB page 338)
Make sure that the learners draw the blank table in their notebooks before you begin the demonstration, or before they start their group work.
1 Wire section XY is 30 cm long and YZ is 60 cm long.
2 The learners must make a prediction, using their previous knowledge. Don’t skip this or rush them – this is a time when they must apply their knowledge. It’s like a workout in their mental gym.
They know from Chapter 14 that the resistance of a wire depends on its length. They can reason that if you double the length, you double the resistance. Therefore the 60 cm length should have twice the resistance of the 30 cm length.
3 Their predictions may or may not be correct. Learners may benefit more from finding out why their prediction was wrong than if they guess correctly or follow hints from you. A
good prediction is that the 4,2 volts will split in the ratio 3090
and 6090
.
So V1 will be 3090
× 4,2 volts and V2 will be 6090
× 4,2 volts. These two voltages should
add up to 4,2 volts.
4 The longer piece gets the bigger voltage. The reason is that the longer piece has greater resistance.
5 Piece XY gets 13
and piece YZ gets 23
of the battery voltage. (In correct English, we’d
say that 13
of the battery voltage appears across XY and 23
appears across YZ.)
6 The total resistance in series is 1 Ω + 2 Ω + 3 Ω, or 6 Ω. So R1 is 16
of the total
resistance, R2 is 26
and R3 is 36
.
Therefore the total voltage Vtotal will be divided in the ratio (beginning on the right at R1): 16
× Vtotal; 26
× Vtotal and 36
× Vtotal
If the learners choose Vtotal to be 4,2 volts, then V1 = 0,7 volts, V2 = 1,4 volts and V3 = 2,1 volts. These three voltages must add up to 4,2 volts.
You can set them the task of doing the calculation again, using Vtotal = 12 volts.

Chapter 15 Series and parallel circuits
176
Unit 15.1 Summary activity (LB page 340)
1 The current is not used up in the resistors but the current transfers energy to the resistors.
2 The battery voltage divides in the same ratio as the resistor’s resistances. The resistor with the highest resistance has the most voltage across it.
3 We measured the current at four points around the circuit.
Unit 15.2 Resistors in parallel (LB page 340)
Activity 3 Connect resistors in parallel (LB page 341)
1 All the current goes through the indicator bulb, while 13
of that current goes through
each of the other bulbs. So we expect that the indicator bulb will be brighter. (Alternatively, one can reason that the resistance across the three bulbs in parallel is less than the resistance across the indicator bulb, and so the indicator bulb will get much more of the battery voltage. However, they don’t yet know that the resistance of the parallel bulbs is lower than a single bulb.)
2 The purpose of this question is to alert the learners to the observation that the indicator bulb is brighter in Figure 15.10 in the learners’ book. (The reason is that the overall resistance in the circuit is lower, but we’re coming to that in this Activity 3.)
3 The total current from the battery increases as you add resistors in parallel.
4 The indicator bulb RT will become brighter.
5 The overall resistance in the circuit is decreasing as you add more resistors in parallel.
A note on language use and misconceptions about current dividers
While this textbook was being written, there was time for only one trial in a technical high school. However, we did get some useful information from trialling a task similar to this Activity 3.
Among other things, we found that learners had a misconception arising from the term current divider. It's a tradition (seen also in the new CAPS for Technical Science) to refer to parallel circuits as "current dividers". However, each extra bulb in parallel allows more current to flow from the battery, so it would be more accurate to describe a parallel circuit as a "current multiplier".
Chapter 15 Series and parallel circuits
177
Learner F3 predicted that each extra bulb she added in parallel would be dimmer because she was making a parallel circuit and parallel circuits are “current dividers”. She explained her reasoning as follows:
Since all the bulbs are the same type and have the same rating, R2 will be dimmer as R2 is in parallel with R1 and parallel circuits are current dividers. (Learner F3, 19-06-2015)
Science curriculum development must take account of language issues such as the use of "current divider" and, where possible, give preference to learner-friendly language over traditional terminology. When learners are well-grounded in the concepts, then it’s time to introduce the traditional terms.
In South Africa, teachers see language as a barrier to students' success in science. We have to remember that the barrier is often not in the gap between English and mother-tongue, but in the way English is used in textbooks and classroom talk. The term "current divider" can confuse English mother-tongue speakers as much as speakers of other mother-tongues.
Activity 4 Currents in parallel branches w ith differing resistance (LB page 343)
1 The top branch has only one resistor/bulb, and the bottom branch has two resistors. 2 The learners can assume that the bulbs are all the same rating, and so they will have the
same resistance. So the bottom branch will have more resistance and therefore it will have a smaller current.
3 This is harder for the learners to work out. A good answer would be that the battery is connected to both the branches, using good conductors, and so the battery will “see” only those two connections.
4 With a voltmeter, they will find that the voltage across the top branch is the same as the voltage across the bottom branch. With an ammeter, they will find that the current in the top branch is about twice as big as the current in the bottom branch. The reasoning we’d expect from the learners is that the top branch has only half the resistance of the bottom branch.
Quick Activity (w ith 3 resistors in parallel) (LB page 346)
eff
1R =
1 1 110 12 15
+ +
= 12 10 8
120+ +
So, Reff = 4 Ω
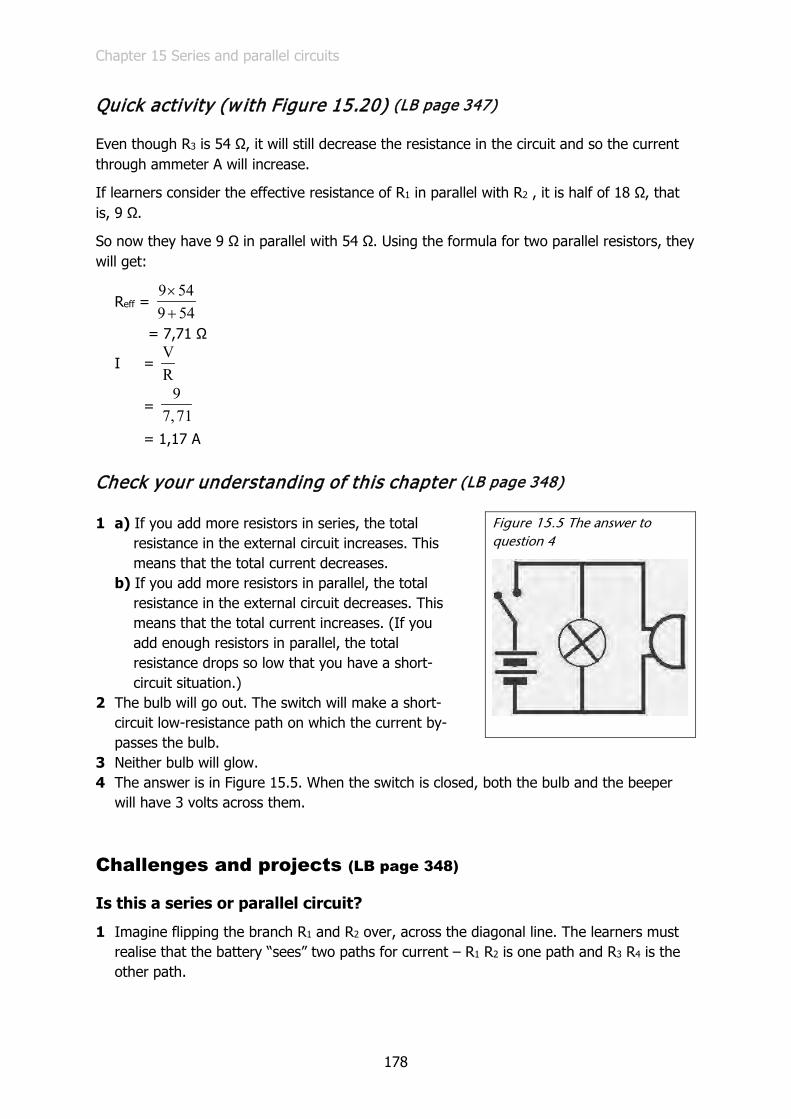
Chapter 15 Series and parallel circuits
178
Quick activity (w ith Figure 15.20) (LB page 347)
Even though R3 is 54 Ω, it will still decrease the resistance in the circuit and so the current through ammeter A will increase.
If learners consider the effective resistance of R1 in parallel with R2 , it is half of 18 Ω, that is, 9 Ω.
So now they have 9 Ω in parallel with 54 Ω. Using the formula for two parallel resistors, they will get:
Reff = 9 549 54×+
= 7,71 Ω
I = VR
= 9
7,71
= 1,17 A
Check your understanding of this chapter (LB page 348)
1 a) If you add more resistors in series, the total resistance in the external circuit increases. This means that the total current decreases.
b) If you add more resistors in parallel, the total resistance in the external circuit decreases. This means that the total current increases. (If you add enough resistors in parallel, the total resistance drops so low that you have a short-circuit situation.)
2 The bulb will go out. The switch will make a short-circuit low-resistance path on which the current by-passes the bulb.
3 Neither bulb will glow. 4 The answer is in Figure 15.5. When the switch is closed, both the bulb and the beeper
will have 3 volts across them.
Challenges and projects (LB page 348)
Is this a series or parallel circuit?
1 Imagine flipping the branch R1 and R2 over, across the diagonal line. The learners must realise that the battery “sees” two paths for current – R1 R2 is one path and R3 R4 is the other path.
Figure 15.5 The answer to question 4

Chapter 15 Series and parallel circuits
179
2 In the top branch, the combined series resistance is 1 ohm + 2 ohms = 3 ohms. In the bottom branch, the combined series resistance is 3 ohms + 4 ohms = 7 ohms. Using the formula for two resistors in parallel, the effective resistance that the battery “sees” is 2,1 ohms.
3 I = VR
, so I = 1,5 volts2,1 ohms , which is 0,71 ampere.
Two ways to work out the voltage splits in a series circuit
1 a) Learners can calculate the current in the circuit by first calculating the total series resistance: RT = 4 + 8 +12 = 24 ohms
I = VR
= 1224
= 0,5 ampere
Using this value, and knowing that V = RI, they can work out that: V1 = 4 × 0,5 = 2 volts By the same method, they can calculate V2 = 4 volts and V3 = 6 volts.
b) The other way to calculate the voltages is to look at the ratio of the resistances. So the total voltage, 12 volts, will split in the ratio: 424
; 824
; 1224
V1 is then 424
× 12 which is 2 volts, and so on.
For a voltmeter, why do all points along a good conductor look like the same point?
From these questions the learners should understand that a voltmeter will show no change in reading between any two points that are connected by conducting material with near-zero resistance. The reason is that the voltmeter shows the quantity of energy each coulomb of charge transfers to a part of the circuit. If the material is a good conductor then very little energy is transferred by the charges and the p.d. is approximately zero.
The textbook emphasises this point in Chapter 13, Activity 4, Question 3.
We see the application of the idea when learners must make sense of a parallel circuit. Figure 15.6 shows a circuit they work with in this chapter. The current through the top branch is greater than the current through the bottom branch, but the p.d. across the branches is the same.
The p.d. across W and S is the same as the p.d. across Z and S. Learners sometimes find this hard to understand, but it helps them if they realise that points P, Q, X, W, Y and Z are all at the same potential.
Figure 15.6

Chapter 15 Series and parallel circuits
180
Formal assessment – CAPS Experiment 14
The CAPS prescription is that the student must be assessed on his/her ability to assemble a circuit to show that a parallel circuit is a current divider while potential difference remains constant.
Formal assessment calls for written evidence that results from practical work. This formal assessment is a step-wise collection of evidence that includes immediate formative assessment to the student.
The practical task of assembling a circuit comes after 3 written stages that seek learners' understanding of the circuit through qualitative questions. (The questions don't ask for calculations because this is a better way of finding how much they understand. To put it crudely, the questions cannot be answered by "getting lucky with a calculator".)
However, learners probably cannot do well unless they have previously built parallel circuits and explored the voltage and current relationships. So, the assessment task sets up a demand for learner practical work before the test.
Administration matters
One issue you have to deal with is the number of kits available for individual students to set up and take measurements on.
Bulbs must be identical or matched sets. Use bulbs rated for 2,4 V rather than those rated for 4,5 V or 6 V, because 2,4 V rated bulbs are brighter.
Use a continuity tester to check that all bulbs are in working order.
Check that cells are all good, especially if you are using AA cells, because AA cells are less able to produce the greater current needed as more bulbs are added in parallel.
Check the ammeters. In the trial, we found one multimeter that had high internal resistance on the 200 mA scale and when it was connected in series with a bulb, the bulb went out. An ammeter works correctly when it does not affect the current it is measuring.
The students will need an average of 20 minutes each to set up and take measurements and then take the kit apart for the next student to work on. In the meantime, the other students can be working on the written parts of the task.
Consider using one room for the practical work with a colleague as invigilator, and letting the students start the written work in batches. In that way, only a few students at a time will complete the written work and move on to the room with the apparatus. So the real time you'll need for Stage 4 is (20 minutes × number of learners) divided by the number of kits you have.
In the last resort, where you just can't get enough apparatus, at Stage 4 you can let one student or one group set up the apparatus and take measurements, and record the measurements for the whole class to see. While the rest of the class will not physically set up the circuit, they will at least be interpreting real data from a real circuit.
The next FOUR pages are for photocopying for your learners.

Chapter 15 Series and parallel circuits
181
Electricity – Formal assessment task
Your name: Date:
__________________________________________________________________________________
Stage 1
You must draw a parallel circuit showing 3 bulbs connected in parallel. The ammeter A will measure the total current. The bulb RT will be dim or bright to indicate the total current. The symbol RT stands for RTotal.
Remember that bulbs are resistors.
Look at the diagram below and complete it as follows:
1 Label the battery "emf = 4,5 volt" and draw another bulb, R1 in the diagram, to complete the circuit. R1 must be in series with the battery, bulb RT and the ammeter. [2]
2 Draw two more bulbs, R2 and R3, connected in parallel with each other and in parallel with R1. [2]
3 Draw a switch in your diagram, which will switch off all three bulbs at the same time. [1]
Figure 1
Hand in your answers and collect the next question.
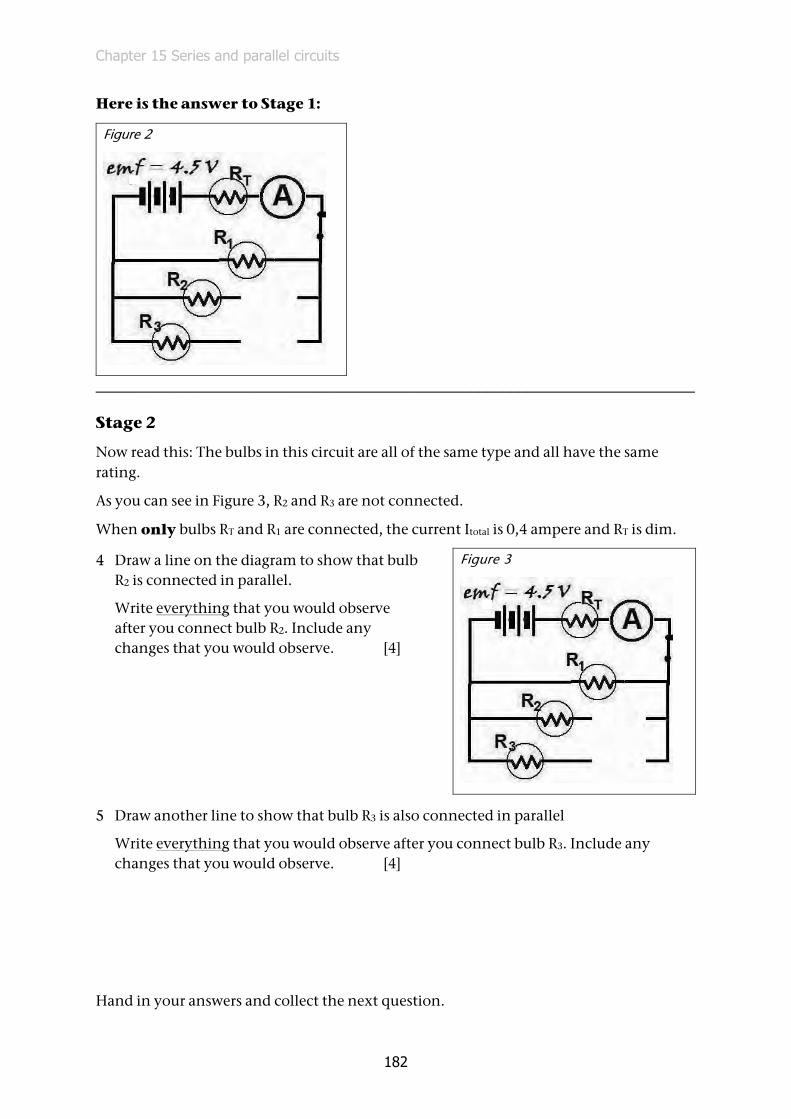
Chapter 15 Series and parallel circuits
182
Here is the answer to Stage 1:
Figure 2
___________________________________________________________________________
Stage 2
Now read this: The bulbs in this circuit are all of the same type and all have the same rating.
As you can see in Figure 3, R2 and R3 are not connected.
When only bulbs RT and R1 are connected, the current Itotal is 0,4 ampere and RT is dim.
4 Draw a line on the diagram to show that bulb R2 is connected in parallel.
Write everything that you would observe after you connect bulb R2. Include any changes that you would observe. [4]
5 Draw another line to show that bulb R3 is also connected in parallel
Write everything that you would observe after you connect bulb R3. Include any changes that you would observe. [4]
Hand in your answers and collect the next question.
Figure 3
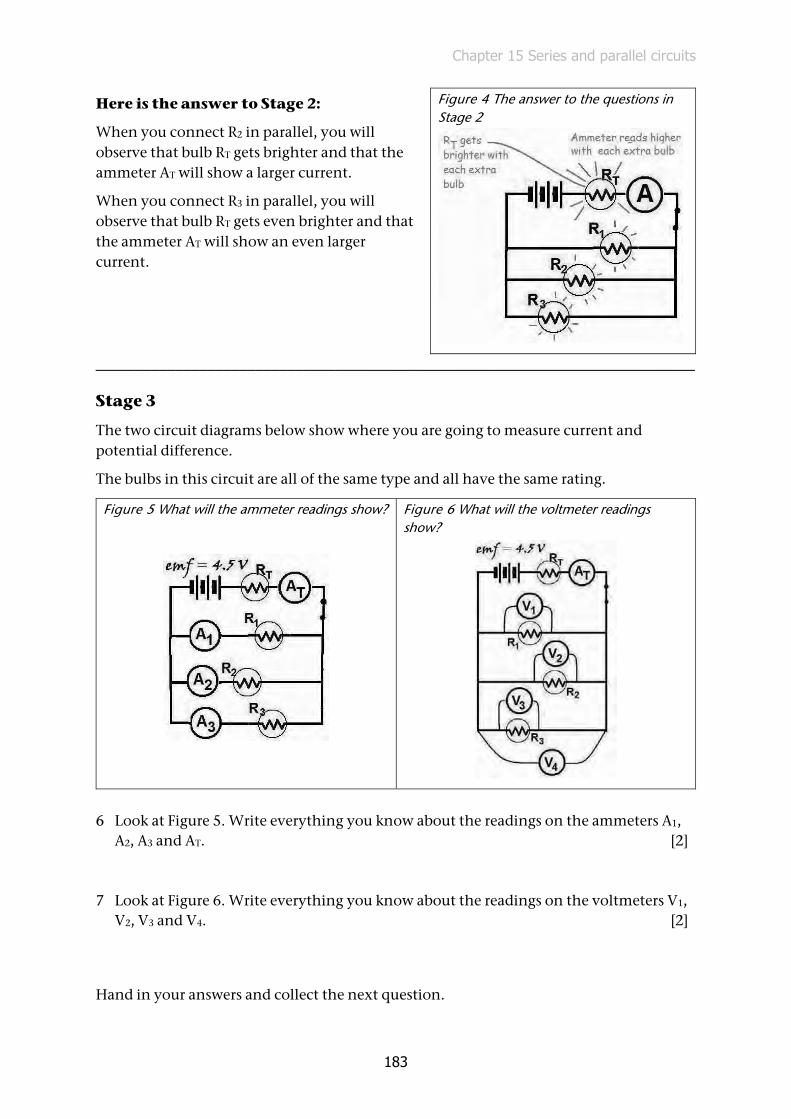
Chapter 15 Series and parallel circuits
183
Here is the answer to Stage 2:
When you connect R2 in parallel, you will observe that bulb RT gets brighter and that the ammeter AT will show a larger current.
When you connect R3 in parallel, you will observe that bulb RT gets even brighter and that the ammeter AT will show an even larger current.
___________________________________________________________________________
Stage 3
The two circuit diagrams below show where you are going to measure current and potential difference.
The bulbs in this circuit are all of the same type and all have the same rating.
Figure 5 What will the ammeter readings show?
Figure 6 What will the voltmeter readings show?
6 Look at Figure 5. Write everything you know about the readings on the ammeters A1,
A2, A3 and AT. [2] 7 Look at Figure 6. Write everything you know about the readings on the voltmeters V1,
V2, V3 and V4. [2]
Hand in your answers and collect the next question.
Figure 4 The answer to the questions in Stage 2
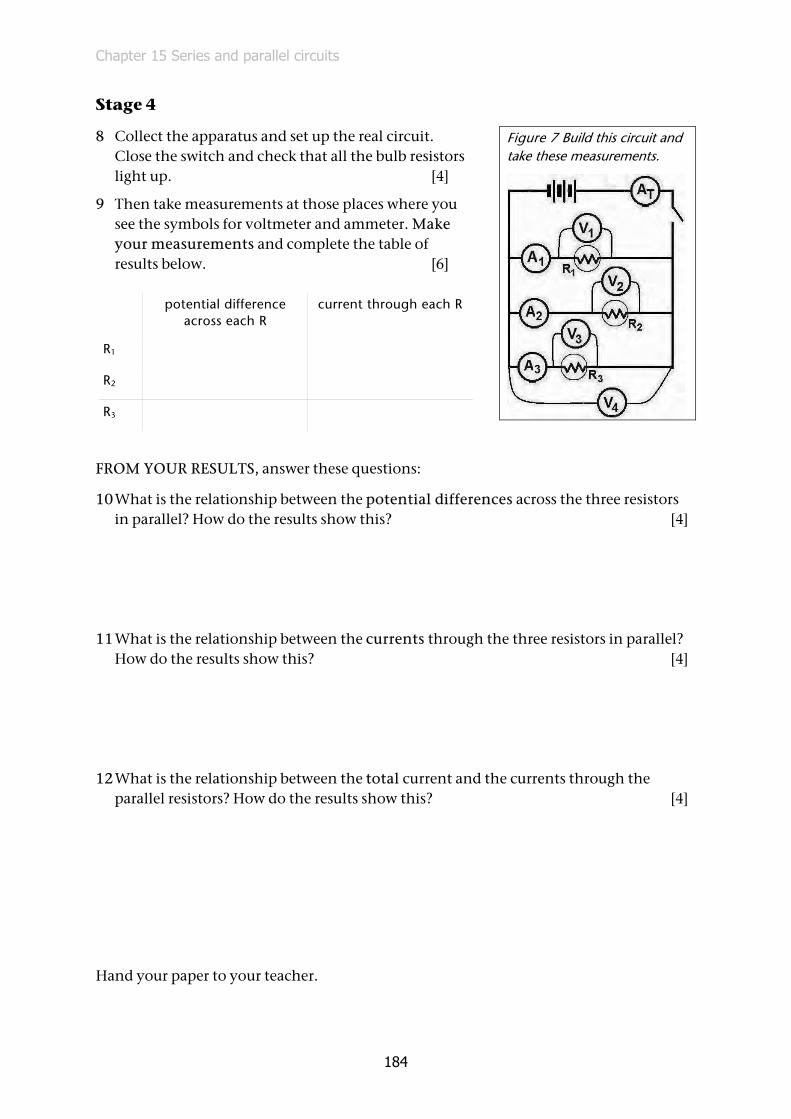
Chapter 15 Series and parallel circuits
184
Stage 4
8 Collect the apparatus and set up the real circuit. Close the switch and check that all the bulb resistors light up. [4]
9 Then take measurements at those places where you see the symbols for voltmeter and ammeter. Make your measurements and complete the table of results below. [6]
potential difference across each R
current through each R
R1
R2
R3
FROM YOUR RESULTS, answer these questions:
10 What is the relationship between the potential differences across the three resistors in parallel? How do the results show this? [4]
11 What is the relationship between the currents through the three resistors in parallel?
How do the results show this? [4] 12 What is the relationship between the total current and the currents through the
parallel resistors? How do the results show this? [4] Hand your paper to your teacher.
Figure 7 Build this circuit and take these measurements.

Chapter 15 Series and parallel circuits
185
Assessment rubric/mark memo
Stage 1
Q1: Battery labelled series circuit is drawn correctly Q2: Two bulbs in parallel labelled Q3: Switch is drawn anywhere in the series part of the circuit but not on one of the parallel
branches Stage 2
Q4: Answer just states the obvious, e.g. current will flow through R2 also States that bulb RT will become brighter
Ammeter reading A will increase from 0,4 A to a higher reading Answer includes observation that bulbs R1 and R2 will be equally bright
but not as bright as RT [max = 4] Q5: Answer just states the obvious, e.g. current will flow through R3 also RT will become even brighter reading A will increase further
Bulbs R1, R2 and R3 will be equally bright but not as bright as bulb RT [max = 4] Stage 3
Q6: Ammeters A1, A2 and A3 will show approximately the same reading but ammeter AT will show the sum (or total) of the readings on ammeters A1, A2 and A3
Q7: The readings on V1 to V3 are equal. and V4 shows the same reading
Stage 4
Q8: Teacher has to confirm that the bulbs are in parallel, controlled by one switch and that they all light up
Q9: Learner completes the table:
potential difference across each R current through each R
R1 Learner records measurements V1 toV3 across R1 to R3 that are similar, to within
0,25 V (Give no mark for answers that show exactly the same p.d. across each resistor; it is very
unlikely that the learner actually got that measurement.)
Learner records measurements A1 to A3 that are similar, to within 0,25 A
(Give no mark for answers that show exactly the same current through each resistor; it is
very unlikely that the learner actually got that measurement.)
R2
R3
Q10: The p.d. are almost the same Learner refers to results in table, comments on fact that they are not exactly the same but nearly so Learner notes that in theory they should be the same if the resistors are identical [max = 4]

Chapter 15 Series and parallel circuits
186
Q11: The currents through the resistors are almost the same Learner refers to results in table, comments on fact that they are not exactly the same but nearly so Learner notes that in theory they should be the same if the resistors are identical [max = 4]
Q12: The total current measured at AT is the same as the sum of the three currents through R1 to R3 Learner refers to measurements in table and does the addition of the readings A1+A2+A3 and compares the sum to the reading AT [max = 4]
Chapter 16 Heat and temperature
187
Chapter 16 Heat and temperature
Unit 16.1 Temperature 187 Unit 16.2 Heat is energy in transfer 189 Unit 16.3 Heat energy 190 Experiment 15: Measure the temperature at which paraffin wax melts and solidifies 192
Preview the chapter
Here are some questions you could give the learners for homework.
1 In what order do we look at the three types of heat energy transfer in this chapter? 2 What are the different types of thermometers that we study in this chapter? 3 Who gave his name to the temperature scale that begins at ‒273 °C? 4 What is the heading of the section where we calculate the energy required to make a cup
of coffee?
Unit 16.1 Temperature (LB page 352)
Activity 1 Think about temperatures (LB page 352)
1 Body temperature: 37 °C 2 About 45 °C 3 +37 °C 4 The answers should involve testing with a thermometer. 5 a) You will see a colourless liquid that is boiling (bubbling gently) and giving off a vapour
which quickly dissipates. b) −196 °C
6 I would choose an alcohol/ethanol thermometer as its melting point is −114 °C. Mercury’s melting point is −38 °C, so it is solid below −38 °C.
7 The melting point of iron is 1 538 °C and the boiling point is 2 862 °C. Technology students might need to know the melting point of iron with regard to welding, but they have no use for the fact that iron boils at 2 862 °C.
8 Solder melts at about 183 °C and silver solder at about 221 °C. It might be possible to use either solder or silver solder to join the strips, but because the
strips are small, it will be difficult to avoid melting the one joint while making the second joint.
No matter what material you use, you would join the thicker pieces first. The thicker pieces will conduct heat away from the joint faster than thinner pieces, so more heat energy will be needed to reach the melting point of the chosen material.
For all the above reasons, the best solution will be to join the thicker pieces with silver solder first and then join the thinner pieces with solder.

Chapter 16 Heat and temperature
188
Activity 2 K inetic energy of particles (LB page 354)
The average kinetic energies of the particles increase as the metal changes colour from reddish to yellow/white.
The average kinetic energy of the particles in the beaker of ice and water is lowest, then the beaker that seems to be at room temperature, and the average kinetic energy of the particles in the beaker of water that is “steaming” is the highest.
Activity 3 Read the temperatures (LB page 355)
1 53 °C 2 35 °C 3 15 °C 4 104 °C 5 20 °C 6 75 °C 7 25 °C 8 0 °C 9 45 °C 10 66 °C
Activity 4 Interpret temperatures (LB page 358)
1 a) −20 °C b) 0 °C c) 20 °C d) 40 C
2 a) Not a body that is alive – it would be frozen at −20 °C. b) Not an oven – the temperatures are too low. c) Perhaps in a room in a place where there are extremes of temperature. d) Probably the weather in a place that can get very hot and very cold, like Sutherland in
the Western Cape Province or Bethlehem in the Free State Province.
Activity 5 Convert between Celsius and Kelvin scales (LB page 360)
1 a b c d e f °C 0 100 1 538 1 688 −101 −273
K 273 373 1 811 1 961 172 0
2 a b c d e f K 0 15 000 000 273 373 77 310
°C −273 14 999 727 0 100 −196 37
3 It increases by 5 K.
Chapter 16 Heat and temperature
189
Unit 16.1 Summary activity (LB page 360)
1 Joule 2 a) If we want to measure how hot an object is we use a thermometer.
b) In thermodynamics we measure the temperature in K. c) If a nurse takes your temperature and reads 37 degrees on the thermometer, she
should write it down as 37 °C. d) 0 K is the same as −273 °C.
3 a) When we measure the temperature of a substance, we are actually measuring the average kinetic energy of the particles of the substance.
b) The temperature of a fluid (gas or liquid) depends on the kinetic energy of the particles as they move about.
c) The temperature of a solid depends on the kinetic energy of the vibrating particles. 4 All bulb thermometers work on the same principle*:
• The volume of the liquid in the bulb changes as its temperature changes – it increases when temperature increases and decreases when temperature decreases.
• As the volume changes, the liquid is seen moving up or down the scale on the thermometer.
5 The two most common thermoelectric sensors are the thermocouple and the thermistor. 6 a) T = (t + 273) K
b) t = (T − 273) °C 7 a) T = (t + 273) K = -95 +273 = 178 K
b) t = (T − 273) °C = 95 − 273 = −178 °C
Unit 16.2 Heat is energy in transfer (LB page 361)
Quick Activity (LB page 361)
Use this opportunity to re-activate learner knowledge of conduction, convection and radiation gained in the Senior Phase.
Activity 6 Demonstration of conduction, convection and radiation (LB page 361)
The aim of this activity is to allow learners to feel and see the effect of conduction, convection and radiation in one simple practical exercise.
Safety box
• Feel the heat one at a time – only one person may be near the apparatus. • Except when touching the handle, your hands must be at least 5 cm away from the
apparatus. • The handle of a conventional pot will get warm. If the pot boils dry, it will be
dangerous to hold the handle.

Chapter 16 Heat and temperature
190
Activity 7 Your own examples of heat energy transfer (LB page 364)
The objective of this activity is for learners to link their recent experience of conduction, convection and radiation in the classroom to conduction, convection and radiation in their individual daily lives.
Unit 16.2 Summary activity (LB page 364)
1 Heat energy is one of the forms in which energy is transferred. Heat energy is transferred from an object that has a higher temperature to an object that has a lower temperature.
2 False 3 Conduction is the way heat energy is transferred in a solid. The transfer of heat energy
occurs between particles when a rapidly vibrating particle transfers some of its kinetic energy to a neighbouring particle that is vibrating slower. The transfer happens when particles collide with each other. As a result of the collisions, neighbouring particles vibrate faster. In this way, energy is transferred from particle to particle through the solid object.
Convection happens in fluids (liquids and gases). Fluids expand when they are heated, so the particles are further apart and the liquid becomes less dense. Hotter, less dense parts of the fluid start to rise through the surrounding colder, denser fluid. This transfer of energy through the motion of hotter parts of the fluid is called a convection current.
Radiation is the transfer of energy by means of electromagnetic waves. All objects emit radiation, and hotter objects emit more radiation than colder objects. Radiation does not involve particles touching each other. Radiation is the only method of energy transfer that does not rely upon any contact between the heat source and the heated object. So radiation is the way that energy can be transferred through a vacuum or a gas.
Unit 16.3 Heat energy (LB page 365)
Activity 8 How many joules are needed? (LB page 366)
Use the way of thinking and the calculations we did in the worked example to calculate the following:
a) To change 1 g of ice to water, without even changing the temperature, it takes a massive 334 J.
To calculate the energy needed, we make the following assumptions: • A cube of ice is about 4 cm × 3 cm × 3 cm • 1 cm3 of water has a mass of 1 g, and ice will be slightly less (remember that ice
floats on water), but let’s say it is the same. So the energy required to melt one cube of ice in grams = mass of the ice × energy to
melt 1 g Energy required = 4 × 3 × 3 × 334 = 12 024 J
Chapter 16 Heat and temperature
191
b) We make the following assumptions: • We will cook the egg by bringing the egg and water to the boil and then leaving it for
three to four minutes. • We have a light shiny aluminium ½ litre pot, so it does not require much energy to
change its temperature. Let's assume its energy requirement is the same as 100 g of water.
• The egg is mostly water and it weighs 50 g. • We will use 250 ml (or 250 g) of water to cook the egg. • Tap water is at room temperature or 20 °C. • Water boils at 100 °C. • It takes 4,184 J to raise the temperature of 1 g of water by 1 °C.
The temperature change required is 100 − 20 = 80 °C The mass to be heated is 250 + 50 + 100 = 400 g So the energy required to heat the substances = 4,184 × 80 × 400 = 133 888 J Let’s allow for about 50% loss of energy to the environment, so the final figure is
200 000 J
Activity 9 The use and control of heat energy in Technology (LB page 367)
1 • Use air-entraining agents to form tiny air-voids in the concrete that will resist freezing and thawing effects (the most air allowable).
• Use concrete with a low water to cement ratio (the least water allowable). • Use concrete curing blankets or heated enclosures to keep the concrete warm.
2 • Large size aggregates will minimize concrete shrink. • Control joints should be spaced at smaller intervals than cold weather concrete
joints and small amounts of concrete should be poured at a time • Aggregates could be cooled down by spraying some water over the stockpile. • Use ice as part of the water for the concrete mix. • Pump cold water through a system of pipes in the structure.
3 If you use soldering equipment that can transfer more heat than is necessary to heat the object, and if you keep the soldering head/bit in contact with the work for too long:
• The flux might spread to where it is not required and draw the solder with it. • The flux might break down and cause a poor join. • The metal might become discoloured. • If you use soldering equipment that cannot transfer enough heat, the join will fail.
4 • The gas welding process involves joining two pieces of the same type of metal, by melting them and allowing them to fuse together. A filler of a similar metal (usually in the form of a rod) is added to form a molten pool, which cools to form the joint. The working temperature is the temperature of the metal being joined.
• The brazing process takes place at the melting temperature of the brazing rod that is used – much lower than the melting points of the metals being joined. The molten fluid does not fuse with the metals being joined, but adheres very strongly.

Chapter 16 Heat and temperature
192
For enrichment
Someone says, “We measure heat in degrees Celsius with a thermometer!” “That is not true,” says someone else.
We need to be very careful about what we say:
• If we want to measure how hot a thing is, we use a thermometer as the measuring instrument, and we use degrees Celsius (°C) as the unit of measurement.
• If we want to determine the quantity of heat energy required to make something hotter, we use an instrument called a calorimeter to do an investigation and follow that with calculations.
• The unit of measurement of heat energy is the joule (J).
Experiment 15: Measure the temperature at which paraffin wax melts and solidifies (LB page 367)
This experiment is the eleventh of the eleven experiments that will be assessed informally this year. It can be assessed on the basis of the Record of Assessment of Experiment 15: Measure the melting point of wax and the Assessment Rubric for Experiments.
NOTE: A good reference is: http://www.oocities.org/capecanaveral/Hall/1410/lab-C-14.html
NOTE: In Term 2, in the unit on Matter and Materials, we learnt that pure substances can be identified by their melting points. We know, for example, that pure frozen water (ice) melts at 0 °C and that frozen water that contains a salt melts at a lower temperature. So if you test a sample of ice and it melts at −2 °C, you will know that it is not pure water. Our aim in this experiment is not to identify a substance – we already know what it is.
The task
Working in groups of four and using the given apparatus, learners must follow a scientific process to find the melting point of wax.
NOTE: We could simplify the experiment by merely heating wax in a tube, but the melting point is difficult to pinpoint because of the air between bits of unmelted wax.
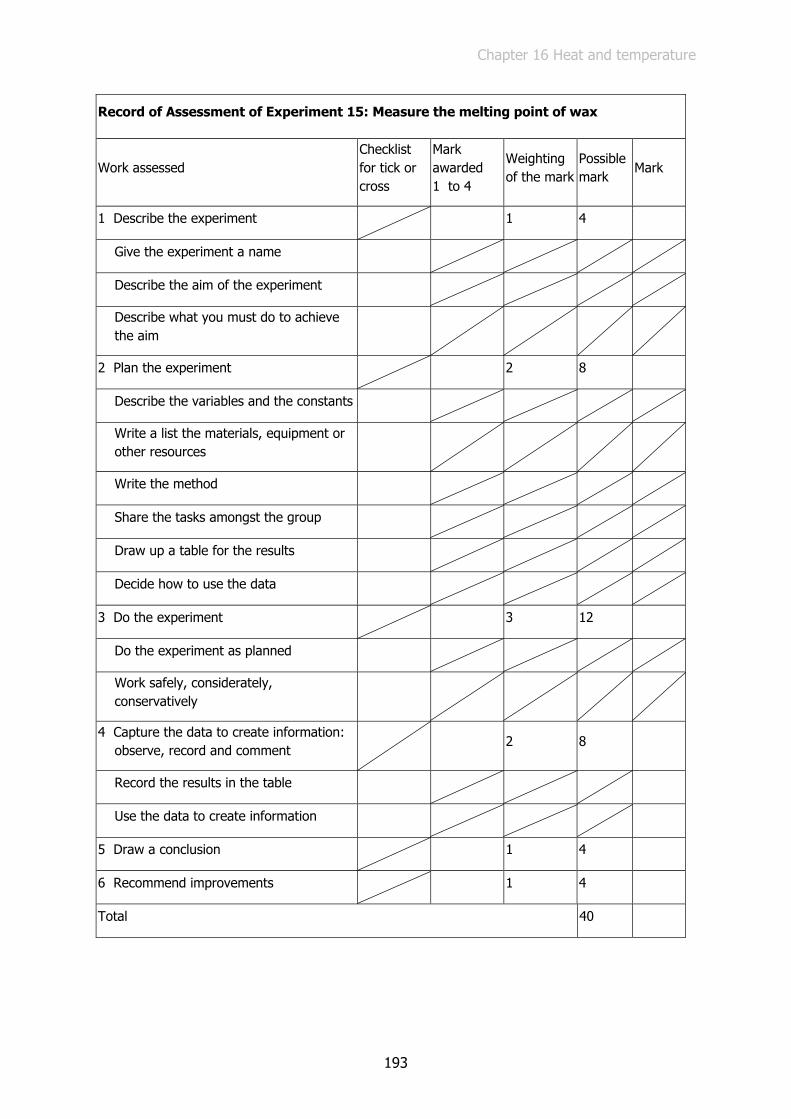
Chapter 16 Heat and temperature
193
Record of Assessment of Experiment 15: Measure the melting point of wax
Work assessed Checklist for tick or cross
Mark awarded 1 to 4
Weighting of the mark
Possible mark
Mark
1 Describe the experiment 1 4
Give the experiment a name
Describe the aim of the experiment
Describe what you must do to achieve the aim
2 Plan the experiment 2 8
Describe the variables and the constants
Write a list the materials, equipment or other resources
Write the method
Share the tasks amongst the group
Draw up a table for the results
Decide how to use the data
3 Do the experiment 3 12
Do the experiment as planned
Work safely, considerately, conservatively
4 Capture the data to create information: observe, record and comment
2 8
Record the results in the table
Use the data to create information
5 Draw a conclusion 1 4
6 Recommend improvements 1 4
Total 40
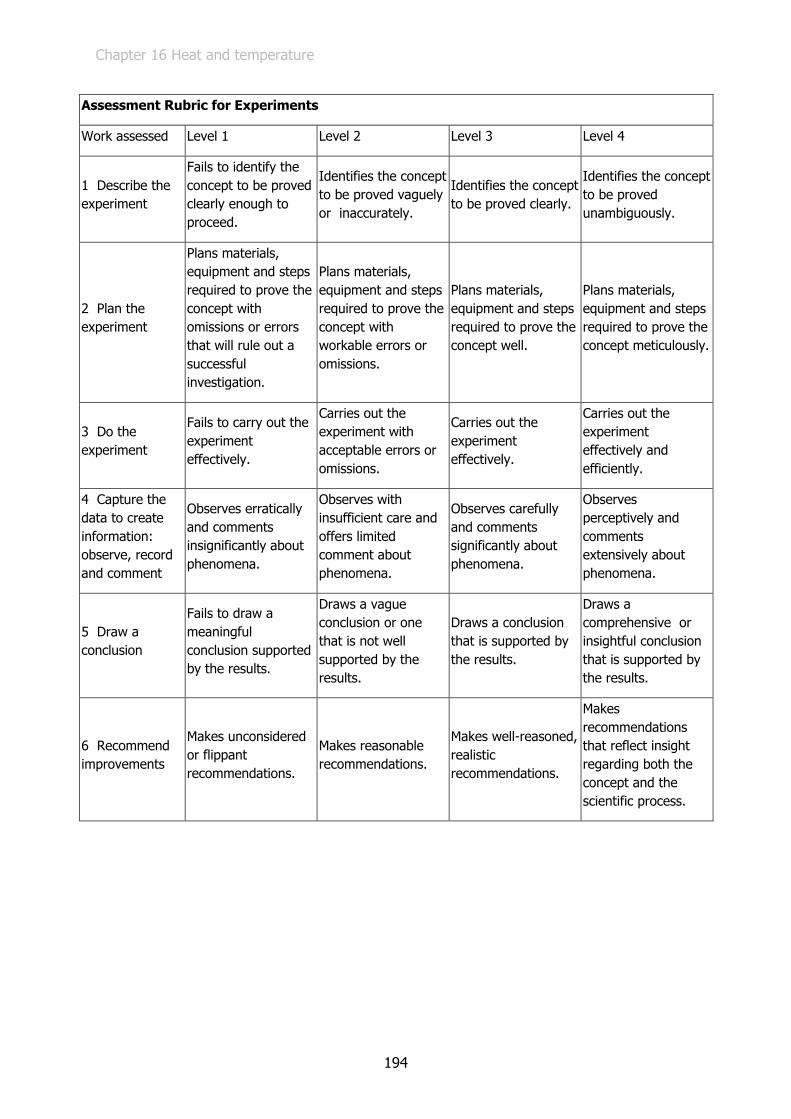
Chapter 16 Heat and temperature
194
Assessment Rubric for Experiments
Work assessed Level 1 Level 2 Level 3 Level 4
1 Describe the experiment
Fails to identify the concept to be proved clearly enough to proceed.
Identifies the concept to be proved vaguely or inaccurately.
Identifies the concept to be proved clearly.
Identifies the concept to be proved unambiguously.
2 Plan the experiment
Plans materials, equipment and steps required to prove the concept with omissions or errors that will rule out a successful investigation.
Plans materials, equipment and steps required to prove the concept with workable errors or omissions.
Plans materials, equipment and steps required to prove the concept well.
Plans materials, equipment and steps required to prove the concept meticulously.
3 Do the experiment
Fails to carry out the experiment effectively.
Carries out the experiment with acceptable errors or omissions.
Carries out the experiment effectively.
Carries out the experiment effectively and efficiently.
4 Capture the data to create information: observe, record and comment
Observes erratically and comments insignificantly about phenomena.
Observes with insufficient care and offers limited comment about phenomena.
Observes carefully and comments significantly about phenomena.
Observes perceptively and comments extensively about phenomena.
5 Draw a conclusion
Fails to draw a meaningful conclusion supported by the results.
Draws a vague conclusion or one that is not well supported by the results.
Draws a conclusion that is supported by the results.
Draws a comprehensive or insightful conclusion that is supported by the results.
6 Recommend improvements
Makes unconsidered or flippant recommendations.
Makes reasonable recommendations.
Makes well-reasoned, realistic recommendations.
Makes recommendations that reflect insight regarding both the concept and the scientific process.