Technical Research - Interplastic Mechanical Properties... · In the Cured-in-Place Pipe (CIPP)...
12
Technical Research A Comparison of Cured-In-Place Pipe (CIPP) Mechanical Properties: Laboratory vs. Field-Manufactured INTERPLASTIC CORPORATION Thermoset Resins Division
Transcript of Technical Research - Interplastic Mechanical Properties... · In the Cured-in-Place Pipe (CIPP)...

Technical Research
A Comparison of Cured-In-Place Pipe (CIPP)
Mechanical Properties: Laboratory vs. Field-Manufactured
INTERPLASTIC CORPORATIONThermoset Resins Division

In the Cured-in-Place Pipe (CIPP) market, themechanical properties of the rehabilitated line areimportant critera for resin selection and the deter-mination of a project’s success. Municipalitiesoften have minimum requirements the CIPP mustmeet (Table 1). Resin suppliers normally reportmechanical properties from laboratory-generatedsamples while the contractor measures resultsfrom field-generated samples. Typically, laboratorysamples give higher physical properties than field-generated samples. This research examined thedifferences in properties between these samples.
INTRODUCTION:
Cured-In-Place Pipe technology has beenemployed worldwide for more than 30 years. It isone of several options available for rehabilitatingand upgrading underground municipal and indus-trial pipe infrastructure. Rehabilitating pipes byusing thermoset polyester resins and polyesterfelt (CIPP) usually requires satisfying predeter-mined specifications for materials and installation.In the United States, these specifications custom-arily follow the standards published by theAmerican Society for Testing and MaterialsInternational (ASTM International). The customer(i.e. municipality engineer, industrial businessengineer, etc.) may also invoke specific materialand/or process requirements such as specialchemical resistance, strength requirements,and/or installation equipment contingencies.
Several issues have arisen over the years in thecorrelation of the properties of laboratory-pro-duced coupons to those of field samples. Thefocus was to determine the major factors influenc-ing the ultimate physical properties, comparethose factors relating to the laboratory and fieldsamples, and then explain why the field sampleshave lower strengths. The ultimate goal was todetermine the parameter(s) that must be con-trolled for laboratory-manufactured samples toduplicate field sample results. This will allow thecreation of more realistic, achievable standardsand give raw material manufacturers a more real-istic composite to test for retention of properties.
The resin/felt composites were constructed byimpregnating 0.24 in. (6 mm), needle-punched,polyester fabric felt with an applicable resin/initiator system. The composites were cured in aclamped mold, incorporating precision spacers,in a time/temperature programmable hot airoven. The composites were subjected to 110°F(43°C) for four hours, followed by 180°F (82°C)for 16 hours, and then cooled to 77°F (25°C)before demolding.
Static flexural physical properties of the panelswere tested according to ASTM D790 and ASTMD638 on an Instron Model 4505 Universal Tester.The coupon thicknesses were measured with aStarrett micrometer. The coupon weights for thespecific gravity measurements were measuredwith a Mettler AE160 scale with an accuracy of0.0002 grams.
The degree of cure was measured with a TA DSC 1000. A sample size of 5 to 15 mil-ligrams was weighed and sealed in the DSC alu-minum sample pan. The samples were scannedfrom 32°F (0°C) to 399°F (200°C) at 18°F (10°C)per minute. The samples were rescanned toensure all the energy was released on the firstscan.
The resin-to-felt ratios were calculated using thefelt manufacturer's theoretical air content perdesigned felt thickness. The average thickness ofthe specimens was used for the flexural and ten-sile static physical properties. The theoretical aircontent is 86.2% for the felt/resin system. Usingthe actual thickness of the felt and the final com-posite thickness determined the percent com-pression of the felt. The reduction in theoreticalair content and ultimate air void space was deter-mined and used to calculate the resin-to-feltratio. We assumed that there is no entrained airin the composite.
The resin system used in this work is a typicalfilled isophthalic resin designed especially forCIPP applications. The isophthalic polymer is atwo-stage, 1:1 isophthalic acid:maleic anhydride,all-propylene glycol that has been commonlyused in corrosion applications.
The panels constructed in the laboratory were
ABSTRACT
INTRODUCTION
EXPERIMENTAL
2

made between two, 1/8-inch (3.2 mm)-thick steelplates. The felt was saturated with the resin system then placed between two pieces of Mylar®
film. All the bubbles were removed from the sur-face and then the panel was placed in a plasticbag. The bag was sealed and placed between thesteel plates. One-quarter inch-thick (6 mm) spacers were placed between the steel plates,and several clamps were positioned around theedges to maintain the thickness during curing.
The thinner laboratory-constructed panels weremade in the same manner, except the spacers were not used and varying amounts ofclamping pressure was used.
RESULTS AND DISCUSSION:
The testing and measurement data collected arecompiled in Tables 2 and 3. The field-generatedsamples are labeled F-1 to F-10. The propertiesof the 10 samples in this study appear tightlygrouped together. This infers that the processesused in the field create similar finished compos-ites and are fairly consistent job-to-job. Theremainder of the analysis is focused on the flexur-al and tensile properties and the factors that influence them.
The laboratory-manufactured samples are labeledL-1 to L-3. These three samples all have signifi-cantly higher flexural strengths than the field-gen-erated samples. The flexural moduli are on thehigh end of the range of the field-manufacturedsamples, but the tensile strengths and tensilemoduli fall within the range of the 10 field sam-ples.
One theory tested was that a lower degree ofcure in the field generated samples would causethe lower physical properties compared to the lab-oratory samples. An X-Y plot of the degree ofcure verses flexural strength is shown in Figure 1.All of the samples, field and laboratory, weregrouped between 95 and 100, which is satisfac-tory and a high level of cure. The points do notshow any signs of having a relationship to eachother.
Similar X-Y plots showing no relationship betweenthe degree of cure and the flexural modulus, ten-sile strength, and tensile modulus data were alsofound. These results correlate with previous workrelating the degree of cure to ultimate static phy-
sical properties. Results showed that specimenshaving a degree of cure over 85% had achievedtheir maximum flexural and tensile properties.
The next theory tested was whether differencesin the percentage of resin in the felt caused thelower field values. This was done by analyzingthe physical property data and the resin content.The resin content had to be calculated becausestandard tests used on composites, such asburnout, would not work. The resin and felt arehydrocarbon-based and have similar flam-mability.
Under ideal controlled conditions, the resin-to-feltratio is 86.2:13.8. When no pressure was put onthe molds in the laboratory samples, the feltachieved full saturation. The laboratory samplesthat were compressed and the field samplesyielded lower resin-to-felt ratios. Cross sectionsof the laboratory and field samples were inspect-ed for voids/entrained air and none was visible.Based on that, the assumption that there wasminimal to no entrained air in the composite wasvalidated
The X-Y plots of the resin ratio compared tophysical properties (flexural strength, flexuralmodulus, tensile strength, and tensile modulus)are shown in Figures 2, 3, 4, and 5 respectively.These plots illustrate that there is no apparentrelationship between the percent resin in thecomposite and its physical properties.
A general observation was made after viewingthe test samples, that the surfaces of the fieldpanels were rough and/or irregular, as well asresin-starved in some cases. Four representativefield samples can be seen in Figure 6. Sample Ais a flat panel; and samples B, C, and D arecurved sections of pipe. The laboratory-manufac-tured samples have a smooth, uniform, andresin-rich surface. Panel A in Figure 7 is a repre-sentative picture.
A new theory was postulated that the poor sur-faces of the field-generated panels were con-tributing to the lower values. This theory wasbased on the knowledge that test panels withflaws on their edges can decrease physical prop-erties. When these flaws cover the whole panel,the decrease in properties may be even morepronounced. Compared to the smooth lab sam-ples, the rough and irregular surface of the field
RESULTS AND DISCUSSION
3

1. The processes used in the field to create thesamples are fairly consistent from job-to-job.
2. The field application of the CIPP process gen-erates a high degree of cure in the composite.
3. The variation found in the degree of cureseen in the samples does not cause any of thedifferences seen in the physical properties of the composite.
4. The tensile properties are not influenced bythe percent of resin in the composite.
5. The tensile properties are not influenced bydifferences in the surface quality.
6. The flexural properties are not influenced bythe percent of resin system in the composite.
7. Surface quality only has a minor effect on theflexural modulus.
8. Surface quality has a major effect on the flexural strength.
This work shows that changes in the surface toreplicate the field samples allows us to moreclosely duplicate in the laboratory the field sam-ples' properties.
1. Evaluate a variety of processes to simulate inthe laboratory the methods that can cause thesurface irregularities in the field.
2. Determine if surface irregularities effect thecorrosion resistance and 10,000 hour creep testing.
The original paper, of the same title, was firstpublished in 2007, by David Herzog, Anthony J.Bennett, Kaleel Rahaim, and Jason D. Schiro, on behalf of Interplastic Corporation. It is avail-able from the American CompositesManufacturing Association (ACMA).
samples creates points where cracks can easilypropagate, causing premature failure.Two other differences wereobserved after inspecting several broken laborato-ry and field specimens - the ultimate bend in thespecimen and the number of visible cracks.
The surface quality theory was tested by roughingthe surface of a laboratory-made panel with acoarse sand paper to create surface flaws. PanelB in Figure 7 is one such panel. The scratchesmade by the sandpaper are more visible in theclose-up photograph on the right.
Views of failed smooth and roughened specimensare shown in Figures 8 and 9. Several thin cracksare seen in the smooth panel and only three thickcracks are seen in the roughened panel. Arrowshave been inserted to point out the cracks thatformed during testing. The lower photograph inFigure 9 shows that six, narrow, visible cracksoccurred during the test in the smooth laboratoryspecimen. The upper photograph in Figure 9shows the roughened laboratory specimen withthree, broader, cracks. Typically the smooth sam-ples had six or more cracks, while the roughenedones had three or four.
Figure 10 contains two side views each of thesmooth and roughened laboratory flexural speci-mens. The smooth laboratory specimen bentmore than 50% further than the roughened speci-men before failure in the three point flexural bend.All of the smooth laboratory samples had a similarlarge bend. Every one of the roughened sampleshad a similar small bend. This difference may beattributed to the resin-rich surface that may beadding some toughness to the surface. The differ-ence could also be related to the numerous sur-face flaws and their contribution to the failure ofthe specimens.
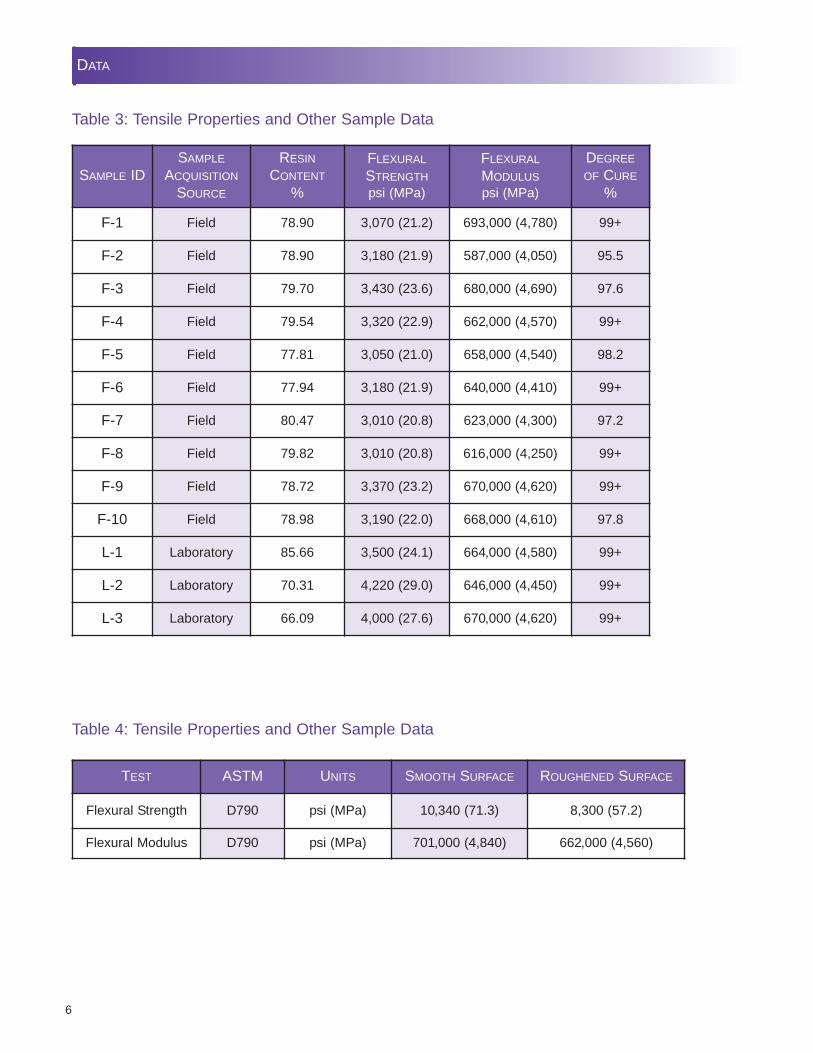
The test results on a smooth and a roughenedpanel are compiled in Table 4 and the analysis ofthe data shows a 20% and 5% drop in the flexuralstrength and modulus respectively. This decreasewas created with only a minor disruption of thesurface. Incorporating a large number and varietyof surface deformations, as seen in the field sam-ples, could cause even lower values. The flexuralstrength and modulus test results on the rough-ened sample are in the top side of the range seenin the field samples presented in Table 2.
CONCLUSIONS
FUTURE RESEARCH
REFERENCE
4

DATA
FLEXURALSTRENGTHpsi (MPa)
FLEXURALMODULUSpsi (MPa)
TENSILESTRENGTHpsi (MPa)
TENSILEMODULUSpsi (MPa)
COMMENTS
ASTM D5813 4,500(31)
250,000(1,720)
2,500(17) NA
If a value is specified,whichever value is greater
is the minimum.
ASTM F1216 and ASTM F1743
4,500(31)
250,000(1,720)
3,000(21) NA Tensile strength requirement
is only for pressure pipes.
Green BookTable 500-1.4.2 (A)
5,000(34)
300,000(2,070)
4,000(28)
250,000(1,720)
Typically, but unofficiallyrequired, is that the static
physical properties be 80%of the coupons' standard for
field-generated samples.
Table 1: Minimum Physical Property Requirements of Cured Resin/Felt Composites
SAMPLE IDSAMPLE
ACQUISITIONSOURCE
RESINCONTENT
%
FLEXURALSTRENGTHpsi (MPa)
FLEXURALMODULUSpsi (MPa)
DEGREEOF CURE
%
F-1 Field 78.90 6,320 (43.6) 563,000 (3,880) 99+
F-2 Field 79.94 7,300 (50.4) 580,000 (4,000) 95.5
F-3 Field 79.70 7,200 (49.7) 532,000 (3,670) 97.6
F-4 Field 79.54 6,140 (42.4) 544,000 (3,750) 99+
F-5 Field 77.81 6,270 (43.3) 571,000 (3,940) 98.2
F-6 Field 77.94 7,170 (49.3) 568,000 (3,920) 99+
F-7 Field 80.47 5,450 (37.6) 517,000 (3,570) 97.2
F-8 Field 79.82 6,910 (47.3) 536,000 (3,700) 99+
F-9 Field 78.72 6,560 (45.3) 555,000 (3,830) 99+
F-10 Field 78.98 6,800 (46.9) 537,000 (3,700) 97.8
L-1 Laboratory 85.66 9,450 (65.2) 703,000 (4,850) 99+
L-2 Laboratory 70.31 7,610 (52.5) 621,000 (3,590) 99+
L-3 Laboratory 66.09 10,290 (70.9) 687,000 (4,280) 99+
Table 2: Flexural Properties and Other Sample Data
5
DATA
SAMPLE IDSAMPLE
ACQUISITIONSOURCE
RESINCONTENT
%
FLEXURALSTRENGTHpsi (MPa)
FLEXURALMODULUSpsi (MPa)
DEGREEOF CURE
%
F-1 Field 78.90 3,070 (21.2) 693,000 (4,780) 99+
F-2 Field 78.90 3,180 (21.9) 587,000 (4,050) 95.5
F-3 Field 79.70 3,430 (23.6) 680,000 (4,690) 97.6
F-4 Field 79.54 3,320 (22.9) 662,000 (4,570) 99+
F-5 Field 77.81 3,050 (21.0) 658,000 (4,540) 98.2
F-6 Field 77.94 3,180 (21.9) 640,000 (4,410) 99+
F-7 Field 80.47 3,010 (20.8) 623,000 (4,300) 97.2
F-8 Field 79.82 3,010 (20.8) 616,000 (4,250) 99+
F-9 Field 78.72 3,370 (23.2) 670,000 (4,620) 99+
F-10 Field 78.98 3,190 (22.0) 668,000 (4,610) 97.8
L-1 Laboratory 85.66 3,500 (24.1) 664,000 (4,580) 99+
L-2 Laboratory 70.31 4,220 (29.0) 646,000 (4,450) 99+
L-3 Laboratory 66.09 4,000 (27.6) 670,000 (4,620) 99+
Table 3: Tensile Properties and Other Sample Data
TEST ASTM UNITS SMOOTH SURFACE ROUGHENED SURFACE
Flexural Strength D790 psi (MPa) 10,340 (71.3) 8,300 (57.2)
Flexural Modulus D790 psi (MPa) 701,000 (4,840) 662,000 (4,560)
Table 4: Tensile Properties and Other Sample Data
6

DATA
3,000/20.7
4,000/27.6
5,000/34.5
6,000/41.4
7,000/48.3
8,000/55.2
9,000/62.1
10,000/69.0
11,000/75.9
95 95.5 96 96.5 97 97.5 98 98.5 99 99.5
Figure 1: X-Y Plot of Degree of Cure vs. Flexural Strength
Key: Field Samples
Flex
ural
Stre
ngth
psi
/MP
a
Laboratory Samples
Figure 2: X-Y Plot of Resin System Content vs. Flexural Strength
3,500/24.1
4,500/31.0
5,500/37.9
6,500/44.8
7,500/51.7
8,500/58.5
9,500/65.5
10,500/72.4
11,500/79.3
60 65 70 75 80 85 90
Flex
ural
Stre
ngth
psi
/MP
a
7
Degree of Cure
Percent Resin
Key: Field SamplesLaboratory Samples

DATA
Figure 3: X-Y Plot of Resin System Content vs. Flexural Modulus
3000,000/2070
350,000/2410
400,000/2760
450,000/3,100
500,000/3,450
550,000/3,790
600,000/4,140
650,000/4,830
700,000/4,830
60 65 70 75 80 85 90
Flex
ural
Stre
ngth
psi
/MP
a
Key: Field SamplesLaboratory Samples
Figure 4: X-Y Plot of Resin System Content vs. Tensile Strength
2,800/19.3
3,000/20.7
3,200/22.1
3,400/23.4
3,600/24.8
3,800/26.2
4,000/27.6
4,200/29.0
4,400/30.3
60 65 70 75 80 85 90
Flex
ural
Stre
ngth
psi
/MP
a
Key: Field SamplesLaboratory Samples
8
Percent Resin
Percent Resin

DATA
580,00/4,000
600,000/4,140
620,000/4,280
640,000/4,410
660,000/4,550
680,000/4,690
700,000/4,830
60 65 70 75 80 85 90
Flex
ural
Stre
ngth
psi/
MPa
Key: Field SamplesLaboratory Samples
Figure 5: X-Y Plot of Resin System Content vs. Tensile Modulus
Figure 6: Field-Manufactured Panels
A: Flat Sample B: Curved Sample
C: Curved SampleD: Curved Sample
9

DATA
Figure 7: Laboratory-Manufactured Panels
Smooth Surface Rough Surface Rough Surface Close-Up
Figure 8: Smooth and Roughened Flexural-Tested Laboratory Specimens
Failed Smooth Specimen
Failed Roughened Specimen
Figure 9: Top View of Smooth and Roughened Flexural-Tested Laboratory Specimens
FailedSmoothSpecimen
FailedRoughenedSpecimen
10

DATA
Figure 10: Side View of the Smooth and Roughened Laboratory Flexural-Tested Specimens
Smooth Surface
Roughened Surface
Smooth Surface
Roughened Surface
0.3 in./2.6 mm
0.2 in./5.1 mm
11

1225 Willow Lake Blvd., St. Paul MN 55110-5145 800.736.5497 Fax: 651.481.9836
www.interplastic.com
© 2008 Interplastic Corporation. CoREZYN is a registered trademark of Interplastic Corp. T-039 3/08