TECHNICAL REPORTS FILE COPY - dtic. · PDF fileity (RTF) during March and April 1968, and the...
43
AEDC-TR-69-216 MAR 4 1970 KAR 13 1995' SPECTR0SC0PIC DETERMINATION OF TEMPERATURE IN A POTASSIUM-SEEDED AIR PLASMA J. W. Gearhart ARO, Inc. February 1970 This document has been approved for public release and sale; its distribution is unlimited. TECHNICAL REPORTS FILE COPY ROCKET TEST FACILITY ARNOLD ENGINEERING DEVELOPMENT CENTER AIR FORCE SYSTEMS COMMAND ARNOLD AIR FORCE STATION, TENNESSEE PS0F337Y OF U. S. AIP: FORCE P40G00 - G9 - C - 0001
Transcript of TECHNICAL REPORTS FILE COPY - dtic. · PDF fileity (RTF) during March and April 1968, and the...

AEDC-TR-69-216 MAR 4 1970
KAR 13 1995'
SPECTR0SC0PIC DETERMINATION OF TEMPERATURE
IN A POTASSIUM-SEEDED AIR PLASMA
J. W. Gearhart
ARO, Inc.
February 1970
This document has been approved for public release and sale; its distribution is unlimited.
TECHNICAL REPORTS FILE COPY
ROCKET TEST FACILITY
ARNOLD ENGINEERING DEVELOPMENT CENTER
AIR FORCE SYSTEMS COMMAND
ARNOLD AIR FORCE STATION, TENNESSEE
PS0F337Y OF U. S. AIP: FORCE
P40G00 - G9 - C - 0001

M/m When U. S. Government drawings specifications, or other data are used for any purpose other than a definitely related Government procurement operation, the Government thereby incurs no responsibility nor any obligation whatsoever, and the fact that the Government may have formulated, furnished, or in any way supplied the said drawings, specifications, or other data, is not to be regarded by implication or otherwise, or in any manner licensing the holder or any other person or corporation, or conveying any rights or permission to manufacture, use, or sell any patented invention that may in any way be related thereto.
Qualified users may obtain copies of this report from the Defense Documentation Center.
References to named commercial products in this report are not to be considered in any sense as an endorsement of the product by the United States Air Force or the Government.

AEDC-TR-69-216
SPECTROSCOPIC DETERMINATION OF- TEMPERATURE
IN A POTASSIUM-SEEDED AIR PLASMA
J. W. Gearhart
ARO, Inc.
This document has been approved for public release and sale; its distribution is unlimited.

AEDC-TR-69-216 I
FOREWORD
The work reported herein was sponsored by the Arnold Engineer- ing Development Center (AEDC), Air Force Systems Command (AFSC), Arnold Air Force Station, Tennessee, under Program Element 65701F, Project 4344.
The work was conducted by ARO, Inc. (a subsidiary of Sverdrup & Parcel and Associates, Inc.), contract operator of AEDC, AFSC, under Contract No. F40600-69-C-0001. The work was conducted under ARO Project No. PL3912, in the 2-mw heater area of the Rocket Test Facil- ity (RTF) during March and April 1968, and the manuscript was sub- mitted for publication as partial result of this work on September 4, . 1969.
The author wishes to acknowledge Messrs. W. K. McGregor and Ray A. Hefferlin for suggestions concerning this investigation and C. C. Limbaugh and G. R. Lynch for assistance with data processing.
This technical report has been reviewed and is approved.
Vincent A. Rocco Harry L. Maynard 1st Lt, USAF Colonel, USAF Research Division Director of Plans Directorate of Plans and Technology
and Technology
li

AEDC-TR-69-216
ABSTRACT
Spectroscopic measurements of radial electron excitation tempera- ture distributions were made at the exit of a seeded, 2-mw arc heater. A nitrogen-oxygen mixture (about 3:1 in mass flow) was seeded with potassium carbonate. Potassium I lines were used in the determi- nation of temperature by the ratio method. A modification to the ratio method was devised so that two different lines, observed under different conditions, could be correctly employed in the ratio method. The exper- imentally determined temperature profiles were nearly uniform across the plasma stream but varied in magnitude from run to run. Relative potassium I atom concentrations were nonuniform, but nearly radially symmetric, and exhibited an off-axis peak.
111

AEDC-TR-69-216
CONTENTS
Page
ABSTRACT iii NOMENCLATURE vi
I. INTRODUCTION 1 II. APPARATUS AND PROCEDURE
2. 1 Apparatus 1 2. 2 Experimental Procedure 2 2. 3 Calibrations 4 2. 4 Data Processing 5
III. RADIATION EQUATIONS 3. 1 The Absolute Method 7 3. 2 The Ratio Method 7 3. 3 Application of the Absolute Method for K 1 Lines. . . 8 3. 4 Application of the Line Ratio Method for K I Lines . . 8
IV. RESULTS AND DISCUSSION 4. 1 Measurements. 10 4. 2 Comparison of Measured with Calculated
Temperatures 12 4.3 Discussion of Accuracy 13
V. CONCLUDING REMARKS AND RECOMMENDATIONS . . 14 REFERENCES 15
APPENDIXES
I. ILLUSTRATIONS
Figure
1. Arc Heater 19
2. Optics 20
3. Spectra Emitted by Potassium-Seeded Air Plasma. . . 21
4. Typical Raw Data0
a. K I 4965-A Line 22 b. K I 5832-Ä Line 23
5. An Axisymmetric Plasma a. Multizone Plasma 24 b. Three-Zone Plasma 25

AEDC-TR-69-216
Figure Page
6. Typical Plots of Epission Coefficient versus Radius a. KI4965-ALine 26 b. KI5832-ALine 27
7. Emission Coefficient versus Temperature for Various Seed Concentrations
a. KI4965-ALine 28 b. K I 5832-ALine 29
8. Temperature versus Radius a. Pair 8, Left Hand 30 b. Pair 8, Right Hand 31
H. TABLES
I. Results of Temperature Measurements <°K) by the Ratio Method 32
U. Results of Temperature Measurements (°K) by the Intensity Ratio Application of the Ratio Method ... 33
III. Calculated Values of Temperature (°K) 34
NOMENCLATURE
A^j^ Spontaneous radiative transition probability (Einstein's A)
c Speed of light
c' Constant, A^gn/X
C\ Calibration constant, w/(cm2 sr amp)
C'^ Constant, w/(cm2 sr cmx amp)
En Energy of atomic energy level n measured from ground state, eV
gn Statistical weight of atomic energy level n
H Total enthalpy
h Planck's constant
I Denotes zeroth degree of ionization when written after element symbol, e.g., K I
VI

AEDC-TR-69-216
Ijg(X) Intensity of lamp at wavelength X, w/(cm sr cm^)
*o^v' ^ Integrated intensity emitted by an optically thin plasma at wavelength X as a function of position y, w/(cm2 sr)
k Boltzmann's constant
N Number of a particular species of atoms per unit volume
N(r) Number of a particular species of atoms per unit volume at r
R(y, X) Response of system to radiation at wavelength, X, when the system is positioned at y, amp
R,g(X) Response of system to standard lamp intensity, Ijg(X), amp
r Radius of the plasma stream (a variable quantity, 0 < r < r0), cm
rQ Pull radius of the plasma stream, cm
T Temperature, °K
T(r) Temperature at r, °K
u{T) Partition function
u[T(r)] Partition function at r [see Eq. (4JJ
y Distance in the vertical (spatial scan) direction, cm
j3 Defined to be H1/H2 and is assumed to be T1/T2
y Ratio of specific heats
e Emission coefficient (intensity), w/cnr*
e(r) Emission coefficient (intensity) as a function of radius obtained by an Abel transform operating on i0(y* *>
X Wavelength, cm
AX Equivalent spectral bandwidth, cm
Vll

AEDC-TR-69-216
SUBSCRIPTS
1 K I 4965-A run
2 K I 5832-Ä run
A. Identifies a dependence on wavelength
vm

AEDC-TR-69-216
SECTION I
INTRODUCTION
A study was made to (1) show the applicability of spectrometric diagnostic techniques for seeded, high enthalpy plasmas produced by large scale, high power, arc heaters, and (2) determine specifically from the spectral radiation the radial distribution of temperature at the exit of a seeded 2-mw arc heater, using a mixture (~3:1 in mass flow) of N2 and O2 as the working fluid, and K2CO3 seed, which was injected into the arc.
Photographic maps were made of the spectra of the plasma in the region from 3000 to 10, 000 A. Among the radiating species were K I, Na I, Cu I, and Zr I. No N2 molecular bands were identified because of the heavy overlapping continuum radiation from K I. Of the radia- tive species present, it was decided to use the K I atomic lines in the determination of the temperature. The two particular lines chosen were selected to minimize self-absorption and self-reversal. It was assumed throughout that the plasma was optically thin for these two lines. Values of the radial electron excitation temperature distribu- tion were found by making spatial scans across the plasma stream to obtain distributions of intensity of particular K I atomic lines as a function of the distance scanned. These intensity distributions were in- verted by the Abel transform to determine emission coefficients for par- ticular volumes on a radius of the stream. Comparison of the emission coefficients along with constants of the particular radiation system and correction for heater fluctuations from run to run allowed calculation of the radial temperature distribution by the ratio method. Absolute meas- urements of intensity were also made and could be used to find the den- sity of the radiating species.
Temperatures were most reliably determined by the ratio method, and the temperature profiles across the stream were nearly uniform. Relative density distributions were nonuniform but nearly radially sym- metric and exhibited an off-axis peak.
SECTION II APPARATUS AND EXPERIMENTAL PROCEDURE
2.1 APPARATUS
The arc heater used in this experiment was a Thermal Dynamics Model F-5000 having a zirconium insert in the cathode (Fig. 1, Appen- dix I, and Ref. 1). Gas was injected tangentially and flowed into a

AEDC-TR-69-216
1-in.-diam, water-cooled, copper anode section where it was heated in the arc and where the potassium seed was injected. The stream then entered a 3-in. -diam stilling chamber and flowed from the still- ing chamber to atmosphere through a nozzle having a 1-in. exit diam- eter. The K2CO3 seed was injected perpendicular to the stream centerline through a 3/16-in.-diam port. The seeder consisted of an auger which fed the seed material to a cyclonic mixing chamber, from which the gas and seed material were blown through a flexible line to the injection port.
The spectrometer used for these measurements was a SPEX Model 1800 which is a 3/4-m Czerny-Turner instrument capable of use either as a spectrograph or as a monochromator. An EMI 6526B multiplier phototube, an amplifier, and an x-y recorder were used for photoelec- tric recording. I-N and 103 -F Kodak® plates were used in making spectral maps from 3000 to 10, 000 A.
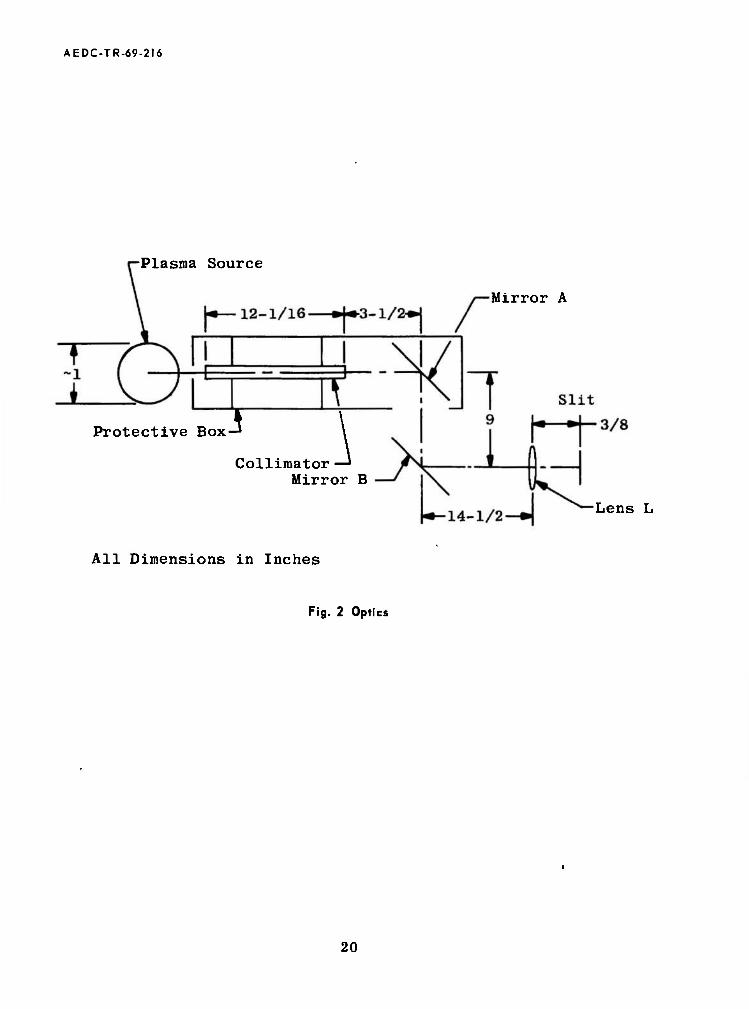
An optical traversing mechanism was fabricated to scan the plasma in a plane 1/8 in. from the face of the heater (Fig. 2). The light entered the protective box and passed through the collimator to mirror A. The collimator and mirror A were moved vertically to spatially scan the plasma stream. The light then passed to mirror B which directed it to lens L which focused it on the slit of the spectrometer. It was assumed that the small change in path length as traversing was done did not affect the radiative transfer properties of the system. The collimator consisted of a piece of ceramic tube with a 1. 5-mm inside diameter.
The system was aligned by focusing a helium-neon laser at the exit slit of the spectrograph, centering the rectangular beam of light on the main collimating mirror and adjusting the wavelength of the spectro- graph until maximum transmission out the entrance slit was obtained for the 6328-A line. The laser beam then proceeded out along the field of view of the spectrograph. In this manner, it was possible to align the field of view of the spectrograph in the vertical and horizontal planes with respect to the heater. The collimator tube was positioned and aligned with the beam from the spectrograph. The scanning mechanism was operated, the beam position was checked, and any skew in the tra- versing mechanism was then eliminated by adjusting the system.
2.2 EXPERIMENTAL PRODEDURE
The arc heater was started with a high voltage, high frequency pulse, and stabilized within 20 to 30 sec. The arc was operated typically at 1000 v and 780 amp. The predicted conditions calculated from preset

AEDC-TR-69-216
gas flow and power settings were 2. 5 atm pressure in the stilling cham- ber and nozzle exit static temperature of 2600°K. These conditions varied, however, because of the inability to accurately control power and flow conditions. The concentration of potassium injected was typ- ically 0.0075 by weight.
During the first series of heater runs, photographic maps were made of the spectrum emitted by the seeded plasma stream.
The collimator was not used in making the.photographic maps. The light from the plasma was reflected by the two mirrors (mirror A set at the stream centerline) and focused on the slit of the spectrograph. Exposures ranged from 1 min to 1/8 sec. A low-pressure mercury discharge lamp was used as a source for wavelength calibration spectra.
In the next series of runs, spatial traverses of the plasma stream were made. The traverses, made while recording the intensity of atomic spectral lines emitted by the plasma, were obtained in the fol- lowing way:
1. The spectrometer was set to the wavelength of a K I line.
2. The traversing mechanism was set to the stream center- line.
3. The arc heater was started, and the wavelength control was adjusted slightly until the photomultiplier signal reached a maximum.
4. The traversing system was moved to the bottom edge of the stream.
5. A traverse was made across the stream. o
6. The wavelength was shifted 5 A to a wavelength contain- ing only continuum radiation, and another traverse was made to record the continuum radiation which was assumed to be equal to that at the wavelength of the line.
Each traverse took about 30 sec, and the entire run time was from 2 to 3 min, including heater stabilization. Because of the limitations of the heater system (maximum continuous operation 3 to 3. 5 min) and the speed of the wavelength drive of the spectrometer, it was not possible to shift to another line and make two more traverses during the same run. Therefore, the traverses of different lines were made in separate runs in which it was attempted to obtain the same total enthalpy conditions. It was, however, not possible to set identical conditions.

AEDC-TR-69-216
Five runs were made on the K I line pair at 4965 A, and five runs were made on the K I pair at 5832 A. Typical raw data are shown in Fig. 4.
2.3 CALIBRATIONS
For intensity calibration, a tungsten ribbon filament standard lamp was set up on the centerline of the plasma jet and rotated to peak the output of the photomultiplier. In this position, the face of the ribbon was perpendicular to the line of sight as defined by the collimator and filled the field of view. With the standard lamp properly warmed up and operating at a calibrated current, the spectrometer was set at each of the line and continuum observation wavelengths, and the system responses (in units of amperes) were recorded on the x-y recorder. Since', Ig(X) is known at the wavelengths of interest and since the response of the whole system, Rjg(X) (in amperes of photomultiplier current), due to this lamp intensity can be observed and recorded, it is possible to define a cali- bration constant C'^ for each wavelength in units of w/(cm^sr cm^ amp). Two calibrations were made at all the wavelengths of interest, and the calibration constants C'x given by both were averaged. The equivalent spectral bandwidth (AX in cm^) of the system is defined to be the recip- rocal dispersion of the spectrograph (cmx/cm) times the wider of the entrance and exit slit widths (cm). Both slits were the same widthi(50 /u) in this experiment. Since the dispersion of the SPEX 1800 was not con- stant over the wavelength region investigated, the dispersion was experi-
O
mentally determined at 500-A intervals, and values for the dispersion at the particular wavelength of interest were calculated and were used to determine the values of bandwidth. The system calibration constant C^ is defined to be
CA = CX • AX (w/cm2 sr amp)
When R(y, X), the signal in amperes produced by the line radiation at the wavelength X emitted by the arc heated gas stream, is multiplied by C\, then the intensity of the radiation from the plasma stream at wave- length X appears in units of w/(cm sr). It was. found that, when the calibration constant C^ was calculated at the continuum measurement wavelengths (5 A greater than the line wavelengths), it was significantly different from the values of C^ at the line wavelengths because of the rapidly changing response of the system as a function of wavelength. Therefore, separate calibrations for the continuum observation,wave- lengths were also necessary.

AEDC-TR-69-216
2.4 DATA PROCESSING
The Central Computing Operations (CCO) IBM 360/50 system was used for all data processing. To prepare input data for computer pro- cessing, an average curve through the raw data (Fig. 4) was drawn by inspection for both the line and continuum traverses, and 50 points equally spaced on the y-axis were read from each of these curves. The input data were 25 points along each radius [R(y, A.) in amp]. The values at these points were multiplied by the predetermined C^ to obtain I0(y* W, the intensity in w/_(cm^ sr) from an optically thin plasma. The continuum intensity was calculated in a similar manner, and the continuum intensity was substracted from the line intensity. In the computer program, the intensity values are fitted to a polynomial divided by a polynomial whose orders are controllable, and then the fitted data are plotted versus y. For these data, a fit was obtained with a fifth- order polynomial divided by a zeroth-order polynomial.
For this experiment, the quantity measured after calibration was intensity, I0(y,A) [in w/(cm^ sr)], as a function of the distance traversed across the plasma. This is an integrated measurement along the opti- cal path and consists of contributions from regions which may vary in temperature and density. The desired measurement, however, is a point function measurement of the separate contribution of each of the elements along the optical path. Therefore, to find this desired quan- tity, which is the radiation per unit volume as a function of the plasma radius (emission coefficient e (r)), it is necessary to perform some mathematical operation on the data obtained.
In optically thin, axisymmetric plasmas, the intensity in terms of the emission coefficient is (Ref. 2)
f° <>-. M = 2 fr^h Cr'-vz)> (1)
where IQ(y» ^) is the intensity in w/(cm^ sr) as a function of the distance y traveled in the vertical direction, r is the variable radius of the stream, and r0 is the full radius of the stream. The inversion of this equation to solve for e (r) is performed by use of the Abel transform and may be written
■W--J-J \o (y.A) dy
<y2 - r2)« <2>

AEDC-TR-69-216
Because of the derivative of I0(yi *■) in Eq. (2), small errors in I0(y, *) may cause large errors in the determination of e (r).
An approximate method of solving Eq. (2) is to write the integral [Eq. (1)] as a sum
Ij = r0 2 aij (ij (3)
where ay is the shape factor (Ref. 3) for the area element being con- sidered (Fig. 5a) and e^ is the emission coefficient of the plasma in that same area, where i labels the radius zones, and j labels the lateral path zones. Figure 5b illustrates a three-zone axisymmetric situation. For a three-zone axisymmetric case, the first equation that could be solved is that for the outermost radius zone:
I3 = a33 €33 r0
This equation can be solved for €33 because a33 is given by the area and I3 is measured. If the plasma is axisymmetric, then £33 = €32 = €31. The next equation solved is
I2 = r0 [a32 £32 - a22 *22 + ^32 «32]
which can be solved for £22» Similarly, £22 =£21 which allows solution for en using the equation for 1\.
In this experiment, the plasma radius was divided into 25 zones, and the computer used an amplified procedure similar to the one above to calculate the values of the emission coefficient for each zone. Figure 6 shows the emission coefficients (w/cm3 sr) as a function of radius, which were obtained by inverting the typical raw data (Fig. 4) by the Abel trans- form.
SECTION III RADIATION EQUATIONS
Two methods of determining temperature of radiative plasmas by spectroscopic methods are considered here: the absolute spectral line intensity method, and the spectral line intensity ratio method.

AEDC-TR-69-216
3.1 THE ABSOLUTE METHOD
The absolute intensity method makes use of the radiation from only one spectral line. The equation for the emission coefficient from such an atomic line is
,v hc AnmSn N(r) f(r) =
|_k T(r)J 4ff K u[T(r)] F |_k T(r)J (4)
where
u[T(r)] = S gn exp rzM LkT(r)J
where Anm is the spontaneous radiative transition probability (Einstein's A), A. is the wavelength of the line, N(r) is the species density, [u T(r)] is the partition function, En is the energy in eV of the upper atomic energy level from which the transition originates, k is Boltzmann's con- stant, and T is the temperature in °K. To solve for temperature from this equation requires knowledge of the species number density and the partition function. Conversely, if the temperature and the partition function are known, then the number density may be found.
3.2 THE RATIO METHOD
A second method of measuring the temperature is by the ratio method. If two lines are observed, under identical conditions, and their emission coefficients are expressed as a ratio, the result is
fiW AnmigniA2
f2^) Ann»2 6n2 *1
r-E "1
kTli] pE^j
kTW
(5)
In this method, the number density and the partition function cancel, and the intensity measurements may be made on a relative scale, since it is only the ratio of the emission coefficients that is of interest. How- ever, for the ratio method to be valid, the excitation conditions for the two lines must be the same; i. e., for plasmas in thermal equilibrium, the temperature of the plasma must be constant over the length of time necessary to measure the two intensities.

AEDC-TR-69-216
3.3 APPLICATION OF THE ABSOLUTE METHOD FOR K I LINES
Olsen (Ref. 4) has made equilibrium calculations for air plasmas which have small concentrations of potassium. By equilibrium, it is meant that local thermodynamic equilibrium was assumed to exist. To make the equilibrium calculations, an equation (Eq. 4) was used. By choosing a typical, relevant value of concentration (N) and temperature (T) from within the range of interest and calculating the partition func- tion [u(Tj], the equation was solved for the emission coefficient (e). Olsen's curves of emission coefficient versus temperature for various concentrations of potassium for the 4965-A line pair and the 5832-A K I line pair are shown in Fig. 7.
Therefore, if the value of N is known and e is measured for either of these lines, then T may be found from Olsen's equilibrium calcula- tions. It should be noted that the transition probabilities used in the equilibrium calculations were taken from theoretical calculations and that there is poor agreement between the few theoretical and experimen- tal determinations of transition probability for K I. It should also be noted that there is no discernible difference between a temperature variation along the radius of the stream and a concentration variation (nonuniform distribution of the gross concentration) using the absolute method [see Eq. (4^ .
3.4 APPLICATION OF THE LINE RATIO METHOD FOR K I LINES
The line ratio method involves finding the relative ratio of the emission coefficients of two lines and solving for the temperature. In this method, the number density and the partition function cancel, and the intensity measurements may be made on a relative scale. Solving Eq. (5) for the temperature gives
T(r) = i- -
L=l <<r2>J (6)
For this particular case (the 4965-A 82D - 42P and 5832-Ä 52D - 42P K I line pairs), the transition probabilities compiled by Olsen (Ref. 4) are 3. 90 x 105 and 3. 20 x 105 (sec"1), respectively, and Eq. (6) may be written
T(r) 4.305 x 10³ °K Enfe. 982 x 10-1^^
f(ri) (7)

AEDC-TR-69-216
These values of Anmj compiled by Olsen, were derived from theoretical calculation. Knowledge of the transition probabilities of K I is at this time quite limited. Most of the values in the literature are based on theoretical calculations and are in poor agreement with the few experimental determinations that have been made.
The K I line pairs used here were chosen because their transitions end in upper energy levels. The radiation from these transitions is, therefore, much less likely to suffer self-reversal by "cool" parts of the plasma since it is unlikely that a significant part of the electron population would be in the 4^P state.
For this investigation, the existence of a cool plasma layer is con- firmed by the fact that the resonance lines of potassium at 7664. 9 and 7669. 0 A are strongly self-reversed (Fig. 3). Even though the cool layer exists, the ratio method may be applied if the plasma is con- sidered to be optically thin at the wavelengths of the lines used in the intensity ratio.
It must be noted that the assumption was made that the temperature and density at which the emission coefficients of the two lines were measured were the same for both measurements, although, in these experiments, the intensities of the two lines were measured in two different runs and, therefore, under different conditions. The emission coefficient for a particular atomic line may be written again:
, , hc Anm gn Mr) u„ f(r) = - — exp (4)
4l7 A ,,[T(r) V ' ■ ~ ' m so that it can be noted that the only plasma variables affecting e(r) are the temperature and density. If the temperature is uniform across the plasma stream, the ratio of the emission coefficient will be equal (at all r's) to the ratio of the uninverted intensities (at all y's) and will also be related to the temperature as in Eq. (6). This may be seen to be true if it is noted that
ioi(y,A). ± ^i±i fr°-^j «P r^i-i t* 1 4»7 A! J u[T,(r)] K |_"IHJ
and
he Anm2 g„2 -ro N2(r) (" -En2~
2 4* A2 J
y u[T2(r)] |_kT2(r)-
AEDC-TR-69-216
for two separate measurements at Xj and A2. If it is assumed that Ti and T2 are both measured in isothermal plasmas and if it is assumed that Ti = T2, then
he Anmigni "PIrrr] rr° WT.*> = to —x-— -^T^T J Ni<r)dz
and
loa(y,A) = he An"i2 8n2 eXP
4ff &]
u[T(r)] J N2(r) di
and
-Er
I01<y.A) Anmi gn,A2 exP[—ITT
Io2(y,A.) Anni2 g„2 ki f-Enj] axphrr (8)
[see Eq. (5)]. Therefore, if the temperature of a plasma stream is uniform across the stream, then temperature information may be obtained from intensity ratios. And, conversely, if Ioi(y, A)/Io2(yi *■) a* ^l y's gives temperature values equal to those found from the ratio method at corresponding r [ratios of e (rj\, then the plasma is isothermal. It should be noted that the assumption that f r0 rrQ J Nj(r)dz =J N2(r)dZj which was made in deriving Eq. (8), is not
y y necessarily a valid one for separate measurements and introduces errors both in the above reasoning and in the ratio, method.
SECTION IV RESULTS AND DISCUSSION
4.1 MEASUREMENTS
If it is assumed that there is a uniform distribution of the gross concentration of the potassium in the plasma, then the absolute method may be employed to find the excitation temperature of the plasma. Olsen's curves (Fig. 7) were used along with the measured absolute emission coefficients (typical set shown in Fig. 6) to determine the excitation temperature for this particular set of data, and gave temper- atures (averaged across the whole diameter) of 2330°K for the 4965-A line and 2398PK for the 5832-Ä line.
10

AEDC-TR-69-216
If it is assumed that I N(r)dz is the same for both runs (see y
Section 3. 4), then the temperature may be found by the ratio method. The temperatures found by the ratio method using the typical emission coefficients (Fig. 6) gave a relatively uniform temperature distribution at about 1900°K. The difference in this result and that obtained from the absolute measurements was due to the violation of the assumption that the measurements, for the pair of runs shown in Fig. G, were made under identical excitation conditions. This is evidenced by the two dif- ferent temperatures obtained using the absolute method. It is interest- ing to note that the average temperatures obtained from the absolute method, for this pair of runs, were in nearly the same ratio as the total enthalpies at which the heater ran when the spectral data were recorded (Ti/T2 = 0. 972 and H1/H2 = 0. 973).
The ratio method may be corrected, however, for the difference in enthalpy from run to run in the following manner: Let
ß = -T1- Ha
If it is assumed that the specific heat of the plasma is constant in the temperature region from Tj to T2, then
Hi Ti
H2 T2
If this assumption is correct, then Eq. (5) may be corrected for enthalpy difference and becomes
(10)
By using measured values of enthalpy, Eq. (9) can be solved for ß, and T^(r) can be obtained from Eq. (10). T2(r) can then be obtained from Eq. (9). The ß correction method assumes that the specific heat be- tween T]_ and T2 is a constant and that Ni(r)/N2(r) is unity. It does not depend on whether or not the distribution of the gross concentration is uniform along the radius; it requires only that the distributions, of the gross concentration of K I for the two different runs, be identical.
*!<!■) Anai 1 cllj ^2
exp l_kT](r)J
f2(r) *nra 2 ^n 2 ^1 exp
■-0Ena]
11

AEDC-TR-69-216
When the ß correction is applied to the typical emission coefficient data shown in Fig. 6 (pair 8), Ti is 2320°K and T2 is 2387CK where Ti and T2 have been averaged over the whole diameter of the stream (Fig. 8 and Table I, Appendix II). Three other pairs of runs were selected, and the results of the ratio method temperature calculation using the ß correction are also shown in Table I.
Temperature calculations were also made using measured inten- sity rather than the emission coefficients; that is, calculations used ratios of IQ(y, A) rather than e(r). The results are shown in Table II. The uniformity of the values obtained from the noninverted calculations and their agreement with the inverted calculation temperatures (except near the center) confirm the observation that the temperature in the plasma stream was nearly uniform. The values of temperature cal- culated for the last three zones of the plasma (23, 24, and 25) are not included in the average values mentioned above or in Tables I and II. These values were removed because of inaccuracy in measurement at the very low intensities at the edge of the plasma and because of the errors inherent in the data processing at the edge-of the intensity dis- tribution.
The uniformity of the temperature distribution across the plasma stream implies that the emission coefficient distribution (e.g., Fig. 6) is directly proportional to the K I concentration as a function of r. The concentration distribution is typically nearly radially symmetric and has an off-axis peak. It can then be concluded that, in the arc heater used, the gross concentration of K I atoms was not distributed uniformly throughout the plasma. This was not unexpected since the injection of the seed into the high velocity swirling gas stream might give such a distribution.
It would, therefore, be incorrect to determine temperature at var- ious points along the radius from Olsen's equilibrium calculations (Fig. 7) using the gross concentration of K I atoms for N(r) and the measured value of e(r).
4.2 COMPARISON OF MEASURED WITH CALCULATED TEMPERATURES
Calculations of average static temperatue at the nozzle exit were made by PWT personnel from the observed operating parameters and the thermodynamic properties of pure air by using an energy balance. These calculations gave the results shown in Line 1, Table III. After the measurements were made, it was found that the mixture of gases had not been the desired 80-percent N2, 20-percent 02 (to simulate air)
12

AEDC-TR-69-216
but had been a 90-percent N2, 10-percent O2 mixture. Recalculation by PWT of the average static temperature corrected for the different mass flow but which still assumed the mixture to be pure air is shown in Line 2, Table III. Correction of 7 to more closely approximate the real mixture gave the results shown in Line 3, Table III.
The results of these calculations possibly indicate a systematic error in the average measured values of temperature found by the ratio method (Line 4, Table III). If such a systematic error is present, it is believed that the transition probabilities used in the ratio calculation would be the most probable cause.
The transition probabilities could have easily caused an error of this magnitude. If the ratio of the transition probabilities (in the ratio c'^/c'i) were larger only by a factor of about three, then the values of temperature found by the ratio method would agree with the real mix- ture, thermodynamic calculations. It is not unreasonable to think that the transition probabilities might be this much in error, since they were obtained from theory, not from measurement.
4.3 DISCUSSION OF ACCURACY
There are several reasons for the temperature data scatter and the discontinuity at the center [between left (top) and right hand (bottom) halves of the same run]. Some of these are:
1. A large amount of fluctuation exists in the K I line inten- sity during the data runs (see Fig. 4).
2. The averaged data curve drawn through the fluctuating re- cording (Fig. 4) could not be expected to be symmetrical even if the "true curve" were.
3. The computer calculated curve fit of the data curve is expected to be only approximate.
4. The computerized Abel inversion is only approximate and operating on the two halves of the nonaxisymmetric intensity approximation; it would be expected to give a center discontinuity in the emission coefficients. This leads to a discontinuity in temperature.
It should be noted that the apparent temperature discontinuity at the center observed in the temperature calculations (Table I) is absent in the.noninverted calculations (Table II). The discontinuity noted in
13

AEDC-TR-69-216
the emission coefficients is due to the sensitivity of the transform to the differences in curve shape of a particular run between the left and right hand sides for the reasons mentioned above. All pair combinations of the ten runs made gave results similar to those listed.
SECTION V CONCLUDING REMARKS AND RECOMMENDATIONS
The general agreement of the electron excitation temperature and the gas temperature predicted from aerodynamic and thermodynamic considerations is one indication of thermodynamic equilibrium. The electron excitation temperature across the seeded plasma stream under all the conditions investigated was determined to be essentially uniform. The excitation temperature could not be defined by an average over the series of runs because of uncontrollably different run conditions. In every case, it was noted that there was an N(r) (K I number density as a function of r) variation, which was symmetrical about the stream centerline and which had an off-axis peak.
The spectral line intensity ratio method was quite sensitive to the enthalpy of the plasma stream, which changed significantly from run to run. However, it was practical to make observations at two different enthalpies and to correct for the enthalpy difference. This correction could be made under the assumptions that the specific heat of the gas was not a function of temperature and that the number density distri- bution for the two cases were the same.
The problem which prevented comparison of data taken during dif- ferent runs and, therefore, at significantly different conditions was purely a mechanical one and might easily be solved by modification of the monochromator wavelength drive. Additionally, it is recommended that, when it is desired to use the ratio method for this kind of source (nearly isothermal), simultaneous measurements be made of the radia- tion from the two lines. In this manner, radial distributions of intensity could be obtained under more nearly identical conditions.
Since the temperature distribution of this particular plasma was nearly uniform across its diameter, future spectroscopic measurements of this and other nearly isothermal plasmas may most accurately and conveniently be made by measuring the ratio of the intensities of the lines rather than by calculating the emission coefficients by the Abel transform and taking their ratio. In this way, the errors inherent in the approximation of the Abel transform and in the data processing are avoided.
14

AEDC-TR-69-216
It is recommended that experimental determination of K I transition probabilities be made. The existing values in the literature are largely from theoretical calculations, are in poor agreement with experiment, have large probable errors, and are incomplete.
It is also recommended that the cause of the large intensity fluc- tuations observed in the plasma be investigated. One suitable method to determine whether the fluctuations were caused by temperature or density fluctuations in the plasma would be simultaneous observation of two K I lines for use in the ratio method. Then, the phenomena re- sponsible for the fluctuations (both spatial and temporal) could be iden- tified, and their effects on the plasma considered. It might then be possible to identify, and, if desirable, find ways to eliminate, the mechanism generating the fluctuating phenomena. It is indicated from the present results that the temporal fluctuation is a density-dependent phenomenon.
REFERENCES
1. Garrison, G. W. "Electrical Conductivity of a Seeded Nitrogen Plasma." AEDC-TR-68-116 (AD672249), July 1968.
2. Greim, H. R. Plasma Spectroscopy. McGraw-Hill Book Company, New York, 1964.
3. Pearce, W. J. Optical Spectrometric Measurements at High Tem- peratures. (Philip J. Dickerman, Editor). University Press, Chicago, 1961.
4. Olsen, H. N. , et al. "Development of Diagnostic Methods for Seeded Air and Nitrogen Plasmas. " AEDC-TR-68-217 (AD679530), December 1968.
15

AEDC-TR-69-216
APPENDIXES
I. ILLUSTRATIONS II. TABLES
17

CO
•Cathode-
-11.7-
WM lltlll u tmtt tUI!W/////////n't 1.75
Zirconium Insert
Water-Cooled Copper—
■Anode-
-13.5-
■4.75 ^l Gas Injector Jt
TZZmZZZZE wmzzmzzzfflzzfflzzzmzzzm
'/////¥////
Ceramic Insulator
-Seed Injection Port
\
1.0 r T 3.0
_L ^T
-1.8
± 1.0
-Approximate Arc Attach- ment Point
Water-Cooled Copper
Nozzle Length 1.8 in.
Exit-to-Throat Area Ratio 1.37
Throat-to-Exit Distance 1.55 in.
Radius of Throat 0.426 in,
Exit Diameter 1 in.
Notes: This Drawing Not to Scale
All Dimensions in Inches
Fig. 1 Arc Heater o n
AEDC-TR-69-216
■Plasma Source
Mirror A
Protec tive Box-}
\ Collimator Mirror B
Lens L
All Dimensions in Inches
Fig. 2 Optics
20

AEDC-TR-69-216
K I
-7699.0 -7664.9
Hg
-7326 -7310 -7300
K I
'6966 -6939.0 -6911.3
i
6682 2nd
-6262 -6252 2nd
-5790- -5770
,5895 -5890 ,5832.1 -5812.5 -5802.0 -5782.6
!o}Na l
K I
Fig. 3 Spectra Emitted by Potassium-Seeded Air Plasma
21

9x10" T 1 1 1 1 r T 1 r
to to
E
W
14
> m O n ■ H 70 6»
2 0 2 Diameter of Stream, cm
8 10 12 14
a. K I 4965-ALine
Fig. 4 Typical Raw Data

6x10' 1 r n r
CO
14 12 10 8 2 0 2 Diameter of Stream, cm
14
b. K I 5832-Ä Line
Fig. 4 Concluded o n
■o

AEDC-TR-69-216
a. Multizorte Plasma
Fig. 5 An Axisymmetric Plasma
24

AEDC-TR-69-216
b. Three-Zone Plasma
Fig. 5 Concluded
25

AEDC-TR-69-216
10 x 10
c
<H 0> 0 o e o •H u Cfl
■H s w
4 6 8 10
Radial Distance, cm
12 14
a. K I 4965-A Line
Fig. 6 Typical Plots of Emission Coefficient versus Radius
26

AEDC-TR-69-21«
8 x 10'
7 —
■p ö V
■H O •H <H <H (U o u c o
•l-l (0 CO
•H E w
6 —
4 —
3 —
4 6 8 Radial Distance, cm
b. K I 5832-A Line Fig. 6 Concluded
27

AEDC-TR-69-216
1 x 10
? 1 x 10"6 M a y
+» a
s Ü
a o
I
1 x 10
2 -
-7
2 x 10 -8
2000
0.014 0.012 0.010 0.008 0.007& 0.006 0.004 0.002
2200 2400 2600
Temperature, K
2800 3000
a. K I 4965-A Line
Fig. 7 Emission Coefficient versus Temperature for Various Seed Concentrations
28

AEDC-TR-69-216
1 x 10
h in i n B u
c o O
■H 0> O o a o
■H m n
■H E W
1 X
2 x 10
2 x 10 —
2000 2200 2400 2600 2800
Temperature, °K
3000 3200
b. K I 5832-A Line
Fig. 7 Concluded
29

AEDC-TR-69-216
2600
220f>
o u
£ 1800 u » a s
1400 -
1000
o0ooooooo0000oooooooo0
J_ J. 6 8 10
Radial Distance, cm 12 14 16
a. Pair 8, Left Hand
Fig. 8 Temperature versus Radius
30

AEDC-TR-69-216
2600
1000 6 8 10-
Radial Distance, cm
b. Pair 8, Right Hand
Fig. 8 Concluded
31

CO CO
TABLE 1 o o 1
RESULTS OF TEMPERATURE MEASUREMENTS (°K) BY THE RATIO METHOD H TO ■
Pair 8 Pair 17 Pair 23 Pai: r 26 1 IO
Zone Left Hand Right Hand Left Hand Right Hand Left Hand Right Hand Left Hand Right Hand o.
1 2226 2384 2305 2458 2098 2404 2431 2744 2 2267 2398 2265 2428 2168 2429 2426 2732 3 2294 2406 2247 2408 2218 2443 2426 2715 4 2314 2410 2240 2393 2261 2451 2430 2692 5 2329 2409 2241 2382 2300 2452 2436 2664 6 2340 2403 2249 2376 2333 2447 2446 2632 7 2347 2392 2261 2373 2362 2436 2458 2598 8 2352 2378 2278 2374 2385 2421 2471 2566 9 2353 2362 2298 2377 2402 2404 2486 2535
10 2352 2344 2320 2382 2416 2386 2502 2508 11 2349 2327 2344 2388 2424 2367 2517 2485 12 2346 2311 2369 2394 2428 2350 2533 2466 13 2341 2296 2395 2400 2432 2335 2548 2451 14 2336 2282 2421 2404 2432 2322 2564 2439 15 2330 2270 2446 2408 2431 2311 2579 2431 16 2325 2259 2472 2410 2428 2302 2593 2426 17 2320 2250 2497 2411 2423 2296 2606 2424 18 2314 2243 2522 2410 2418 2292 2618 2425 19 2310 2236 2546 2406 2413 2290 2629 2429 20 2305 2231 2570 2400 2406 2291 2638 2436 21 2302 2228 2593 2387 2398 2298 2645 2450 22 2298 2225 2616 2376 2391 2304 2652 2463 23* 24* 25*
Average 2320 2320 2386 2398 2362 2365 2529 2532
* The values of temperature for this zone are not included because of inaccuracy in measurement at the very low edge intensities and because of errors inherent in the data processing at the edge of the intensity distribution.

TABLE II RESULTS OF TEMPERATURE MEASUREMENTS (°K) BY THE INTENSITY RATIO
APPLICATION OF THE RATIO METHOD
Co CO
Pair 8 Pair 17 Pair 23 Pair 26 Zone Left Hand Right Hand Left Hand Right Hand Left Hand Right Hand Left Hand Right Hand
1 2321 2310 2382 2384 2364 2366 2523 2532 2 2324 2309 2382 2382 2372 2366 2525 2526 3 2327 2307 2384 2381 2380 2364 2528 2519 4 2330 2304 2388 2381 2388 2361 2531 2511 5 2331 2300 2393 2380 2395 2357 2536 2503 6 2332 2296 2400 2380 2403 2353 2542 2494 7 2332 2291 2409 2380 2408 2348 2548 2486 8 2331 2285 2420 2380 2412 2342 2555 2478 9 2330 2279 2431 2381 ■2416 2337 2562 2471
10 2329 2273 2444 2381 2418 2332 2570 2466 11 2326 2267 2459 2381 2419 2327 2578 2461 12 2324 2261 2473 2381 2418 2323 2586 2458 13 2321 2256 2489 2381 2417 2319 2594 2456 14 2318 2251 2505 2380 2415 2316 2602 2456 15 2315 2246 2522 2378 2412 2314 2610 2457 16 2312 2241 2539 2376 2408 2313 2617 2460 17 2309 2237 2557 2373 2403 2314 2624 2464 18 2306 2234 2574 2368 2398 2316 2630 2471 19 2304 2231 2592 2361 2392 2320 2635 2481 20 2302 2229 2610 2352 2386 2326 2639 2493 21 2302 2227 2628 2340 2378 2337 2640 2512 22 2302 2227 2646 2322 2368 2353 2637 2538
Average 2320 2266 2483 2373 2399 2337 2582 2486
o
o ■ M

TABLE III CALCULATED VALUES OF TEMPERATURE (°K)
n
ON •O
Static Temperature, Air
Static Temperature, 90- percent N2, 10-percent O2, Corrected for Mass Flow
Pair 8 Pair 17 Pair 23 Pair 26
2698 2734 2734 2698
2876 2840 2840 2804
to 4=> Static Temperature, 90-
percent N2, 10-percent O2, Corrected for Mass Flow, Y Corrected for Mixture
3615 3572 3572 3540
Spectrometer, Line Ratio 2290 2428 2367 2534

UNCLASSIFIED Security Classification
DOCUMENT CONTROL DATA -R&D (Security classification of till», body of abstract and Indextnt annotation must be entered when the overall report la classified)
I- ORIGINATING ACTIVITY (Corporate author)
Arnold Engineering Development Center ARO, Inc., Operating Contractor Arnold Air Force Station, Tennessee
2a. REPORT SECURITY CLASSIFICATION
UNCLASSIFIED 2b. GROUP
N/A 3. REPORT TITLE
SPECTROSCOPIC DETERMINATION OF TEMPERATURE IN A POTASSIUM-SEEDED AIR PLASMA
4 DESCRIPTIVE NOTES (Type ol report and Inclusive dates)
March and April, 1968 -Final Report a. AUTHOB(S) (First name, middle Initial, last name)
J. W. Gearhart, ARO, Inc.
S. REPORT DATE
February 1970 7a. TOTAL NO. OF PAGES
42 7b. NO. OF REFS
■a. CONTRACT OR GRANT NO F40600-69-C-0001
b. PROJECT NO 4344
cProgram Element 6570IF
9a. ORIGINATOR'S REPORT NUMBERI9I
AEDC-TR-69-216
9b. OTHER REPORT NO(S| (Any other number» that may be assigned this report)
N/A IC DISTRIBUTION 5TATEMENT
This document has been approved for public release and sale; its distribution is unlimited.
II.SUPPLEMENTARY NOTES
Available in DDC
12. SPONSORING MILITARY ACTIVITY
Arnold Engineering Development Center, Air Force Systems Command Arnold Air Force Station, Tenn.37389
13. ABSTRACT
Spectroscopic measurements of radial electron excitation tempera- ture distributions were made at the exit of a seeded, 2-mw arc heater. A nitrogen-oxygen mixture (about 3:1 in mass flow) was seeded with potassium carbonate. Potassium I lines were used in the determi- nation of temperature by the ratio method. A modification to the ratio method was devised so that two different lines, observed under different conditions, could be correctly employed in the ratio method. The exper- imentally determined temperature profiles were nearly uniform across the plasma stream but varied in magnitude from run to run. Relative potassium I atom concentrations were nonuniform, but nearly radially symmetric, and exhibited an off-axis peak.
DD FORM 1473 UNCLASSIFIED Security Classification

UNCLASSIFIED Security Classification
KKV WORD1 ROLE
LINK B LINK C
ROLE
spectroscopic analysis
electron temperature
temperature distribution
arc heaters
line spectra
%1-ooM AFS Twin
UNCLASSIFIED Security Classification