Technical ReportForest Research - British Columbia
17
TR-015 Geomorphology February 2002 Using terrain attributes to predict post-logging landslide likelihood on southwestern Vancouver Island by T. Rollerson, T. Millard, and B. Thomson Technical Report Forest Research Vancouver Forest Region 2100 Labieux Road, Nanaimo, BC, Canada, V9T 6E9, 250-751-7001 Research Disciplines: Ecology ~ Geology ~ Geomorphology ~ Hydrology ~ Pedology ~ Silviculture ~ Wildlife
Transcript of Technical ReportForest Research - British Columbia

TR-015 Geomorphology February 2002
Using terrain attributes to predictpost-logging landslide likelihood
on southwestern Vancouver Islandby
T. Rollerson, T. Millard, and B. Thomson
Technical ReportForest Research
Vancouver Forest Region2100 Labieux Road, Nanaimo, BC, Canada, V9T 6E9, 250-751-7001
Research Disciplines: Ecology ~ Geology ~ Geomorphology ~ Hydrology ~ Pedology ~ Silviculture ~ Wildlife
Citation:Rollerson, T., T. Millard and B. Thomson. 2002. Usingterrain attributes to predict post-logging landslidelikelihood on southwestern Vancouver Island. Res. Sec.,Van. For. Reg., B.C. Min. For., Nanaimo, B.C. Tec. Rep.TR-015/2002.
Contact:Tom Millard, M.Sc., P.Geo.Research GeomorphologistVancouver Forest RegionBC Ministry of Forests2100 Labieux RoadNanaimo, British Columbia V9T [email protected]
http://www.for.gov.bc.ca/vancouvr/research/research_index.htm
Cover photo: Typical terrain polygons in southwesternVancouver Island.
Technical Report TR-015 February 2002 Research Section, Vancouver Forest Region, BCMOF
Research Disciplines: Ecology ~ Geology ~ Geomorphology ~ Hydrology ~ Pedology ~ Silviculture ~ Wildlife
Summary...................................................................................................................................................... 2Keywords.................................................................................................................................................................. 2Author Information.............................................................................................................................................. 2Acknowledgements.............................................................................................................................................. 21. Introduction....................................................................................................................................................... 22. Study Area........................................................................................................................................................... 3
2.1 Area and Physiography................................................................................................................................ 32.2 Climate........................................................................................................................................................... 32.3 Bedrock Geology.......................................................................................................................................... 42.4 Surficial Geology........................................................................................................................................... 4
3. Methodology...................................................................................................................................................... 43.1 Sampling Design.......................................................................................................................................... 43.2 Data Collection.............................................................................................................................. 43.3 Data Analysis.................................................................................................................................. 5
4. Results.................................................................................................................................................................. 64.1 Univariate Terrain Attribute Analysis....................................................................................................... 6
4.1.1 Clearcut Landslides (Tables 1 and 2)..................................................................................... 64.1.2 Road Fill Landslides (Tables 3 and 4).................................................................................... 74.1.3 Road Cut Landslides (Tables 5 and 6)............................................................................. 9
4.2 Multivariate Terrain Attribute Analysis............................................................................................ 104.2.1 Clearcut Landslides (Figures 2 and 3).................................................................................. 104.2.2 Road Fill Landslides (Figure 4).......................................................................................... 134.2.3 Road Cut Landslides (Figure 5)......................................................................................... 13
5. Discussion and Conclusions....................................................................................................................... 13References..........................................................................................................................................15
TABLE OF CONTENTS
Tables:1. Comparison of terrain attributes with clearcut
landslide likelihood ...........................................62. Terrain attributes - clearcut landslides summary
statistics.. . . . . . . . . . . . . . . . . . . . . . . . . . . . . . . . . . . . . . . . . . . . . .73. Comparison of terrain attributes with road fill
landslide likelihood..........................................84. Terrain attributes - road fill landslides summary
statistics... . . . . . . . . . . . . . . . . . . . . . . . . . . . . . . . . . . . . . . . . . . . . .85. Comparison of terrain attributes with road cut
landslide likelihood............................................96. Terrain attributes - road cut landslides summary
statistics..........................................................97. Summary of important terrain attributes.......138. Slope morphology and clearcut >500 m2 landslide
density in Coastal British Columbia................14
Figures:1. Study area, southwestern Vancouver Island....32. CHAID tree for >500 m2 clearcut landslide presence
for southwestern Vancouver Island.............103a. CHAID tree for >500 m2 clearcut landslide density,
non-gullied slopes, southwestern VancouverIsland.............................................................11
3b. CHAID tree for >500 m2 clearcut landslide density,gullied slopes, southwestern VancouverIsland..............................................................11
4. CHAID tree for >500 m2 road fill landslide presencefor southwestern Vancouver Island................12
5. CHAID tree for >500 m2 road cut landslide presencefor southwestern Vancouver Island................12

Technical Report TR-015 February 2002 Research Section, Vancouver Forest Region, BCMOF
Research Disciplines: Ecology ~ Geology ~ Geomorphology ~ Hydrology ~ Pedology ~ Silviculture ~ Wildlife
KEY WORDS
landslides, terrain, southwestern Vancouver Island.
AUTHOR INFORMATION
• Terry Rollerson, Senior Geoscientist, Golder Associates Ltd.1462 Broadview Road, Gabriola, B.C., Canada. V0R 1X5;
• Bruce Thomson, Regional Geomorphologist, Ministry ofWater, Air and Land Protection, Lower Mainland Region, 10334152A Street, Surrey, B.C., Canada. V3R 7P8.
ACKNOWLEDGEMENTS
The authors thank Gray Switzer, Mel Zwierink, and Pierre Friele,who ably assisted with the field data collection. Sid Tsang andEric Lott compiled and edited the data. Reviews were gratefullyreceived from Rick Guthrie, Peter Ott, and Doug VanDine.
2
SUMMARY
Terrain attributes are landscape features that can be used to iden-tify hillslopes susceptible to landslides. For analysis, loggedhillslopes were divided into terrain polygons, which are smallareas that have a consistent set of terrain attributes such as slopegradient, surficial material type, and slope morphology. Terrainattribute data was systematically collected in the field in con-junction with post-logging landslide data and analysed to iden-tify those terrain attributes that are useful predictors of post-logging landslides. The method provides quantification of land-slide likelihood � an important improvement over qualitativelandslide likelihood evaluation.
Two measures of landslide likelihood were used in this study.Landslide presence is the presence of one or more landslides withina terrain polygon. This study analysed landslide presence usingonly landslides > 500 m2 in area, as well as the presence oflandslides of any size. Landslide density is the average number oflandslides in a unit area. In this study, only landslides >500 m2
were used to determine landslide density. Three post-logginglandslide types were evaluated: clearcut landslides, road fill land-slides, and road cut landslides. The study used a combination ofunivariate and multivariate statistical procedures.
Clearcut areas in the Klanawa, Gordon, San Juan, and Caycusewatersheds on southwestern Vancouver Island were studied. Atotal of 767 terrain polygons was sampled, representing an ag-gregate area of 3491 ha. The mean polygon area was 4.6 ha,with a standard deviation of 3.7 ha and a range of 0.4 to 27.7hectares. There were 195 clearcut landslides >500 m2, 228 roadfill landslides >500 m2, and 47 road cut landslides >500 m2. Atotal of 122 (16%) of the 767 terrain polygons in the samplepopulation had >500 m2 clearcut landslide presence. Overall, the av-erage >500 m2 landslide density was 0.06 landslides per hectare (ls/ha). Of the 567 terrain polygons in the study area with roads,126 (22%) had >500 m2 road fill landslide presence. Thirty-two (6%)of the 567 terrain polygons with roads had >500 m2 road cutlandslide presence.
Slope gradient strongly affected all types of landslides, with slopes
less than 30° having had much lower landslide likelihood thanslopes steeper than 30°. Clearcut landslide density for slopesless than 30° was 0.02 ls/ha, while slopes steeper than 30° had>500 m2 clearcut landslide densities from 0.05 to 0.12 ls/ha. Simi-larly, less than 15% of samples on slopes <30° had >500 m2 roadfill landslide presence, while 21% to 48% of slopes >30° had >500m2 road fill landslide presence. Road cut landslide presence increasedas well with increasing slope gradient. For slopes less than 35°,less than 5% of the samples had >500 m2 road cut landslide pres-ence. For slopes steeper than 35°, from 12 to 15% of the sampleshad >500 m2 road cut landslide presence.Gullied terrain had higher landslide likelihoods than other typesof slope morphology. Single gullies and dissected terrain (mul-tiple gullies) had >500 m2 clearcut landslide densities of 0.10 � 0.16ls/ha, compared with other slope morphologies that all had >500m2 clearcut landslide densities of 0.05 ls/ha or less. Similarly, >500m2 road fill landslide presence was highest for dissected and singlegully terrain (36 and 34%, respectively), compared with otherslope morphologies that all had >500 m2 road fill landslide presenceless than 20%. Road cut landslides were also highest in dissectedand single gully terrain (both had 12% >500 m2 road fill landslidepresence), while other slope morphologies had >500 m2 road filllandslide presence of 5% or less. Similar results were found forhorizontal curvature, where concave and convex slopes tendedto have higher landslide likelihoods. Concave and complex slopeswere often gullied slopes. As well, gullies that were deeper had agreater landslide likelihood.Slopes located on the Leech River bedrock formation had higherclearcut landslide likelihood than other bedrock formations.The use of terrain attributes is a important part of landslideassessment in Coastal British Columbia. This study providesquantification of landslide likelihood for a valuable forestry area.Since terrain conditions are variable, caution is urged in apply-ing these results to unlogged areas.
1.0 INTRODUCTIONForestry operations in Coastal British Columbia occur across largetracts of land, often with unstable or potentially unstable ter-rain broadly distributed across the landscape. Methods of iden-tifying terrain susceptible to landslides are needed that are accu-rate and yet are rapid enough to be applied to extensive areas.Terrain attributes are features or characteristics of a specific,relatively uniform portion of a slope, called a terrain polygon. Ter-rain attribute studies produce statistically derived post-logginglandslide likelihoods by identifying significant terrain attributesor groups of terrain attributes. Since identification of these ter-rain attributes in the field (and to a certain extent on air photosand topographic maps) is usually easy, the method produces as-sessments of landslide likelihood in a relatively rapid manner.This study examines logged terrain in southwestern VancouverIsland, British Columbia, an area of extensive forestry opera-tions in steep terrain. This study is one of a series of terrainattribute studies that examines forestry-related landslidelikelihood in Coastal British Columbia: Queen Charlotte Islands(Rollerson, 1992); West Coast of Vancouver Island (Rollerson

Technical Report TR-015 February 2002 Research Section, Vancouver Forest Region, BCMOF
Research Disciplines: Ecology ~ Geology ~ Geomorphology ~ Hydrology ~ Pedology ~ Silviculture ~ Wildlife
3
et al, 1998); and Coast Mountains (Rollerson et al, 2001).
The objectives of this study are to:● characterize steep terrain that is susceptible to landslides fol-lowing logging (clearcutting) and associated road building onsouthwestern Vancouver Island.● develop terrain-based stability classifications for southwesternVancouver Island that estimate the landslide likelihood follow-ing logging.
2.0 STUDY AREA
2.1 AREA AND PHYSIOGRAPHY
Data for this study were collected within portions of the KlanawaRiver and Gordon River watersheds, plus smaller samples fromthe Caycuse River watershed and a small southern portion ofthe San Juan River watershed (Figure 1). These areas are locatedon southwestern Vancouver Island and are typical of the terrainwest of Cowichan Lake, from Barkley Sound in the northwest
to Loss Creek in the southeast.
The study area lies within the South Vancouver Island Ranges, aphysiographic region that is part of the northwest to southeasttrending Vancouver Island Range of mountains that forms thecore of Vancouver Island (Holland, 1964). The study area ischaracterized by deeply dissected and rugged terrain. Elevationswithin the study area range from sea level to 1400 m, with majorridge crests at approximately 1100 m above sea level. Valleys arecommonly U-shaped and originate in cirques (Alley and Chatwin,1979). The valley pattern tends to closely follow major joints,faults, and lineations within the underlying bedrock. Erosionalong major lineaments has formed the prominent troughs ofNitinat Lake, Cowichan Lake, San Juan River, and Loss Creek.
2.2 CLIMATE
The study area is vegetated by dense coniferous forest of theCoastal Western Hemlock Biogeoclimatic Zone (Krajina 1969). Theaverage January temperature is 4 to 5 Co; the average July tem-
Figure 1. Study area, southwestern Vancouver Island.

Technical Report TR-015 February 2002 Research Section, Vancouver Forest Region, BCMOF
Research Disciplines: Ecology ~ Geology ~ Geomorphology ~ Hydrology ~ Pedology ~ Silviculture ~ Wildlife
4
peratures range between 13 and 18 Co (Krajina, 1969). This zoneis the wettest in British Columbia, with annual precipitation vary-ing with location between 1650 and 6650 mm (Krajina, 1969).The weather station at Nitinat Lake Fish Hatchery recorded anaverage annual precipitation of 4285 mm from 1982 to 1998.
2.3 BEDROCK GEOLOGY
Southwest Vancouver Island is comprised of distinct assemblagesof geologic formations, or terranes, that have accreted onto thewestern margin of North America. Each terrane is composedof one or more geologic formations, and major fault systemsseparate the terranes. All of the study area north of the SanJuan River is composed of the Wrangellia terrane. South of theSan Juan River is the Pacific Rim terrane. To the south of thePacific Rim terrane, and outside of the study area, is the Cres-cent terrane. The San Juan fault separates Wrangellia from thePacific Rim terrane, and the Leech River fault separates the Pa-cific Rim terrane from the Crescent terrane (Yorath and Nasmith,1995). (Figure 1)
Several bedrock formations are in the Wrangellia terrane. TheIsland Intrusions are quartz diorite to granite intrusions thatcommonly underlie the highest portions of the landscape, andextend as a major block in a northwest�southeast trend acrossthe study area. However, the greater part of the study area northof the San Juan Fault zone is underlain by altered volcanic rocksof the Bonanza Group, composed of andesite, dacite, and rhyo-lite. Exposures of northwest�southeast trending volcanics ofthe Karmutsen Formation are also found in the northern por-tion of the area. Minor exposures of northwest�southeast trend-ing Quatsino Formation limestone are also found in associationwith the Karmutsen and Bonanza suites of rocks. Widespreadfaulting (Muller 1976) has complicated bedrock geology northof the San Juan Fault, and produced areas where the bedrock isstrongly fractured or sheared.
The Pacific Rim terrane is composed of the Leech River forma-tion. The rocks are primarily greywacke, argillite, and schist, withsome chert and volcanic rocks (Mueller, 1976).
2.4 SURFICIAL GEOLOGY
Surficial deposits are generally less than 25,000 years old and arerelated to the Fraser Glaciation (Late Wisconsin) and post-gla-cial geomorphic processes. Relatively thick (>1m) blankets oftill (morainal deposits) are generally restricted to valley bottomsand lower to mid portions of the adjacent slopes. Thin veneersof till are common on upper slopes and ridge tops. Discontinu-ous veneers of colluvium often overlie till on steeper upper andmid slopes. The till matrix is influenced considerably by localbedrock lithology; finer textured rocks such as volcanics andmetamorphics tend to produce a silty till matrix, whereas thecoarser textured granitics produce a sandy till matrix.
Glaciofluvial sediments occur in most major valleys, but are moreextensive along the southern coastal area (Alley and Chatwin,1979). Extensive deposits of glaciolacustrine materials are notcommon, although localized outcrops of silts and clays are foundalong lower valley side slopes in the Klanawa and San Juan val-
leys (Figure 1). Post-glacial fluvial sands and gravels are com-mon along river valley bottoms.
3.0 METHODOLOGY
3.1 SAMPLING DESIGN
A number of representative areas were selected within each ofthe four watersheds in the study area. Within each representa-tive area, all accessible logged areas, ranging in age from six to15 years following logging, were sampled. The lower age limitwas established so that the areas had time to experience a num-ber of large storms after logging, and to give adequate time forroot strength loss to occur. The upper age limit was establishedbecause increasing tree height and crown closure in plantationsolder than 15 years tends to mask local terrain features, includ-ing small landslides, making collection of accurate data difficult.A number of situations were observed where rapidly growingconifers and alders completely masked the presence of land-slides in clearcut areas within 10 to 15 years.
Each selected representative area was mapped at a scale of1:20,000 using the BC Terrain Classification System (Howes andKenk, 1997), and 1:15,000 to 1:20,000 scale air photos. Eachterrain polygon with a slope gradient greater than 20o was vis-ited in the field. For the sake of efficiency, most terrain poly-gons with slopes less than 20o were excluded from the study,because they rarely show evidence of post-logging landslides.
It is known that no two terrain mappers map identical terrainpolygons for a given landscape, or describe an area in exactlythe same manner. Because this study involved several mappers,the terrain mapping approach therefore has introduced someunknown amount of bias or variability. However, bias or vari-ability was limited by providing clear definitions and descrip-tions of the terrain attributes to be mapped, and by having themappers work with a mapping coordinator to ensure a consis-tent approach. During analysis, distinct terrain types weregrouped into a smaller set of terrain categories. Such a consoli-dation of data further reduces the effect of differences in ter-rain polygon delineation and classification.
Over time, additional sampling within the representative areaswill augment the data set derived for this study. Landslide inci-dence will be updated periodically, usually after major stormevents or when new air photos are produced. At any point intime, the data set will slightly under-represent the total numberof post-logging landslides that have occurred in the study area.
3.2 DATA COLLECTION
For each terrain polygon, the following terrain attributes wererecorded in the field and analysed:
● Slope gradient, recorded as maximum, average, and minimumslope gradients for the polygon;● Natural landslides >500 m2 in slope area (absent or present);● Minor natural landslides <500 m2 in slope area (absent or present);● Slope position (four categories);● Slope morphology (five categories);
Technical Report TR-015 February 2002 Research Section, Vancouver Forest Region, BCMOF
Research Disciplines: Ecology ~ Geology ~ Geomorphology ~ Hydrology ~ Pedology ~ Silviculture ~ Wildlife
5
● Terrain category (10 groupings of surficial materials);● Horizontal curvature (four categories);● Soil drainage (four categories);● Slope aspect (divided into octants);● Elevation (divided into five ranges of elevations);● Bedrock formation (five categories);● Bedrock lithology (eight categories);● Bedrock structure (four categories);● Bedrock competence (three categories);● Surficial material depth;● Gully depth.
For each terrain polygon, the following post-logging landslidecharacteristics were recorded:
● The number of landslides initiated within the clearcut areathat were >500 m2 (slope area for all landslide sizes);
● The number of >500 m2 landslides initiated within road fills;
● The number of >500 m2 landslides initiated within or directlyabove road cuts;
● The presence or absence of one or more landslides <500 m2
in clearcut areas. Since smaller landslides were difficult to con-sistently identify, they were not individually enumerated;
● The presence of one or more landslides <500 m2 associatedwith road fills;
● The presence of one or more landslides <500 m2 associatedwith road cuts.
In addition, signs of potential road fill instability such as ten-sion cracks and fill slope settlement were also recorded.
3.3 DATA ANALYSIS
Two specific measures of post-logging landslide likelihood wereused in the analysis: landslide presence and landslide density.
Landslide presence is the presence of the initiation point of one ormore post-logging landslides within a terrain polygon. The analy-sis reports the percentage of samples with landslides present.Landslide presence was evaluated using four criteria:
1. Only landslides >500 m2 were used as the dependent variable.This outcome applies to clearcut landslides, road fill landslides androad cut landslides.
2. For clearcut areas, the presence of landslides of any size was usedas an additional dependent variable.
3. For road fills, the presence of any signs of instability was used as asecond dependent variable. This measure included landslides ofany size, tension cracks, fill slope settlement, or other signs ofpotential road fill instability.
4. For road cuts, the presence of landslides of any size was used as asecond dependent variable.
Landslide density is the average number of landslides within a unitarea. Landslide density considers only landslides >500 m2, sincesmaller landslides were not individually enumerated. For clearcutareas, landslide density was measured as landslides per hectare(ls/ha), based on slope area not planimetric area. Landslide den-sity was not determined for road fill and road cut landslidessince road lengths were not recorded.
This approach resulted in seven landslide likelihoods used inthe analysis:
● Clearcut landslide likelihood -
1. percentage of polygons with >500 m2 clearcut landslide presence;2. >500 m2 clearcut landslide density (ls/ha);3. percentage of polygons with any size of clearcut landslide presence.
● Road fill landslide likelihood -
4. percentage of polygons with >500 m2 road fill landslide presence;
5. percentage of polygons with any road fill instability presence.
● Road cut landslide likelihood -
6. percentage of polygons with >500 m2 road cut landslide presence;
7. percentage of polygons with any road cut landslide presence.
For each terrain attribute, the seven landslide likelihoods weredetermined. Chi-square tests were used to test for significantdifferences in the presence or absence of landslides. The Kruskal-Wallis test was used when testing for significant differences inlandslide density. If the statistical test showed significance, thenat least some of the categories within a terrain attribute are sig-nificantly different from one another, but not necessarily all cat-egories are different. For each test, a significance level of P =0.05 was used.
Analysis of landslide density used weighted samples to producepseudo-replicates. This reduces the bias that results if samplesof unequal size are used to calculate landslide density. Sampleswere weighted by their area, with a unit area of one hectare usedas the nominal sample, and the polygon area rounded to thenearest integer. As an example, a terrain polygon of 3.7 ha wouldbe considered as four samples. The approach is used because itresults in a better estimate of mean landslide density.
A limited multivariate analysis was also carried out. Using CHAID(Chi-squared Automatic Interaction Detector), individual terrainpolygons that have a similar likelihood of post-logging land-slides were grouped into multi-factor terrain categories. CHAIDuses a non-parametric, multivariate procedure known as segmen-tation modeling (Magidson J./SPSS Inc, 1993). The proceduredivides a sample population into two or more distinct groupsbased on the best predictors of a dependent variable. Groupsare further subdivided if CHAID identifies additional signifi-cant variables. Segments defined by the analysis do not overlap.Both dependent and predictor variables are treated as categori-cal variables. The procedure merges categories of a predictorvariable that are not significantly different at each segmentationlevel. The analysis produces a tree diagram that identifies the

Technical Report TR-015 February 2002 Research Section, Vancouver Forest Region, BCMOF
Research Disciplines: Ecology ~ Geology ~ Geomorphology ~ Hydrology ~ Pedology ~ Silviculture ~ Wildlife
most significant variables and presents statistics for each sepa-rate group or segment of the dependent variable. These cat-egories can form the basis of a terrain stability classificationthat estimates the likelihood of landslides occurring after clearcutlogging and associated road building.
4.0 RESULTS
A total of 767 terrain polygons were sampled in southwesternVancouver Island, representing an aggregate area of 3491 ha.The mean polygon area was 4.6 ha, with a standard deviation of3.7 ha and a range of 0.4 to 27.7 hectares. The median polygonsize was 3.5 ha. There were 195 clearcut landslides >500 m2, 228road fill landslides >500 m2, and 47 road cut landslides >500 m2.
The following sections outline the relationships identified be-tween various terrain attributes and clearcut, road fill and roadcut related landslide activity. The reader is reminded that theslopes studied are generally equal to or steeper than 20o, a factorthat has some bearing on the relationships described below. Forexample, slope position rarely if ever shows a significant rela-tionship to landslide activity. This result is an artifact of theexclusion from the sample population of the gentle slopes of-ten found along toe slopes and ridge crests.
Landslide presence provides a general estimate of the probabil-ity of landslide likelihood within a given attribute category; how-ever, it is dependent on polygon size. Polygons with landslideswere significantly larger than polygons without landslides (anaverage of 5.3 ha compared with 4.4 ha).
4.1 UNIVARIATE TERRAIN ATTRIBUTE ANALYSIS
Univariate analysis of the terrain attribute data is used to de-scribe general results and to draw general conclusions. How-ever, there may be confounding factors affecting the results. Asan example, steeper slopes may be associated with a specificterrain type. If the specific terrain type has a high landslide like-lihood, it may actually be a result of steeper slopes, not terraintype. In addition, since the study sampled the available terrainunits, there may be some variable categories that have a limitednumber of samples. Results for categories that have limitedsample numbers should be used cautiously.
4.1.1 CLEARCUT LANDSLIDES (TABLES 1 AND 2)
A total of 122 (16%) of the 767 terrain polygons in the samplepopulation have >500 m2 clearcut landslide presence. Overall, theaverage >500 m2 landslide density is 0.06 ls/ha. If any size of clearcutlandslide presence is considered, then 280 (36%) of the terrainpolygons experienced one or more clearcut landslides, althoughsome were quite small.
There are significant differences in clearcut landslide activity forseveral of the terrain attributes, regardless of whether >500 m2
clearcut landslide presence, >500 m2 landslide density, or any size ofclearcut landslide presence is considered as the post-logging land-slide likelihood measure. Differences in slope gradient, slopemorphology, horizontal curvature, and gully depth are stronglyrelated to clearcut landslide likelihood, as indicated by signifi-cance levels in Table 1.
Slopes with a gradient less than 30° had average >500 m2 land-slide densities of 0.02 ls/ha (Table 2). Slopes with a gradient of31-35° had >500 m2 landslide density of 0.12 ls/ha, and slopessteeper than 40° had 0.09 ls/ha. Slopes steeper than 40° had agreater proportion of terrain types with rock outcrops (78% ofslopes >40° compared with 18% for the entire sample), and thisis likely the reason why the steepest slopes did not have thehighest landslide likelihood.
Slopes with gullies (either single gullies or dissected morphol-ogy) had >500 m2 landslide densities of 0.10 � 0.16 ls/ha, whereasother slope morphologies had 0.05 ls/ha or less. As gully depthincreased, >500 m2 landslide density increased from 0.04 ls/ha to0.18 ls/ha (Table 2). Concave slopes were strongly associatedwith gullies and had higher landslide likelihoods compared withother horizontal curvatures.
Table 1 indicates that slope position, soil drainage, bedrock for-mation, bedrock lithology, bedrock structure, and surficial ma-terial depth show weaker associations with landslide activity.Lower slope polygons had 0.13 ls/ha, compared with 0.04�0.05ls/ha for mid and upper slopes. Rapidly drained soils had some-what higher landslide likelihoods, probably a result of rapidlydrained soils being on steeper slopes. Of the bedrock forma-tions, the Leech River formation had the highest >500 m2 landslidedensity of 0.21 ls/ha, the Quatsino formation had 0.17 ls/ha, theBonanza formation had 0.09 ls/ha, and the other two bedrock for-mations had 0.04 ls/ha or less. The result for the Quatsino forma-tion should be considered tentative since there were only 14 samples.All of the Leech River samples had phyllite lithology. Sheared andmassive bedrock had higher landslide likelihoods than fracturedbedrock structures. Slopes with surficial material depths greater than2.5 m showed the greatest landslide likelihoods.
6
(1) Chi-square test(2) Kruskal-Wallis test(ns: not significant)
Table 1. Comparison of terrain attributes with clearcut land-slide likelihood.
P-value
Terrain Attribute >500 m2 clearcutlandslidepresence1
>500 m2 clearcutlandslidedensity2
Any clearcutlandslidepresence1
Slope gradient <0.001 <0.001 <0.001Natural landslides >500 m2 ns ns nsMinor natural landslides ns 0.002 nsSlope position ns <0.001 0.016Slope morphology <0.001 <0.001 <0.001Horizontal curvature <0.001 <0.001 <0.001Soil drainage ns <0.001 <0.001Slope aspect ns 0.000 nsElevation ns 0.010 nsTerrain category ns <0.001 nsBedrock formation <0.001 <0.001 nsBedrock lithology <0.001 <0.001 nsBedrock structure ns <0.001 0.046Bedrock competence ns ns nsSurficial material depth ns <0.001 0.030Gully depth 0.001 <0.001 <0.001

Technical Report TR-015 February 2002 Research Section, Vancouver Forest Region, BCMOF
Research Disciplines: Ecology ~ Geology ~ Geomorphology ~ Hydrology ~ Pedology ~ Silviculture ~ Wildlife
7
Terrain Attribute Code n >500 m2
clearcutlandslidepresence
(%)
Average>500 m2
clearcutlandslidedensity(#/ha)
Anyclearcutlandslidepresence
(%)
Slope gradient (°°°°)<2021 – 2526 – 3031 – 3536 – 40>40
123456
415215925015646
-69
143224
-0.020.020.050.120.09
-1633375552
Natural landslidesabsentpresent
01
7607
1614
0.060.03
3686
Minor natural landslidesabsentpresent
01
7616
160
0.060.00
3636
Slope positionapexupper slopemid slopelower slope
1234
417953351
-131622
-0.040.050.13
-313755
Slope morphologyuniformbenchydissected (>1 gully)irregularsingle gullies
12356
48325858688
148
288
27
0.050.020.100.010.16
2712731974
Terrain categoryMorainal blankets/veneersMorainal veneersColluvial blankets/veneersColluvial veneersGlaciofluvial & moraine/FG
Rock & rock/colluvialMorainal+colluvial blanketsMorainal+colluvialMorainal+rockColluvial/rock
123456789
10
16013128909
2816
12677
102
179
1119334
25151722
0.070.030.030.060.180.010.120.070.070.07
33304634443231373650
Horizontal curvatureConcaveConvexStraightComplex
1234
24714133841
28129
15
0.110.050.020.03
64192439
Soil drainageRapidlyWellModerately wellImperfectly
1234
154555571
211515-
0.070.050.05
-
513426-
Note: proportion symbols: / indicates dominant/subdominant;+ indicates either component may be dominant or it may beequivalent.
Table 2. Terrain attributes - clearcut landslides summary statistics.
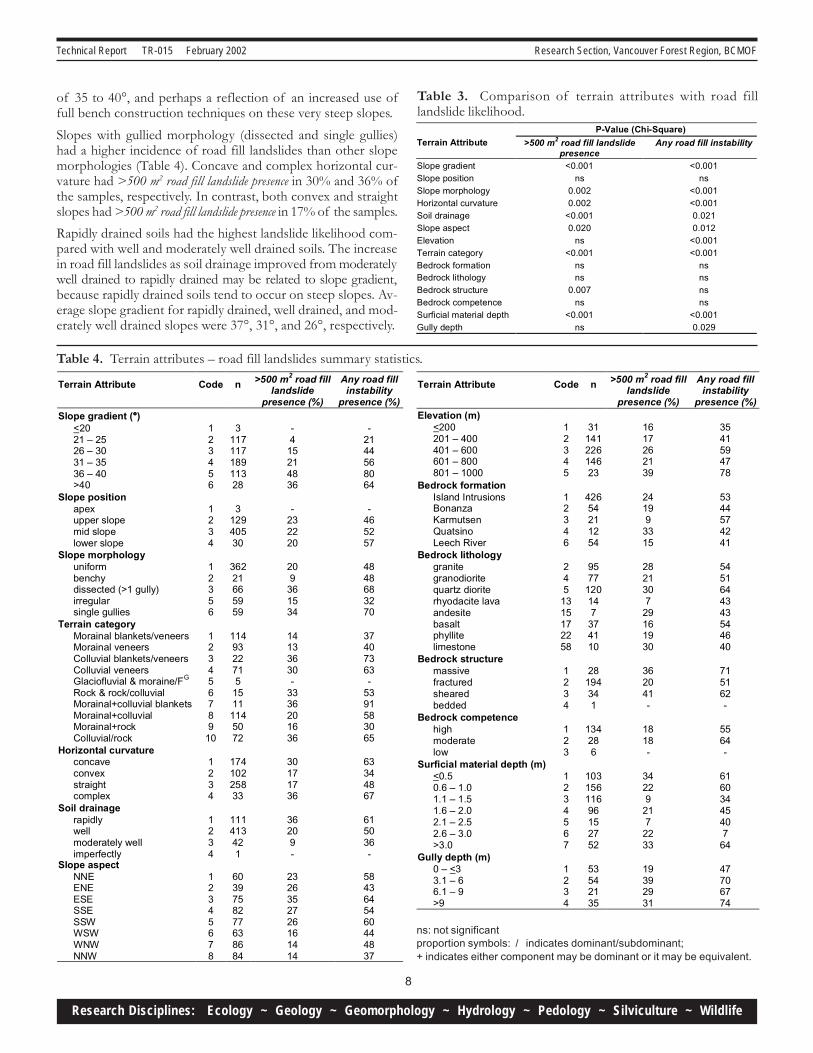
4.1.2 ROAD FILL LANDSLIDES (TABLES 3 AND 4)
Of the 567 terrain polygons in the study area with roads, 126(22%) had >500 m2 road fill landslide presence. If any road fill insta-bility presence is considered then 290 (51%) of the terrain poly-gons had unstable road sections.
Road fill landslides tend to be significantly associated with slopegradient, slope morphology, horizontal curvature, soil drainage,slope aspect, terrain category, and surficial material depth, re-
gardless of the landslide likelihood measure tested (Table 3).
There was an increasing incidence of road fill landslide activityas slope gradient increased. Four percent of the polygons with<26° slope gradient had >500 m2 road fill landslide presence (Table4). In contrast, 48% of the samples with slope gradients be-tween 35 and 40° had >500 m2 road fill landslide presence. Thirty-six percent of the steepest slopes (>40°) had >500 m2 road filllandslide presence � a lower percentage than polygons on slopes
Terrain Attribute Code n >500 m2
clearcutlandslidepresence
(%)
Average>500 m2
clearcutlandslidedensity(#/ha)
Anyclearcutlandslidepresence
(%)
Slope aspectNNEENEESESSESSWWSWWNWNNW
12345678
8455
10811210083
106118
241513129
151921
0.080.060.050.030.030.030.060.10
4042402829404334
Elevation (m)<200201 – 400401 – 600601 – 800801 – 1000
12345
5818830918131
1714171616
0.100.040.060.060.08
4138373235
Bedrock formationIsland IntrusionsBonanzaKarmutsenQuatsinoLeech River
12346
57376261478
1320111439
0.040.090.020.170.21
3540272950
Bedrock lithologygranitegranodioritequartz dioriterhyodacite lavaandesitebasaltphyllitelimestone
2451315172258
11492
175218445812
1511139
2514408
0.030.030.040.020.140.040.210.04
3334384850345217
Bedrock structuremassivefracturedshearedbedded
1234
36256402
171123-
0.060.030.06
-
283550-
Bedrock competencehighmoderatelow
123
192326
111633
0.040.030.05
343733
Surficial material depth (m)
<0.50.6 – 1.01.1 – 1.51.6 – 2.02.1 – 2.52.6 – 3.0>3.0
1234567
130217158126183781
161614176
2921
0.040.050.040.050.010.090.16
37333039224251
Gully depth (m)0 – <33.1 – 66.1 – 9>9
1234
68673856
13212943
0.040.060.140.18
44726687
Technical Report TR-015 February 2002 Research Section, Vancouver Forest Region, BCMOF
Research Disciplines: Ecology ~ Geology ~ Geomorphology ~ Hydrology ~ Pedology ~ Silviculture ~ Wildlife
8
Table 3. Comparison of terrain attributes with road filllandslide likelihood.
ns: not significantproportion symbols: / indicates dominant/subdominant;+ indicates either component may be dominant or it may be equivalent.
Table 4. Terrain attributes � road fill landslides summary statistics.
of 35 to 40°, and perhaps a reflection of an increased use offull bench construction techniques on these very steep slopes.Slopes with gullied morphology (dissected and single gullies)had a higher incidence of road fill landslides than other slopemorphologies (Table 4). Concave and complex horizontal cur-vature had >500 m2 road fill landslide presence in 30% and 36% ofthe samples, respectively. In contrast, both convex and straightslopes had >500 m2 road fill landslide presence in 17% of the samples.Rapidly drained soils had the highest landslide likelihood com-pared with well and moderately well drained soils. The increasein road fill landslides as soil drainage improved from moderatelywell drained to rapidly drained may be related to slope gradient,because rapidly drained soils tend to occur on steep slopes. Av-erage slope gradient for rapidly drained, well drained, and mod-erately well drained slopes were 37°, 31°, and 26°, respectively.
P-Value (Chi-Square)Terrain Attribute >500 m2 road fill landslide
presenceAny road fill instability
Slope gradient <0.001 <0.001Slope position ns nsSlope morphology 0.002 <0.001Horizontal curvature 0.002 <0.001Soil drainage <0.001 0.021Slope aspect 0.020 0.012Elevation ns <0.001Terrain category <0.001 <0.001Bedrock formation ns nsBedrock lithology ns nsBedrock structure 0.007 nsBedrock competence ns nsSurficial material depth <0.001 <0.001Gully depth ns 0.029
Terrain Attribute Code n >500 m2 road filllandslide
presence (%)
Any road fillinstability
presence (%)Slope gradient (°°°°)
<2021 – 2526 – 3031 – 3536 – 40>40
123456
311711718911328
-4
15214836
-2144568064
Slope positionapexupper slopemid slopelower slope
1234
312940530
-232220
-465257
Slope morphologyuniformbenchydissected (>1 gully)irregularsingle gullies
12356
36221665959
209
361534
4848683270
Terrain categoryMorainal blankets/veneersMorainal veneersColluvial blankets/veneersColluvial veneersGlaciofluvial & moraine/FG
Rock & rock/colluvialMorainal+colluvial blanketsMorainal+colluvialMorainal+rockColluvial/rock
123456789
10
1149322715
15111145072
14133630-
3336201636
37407363-
5391583065
Horizontal curvatureconcaveconvexstraightcomplex
1234
17410225833
30171736
63344867
Soil drainagerapidlywellmoderately wellimperfectly
Slope aspectNNEENEESESSESSWWSWWNWNNW
1234
12345678
111413421
6039758277638684
36209-
2326352726161414
615036-
5843645460444837
Terrain Attribute Code n >500 m2 road filllandslide
presence (%)
Any road fillinstability
presence (%)Elevation (m)
<200201 – 400401 – 600601 – 800801 – 1000
12345
3114122614623
1617262139
3541594778
Bedrock formationIsland IntrusionsBonanzaKarmutsenQuatsinoLeech River
12346
42654211254
24199
3315
5344574241
Bedrock lithologygranitegranodioritequartz dioriterhyodacite lavaandesitebasaltphyllitelimestone
245
1315172258
9577
120147
374110
2821307
29161930
5451644343544640
Bedrock structuremassivefracturedshearedbedded
1234
28194341
362041-
715162-
Bedrock competencehighmoderatelow
123
134286
1818-
5564-
Surficial material depth (m)<0.50.6 – 1.01.1 – 1.51.6 – 2.02.1 – 2.52.6 – 3.0>3.0
1234567
10315611696152752
34229
217
2233
61603445407
64Gully depth (m)
0 – <33.1 – 66.1 – 9>9
1234
53542135
19392931
47706774
Technical Report TR-015 February 2002 Research Section, Vancouver Forest Region, BCMOF
Research Disciplines: Ecology ~ Geology ~ Geomorphology ~ Hydrology ~ Pedology ~ Silviculture ~ Wildlife
9
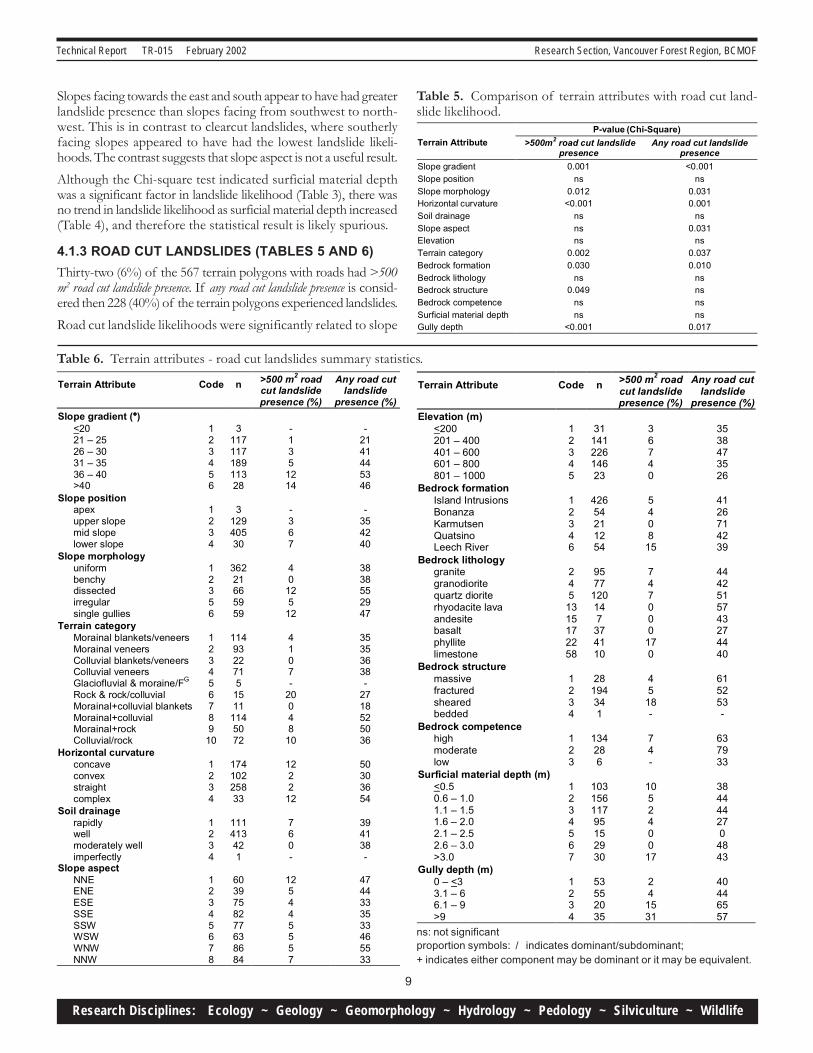
Slopes facing towards the east and south appear to have had greaterlandslide presence than slopes facing from southwest to north-west. This is in contrast to clearcut landslides, where southerlyfacing slopes appeared to have had the lowest landslide likeli-hoods. The contrast suggests that slope aspect is not a useful result.Although the Chi-square test indicated surficial material depthwas a significant factor in landslide likelihood (Table 3), there wasno trend in landslide likelihood as surficial material depth increased(Table 4), and therefore the statistical result is likely spurious.
4.1.3 ROAD CUT LANDSLIDES (TABLES 5 AND 6)
Thirty-two (6%) of the 567 terrain polygons with roads had >500m2 road cut landslide presence. If any road cut landslide presence is consid-ered then 228 (40%) of the terrain polygons experienced landslides.Road cut landslide likelihoods were significantly related to slope
Table 5. Comparison of terrain attributes with road cut land-slide likelihood.
P-value (Chi-Square)Terrain Attribute >500m2 road cut landslide
presenceAny road cut landslide
presence
Slope gradient 0.001 <0.001Slope position ns nsSlope morphology 0.012 0.031Horizontal curvature <0.001 0.001Soil drainage ns nsSlope aspect ns 0.031Elevation ns nsTerrain category 0.002 0.037Bedrock formation 0.030 0.010Bedrock lithology ns nsBedrock structure 0.049 nsBedrock competence ns nsSurficial material depth ns nsGully depth <0.001 0.017
Terrain Attribute Code n >500 m2 roadcut landslidepresence (%)
Any road cutlandslide
presence (%)Slope gradient (°°°°)
<2021 – 2526 – 3031 – 3536 – 40>40
123456
311711718911328
-135
1214
-2141445346
Slope positionapexupper slopemid slopelower slope
1234
312940530
-367
-354240
Slope morphologyuniformbenchydissectedirregularsingle gullies
12356
36221665959
40
125
12
3838552947
Terrain categoryMorainal blankets/veneersMorainal veneersColluvial blankets/veneersColluvial veneersGlaciofluvial & moraine/FG
Rock & rock/colluvialMorainal+colluvial blanketsMorainal+colluvialMorainal+rockColluvial/rock
123456789
10
1149322715
1511
1145072
4107-
20048
10
35353638-
2718525036
Horizontal curvatureconcaveconvexstraightcomplex
1234
17410225833
1222
12
50303654
Soil drainagerapidlywellmoderately wellimperfectly
Slope aspectNNEENEESESSESSWWSWWNWNNW
1234
12345678
111413421
6039758277638684
760-
125445557
394138-
4744333533465533
Table 6. Terrain attributes - road cut landslides summary statistics.
ns: not significantproportion symbols: / indicates dominant/subdominant;+ indicates either component may be dominant or it may be equivalent.
Terrain Attribute Code n >500 m2 roadcut landslidepresence (%)
Any road cutlandslide
presence (%)Elevation (m)
<200201 – 400401 – 600601 – 800801 – 1000
12345
3114122614623
36740
3538473526
Bedrock formationIsland IntrusionsBonanzaKarmutsenQuatsinoLeech River
12346
42654211254
5408
15
4126714239
Bedrock lithologygranitegranodioritequartz dioriterhyodacite lavaandesitebasaltphyllitelimestone
245
1315172258
9577
120147
374110
747000
170
4442515743274440
Bedrock structuremassivefracturedshearedbedded
1234
28194341
45
18-
615253-
Bedrock competencehighmoderatelow
123
134286
74-
637933
Surficial material depth (m)<0.50.6 – 1.01.1 – 1.51.6 – 2.02.1 – 2.52.6 – 3.0>3.0
1234567
10315611795152930
1052400
17
384444270
4843
Gully depth (m)0 – <33.1 – 66.1 – 9>9
1234
53552035
24
1531
40446557

Technical Report TR-015 February 2002 Research Section, Vancouver Forest Region, BCMOF
Research Disciplines: Ecology ~ Geology ~ Geomorphology ~ Hydrology ~ Pedology ~ Silviculture ~ Wildlife
10
gradient, slope morphology, terrain category, horizontal curva-ture, bedrock formation, and gully depth (Table 5).
As with road fill landslide likelihoods, there was a general in-crease in road cut landslide likelihoods as slope gradient increased.Although any road cut landslide presence was less for the steepestslopes compared to slopes from 35 � 40° (as it was for road filllandslide likelihoods), the >500 m2 road cut landslide presence washighest for the steepest slopes (Table 6).
Both single gullies and dissected slopes had 12% of the sampleswith >500 m2 road fill landslide presence, and about 50% of thegullied samples had any road cut landslide presence � the highestroad cut landslide likelihoods of any of the slope morphologies.As gully depth increases, so too did road cut landslide likelihood.
Although in Table 5 the Chi-Square tests show that terrain cat-egory is a significant variable, examination of the landslide like-lihoods in Table 6 shows no clear pattern. The highest >500 m2
road fill landslide presence for a terrain category was 20% of poly-gons that had rock or rock/colluvial terrain, however the anyroad cut landslide presence for rock or rock/colluvial terrain showedthe second lowest likelihood, and there were only 15 suchsamples. Only the moraine+rock terrain category showed botha high >500 m2 road fill landslide presence (8%) and a high any roadcut landslide presence (50%).
Concave and complex slopes had higher road cut landslide like-lihoods compared with convex and straight slopes. This resultwas consistent for clearcut landslides, road fill landslides, androad cut landslides. In both concave and complex slopes, to-
pography concentrates subsurface drainage, and this was likelythe cause of the increased numbers of landslides.
Table 5 indicates that there were weak relationships betweenroad cut landslide likelihoods and the various bedrock attributes.Sheared bedrock samples showed a higher >500 m2 road fill land-slide presence (18%) than massive or fractured bedrock samples (4and 5%, respectively). However sheared bedrock samples didnot show a higher any road cut landslide presence (53%) than mas-sive or fractured bedrock samples (61 and 52%, respectively).
4.2 MULTIVARIATE TERRAIN ATTRIBUTE ANALYSIS
4.2.1 CLEARCUT LANDSLIDES (FIGURES 2 AND 3)
Figure 2 presents the results of a CHAID multivariate analysisof >500 m2 clearcut landslide presence. In Figure 2, the topmost lineshows the dependent variable being analysed � in this case >500m2 clearcut landslide presence. Within the first box �Category 0�shows that 84% of the samples did not have any landslides, and�Category 1� shows that 16% of samples did have landslides.CHAID selected maximum slope angle (gradient) as the mostsignificant predictor of >500 m2 clearcut landslide presence, with aP-value significance of 0.0000 (and a Chi-square value of 54and 2 degrees of freedom). CHAID split the samples into threegroups: slopes from 21 - 33° (5% >500 m2 clearcut landslide pres-ence), slopes from >33 - 40° (15% >500 m2 clearcut landslide pres-ence), and slopes >40° (31% >500 m2 clearcut landslide presence).
Further divisions of each group occurred, with bedrock forma-tion and aspect the next most significant divisions. For rock
Figure 2. CHAID tree for >500 m2 clearcut landslide presence for southwestern Vancouver Island.
Technical Report TR-015 February 2002 Research Section, Vancouver Forest Region, BCMOF
Research Disciplines: Ecology ~ Geology ~ Geomorphology ~ Hydrology ~ Pedology ~ Silviculture ~ Wildlife
11
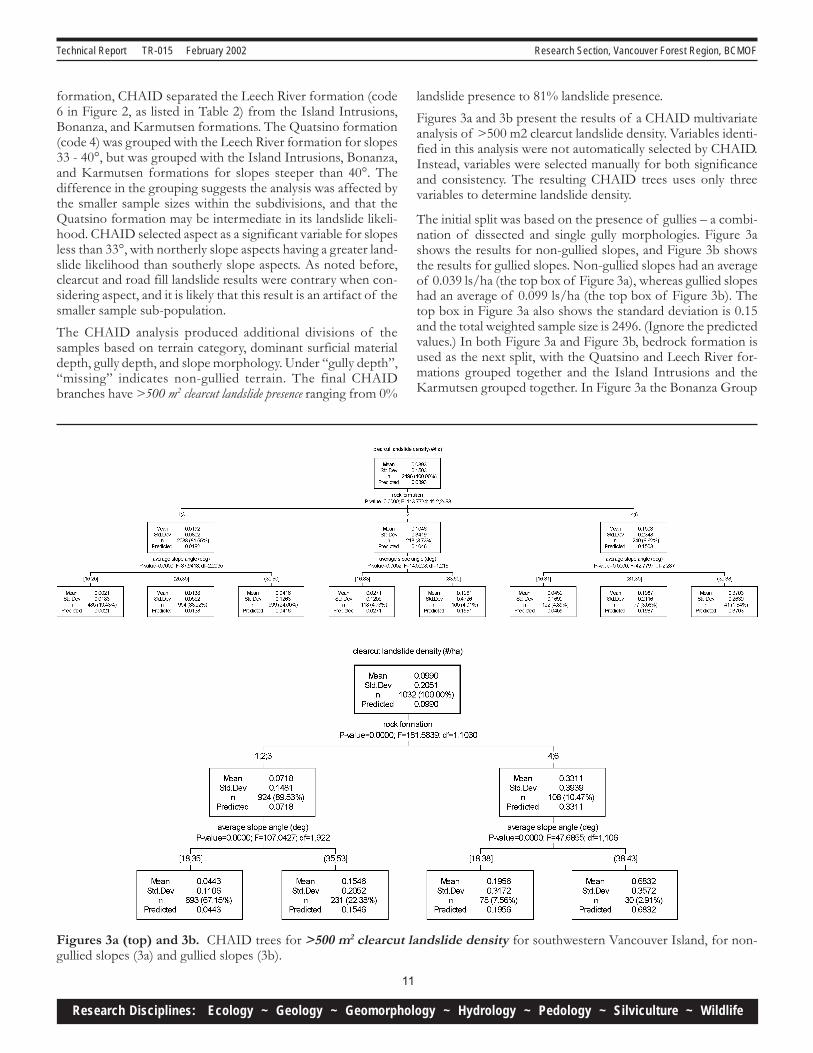
formation, CHAID separated the Leech River formation (code6 in Figure 2, as listed in Table 2) from the Island Intrusions,Bonanza, and Karmutsen formations. The Quatsino formation(code 4) was grouped with the Leech River formation for slopes33 - 40°, but was grouped with the Island Intrusions, Bonanza,and Karmutsen formations for slopes steeper than 40°. Thedifference in the grouping suggests the analysis was affected bythe smaller sample sizes within the subdivisions, and that theQuatsino formation may be intermediate in its landslide likeli-hood. CHAID selected aspect as a significant variable for slopesless than 33°, with northerly slope aspects having a greater land-slide likelihood than southerly slope aspects. As noted before,clearcut and road fill landslide results were contrary when con-sidering aspect, and it is likely that this result is an artifact of thesmaller sample sub-population.The CHAID analysis produced additional divisions of thesamples based on terrain category, dominant surficial materialdepth, gully depth, and slope morphology. Under �gully depth�,�missing� indicates non-gullied terrain. The final CHAIDbranches have >500 m2 clearcut landslide presence ranging from 0%
landslide presence to 81% landslide presence.Figures 3a and 3b present the results of a CHAID multivariateanalysis of >500 m2 clearcut landslide density. Variables identi-fied in this analysis were not automatically selected by CHAID.Instead, variables were selected manually for both significanceand consistency. The resulting CHAID trees uses only threevariables to determine landslide density.
The initial split was based on the presence of gullies � a combi-nation of dissected and single gully morphologies. Figure 3ashows the results for non-gullied slopes, and Figure 3b showsthe results for gullied slopes. Non-gullied slopes had an averageof 0.039 ls/ha (the top box of Figure 3a), whereas gullied slopeshad an average of 0.099 ls/ha (the top box of Figure 3b). Thetop box in Figure 3a also shows the standard deviation is 0.15and the total weighted sample size is 2496. (Ignore the predictedvalues.) In both Figure 3a and Figure 3b, bedrock formation isused as the next split, with the Quatsino and Leech River for-mations grouped together and the Island Intrusions and theKarmutsen grouped together. In Figure 3a the Bonanza Group
Figures 3a (top) and 3b. CHAID trees for >500 m2 clearcut landslide density for southwestern Vancouver Island, for non-gullied slopes (3a) and gullied slopes (3b).
Technical Report TR-015 February 2002 Research Section, Vancouver Forest Region, BCMOF
Research Disciplines: Ecology ~ Geology ~ Geomorphology ~ Hydrology ~ Pedology ~ Silviculture ~ Wildlife
12
Figure 4. CHAID tree for >500 m2 road fill landslide presence for southwestern Vancouver Island.
Cat. % n0 94.36 5351 5.64 32
Total (100.00) 567
road cut landslides >500 sq m present
Cat. % n0 98.61 711 1.39 1
Total (12.70) 72
gully depth (m)P-value=0.0000; Chi-square=29.6328; df=2
[1,4]
Cat. % n0 82.42 751 17.58 16
Total (16.05) 91
(4,30]
Cat. % n0 96.29 3891 3.71 15
Total (71.25) 404
<missing>
Cat. % n0 98.04 3001 1.96 6
Total (53.97) 306
average slope angle (deg)P-value=0.0279; Chi-square=10.8320; df=1
[16,35]
Cat. % n0 90.82 891 9.18 9
Total (17.28) 98
(35,50]
Figure 5. CHAID tree for >500 m2 road cut landslide presence for southwestern Vancouver Island.
Technical Report TR-015 February 2002 Research Section, Vancouver Forest Region, BCMOF
Research Disciplines: Ecology ~ Geology ~ Geomorphology ~ Hydrology ~ Pedology ~ Silviculture ~ Wildlife
13
is separate, whereas in Figure 3b the Bonanza Group is com-bined with the Island Intrusions and the Karmutsen formation.Final splits in Figures 3a and 3b all used average slope gradient,with most splits at about 26°, and 33° or 35°. Landslide densi-ties ranged from 0.002 - 0.68 ls/ha. Although the Quatsino for-mation was grouped in both cases with the Leech River forma-tion, caution is urged given the low sample numbers for theQuatsino formation.
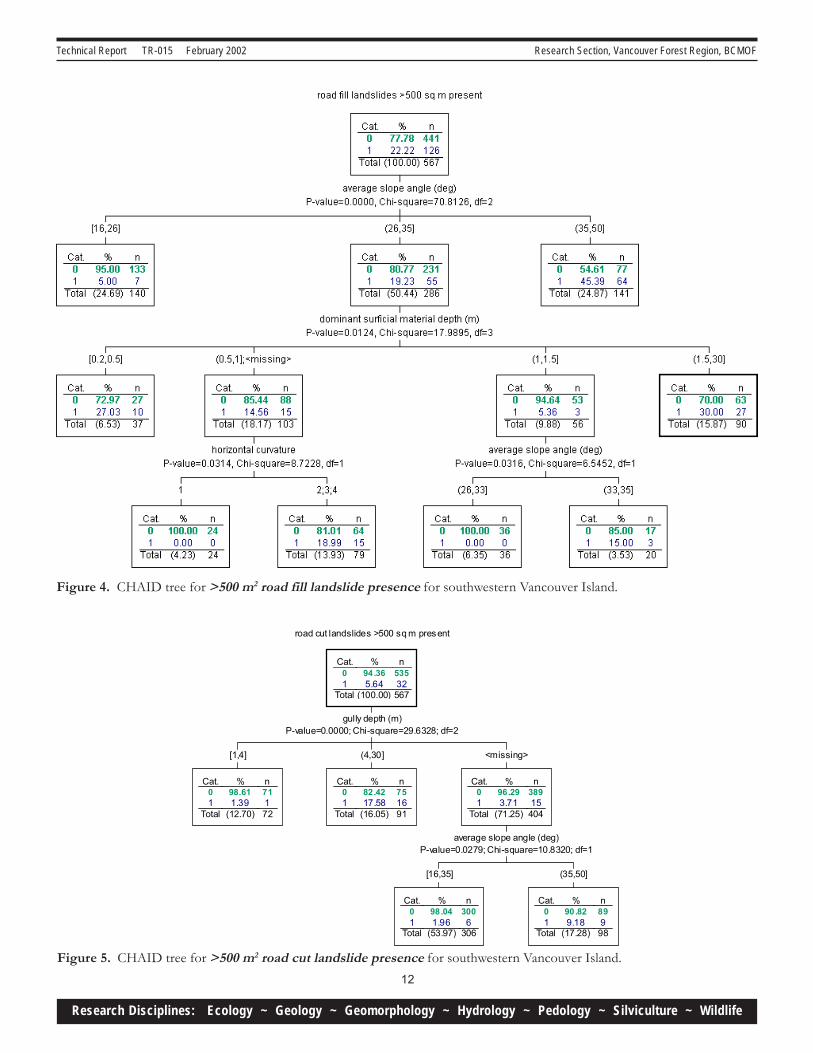
4.2.2 ROAD FILL LANDSLIDES (FIGURE 4)
Figure 4 shows the CHAID analysis for >500 m2 road fill landslidepresence. CHAID grouped polygons initially on average polygonslope gradient. Five percent of polygons with a slope gradientof <26° had >500 m2 road fill landslides, 19% of polygons withslopes from 26 to 35° had >500 m2 road fill landslides, and 45% ofpolygons with slopes >35° had >500 m2 road fill landslides.
CHAID used surficial material depth to subdivide the polygonswith slope gradients from 26°to 35°. The percentage of poly-gons with landslides decreased as surficial material depth in-creased to 1.5m, but then increased for the deeper surficial ma-terials. Slope curvature and slope gradient were used to furthersubdivide some groupings of material depth. The analysis resultedin >500 m2 road fill landslide presence ranging from 0% to 45%.
4.2.3 ROAD CUT LANDSLIDES (FIGURE 5)
Figure 5 shows the CHAID analysis for >500 m2 road cut land-slide presence. CHAID identified only two variables that were sig-nificant for >500 m2 road cut landslide presence � gully depth and
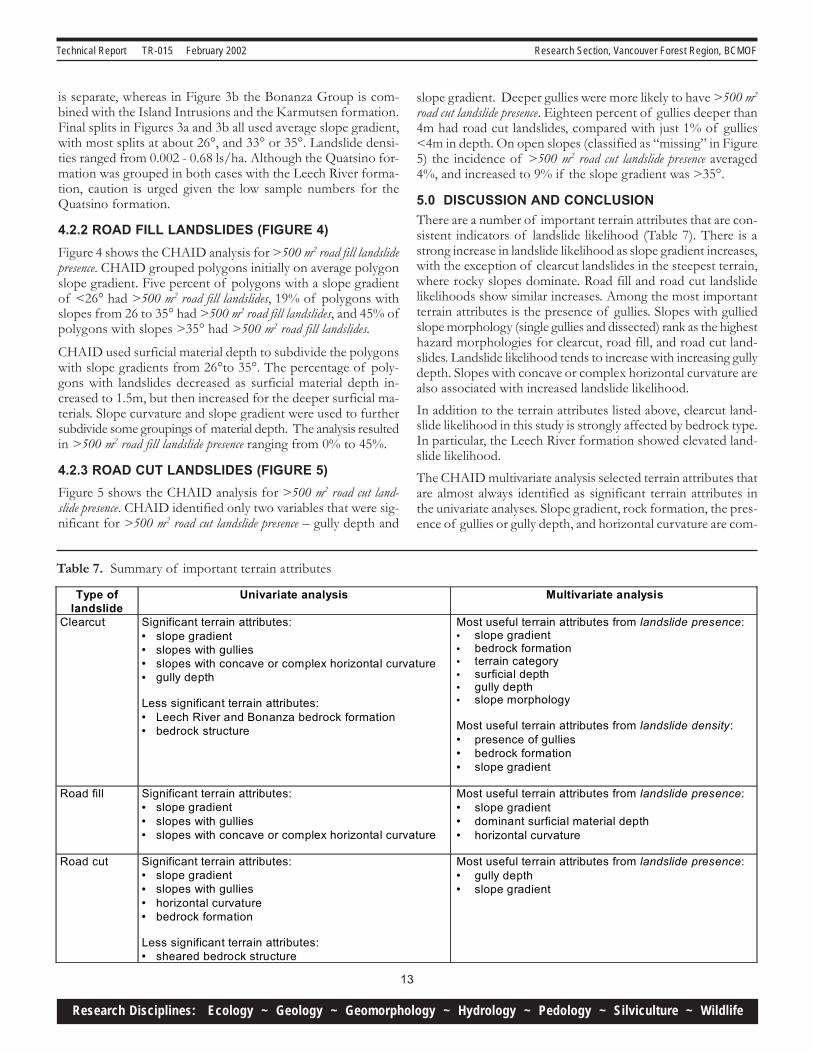
Table 7. Summary of important terrain attributes
slope gradient. Deeper gullies were more likely to have >500 m2
road cut landslide presence. Eighteen percent of gullies deeper than4m had road cut landslides, compared with just 1% of gullies<4m in depth. On open slopes (classified as �missing� in Figure5) the incidence of >500 m2 road cut landslide presence averaged4%, and increased to 9% if the slope gradient was >35°.
5.0 DISCUSSION AND CONCLUSIONThere are a number of important terrain attributes that are con-sistent indicators of landslide likelihood (Table 7). There is astrong increase in landslide likelihood as slope gradient increases,with the exception of clearcut landslides in the steepest terrain,where rocky slopes dominate. Road fill and road cut landslidelikelihoods show similar increases. Among the most importantterrain attributes is the presence of gullies. Slopes with gulliedslope morphology (single gullies and dissected) rank as the highesthazard morphologies for clearcut, road fill, and road cut land-slides. Landslide likelihood tends to increase with increasing gullydepth. Slopes with concave or complex horizontal curvature arealso associated with increased landslide likelihood.In addition to the terrain attributes listed above, clearcut land-slide likelihood in this study is strongly affected by bedrock type.In particular, the Leech River formation showed elevated land-slide likelihood.The CHAID multivariate analysis selected terrain attributes thatare almost always identified as significant terrain attributes inthe univariate analyses. Slope gradient, rock formation, the pres-ence of gullies or gully depth, and horizontal curvature are com-
Type oflandslide
Univariate analysis Multivariate analysis
Clearcut Significant terrain attributes:• slope gradient• slopes with gullies• slopes with concave or complex horizontal curvature• gully depth
Less significant terrain attributes:• Leech River and Bonanza bedrock formation• bedrock structure
Most useful terrain attributes from landslide presence:• slope gradient• bedrock formation• terrain category• surficial depth• gully depth• slope morphology
Most useful terrain attributes from landslide density:• presence of gullies• bedrock formation• slope gradient
Road fill Significant terrain attributes:• slope gradient• slopes with gullies• slopes with concave or complex horizontal curvature
Most useful terrain attributes from landslide presence:• slope gradient• dominant surficial material depth• horizontal curvature
Road cut Significant terrain attributes:• slope gradient• slopes with gullies• horizontal curvature• bedrock formation
Less significant terrain attributes:• sheared bedrock structure
Most useful terrain attributes from landslide presence:• gully depth• slope gradient

Technical Report TR-015 February 2002 Research Section, Vancouver Forest Region, BCMOF
Research Disciplines: Ecology ~ Geology ~ Geomorphology ~ Hydrology ~ Pedology ~ Silviculture ~ Wildlife
14
mon terrain attributes selected by CHAID for landslide likeli-hood. CHAID selects slope gradient as the most significant ter-rain attribute for both >500 m2 clearcut landslide presence (Figure 2)and >500 m2 road fill landslide presence (Figure 4). As CHAID di-vides the sample population into smaller groups, it becomes sen-sitive to the smaller sample sizes it analyses. As a result, thesplits on the lowest branches of the CHAID tree should beviewed with some caution.
The assessment of all signs of instability associated with roadfills may provide a better long-term estimate of the likelihoodof larger road fill landslides. Due to the nature of some earlierlogging road construction � such as fills supported by slowlydeteriorating buried logs and stumps � more large landslides arelikely to occur as these roads grow older.
Overall landslide likelihood results from this study show thatsouthwest Vancouver Island has a similar post-logging landslidelikelihood to other areas of the west coast of Vancouver Island(Rollerson et al, 1998). Seventeen percent of the samples fromthe west coast of Vancouver Island study (Rollerson et al, 1998)had clearcut >500 m2 landslide presence, while in southwesternVancouver Island, 16% of the samples had clearcut >500 m2 land-slide presence. Clearcut landslides were more likely in the QueenCharlotte Islands, where 30% of the samples with slopes steeperthan 20° had had clearcut >500 m2 landslide presence (Rollerson,1992). However, clearcut >500 m2 landslide presence was much lowerin the Coast Mountains, where less than 3% of the samples hadlandslides (Rollerson et al, 2001).
The results from this study are similar to results from other loca-tions within this study series. Slopes steeper than 30° always havehigher landslide likelihoods than slopes <30°. As in this study,gullies almost always rank as the most unstable slope morphol-ogy in other Coastal B.C. terrain attribute studies (Table 8).
Road fill landslide likelihood in southwestern Vancouver Islandwas elevated compared with other areas in Coastal BritishColumbia. Fifteen percent of the samples in the Queen CharlotteIslands had road fill landslides >500 m2 road fill landslide presence,while less than 4% of the Coast Mountain samples had >500m2 road fill landslide presence. Road fill landslide data is not avail-able for the west coast of Vancouver Island. In southwestern
Vancouver Island, 22 % of the samples had >500 m2 road filllandslide presence.
No obvious differences in terrain attributes were evident to ex-plain why road fill landslide likelihood was greater in southwest-ern Vancouver Island than in the Queen Charlotte Islands. TheQueen Charlotte Islands study had greater clearcut landslide like-lihoods than southwestern Vancouver Island, and the QueenCharlotte Islands are generally regarded as more unstable. It ispossible that the differences in road fill landslide likelihoods werea result of different road construction practices.
Readers must use the results of this study carefully. The resultsare based on an apparently large sample of terrain polygons insouthwestern Vancouver Island; however, this is actually a rela-tively small sample size, since the permutations of terrain at-tributes, such as bedrock, terrain categories, slope morphology,and slope gradient result in an extremely diverse range of slopeconditions. It should not be assumed that all terrain types arerepresented in this study. As well, since the study area was rela-tively small it should not be immediately assumed that the re-sults of this study necessarily apply to other areas within south-western Vancouver Island.
Although the results of this study need to be carefully used, theconsistent identification of specific terrain attributes as indica-tors of increased landslide likelihood, in this and other terrainattribute studies, shows that using terrain attributes to deter-mine landslide likelihood is useful. While terrain attributes suchas slope angle are well recognized in deterministic slope stabilitymodels, other terrain attributes such as slope morphology orsoil drainage are either not recognized in deterministic modelsor are difficult to incorporate. In addition, deterministic modelsrequire intensive data input for accurate prediction of slope sta-bility, a prohibitive requirement when assessing large tracts of land.
The terrain attribute statistical approach provides quantificationof landslide likelihood, an improvement over qualitative assess-ments commonly used in forestry. The large tracts of land thatmust be assessed in forestry operations require methods thatprovide rapid yet accurate assessment of extensive areas. Theuse of terrain attributes provides a valuable approach for as-sessing landslide likelihood.
Clearcut >500 m2 landslide density (ls/ha)Study areaSingle gullies and dissectedslope morphology
All other slopemorphologies
Queen Charlotte Islands1 0.29 – 0.51 0.02 – 0.18West Coast Vancouver Island2 0.13 – 0.18 0.00 – 0.06Coast Mountains3 0.00 – 0.02 0.00 – 0.063
Southwestern Vancouver Island4 0.10 – 0.164 0.02 – 0.06
Table 8. Slope morphology and clearcut >500 m2 landslide density in Coastal British Columbia
1) Rollerson, 19922) Rollerson et al, 19983) Rollerson et al, 2001. Only benchy slope morphology ranked higher than gullied slope morphology, and it had only 11 samples.4) Note that the southwestern Vancouver Island study used a weighted sample to derive landslide densities, while the otherstudies did not. The weighted samples result in slightly different average landslide densities.
Technical Report TR-015 February 2002 Research Section, Vancouver Forest Region, BCMOF
Research Disciplines: Ecology ~ Geology ~ Geomorphology ~ Hydrology ~ Pedology ~ Silviculture ~ Wildlife
15
REFERENCES
Alley. N. F. and Chatwin S. C. 1979. Late Pleistocene historyand geomorphology, southwestern Vancouver Island, Brit-ish Columbia. Canadian Journal of Earth Sciences. 16 pp.1645-1657.
Holland, S.S. 1964. Landforms of British Columbia, a Physi-ographic Outline. Bulletin 48, British Columbia Mines andPetroleum Resources, Victoria, B.C., Canada. 138 p.
Howes, D.E. and Kenk, E. 1997. Terrain Classification Systemfor British Columbia (Version 2). Ministry of Environment,Ministry of Crown Lands, Victoria, B.C., Canada., 102 p.
Krajina, V.J. 1969. Ecology of Western North America Vol. 2,No. 1. pp. 1 � 147. Department of Botany, University ofBritish Columbia.
Magidson, J./SPSS Inc. 1993. SPSS for Windows CHAIDRelease 6.0. SPSS Inc., 444 North Michigan Avenue,Chicago, Illinois, USA 60611.
Muller, J.E. 1976. Cape Flattery map-area (92C), BritishColumbia. Report of Activities, Part A. Geological Surveyof Canada, Paper 76-1A, pp. 287-294.
Rollerson, T. (1992). Relationships between landscape attributesand landslide frequencies after logging - Skidegate Plateau,Queen Charlotte Islands. Land Management Report No. 76.Ministry of Forests, Victoria, B.C., Canada. 11 p.
Rollerson, T., Thomson, B and Millard, T.H. 1998. Post-LoggingTerrain Stability in Clayoquot Sound and Barkley Sound. InProceedings of the 12th Annual Vancouver GeotechnicalSociety Symposium on Site Characterization. VancouverGeotechnical Society, Vancouver, B.C. 13 p.
Rollerson, T., T. Millard, C. Jones, K. Trainor, and B. Thomson.2001. Predicting Post-Logging Landslide Activity UsingTerrain Attributes: Coast Mountains, British Columbia.Vancouver Forest Region, Ministry of Forests TechnicalReport 11. Nanaimo, B.C. 20 p.
Yorath, C.J. and Nasmith, H.W. 1995. The Geology of SouthernVancouver Island: A Field Guide. Orca Book Publishers,Victoria, B.C., Canada. 172 p.