TECHNICAL REPORT - TU Wien
11
Institut für Computergraphik und Algorithmen Technische Universität Wien Karlsplatz 13/186/2 A-1040 Wien AUSTRIA Tel: +43 (1) 58801-18601 Fax: +43 (1) 58801-18698 Institute of Computer Graphics and Algorithms Vienna University of Technology email: [email protected] other services: http://www.cg.tuwien.ac.at/ ftp://ftp.cg.tuwien.ac.at/ TECHNICAL REPORT Smart Visibility in Visualization Ivan Viola and Meister E. Gröller Institute of Computer Graphics and Algorithms, Vienna University of Technology, Austria {viola | meister}@cg.tuwien.ac.at TR-186-2-05-06 August 2005
Transcript of TECHNICAL REPORT - TU Wien
Institut für Computergraphik undAlgorithmen
Technische Universität WienKarlsplatz 13/186/2
A-1040 WienAUSTRIA
Tel: +43 (1) 58801-18601Fax: +43 (1) 58801-18698
Institute of Computer Graphics andAlgorithms
Vienna University of Technologyemail:
other services:http://www.cg.tuwien.ac.at/ftp://ftp.cg.tuwien.ac.at/
TECHNICAL REPORT
Smart Visibility in Visualization
Ivan Viola and Meister E. GröllerInstitute of Computer Graphics and Algorithms, Vienna University of Technology, Austria
{viola | meister}@cg.tuwien.ac.at
TR-186-2-05-06August 2005

Smart Visibility in Visualization
Ivan Viola and Meister E. GröllerInstitute of Computer Graphics and Algorithms, Vienna University of Technology, Austria
{viola | meister}@cg.tuwien.ac.at
August 25, 2005
Abstract
In this paper we discuss expressive visualization tech-niques that smartly uncover the most important infor-mation in order to maximize the visual information ofthe underlying data. This is achieved through dynamicchange in visual representations, through deformations,or through changing the spatial position of parts of thedata. Such techniques originate from technical illustra-tion and are called cut-away views, ghosted views, andexploded views. These illustrative techniques unveil themost important visual information by a high level of ab-straction. The change in visual representation or spatialposition is done in a way that is easily perceivable andthe overall visual harmony is preserved.
1 Introduction
Illustration has always been an important visual com-munication medium among humans. The origin of illus-tration can be found in the Paleolithic period (30000 and10000 B.C.) The cave paintings from this period displaymostly large wild animals and tracings of human hands.Drawings of humans are rare and are usually schematicrather than the more naturalistic drawings of animals.Hierogyphs as the visual language developed in ancientEgypt (3200 B.C. to 30 B.C.), depicted religious, polit-ical, and daily life. The line is the most important ele-ment in Egyptian paintings. All paintings are borderedby black lines. It is generally accepted that Egyptiansdid not use perspective, they used just hierarchic per-spective in their early profile drawings. Through over-lapping they tried to give the idea of depth. Some sceneswith sets of overlapping people depict workers involvedin the seeding of the fields.Like the drawings of the ancient Egyptians, the archi-tectural drawings of the early Greeks (1100 B.C. to 100B.C.) also lacked perspective. To imitate this kind ofart in architecture, the ancient Greek architects even
designed their buildings to visually counterbalance theviewer’s intuitive understanding of perspective. A typ-ical example of this is the Parthenon in Athens, whichwas situated at the top of the Acropolis compound. TheParthenon could only be approached from one accesspoint. The rear of the structure is bigger and widerthan the front, and the side columns increase in massfrom front to rear. This construction technique gave theParthenon an appearance through which it approximatedthe flat or axonometric views the Greeks were used tosee in their art.The principle of perspective was defined in the year1000 A.D. by the Arabian mathematician and philoso-pher Alhazen [Oma77]. He explained in his work thatlight projects conically into the eye. A method for pro-jecting a scene onto an image was developed approxi-mately 300 years later during the Renaissance period.In this period the beginning of descriptive technical il-lustrations took place through the work of artists suchas Leonardo da Vinci (1452-1519). In da Vinci’s per-sonality artistic abilities were combined with a scientificmind, which enabled a merging of visual art with inven-tion. The creation of spatial illusions was another majorachievement of this period. The evolution of what iscalled illusionistic perspective was taking place.The flourishing of technical illustrations was a directimplication of the industrial revolution. Mass produc-tion and outsourcing created the need to adopt conven-tions and standards in technical illustrations that wereuniversally understood. By the mid 1900s both artisticand technical illustrators had a predictable methodologyavailable for illustrating objects and environments morerealistically. Illustrative techniques are often designedin a way that even a person with no technical under-standing clearly understands the piece of art. The use ofvarying line widths to emphasize mass, proximity, andscale helped to make a simple line drawing more under-standable to the lay person. Cross hatching, stippling,and other low abstraction techniques gave greater depthand dimension to the subject matter. Technical illustra-
1
2 2 SMART VISIBILITY
(a) (b) (c) (d)
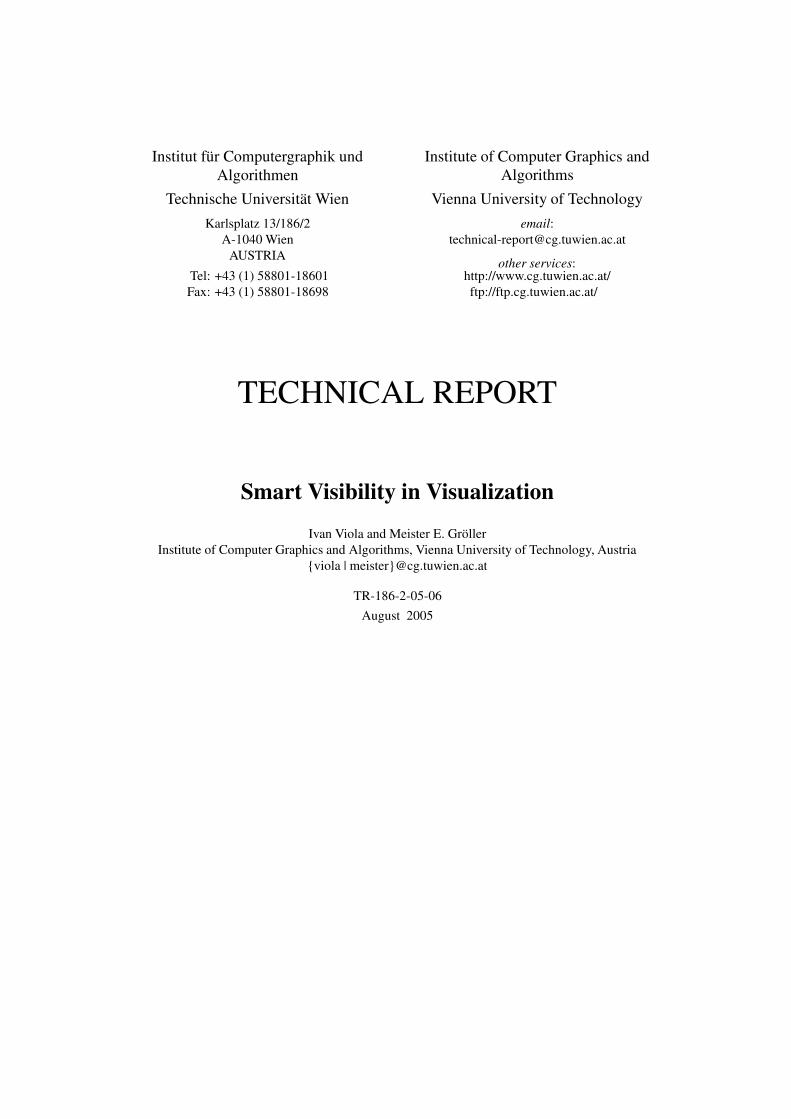
Figure 1: Examples of smart visibility visualizations: cut-away view visualization of complex dynamicalsystems [LMG97] (a), volumetric splitting [IDSC04] (b), browsing in the features through leafer deforma-tion [MTB03] (c), and cut-away view visualization of peripheral arteries [SvC∗04] (d).
(a) (b) (c) (d)
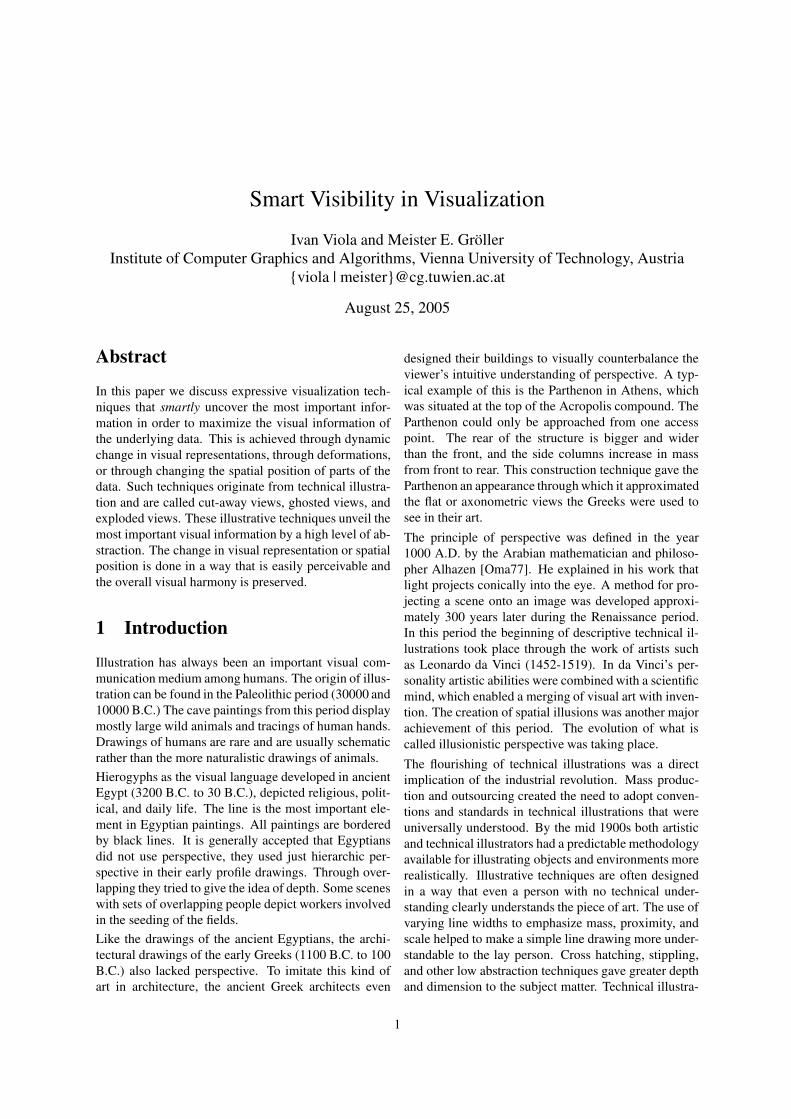
Figure 2: Different types of hand crafted expressive illustrations: cut-away view (a), ghosted view (b), sectionview (c), and exploded view (d). Technical illustrations are courtesy of Kevin Hulsey Illustration, Inc [Hul05].
tions were further advanced during the photorealistic artmovement around 1960. Photorealists were often work-ing with photographic slide projections onto canvases.The style is very accurate, with an emphasis on detailsand often simulates glossy effects such as reflections inspecular surfaces.
By merging technical illustration and photorealism, thetechnical illustrator could now convey highly complextechnical information to someone with little understand-ing of mechanics or drafting. To further increase theexpressivity of the illustrations, high level abstractiontechniques such as cut-away views or exploded viewshave been established.
The aim of illustration is to generate expressive imagesthat effectively convey certain information via the visualchannel to the human observer. Additionally, illustra-tors and visual artists in general create images that fol-low principles of visual harmony such as color combi-
nations, scene composition, contrast, dynamics or otheraesthetical aspects. Breaking some of these principlesmay evoke misunderstanding and confusion. Thus, notonly the expressivity but also the overall visual harmonyand aesthetics play a very important role in the illustra-tion. In the next sections we will address high level ab-straction techniques and adopted expressive visualiza-tion techniques in more detail.
2 Smart VisibilityA typical problem in the visualization of three-dimensional or higher-dimensional data is that the mostinteresting features are not easily perceivable, becausethey are occluded by other, less important features. Tra-ditional visualization techniques classify the visual rep-resentation of features independently from the view-point. The global setting limits viewpoint positions and
3.1 Importance-Driven Feature Enhancement 3
viewing angles to a range, where the important struc-tures are not occluded by other objects.An effective way to visualize three-dimensional dataand resolve the occlusion of the most prominent infor-mation is to take approaches used in technical and med-ical illustrations [GMS∗02, Hod03]. Illustration chal-lenges are very similar in these cases. Illustration tech-niques such as cut-away views, ghosted views, or ex-ploded views effectively uncover the most importantinformation. This is achieved by changing the levelof visual abstraction or modifying the spatial arrange-ment of features. Figure 2 shows examples of expres-sive illustrations that enable to see interesting struc-tures. Further excellent illustrations featuring expres-sive techniques can be found on the referenced web-sites [How05, Hul05].Smart visibility visualizations are implementing highlevel abstraction techniques from illustration which aregenerated automatically. They even allow direct manip-ulation with the data. The underlying illustration tech-niques have been developed strongly considering aes-thetical aspects. Therefore smart visibility visualiza-tions implement aesthetics principles indirectly and asthey are generated algorithmically they are strongly rel-evant for computational aesthetics.
3 Cut-Away Views, Section Views,and Ghosted Views
The popularity of cut-away and ghosted views is demon-strated by the fact that they can be found in all bookson technical or medical illustrations [GMS∗02, Hod03].An automatic generation of cut-away and ghosted viewsfor polygonal data was introduced by Feiner and Selig-mann [FS92]. They propose a family of algorithmsthat automatically identify potentially obscuring objectsand display them in a ghosted or cut-away view. Theproposed algorithms exploit z-buffer rendering, there-fore they are suitable for real-time interaction achievedby hardware acceleration. Interactive semi-transparentviews, section views, and cut-away views for polygo-nal data have been recently revised by Diepstraten etal. [DWE02, DWE03]. Semi-transparent views unveilinteresting objects obscured by other context informa-tion by increasing the transparency of the context. Diep-straten et al. propose to adhere to an effective set of rulesfor the automatic generation of the discussed illustrativetechniques. For semi-transparent illustrative views thefollowing three rules should be taken into consideration:
• faces of transparent objects never shine through
• objects occluded by two transparent objects do notshine through
• transparency falls-off close to the edges of trans-parent objects
For section views and cut-away views they propose tofollow seven other rules:
• inside and outside objects have to be distinguishedfrom each other
• a section view is represented by the intersection oftwo half spaces
• the cut-out of a section view is aligned to the mainaxis of the outside object
• an optional jittering mechanism is useful for cut-outs
• a mechanism to make the walls visible is needed
• cut-outs consist of a single hole in the outside ob-ject
• interior objects should be visible from any givenviewing angle
The mentioned algorithms and rules for cut-away views,section views, and ghosted views have been applied topolygonal data and are generally applicable in computergraphics. For an arbitrary clipping of volumetric dataWeiskopf et al. [WEE03] propose a number of effectivetechniques to increase performance and visual quality.The implementation of clipping operations is mappedto commodity graphics hardware to achieve interactiveframerates. Additionally to clipping all rendering com-putations are performed on the graphics hardware. Per-fragment operations estimate on-the-fly the visibility ac-cording to the clipping geometry and adjust the shadingin areas where clipping occurs. In the following Sec-tions 3.1 and 3.2 we focus more on visualization relatedtasks. First we will discuss an approach for automaticcut-away and ghosted views out of scientific volumetricdata [VKG04, VKG05]. This technique employs addi-tional information about the importance of a particularfeature. Afterwards we will show the potential of suchexpressive views on a set of applications.
3.1 Importance-Driven Feature Enhance-ment
Traditionally features within the volume dataset areclassified by optical properties like color and opacity.
4 3 CUT-AWAY VIEWS, SECTION VIEWS, AND GHOSTED VIEWS
representation
0importance
max
dense
representation
0importance
max
dense
0importance
max
dense
0.1
0.70.1 0.7
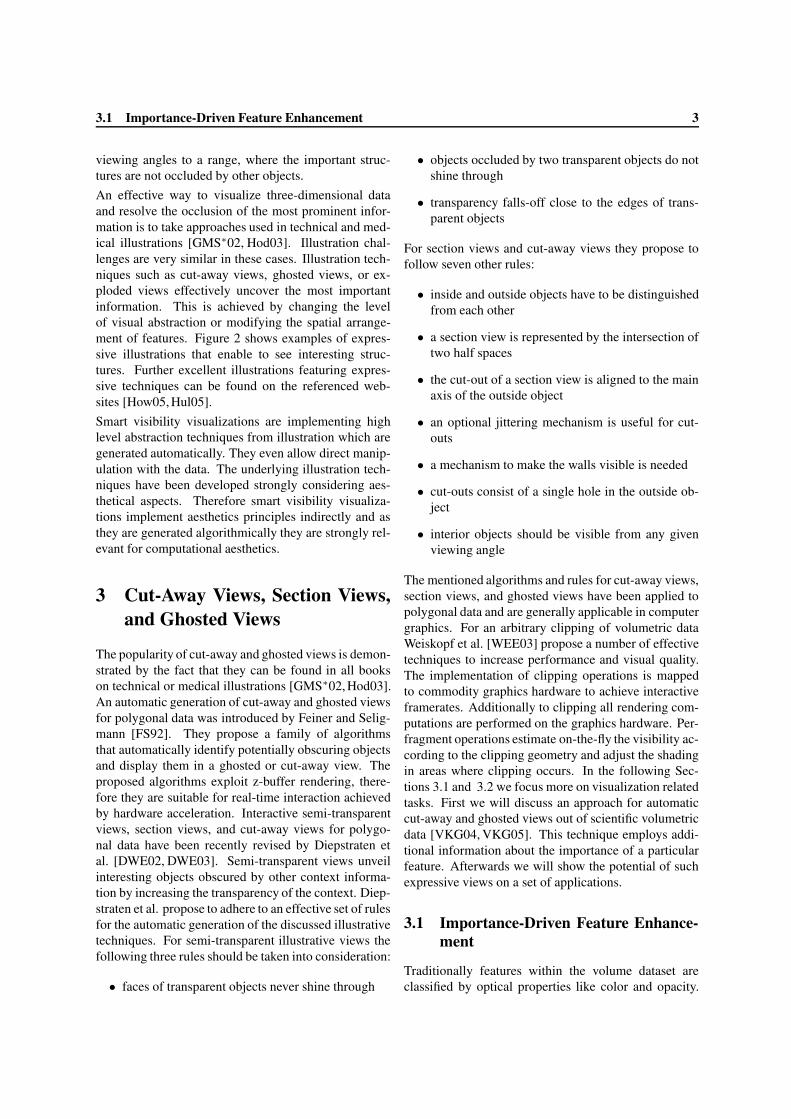
Figure 3: Stages in the pipeline of importance-driven volume rendering: Volumetric features are assigned impor-tance values (left image). The volume is traversed (center) in the importance compositing stage to estimate levelsof sparseness (right). These levels are used to enhance or suppress particular parts of the volume. The resultingimages then emphasize important features.
With importance-driven feature enhancement we addi-tionally assign one more dimension to features, whichdescribes their importance. Importance encodes whichfeatures are the most interesting ones and have the high-est priority to be clearly visible. Prior to the final im-age synthesis, the visibility of important features is es-timated. If less important objects are occluding featuresthat are more interesting, the less important ones arerendered more sparsely, e.g., more transparently. If thesame object does not cause any unwanted occlusions inother regions of the image, it is rendered more densely,e.g., opaque, in order to see its features more clearly.This allows to see all interesting structures irrespectiveif they are occluded or not, and the less important partsare still visible as much as possible. Instead of usingconstant optical characteristics, which are independentfrom the viewpoint, we use several levels of sparsenessfor each feature. Levels of sparseness correspond to lev-els of abstraction, i.e., we do not assign a single opticalcharacteristic, but several characteristics with smoothtransitions in between. These multiple levels of sparse-ness allow the object to continuously change its visualappearance from a very dense representation to a verysparse one. Which level of sparseness will be chosen,is dependent on the importance of the particular objectand the importance of objects in front and behind. Thelevel of sparseness thus may continuously vary withina single feature. For different viewpoints the same partof a feature may be represented with different levels ofsparseness. To determine the sparseness level for eachobject or parts thereof the rendering pipeline requiresan additional step, which we call importance composit-ing. This step evaluates the occlusion according to theviewpoint settings, takes the importance factor of eachfeature into account and assigns to each feature a par-ticular level of sparseness. The final synthesis resultsin images with maximal visual information with respectto the predefined object importance. The interrelation-ship between object importance, importance composit-
ing, and levels of sparseness is depicted in Figure 3. Theimportance compositing traverses the whole volume toidentify object occlusions and assigns the correspondinglevel of sparseness to each object. Object importancetranslates to object visibility in the result image. Thiscauses different rendering settings for the context object(with importance 0.1) in the area of the image which iscovered by the focus object (importance 0.7).
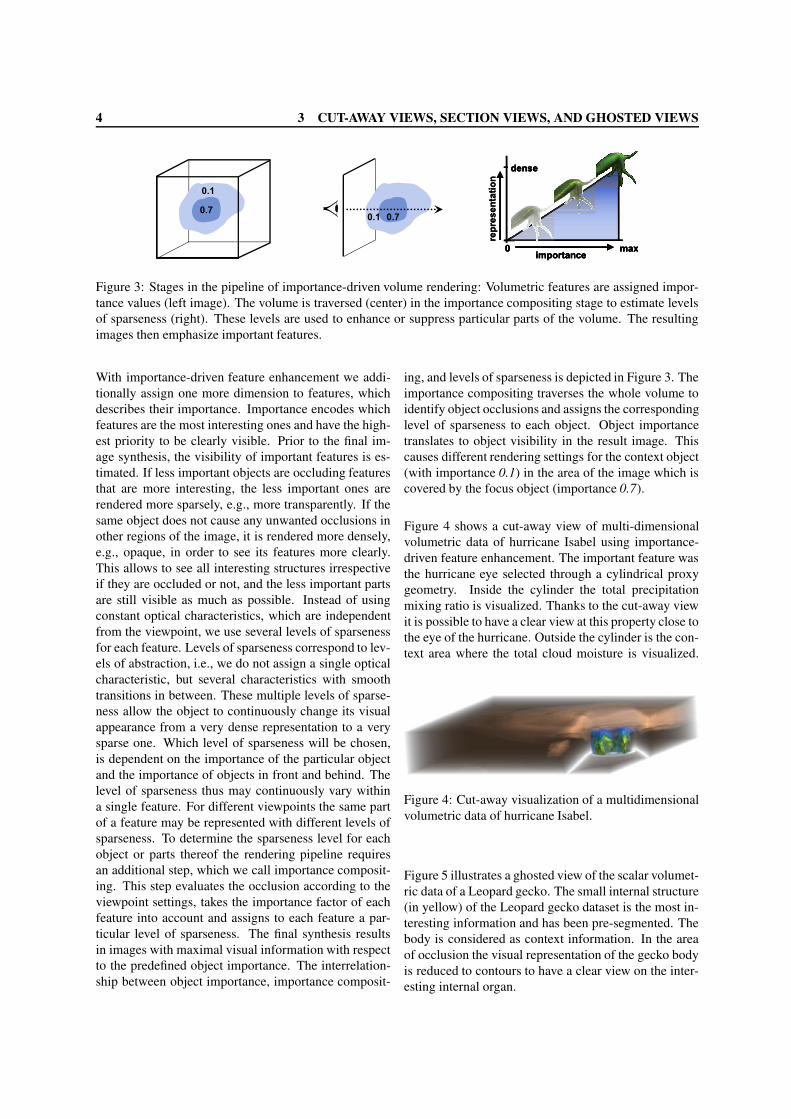
Figure 4 shows a cut-away view of multi-dimensionalvolumetric data of hurricane Isabel using importance-driven feature enhancement. The important feature wasthe hurricane eye selected through a cylindrical proxygeometry. Inside the cylinder the total precipitationmixing ratio is visualized. Thanks to the cut-away viewit is possible to have a clear view at this property close tothe eye of the hurricane. Outside the cylinder is the con-text area where the total cloud moisture is visualized.
Figure 4: Cut-away visualization of a multidimensionalvolumetric data of hurricane Isabel.
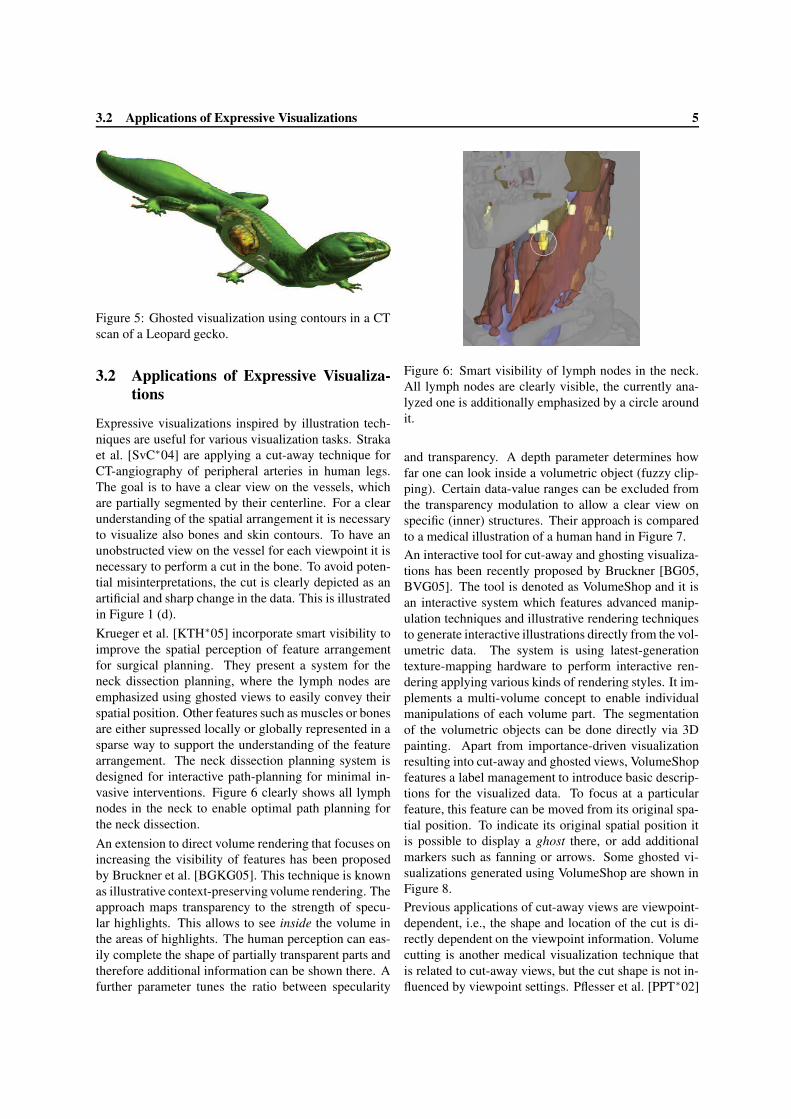
Figure 5 illustrates a ghosted view of the scalar volumet-ric data of a Leopard gecko. The small internal structure(in yellow) of the Leopard gecko dataset is the most in-teresting information and has been pre-segmented. Thebody is considered as context information. In the areaof occlusion the visual representation of the gecko bodyis reduced to contours to have a clear view on the inter-esting internal organ.
3.2 Applications of Expressive Visualizations 5
Figure 5: Ghosted visualization using contours in a CTscan of a Leopard gecko.
3.2 Applications of Expressive Visualiza-tions
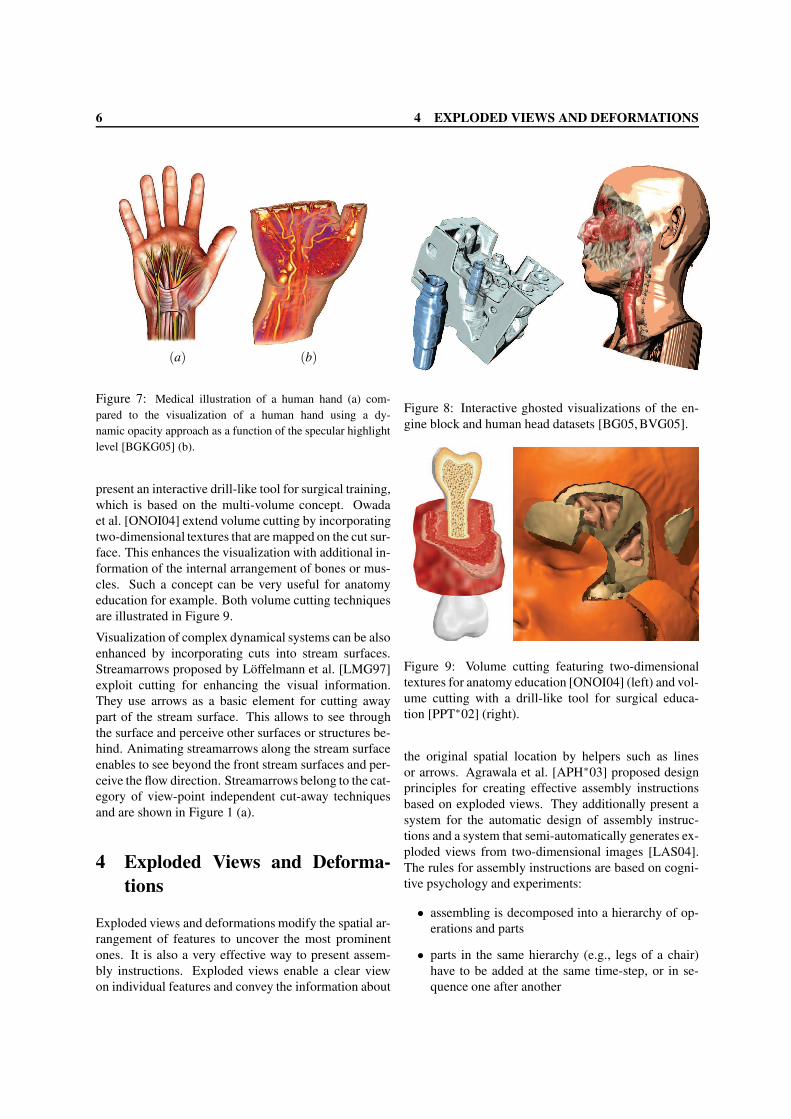
Expressive visualizations inspired by illustration tech-niques are useful for various visualization tasks. Strakaet al. [SvC∗04] are applying a cut-away technique forCT-angiography of peripheral arteries in human legs.The goal is to have a clear view on the vessels, whichare partially segmented by their centerline. For a clearunderstanding of the spatial arrangement it is necessaryto visualize also bones and skin contours. To have anunobstructed view on the vessel for each viewpoint it isnecessary to perform a cut in the bone. To avoid poten-tial misinterpretations, the cut is clearly depicted as anartificial and sharp change in the data. This is illustratedin Figure 1 (d).Krueger et al. [KTH∗05] incorporate smart visibility toimprove the spatial perception of feature arrangementfor surgical planning. They present a system for theneck dissection planning, where the lymph nodes areemphasized using ghosted views to easily convey theirspatial position. Other features such as muscles or bonesare either supressed locally or globally represented in asparse way to support the understanding of the featurearrangement. The neck dissection planning system isdesigned for interactive path-planning for minimal in-vasive interventions. Figure 6 clearly shows all lymphnodes in the neck to enable optimal path planning forthe neck dissection.An extension to direct volume rendering that focuses onincreasing the visibility of features has been proposedby Bruckner et al. [BGKG05]. This technique is knownas illustrative context-preserving volume rendering. Theapproach maps transparency to the strength of specu-lar highlights. This allows to see inside the volume inthe areas of highlights. The human perception can eas-ily complete the shape of partially transparent parts andtherefore additional information can be shown there. Afurther parameter tunes the ratio between specularity
Figure 6: Smart visibility of lymph nodes in the neck.All lymph nodes are clearly visible, the currently ana-lyzed one is additionally emphasized by a circle aroundit.
and transparency. A depth parameter determines howfar one can look inside a volumetric object (fuzzy clip-ping). Certain data-value ranges can be excluded fromthe transparency modulation to allow a clear view onspecific (inner) structures. Their approach is comparedto a medical illustration of a human hand in Figure 7.An interactive tool for cut-away and ghosting visualiza-tions has been recently proposed by Bruckner [BG05,BVG05]. The tool is denoted as VolumeShop and it isan interactive system which features advanced manip-ulation techniques and illustrative rendering techniquesto generate interactive illustrations directly from the vol-umetric data. The system is using latest-generationtexture-mapping hardware to perform interactive ren-dering applying various kinds of rendering styles. It im-plements a multi-volume concept to enable individualmanipulations of each volume part. The segmentationof the volumetric objects can be done directly via 3Dpainting. Apart from importance-driven visualizationresulting into cut-away and ghosted views, VolumeShopfeatures a label management to introduce basic descrip-tions for the visualized data. To focus at a particularfeature, this feature can be moved from its original spa-tial position. To indicate its original spatial position itis possible to display a ghost there, or add additionalmarkers such as fanning or arrows. Some ghosted vi-sualizations generated using VolumeShop are shown inFigure 8.Previous applications of cut-away views are viewpoint-dependent, i.e., the shape and location of the cut is di-rectly dependent on the viewpoint information. Volumecutting is another medical visualization technique thatis related to cut-away views, but the cut shape is not in-fluenced by viewpoint settings. Pflesser et al. [PPT∗02]
6 4 EXPLODED VIEWS AND DEFORMATIONS
(a) (b)
Figure 7: Medical illustration of a human hand (a) com-pared to the visualization of a human hand using a dy-namic opacity approach as a function of the specular highlightlevel [BGKG05] (b).
present an interactive drill-like tool for surgical training,which is based on the multi-volume concept. Owadaet al. [ONOI04] extend volume cutting by incorporatingtwo-dimensional textures that are mapped on the cut sur-face. This enhances the visualization with additional in-formation of the internal arrangement of bones or mus-cles. Such a concept can be very useful for anatomyeducation for example. Both volume cutting techniquesare illustrated in Figure 9.
Visualization of complex dynamical systems can be alsoenhanced by incorporating cuts into stream surfaces.Streamarrows proposed by Löffelmann et al. [LMG97]exploit cutting for enhancing the visual information.They use arrows as a basic element for cutting awaypart of the stream surface. This allows to see throughthe surface and perceive other surfaces or structures be-hind. Animating streamarrows along the stream surfaceenables to see beyond the front stream surfaces and per-ceive the flow direction. Streamarrows belong to the cat-egory of view-point independent cut-away techniquesand are shown in Figure 1 (a).
4 Exploded Views and Deforma-tions
Exploded views and deformations modify the spatial ar-rangement of features to uncover the most prominentones. It is also a very effective way to present assem-bly instructions. Exploded views enable a clear viewon individual features and convey the information about
Figure 8: Interactive ghosted visualizations of the en-gine block and human head datasets [BG05, BVG05].
Figure 9: Volume cutting featuring two-dimensionaltextures for anatomy education [ONOI04] (left) and vol-ume cutting with a drill-like tool for surgical educa-tion [PPT∗02] (right).
the original spatial location by helpers such as linesor arrows. Agrawala et al. [APH∗03] proposed designprinciples for creating effective assembly instructionsbased on exploded views. They additionally present asystem for the automatic design of assembly instruc-tions and a system that semi-automatically generates ex-ploded views from two-dimensional images [LAS04].The rules for assembly instructions are based on cogni-tive psychology and experiments:
• assembling is decomposed into a hierarchy of op-erations and parts
• parts in the same hierarchy (e.g., legs of a chair)have to be added at the same time-step, or in se-quence one after another
4.1 Applications of Expressive Visualization 7
• step-by-step instructions are better understandablethan a single diagram showing all the operations
• diagrams presenting the final assembly are neces-sary to understand the step-by-step action diagrams
• parts added in the current assembly step must beclearly visible
• objects have to be presented in their clearest orien-tation
Smart-visibility visualizations are using some of theabove mentioned rules for other tasks than assembly in-structions. In the following visualization approaches arepresented that have been inspired by the exploded viewsconcept. They use some of the rules for assembly in-structions implicitly.
4.1 Applications of Expressive Visualiza-tion
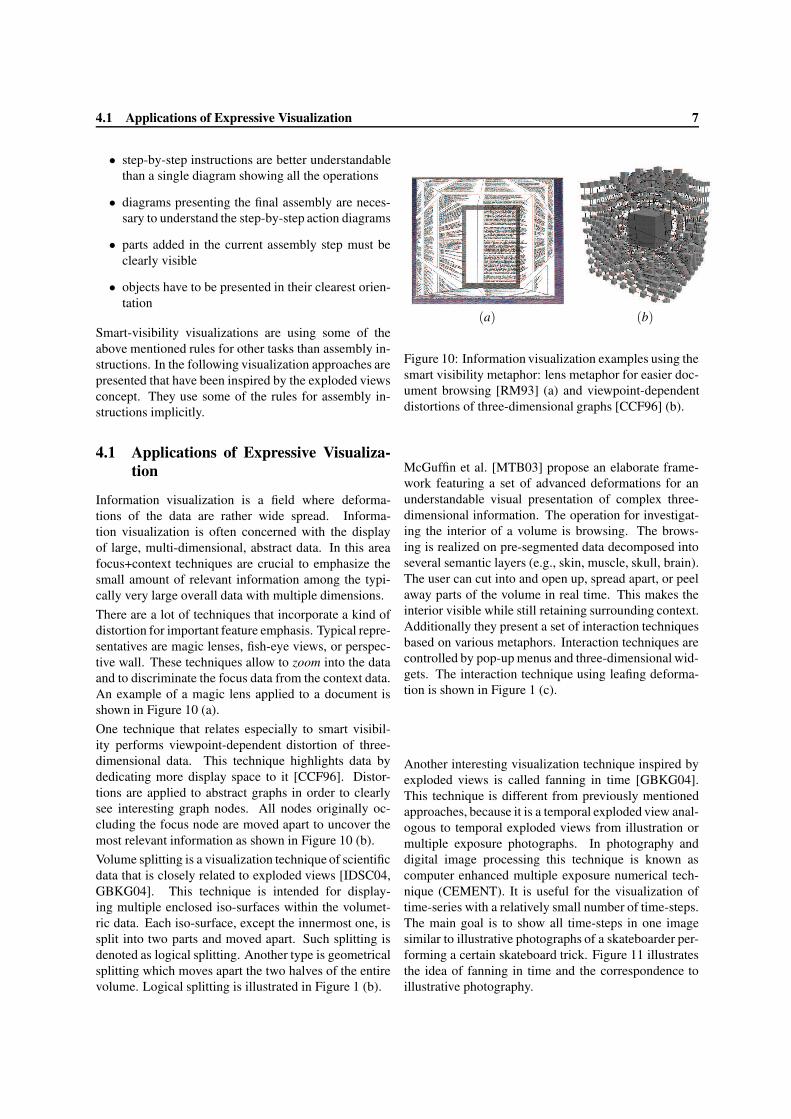
Information visualization is a field where deforma-tions of the data are rather wide spread. Informa-tion visualization is often concerned with the displayof large, multi-dimensional, abstract data. In this areafocus+context techniques are crucial to emphasize thesmall amount of relevant information among the typi-cally very large overall data with multiple dimensions.There are a lot of techniques that incorporate a kind ofdistortion for important feature emphasis. Typical repre-sentatives are magic lenses, fish-eye views, or perspec-tive wall. These techniques allow to zoom into the dataand to discriminate the focus data from the context data.An example of a magic lens applied to a document isshown in Figure 10 (a).One technique that relates especially to smart visibil-ity performs viewpoint-dependent distortion of three-dimensional data. This technique highlights data bydedicating more display space to it [CCF96]. Distor-tions are applied to abstract graphs in order to clearlysee interesting graph nodes. All nodes originally oc-cluding the focus node are moved apart to uncover themost relevant information as shown in Figure 10 (b).Volume splitting is a visualization technique of scientificdata that is closely related to exploded views [IDSC04,GBKG04]. This technique is intended for display-ing multiple enclosed iso-surfaces within the volumet-ric data. Each iso-surface, except the innermost one, issplit into two parts and moved apart. Such splitting isdenoted as logical splitting. Another type is geometricalsplitting which moves apart the two halves of the entirevolume. Logical splitting is illustrated in Figure 1 (b).
(a) (b)
Figure 10: Information visualization examples using thesmart visibility metaphor: lens metaphor for easier doc-ument browsing [RM93] (a) and viewpoint-dependentdistortions of three-dimensional graphs [CCF96] (b).
McGuffin et al. [MTB03] propose an elaborate frame-work featuring a set of advanced deformations for anunderstandable visual presentation of complex three-dimensional information. The operation for investigat-ing the interior of a volume is browsing. The brows-ing is realized on pre-segmented data decomposed intoseveral semantic layers (e.g., skin, muscle, skull, brain).The user can cut into and open up, spread apart, or peelaway parts of the volume in real time. This makes theinterior visible while still retaining surrounding context.Additionally they present a set of interaction techniquesbased on various metaphors. Interaction techniques arecontrolled by pop-up menus and three-dimensional wid-gets. The interaction technique using leafing deforma-tion is shown in Figure 1 (c).
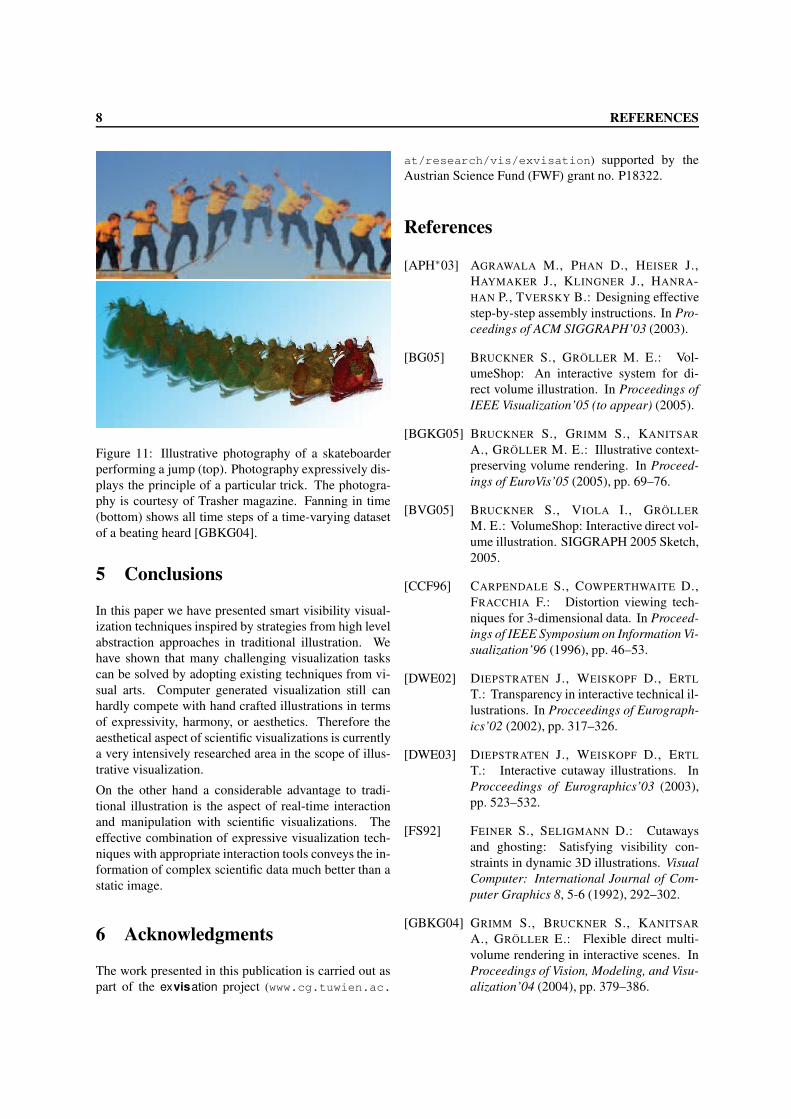
Another interesting visualization technique inspired byexploded views is called fanning in time [GBKG04].This technique is different from previously mentionedapproaches, because it is a temporal exploded view anal-ogous to temporal exploded views from illustration ormultiple exposure photographs. In photography anddigital image processing this technique is known ascomputer enhanced multiple exposure numerical tech-nique (CEMENT). It is useful for the visualization oftime-series with a relatively small number of time-steps.The main goal is to show all time-steps in one imagesimilar to illustrative photographs of a skateboarder per-forming a certain skateboard trick. Figure 11 illustratesthe idea of fanning in time and the correspondence toillustrative photography.
8 REFERENCES
Figure 11: Illustrative photography of a skateboarderperforming a jump (top). Photography expressively dis-plays the principle of a particular trick. The photogra-phy is courtesy of Trasher magazine. Fanning in time(bottom) shows all time steps of a time-varying datasetof a beating heard [GBKG04].
5 Conclusions
In this paper we have presented smart visibility visual-ization techniques inspired by strategies from high levelabstraction approaches in traditional illustration. Wehave shown that many challenging visualization taskscan be solved by adopting existing techniques from vi-sual arts. Computer generated visualization still canhardly compete with hand crafted illustrations in termsof expressivity, harmony, or aesthetics. Therefore theaesthetical aspect of scientific visualizations is currentlya very intensively researched area in the scope of illus-trative visualization.
On the other hand a considerable advantage to tradi-tional illustration is the aspect of real-time interactionand manipulation with scientific visualizations. Theeffective combination of expressive visualization tech-niques with appropriate interaction tools conveys the in-formation of complex scientific data much better than astatic image.
6 Acknowledgments
The work presented in this publication is carried out aspart of the exvisation project (www.cg.tuwien.ac.
at/research/vis/exvisation) supported by theAustrian Science Fund (FWF) grant no. P18322.
References
[APH∗03] AGRAWALA M., PHAN D., HEISER J.,HAYMAKER J., KLINGNER J., HANRA-HAN P., TVERSKY B.: Designing effectivestep-by-step assembly instructions. In Pro-ceedings of ACM SIGGRAPH’03 (2003).
[BG05] BRUCKNER S., GRÖLLER M. E.: Vol-umeShop: An interactive system for di-rect volume illustration. In Proceedings ofIEEE Visualization’05 (to appear) (2005).
[BGKG05] BRUCKNER S., GRIMM S., KANITSARA., GRÖLLER M. E.: Illustrative context-preserving volume rendering. In Proceed-ings of EuroVis’05 (2005), pp. 69–76.
[BVG05] BRUCKNER S., VIOLA I., GRÖLLERM. E.: VolumeShop: Interactive direct vol-ume illustration. SIGGRAPH 2005 Sketch,2005.
[CCF96] CARPENDALE S., COWPERTHWAITE D.,FRACCHIA F.: Distortion viewing tech-niques for 3-dimensional data. In Proceed-ings of IEEE Symposium on Information Vi-sualization’96 (1996), pp. 46–53.
[DWE02] DIEPSTRATEN J., WEISKOPF D., ERTLT.: Transparency in interactive technical il-lustrations. In Procceedings of Eurograph-ics’02 (2002), pp. 317–326.
[DWE03] DIEPSTRATEN J., WEISKOPF D., ERTLT.: Interactive cutaway illustrations. InProcceedings of Eurographics’03 (2003),pp. 523–532.
[FS92] FEINER S., SELIGMANN D.: Cutawaysand ghosting: Satisfying visibility con-straints in dynamic 3D illustrations. VisualComputer: International Journal of Com-puter Graphics 8, 5-6 (1992), 292–302.
[GBKG04] GRIMM S., BRUCKNER S., KANITSARA., GRÖLLER E.: Flexible direct multi-volume rendering in interactive scenes. InProceedings of Vision, Modeling, and Visu-alization’04 (2004), pp. 379–386.
REFERENCES 9
[GMS∗02] GIESECKE F., MITCHELL A., SPENCERH., HILL I., DYGDON J., NOVAK J.: Tech-nical Drawing. Prentice Hall, 2002.
[Hod03] HODGES E. (Ed.): The Guild Handbook ofScientific Illustration. Wiley, 2003.
[How05] Howell MediGraphicsweb page,http://www.medigraphics.com/, 2005.
[Hul05] K. Hulsey technical illustration web page,http://www.khulsey.com/, 2005.
[IDSC04] ISLAM S., DIPANKAR S., SILVER D.,CHEN M.: Spatial and temporal splittingof scalar fields in volume graphics. In Pro-ceedings of IEEE/SIGGRAPH Symposiumon Volume Visualization’04 (2004), pp. pp.87–94.
[KTH∗05] KRÜGER A., TIETJEN C., HINTZE J.,PREIM B., HERTEL I., STRAUSS G.: In-teractive visualization for neck dissectionplanning. In Proceedings of EuroVis’05(2005), pp. –.
[LAS04] LI W., AGRAWALA M., SALESIN D.: In-teractive image-based exploded view dia-grams. In Proceedings of Graphics Inter-face’04 (2004).
[LMG97] LÖFFELMANN H., MROZ L., GRÖLLERE.: Hierarchical streamarrows for the vi-sualization of dynamical systems. In Euro-graphics Workshop on Visualization in Sci-entific Computing’97 (1997), pp. 155–164.
[MTB03] MCGUFFIN M., TANCAU L., BALAKR-ISHNAN R.: Using deformations for brows-ing volumetric data. In Proceedings ofIEEE Visualization’03 (2003), pp. 401–408.
[Oma77] OMAR S.: Ibn al-Haytham’s Optics: AStudy of the Origins of Experimental Sci-ence. Bibliotheca Islamica, 1977.
[ONOI04] OWADA S., NIELSEN F., OKABE M.,IGARASHI T.: Volumetric illustration: De-signing 3d models with internal textures.In Proceedings of ACM SIGGRAPH’04(2004), pp. 322–328.
[PPT∗02] PFLESSER B., PETERSIK A., TIEDE U.,HÖHNE K. H., LEUWER R.: Volume cut-ting for virtual petrous bone surgery. Com-puter Aided Surgery 7, 2 (2002), 74–83.
[RM93] ROBERTSON G., MACKINLAY J.: Thedocument lens. In Proceedings of ACMSymposium on User Interface Software andTechnology (1993), pp. 101–108.
[SvC∗04] STRAKA M., CERVENANSKÝ M.,CRUZ A. L., KÖCHL A., ŠRÁMEK M.,GRÖLLER E., FLEISCHMANN D.: TheVesselGlyph: Focus & context visualiza-tion in CT-angiography. In Proceedingsof IEEE Visualization’04 (2004), pp. 385–392.
[VKG04] VIOLA I., KANITSAR A., GRÖLLERM. E.: Importance-driven volume ren-dering. In Proceedings of IEEE Visualiza-tion’04 (2004), pp. 139–145.
[VKG05] VIOLA I., KANITSAR A., GRÖLLERM. E.: Importance-driven feature en-hancement in volume visualization. IEEETransactions on Visualization and Com-puter Graphics 11, 4 (2005), 408–418.
[WEE03] WEISKOPF D., ENGEL K., ERTL T.: Inter-active clipping techniques for texture-basedvolume visualization and volume shading.IEEE Transactions on Visualization andComputer Graphics 9, 3 (2003), 298–312.