TECHNICAL REPORT STANDARD PAGE - Louisiana ... Report Period Covered: September 2008-June 30, 2009...
109
TECHNICAL REPORT STANDARD PAGE 1. Report No. FHWA/LA.09/465 2. Government Accession No. 3. Recipient's Catalog No. 4. Title and Subtitle Characterization of HMA Mixtures Containing High Reclaimed Asphalt Pavement Content With Crumb Rubber Additives 5. Report Date March 2013 6. Performing Organization Code 7. Author(s) Louay N. Mohammad, Ph.D., Samuel B. Cooper, Jr., MSCE., P.E., Bill King, P.E., Amar Raghavendra, P.E. 8. Performing Organization Report No. 9. Performing Organization Name and Address Louisiana Transportation Research Center 4101 Gourrier Avenue Baton Rouge, LA 70809 10. Work Unit No. 11. Contract or Grant No. State Project Number: 736-99-1574 LTRC Project Number: 09-1B 12. Sponsoring Agency Name and Address Louisiana Transportation Research Center 4101 Gourrier Avenue Baton Rouge, LA 70809 13. Type of Report and Period Covered Final Report Period Covered: September 2008-June 30, 2009 14. Sponsoring Agency Code 15. Supplementary Notes 6. Abstract As the price of petroleum and material costs escalate and pressures of maintaining the sustainability of our environment, owners must continually find methods to decrease material costs and maximize their benefits. This paper presents the findings of laboratory characterization of HMA mixtures containing high reclaimed asphalt pavement (RAP) content with crumb rubber (CR) additives. Five mixtures were examined in this study. The conventional mixture contained a styrene- butadiene-styrene, polymer-modified asphalt cement, Performance Grade (PG) 76-22M and no RAP. The second mixture utilized 15 percent RAP and PG 76-22M asphalt cement binder. The third mixture contains no RAP, 30 mesh CR additives blended (wet process) with a PG 64-22 binder. The fourth mixture contains 40 percent RAP, 30 mesh CR additives blended (dry process) with a PG 64-22 asphalt cement binder. The final mixture utilized 100 percent RAP with CR additives. Laboratory mixture characterization includes the Asphalt Mixture Performance Tests (Dynamic Modulus, E*, and Flow Number, FN), Semi-Circular Bend test, Dissipated Creep Strain Energy test, and the Modified Lottman test. In addition, Loaded Wheel Tracking, LWT, test was performed. Results indicate that the addition of CR additives as a dry feed to carry rejuvenating agents is promising. Mixtures containing high RAP content and CR additives exhibited similar performance as conventional mixture with PG 76-22M binder. 17. Key Words Crumb Rubber, HMA, Asphalt Mixture Performance Tests, Materials Characterization 18. Distribution Statement Unrestricted. This document is available through the National Technical Information Service, Springfield, VA 21161. 19. Security Classif. (of this report) N/A 20. Security Classif. (of this page) N/A 21. No. of Pages 109 22. Price
Transcript of TECHNICAL REPORT STANDARD PAGE - Louisiana ... Report Period Covered: September 2008-June 30, 2009...

TECHNICAL REPORT STANDARD PAGE
1. Report No. FHWA/LA.09/465
2. Government Accession No.
3. Recipient's Catalog No.
4. Title and Subtitle
Characterization of HMA Mixtures Containing High
Reclaimed Asphalt Pavement Content With Crumb
Rubber Additives
5. Report Date March 2013 6. Performing Organization Code
7. Author(s)
Louay N. Mohammad, Ph.D., Samuel B. Cooper, Jr., MSCE.,
P.E., Bill King, P.E., Amar Raghavendra, P.E.
8. Performing Organization Report No.
9. Performing Organization Name and Address
Louisiana Transportation Research Center 4101 Gourrier Avenue Baton Rouge, LA 70809
10. Work Unit No. 11. Contract or Grant No.
State Project Number: 736-99-1574
LTRC Project Number: 09-1B
12. Sponsoring Agency Name and Address
Louisiana Transportation Research Center
4101 Gourrier Avenue
Baton Rouge, LA 70809
13. Type of Report and Period Covered
Final Report
Period Covered: September 2008-June 30, 2009 14. Sponsoring Agency Code
15. Supplementary Notes
6. Abstract
As the price of petroleum and material costs escalate and pressures of maintaining the sustainability of our environment,
owners must continually find methods to decrease material costs and maximize their benefits. This paper presents the
findings of laboratory characterization of HMA mixtures containing high reclaimed asphalt pavement (RAP) content with
crumb rubber (CR) additives. Five mixtures were examined in this study. The conventional mixture contained a styrene-
butadiene-styrene, polymer-modified asphalt cement, Performance Grade (PG) 76-22M and no RAP. The second mixture
utilized 15 percent RAP and PG 76-22M asphalt cement binder. The third mixture contains no RAP, 30 mesh CR
additives blended (wet process) with a PG 64-22 binder. The fourth mixture contains 40 percent RAP, 30 mesh CR
additives blended (dry process) with a PG 64-22 asphalt cement binder. The final mixture utilized 100 percent RAP with
CR additives. Laboratory mixture characterization includes the Asphalt Mixture Performance Tests (Dynamic Modulus,
E*, and Flow Number, FN), Semi-Circular Bend test, Dissipated Creep Strain Energy test, and the Modified Lottman test.
In addition, Loaded Wheel Tracking, LWT, test was performed. Results indicate that the addition of CR additives as a dry
feed to carry rejuvenating agents is promising. Mixtures containing high RAP content and CR additives exhibited similar
performance as conventional mixture with PG 76-22M binder.
17. Key Words
Crumb Rubber, HMA, Asphalt Mixture Performance Tests,
Materials Characterization
18. Distribution Statement Unrestricted. This document is available through the National
Technical Information Service, Springfield, VA 21161.
19. Security Classif. (of this report)
N/A
20. Security Classif. (of this page)
N/A
21. No. of Pages
109
22. Price


Project Review Committee
Each research project has an advisory committee appointed by the LTRC Director. The
Project Review Committee (PRC) is responsible for assisting the LTRC Administrator or
Manager in the development of acceptable research problem statements, requests for
proposals, review of research proposals, oversight of approved research projects, and
implementation of findings.
LTRC appreciates the dedication of the following Project Review Committee members in
guiding this research study to fruition.
LTRC Manager
Bill King
Senior Asphalt Research Engineer
Members
Luanna Cambas, LADOTD
Philip Graves, DOTD
Philip Arena, FHWA
Don Weathers, LAPA
Danny Smith, DOTD
Gary Fitts, Asphalt Institute
Directorate Implementation Sponsor
William H. Temple, DOTD Chief Engineer


Characterization of HMA Mixtures Containing High Recycled Asphalt
Pavement Content with Crumb Rubber Additives
by
Louay N. Mohammad, Ph.D.
Professor of Civil and Environmental Engineering
Director, Engineering Materials Characterization Research Facility
Samuel B. Cooper, Jr., MSCE, P.E.
Associate Director Technology Transfer and Training
Bill King, P.E.
Senior Asphalt Research Engineer
Amar Raghavendra, P.E.
Application Engineer Manager
Louisiana Transportation Research Center
Research Project No. 09-1B
State Project No. 736-99-1574
Louisiana Transportation Research Center
4101 Gourrier Ave.
Baton Rouge, LA 70808
The contents of this report reflect the views of the author/principal investigator who is
responsible for the facts and accuracy of the data presented herein. The contents of this
report do not necessarily reflect the views or policies of the Louisiana Department of
Transportation and Development or the Louisiana Transportation Research Center. This
report does not constitute a standard, specification, or regulation.
March 2013


iii
ABSTRACT
This study presents the findings of a laboratory characterization of hot mix asphalt (HMA)
mixtures containing high reclaimed asphalt pavement (RAP) content with crumb rubber (CR)
additives. Five mixtures were examined in this study. The conventional mixture contained a
styrene-butadiene-styrene polymer modified asphalt cement, Performance Grade (PG) 76-
22M and no RAP. The second mixture utilized 15 percent RAP and PG 76-22M asphalt
cement binder. The third mixture contained no RAP, 30 mesh CR additives blended (wet
process) with a PG 64-22 binder. The fourth mixture contained 40 percent RAP, 30 mesh
CR additives blended (dry process) with a PG 64-22 asphalt cement binder. The final
mixture utilized 100 percent RAP with CR additives. Laboratory mixture characterization
included the asphalt mixture simple performance tests (Dynamic Modulus, E*, and flow
number, FN); semi-circular bend test, dissipated creep strain energy test; and the modified
Lottman test. In addition, Loaded Wheel Tracking, LWT, test was performed. Results
indicate that the addition of CR additives as a dry feed to carry rejuvenating agents is
promising. Mixtures containing high RAP content and CR additives exhibited similar
performance as conventional mixtures with PG 76-22M binder.


v
ACKNOWLEDGEMENTS
The research work reported in this paper was sponsored by the Louisiana Department of
Transportation and Development (LADOTD) through the Louisiana Transportation Research
Center (LTRC). The authors would like to express thanks to all who have provided valuable
help in this study especially Greg Tullier, Willie Gueho, Patrick Frazier, and Amar
Raghavendra. Also, the authors would like to thank Md Sharear Kabir for providing
technical input in this study. Lastly, the authors would like to thank John Osborn of
Elastomeric Concentrates, LLC who supplied the crumb rubber additives utilized in this
study.


vii
IMPLEMENTATION STATEMENT
The results of this study clearly show the benefits of utilizing the absorptive properties of
crumb rubber to carry rejuvenating type products into an HMA mixture that contains a high
RAP content. The outcome of this study indicates that crumb rubber additives can be added
as part of the aggregate portion (dry feed) during HMA production in lieu of crumb rubber as
part of the asphalt cement binder (i.e., wet blending). The use of crumb rubber additives as
demonstrated in this study clearly indicates promise. However, since this was a limited
study, further investigation utilizing several RAP sources and asphalt cement sources should
be conducted. Optimization of the crumb rubber additives is necessary to maximize a
mixtures performance, i.e., fatigue resistance or permanent deformation. In addition, a life
cycle cost analysis should be included to indicate the economic benefit in utilizing high RAP
and recycled products such as crumb rubber.


ix
TABLE OF CONTENTS
ABSTRACT ................................................................................................................................... iii
ACKNOWLEDGEMENTS ............................................................................................................ v
IMPLEMENTATION STATEMENT .......................................................................................... vii
TABLE OF CONTENTS ............................................................................................................... ix
LIST OF TABLES ......................................................................................................................... xi
LIST OF FIGURES ..................................................................................................................... xiii
INTRODUCTION .......................................................................................................................... 1
Background.............................................................................................................................. 1
Literature Review .................................................................................................................... 3
Problem Statement................................................................................................................. 12
OBJECTIVE ................................................................................................................................. 15
SCOPE .......................................................................................................................................... 17
METHODOLOGY ....................................................................................................................... 19
Test Factorial Design ............................................................................................................. 19
Hot Mix Asphalt Mixture Design Development ................................................................... 19
Aggregate Tests ..................................................................................................................... 22
Asphalt Binder Tests ............................................................................................................. 23
HMA Mixture Blending ........................................................................................................ 25
Fabrication of Mixture Specimens ........................................................................................ 27
Laboratory Tests on HMA Mixtures ..................................................................................... 28
Modified Lottman Test ................................................................................................. 29
Dissipated Creep Strain Energy Test ............................................................................ 30
SCB Test ....................................................................................................................... 32
Simple Performance Tests (SPTs) ................................................................................ 33
Loaded Wheel Tracking Device Test ........................................................................... 35
Conduct Data Analysis .......................................................................................................... 37
DISCUSSION OF RESULTS....................................................................................................... 39
Asphalt Binder Test Results .................................................................................................. 39
HMA Mixture Characterization Test Results ........................................................................ 46
Modified Lottman Test Results .................................................................................... 46
DCSE Test Results ....................................................................................................... 49
Semi-Circular Bend (SCB) Test Results ...................................................................... 49
Dynamic Modulus (E*) Test Results............................................................................ 51
Dynamic Modulus (E*) Ratio....................................................................................... 53
Phase Angle Test Results ............................................................................................. 54
Flow Number Test (Repeated Load Permanent Deformation Test) Results ................ 57

x
Evaluation of Rutting and Fatigue Factors from E* Tests ........................................... 58
Loaded Wheel Tracking Test Results ........................................................................... 60
Correlation between Laboratory Test Results ....................................................................... 61
Correlation between Jc and DCSE Test Results ........................................................... 61
Correlation between Modified Lottman and Semi-Circular Bend Test Results ........... 62
Correlation between Fatigue Factor and DCSE Test Results ....................................... 62
Correlation between Fatigue Factor and Semi-Circular Bend Test Results ................. 63
Comparison of Statistical Ranking of HMA Mixtures .......................................................... 64
CONCLUSIONS........................................................................................................................... 67
RECOMMENDATIONS .............................................................................................................. 71
ACRONYMS, ABBREVIATIONS, AND SYMBOLS ............................................................... 73
REFERENCES ............................................................................................................................. 75
APPENDIX A ............................................................................................................................... 79
Aggregate Gradations and Material Properties ..................................................................... 79
APPENDIX B ............................................................................................................................... 81
Simple Performance Test Results for Asphalt Mixtures ....................................................... 81

xi
LIST OF TABLES
Table 1 Test factorial .................................................................................................................... 19
Table 2 Job mix formula ............................................................................................................... 21
Table 3 LADOTD performance graded asphalt cement specification.......................................... 25
Table 4 Mixture performance tests ............................................................................................... 29
Table 5 LADOTD performance graded asphalt cement test results ............................................. 41
Table 6 Extracted RAP asphalt cement binder rest results ........................................................... 43
Table 7 Modified Lottman test results .......................................................................................... 48
Table 8 SCB peak load test results ............................................................................................... 50
Table 9 Statistical ranking of mixtures fatigue and rutting characteristics ................................... 66
Table 10 Sieve analysis of aggregates (percent passing) .............................................................. 77
Table 11 Aggregate consensus properties..................................................................................... 77
Table 12 Tire crumb rubber certificate of analysis ....................................................................... 78
Table 13 Dynamic modulus (E*) test results, 76CO HMA .......................................................... 79
Table 14 Dynamic modulus (E*) test results, 76CRM HMA ....................................................... 80
Table 15 Dynamic modulus (E*) test results, 76RAP15 HMA .................................................... 81
Table 16 Dynamic modulus (E*) test results, 64RAP40 HMA .................................................... 82
Table 17 Dynamic modulus (E*) test results, 100%RAP ............................................................. 83
Table 18 Phase angle test results, 76CO HMA............................................................................. 84
Table 19 Phase angle test results, 76CRM HMA ......................................................................... 85
Table 20 Phase angle test results, 76RAP15 HMA ...................................................................... 86
Table 21 Phase angle test results, 64RAP40 ................................................................................. 87
Table 22 Phase angle test results, 100%RAP ............................................................................... 88
Table 23 Flow number test results ................................................................................................ 89


xiii
LIST OF FIGURES
Figure 1 Aggregate gradation curves ............................................................................................ 23
Figure 2 HMA mix blending procedure........................................................................................ 27
Figure 3 Superpave gyratory compactor (SGC) ........................................................................... 28
Figure 4 DCSE test sample instrumentation ................................................................................. 31
Figure 5 Dissipated creep strain energy determination................................................................. 32
Figure 6 Set-up of semi-circular bending test ............................................................................... 33
Figure 7 Mixture stress-strain response under sinusoidal load ..................................................... 34
Figure 8 Stages of accumulated permanent strain and flow number computation ....................... 35
Figure 9 Hamburg loaded wheel tracking device ......................................................................... 36
Figure 10 Typical LWT test output .............................................................................................. 37
Figure 11 Dynamic shear, G*/Sin(δ) (RAP binder tested as Original) ........................................ 44
Figure 12 Dynamic shear, G*/Sin(δ) (RAP binder tested as RTFO)........................................... 45
Figure 13 Dynamic shear, G*Sin(δ) (RAP binder tested as PAV) .............................................. 45
Figure 14 RAP binder rotational viscosity.................................................................................... 46
Figure 15 Modified Lottman retained tensile strength ................................................................. 48
Figure 16 Dissipated creep strain energy test results .................................................................... 49
Figure 17 Semi-circular bend test results...................................................................................... 51
Figure 18 Dynamic modulus test results ....................................................................................... 52
Figure 19 Dynamic modulus isotherms ........................................................................................ 53
Figure 20 Dynamic modulus ratio comparison (E* Ratio) .......................................................... 54
Figure 21 Dynamic modulus and phase angle relationships ........................................................ 55
Figure 22 Phase angle vs. mix type relationship........................................................................... 56
Figure 23 Flow number vs. mix type ............................................................................................ 57
Figure 24 Rutting factor, E*/Sinδ @ 5Hz, 54.4°C ....................................................................... 59
Figure 25 Fatigue factor, E*(Sinδ) @ 5Hz, 25.0°C ...................................................................... 59
Figure 26 LWT rutting results ...................................................................................................... 60
Figure 27 Correlations between Jc and DCSE test parameters ..................................................... 61
Figure 28 Correlations between %TSR and Jc test results ............................................................ 62
Figure 29 Correlations between fatigue factor and DCSE test results .......................................... 63
Figure 30 Correlations between fatigue factor and Jc test results ................................................. 64


INTRODUCTION
Background
One of the issues concerning environmental sustainability is determining how to make the
production, distribution, and consumption of goods and services last longer and have less
impact on our ecological systems consisting of all plants, animals, and micro-organisms in an
area functioning together with all non-living physical factors of the environment. One such
method of sustainability in the hot mix asphalt (HMA) industry is using recycled materials to
replace a percentage of virgin materials used in the manufacturing process such as aggregates
and asphalt cement binder, which has a direct impact on cost and the environment.
Agencies and owners must continually find methods to decrease material costs and maximize
their benefits as the price of HMA mixtures continually rise because of the increase in
material costs such as aggregates and petroleum products. One such method is to increase
and/or begin using readily available recycled materials like reclaimed asphalt pavements
(RAP) and crumb rubber (CR).
Asphalt pavements are the most recycled product in America. A reclaimed asphalt pavement,
which is commonly called RAP, is an HMA mixture containing aggregates and asphalt
cement binder that has been removed and reclaimed from an existing pavement. Properly
processed RAP consists of well-graded aggregates coated with asphalt cement binder.
Reports from the Federal Highway Administration (FHWA) and the United States
Environmental Protection Agency (U.S. EPA) state that approximately 80 percent of
removed asphalt pavements are reused as part of new roads, roadbeds, shoulders, and
embankments.
Another available recycled material is crumb rubber. Crumb rubber or ground rubber is
typically defined as scrap tire rubber that has been reduced to a particle size of 3/8 inch or
less. There are approximately 290 million scrap tires generated per year in the United States.
In 2004, there were approximately 275 million scrap tires in stockpiles in the United States.
About 27 millions scrap tires are estimated to be disposed in landfills annually resulting in
major disposal costs, environmental risks related to pests and insect growths that promote the
outbreak of diseases, and fires that are hard to distinguish and cause contamination of the
soil. The three largest markets for the use of recycled scrap tires are tire derived fuel; civil
engineering applications (subgrade fill, embankments, septic system drain fields, etc.); and

2
ground rubber, i.e., crumb rubber applications/rubberized asphalt. Currently there are 30
million tons of scrap tires that are recycled into crumb rubber each year.
The use of crumb-rubber modifiers (CRM) in hot-mix asphalt mixtures can be traced back to
the 1840s when natural rubber was introduced into bitumen to increase its engineering
performance [1]. Since the 1960s, researchers and engineers have used shredded automobile
tires in HMA mixtures for pavements. The process of applying crumb rubber in asphalt
mixtures can be divided into two broad categories: a dry process and a wet process. In the
dry process, crumb rubber is added to the aggregate before the asphalt binder is charged into
the mixture. In the wet process, asphalt cement is pre-blended with the rubber at high
temperature (177 – 210oC) and specific blending conditions [1].
LADOTD initiated a research project to evaluate different procedures of CRM applications
used in HMA mixtures in 1994 in which the long-term pavement performance of CRM
asphalt pavements was compared to that of control sections built with conventional asphalt
mixtures [2]. It is reported that the conventional mixtures exhibited higher laboratory
strength characteristics (indirect tensile strength) than CRM mixtures. Also, the pavement
sections constructed with CRM asphalt mixtures showed overall better performance indices
(rut depth, fatigue cracks, and international roughness index numbers) than the corresponding
control sections [3].
In the 1970s, states and paving contractors began making extensive use of RAP in HMA
pavements because of the cost savings and the environmentally positive method of recycling.
From 1987 through 1993, several research projects were carried out to develop the Superpave
method of HMA designs under the Strategic Highway Research Program (SHRP). One of
the distinct shortcomings of this mix design method was that there was no provision for the
use of RAP in the mix design process. It was determined that the effect of aged binder from
RAP on the performance properties of the virgin binder depends upon the level of RAP used
in the HMA mixture. When the percentage of RAP used in the HMA is low (10 – 20
percent), the effect on the asphalt binder properties is minimal. As RAP percentage increases
(greater than 20 percent) in the HMA, the aged binder from RAP blends with the virgin
asphalt binder in sufficient quantity to significantly affect the asphalt binder performance.
The blending of old, hardened asphalt binders from RAP with a virgin asphalt binder will
typically result in an asphalt binder that is harder than the original virgin asphalt binder.
Usually this binder hardening is counteracted by adding a softer virgin asphalt binder and
letting the RAP asphalt binder stiffen the softer binder to achieve a blended asphalt binder of

3
desired properties. In addition to the use of softer asphalt binders, recycling agents or
rejuvenators are also used to soften the hardened RAP asphalt binders [4].
This study explored the use of the absorption properties of crumb rubber to carry asphalt
cement binder components (light ends) that are typically lost during oxidation of HMA
pavements as a dry feed component in the making of hot mix asphalt mixtures. No available
literature was found indicating that this method has been evaluated. Laboratory mechanistic
performance and mixture characterization evaluations and analysis were performed to
determine the effects of crumb rubber additives and RAP on HMA mixtures’ performance.
Literature Review
The term “sustainability” is a relatively new concept that has already proved useful.
Sustainability relates to “how to make human economic systems (production, distribution and
consumption of goods and services in a particular society) last longer and have less impact
on ecological systems consisting of all plants, animals and micro-organisms in an area
functioning together with all of the non-living physical factors of the environment, and
particularly relates to concern over major global problems such as climate change and oil
depletion” [6]. One such method of sustainability in the HMA industry is using recycled
materials to replace a percentage of virgin materials used in the manufacturing process such
as aggregates and asphalt cement binder, which has a direct impact on cost and the
environment.
Agencies and owners must continually find methods to decrease material costs and maximize
their benefits as the price of HMA mixtures continually rise because of the increase in
material costs such as aggregates and petroleum products. One such method is to increase
and/or begin using readily available recycled materials like RAP and crumb rubber.
Therefore it is only logical to try to devise methods to increase the usage of these type
products without sacrificing HMA mixture performance. Recycled materials, such as crumb
rubber made from scrap tires, and RAP are available to the HMA industry.
Reclaimed asphalt pavement is an HMA mixture containing aggregates and asphalt cement
binder that has been removed and reclaimed from an existing roadway. RAP is generated
during rehabilitation/reconstruction of existing HMA roadways or from utility cuts across an
existing HMA roadway that was necessary to obtain access to underground utilities. When
RAP is properly processed, crushed and screened, RAP will consist of well-graded
aggregates coated with asphalt cement binder. During reconstruction or rehabilitation, HMA

4
pavements are typically removed by milling machines. This process is commonly referred to
as cold planning. The depth of HMA removal by milling varies by the type of reconstruction
required. The reconstruction/rehabilitation process may require the removal of an existing
wearing course mixture or may require full-depth removal of the entire HMA structure. As
the existing HMA pavement is being milled, RAP is deposited directly into haul trucks and
then delivered to an HMA hot mix plant for processing. Full-depth removal involves milling
the existing HMA structure in several passes depending on the existing depth of the structure
or by ripping and breaking the pavement into large pieces using rippers on a bull dozer or by
use of a backhoe. When the RAP is broken into large pieces, the broken material is picked
up by a front-end loader or backhoe and then loaded into haul trucks and is usually
transported to an HMA hot mix plant for processing. At the HMA hot mix plant, the RAP is
processed by crushing and screening, and then it is conveyed and stockpiled [7].
It is reported that asphalt pavements are America’s most recycled product. More than 73
million tons of reclaimed asphalt pavements are recycled each year as compared to the
combined total of 40 million tons of recycled paper, glass, aluminum, and plastic. Reports
from the FHWA and the U.S. EPA state that approximately 80 percent of removed asphalt
pavements are reused as part of new roads, roadbeds, shoulders, and embankments [8].
In 1994, there were approximately 800 million scrap tires disposed of in stockpiles. Since
then, there has been millions of scrap tires removed by aggressive cleanup by state scrap tire
management programs. It was reported in 2004 that there were approximately 275 million
scrap tires remaining in stockpiles in the United States. There were approximately 290
million scrap tires generated in 2003, which is the typical yearly rate seen in the United
States. About 27 million scrap tires are estimated to be disposed in landfills annually
resulting in major disposal costs, environmental risks related to pests and insect growths that
promote the outbreak of diseases, and fires that are hard to distinguish and cause
contamination of the soil. As of 2003, markets existed for the use of 80 percent of the scrap
tires that relates to 233 million scrap tires out of 290 million scrap tires available. The three
largest markets for the use of recycled scrap tires are tire derived fuel; civil engineering
applications (subgrade fill, embankments, septic system drain fields, etc.); and ground
rubber, i.e., crumb rubber applications/rubberized asphalt. Currently there are 30 million
tons of scrap tires that are recycled into crumb rubber each year [9]. The transportation
industry still has the potential to escalate its use of disposed scrap tires by increasing the use
of crumb rubber in specialty mixes such as CRM HMA mixtures.

5
Crumb rubber or ground rubber is typically defined as scrap tire rubber that has been reduced
to a particle size of 3/8-inch or less. Crumb rubber is described or measured by the mesh
screen or sieve size through which it passes in the production process. A 30 mesh means
there are 30 openings, per linear inch of screen. There are three processes that are typically
used in the making the crumb rubber from scrap tires. First, the scrap tire is reduced to 2 ½-
inch to 4-inch size shreds by a slow speed “shear” shredder or shredders. Second, the shreds
go through two or three successively narrower blade shredders to further reduce the shreds to
3/8-inch or less. Finally, the particles are processed to even smaller mesh sizes by using
cracking or grinding rolling mills. The final mesh size of the crumb rubber product is
determined by the number of passes through the mill. Other than shredding, there are other
methods for processing scrap tires into crumb rubber: First there are cryogenic systems that
utilize sub-zero temperatures to freeze the tires. Then the frozen tires are shattered using a
hammer mill which makes it easy to separate the rubber from the steel and fabric. A second
alternative method is to use ambient systems that operate at room temperature and literally
tear the tire material apart. During the process, screens and gravity separators are used to
remove steel, non-ferrous metals, sand, and other unwanted materials, and aspiration
equipment is used to remove fibers. One scrap passenger tire can yield between 10-12 lb. of
crumb rubber product [10].
The processes of applying crumb rubber in asphalt mixtures can be divided into two broad
categories: a dry process and a wet process. In the dry process, crumb rubber is added to the
aggregate before the asphalt binder is charged into the mixture. In the wet process, asphalt
cement is pre-blended with the rubber at high temperature (177 – 210 oC) and specific
blending conditions. Crumb rubber particles in the dry process are normally coarser than
those in the wet process and are considered as part of the aggregate gradations (called
“rubber-filler”); whereas, in the wet process, crumb rubber is reacted with asphalt binders
(called “asphalt-rubber”). In the wet process, crumb rubber is mixed with asphalt binder at
high temperature and is allowed to swell by absorption of the asphalt oil components to form
a gel-like material [1]. The extent of the swelling process depends on the mixing
temperature, the size of the crumb rubber particles, and the concentration of rubber in the
blend [11]. Researchers have noted that if these variables are not selected properly, the
rubber may depolymerize causing a negative impact on the properties of the blend [12].
Common dry process methods include the PlusRide™, chunk rubber, and generic dry.
Common wet process methods include the Arizona, McDonald, Ecoflex, and Rouse
continuous blending methods [1].

6
The use of CRM in hot mix asphalt mixtures can be traced back to the 1840s when natural
rubber was introduced into bitumen to increase its engineering performance [1]. The use of
ground rubber from scrap tires has long been supported by environmental and government
agencies to reduce the disposal problem associated with waste tires. Since the 1960s,
researchers and engineers have used shredded automobile tires in HMA mixtures for
pavements.
In the 1960s, Charles H. McDonald pioneered the development of the wet process (or
reacted) crumb rubber modified asphalt cement binders in the United States. In 1963,
McDonald first used CRM asphalt cement binders for a patching material in which he termed
the operation as a “band-aid” repair technique in Phoenix, Arizona. The CRM asphalt binder
was spray applied using an asphalt distributor and then covered with a “localized chip seal”
placed by hand over a small pavement area. The first “large area” spray application was
performed in 1967, which became known as stress-absorbing membranes (SAM). In 1972,
Arizona DOT placed its first stress–absorbing membrane interlayer (SAMI) as part of a
project to evaluate techniques to reduce reflection cracking. Arizona placed its first HMA
mixture containing CRM asphalt cement in 1975. Arizona DOT currently uses CRM asphalt
binders in SAMIs, gap-graded HMA mixtures, and in open-graded friction courses, which is
now the most popular use of CRM binders [13].
Not until the late 1980s did the use of recycled tire crumb rubber in HMA mixtures become
popular. In 1991, the Intermodal Surface Transportation Efficiency Act (ISTEA) specified
that all asphalt pavement projects funded by federal agencies must use certain percentages of
scrap tires [14]. Although this mandate was later suspended from the ISTEA legislation, it
has greatly encouraged the research and application of CRM asphalt in HMA pavements.
The National Cooperative Highway Research Programs (NCHRP) “Synthesis of Highway
Practice 198 – Uses of Recycled Rubber Tires in Highways” provides a comprehensive
review of the use of recycled rubber tires in highways based on a review of nearly 500
references and on information recorded from state highway agencies’ responses to a 1991
survey of current practices [15].
The Florida Department of Transportation (FLDOT) constructed three HMA mixture
demonstration projects that utilized CRM wet processes in 1989 for the purpose of evaluating
the short term field performance and constructability of these mixtures. It was necessary to
construct these projects so that the FLDOT could develop specifications and procedures for
CRM use. The mixtures evaluated were two fine-graded and an open-graded Friction Course

7
mixture type. For this study, minus No. 80 mesh crumb rubber was pre-blended (“reacted”
or digested”) with the asphalt cement binder prior to its incorporation with the aggregates.
They concluded that the addition of CRM would increase asphalt film thickness, binder
resiliency, viscosity, and shear strength. It was further reported that with the use of CRM the
FLDOT was able to increase the asphalt binder content of the mixtures because of the
stiffening effect it had on the asphalt cement binder. By increasing the asphalt content,
Florida DOT anticipates increased durability of these type mixtures [16].
From 1990 to 1993, Virginia DOT constructed pavements containing CRM asphalt mixtures.
The objective was to familiarize the Virginia Department of Transportation and contractors
personnel with the construction process and to compare the performance of different types of
mixes containing ground tire rubber. Four test sections (dense graded surface mixes, a gap-
graded surface mix, a base mix, and a stress-absorbing membrane interlayer) using asphalt
rubber hot mix were placed in Virginia utilizing two wet processes, McDonald and Rouse,
and then pavement performance was compared to that of conventional asphalt mixtures [17].
The McDonald process focuses on reacted asphalt cement/CRM binder in which the time
required to “react” these materials is dependent on the size of the crumb rubber particles used
in the blending process. The Rouse process blends a 180-micron (80 mesh) sieve CRM with
an asphalt cement binder utilizing continuous blending procedures [1]. It is reported that the
mixes containing asphalt rubber performed at least as well as conventional mixes. In
Virginia mixes, the inclusion of asphalt rubber in HMA pavements increased construction
costs by 50 to 100 percent as compared to the cost of conventional mixes [17].
Troy et al. [18] conducted research on CRM pavements in Nevada. The objective of the
study was to test and evaluate CRM binders blended by the wet process using the Superpave
performance grading system binder protocols and its applicability to CRM binders. In
addition, the CRM HMA mix design was conducted using the Hveem procedure. They
concluded that the conventional sample geometry in Superpave binder test protocols cannot
be used to test the CRM binders and that the Hveem compaction is inadequate for mixtures
containing CRM binders. It was further concluded that Superpave binder testing protocols
would not work for CRM binders containing coarse rubber particles. It was recommended
that the plate and cup system be used for asphalt cement binders blended with crumb rubber.
It was further concluded that the plate and cup system could not replace the bending beam
rheometer for low-temperature testing. In addition, a modified Hveem mix design procedure
was developed when CRM mixtures are used.

8
LADOTD initiated a research project to evaluate different procedures of CRM applications
used in HMA mixtures in 1994 in which the long-term pavement performance of the CRM
asphalt pavements was compared to that of the control sections built with conventional
asphalt mixtures [2]. There were eight CRM applications evaluated in this study as follows:
Arizona wet process incorporated into a gap-graded mixture;
Arizona wet process incorporated into a SAMI;
Arizona wet process incorporated into an open-graded friction course
(OGFC);
PlusRide™ dry process utilizing a gap-graded aggregate structure;
Rouse powdered rubber wet process incorporated into a typical dense-graded
mixture;
A terminal-blended material formulated by Neste Wright in a dense-graded
mixture;
Rouse dry-powdered rubber process blended into a dense-graded aggregate
structure; and
Generic CRM dry process incorporated into a gap-graded mixture.
Huang et al. evaluated conventional and CRM asphalt mixtures through laboratory
engineering performance tests such as ITS and indirect tensile resilient modulus (Mr) tests
[19]. Marshall Stability and Flow tests were also conducted during the mixture design.
Huang et al. also compared field performance through the pavement structural non-
destructive test using Dynaflect and long-term pavement performance measurement, such as
roadway core density, International Roughness Index (IRI), rutting, and fatigue cracking.
The conventional mixtures exhibited higher laboratory strength characteristics than CRM
mixtures. However the pavement sections constructed with CRM asphalt mixtures showed
overall better performance indices (rut depth, fatigue cracks, and international roughness
index numbers) than the corresponding control sections [19]. In addition, Cooper et al.
evaluated the long term field performance (10 years) as it relates to random cracking,
International Roughness Index, and rutting of asphalt pavements constructed with these eight
different CRM applications as opposed to the control sections built with conventional HMA
mixtures [3]. It is reported that the “pavement sections constructed with CRM asphalt
mixtures showed overall better field performance indices (rut depth, random cracks, and IRI
numbers) than corresponding control sections. Both CRM modified, wet and dry, and HMA
mix types are performing equally well, if not better, than the conventional mix types
evaluated.”

9
LADOTD conducted a study in 2004 to evaluate and characterize HMA mixtures that used
recycled polymer-modified asphalt pavements as one of the mixture components [20].
According to the study, “the objectives of this research were to (1) analyze the properties of
field-aged polymer modified asphalt cement (PMAC) relative to Pressure Aging Vessel
(PAV) with aged PMAC; (2) examine the compatibility and feasibility of blending reclaimed
PMAC with virgin PMAC based on chemical component analysis methods and Superpave
binder specification; and (3) evaluate the fatigue and permanent deformation properties of
asphalt mixtures containing various percentages of laboratory-aged and/or field-extracted
PMACs based on laboratory fundamental engineering tests.” The scope of this study was to
develop extraction techniques necessary for the removal of the aged asphalt cement binder
from the aggregate components of the HMA mixture. Also the extraction technique would
allow for the separation of the polymer additive component from the asphalt cement binder.
Asphalt cement binder testing, analysis, and Superpave characterization included (1)
differential scanning calorimetric (DSC) measurement, (2) Fourier transform infrared (FTIR)
measurement, (3) gel permeation chromatograph (GPC) measurement, (4) rotational
viscosity measurement, (5) dynamic shear modulus and phase angle measurement, and (6)
beam stiffness and creep slope measurement. In addition, a 19 mm nominal maximum
aggregate size (NMAS) high volume HMA mixture that is commonly used by LADOTD was
designed using virgin PMAC, meeting LADOTD PAC-40HG and PG 70-22M specifications
and then blended with varying percentages (0, 20, 40, and 60 percent) of reclaimed polymer
modified asphalt cement (RPMAC) and virgin aggregates. To characterize the HMA
mixtures on both lab-aged and field-aged RPMAC mixtures being evaluated, a series of
fundamental engineering tests were utilized. These tests included the frequency sweep at
constant height (FSCH), repeated shear at constant height (RSCH), simple shear at constant
height (SSCH), ITS and strain, indirect tensile modulus (Mr), semi-circular fracture, beam
fatigue, and asphalt pavement analyzer (APA) tests. It is reported that as the percentage of
RPMAC binder in mixtures increased, the rutting resistance increased and the fatigue
resistance decreased. The asphalt cement binder that was extracted from field cores revealed
that the binder was quite brittle at low temperatures as measured by the force ductility and
bending beam tests. In addition, the extracted RPMAC binder was blended with the virgin
PMAC and analyzed. It is reported that the resultant blends had much stiffer properties than
those of lab-aged PMAC, which indicates that the PAV procedure did not predict the field
aging of PMAC binders. It was stated that the HMA mixture containing 60 percent RPMAC
exhibited better fatigue life than those mixtures with 20 and 40 percent RPMAC [20].
In the 1970s, states and paving contractors began making extensive use of RAP in HMA
pavements. The use of RAP results in cost savings and an environmentally positive method

10
of recycling. Properly designed HMA containing RAP can perform as well as HMA
prepared with 100 percent virgin materials [4]. From 1987 through 1993, several research
projects were carried out to develop the Superpave method of design based on performance
based HMA designs under the SHRP. One of the distinct shortcomings of this mix design
method was no provision for the use of RAP in the mix design process. This shortcoming
hindered the use of RAP in HMA mixtures by agencies that adopted the Superpave mix
design process. In order to temporarily remedy this situation, interim guidelines were
developed by a Superpave Mixtures Expert Task Group based on their experience. It was
noted that the effect of aged binder from RAP on the performance properties of the virgin
binder depends upon the level of RAP used in the HMA mixture. When the percentage of
RAP used in the HMA is low (10 – 20 percent), the effect on the asphalt binder properties is
minimal. At these low percentages, RAP affects the mix volumetrics and performance
through gradation because RAP acts like a “black rock.” As RAP percentage in the HMA
increases (greater than 20 percent), the aged binder from RAP blends with the virgin asphalt
binder in sufficient quantity to significantly affect the asphalt binder performance [4].
McDaniel et al. as part of NCHRP Project 9-12, were given the task of developing guidelines
for the use of RAP in HMA mixtures [4]. RAP materials from three states (Florida,
Connecticut, and Arizona) yielded recovered RAP asphalt binders of different stiffness
properties in combination with two virgin asphalt binders at RAP contents of 10 and 40
percent. Mixtures properties were evaluated using the Superpave shear tests [AASHTO TP7
- Simple Shear Test at Constant Height) at high temperatures and indirect tensile creep and
strength tests (AASHTO TP9 - Standard Test Method for Determining the Creep Compliance
and Strength of Hot Mix Asphalt (HMA) Using the Indirect Tensile Test Device] for low
temperature properties. The findings confirmed current practice that low amounts of RAP,
typically 10 to 20 percent, can be used without determining the recovered asphalt binder
properties. This is because there is not enough of the old, hardened RAP asphalt binder
present in the final asphalt cement binder blend to change the properties of the asphalt binder,
and the RAP may account as an aggregate component of the aggregate. When more than 20
percent RAP is used in an HMA mixture, recovery and testing of its binder is recommended,
along with blending charts to determine what performance grade of virgin asphalt binder
should be used in the HMA mixture design. The blending of old, hardened asphalt binders
from RAP with a virgin asphalt binder will typically result in an asphalt binder that is harder
than the virgin asphalt binder properties used. Usually this binder hardening is counteracted
by adding a softer virgin asphalt binder and allowing the RAP asphalt binder stiffen the
softer binder to achieve a blended asphalt binder of desired properties. In addition to the use
of softer asphalt binders, recycling agents are also used to soften the hardened RAP asphalt
binders. The recommended binder selection guidelines for RAP mixtures are as follows [4]:

11
Less than 20 percent RAP used – no change in asphalt binder selection.
Between 20 – 30 percent RAP used – select one grade softer virgin asphalt
binder than normally used (e.g., select a PG 58-28 in lieu of a PG 64-22).
Greater than 30 percent RAP – develop and use recommendations from
blending charts.
Softening of hardened RAP binders when high percentages of RAP content (greater than 25
percent) are used in a HMA mixture is typically achieved by adding rejuvenating agents.
The use of rejuvenators changes the composition, physical properties, and performance
properties of the rejuvenated aged asphalt binders in RAP [5]. Rejuvenators are used to
recover the original properties of the aged binders and then reconstitute the chemical
compositions of the aged binders that were lost due to the aging and oxidation process over
time. An asphalt binder that experiences oxidization aging has a lower concentration of more
reactive components, nitrogen base plus first acidaffins, and a higher concentration of less
reactive components such as paraffines plus second acidaffins [5].
Many CRM asphalt pavements used in the past are becoming prime candidates for recycling.
Shen et al. studied the effects of rejuvenating agents on CRM modified binders by
characterizing blended laboratory-aged CRM asphalt binders and rejuvenating agents using
gel permeation chromatography (GPC) [21]. Results of the study indicated that the
compositional changes of the asphalt binder blends with varying percentages of RAP or
rejuvenating agents is reflected in the GPC test results. It was shown that the large molecular
size (LMS) of blends decreases as the small molecular size (SMS) increases as the
percentage of rejuvenators used increases regardless of the type of aged binders or
rejuvenating agents. As a result, empirical prediction models were developed for Superpave
binder properties for viscosity and high-failure temperature using LMS and SMS. It is stated
that the predicted values from these models show a high correlation with viscosity and the
high-failure temperature of asphalt binders [21].
Shen et al. studied the effects of rejuvenating agents on Superpave HMA mixtures containing
RAP in South Carolina [5]. There were three objectives of this study: first, to evaluate the
properties of Superpave mixtures containing various RAP sources and a rejuvenator and then
comparing to those of the recycled Superpave mixtures utilizing a softer asphalt cement
binder; second, to investigate the use of blending charts of aged asphalt cement binders and a
rejuvenator for determining the rejuvenator contents for the design of Superpave mixtures
containing RAP; and third, to evaluate the properties of virgin Superpave mixtures and

12
Superpave mixtures containing RAP to ascertain the possibility of incorporating RAP into
Superpave mixtures. Two RAPs were incorporated into a 9.5 mm nominal maximum size
Superpave mixtures containing either a rejuvenator or a softer binder (control mixture).The
HMA mixtures were evaluated in terms of volumetrics, ITS, and rutting potential using the
APA. The rejuvenator content was determined from the blending charts of RAP binders
containing the rejuvenator. Twelve Superpave mixtures were designed, 10 containing RAP
and two with virgin materials. It was reported that for the mixtures tested, ITS and APA
properties of the RAP HMA mixtures containing rejuvenator were better than those that
contained only the softer binder. In addition, by using a rejuvenator in lieu of a softer binder,
one could use 10 percent more RAP in the HMA mixture. It was further reported that there
were good relationships between the measured performance parameters and rejuvenator
contents utilized, which were determined by the blending charts developed from the
extracted aged binders making it possible to determine the design rejuvenator contents
necessary for recycling RAP [5].
Problem Statement
Asphalt cement prices, like gasoline and crude oil, are at an all-time high with no relief in
sight. With HMA mixtures’ prices continuously climbing, highway agencies and owners are
continually searching for methods to decrease material costs and maximize their benefits
with no compromise in performance. One such method is to develop innovative technology
to incorporate waste and recycled materials, such as crumb rubber from waste tires and RAP
in HMA mixtures. RAP is currently allowed for use in limited percentages within HMA
layers. As HMA pavements age over time, the asphalt binders become hardened and
oxidized causing premature cracking in pavements. Thus, the current limiting factor in
increasing the percentages of RAP is the excessive stiffness of the resulting HMA mixture.
Rejuvenating additives are often used to “soften” the asphalt cement binder of RAP
materials. Therefore, the incorporation of these additives into the HMA mixture will enable
the use of higher percentages of RAP in the finished product. Furthermore, absorption
properties of crumb rubber, from waste tires, may be used to carry those additives to
revitalize the properties of the aged binders. Research is needed to evaluate the performance
of HMA mixtures containing these additives.
A limited comparative laboratory mechanistic performance evaluation of conventional HMA
mixtures and mixtures that contain waste tire crumb rubber, additives, and RAP will be
conducted. HMA mixture characterization in terms of fatigue cracking, moisture

13
susceptibility, and rutting will be analyzed and evaluated to determine the effects of the
crumb rubber, additives, and RAP on the HMA mixtures’ performance.


15
OBJECTIVE
The main objective of this study was to characterize the laboratory performance of
conventional HMA mixtures and mixtures containing high RAP content and waste tire crumb
rubber/additives through their fundamental engineering properties.
The second objective was to characterize the laboratory performance of an HMA mixture
containing 100% RAP and waste tire crumb rubber/additives. A candidate for this mixture is
the asphalt treated base mixture.


17
SCOPE
A Superpave l9-mm nominal maximum aggregate size (NMAS) Level 2 HMA mixture
meeting LADOTD specifications was designed and examined. Siliceous limestone
aggregates and coarse natural sand that are commonly used in Louisiana were included in
this study. A total of four mixtures were examined in this study to fulfill the main objective.
The first mixture was a control mixture, that contains a Styrene-Butadiene (SB) polymer
modified asphalt cement meeting Louisiana specifications for PG 76-22M. The second
mixture contained no RAP, 30 mesh CR plus additives blended (wet process) with a PG 64-
22 asphalt cement binder, which yielded a PG76-22. The third mixture contained 15 percent
RAP and PG 76-22M asphalt cement binder. The fourth mixture contained 40 percent RAP,
30 mesh crumb rubber, and additives blended (dry process) with a PG 64-22 asphalt cement
binder. In addition, to fulfill the second objective of this study, an asphalt treated base
mixture, which utilized 100 percent RAP and 30 mesh CR plus additives, was examined and
characterized to determine its fundamental engineering properties. The CR and additives
were introduced to the mixture at a rate of 10 percent by total weight of binder. Mixture
performance tests conducted included simple performance tests (Dynamic modulus, E*, and
flow number, FN), Semi-circular bend (SCB) test, dissipated creep strain energy (DCSE) test,
and modified Lottman test. Triplicate samples were used for each test. In addition, Loaded
Wheel Tracking, LWT, test was performed.

19
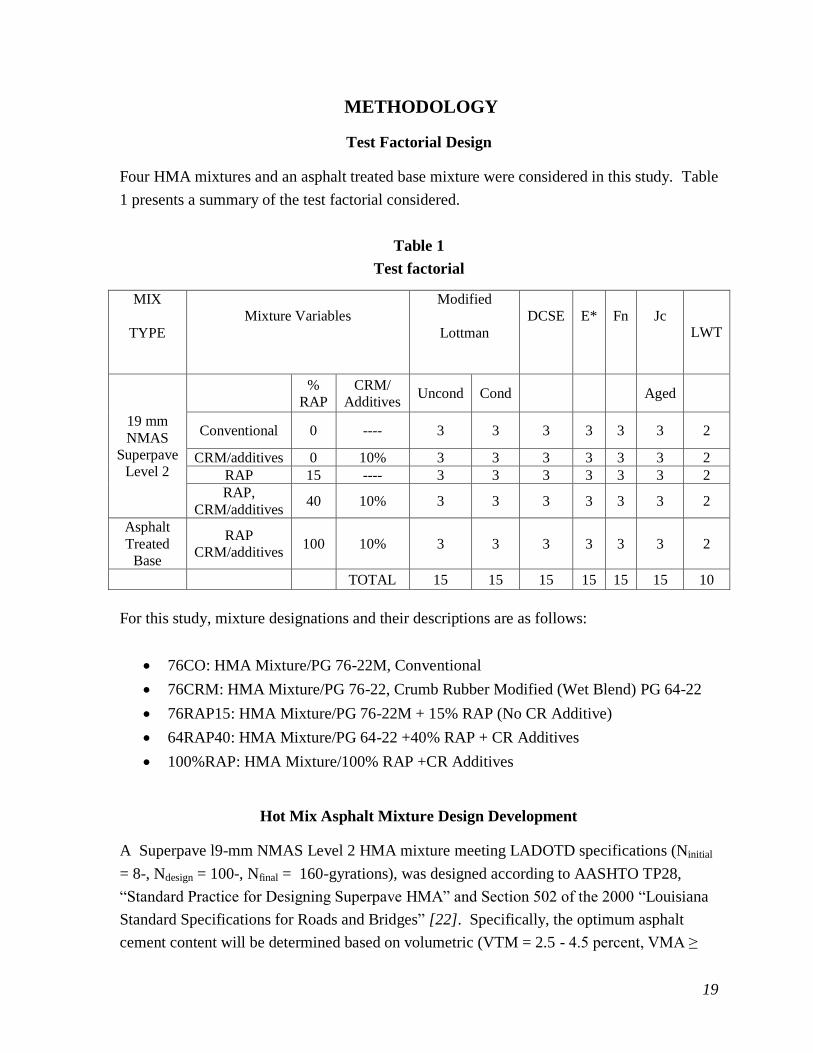
METHODOLOGY
Test Factorial Design
Four HMA mixtures and an asphalt treated base mixture were considered in this study. Table
1 presents a summary of the test factorial considered.
Table 1
Test factorial
MIX
TYPE Mixture Variables
Modified
Lottman DCSE E* Fn Jc
LWT
19 mm
NMAS Superpave
Level 2
%
RAP CRM/
Additives Uncond Cond Aged
Conventional 0 ---- 3 3 3 3 3 3 2
CRM/additives 0 10% 3 3 3 3 3 3 2 RAP 15 ---- 3 3 3 3 3 3 2 RAP,
CRM/additives 40 10% 3 3 3 3 3 3 2
Asphalt
Treated
Base
RAP CRM/additives
100 10% 3 3 3 3 3 3 2
TOTAL 15 15 15 15 15 15 10
For this study, mixture designations and their descriptions are as follows:
76CO: HMA Mixture/PG 76-22M, Conventional
76CRM: HMA Mixture/PG 76-22, Crumb Rubber Modified (Wet Blend) PG 64-22
76RAP15: HMA Mixture/PG 76-22M + 15% RAP (No CR Additive)
64RAP40: HMA Mixture/PG 64-22 +40% RAP + CR Additives
100%RAP: HMA Mixture/100% RAP +CR Additives
Hot Mix Asphalt Mixture Design Development
A Superpave l9-mm NMAS Level 2 HMA mixture meeting LADOTD specifications (Ninitial
= 8-, Ndesign = 100-, Nfinal = 160-gyrations), was designed according to AASHTO TP28,
“Standard Practice for Designing Superpave HMA” and Section 502 of the 2000 “Louisiana
Standard Specifications for Roads and Bridges” [22]. Specifically, the optimum asphalt
cement content will be determined based on volumetric (VTM = 2.5 - 4.5 percent, VMA ≥

20
12%, and VFA = 68% -78%) and densification (%Gmm at Ninitial ≤ 89, %Gmm at Nfinal ≤ 98)
requirements. It is noted that the aggregate structure for all the mixtures considered will be
similar (i.e., the aggregate proportions for the blend selected will be adjusted to allow for the
addition of RAP). Siliceous limestone aggregates and coarse natural sand that are commonly
used in Louisiana will be included in this study.
Four HMA mixtures were evaluated to meet the main objective and were as follows: The
first mixture was a conventional HMA mix type, as a control mixture, that contained no RAP
and no CR additives material type and an SB polymer modified asphalt cement meeting
Louisiana specifications for PG 76-22M. The second mixture contained no RAP and 30
mesh CR and additives blended (wet process) with a PG 64-22 asphalt cement binder, which
yielded a PG76-22. The third mixture contained 15 percent RAP with PG 76-22M asphalt
cement and no CR and additives. The fourth mixture contained 40 percent RAP, 30 mesh
CR and additives, and PG 64-22 asphalt cement.
In the making of the 64RAP40 HMA mixture, crumb rubber additives were introduced as a
dry feed at 10 percent by total weight of asphalt cement binder. This study explored the use
of the absorption properties of crumb rubber to carry asphalt cement binder components that
are typically lost during oxidation of HMA pavements as a dry feed component in the
making of hot mix asphalt mixtures. There were two distinct CR additive components used
as a dry feed in the 64RAP 40 HMA mixtures. The first CR component was comprised of 70
percent 30 mesh crumb rubber that had been pre-swelled, 10 percent long-chain wax, and 20
percent asphaltenes. The second component contained 70 percent 30 mesh pre-swelled
crumb rubber, 10 percent long-chain wax, and 20 percent de-metalized motor oil. The two
components were blended at a 50/50 ratio before being introduced into the HMA mixture at
the specified rate of 10 percent by total weight of binder.
To meet the second objective of this study, an asphalt treated base mixture containing 100%
RAP, 30 mesh CR, and additives was selected. This mixture was designed using the
methodology developed under ongoing LTRC research study 04-4B Development of a
Design Methodology for Asphalt Treated Base Mixture.
The job mix formula for the four HMA mixtures considered in this study is summarized in
Table 2. The design optimum asphalt cement binder content for the mixtures indicated is
similar.

21
Table 2
Job mix formula
Mixture Designation 76CO 76CRM 76RAP15 64RAP40
Mix Type 19.0 mm (3/4 in.) Superpave
Aggregate
Blend
#67 LS 37% 37% 38.5% 34%
#78 LS 25% 25% 24. 5% 19.6%
#11 LS 29% 29% 14% ----
CS 9% 9% 8% 6%
RAP N/A N/A 15% 40%
CR N/A N/A N/A 0.4%
Binder type PG
76-22M
PG
76-22
CRM
PG
76-22M
PG
64-22
% Gmm at NIni 87.0 86.9 87.7 87.6
% Gmm at NMax 97.6 97.5 97.3 98.0
Binder content, % 4. 0 4. 0 4. 1 4.0
Design air void, % 3.7 4.2 3.9 3.4
VMA, % 13 12 13 12
VFA, % 68 66 71 72
Metric (U. S.) Sieve Composite Gradation Blend
37. 5 mm (1½ in.) 100 100 100 100
25.0 mm (1 in.) 100 100 100 100
19.0 mm (3/4 in.) 98 98 95 95
12. 5 mm (1/2 in.) 77 77 77 79
9. 5 mm (3/8 in.) 61 61 60 61
4. 75 mm (No. 4) 41 41 37 37
2. 36 mm (No. 8) 29 29 28 27
1. 18 mm (No. 16) 21 21 21 19
0. 600 mm (No. 30) 15 15 16 15
0. 300 mm (No. 50) 8 8 9 9
0.150 mm (No. 100) 6 6 6 6
0. 075 mm (No. 200) 4. 6 4. 6 4. 6 4.5
Note: N/A: Not Applicable, LS: Limestone, CR: Crumb Rubber, CS: Coarse Sand
76CO: HMA Mixture/PG 76-22M, Conventional
76CRM: HMA Mixture/PG 76-22, Crumb Rubber Modified (Wet Blend) PG 64-22
76RAP15: HMA Mixture/PG 76-22M + 15% RAP (NO CR Additive)
64RAP40: HMA Mixture/PG 64-22 +40% RAP + CR Additives

22
Aggregate Tests
Aggregates from each source were tested to determine aggregate properties. The test items
included coarse aggregate angularity, fine aggregate angularity (FAA), flat and elongated
particles, gradation analysis, and sand equivalency.
For the mixtures considered in this study, RAP, siliceous limestone aggregates (#67
Limestone, #78 Limestone, and #11 Limestone) and coarse sand typically used in Louisiana
were included in this study. To determine the aggregate gradation from each source a
washed sieve analysis was performed on aggregates in accordance with AASHTO T 27
“Standard Method of Test for Sieve Analysis of Fine and Coarse Aggregates.” The gradation
analysis results of these aggregates obtained from sieve analysis are presented in Appendix A
of this document. In addition the measured aggregate consensus properties for the materials
used in this study can be found in Appendix A.
Additionally, the #67 Limestone and #78 Limestone aggregates were sieved and materials
retained on 3/4 in.,1/2 in., 3/8 in., No. 4 sieves, and passing No. 4 sieves were stored in
separate containers. For blending the high RAP content (40 percent) HMA mixture, the RAP
aggregate was fractionated between the +8 and -8 sieves and stored in separate containers.
The RAP did not require fractionation at the lower percentage (15 percent) evaluated in this
study. Separating the aggregates into various sizes was needed so the required aggregate
blend gradations could be batched directly from individual sized fractions for the desired
HMA mix design. This method allowed for consistent replication of the HMA mixtures’
composite aggregate gradation because each sieve size batch weight was mixed at the exact
proportions needed for the hot mix job mix formula.
Figure 1 indicates the gradation blend for each mixture evaluated.

23
Figure 1
Aggregate gradation curves
Asphalt Binder Tests
Asphalt cement binders are one of man’s oldest known engineering materials. The
rheological properties of an asphalt cement binder can affect an HMA pavement’s
performance. An asphalt cement binder’s rheological properties change during the
production of an HMA mixture and as the AC ages over time due to oxidation and
environmental influences. Pavement distresses may result if these changes are not properly
addressed before production of a HMA mixture. Some of the specific types of pavement
distresses that are contributed to by the rheological properties of an asphalt cement binder are
raveling, cracking, stripping, and rutting. To ensure that an asphalt cement binder meets
criteria to reduce and/or prevent pavement distresses due to changes in its rheological
properties, testing of the asphalt cements binder properties is necessary. Therefore
specifications were developed to minimize an asphalt cement binder’s contribution for
durability, rutting, fatigue cracking, and low temperature cracking.
Asphalt cement binders (virgin binder, RAP binder, and RAP with CR additives) were tested
and characterized according to AASHTO PP6, “Practice for Grading or Verifying the
Performance Grade of an Asphalt Binder” in order to determine the effect of the
CRM/additives on asphalt cements considered in this study.

24
The asphalt binders included in this study (PG 64-22, PG 76-22M, and PG76-22) were tested
and characterized according to the “Louisiana Department of Transportation and
Development Performance Graded Asphalt Cement” specifications [23]; see Table 3. The
asphalt cement binder’s rheological properties were measured on unaged binders in
accordance with the American Association of State Highway Transportation Officials
(AASHTO) test methods. The rolling thin film oven (RTFO) test was performed in
accordance with AASHTO T 240-06 “Standard Method of Test for Effect of Heat and Air on
a Moving Film of Asphalt (Rolling Thin-Film Oven Test)” to simulate the binder aging that
occurs during HMA mixture production and construction operations. The RTFO measures
an asphalt cement binder’s resistance to aging (durability) during construction. In addition,
to determine the effect of long-term aging, the pressure aging vessel (PAV) test was
conducted in accordance with AASHTO R 28 “Standard Practice for Accelerated Aging of
Asphalt Binder Using a Pressurized Aging Vessel (PAV)” to simulate binder aging
(hardening) that takes place during an HMA mixture’s service life. The PAV test is used to
measure the resistance to aging (durability). The test purpose of the Rotational Viscometer
(RV) is to measure the binder properties at high construction temperatures to ensure pumping
and handling during production. This test was conducted in accordance with AASHTO T
316-06 “Standard Method of Test for Viscosity Determination of Asphalt Binder Using
Rotational Viscometer” for determining the viscosity of the asphalt binder at 135°C. The
Dynamic Shear Rheometer (DSR) test measures the binder properties at high and
intermediate service temperatures to determine its resistance to permanent deformation
(rutting) and fatigue cracking. The Dynamic Shear Rheometer test was conducted in
accordance with AASHTO T 315-06 “Standard Method of Test for Determining the
Rheological Properties of Asphalt Binder Using a Dynamic Shear Rheometer (DSR)”
method. In addition, the Bending Beam Rheometer (BBR) test is used to measure the asphalt
cement binder properties at low service temperatures to determine its resistance to thermal
cracking. This test was performed in accordance with AASHTO T 313-06 “Standard Method
of Test for Determining the Flexural Creep Stiffness of Asphalt Binder Using the Bending
Beam Rheometer (BBR).” Also, additional tests were conducted to determine the elastic
properties of the asphalt cements considered in this study, utilizing the force ductility and
elastic recovery tests in accordance with AASHTO T 300 “Standard Method of Test for
Force Ductility Test of Asphalt Materials” and AASHTO T 301 “Standard Method of Test
for Elastic Recovery Test of Asphalt Materials by Means of a Ductilometer,” respectively.

25
Table 3
LADOTD performance graded asphalt cement specification
Property AASHTO
Test
Method
Specification
PG 64-22 PG 76-22M
Tests on Original Binder
Rotational Viscosity @ 135°C,
Pa.s T 316 3.0- 3.0-
Dynamic Shear, 10 rad/s, G*/Sin
Delta, kPa T 315 1.30+ @ 64°C 1.00+ @ 76°C
Force Ductility Ratio (F2/F1, 4°C,
5 cm/min, F2 @ 30 cm elongation) T 300 N/A 0.30+
Force Ductility, (4°C, 5 cm/min, 30
cm elongation, kg) T 300 N/A N/A
Tests on RTFO Residue
Dynamic Shear, 10 rad/s, G*/Sin
Delta, kPa T 315 2.20+ @ 64°C 2.20+ @ 76°C
Elastic Recovery, 25ºC, 10 cm
elongation, % T 301 N/A 60+
% Mass Loss T 240 1.00- 1.00-
Tests on PAV Residue
Dynamic Shear, @ 25ºC, 10 rad/s,
G*Sin δ, kPa T 315 5000- 5000-
Bending beam Creep Stiffness, S,
Mpa T 313 300- 300-
Bending beam Creep Slope, m
value T 313 0.300+ 0.300+
Note: N/A: Not Applicable
“M” designation indicates modified
HMA Mixture Blending
Upon the completion of the design phase of this study, aggregate blending calculations were
performed to determine the weight of each dry aggregate component for a specific batch
weight. After determining each aggregate’s batch weight, aggregates were weighed and
placed in flat pan. After batching, the aggregates were placed in a force draft oven at 163 °C
until such time that they reached this temperature. Approximately 1 hour before blending of

26
the aggregate with the asphalt cement (AC) binder, the AC was placed in a force draft oven
at 163°C. To ensure uniform mixing, all mixing equipment was also placed in the force draft
oven at 163°C prior to blending aggregate and AC components. After all components
reached the temperature of 163°C, these materials were placed in a mixing bucket. A crater
in the center of the blended aggregate was formed for placement of the AC binder component
at the specified batch weight. The mixing operation followed immediately after the AC
binder component was added to the aggregate to ensure uniform blending of the materials.
After mixing, the final HMA mixture was distributed in a flat pan and then placed back in a
force draft oven at 163°C for 1 hour for short term aging. Upon completion of this step, the
samples were prepared using the Superpave gyratory compactor to the specified dimensions
for each particular test procedure.
When blending RAP as an aggregate component, it was important to add moisture to the pre-
dryed RAP. For this study 5 percent moisture was added to the dryed RAP and then sealed
prior to use. The virgin aggregates were placed in a force draft oven at 204°C to superheat
the aggregate. The superheated aggregate is needed to cause steaming of the RAP (Figure 2),
which also helps distribute heat and activate the RAP binder. The superheated aggregate
components and moisture laden RAP were placed in the mixing bucket as follows: first the
RAP was placed in the heated mixing bucket on the bottom then the superheated aggregate
was placed on top of the RAP. The aggregates were then blended until there were no visible
signs of steaming. After mixing the blended aggregates were distributed in a flat plan and
placed in the oven at 163°C to remove any remaining moisture and bring the aggregate blend
to the temperature of 163°C for required incorporation of the asphalt cement. The remaining
blending steps were followed as previously described.
It is noted that the addition of crumb rubber at 10 percent by weight of total asphalt cement
binder occurred after placement of the RAP and prior to placement of the superheated
aggregate in the mixing bucket.
Figure 2 is a pictorial representation of the HMA mixture blending procedure.

27
Figure 2
HMA mix blending procedure
Fabrication of Mixture Specimens
Laboratory mix specimens were prepared according to the specific requirements of each
individual test. According to the test factorials described, cylindrical samples were
fabricated. An SGC as shown in Figure 3 was used to compact all cylindrical specimens.

28
Figure 3
SGC
Laboratory Tests on HMA Mixtures
Laboratory mechanistic performance and material characterization tests were conducted to
evaluate the laboratory performance of conventional HMA mixtures and mixtures containing
high RAP content and waste tire crumb rubber/additives through their fundamental
engineering properties. HMA mixture characterization in terms of fatigue cracking, moisture
susceptibility, and rutting were analyzed and evaluated to determine the effects of the crumb
rubber, additives, and RAP on the HMA mixtures’ performance. Specimens fabricated
through various methods at the target air voids (7 ± ½%) were used to conduct laboratory
mixture performance tests as outlined in Table 4. A brief description of each test is provided
below. With the exception of LWT, triplicate samples were used for each test.

29
Table 4
Mixture performance tests
Performance
Characteristics Test Specimen Details
Test
Temp. Protocol
Durability Modified Lottman*
150 x 95 mm — AASHTO T 283
Permanent
Deformation
Complex Modulus 150 x 100 mm 54 ºC AASHTO TP7
Flow Number 150 x 100 mm 54 ºC AASHTO TP7
Loaded Wheel
Tracking (LWT)
150 x 60 mm, 320mm x 260mm
x 80mm
54 ºC AASHTO T 324
Fatigue
Cracking
DCSE 150 x 50 mm 10 ºC Roque [24]
Semi Circular
Bend 150 x 57 mm 25 ºC Mohammad [25]
*One freeze/thaw cycle only.
Modified Lottman Test
This test evaluates the effect of saturation and accelerated water conditioning on compacted
HMA samples utilizing freeze-thaw cycles. This method quantifies HMA mixtures’
sensitivity to moisture damage, which is necessary to assure durability and long lasting hot
mix asphalt. Numerical values of retained indirect-tensile properties are obtained by
comparing conditioned samples, samples subjected to vacuum saturation and freeze-thaw
cycles, to unconditioned samples. “Unconditioned” samples are samples that are not
saturated nor subjected to freeze-thaw cycles. For each mix used in the study, six 150 x 95-
mm diameter samples were compacted with a SGC to an air void content of 7 ± 0.5 percent.
After compaction and air void determination, the six SGC samples were subdivided into two
groups of three samples, so the average air void contents of the two subsets are
approximately equivalent. The “unconditioned” sample subset was stored at room
temperature for 24 ± 3 hours. Afterwards the “unconditioned” specimens were wrapped or
placed in a heavy duty, leak proof plastic bag and then placed in a 25 ± 0.5 °C water bath for
2 hours ± 10 minutes. The “unconditioned” specimens were then tested to determine the
indirect tensile strength for each sample. The “conditioned” samples were placed in a
freezer at -17 °C for 16 to 18 hours. After the freezing cycle, the conditioned samples were

30
placed in a 60°C water bath for 24 hours. Upon completion of the freeze/thaw cycle, the
indirect tensile strength for the conditioned samples was determined. The average indirect
tensile strength was determined for both conditioned and unconditioned samples by summing
the test values and then determining the average value. The tensile strength ratio (TSR) is
defined as the ratio of the conditioned to the unconditioned indirect tensile strength
(AASHTO T-283, 2003) [26].
Dissipated Creep Strain Energy Test
Fatigue cracking is a major asphalt pavement distress that concerns the owners of asphalt
pavement highways. Fatigue cracking begins as microcracks that later coalesce to form
macrocracks that propagate due to either tensile or shear stress or a combination of both.
Research has indicated that a threshold concept is a good indicator of the cracking
mechanism of asphalt pavements, and DCSE is the most reliable criterion to be used as this
threshold [27]. The DCSE threshold represents the energy that the mixture can tolerate
before it fractures. Two laboratory tests, the indirect resilient modulus (MR) test and the ITS
tests, were conducted at 10°C on the same specimen to calculate the dissipated strain
energy[28, 29] . Triplicate specimens of 150 mm in diameter and 50 mm in thickness were
used. Sample instrumentations as shown in Figure 4 were used in order to accurately capture
the small deformations resulting from the repeated load applied in the MR test. Two units of
single integral, bi-axial extensometers model 3910 from epsilon technology that measure
both lateral and vertical deformations were clipped onto gage points mounted on each face of
the specimen. The gage length (i.e., the distance between two gage points) was maintained at
3 inches, which is one half of the sample diameter [28]. The test specimens were
conditioned at 10°C for four hours before a 200-cycle haversine load with 0.1-second loading
period and 0.4-second rest period in each loading cycle was applied along the diametrical
plane on the specimen. A conditioning loading sequence was applied before the actual test in
order to obtain uniform measurements in load and deformation. Then, a four-cycle haversine
compressive load was applied and load and deformation data were recorded continuously.
The magnitude of the applied load should result in a deformation as close as possible to 100
microstrains. After one test was complete, the specimen was rotated 90 degrees and tested
again. The resilient modulus was then calculated from the average value of the two test
results. Once the MR test was finished, the ITS test was performed on the same specimen.
Both tests, MR and ITS, were performed using a Materials Testing System (MTS) hydraulic
loading system, which was also be the same system used for the SCB test.

31
Figure 4
DCSE test sample instrumentation
The DCSE calculation used in this study was introduced by Roque et al. and later used by
Alshamsi [24], [30], [31]. As indicated in Figure 5, DCSE is defined as the fracture energy
(FE) minus the elastic energy (EE). The fracture energy is defined as the area under the
stress-strain curve up to the point where the specimen begins to fracture. As shown in Figure
5 the area within the curve OA and x-axis (i.e., area OAB) is the fracture energy. The elastic
energy is the energy resulting in elastic deformation. Therefore, MR, calculated from the
resilient modulus test, is selected as the slope of the line AC and the area of triangle ABC is
taken as the EE. The failure strain (f), peak tensile strength (St), and fracture energy are
determined from the ITS test. A rather clear picture of DCSE calculation is described below:
0f
tr
SM
(1)
Therefore, R
tfR0
M
)SM( (2)
)(S2
1EE 0ft (3)
DCSE = FE – EE (4)

32
Strain
Str
ess (
Psi)
A
BCO
Tensile Strength
Dissipated Creep Strain Energy (DE)
Elastic Energy(EE)
f
MR
MR
Figure 5
Dissipated creep strain energy determination
SCB Test
This test characterizes the fracture resistance of asphalt mixtures based on a fracture
mechanics concept, the critical strain energy release rate, also called the critical value of J-
integral, or Jc [32], [33], [27]. To determine the critical value of J-integral, semi-circular
specimens with three notch depths (25.4, 31.8, and 38.0 mm) were tested. The test was
conducted at 25oC. A semi-circular specimen was loaded monotonically till fracture under a
constant cross-head deformation rate of 0.5 mm/min in a three-point bend load configuration
(Figure 6).
The load and deformation were continuously recorded and the critical value of J-integral was
determined based on the following equation:
da
dU
b
1JC
(5)
where,
b = sample thickness,
a = the notch depth, and
U = the strain energy to failure.
Dissipated Creep Strain Energy (DCSE)

33
Aged samples were prepared and tested to examine the influence of CR additives and high
RAP contents mixtures performance. Mixture aging was performed according to AASHTO
PP2 by placing compacted specimens in a forced draft oven for five days at 85°C [34].
a
2s
2rd
P
notch
P
2
P
2
b
Figure 6
Set-up of semi-circular bending test
Simple Performance Tests (SPTs)
Simple SPTs were performed to characterize the laboratory performance of mixtures
evaluated in this study with respect to resistance to permanent deformation as measured by
the dynamic modulus and flow number tests. Using the measured dynamic modulus and
phase angles obtained from the simple performance tests, a rutting factor and a fatigue factor
can be developed, which is an indication of a HMA mixtures ability to resist permanent
deformation (i.e., rutting).
Dynamic Modulus, |E*|. The dynamic modulus test is a triaxial compression test,
which was standardized in 1979 as ASTM D3497, “Standard Test Method for Dynamic
Modulus of Asphalt Concrete Mixtures” [35]. This test consists of applying a uniaxial
sinusoidal (i.e., haversine) compressive stress to an unconfined or confined HMA cylindrical
test specimen as shown in Figure 7. The stress to strain relationship under a continuous
sinusoidal loading for linear viscoelastic materials is defined by a complex number called the
“complex modulus” (E*). The absolute value of the complex modulus |E* | is defined as the
dynamic modulus. The dynamic modulus is mathematically defined as the maximum (i.e.,
peak) dynamic stress (σo) divided by the peak recoverable strain (o).
2rd=152mm, 2s=127mm, b=57mm

34
o
o*E
(6)
This test is conducted at -10, 4, 20, 38.8, and 54.4°C at loading frequencies of 0.1, 0.5, 1.0, 5,
10, 25 Hz at each temperature [36].
Figure 7
Mixture stress-strain response under sinusoidal load
Repeated Loading Test/Flow Number Test. The flow number test is used to
determine the permanent deformation characteristic of hot mix asphalt mixtures by applying
a repeated haversine load for several thousand cycles on a cylindrical asphalt sample. The
load is applied for 0.1 second with a rest period of 0.9 second in one cycle as shown in
Figure 8.
In this study, the test was conducted for 10,000 cycles at 54°C, and a stress level of 30 psi
was used. This test was conducted on specimens 100 mm in diameter and 150 mm tall for
mixtures with nominal maximum size aggregates less than or equal to 37.5 mm (1.5 in.). The
flow number is defined as the number of repetitions corresponding to the minimum rate of
change in permanent strain under repeated loading conditions. It is determined by
differentiation of the permanent strain versus the number of load cycles curve. Figure 8

35
represents an example of a typical permanent axial strain response and the computation of
flow number.
Figure 8
Stages of accumulated permanent strain and flow number computation
Loaded Wheel Tracking Device Test
One of the major distresses in asphalt pavements is its inability to resist permanent
deformation due to traffic loading. To determine the rutting characteristics of the HMA
mixtures considered in this study, a loaded wheel tracking test was conducted in accordance
with AASHTO T 324-04 “Standard Method of Test for Hamburg Wheel-Track Testing of
Compacted Hot-Mix Asphalt (HMA).” In this test, specimens are subjected to a steel wheel
weighing 703 N, which is repeatedly rolled across its surface while being submerged in 50°C
hot water. The test completion time is predicated upon test specimens being subjected to a
maximum of 20,000 cycles or attainment of 20 mm deformation, whichever is reached first.
Upon completion of the test, the average rut depth for the samples tested are recorded.
The Hamburg type LWT manufactured by PMW, Inc. of Salina, Kansas was used in this
study (Figure 9). The Hamburg LWT can test two specimens simultaneously. The test
specimens are subject to two reciprocating solid-steel wheels of 203.5 mm in diameter and

36
47 mm in width while being submerged in hot water at the specified temperature of 50°C
which was utilized in this study. Before actual testing of the laboratory specimens, they
were conditioned at 50°C, for 90 minutes. After conditioning, a fixed load of 703 N with a
rolling speed of 1.1 km/h at the rate of 56 passes/min was implied. Each wheel rolls 230
mm before reversing direction.
In order to accurately measure permanent deformation, two Linear Variable Displacement
Transducers (LVDTs) were utilized and the subsequent test results (rut depths, number of
passes, and water bath temperature) were collected and recorded in an automatic data
recording system associated with the Hamburg Wheel Tracking Device used in this study.
Figure 10 represents a typical LWT test output.
Figure 9
Hamburg loaded wheel tracking device
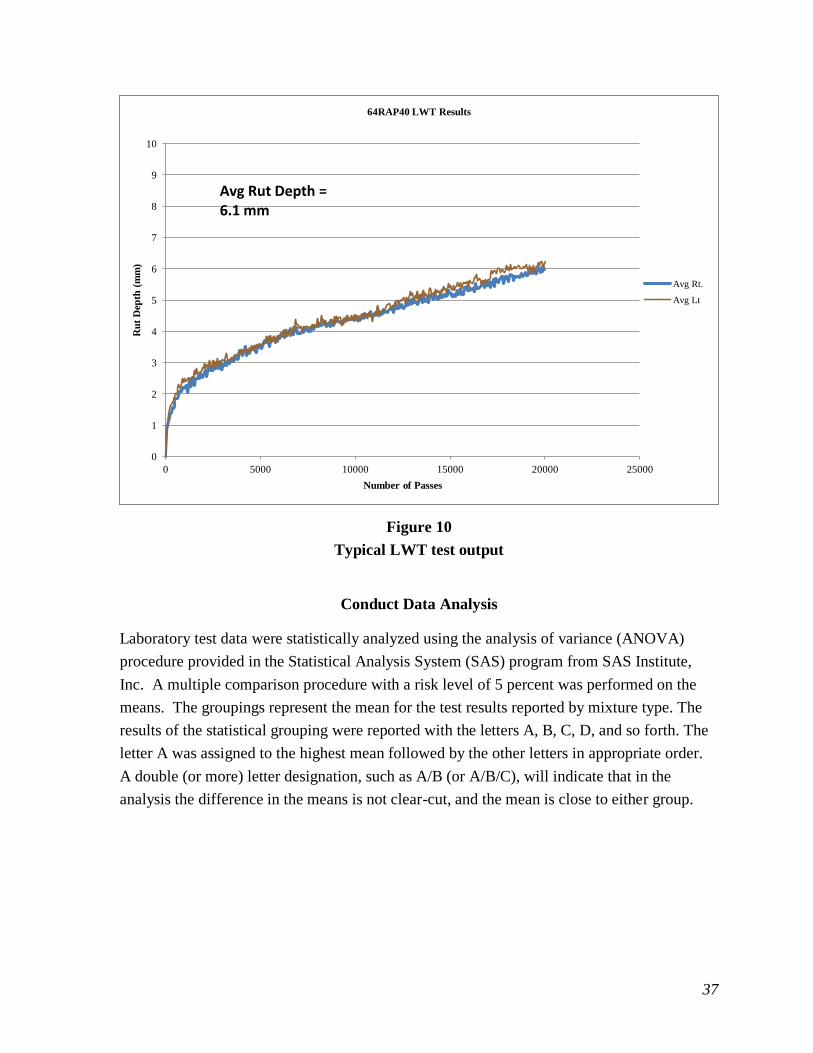
37
Figure 10
Typical LWT test output
Conduct Data Analysis
Laboratory test data were statistically analyzed using the analysis of variance (ANOVA)
procedure provided in the Statistical Analysis System (SAS) program from SAS Institute,
Inc. A multiple comparison procedure with a risk level of 5 percent was performed on the
means. The groupings represent the mean for the test results reported by mixture type. The
results of the statistical grouping were reported with the letters A, B, C, D, and so forth. The
letter A was assigned to the highest mean followed by the other letters in appropriate order.
A double (or more) letter designation, such as A/B (or A/B/C), will indicate that in the
analysis the difference in the means is not clear-cut, and the mean is close to either group.
0
1
2
3
4
5
6
7
8
9
10
0 5000 10000 15000 20000 25000
Ru
t D
epth
(m
m)
Number of Passes
64RAP40 LWT Results
Avg Rt.
Avg Lt
Avg Rut Depth = 6.1 mm


39
DISCUSSION OF RESULTS
Asphalt Binder Test Results
It is important to realize that an asphalt cement binder’s rheological properties have an effect
on the performance of an HMA pavement. Changes in the AC rheological properties due to
production and aging that result from oxidation and environmental influences must be
addressed to reduce asphalt binder related pavement distresses such as raveling, cracking,
stripping, and rutting. It is essential that the asphalt cement binders are tested to ensure that
the binder rheology meets specified criteria necessary to reduce pavement distresses.
Therefore specifications were developed to characterize an asphalt cement binder’s rheology,
which is necessary to minimize the AC’s contribution to durability issues, rutting, fatigue
cracking, and low temperature cracking.
Table 5 presents the physical and rheological asphalt cement binder test results for the
asphalt cement binders considered in this study. The PG 76-22 designated material as shown
in Table 5 utilized unmodified asphalt cement (PG 64-22) that had been wet blended with CR
to yield PG 76-22 asphalt cement binder. The PG 76-22 asphalt cement binder had a CR
total content of 9 percent crumb rubber additive, 8 percent 30 mesh crumb rubber, and 1
percent Gilsonite. The 64RAP40 extraction sample is the extracted asphalt cement binder
taken from the 64RAP40 HMA mixtures and subsequently tested for specification
compliance. Table 5 shows the final test results for the conventional and crumb rubber
modified (wet blend) virgin asphalt cement binders used in this study. Also shown in Table
5 is the asphalt binder rheology test results for the extracted asphalt cement binder from
64RAP40 HMA mixture. The rotational viscosity measured at 135°C for all ACs considered
in this study passed the specified criteria of 3.0 Pa·s (maximum value) with the exception of
the PG 76-22 binder, 3.1 Pa·s. The conventional asphalt cement binders (PG 64-22 and PG
76-22M) utilized in this study passed all specification requirements for their appropriate
grading as observed in Table 5. In regards to the extracted 64RAP40 binder, research has
shown that when high percentages of RAP are incorporated (i.e., 40 percent as in the
64RAP40 HMA mixture) into an HMA mixture, the blended asphalt cement (RAP AC plus
virgin AC) will be stiffer and will grade out as high as three temperature grades, high and
low temperature specification parameters, above the original virgin AC used [4]. For
example, the virgin AC grading is PG 64-22, then 40 percent RAP is added to the mixture,
and RAP AC blends with the virgin AC during production. The asphalt cement is extracted
from the HMA mixture and then tested to determine it grading. The final grading could be as
much as three temperature grades higher (high temperature and low temperature) than

40
original grading, i.e., PG 82-4. Table 5 shows that this was not the case in the 64RAP40
extraction. The actual final performance grade of this material was a PG 70-28. The
addition of the CR additives softened the RAP binder such that the final blended material
stiffness was not increased. In fact, on the high temperature side, there was an increase in
one temperature grade from PG 64 to PG 70, and there was a decrease in the low temperature
properties of one grade, from -22 to -28. It must be noted that the extracted binder material
did not go through the PAV process that provides for long-term service aging. Aging the
64RAP40 extracted binder with this process would have additionally stiffened the G*Sinδ
and bending beam results. Nevertheless, the 64RAP40 extracted binder generally should be
more rut and fatigue resistant than the PG 64-22, while also being more resistant to low
temperature cracking (thermal cracking). In addition, in regards to pavement performance
based on the asphalt cement binder rheology presented in Table 5, the 64RAP40 HMA
mixture could possibly be comparable to the conventional PG 76-22M HMA mixture (76CO)
with respect to pavement deformation, especially since the G*/Sinδ rutting factor on the
original binder test parameter passed at the temperature of 76°C. Also the 64RAP40 HMA
mixture resistance to fatigue cracking should be better than the conventional mixture (64CO)
utilizing the PG 64-22. Table 5 indicates that the addition of a crumb rubber as a dry feed for
the purpose of carrying rejuvenating type additives without sacrificing performance is viable.

41
Table 5
LADOTD performance graded asphalt cement test results
Spec
PG
64-22
PG
76-22M
PG 76-22
Wet Blend
(CRM)
Extraction
from
64RAP40
HMA
Mixture
Dynamic Shear, G*/Sin(δ), (kPa) 1.30+
@ 64°C 1.92 — — 6.65
Dynamic Shear, G*/Sin(δ), (kPa) 1.00+
@ 70°C 0.88 — — 3.35
Dynamic Shear, G*/Sin(δ), (kPa) 1.00+
@ 76°C — 1.82 2.71 1.56
Dynamic Shear, G*/Sin(δ), (kPa) 1.00+
@ 82°C — 1.29 1.54 —
Dynamic Shear, G*/Sin(δ), (kPa) 1.00+
@ 88°C — — 1.29 —
Force Ductility Ratio (F2/F1,
4°C, 5 cm/min,
F2 @ 30 cm elongation
0.30+
(PG 76-
22m)
N/A 0.49 N/A N/A
Rotational Viscosity @ 135°C
(Pa·s) 3.0+ 0.5 1.7 3.1 1.3
Dynamic Shear, G*/Sin(δ), (kPa) 2.20+
@ 64°C 3.25 — — 5.56
Dynamic Shear, G*/Sin(δ), (kPa) 2.20+
@ 70°C 1.61 — 4.72 3.07
Dynamic Shear, G*/Sin(δ), (kPa) 2.20+
@ 76°C — 2.48 5.97 1.68
Dynamic Shear, G*/Sin(δ), (kPa) 2.20+
@ 82°C — 1.67 3.25 —
Dynamic Shear, G*/Sin(δ), (kPa) 2.20+
@ 88°C — — 1.89 —
Elastic Recovery, 25ºC,
10 cm elongation, %
60+ (PG
76-22m) N/A 70 75 N/A
Dynamic Shear, @ 25°C,
G*Sin(δ), (kPa) 5000- 2774 2297 2166 1463
Bending Beam Creep Stiffness
@ -12°C, (MPa) 300- 234 152 104 53
Bending Beam
m-value@ -12°C 0.300+ 0.312 0.327 0.320 0.421
Bending Beam Creep Stiffness
@ -18°C, (MPa) 300- — — — 151
Bending Beam
m-value@ -18°C 0.300+ — — — 0.342
Actual PG Grading PG
64-22
PG
76-22M
PG
76-22
PG
70-28
Note:“ — ” Test was not performed
N/A: Not applicable

42
It is shown in Table 5 that the addition of crumb rubber as a wet blend (PG 76-22CRM)
increased the dynamic shear G*/Sinδ rutting factor properties and rotational viscosity of the
asphalt cement binder while improving the fatigue rutting factor G*(Sinδ) as indicated by the
dynamic shear results at the 25°C testing temperature. The addition of the wet blended
crumb rubber appears to have also improved the elastic properties of the asphalt cement
binder tested as shown by the bending beam test results.
In order to determine if the CR additives had an effect on the recycled asphalt pavement used
in this study, it was necessary to blend the crumb rubber additives with the RAP and then
extract the asphalt cement binder from the HMA mixture. Table 6 presents the extracted
RAP asphalt cement binder test results for the 100 percent RAP and the 100 percent RAP
with CR additive blend. It is noted that the asphalt cement materials characterized in Table 6
did not go through the RTFO and PAV aging methods since the RAP utilized in this study
was from a roadway previously constructed 15 years earlier and this material had been
through the short term and long term aging process naturally throughout its life on the
roadway. However this material was tested as if they had been aged through RTFO and
PAV. It is shown that both materials graded out as a PG 82-16; however, in review of each
test parameter, the addition of the crumb rubber to the RAP had a positive effect. The actual
test results showed a significant improvement in regards to G*/Sinδ, rutting factor, tested as
the original asphalt cement binder and as tested as a RTFO material. In addition, the
G*(Sinδ), fatigue factor, as tested on the PAV material exhibited a substantial improvement
over the extracted 100 percent RAP material.

43
Table 6
Extracted RAP asphalt cement binder rest results
Spec
Extracted
100%
RAP
Extracted
100% RAP
w/ CR
Test on Original Binder
Dynamic Shear, G*/Sin(δ), (kPa) 1.00
+
@ 70°C 32.23 13.82
Dynamic Shear, G*/Sin(δ), (kPa) 1.00
+
@ 76°C 14.25 6.41
Dynamic Shear, G*/Sin(δ), (kPa) 1.00
+
@ 82°C 6.41 3.08
Dynamic Shear, G*/Sin(δ), (kPa) 1.00
+
@ 88°C 3.18 1.53
Rotational Viscosity @ 135°C (Pa·s) 3.0+ 3.9 3.1
Tests on RTFO
Dynamic Shear, G*/Sin(δ), (kPa) 2.20
+
@ 70°C 24.94 14.40
Dynamic Shear, G*/Sin(δ), (kPa) 2.20
+
@ 76°C 8.53 7.03
Dynamic Shear, G*/Sin(δ), (kPa) 2.20
+
@ 82°C 4.07 pass 3.25 pass
Dynamic Shear, G*/Sin(δ), (kPa) 2.20
+
@ 88°C 1.90 1.63
Tests on (RTFO+ PAV)
Dynamic Shear, @ 25°C, G*Sin(δ),
(kPa) 5000
- 8616 4149
Dynamic Shear, @ 28°C, G*Sin(δ),
(kPa) 5000
- 6135 2748
Dynamic Shear, @ 31°C, G*Sin(δ),
(kPa) 5000
- 4329 1899
Bending Beam Creep Stiffness @ -12°C,
(MPa) 300
- 200 275
Bending Beam
m-value@ -12°C 0.300
+ 0.299 0.238
Bending Beam Creep Stiffness @ -18°C,
(MPa) 300
- 397 423
Bending Beam
m-value@ -18°C 0.300
+ 0.236 0.191
Actual PG Grading PG 82-16 PG 82-16

44
Figure 11 is a graphical illustration of the dynamic shear rutting factor results of the 100
percent RAP and 100 percent RAP with crumb rubber additives. It is shown that throughout
the temperature ranges tested the 100 percent RAP and crumb rubbers were substantially
improved over the 100 percent RAP only material. It is shown that both materials passed the
required specification of 1.1 kPa at 88°C.
0
5
10
15
20
25
30
35
70 C 76 C 82 C 88 C
Dyn
am
ic S
hear
(kP
a)
Temperature
100% RAP 100% RAP + CR
Figure 11
Dynamic Shear, G*/Sin(δ) (RAP binder tested as original)
Figure 12 illustrates the rutting factor, G*/Sinδ, dynamic shear test results on both extracted
materials tested as an RTFO material. This figure also shows a benefit in the addition of
crumb rubber additives as can be seen by the lower values for each test temperature tested. It
is noted that these materials passed the specification requirement of 2.2 kPa at 82°C yet
failed this criteria at the 88°C test temperature. Therefore these materials grade out as a PG
82 material on the high temperature side of the performance graded binder specification.
Figure 13 presents the graphical representation of the fatigue factor, G*(Sinδ), dynamic shear
test results for the 100 percent RAP and 100 percent RAP and crumb rubber additives tested
as a PAV material. It is shown that there was an improvement in the binder characterization
when the crumb rubber additives were blended with the 100 percent RAP as indicated by the
decrease in actual test values. This improvement can be seen at all test temperatures

45
conducted for fatigue factor determination. The specification criterion for this material is a
maximum value of 5000 kPa tested at 25°C. In Table 6, it is indicated that the 100 percent
RAP and crumb rubber additives passed this criteria at the required specification test
temperature of 25°C and that the 100 percent RAP binder had a failing test value of 8616 kPa
at this temperature. It is shown that the 100 percent RAP binder attained a passing test value
of 4329 kPa at the test temperature of 31°C; whereas, the 100 percent RAP and crumb rubber
additive binder decreased to a test value of 1899 kPa.
0
5
10
15
20
25
30
70 C 76 C 82 C 88 C
Dyn
am
ic S
hear
(kP
a)
Temperature
100% RAP 100% RAP + CR
Figure 12
Dynamic Shear, G*/Sin(δ) (RAP binder tested as RTFO)
0
1000
2000
3000
4000
5000
6000
7000
8000
9000
25 C 28 C 31 C
Dyn
am
ic S
hear
(kP
a)
Temperature
100% RAP 100% RAP + CR
Figure 13
Dynamic Shear, G*Sin(δ) (RAP binder tested as PAV)

46
Figure 14 shows the rotational viscosity test results for both extracted RAP binders. It is
indicated that both materials failed specification criteria of 3.0 Pa·s at the test temperature of
135°C. However the addition of the CR clearly illustrates a reduction in viscosity as
indicated.
0
0.5
1
1.5
2
2.5
3
3.5
4
4.5
135 C
Vis
co
sity
(P
a·s
)
Temperature
100% RAP 100% RAP + CR
Figure 14
RAP binder rotational viscosity
HMA Mixture Characterization Test Results
Several laboratory tests were conducted and evaluated to measure the performance
characteristics of the HMA mixtures considered in this study. The pavement performance
characteristics were analyzed for the HMA mixtures’ durability as measured by the modified
Lottman test. The HMA mixtures’ performance in terms of resistance to fatigue cracking
was evaluated from results obtained from the SCB, DCSE, and dynamic modulus [i.e.,
fatigue factor, E*(Sinδ)] tests. Furthermore, dynamic modulus (i.e., rutting factor, E*/Sinδ)
and flow number were used to determine the mixtures resistance to permanent deformation.
In addition, a simulative type test was performed, LWT. Triplicate samples were prepared
and tested for each laboratory test. The detailed analysis for these test results is included in
the following sections of this chapter.
Modified Lottman Test Results
The modified Lottman test evaluates the effect of saturation and accelerated water
conditioning on compacted HMA samples utilizing freeze-thaw cycles. This test quantifies

47
HMA mixtures’ sensitivity to moisture damage, which is necessary to assure durability and
long lasting hot mix asphalt pavements. Moisture sensitivity is measured by the percentage
of retained tensile strength ratio of the conditioned samples compared to the control samples.
The conditioned samples are samples that have been subjected to the required freeze/thaw
cycle. Louisiana requires that the retained tensile strength be equal or greater than 80 percent
to be considered as a passing result. Table 7 presents the measured modified Lottman test
results and Figure 15 is the graphical presentation of the test results as shown in Table 7 for
the five mixtures evaluated in this study. It is noted that no liquid anti-strips that facilitate
adhesion of the asphalt cement binder to the aggregates were used in this study. In doing so,
the test results specifically indicate the asphalt cement binders effect on adhesion to the
aggregate by the measure of the percent retained tensile strength ratio. As expected the
100% RAP mixture failed the modified Lottman test. In addition, HMA mixtures 76CO and
76RAP15, which contain SBS modified asphalt cement binder (PG 76-22M), had passing
results. It is shown in Table 7 that the HMA mixture 76RAP15 had the highest percent
tensile strength ratio followed by the 76CO mixture. In addition, the HMA mixture
64RAP40 that contains an unmodified AC (PG 64-22), 40 percent RAP, and CR additives
passed the modified Lottman test. However the mixture 76CRM failed this test. The AC
used in the 76CRM HMA mixture is unmodified asphalt cement (PG 64-22) that has been
wet blended with CR to yield PG 76-22 asphalt cement. The CR modified asphalt had a total
of 9 percent crumb rubber and additive (8 percent 30 mesh crumb rubber, and 1 percent
Gilsonite). It is suspected that the percentage of Gilsonite, which is used to increase
resistance to water susceptibility (stripping), was insufficient to increase the retained tensile
strength to passing level at the percentage incorporated into the total blend of 9% utilized to
make the PG 76-22 CR modified asphalt cement binder.

48
Table 7
Modified Lottman test results
Mix Type Tensile Strength (PSI)
Mix Type Tensile Strength (PSI)
Control Conditioned Control Conditioned
76CO Average 188.44 160.83 76CRM Average 155.99 107.37
Stdev 9.27 28.11 Stdev 6.82 7.48
CV 4.92 17.48 CV 4.37 6.97
%TSR 85.3 %TSR 68.8
76RAP15 Average 160.64 140.22
64RAP40
Average 185.91 150.34
Stdev 4.01 8.35 Stdev 17.57 9.04
CV 2.49 5.95 CV 9.45 6.01
%TSR 87.3 %TSR 80.9
100%RAP
Average 138.47 70.66
Stdev 23.15 32.78
CV 16.72 46.39
%TSR 51.0
Figure 15
Modified Lottman retained tensile strength
0
10
20
30
40
50
60
70
80
90
100
76C0 76CRM 76RAP15 64RAP40 100%RAP
Mix Type
% T
SR
80% TSR

49
DCSE Test Results
The calculated DCSE threshold values represent the energy that the mixture can tolerate
before it fractures. Roque et al. reported that a DCSE minimum value of 0.75 Kj/m3 as the
limiting criterion [30]. HMA mixtures having a DCSE value greater than 0.75 Kj/m3 are not
as susceptible to cracking. Figure 16 represents the calculated DCSE mean values for the
HMA mixtures analyzed in this study. The coefficient of variation (CV) of the samples
tested ranged from 6 to 18 percent. It is shown that the 76CO mixture has the highest DCSE
values of all mixtures tested and therefore is less prone to crack. In addition, three out of the
five mixtures meet the 0.75 KJ/m3 criteria for resistance to cracking. The 64RAP40 and the
100%RAP mixtures had less than the limiting criterion necessary for fracture resistance.
Figure 16
Dissipated Creep Strain Energy test results
Semi-Circular Bend (SCB) Test Results
Table 8 indicates the average peak load during testing that was required to cause cracking to
begin at the tip of the sample notches, which were previously cut as part of the sample
preparation. It is shown in this table that there is a decrease in peak load as the notch depths
0
0.5
1
1.5
2
2.5
3
3.5
4
4.5
76CO 76CRM 76RAP15 64RAP40 100%RAP
Mix Type
DC
SE
, K
j/m
3 (
AG
ED
)
0.75Kj/m3

50
are increased for all mix types. This is consistent since it would take lower peak loads to
propagate cracking as the effective depth of the sample above the notch decreases due to the
increased sample notch depth. In addition, Table 8 indicates that in general for the mixtures
studied, the mixtures containing RAP had the highest SCB peak loads. It is noted that the
76RAP15 followed by the 100% RAP mixture had the highest peak loads necessary to
propagate cracking as shown in Table 8. It is noted that the 76RAP15 has the highest peak
load followed by the 100%RAP and 64RAP40 HMA mixtures, respectively.
Figure 17 presents the calculated critical fracture resistance (Jc) values for the six HMA
mixture types evaluated. In terms of fracture resistance, the higher the Jc value the greater
the fracture resistance the HMA mixtures possess. It is shown that the 76RAP15 HMA
mixture had the highest Jc value and, therefore, has the greatest fracture resistance of all
mixtures evaluated in this study. The 100%RAP mixture attained the lowest Jc and has the
highest propensity for fatigue cracking.
Table 8
SCB peak load test results
Mix Type
Peak Load (KN)
Aged
Notch Depths (mm)
25.4 31.8 38.0
64CO 0.75 0.62 0.37
76CO 1.11 0.77 0.45
76CRM 1.18 0.92 0.64
76RAP15 1.77 1.03 0.85
64RAP40 1.17 1.11 0.65
100%RAP 1.28 0.97 0.78

51
In a previous study, Mohammad et al. indicates that any mixture achieving a Jc value greater
than 0.65 Kj/m2 is expected to exhibit good fracture resistance [33]. Figure 17 indicates that
with the exception of the 100%RAP and 64RAP40 mixtures all other mixtures passed this
criterion.
Figure 17
Semi-circular bend test results
Dynamic Modulus (E*) Test Results
The purpose of the dynamic modulus test is to evaluate the visco-elastic response
characteristics of HMA mixtures over a given range of temperatures and frequencies. Figure
18 and 19 present the dynamic modulus isotherms at various temperatures and frequencies
for all mixtures considered in this study. The values indicated are the average E* results for
three laboratory specimens evaluated per HMA mixture type. The CV of the samples tested
ranged from 1 to 18 percent. As shown in Figure 18 and Figure 19, the E* values increase as
the frequency increases. Furthermore the E* values decrease with increased temperatures.
Figure 19 indicates that, at low temperatures (4.4°C), the isotherms are inclined in a straight
line direction. This indicates that the HMA mixture behavior is in the visco-elastic region
and is predominately affected by the asphalt cement binders. The E* isotherms became
0
0.2
0.4
0.6
0.8
1
1.2
76CO 76CRM 76RAP15 64RAP40 100%RAP
Mix Type
Jc
(Kj/
m2)
0.65 Kj/m2

52
concave at the intermediate and high temperature levels, 25°C, 37.8°C, and 54°C,
respectively. This change in the isotherm shape represents the non-linear behavior in HMA
mixtures during compression. This non-linear behavior reveals the mechanical response that
is caused by the aggregate skeleton of the HMA mixture overwhelming the viscous influence
of the asphalt cement binder materials within the HMA materials at these high temperatures.
In Figure 18, it is shown that at any given temperature for any given HMA mixture that the
E* values decrease with decreased frequency.
Analysis of the phase angle results, which is determined from the dynamic modulus test, was
performed to further confirm the findings as shown by the E* isotherms. These results are
discussed further within this section.
Figure 18
Dynamic modulus test results
0
500
1000
1500
2000
2500
3000
76C0 76CRM 76RAP15 64RAP40 100%RAP
Av
era
ge
Dy
na
mic
Mo
du
lus
(Ksi
)
Mix Type
25.0 10.0 5.0 1.0 0.5 0.1
4.4 °C
0
200
400
600
800
1000
1200
1400
76C0 76RAP15 100%RAP
Av
era
ge
Dy
na
mic
Mo
du
lus
(Ksi
)
Mix Type
25.0 10.0 5.0 1.0 0.5 0.1
25
°C
0
100
200
300
400
500
600
700
76C0 76CRM 76RAP15 64RAP40 100%RAP
Av
era
ge
Dy
na
mic
Mo
du
lus
(Ksi
)
Mix Type
25.0 10.0 5.0 1.0 0.5 0.1
37.8 °C
0
50
100
150
200
250
300
76C0 76CRM 76RAP15 64RAP40 100%RAP Av
era
ge
Dy
na
mic
Mo
du
lus
(Ksi
)
Mix Type
25.0 10.0 5.0 1.0 0.5 0.1
54 °C
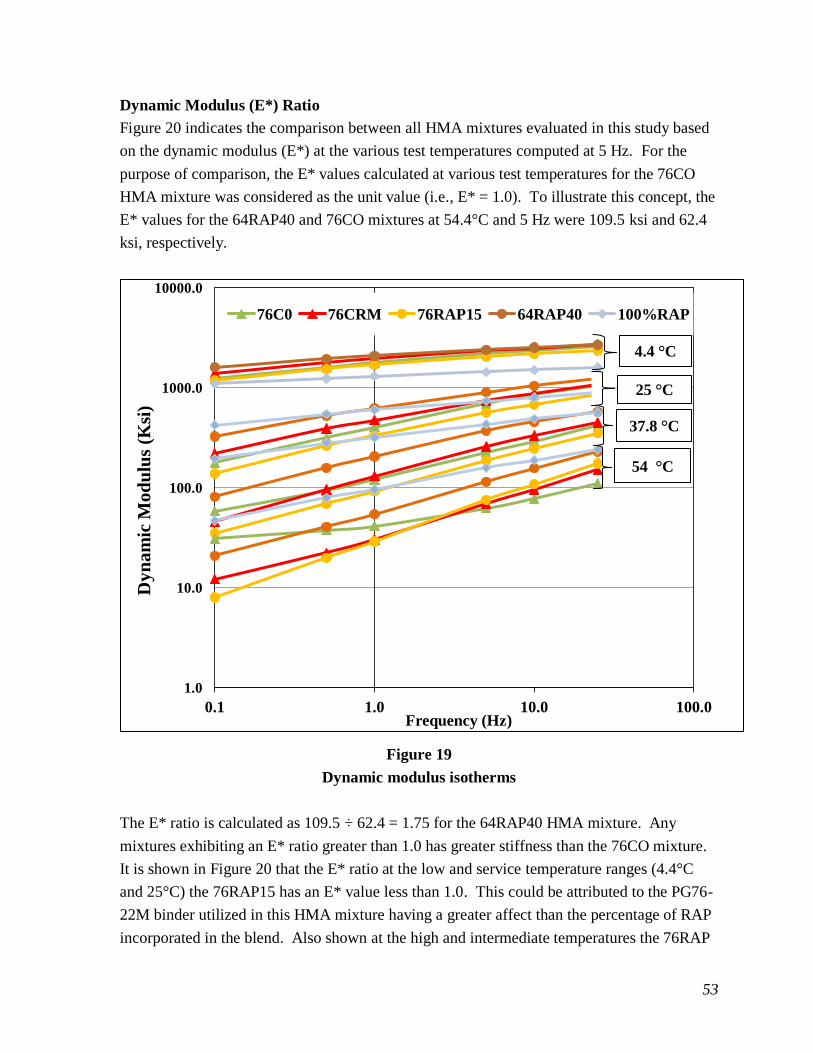
53
Dynamic Modulus (E*) Ratio
Figure 20 indicates the comparison between all HMA mixtures evaluated in this study based
on the dynamic modulus (E*) at the various test temperatures computed at 5 Hz. For the
purpose of comparison, the E* values calculated at various test temperatures for the 76CO
HMA mixture was considered as the unit value (i.e., E* = 1.0). To illustrate this concept, the
E* values for the 64RAP40 and 76CO mixtures at 54.4°C and 5 Hz were 109.5 ksi and 62.4
ksi, respectively.
Figure 19
Dynamic modulus isotherms
The E* ratio is calculated as 109.5 ÷ 62.4 = 1.75 for the 64RAP40 HMA mixture. Any
mixtures exhibiting an E* ratio greater than 1.0 has greater stiffness than the 76CO mixture.
It is shown in Figure 20 that the E* ratio at the low and service temperature ranges (4.4°C
and 25°C) the 76RAP15 has an E* value less than 1.0. This could be attributed to the PG76-
22M binder utilized in this HMA mixture having a greater affect than the percentage of RAP
incorporated in the blend. Also shown at the high and intermediate temperatures the 76RAP
1.0
10.0
100.0
1000.0
10000.0
0.1 1.0 10.0 100.0
Dy
nam
ic M
od
ulu
s (K
si)
Frequency (Hz)
76C0 76CRM 76RAP15 64RAP40 100%RAP
4.4 °C
25 °C
37.8 °C
54 °C

54
values are greater than the E* values for the 76CO mixture. This indicates that this mixture
is more susceptible to permanent deformation than the 76CO HMA mixture at these
temperatures tested. The 100%RAP mixture at the low temperature (4.4°C) is more
susceptible to rutting (i.e., permanent deformation) than the 76CO mixture as can be seen by
the reported E* ratio. The 76CRM and 64RAP40 mixtures exhibit greater stiffness at all
temperature ranges as compared to the 76CO HMA mixture. Figure 20 shows that at the
intermediate and high temperature levels that the final ranking of the mixtures is as one
would expect for the asphalt cement binders used in this study. At these higher temperatures,
the asphalt cement binders are leaving the visco-elastic range of their respective material and
are becoming more viscous. At these high temperatures, the final outcome is predominantly
based on the stiffness of the asphalt binders at these temperatures as shown by the E* values.
Figure 20
Dynamic modulus ratio comparison (E* ratio)
Phase Angle Test Results
Figure 21 indicates the graphical representation of the phase angle mean results with respect
to the dynamic modulus values for all six HMA mixtures considered in this study. The CV
of the samples tested ranged from 1 to 14 percent. As shown in this figure, the phase angle
0.0
0.5
1.0
1.5
2.0
2.5
4.4 25 37.8 54.4
Temperature (°C)
E*
R
ati
o
76CO 76CRM 76RAP15 64RAP40 100%RAP
E* Ratio (76C0) = 1.0
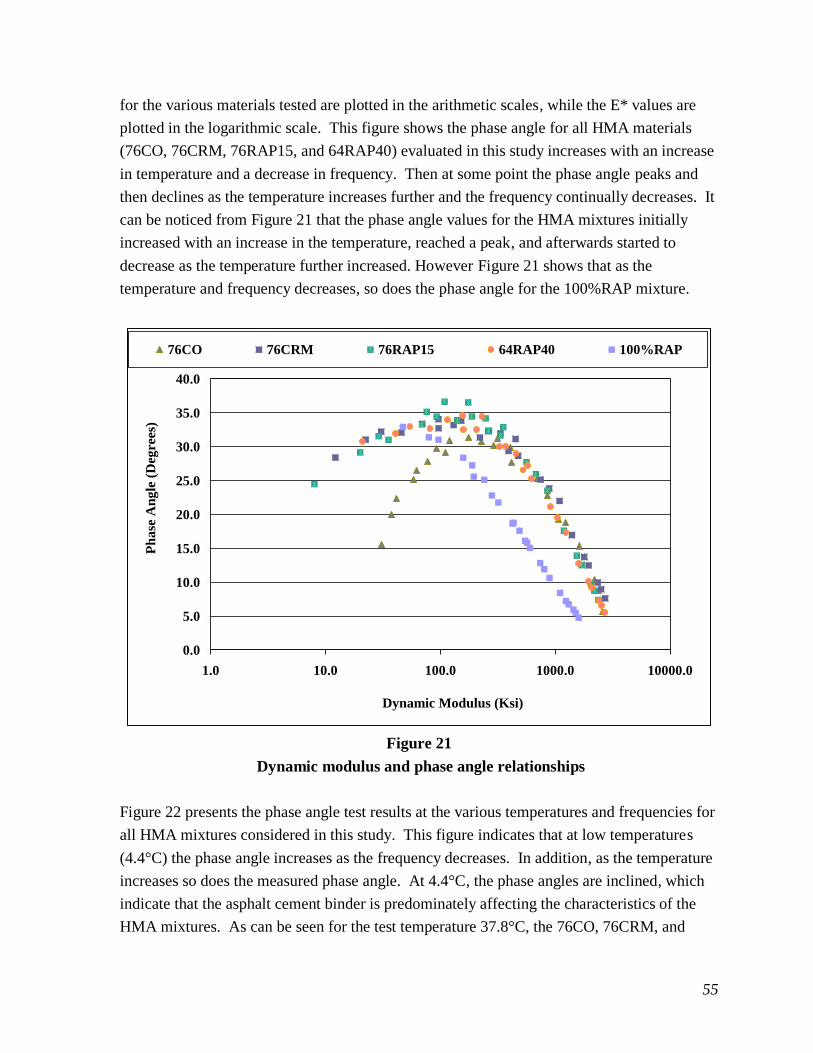
55
for the various materials tested are plotted in the arithmetic scales, while the E* values are
plotted in the logarithmic scale. This figure shows the phase angle for all HMA materials
(76CO, 76CRM, 76RAP15, and 64RAP40) evaluated in this study increases with an increase
in temperature and a decrease in frequency. Then at some point the phase angle peaks and
then declines as the temperature increases further and the frequency continually decreases. It
can be noticed from Figure 21 that the phase angle values for the HMA mixtures initially
increased with an increase in the temperature, reached a peak, and afterwards started to
decrease as the temperature further increased. However Figure 21 shows that as the
temperature and frequency decreases, so does the phase angle for the 100%RAP mixture.
Figure 21
Dynamic modulus and phase angle relationships
Figure 22 presents the phase angle test results at the various temperatures and frequencies for
all HMA mixtures considered in this study. This figure indicates that at low temperatures
(4.4°C) the phase angle increases as the frequency decreases. In addition, as the temperature
increases so does the measured phase angle. At 4.4°C, the phase angles are inclined, which
indicate that the asphalt cement binder is predominately affecting the characteristics of the
HMA mixtures. As can be seen for the test temperature 37.8°C, the 76CO, 76CRM, and
0.0
5.0
10.0
15.0
20.0
25.0
30.0
35.0
40.0
1.0 10.0 100.0 1000.0 10000.0
Dynamic Modulus (Ksi)
Ph
ase
An
gle
(D
egre
es)
76CO 76CRM 76RAP15 64RAP40 100%RAP

56
76RAP15 HMA mixtures start to increase and reach a peak but then decrease as the
frequency continues to decrease. It is noted that the phase angle for the other HMA mixture
type (64RAP40) and the 100%RAP mixture at this temperature is still predominately being
affected by the asphalt cement binders used. At the test temperature 37.8 °C, Figure 22
shows that all HMA mixtures with the exception of the 64RAP40 and the 100%RAP
mixtures has reached a peak phase angle at 5 Hz before making the downward trend. The
64RAP40 HMA mixture and the 100%RAP mixture phase angle is still being affected by the
asphalt cement binder. With the exception of the 100%RAP mixture at 54°C, the phase
angle for all mixtures decreases with a decrease in frequency. This trend is opposite of the
behavior noted at the low temperature of 4.4°C. This behavior characteristic indicates that
the phase angle is predominately affected by the aggregate structure. It is noted that the shift
in this behavior was observed at 37.8°C.
Figure 22
Phase angle vs. mix type relationship
0
2
4
6
8
10
12
14
16
18
20
76C0 76CRM 76RAP15 64RAP40 100%RAP
Ph
ase
An
gle
(D
egre
e)
Mix Type
25.0 10.0 5.0 1.0 0.5 0.1
4.4 °C
0
5
10
15
20
25
30
35
40
76C0 76CRM 76RAP15 64RAP40 100%RAP
Ph
ase
An
gle
(D
egre
e)
Mix Type
25.0 10.0 5.0 1.0 0.5 0.1
25 °C
0
5
10
15
20
25
30
35
40
76C0 76CRM 76RAP15 64RAP40 100%RAP
Ph
ase
An
gle
(D
egre
e)
Mix Type
25.0 10.0 5.0 1.0 0.5 0.1
37.8 °C
0
5
10
15
20
25
30
35
40
76C0 76CRM 76RAP15 64RAP40 100%RAP
Ph
ase
An
gle
(D
egre
e)
Mix Type
25.0 10.0 5.0 1.0 0.5 0.1
54 °C

57
Flow Number Test (Repeated Load Permanent Deformation Test) Results
The flow number test is used to determine the permanent deformation characteristic of hot
mix asphalt mixtures. The flow number is defined as the number of repetitions corresponding
to the minimum rate of change in permanent strain under repeated loading conditions. It is
the starting point, or cycle number, at which tertiary flow occurs on a cumulative permanent
strain curve generated during the test. Therefore, the higher the flow number value, the
better the mixture resists permanent deformation.
Figure 23 presents the flow number test results for the five mixtures considered in this study.
It is shown that the 100%RAP mixture had the highest flow number values and, therefore,
was the most rut resistant for the mix types evaluated by this test. The second grouping was
the 76CO and the 76RAP15 HMA mixtures, which contain a SBS modified asphalt cement
binder. The last grouping as shown in Figure 23 is the 64RAP40 and 76CRM HMA
mixtures, which utilized PG64-22 base asphalt cement binder. The 64RAP40 and 76 CRM
was the least resistant to permanent deformation for the mixtures evaluated.
Figure 23
Flow number vs. mix type
0
2000
4000
6000
8000
10000
12000
76CO 76CRM 76RAP15 64RAP40 100%RAP
Mix Type
Flo
w N
um
ber
(C
ycl
es)

58
Evaluation of Rutting and Fatigue Factors from E* Tests
An HMA mixture propensity to resist permanent deformation (rutting) and fatigue cracking
can be characterized by using the dynamic modulus test results from various temperatures
and frequency. The rutting factor is defined as E*/Sinδ, where δ is the phase angle at a
particular temperature and frequency. A loading frequency of 5Hz and test temperature of
54.4ºC was used for computation of the rutting factor, E*/Sinδ in this study [37]. For
mixtures to be rut resistant and exhibit higher stiffness, a higher E* value and a lower phase
angle is necessary. The higher the rutting factor value indicates a mixture greater resistance
to permanent deformation.
Figure 24 shows the rutting factor values for all mix types evaluated in this study. It clearly
indicates that the 100%RAP mixture followed by the 64RAP40 HMA mixture has the
greatest resistance to rutting. This can be contributed to the high RAP content used in these
mixture types. It is noted that there is a grouping of similar results for the 76CO, 76CRM,
and 76RAP15 HMA mixture types.
To determine a mixture’s resistance to fatigue cracking, a parameter termed fatigue factor is
calculated from dynamic modulus test results at a given frequency and test temperature. The
test temperature of 25ºC and a loading frequency of 5 Hz were selected for this study [37].
By definition the fatigue factor is calculated as E*(Sinδ), where δ is the phase angle at the
selected temperature and frequency. For a mixture to resist fatigue cracking, its
corresponding E* value should be lower as well as the phase angle at the in-service
temperature of 25ºC. The lower the fatigue factor value indicates the mixture’s performance
against fatigue cracking.
Figure 25 indicates the fatigue factor values for all mix types evaluated in this study. There
are two distinct groups as shown in Figure 25. The first grouping showing similar test results
is the four HMA mixtures (76CO, 76CRM, 76RAP15, and 64RAP40) that indicate these
mixtures as being the best in fatigue cracking resistance of the five mixtures evaluated in this
study. The second group (100%RAP mixture) exhibited the highest fatigue factor value and,
therefore, was the least resistant to fatigue cracking.

59
Figure 24
Rutting factor, E*/Sinδ @ 5Hz, 54.4°C
Figure 25
Fatigue factor, E*(Sinδ) @ 5Hz, 25.0°C
0.0
50.0
100.0
150.0
200.0
250.0
300.0
350.0
76C0 76CRM 76RAP15 64RAP40 100%RAP
Mix Type
E*/Sinδ
0.0
50.0
100.0
150.0
200.0
250.0
300.0
350.0
76C0 76CRM 76RAP15 64RAP40 100%RAP
Mix Type
E*Sinδ

60
Loaded Wheel Tracking Test Results
Figure 26 indicates the average rut depth of the five mixtures evaluated in this study. The
specimens rut depth is continuously measured and recorded for 20,000 passes unless the
specimen attains more than 20.0 mm of rutting in which the testing is then terminated. The
average rut depth reported in Figure 26 is the mean rut depth after 20,000 passes of the LWT.
Mixtures with an average rut depth less than 6.0 mm after 20,000 passes are considered
acceptable. As shown in Figure 26, the 64RAP40 HMA mixtures that utilize PG 64-22
asphalt cement failed the acceptable rutting criterion. However, it is noted that the 64RAP40
mixture was borderline failing with a measured rut depth of 6.1 mm. As expected, the
100%RAP mixture failed this test due to stripping, which confirms this mixtures propensity
to moisture damage based on the modified Lottman test results as previously shown in Table
7 and Figure 15. All other mixtures tested passed the maximum rut depth requirement (6.0
mm).
Figure 26
LWT rutting results
0
5
10
15
20
25
76CO 76CRM 76RAP15 64RAP40 100%RAP
Mix Type
Ru
t D
epth
(m
m)
Rut Depth = 6 mm

61
Correlation between Laboratory Test Results
This section presents the correlation of the HMA mixture test results from various laboratory
tests evaluated in this study. In this section, 76CO, 76CRM, 76RAP15, and the 64RAP40
HMA mixtures are compared. The 100%RAP mixture is not included in the evaluation
because it is not a true HMA mixture that is based on mix design principles and the inclusion
of virgin aggregates and asphalt cement binder. A linear regression statistical analysis was
applied to determine the level of relationships between laboratory test parameters. In
addition, the coefficient of determination, R2, was computed to measure the goodness of fit.
Correlation between Jc and DCSE Test Results
Figure 27 indicates the correlation between the semi-circular bend test and the dissipated
creep strain energy test results. As expected, there is a fair correlation between the dissipated
creep strain energy and semi-circular bend test parameters as noted by the coefficient of
determination, R2, value of 0.70. It is also shown in Figure 27 by the linear regression line
that as the DCSE values increase, the JC values also increase.
Figure 27
Correlations between Jc and DCSE test parameters

62
Correlation between Modified Lottman and Semi-Circular Bend Test Results
Figure 28 illustrates the correlations between the modified Lottman test and the semi-circular
bend test as measured by %TSR and Jc, respectively. As shown in Figure 28, there appears
that there was not a fair correlation as indicated by the R2 value between the modified
Lottman test results as measured by %TSR and the semi-circular bend test, JC results. It is
indicated that as the %TSR increases, the JC values also increase. This would appear to be
logical since the Modified Lottman test is a measure of a mixture’s susceptiblility to moisture
damage that is highly dependent upon the HMA mixtures adhesion and cohesive properties,
which is also the case of the semi-circular bend test.
Figure 28
Correlations between %TSR and Jc test results
Correlation between Fatigue Factor and DCSE Test Results
Figure 29 shows the correlation between the fatigue factor and dissipated creep strain energy
laboratory test results. This figure indicates that there was fair correlation between these
performance characteristics for the mixtures evaluated in this study. However Figure 29 does
show a trend in these properties. It is illustrated that as the DCSE increases the fatigue factor
y = 19.85x + 62.51
R2 = 0.30
50
55
60
65
70
75
80
85
90
0.40 0.50 0.60 0.70 0.80 0.90 1.00 1.10 1.20
Jc (Kj/m2)
% T
SR

63
decreases. This is logical since higher DCSE values are desirable for crack resistance;
whereas, lower fatigue factor values are desirable.
Figure 29
Correlations between fatigue factor and DCSE test results
Correlation between Fatigue Factor and Semi-Circular Bend Test Results
Figure 30 indicates the correlation between the fatigue factor and the semi-circular bend test
performance characterization laboratory test results for the HMA mixtures evaluated in this
study. This figure shows that there is a strong correlation between the fatigue factor and
SCB test results. It is noted that Figure 30 does indicate a trend in these parameters. It is
illustrated in Figure 30 that as the Jc increases the fatigue factor decreases. This is desirable
trend since higher Jc values indicate an HMA mixture’s stronger propensity for crack
resistance; whereas, lower fatigue factor values are desirable for resistance to cracking.
y = -8.19x + 329.11
R2 = 0.73
290
295
300
305
310
315
320
325
330
0.00 0.50 1.00 1.50 2.00 2.50 3.00 3.50 4.00 4.50
DCSE (Kj/m3)
Fa
tig
ue
Fa
cto
r (K
si)

64
Figure 30
Correlations between fatigue factor and Jc test results
Comparison of Statistical Ranking of HMA Mixtures
Tables 9 summarizes the statistical ranking of several of the laboratory performance test
results for the HMA mixture types considered in this study. In this section, 76CO, 76CRM,
76RAP15, and the 64RAP40 HMA mixtures are statistically analyzed to determine any
statistical difference between mixture types. The evaluation of the HMA mixtures’ laboratory
performance in this study included durability, permanent deformation, and fatigue resistance.
The durability performance characteristic was measured by the modified Lottman test. The
mixture’s ability to resist deformation was characterized by the flow number and dynamic
modulus test as measured by the rutting factor. The mixtures fatigue resistance was
measured through the DCSE, SCB, and dynamic modulus test as reported by the fatigue
factor calculation. However, statistical analysis was based only on two mixture performance
criteria namely: (1) fatigue resistance and (2) permanent deformation. In addition the results
reported in this analysis are the DCSE, fatigue factor, rutting factor, and flow number tests
because the SCB and modified Lottman tests numbers were limited and did not lend
themselves to statistical analysis for this study.
y = -61.82x + 366.15
R2 = 0.99
290
295
300
305
310
315
320
325
330
0.50 0.60 0.70 0.80 0.90 1.00 1.10 1.20
JC (Kj/m2)
Fa
tig
ue
Fa
cto
r (K
si)

65
The laboratory performance data were statistically analyzed using the analysis of variance
(ANOVA) procedure. More specifically a multiple comparison procedure with a risk level
of 5 percent was performed on the laboratory test results. The statistical results of each
grouping is reported with the letters A, B, C, D, and so forth. The letter A is assigned to the
HMA mixtures performance having the highest mean followed by the other letters in
appropriate order. A double (or more) letter designation, such as A/B (or A/B/C), indicates
that in the analysis the difference in the mixture performance is not clear-cut, and the mixture
performance is close to either group.
It is indicated in Table 9 that all HMA ranked similar in fatigue resistance as measured by the
fatigue factor. In addition, the DCSE analysis shows three distinct groupings. The first group
is the 76CO mixture. The second group is the 76CRM and 76RAP15 HMA mixtures
followed by the 64RAP40 mixture group.
Table 9 indicates that there was not an agreement on permanent deformation. It is shown that
for the rutting factor there were two groupings. The 64RAP40 mixture had the highest
resistance to rutting followed by the 76CO, 76CRM, and 76RAP15 HMA mixture grouping.
In regards to permanent deformation as measured by flow number, the 76CO and 76RAP
HMA mixtures, which had similar rankings, had the highest propensity to resist rutting
followed by the grouping of the 76CRM and 64RAP40 HMA mixtures.
The tests evaluated and presented were selected to capture the laboratory performance of the
HMA mixtures studied. However the test results were not consistent and did not clearly rank
the mixtures. The LWT and FN tests, which are used for checking a mixtures resistance for
permanent deformation, were not clear cut. This may be due to the fact that the LWT
samples are tested in confinement; whereas, the FN test is tested in an unconfined mode. In
addition the modified Lottman and JC tests were inconsistent. A mixture’s adhesion and
cohesive behavior is important in both of these tests. In one test, modified Lottman, the
64RAP40 shows good properties. However in the JC test, the mean values are low for this
mixture type. If the modified Lottman indicated good adhesive and cohesion properties, then
the JC values should have been higher than the reported value. It is noted that in general the
76CO HMA mixture ranked highest in all tests evaluated.

66
Table 9
Statistical ranking of mixtures fatigue and rutting characteristics
Fatigue Performance
Characteristic
Permanent Deformation
Performance Characteristic
Property
Fatigue
Factor
(E*Sinδ)
DCSE
Rutting
Factor
(E*/Sinδ)
Flow Number
Aging
Criterion Un-aged Aged Un-aged Un-aged
Mixture
Type Mean Rank Mean Rank Mean Rank Mean Rank
76CO 296.5 A 4.20 A 141.0 B 6132.0 A
76CRM 316.8 A 2.29 B 126.5 B 1325.3 B
76RAP15 300.4 A 2.30 B 133.7 B 6867.0 A
64RAP40 330.2 A 0.57 C 197.4 A 2397.0 B

67
CONCLUSIONS
This study characterized the laboratory performance of conventional HMA mixtures and
mixtures containing high RAP content and waste tire crumb rubber/additives through their
fundamental engineering properties. A comparative laboratory evaluation of six 19-mm
NMAS Level 2 Superpave HMA mixtures meeting LADOTD specifications was considered
in this study. Four HMA mixtures were evaluated as follows: The first mixture was a
conventional HMA mix type, as a control mixture, that contained no RAP and no CR
additives material type and an SB polymer modified asphalt cement meeting Louisiana
specifications for PG 76-22M. The second mixture contained no RAP and 30 mesh CR and
additives blended (wet process) with a PG 64-22 asphalt cement binder, which yielded a
PG76-22. The third mixture contained 15 percent RAP with PG 76-22M asphalt cement and
no CR and additives. The fourth mixture contained 40 percent RAP, 30 mesh CR and
additives, and PG 64-22 asphalt cement. The CR and additives were introduced to the
mixture at a rate of 10 percent by total weight of asphalt cement binder. In addition an
asphalt treated base mixture containing 100% RAP, 30 mesh CR, and additives were selected
for mixture characterization.
To evaluate performance, physical and rheological tests were evaluated on asphalt binders
and HMA mixtures. A simulative permanent deformation test, LWT, was performed on
mixtures evaluated in this study. The RTFO test, PAV test, RV test, DSR test, and BBR test
were performed on the asphalt cement binders to characterize their physical and rheological
properties. In addition to asphalt cement rheology characterization, HMA mixture
performance and characterization tests namely, the SCB test, DCSE test, LWT test, simple
performance tests (dynamic modulus, E*, flow number, FN), and modified Lottman test were
conducted to define permanent deformation (stability) and the fatigue life (durability) of
HMA mixtures considered in this study. A statistical analysis was performed on the results
of these tests to determine if there were any significant differences in the fundamental
material characterization properties of the HMA mixtures considered in this study. Based on
the results of this study, the following conclusions are drawn:
The addition of the crumb rubber additives softened the blended AC for the 64RAP40
HMA mixture as determined by rheology testing of the asphalt cement extracted from
the mixture. The blended AC for the 64RAP40 HMA mixture that contained PG 64-
22, high RAP content (40 percent), and crumb rubber additives graded as a PG 70-28
asphalt cement.
The addition of the crumb rubber additives with RAP had a positive influence in the
asphalt cement binder rheology. This can be attributed to the use of the absorptive

68
properties of crumb rubber carrying rejuvenating products back into the HMA
mixture allowing the RAP binders to be softened in lieu of the original binders being
stiffened by the effect of the aged RAP binders.
The asphalt mixtures considered in this study were subjected to the Modified Lottman
test, which quantifies the mixtures sensitivity to moisture damage. The mixtures
containing 100%RAP failed this test. The 64RAP40 mixture that contained
unmodified PG 64-22 asphalt cement binder passed the modified Lottman test. This
indicates the CR additives had a positive influence in the asphalt cement binder’s
ability to increase adherence to the aggregate structure.
Fracture resistance as measured by the dissipated creep strain energy test indicates
that the 64RAP40 HMA mixture ranked last in its ability to resist fracture while the
76CO mixture had the highest fracture resistance. This is attributable to the binder
types utilized in the respective HMA mixtures. The 76CO HMA mixture utilized PG
76-22M polymer modified asphalt cement; whereas, the 64RAP40 contained
unmodified PG 64-22 AC, which is less stiff than the PG 76-22M material and does
not have the elastic properties as does a SBS modified asphalt cement. The elastic
properties of a SBS modified binder increases a mixtures resistance to the initiation of
fatigue cracking.
Fracture resistance as measured by the semi-circular bend test confirmed the DCSE
results in regards to the fracture resistance of the 64RAP40 mixture.
Dynamic modulus tests used to evaluate the visco-elastic response of HMA mixtures
indicate that as the frequency increases the E* values also increase, and as the
temperatures increase the E* values decrease. In addition, at 4.4°C, the E* isotherms
show that the HMA mixtures are in the visco-elastic range and are primarily affected
by the asphalt cement. As the temperatures increase, the isotherms shape changes to
a non-linear shape that represents the non-linear response, which is indicative of the
mechanical response caused by the aggregate structure of the HMA mixture,
overwhelming the viscous influence of the asphalt cement binder.
Analysis of the phase angle test results as determined from the dynamic modulus test
confirms the E* isotherm findings. The phase angle results indicate that at 4.4°C all
mixtures tested were in the visco-elastic range. At 37.8°C, the 76CO, 76CRM, and
the 76RAP HMA mixtures show the non-linear response indicating the aggregate
structure has taken control of these mixtures properties. At the test temperature of
37.8°C, all mixtures with the exception of the 64RAP40 and 100%RAP mixtures
exhibit the non-linear response. It was shown that the 64RAP40 HMA mixtures
characteristic was still in the visco-elastic range indicating that the asphalt cement
binder was still the contributing factor and that the non-linear response did not occur

69
until the 54°C test temperature. It is noted that the 100%RAP mixture did not indicate
the non-linear response at any temperature tested.
The HMA mixtures’ resistance to permanent deformation (i.e., rutting) as determined
by the E* ratio and rutting factor, E*/Sinδ, as measured from the dynamic modulus
test indicate that the 100%RAP mixture followed by the 64RAP40 HMA mixture has
the greatest propensity to resist rutting.
Results of the LWT test showed that mixtures evaluated in this study passed the
maximum rut depth requirement of 6.0 mm, except 100% RAP mixture.
In regard to fatigue resistance as determined from the fatigue factor, E*(Sinδ), the
100%RAP mixture had the least resistance to fatigue cracking. All other HMA
mixtures evaluated in this study were ranked similarly.


71
RECOMMENDATIONS
The results of this study illustrated the benefits of utilizing the absorptive properties of crumb
rubber to carry engineered additives into asphalt mixtures containing high levels of RAP
content. Optimization of crumb rubber and engineered additives for the various types of RAP
sources should be performed. Further, it is recommended that the use of crumb rubber and
engineered additives in a dry process be investigated to ascertain its utilization in
applications such as warm mix additives and anti-strip additives. In addition, life cycle cost
analysis should be performed to indicate the economic benefits in utilizing high RAP and
recycled products such as crumb rubber in flexible pavement construction and rehabilitation.


73
ACRONYMS, ABBREVIATIONS, AND SYMBOLS
AASHTO American Association of State Highway and Transportation
Officials
AC asphalt cement
ANOVA analysis of variance
APA asphalt pavement analyzer
BBR Bending Beam Rheometer
cm centimeter(s)
CR crumb rubber
CRM crumb-rubber modifiers
CV coefficient of variance
DCSE dissipated creep strain energy
DSC differential scanning calorimetric
DSR Dynamic Shear Rheometer
EE elastic energy
FAA fine aggregate angularity
FE fracture energy
FHWA Federal Highway Administration
FLDOT Florida Department of Transportation
Fn flow number
FSCH frequency sweep at constant height
ft. foot (feet)
FTIR Fourier transform infrared
GPC gel permeation chromatograph
HMA hot mix asphalt
in. inch(es)
IRI International Roughness Index
ISTEA Intermodal Surface Transportation Efficiency Act
ITS indirect tensile strength
LADOTD Louisiana Department of Transportation and Development
lb. pound(s)
LMS large molecular size
LTRC Louisiana Transportation Research Center
LVDT Linear Variable Displacement Transducer
m meter(s)
NMAS nominal maximum aggregate size
NCHRP National Cooperative Highway Research Program

74
OGFC open-graded friction course
PAV Pressure Aging Vessel
PG Performance Grade
PMAC polymer modified asphalt cement
RAP reclaimed asphalt pavement
RPMAC reclaimed polymer modified asphalt cement
RSCH repeated shear at constant height
RV Rotational Viscometer
SAM stress-absorbing membranes
SAMI stress–absorbing membrane interlayer
SAS Statistical Analysis System
SCB semi-circular bend
SGC Superpave gyratory compactor
SHRP Strategic Highway Research Program
SMS small molecular size
SPTs Simple Performance Tests
SSCH simple shear at constant height
TSR tensile strength ratio
U.S. EPA United States Environmental Protection Agency

75
REFERENCES
1. Heitzman, M., “State of the Practice – Design and Construction of Asphalt Paving
Materials with Crumb Rubber Modifier,” Research Report No. FHWA-SA-92-022,
Federal Highway Administration, Washington, D.C., May, 1992.
2. “LTRC Annual Research Program,” Louisiana Transportation Research Center
(LTRC), Baton Rouge, LA, June 1996, pp. 23.
3. Cooper, Jr., S.B., Mohammad, L.N., and Abadie, C., “Evaluation of Field Projects
Using Crumb Rubber Modified Asphaltic Concrete,” Louisiana Transportation
Research Center, Report No. FHWA/LA.04/393, March 2007.
4. McDaniel, R., and Anderson, R.M., “Recommended Use of Reclaimed Asphalt
Pavement in the Superpave Mix Design Method: Technician’s Manual,” NCHRP
Report 452, 2001.
5. Shen, J., Amirkhanian, S.N., and Miller, J.A., “Effects of Rejuvenating Agents on
Superpave Mixtures Containing Reclaimed Asphalt Pavement,” Journal of Material
in Civil Engineering, ASCE, Vol. 19, No. 5, May 1, 2007.
6. Wikipedia, http://en.wikipedia.org/wiki/Sustainablility, Accessed September 2008.
7. Turner- Fairbank Highway Research Center,
www.tfhrc.gov/hnr20/recycle/waste/rap131.htm, Accessed June 2006.
8. NAPA, National Asphalt Pavement Association,
http://www.hotmix.org/allaboutasphalt.php, Accessed 2008.
9. US EPA, United States Environmental Protection Agency, http://www.epa.gov/,
Accessed 2008.
10. TNRCC Information, “The Many Uses of Crumb Rubber,” Waste Tire Recycling
Program, Office of Permitting, September 1999.
11. Jensen, W., and Abdelrahman, M. “Use of Crumb Rubber in Performance Graded
Binder,” Nebraska Department of Roads, Lincoln, NE, 2006.

76
12. Chehovits, J., and Hicks, R. “Mix Design Procedures.” Session 10.0, Crumb Rubber
Modifier Workshop Notes, Federal Highway Administration, Office of Technology
Applications, March 1993.
13. Hicks, R., and Epps, J., “Life Cycle Cost Analysis of Asphalt-Rubber Paving
Materials,” RPA Reports,
htpp://www.rubberpavements.org/library/lcca_australia/history.html, Accessed 2000.
14. Public Law, “Intermodal Surface Transportation Efficiency Act of 1991,” Public Law
102 – 240, December 18, 1991.
15. Epps, J., “Use of Recycled Rubber Tires in Highways – A Synthesis of Highway
Practice,” NCHRP Synthesis 198, National Cooperative Highway Research Program,
TRB, National Research Council, Washington, D.C., 1994.
16. Page, G., “Florida’s Initial Experience Utilizing Ground Tire Rubber in Asphalt
Concrete Mixes,” Research Report FL/DOT/MO89-366, Florida Department of
Transportation, Materials Office, September 1989.
17. Maupin, G., Jr., “Hot Mix Asphalt Rubber Applications in Virginia,” Transportation
Research Record, No. 1530, TRB, National Research Council, Washington, D.C.,
1996.
18. Troy, K., Sebaaly, P., and Epps, J., “Evaluation Systems for Crumb Rubber Modified
Binders and Mixtures,” Transportation Research Record, No. 1530, TRB, National
Research Council, Washington, D.C., 1996.
19. Huang, B., Mohammad, L.N., Graves, P.S., and Abadie, C., “Louisiana Experience
with Crumb Rubber-Modified Hot-Mix Asphalt Pavement,” Transportation Research
Record, No. 1789, TRB, National Research Council, Washington, D.C., 2002.
20. Mohammad, L.N., Daly, W.H., Negulescu, I.I., Wu, Z., and Daranga, C.,
“Investigation of the Use of Recycled Polymer-Modified Asphalt in Asphaltic
Concrete Pavements,” Louisiana Transportation Research Center, Report No.
FHWA/LA04/391, June 2004.
21. Shen, J., Amirkhanian, S.N., and Lee, S.J., “HP-GPC Characterization of
Rejuvenated Aged CRM Binders,” Journal of Material in Civil Engineering, ASCE,
June 2007.

77
22. Louisiana Standard Specifications for Roads and Bridges, Louisiana Department of
Transportation and Development, Baton Rouge, Louisiana, 2000.
23. Louisiana Standard Specifications for Roads and Bridges, Louisiana Department of
Transportation and Development, Baton Rouge, Louisiana, 2006.
24. Roque, R., Birgisson, B., Zhang, Z., Sangpetngam, B., and Grant, T.,
“Implementation of SHRPP Indirect Tension Tester to Mitigate Cracking in Asphalt
Pavements and Overlays,” Final Report Submitted to Florida Department of
Transportation, University of Florida, Gainesville, FL, May 2002.
25. Mohammad, L., Wu, Z., and Mull, M.A. “Characterization of Fracture Resistance of
Superpave Mixture using the Semi-Circular Bending Test.” Journal of ASTM
International (JAI), Vol. 2, No.3, March 2005.
26. AASHTO, American Association of State Highways and Transportation Officials,
“Standard Method of Test for Resistance of Compacted Asphalt Mixtures to
Moisture-Induced Damage,” AASHTO T 283-03, Washington D.C., 2003.
27. Mull, M.A., Stuart, K., and Yehia, A., “Fracture Resistance Characterization of
Chemically Modified Crumb Rubber Asphalt Pavement,” Journal of Materials
Science, Vol. 37, 2002, pp. 557-566.
28. Witczak, M.W., “Laboratory Determination of resilient Modulus for Flexible
Pavement Design,” Research Results Digest, National Cooperative Highway
Research Program (NCHRP) Report 1-28A, Transportation Research Board of the
National Academies, No. 285, 2004.
29. AASHTO, American Association of State Highways and Transportation Officials,
“Standard Method of Test for Determining the Creep Compliance and Strength of
Hot-Mix Asphalt (HMA) Using the Indirect Tensile Test Device,” AASHTO
Designation: TP 322-03, Washington D.C., 2006.
30. Roque, R., Birgisson, B., Drakos, C. and Dietrich, B., “Development and Field
Evaluation of Energy-Based Criteria for Top-Down Cracking Performance of Hot-
Mix Asphalt,” Journal of the Association of Asphalt Paving Technologists, Vol. 73,
Baton Rouge, LA, 2004.

78
31. Alshamsi, K.S., “Development of Mix Design Methodology for Asphalt Mixtures
with Analytically Formulated Aggregate Structures,” Ph.D. Dissertation, Louisiana
State University and Agricultural and Mechanical College, Baton Rouge, Louisiana,
May, 2006.
32. Mohammad, L.N., and Paul, H.R., “Evaluation of a New Indirect Tension Test
Apparatus,” Transportation Research Record No. 1353, pp.62-68, 1992.
33. Mohammad, L.N., Wu, Z., and Aglan, M., “Characterization of Fracture and Fatigue
Resistance on Recycled Polymer-Modified Asphalt Pavements,” The 5th
RILEM
conference on Pavement Cracking, France, 2004.
34. AASHTO, American Association of State Highways and Transportation Officials,
“Practice for Short and Long Term Aging of Hot Mix Asphalt.” AASHTO
Designation PP2, Washington D.C., 1994.
35. ASTM D3497, “Standard Test Method for Dynamic Modulus of Asphalt Mixtures,”
ASTM International, West Conshohocken, PA, 1979.
36. Witczak, M.W., Kaloush, K., Pellinen, T., and El-Basyouny, M., “Appendix A –Test
Method for Dynamic Modulus of Asphalt Concrete Mixtures for Permanent
Deformation,” National Cooperative Highway Research Program (NCHRP) Report
465, Transportation Research Board, National Research Council, Washington, D.C.,
2002.
37. Witczak, M.W., Kaloush, K., Pellinen, T., El-Basyouny, M., and Quintus, H.V.,
“Simple Performance Test for Superpave Mix Design,” National Cooperative
Highway Research Program (NCHRP) Report 465, Transportation Research Board,
National Research Council, Washington, D.C., 2002.

79
APPENDIX A
Aggregate Gradations and Material Properties
Table 10
Sieve analysis of aggregates (percent passing)
Metric (U.S.) Sieve Aggregate Type
# 67 LS # 78 LS # 11 LS Coarse Sand RAP
37.5 mm (1½ in) 100.0 100.0 100.0 100.0 100.0
25 mm (1 in) 100.0 100.0 100.0 100.0 100.0
19 mm (¾ in) 85.8 100.0 100.0 100.0 100.0
12.5 mm (½ in) 45.3 94.1 100.0 100.0 97.7
9.5 mm (⅜ in) 24.5 62.1 100.0 100.0 87.5
4.75 mm (No. 4) 7.0 10.3 94.6 95.7 69.8
2.36 mm (No. 8) 4.1 4.8 68.8 87.4 55.2
1.18 mm (No.16) 3.0 3.3 42.7 78.8 45.4
0.6 mm (No. 30) 2.4 2.7 27.9 62.9 37.9
0.3 mm (No. 50) 2.2 2.4 19.8 16.8 24.0
0.15 mm (No. 100) 1.9 2.2 14.8 1.6 17.2
0.075 mm (No. 200) 1.8 2.1 12.2 0.6 10.8
Table 11
Aggregate consensus properties
Property Test Protocol Specification HMA
Mixtures
CAA, % ASTM D 5821 95+, 2 face 100
FAA, % AASHTO T 304 45+ 46
F&E, % ASTM D 4791 10-, 5:1 ratio 0
SE,% AASHTO T 176 45+ 62
Note: CAA: Coarse Aggregate Angularity, FAA: Fine Aggregate Angularity
F&E: Flat and Elongated Particles, SE: Sand Equivalent

80
Table 12:
Tire crumb rubber certificate of analysis
Screen Size Sieve Analysis (%
passing) Chemical Analysis
30 mesh* 100.0 Acetone Extract 12.09%
40 mesh 87.0 RHC 49.03%
50 mesh 45.7 Carbon Black 31.85%
60 mesh 31.5 Ash 7.021%
80 mesh 16.2 Moisture Content 0.65%
Pan 0.0
Reference: PolyVulc, Lot 236-A, 6-06-08
*Trace retained on 30 Mesh
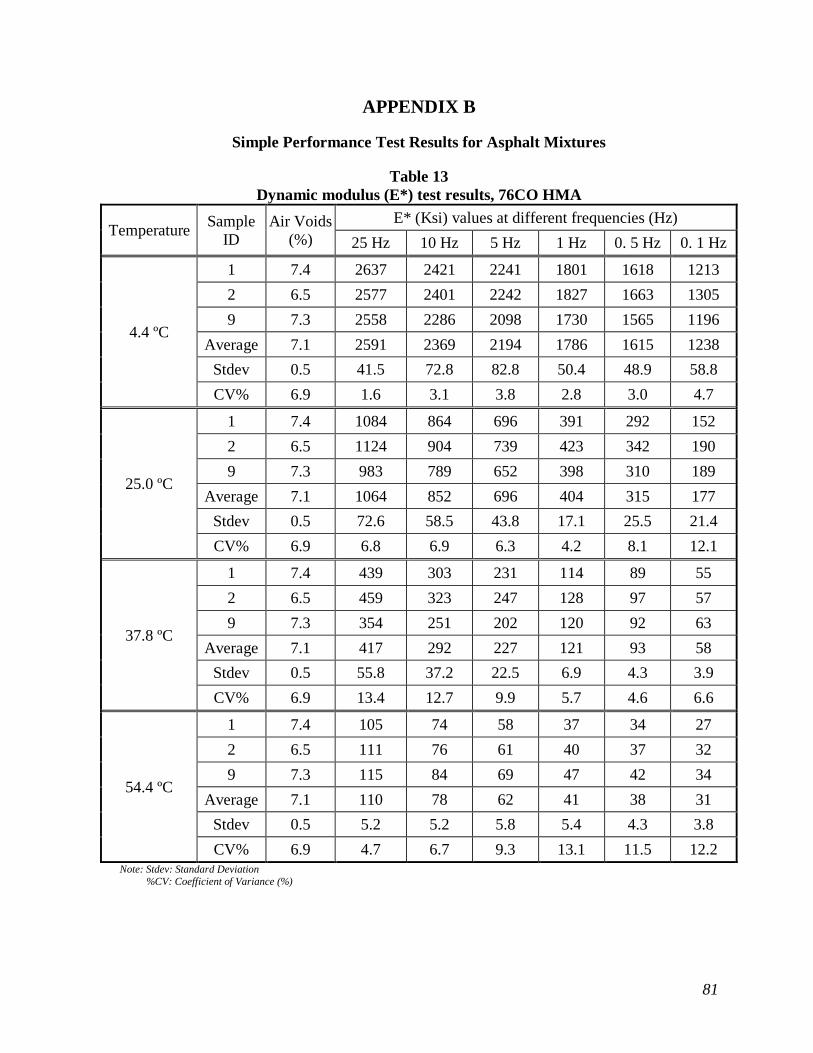
81
APPENDIX B
Simple Performance Test Results for Asphalt Mixtures
Table 13
Dynamic modulus (E*) test results, 76CO HMA
Temperature Sample
ID
Air Voids
(%)
E* (Ksi) values at different frequencies (Hz)
25 Hz 10 Hz 5 Hz 1 Hz 0. 5 Hz 0. 1 Hz
4.4 ºC
1 7.4 2637 2421 2241 1801 1618 1213
2 6.5 2577 2401 2242 1827 1663 1305
9 7.3 2558 2286 2098 1730 1565 1196
Average 7.1 2591 2369 2194 1786 1615 1238
Stdev 0.5 41.5 72.8 82.8 50.4 48.9 58.8
CV% 6.9 1.6 3.1 3.8 2.8 3.0 4.7
25.0 ºC
1 7.4 1084 864 696 391 292 152
2 6.5 1124 904 739 423 342 190
9 7.3 983 789 652 398 310 189
Average 7.1 1064 852 696 404 315 177
Stdev 0.5 72.6 58.5 43.8 17.1 25.5 21.4
CV% 6.9 6.8 6.9 6.3 4.2 8.1 12.1
37.8 ºC
1 7.4 439 303 231 114 89 55
2 6.5 459 323 247 128 97 57
9 7.3 354 251 202 120 92 63
Average 7.1 417 292 227 121 93 58
Stdev 0.5 55.8 37.2 22.5 6.9 4.3 3.9
CV% 6.9 13.4 12.7 9.9 5.7 4.6 6.6
54.4 ºC
1 7.4 105 74 58 37 34 27
2 6.5 111 76 61 40 37 32
9 7.3 115 84 69 47 42 34
Average 7.1 110 78 62 41 38 31
Stdev 0.5 5.2 5.2 5.8 5.4 4.3 3.8
CV% 6.9 4.7 6.7 9.3 13.1 11.5 12.2 Note: Stdev: Standard Deviation
%CV: Coefficient of Variance (%)
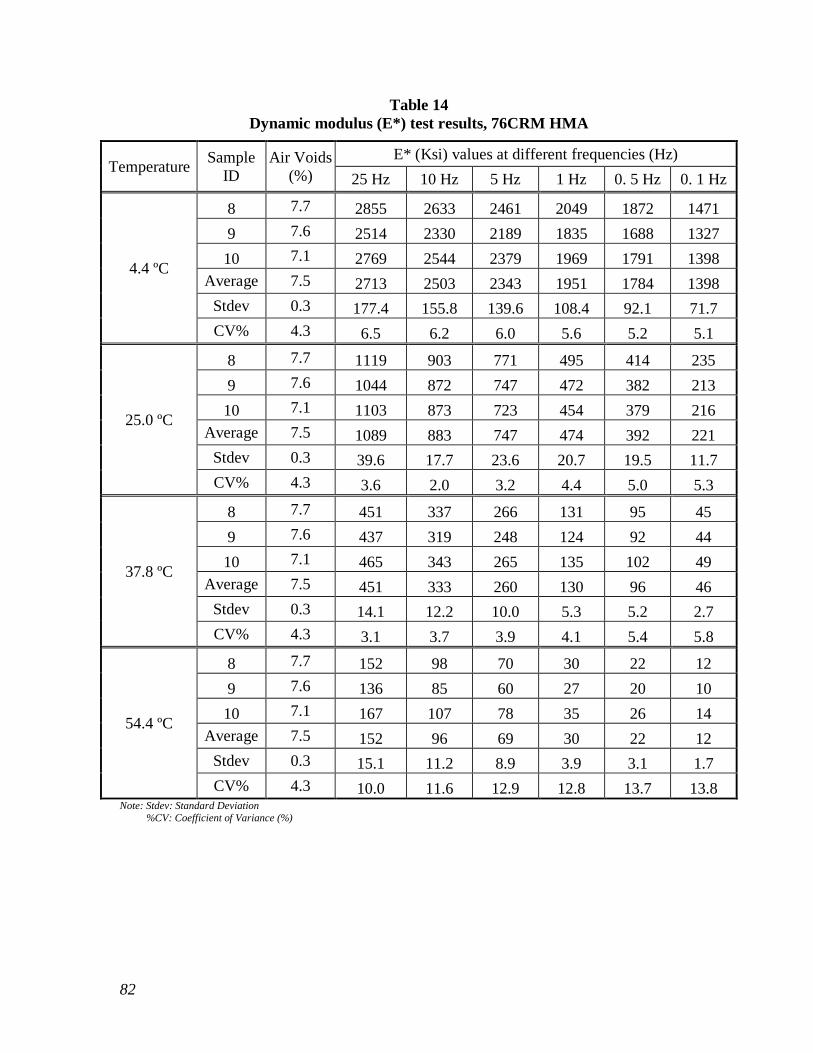
82
Table 14
Dynamic modulus (E*) test results, 76CRM HMA
Temperature Sample
ID
Air Voids
(%)
E* (Ksi) values at different frequencies (Hz)
25 Hz 10 Hz 5 Hz 1 Hz 0. 5 Hz 0. 1 Hz
4.4 ºC
8 7.7 2855 2633 2461 2049 1872 1471
9 7.6 2514 2330 2189 1835 1688 1327
10 7.1 2769 2544 2379 1969 1791 1398
Average 7.5 2713 2503 2343 1951 1784 1398
Stdev 0.3 177.4 155.8 139.6 108.4 92.1 71.7
CV% 4.3 6.5 6.2 6.0 5.6 5.2 5.1
25.0 ºC
8 7.7 1119 903 771 495 414 235
9 7.6 1044 872 747 472 382 213
10 7.1 1103 873 723 454 379 216
Average 7.5 1089 883 747 474 392 221
Stdev 0.3 39.6 17.7 23.6 20.7 19.5 11.7
CV% 4.3 3.6 2.0 3.2 4.4 5.0 5.3
37.8 ºC
8 7.7 451 337 266 131 95 45
9 7.6 437 319 248 124 92 44
10 7.1 465 343 265 135 102 49
Average 7.5 451 333 260 130 96 46
Stdev 0.3 14.1 12.2 10.0 5.3 5.2 2.7
CV% 4.3 3.1 3.7 3.9 4.1 5.4 5.8
54.4 ºC
8 7.7 152 98 70 30 22 12
9 7.6 136 85 60 27 20 10
10 7.1 167 107 78 35 26 14
Average 7.5 152 96 69 30 22 12
Stdev 0.3 15.1 11.2 8.9 3.9 3.1 1.7
CV% 4.3 10.0 11.6 12.9 12.8 13.7 13.8 Note: Stdev: Standard Deviation
%CV: Coefficient of Variance (%)

83
Table 15
Dynamic modulus (E*) test results, 76RAP15 HMA
Temperature Sample
ID
Air Voids
(%)
E* (Ksi) values at different frequencies (Hz)
25 Hz 10 Hz 5 Hz 1 Hz 0. 5 Hz 0. 1 Hz
4.4 ºC
1 7.7 2246 2068 1925 1586 1430 1086
2 7.6 2537 2331 2179 1806 1639 1260
4 7.2 2333 2157 2021 1698 1557 1225
Average 7.5 2372 2185 2041 1697 1542 1190
Stdev 0.3 149.2 133.7 128.3 109.7 105.3 92.1
CV% 3.5 6.3 6.1 6.3 6.5 6.8 7.7
25.0 ºC
1 7.7 772 618 510 291 222 113
2 7.6 900 720 597 353 276 144
4 7.2 889 703 577 354 296 162
Average 7.5 854 680 561 333 265 140
Stdev 0.3 71.3 54.6 45.2 35.8 38.2 24.9
CV% 3.5 8.3 8.0 8.0 10.8 14.4 17.9
37.8 ºC
1 7.7 319 227 172 84 62 31
2 7.6 349 243 184 90 68 36
4 7.2 388 275 208 104 77 39
Average 7.5 352 248 188 93 69 35
Stdev 0.3 34.9 24.2 18.1 10.2 7.6 4.0
CV% 3.5 9.9 9.8 9.6 11.0 11.0 11.2
54.4 ºC
2 7.6 159 103 75 33 24 12
3 7.7 144 97 73 37 28 17
4 7.2 175 109 76 29 20 8
Average 7.5 159 103 75 33 24 12
Stdev 0.3 15.5 6.0 1.5 4.0 4.0 4.5
CV% 3.5 9.7 5.8 2.0 12.1 16.7 36.7 Note: Stdev: Standard Deviation
%CV: Coefficient of Variance (%)

84
Table 16
Dynamic modulus (E*) test results, 64RAP40 HMA
Temperature Sample
ID
Air Voids
(%)
E* (Ksi) values at different frequencies (Hz)
25 Hz 10 Hz 5 Hz 1 Hz 0. 5 Hz 0. 1 Hz
4.4 ºC
1 7.3 2741 2583 2457 2147 2017 1704
3 7.4 2574 2420 2298 2005 1871 1556
5 7.1 2846 2662 2514 2170 2007 1652
Average 7.3 2720 2555 2423 2107 1965 1637
Stdev 0.15 137 123 112 89 81 75
CV% 2.1 5.0 4.8 4.6 4.2 4.1 4.6
25.0 ºC
1 7.3 1295 1103 971 686 587 383
3 7.4 1219 1031 893 621 519 320
5 7.1 1278 1074 948 654 554 327
Average 7.3 1264 1070 937 654 553 343
Stdev 0.15 39.8 36.3 40.1 32.8 33.9 34.5
CV% 2.1 3.1 3.4 4.3 5.0 6.1 10.0
37.8 ºC
1 7.3 605 482 397 227 179 98
3 7.4 554 448 370 208 157 79
5 7.1 609 469 379 207 158 80
Average 7.3 589 466 382 214 165 86
Stdev 0.15 30.6 17.1 13.6 11.5 12.4 10.9
CV% 2.1 5.2 3.7 3.6 5.4 7.5 12.7
54.4 ºC
1 7.3 218 148 105 54 30 19
3 7.4 243 167 120 55 42 23
5 7.1 203 136 99 47 35 18
Average 7.3 221 150 109 52 39 20
Stdev 0.15 20.0 15.5 10.4 4.3 3.9 2.3
CV% 2.1 9.0 10.3 9.5 8.3 10.1 11.7 Note: Stdev: Standard Deviation
%CV: Coefficient of Variance (%)

85
Table 17
Dynamic modulus (E*) test results, 100%RAP
Temperature Sample
ID
Air Voids
(%)
E* (Ksi) values at different frequencies (Hz)
25 Hz 10 Hz 5 Hz 1 Hz 0. 5 Hz 0. 1 Hz
4.4 ºC
1 7.1 1765 1678 1613 1481 1402 1254
2 7.5 1457 1377 1315 1191 1131 998
6 7.5 1569 1466 1395 1256 1187 1052
Average 7.4 1597 1507 1441 1309 1240 1101
Stdev 0.23 156.2 154.4 154.3 152.2 143.0 134.8
CV% 3.1 9.8 10.2 10.7 11.6 11.5 12.2
25.0 ºC
1 7.1 1046 944 871 709 643 494
2 7.5 806 720 658 530 479 368
6 7.5 822 745 689 566 518 411
Average 7.4 891 803 739 602 547 425
Stdev 0.23 134.2 122.5 114.8 94.2 85.6 64.1
CV% 3.1 15.1 15.3 15.5 15.7 15.7 15.1
37.8 ºC
1 7.1 647 556 494 361 317 216
2 7.5 488 413 364 264 229 158
6 7.5 570 495 442 333 296 211
Average 7.4 569 488 434 319 281 195
Stdev 0.23 79.5 71.7 65.6 49.9 45.7 32.4
CV% 3.1 14.0 14.7 15.1 15.6 16.3 16.6
54.4 ºC
1 7.1 286 221 183 107 86 48
2 7.5 211 164 137 84 69 41
6 7.5 225 181 153 98 83 52
Average 7.4 241 189 158 96 79 47
Stdev 0.23 39.6 29.4 23.5 11.5 9.0 5.3
CV% 3.1 16.5 15.6 14.9 12.0 11.4 11.2 Note: Stdev: Standard Deviation
%CV: Coefficient of Variance (%)

86
Table 18
Phase angle test results, 76CO HMA
Temperature Sample
ID
Air Voids
(%)
Phase Angle values at different frequencies (Hz)
25 Hz 10 Hz 5 Hz 1 Hz 0.5 Hz 0.1 Hz
4.4 ºC
1 7.4 6.1 9.0 10.6 14.1 15.8 19.1
2 6.5 6.0 8.9 10.6 14.1 15.7 19.4
9 7.3 4.7 8.5 10.0 13.1 14.5 17.9
Average 7.1 5.6 8.8 10.4 13.8 15.3 18.8
Stdev 0.5 0.8 0.3 0.4 0.6 0.7 0.8
CV% 6.9 14.0 3.0 3.4 4.2 4.5 4.0
25.0 ºC
1 7.4 20.2 23.5 26.2 31.2 32.8 33.2
2 6.5 19.3 22.6 25.0 29.7 30.4 30.8
9 7.3 18.5 22.3 24.43 28.6 30.2 30.1
Average 7.1 19.3 22.8 25.2 29.9 31.1 31.4
Stdev 0.5 0.8 0.6 0.9 1.3 1.4 1.6
CV% 6.9 4.4 2.8 3.6 4.4 4.5 5.2
37.8 ºC
1 7.4 28.2 31.0 31.8 32.8 30.9 25.6
2 6.5 28.2 30.6 31.6 32.4 31.4 27.3
9 7.3 26.6 28.8 28.7 27.4 27.0 22.5
Average 7.1 27.7 30.2 30.7 30.8 29.8 25.1
Stdev 0.5 0.9 1.2 1.7 3.0 2.4 2.4
CV% 6.9 3.3 3.9 5.6 9.7 8.2 9.7
54.4 ºC
1 7.4 31.1 29.8 28.3 23.9 21.2 16.5
2 6.5 29.7 28.4 26.9 22.1 19.1 14.2
9 7.3 26.6 25.3 24.4 20.8 19.5 16.0
Average 7.1 29.1 27.8 26.5 22.3 19.9 15.6
Stdev 0.5 2.3 2.3 2.0 1.6 1.1 1.2
CV% 6.9 7.9 8.2 7.5 7.0 5.5 7.6 Note: Stdev: Standard Deviation
%CV: Coefficient of Variance (%)

87
Table 19
Phase angle test results, 76CRM HMA
Temperature Sample
ID
Air Voids
(%)
Phase Angle (Degrees) values at different frequencies (Hz)
25 Hz 10 Hz 5 Hz 1 Hz 0.5 Hz 0.1 Hz
4.4 ºC
8 7.7 7.5 8.8 9.8 12.3 13.4 16.5
9 7.6 7.5 8.8 9.8 12.3 13.6 16.8
10 7.1 7.8 9.2 10.2 12.9 14.1 17.5
Average 7.5 7.6 9.0 9.9 12.5 13.7 17.0
Stdev 0.3 0.2 0.2 0.2 0.3 0.4 0.5
CV% 4.3 2.2 2.3 2.4 2.8 2.6 3.0
25.0 ºC
8 7.7 21.6 23.2 24.3 27.8 28.7 30.9
9 7.6 21.4 23.1 24.3 27.5 28.2 30.2
10 7.1 22.9 25.3 26.8 30.6 31.2 33.0
Average 7.5 22.0 23.8 25.1 28.6 29.4 31.4
Stdev 0.3 0.8 1.2 1.4 1.7 1.6 1.5
CV% 4.3 3.8 5.1 5.7 6.0 5.5 4.7
37.8 ºC
8 7.7 31.1 32.0 32.4 33.5 33.3 33.0
9 7.6 30.7 31.6 31.9 32.9 32.4 31.5
10 7.1 31.5 32.3 32.5 33.2 32.5 31.7
Average 7.5 31.1 32.0 32.3 33.2 32.7 32.1
Stdev 0.3 0.4 0.4 0.3 0.3 0.5 0.8
CV% 4.3 1.3 1.1 0.9 0.9 1.5 2.5
54.4 ºC
8 7.7 34.2 34.4 33.8 32.2 31.1 28.8
9 7.6 34.2 34.5 33.8 32.6 31.2 28.6
10 7.1 33.1 33.2 32.5 31.9 30.8 27.8
Average 7.5 33.8 34.1 33.4 32.2 31.0 28.4
Stdev 0.3 0.6 0.7 0.7 0.4 0.2 0.5
CV% 4.3 1.8 2.1 2.2 1.1 0.7 1.9 Note: Stdev: Standard Deviation
%CV: Coefficient of Variance (%)

88
Table 20
Phase angle test results, 76RAP15 HMA
Temperature Sample
ID
Air Voids
(%)
Phase Angle (Degrees) values at different frequencies (Hz)
25 Hz 10 Hz 5 Hz 1 Hz 0.5 Hz 0.1 Hz
4.4 ºC
1 7.7 7.5 8.9 10.0 12.9 14.4 18.5
2 7.6 7.5 9.0 10.1 12.9 14.4 18.1
4 7.2 7.1 8.3 9.2 11.7 13.0 16.2
Average 7.5 7.4 8.7 9.8 12.5 13.9 17.6
Stdev 0.3 0.3 0.4 0.5 0.7 0.8 1.2
CV% 3.5 3.7 4.4 5.0 5.6 5.9 6.8
25.0 ºC
1 7.7 24.6 27.2 28.9 32.5 33.2 34.6
2 7.6 23.4 25.7 27.5 31.4 32.2 33.4
4 7.2 22.4 24.9 26.7 31.0 31.8 33.7
Average 7.5 23.5 25.9 27.7 31.6 32.4 33.9
Stdev 0.3 1.1 1.2 1.1 0.8 0.7 0.6
CV% 3.5 4.9 4.5 4.1 2.6 2.3 1.8
37.8 ºC
1 7.7 33.4 34.6 34.7 34.5 33.5 31.0
2 7.6 33.8 35.1 35.3 34.9 33.4 30.5
4 7.2 31.4 32.8 33.3 33.8 33.0 31.5
Average 7.5 32.9 34.2 34.4 34.4 33.3 31.0
Stdev 0.3 1.3 1.2 1.0 0.5 0.3 0.5
CV% 3.5 4.0 3.6 2.9 1.6 0.8 1.6
54.4 ºC**
2 7.6 34.0 34.0 33.3 31.9 30.4 27.4
3 7.7 36.6 36.6 35.0 31.4 28.8 24.1
4 7.2 36.4 36.6 35.2 31.7 29.5 24.9
Average 7.5 35.7 35.7 34.5 31.7 29.6 25.4
Stdev 0.3 1.4 1.5 1.0 0.3 0.8 1.7
CV% 3.5 4.0 4.2 3.0 0.8 2.7 6.8 Note: Stdev: Standard Deviation
%CV: Coefficient of Variance (%)

89
Table 21
Phase angle test results, 64RAP40
Temperature Sample
ID
Air Voids
(%)
Phase Angle (Degrees) values at different frequencies (Hz)
25 Hz 10 Hz 5 Hz 1 Hz 0.5 Hz 0.1 Hz
4.4 ºC
1 7.3 5.1 6.0 6.6 8.3 9.2 11.5
3 7.4 5.5 6.5 7.2 9.1 10.0 12.5
5 7.1 5.4 6.4 7.1 9.1 10.0 12.7
Average 7.3 5.3 6.3 6.9 8.7 9.6 12.0
Stdev 0.15 0.3 0.4 0.4 0.5 0.6 0.7
CV% 2.1 5.3 6.1 6.4 6.0 6.1 6.1
25.0 ºC
1 7.3 16.2 18.2 19.8 23.6 24.8 28.0
3 7.4 16.9 19.2 20.9 25.1 26.4 29.9
5 7.1 17.2 19.6 21.3 25.5 26.7 29.8
Average 7.3 16.8 19.0 20.6 24.7 26.0 29.2
Stdev 0.15 0.5 0.7 0.8 1.0 1.0 1.1
CV% 2.1 3.3 3.8 3.8 4.0 3.8 3.8
37.8 ºC
1 7.3 26.3 28.1 29.1 31.3 31.2 31.4
3 7.4 26.8 28.5 29.6 32.4 32.6 33.0
5 7.1 27.6 29.4 30.4 32.7 32.6 32.5
Average 7.3 26.9 28.6 29.7 32.1 32.1 32.3
Stdev 0.15 0.7 0.7 0.7 0.7 0.8 0.8
CV% 2.1 2.5 2.4 2.2 2.2 2.4 2.6
54.4 ºC
1 7.3 32.7 32.6 32.0 31.6 30.8 29.8
3 7.4 36.0 36.0 35.0 33.1 31.8 28.9
5 7.1 34.9 34.9 34.1 32.3 31.0 27.9
Average 7.3 34.5 34.5 33.7 32.3 31.2 28.9
Stdev 0.15 1.7 1.7 1.5 0.8 0.5 0.9
CV% 2.1 4.8 5.0 4.5 2.4 1.8 3.3 Note: Stdev: Standard Deviation
%CV: Coefficient of Variance (%)

90
Table 22
Phase angle test results, 100%RAP
Temperature Sample
ID
Air Voids
(%)
Phase Angle (Degrees) values at different frequencies (Hz)
25 Hz 10 Hz 5 Hz 1 Hz 0.5 Hz 0.1 Hz
4.4 ºC
1 7.1 4.4 5.0 5.4 6.3 6.9 8.0
2 7.5 5.1 6.0 6.7 7.3 7.7 9.0
6 7.5 4.8 5.4 5.8 6.7 7.1 8.2
Average 7.4 4.8 4.4 5.9 6.7 7.2 8.4
Stdev 0.23 0.4 0.4 0.6 0.5 0.4 0.5
CV% 3.1 8.3 9.1 10.8 7.9 6.1 6.4
25.0 ºC
1 7.1 10.9 12.2 13.1 15.6 16.6 29.5
2 7.5 11.0 12.4 13.4 15.8 16.9 19.6
6 7.5 10.0 11.2 11.9 13.8 14.8 16.9
Average 7.4 10.6 11.9 12.8 15.1 16.1 18.7
Stdev 0.23 0.6 0.6 0.8 1.1 1.2 1.5
CV% 3.1 5.6 5.3 6.1 7.1 7.2 8.1
37.8 ºC
1 7.1 16.0 17.9 19.2 22.5 23.5 26.4
2 7.5 16.4 18.3 19.4 22.4 23.5 26.4
6 7.5 15.1 16.6 17.7 20.4 21.3 23.9
Average 7.4 15.8 17.6 18.8 21.8 22.8 25.6
Stdev 0.23 0.6 0.9 1.0 1.2 1.3 1.5
CV% 3.1 4.0 5.0 5.1 5.5 5.7 5.7
54.4 ºC
1 7.1 25.8 28.1 29.2 32.0 32.3 34.0
2 7.5 25.4 27.6 28.8 31.4 31.9 33.3
6 7.5 24.2 26.1 27.1 29.6 30.0 31.4
Average 7.4 25.1 27.2 28.4 31.0 31.4 32.9
Stdev 0.23 0.8 1.1 1.1 1.3 1.3 1.3
CV% 3.1 3.3 3.9 4.0 4.1 4.0 4.0 Note: Stdev: Standard Deviation
%CV: Coefficient of Variance (%)

91
Table 23
Flow number test results
Mix Type Sample
ID Air Void
(%) Flow Number
(Cycles)
Mean Flow
Number
(Cycles) St Dev CV (%)
76CO
1 7.3 5493
6132 851.0 13.9 8 6.7 5805
11 7.2 7098
76CRM
6 7.0 1975
1725 411.6 23.9 11 6.5 1950
14 6.6 1250
76RAP15
1 7.7 6450
6867 520.4 7.6 2 7.7 6700
3 6.8 7450
64RAP40
1 7.3 1992
2397 404.0 16.8 2 7.1 2400
3 7.5 2800
100%RAP
4 7.5 10000
10000 0.0 0.0 7 7.2 10000
8 7.2 10000
Note: Stdev: Standard Deviation
%CV: Coefficient of Variance (%)