TECHNICAL REPORT STANDARD PAGE “Bill” King, Jr., Md Sharear Kabir, Samuel B. Cooper, Jr., ......
72
1. Report No. FHWA/LA.13/513 2. Government Accession No. 3. Recipient's Catalog No. 4. Title and Subtitle Evaluation of Open Graded Friction Course (OGFC) Mixtures 5. Report Date October 2013 6. Performing Organization Code LTRC Project Number: 04-5B State Project Number: 736-99-1300 7. Author(s) William “Bill” King, Jr., Md Sharear Kabir, Samuel B. Cooper, Jr., Christopher Abadie 8. Performing Organization Report No. 9. Performing Organization Name and Address Louisiana Transportation Research Center (LTRC) 4101 Gourrier Avenue, Baton Rouge, LA 70808 10. Work Unit No. 11. Contract or Grant No. 12. Sponsoring Agency Name and Address Louisiana Department of Transportation and Development P.O. Box 94245 Baton Rouge, LA 70804-9245 13. Type of Report and Period Covered Final Report [06/04 - 04/11] 14. Sponsoring Agency Code 15. Supplementary Notes Conducted in Cooperation with the U.S. Department of Transportation, Federal Highway Administration 16. Abstract Louisiana Department of Transportation and Development (LADOTD) began the development of Open-Graded Friction Course (OGFC) mixtures in the late 1960s and early 1970s. In the early 1980s, a moratorium was imposed on the use of OGFC mixtures due to some early failure issues and a number of OGFC pavements experiencing end of life failure. However, significant improvements have been noticed in OGFC mixture performance and service life since a new-generation of OGFC mixture was promoted in the U.S. in late 1990s. Inspired by the success of some other state agencies, LADOTD modified the earlier mix design and constructed four new OGFC sections during the last decade to evaluate pavement performance and safety benefits. This paper includes a comprehensive evaluation of Louisiana OGFC mixtures on the basis of their laboratory and field performance. Laboratory work entailed material and mixture design in addition to performing numerous laboratory tests namely permeability, draindown, tensile strength ratio, and loaded wheel test. Field evaluation involved visual inspection, pavement condition survey, skid resistance, and traffic safety. With very few exceptions in the laboratory, the selected OGFC mixtures showed the potential to meet current LADOTD specifications as well as various performance standards established by previous studies. The field analysis indicates that the OGFC test sections showed improved rutting, cracking, and skid performance when compared to typical Superpave roadway sections. It is anticipated that this performance evaluation will support the ongoing use of OGFC mixtures in the state of Louisiana. Additionally, it provides an opportunity to continually improve the current OGFC specification and mix design procedures adopted by LADOTD. 17. Key Words OGFC, skid resistance, safety, pavement condition survey, glass- grid. 18. Distribution Statement Unrestricted. This document is available through the National Technical Information Service, Springfield, VA 21161. 19. Security Classif. (of this report) 20. Security Classif. (of this page) 21. No. of Pages 72 22. Price TECHNICAL REPORT STANDARD PAGE
Transcript of TECHNICAL REPORT STANDARD PAGE “Bill” King, Jr., Md Sharear Kabir, Samuel B. Cooper, Jr., ......

1. Report No. FHWA/LA.13/513
2. Government Accession No. 3. Recipient's Catalog No.
4. Title and Subtitle Evaluation of Open Graded Friction Course (OGFC) Mixtures
5. Report Date
October 2013 6. Performing Organization Code LTRC Project Number: 04-5B State Project Number: 736-99-1300
7. Author(s)
William “Bill” King, Jr., Md Sharear Kabir, Samuel B. Cooper, Jr.,
Christopher Abadie
8. Performing Organization Report No.
9. Performing Organization Name and Address Louisiana Transportation Research Center (LTRC) 4101 Gourrier Avenue, Baton Rouge, LA 70808
10. Work Unit No.
11. Contract or Grant No.
12. Sponsoring Agency Name and Address
Louisiana Department of Transportation and Development P.O. Box 94245 Baton Rouge, LA 70804-9245
13. Type of Report and Period Covered
Final Report [06/04 - 04/11] 14. Sponsoring Agency Code
15. Supplementary Notes
Conducted in Cooperation with the U.S. Department of Transportation, Federal Highway Administration
16. Abstract Louisiana Department of Transportation and Development (LADOTD) began the development of Open-Graded Friction Course (OGFC) mixtures in the late 1960s and early 1970s. In the early 1980s, a moratorium was imposed on the use of OGFC mixtures due to some early failure issues and a number of OGFC pavements experiencing end of life failure. However, significant improvements have been noticed in OGFC mixture performance and service life since a new-generation of OGFC mixture was promoted in the U.S. in late 1990s. Inspired by the success of some other state agencies, LADOTD modified the earlier mix design and constructed four new OGFC sections during the last decade to evaluate pavement performance and safety benefits. This paper includes a comprehensive evaluation of Louisiana OGFC mixtures on the basis of their laboratory and field performance. Laboratory work entailed material and mixture design in addition to performing numerous laboratory tests namely permeability, draindown, tensile strength ratio, and loaded wheel test. Field evaluation involved visual inspection, pavement condition survey, skid resistance, and traffic safety. With very few exceptions in the laboratory, the selected OGFC mixtures showed the potential to meet current LADOTD specifications as well as various performance standards established by previous studies. The field analysis indicates that the OGFC test sections showed improved rutting, cracking, and skid performance when compared to typical Superpave roadway sections. It is anticipated that this performance evaluation will support the ongoing use of OGFC mixtures in the state of Louisiana. Additionally, it provides an opportunity to continually improve the current OGFC specification and mix design procedures adopted by LADOTD.
17. Key Words
OGFC, skid resistance, safety, pavement condition survey, glass-grid.
18. Distribution Statement Unrestricted. This document is available through the National Technical Information Service, Springfield, VA 21161.
19. Security Classif. (of this report)
20. Security Classif. (of this page)
21. No. of Pages 72
22. Price
TECHNICAL REPORT STANDARD PAGE


Project Review Committee
Each research project will have an advisory committee appointed by the LTRC Director. The
Project Review Committee is responsible for assisting the LTRC Administrator or Manager
in the development of acceptable research problem statements, requests for proposals, review
of research proposals, oversight of approved research projects, and implementation of
findings.
LTRC appreciates the dedication of the following Project Review Committee Members in
guiding this research study to fruition.
LTRC Administrator
William “Bill” King, Jr., P.E.
Materials Research Administrator
Members
David Hodnett
Janice Williams
Luanna Cambas
Marcia Granger
Hector Santiago
Gary Fitts
Jonathan Ashley
Directorate Implementation Sponsor
Richard Savoie, P.E.
DOTD Chief Engineer


Evaluation of Open Graded Friction Course (OGFC) Mixtures
by
William “Bill” King, Jr., P.E.
Materials Research Administrator
Md Sharear Kabir, P.E.
Asphalt Research Engineer
Samuel B. Cooper, Jr., P.E.
LTRC Training and Technology Transfer Engineer
Christopher Abadie, P.E.
Materials Engineer Administrator
Louisiana Transportation Research Center (LTRC)
4101 Gourrier Avenue,
Baton Rouge, LA 70808
LTRC Project No. 04-5B
State Project No. 736-99-1300
conducted for
Louisiana Department of Transportation and Development
Louisiana Transportation Research Center
The contents of this report reflect the views of the author/principal investigator who is
responsible for the facts and the accuracy of the data presented herein. The contents of do
not necessarily reflect the views or policies of the Louisiana Department of Transportation
and Development, the Federal Highway Administration or the Louisiana Transportation
Research Center. This report does not constitute a standard, specification, or regulation.
October 2013


iii
ABSTRACT
Louisiana Department of Transportation and Development (LADOTD) began the
development of Open-Graded Friction Course (OGFC) mixtures in the late 1960s and early
1970s. In the early 1980s, a moratorium was imposed on the use of OGFC mixtures due to
some early failure issues and a number of OGFC pavements experiencing end of life failures.
However, significant improvements have been noticed in OGFC mixture performance and
service life since a new-generation of OGFC mixture was promoted in the U.S. in late 1990s.
Inspired by the success of some other state agencies, LADOTD modified the earlier mix
design and constructed four new OGFC sections during the last decade to evaluate pavement
performance and safety benefits. This paper includes a comprehensive evaluation of
Louisiana OGFC mixtures on the basis of their laboratory and field performance. Laboratory
work entailed material and mixture design in addition to performing numerous laboratory
tests namely permeability, draindown, tensile strength ratio, and loaded wheel. Field
evaluation involved visual inspection, pavement condition survey, skid resistance, and traffic
safety. With very few exceptions in the laboratory, the selected OGFC mixtures showed the
potential to meet current LADOTD specifications as well as various performance standards
established by previous studies. The field analysis indicates that the OGFC test sections
showed improved rutting, cracking, and skid performance when compared to typical
Superpave roadway sections. It is anticipated that this performance evaluation will support
the ongoing use of OGFC mixtures in the state of Louisiana. Additionally, it provides an
opportunity to continually improve the current OGFC specification and mix design
procedures adopted by LADOTD.


v
ACKNOWLEDGMENTS
The authors acknowledge the financial support for this study by Federal Highway
Administration (FHWA), Louisiana Department of Transportation and Development
(LADOTD), and Louisiana Transportation Research Center (LTRC). The efforts of Greg
Tullier, William Gueho, and Patrick Frazier at LTRC asphalt laboratory and Mitchell Terrell
and Shawn Elisar at LTRC pavement research section are highly appreciated. The authors
would like to express sincere thanks to Louay Mohammad, Ph.D., for his thoughtful input,
encouragement, and help throughout the course of this study. Special thanks to Patrick
Icenogle, P.E., for his priceless contribution in the Pavement Management System data
analyses.


vii
IMPLEMENTATION STATEMENT
The experience obtained from this research study has led to the development of new OGFC
mixture specifications for LADOTD which are capable of delivering impressive performance
as well as providing a safe traveling surface and improved visibility during inclement
weather.
Based on the recommendations of this research, Louisiana’s OGFC mix design procedure has
been incorporated into the recently developed 501 specifications, Thin Asphaltic Concrete
Applications. Some of the highlighted mixture specifications include:
Performance graded asphalt cement along with fiber additives are required in current
practice.
A maximum limit of 0.472-in. (12-mm) rut depth after 7500 passes in the LWT test.
The Spray Paver shall be required when placing OGFC mixtures using a polymer
based emulsion for the tack coat.
Require the use of the CoreLok device for determining air voids.
In addition to the new specifications, a design memorandum on the appropriate use of all
Asphalt mixtures and treatments was developed, which includes the OGFC mixtures. The
memorandum indicates that all new construction on Interstate roadways in urban areas have
an OGFC placed as the final lift. Since the beginning of this study, approximately 115,000
tons or 263 lane miles of OGFC mixtures have been placed on various roadways and many
more are being planned throughout the state. LTRC will continue to monitor the use and
performance of these pavements.


ix
TABLE OF CONTENTS
ABSTRACT .............................................................................................................................III
ACKNOWLEDGMENTS ........................................................................................................ V
IMPLEMENTATION STATEMENT ................................................................................... VII
TABLE OF CONTENTS ........................................................................................................ IX
LIST OF TABLES .................................................................................................................. XI
LIST OF FIGURES .............................................................................................................. XIII
INTRODUCTION .....................................................................................................................1
Background and Literature Review .............................................................................. 2
Noise Reduction ................................................................................................ 3
Improved Safety ................................................................................................ 4
Mixture Design ................................................................................................. 6
Production and Construction ............................................................................. 7
Limitations of OGFCs....................................................................................... 8
OBJECTIVE ..............................................................................................................................9
SCOPE .....................................................................................................................................11
METHODOLOGY ..................................................................................................................13
Field Project Description ............................................................................................ 13
US 71, Grant Parish ........................................................................................ 13
I-20, Ouacita Parish ........................................................................................ 14
US 61, Ascension Parish ................................................................................. 14
US 171, Desoto Parish .................................................................................... 14
Materials and Mixture Design .................................................................................... 17
Laboratory Testing ...................................................................................................... 19
Permeability Test ............................................................................................ 19
Draindown Test ............................................................................................... 20
Loaded Wheel Tracker (LWT) Test ............................................................... 21
Tensile Strength Ratio (TSR) Test .................................................................. 22
Air Void Measurement ................................................................................... 22
Field Performance Tests ............................................................................................. 24
Pavement Friction Properties .......................................................................... 24
Distress Condition Survey .............................................................................. 25
DISCUSSION OF RESULTS..................................................................................................27
Laboratory Test Results .............................................................................................. 27
Permeability Test Results ............................................................................... 27
Draindown Test Results .................................................................................. 28

x
Loaded Wheel Tracking (LWT) Test Results ................................................. 28
Tensile Strength Ratio (TSR) Test Results ..................................................... 29
Air Void Measurement ................................................................................... 30
Filed Performance Evaluation ..................................................................................... 31
Distress Condition Survey Results.................................................................. 31
Reflective Crack Measures ............................................................................. 35
Accident Reduction ......................................................................................... 36
Splash and Spray of Rainwater ....................................................................... 38
Cost Comparisons ........................................................................................... 39
CONCLUSIONS......................................................................................................................41
RECOMMENDATIONS .........................................................................................................43
ACRONYMS, ABBREVIATIONS, AND SYMBOLS ..........................................................45
REFERENCES ........................................................................................................................47
APPENDIX ..............................................................................................................................53

xi
LIST OF TABLES
Table 1 Comparison between FHWA and NCAT gradations ................................................. 7
Table 2 Mixture description and volumetrics ........................................................................ 18
Table 3 Friction properties of various roadway sections ....................................................... 32
Table 4 PCI and predicted service life ................................................................................... 36
Table 5 Accident reduction .................................................................................................... 37
Table 6 Cost comparison of OGFC and glass-grid sections .................................................. 40


xiii
LIST OF FIGURES
Figure 1 Locations of OGFC test sections ............................................................................. 13
Figure 2 Construction of OGFC ............................................................................................ 15
Figure 3 LADOTD OGFC test sections ................................................................................. 16
Figure 4 Blended aggregate gradations .................................................................................. 19
Figure 5 Falling head flexible wall permeameter .................................................................. 20
Figure 6 Loaded wheel tester device ..................................................................................... 21
Figure 7 Humbolt TSR device ............................................................................................... 22
Figure 8 CoreLok testing device ............................................................................................ 23
Figure 9 Locked wheel skid tester ......................................................................................... 24
Figure 10 Automated pavement data collection unit ............................................................. 25
Figure 11 A screen shot of visidata software ......................................................................... 26
Figure 12 Permeability test results ......................................................................................... 27
Figure 13 Draindown test results ........................................................................................... 28
Figure 14 LWT test results .................................................................................................... 29
Figure 15 TSR test results ...................................................................................................... 30
Figure 16 Comparison of air voids ........................................................................................ 31
Figure 17 MPD results ........................................................................................................... 33
Figure 18 Performance based on PMS data ........................................................................... 34
Figure 19 Pattern of accident occurrences ............................................................................. 38
Figure 20 Splash and spray comparison: (a) typical superpave (b) OGFC ........................... 39


INTRODUCTION
OGFC (open-graded friction course) is a porous, gap-graded asphaltic concrete mixture that
contains a high percentage of interconnected air voids. These types of mixtures are also
referred to as Permeable Friction Course (PFC) and primarily designed as a thin wearing
surface to provide numerous benefits in terms of safety, economy and environment [1].
Researchers found that the high air void content coupled with large permeability enhance the
effective lateral drainage of rain water to the edge of the pavement. Generally, the OGFC
pavement reduces hydroplaning, splash and spray, and improves roadway visibility and the
skid resistance of pavement surface under wet weather conditions. Other purported benefits
of OGFC mixtures are improved pavement smoothness and lower pavement tire noise [2-6].
In Louisiana, OGFC mixtures were first developed between the late 1960s and early 1970s
prior to the initiation of the Federal Highway Safety Program Management Guide, Highway
Safety Program 12, and Instructional Memorandum 211-3-73 of 1973 (Skid Accident
Reduction Program). Afterwards, LADOTD issued an Engineering Directive to use Plant
Mix Seal (another name for OGFC) on all roads with an ADT greater than 4,000 (revised to
3000 in 1980). Many of these surface layers had reached their end-of-life (10-12 years),
having lasted much longer than the original life expectancy of five years. However, early
failures with some of the OGFCs in the early 1980s due to a reduction in asphalt cement
content led to a moratorium on its use in the state of Louisiana.
Initial inspection indicated that the problems encountered with the failed OGFCs were related
mainly to moisture and temperature. These problems resulted in early raveling, stripping,
and construction difficulties of the OGFC mixtures. The design asphalt content of OGFC’s
was significantly decreased in late 1970s due to several oil boycotts and subsequent increases
in the cost of crude. The decreased asphalt content in combination with the use of base
asphalt that oxidized rapidly contributed to these problems. The temperature issues were
related to both mix and weather; whereas, the moisture issues were generally associated with
a particular aggregate type. To address these issues, changes were made to the
specifications, including maximum moisture content for the aggregate, institution of a
construction season from May to September, and an increased minimum ambient air
temperature. Based on those changes, the moratorium was later lifted.
Construction of a safe and durable highway system in Louisiana has long been a major
concern for highway engineers. Substantial efforts have been undertaken to modify the first
generation OGFC mixes to overcome the previous failures and to achieve the highest level of
performance. Significant improvements have been noticed in mixture performance and
service life since a new-generation of OGFC was promoted in the states around the late

2
1990s based on the mixture design proposed by National Center for Asphalt Technology
(NCAT) [1, 7]. The new mixtures may contain fibers, polymer-modified asphalt, or asphalt-
rubber in addition to a minimum air void content of 18 percent. Inspired by the success of
several state agencies, LADOTD constructed four new OGFC roadway sections to evaluate
pavement performance and safety benefits. The assessment indicated that OGFC is
beneficial for wet weather accident reduction, crack relief over composite pavements, and
pavement surface preservation. With positive field performances, OGFC specification and
mix design procedures have been developed and included into the latest edition of LADOTD
Specifications for Roads and Bridges for thin asphaltic concrete application.
Background and Literature Review
The history of development of OGFC mixes in the United States started with the
experimentation of plant mix seal coats during the first half of the twentieth century.
According to National Cooperative Highway Research Program (NCHRP), Oregon first
began the experimentation of improving the frictional properties of pavement in the 1930s
[6]. Later California started to use plant mix seal coat mixtures as drainage interlayers and as
an alternative to chip seals and slurry seals. In the late 1940s, substantial use of these type of
mixtures (later termed as OGFCs) began in the western part of the United States. Despite
providing improved frictional properties and reduced potential for hydroplaning and
splash/spray, the use of OGFC across the United States did not gain popularity until the
FHWA initiated a program to increase the skid resistance on roadways in the 1970s [7].
Numerous European countries also began to utilize PFCs (another form of OGFCs) in the
late 1970s to early 1980s. Europeans introduced modified binders and fibers to the U.S.
version of OGFCs developed between the 1930s and 1970s and improved the performance of
those mixtures significantly.
In 1978, NCHRP reported that 15 states in the U.S. were using OGFC extensively and
several additional states were considering the use of OGFC mixtures [8]. Some state
departments of transportation have reported good performance while many others have
reported the opposite. A 1998 survey indicated that 19 states were using OGFC at that time
[9]. The state DOTs that reported good performance with OGFCs had adopted coarser
gradations and modified asphalt binders. A recent survey conducted by Clemson University,
South Carolina, on the use, specifications, and design of OGFC across the United States
indicated that 61 percent of the respondents were using OGFCs on roadways in their
jurisdiction [10].
Over the years, numerous researchers in the United States and Europe evaluated the
application, performance, and effectiveness of OGFC mixtures. Even though there are minor
differences between OGFCs used in the United States and the PFCs or Porous Asphalt (PA)

3
used in other countries, their functions are anticipated to be the same. Consequently, this part
of the literature review uses the terms OGFC, PFC, and PA interchangeably and focuses on
the overall performance of these types of mixtures. NCHRP published a report that offers
valuable resources for the entities interested in the state-of-practice of OGFCs. The report
fully documents a comprehensive, critical review of the worldwide literature on design,
performance, construction, and maintenance of PFC roadways in addition to survey results
from various state departments of transportation [6]. Based on the findings of that study, the
authors concluded the following:
The primary benefits of PFCs are associated with improved safety, driver comfort,
and environmental. Safety improvement includes the high potential for reduced
hydroplaning, pavement glare, and splash/spray. Additionally, it can improve wet
weather friction and hence improve traffic safety.
PFCs can provide driver comfort as it increases driver’s confidence during a rain
event.
PFCs offer environmental benefits by providing smoother pavements, which improve
fuel economy and reduce pavement noise.
Design of PFC mixtures should be done through four major steps: (1) selection of
appropriate materials, i.e., angular aggregates, modified binders, fibers, etc.; (2)
selection of a suitable gradation; (3) selection of optimum binder content; and (4)
performance testing, i.e., cantabro abrasion test, stone-on-stone contact test, and
draindown test.
Construction of PFCs requires slight adjustments in hauling, laydown and compaction
procedures compared to most hot mix asphalt (HMA) mixtures. PFCs tend to cool
down faster; therefore, precaution is needed during transportation. Vibratory and
pneumatic rollers are prohibited and only static steel wheel rollers should be used.
In general, PFCs are not considered to provide structural value to a pavement
structure. Literature has shown evidence that PFC’s provide cooler temperatures in
the underlying layers which result in a net increase in overall pavement stiffness.
PFCs should not be used in areas exposed to debris and dirt.
Noise Reduction
The power train and the pavement-tire interaction are major sources associated with traffic
noise. Power train noise is generated from mechanical devices and, therefore, falls out of the
scope of pavement engineering. To investigate pavement-tire noise, the influential factors
were found to be: pavement surface type, vehicle speed, layer thickness, traffic condition,

4
texture and roughness of pavement surface, nominal maximum aggregate size, air void
contents, and so on [11].
Historically, OGFCs have been found to reduce the pavement-tire noise level due to their
good, sound absorption potential. Huber reported an approximately 3 dBA noise reduction
with OGFCs in comparison to dense graded HMA at highway speeds [12]. This equals a 50
percent reduction in noise pressure. Similarly, Kandahl reported an average noise reduction
of 3 to 5 dBA for OGFCs in comparison to regular HMAs [13]. Colorado DOT tested 19
pavement surfaces (13 HMA and 6 PCCP) to evaluate the pavement tire noise levels for each
surface type. The OGFC section was found to be the quietest with an average noise level of
95.2 dB(A) [2]. Similarly, in Ohio, the pavement tire noise for OGFC pavement was 2.8 dB
lower than the dense graded asphalt pavement [14].
In 2003, three highway test sections constructed in the central Indiana region were monitored
for friction, texture, and noise properties over four years [3]. The test sections were
constructed with dense-graded asphalt (DGA), stone matrix asphalt (SMA), and PFC
mixtures. The authors found the PFC to be the quietest surface followed by Superpave DGA
and SMA surfaces. However, a slight increasing trend for noise was observed on the PFC
section over time. A similar reduction in pavement-tire noise is reported by Bennert et al.
who evaluated different pavement surfaces in New Jersey using the CPX methods at a
vehicle speed of 60 mph [15]. In another study, Washington State DOT found the OGFC
pavements were quieter initially than newly built typical dense graded HMA. However,
OGFC pavements continued to lose their initial noise reduction qualities over time [4].
The size of aggregates in OGFC mixtures can be a contributing factor to noise reduction.
Research at the Institute for Safe, Quiet and Durable Highways indicated that OGFC
mixtures containing smaller sized aggregates generally performed better with respect to noise
reduction [16]. Similarly, Raaberg et al. concluded that the OGFC mixtures with smaller
sized aggregates performed better than OGFC mixtures with larger sized aggregates and
dense graded HMA as well. However, OGFC mixtures with smaller aggregates showed
durability issues with studded tires [17].
Improved Safety
It has been reported that over 41,000 fatalities and almost 2.5 million injuries occur on
United States highways, and nearly 30 percent of those fatalities were influenced by
pavement surface condition. Analysis showed that 13.5 percent of fatal crashes and 18.8
percent of all crashes occur under wet weather condition [18]. Pavement surfaces should
therefore be designed to provide sufficient friction especially in wet weather conditions.
Macro-texture, mainly controlled by aggregate gradations and mixture design, has been
found to be responsible for hysteresis friction and hydroplaning. The open gradations of

5
OGFC mixtures create courser surface textures, which result in providing higher macro-
textures than the traditional Superpave mixtures. High air void content coupled with higher
macro-textures allow quick water drainage, which can effectively improve traffic safety
when the pavement is wet [19].
To investigate the effect of OGFC on friction and micro-texture of asphalt pavement, Wang
and Flintsch evaluated the Friction Number (FN) and Mean Profile Depth (MPD) of several
dense-graded Superpave mixtures, one OGFC, and one SMA surface at the Virginia Smart
Road facility over a period of six years [20]. The OGFC was found to have highest macro-
texture depth (3.75 mm) followed by SMA (2.25 mm) and Superpave (≈ 1.2 mm),
respectively. However, the OGFC and SMA mixtures had bigger nominal aggregates, which
may contribute to this finding. Additionally, at higher speed, the coarser mixes (OGFC and
SMA) were reported to offer higher friction; whereas, no significant difference in friction
was noticed at intermediate speed.
Numerous other studies have shown that OGFC pavements provide improved surface friction
or at least comparable friction to regular dense graded pavements [3, 4, 6, 21, 22]. McDaniel
et al. compared a PFC section to adjacent SMA and conventional HMA sections. The
Circular Texture Meter (CTM) measurements indicated that the PFC had the highest surface
texture depth, more than four times greater than the conventional HMA. The PFC also
provided the highest friction value followed by SMA in terms of International Friction Index
(FN60) [23].
OGFC mixtures possess a permeable interconnected void structure that allows storm water to
pass through the surface layer in a faster pace. This can reduce splash and spray of rain
water, pavement glaring from reflected light in addition to providing greater friction due to
decreased hydroplaning potential. A long-term study by the British Columbia Ministry of
Transportation and Infrastructure indicated that OGFC pavements improved friction and
surface drainage in addition to glare and splash reduction [24]. In most of the studies, no
quantified measure of splash and spray was reported. However, Nicholls quantified
approximately 95 percent reduction in splash and spray generated by a vehicle when
comparing wet OGFC and dense-graded asphalt pavement surfaces in United Kingdom. This
observation was effective for a number of years even though it seemed to be decreasing over
time [25]. In the U.S., a number of state DOTs presented photographic evidence of this
benefit, too. Then again, based upon visual inspection and motorists comments, Pierce et al.
and Huddleston et al. reported a significant reduction in splash and spray and improved
visibility while driving during rainy weather [4, 21].

6
Significant improvement in ride quality can be achieved through a thin lift of OGFC. The
ride quality comparison by Virginia DOT indicated a consistent improvement of IRI values
nearly 50 percent for the new OGFC lift over the original surface [26].
Mixture Design
Different agencies in the U.S. have embraced a wide divergence of mix design practices for
OGFCs. A survey by NCAT in 1998 revealed that 76 percent of the participating states had
formal mix designs, while 9 percent used a recipe and the rest used a hybrid of those two [9].
It is believed that the first widely used OGFC mix design was developed by FHWA in 1974.
This design procedure was modified twice, first in 1980 and then again in 1990. The FHWA
mix design was based on the evaluation of the surface capacity (determined by oil
absorbency test) of the predominant aggregate fraction corresponding to the materials that
passed through a 3/8-in. sieve and retained on a No. 4 sieve. Additionally, a draindown test
was required to determine the optimum mixing temperature along with a moisture resistance
test.
Based on the experience gained in the U.S., Europe, and internal research, NCAT proposed a
new OGFC mix design procedure in 2000. This mix-design method included an assessment
of both functionality (permeability) and durability [7]. There were four primary components
in this new mix design: material selection, selection of design gradation, determining
optimum binder content, and lastly, evaluation for moisture susceptibility. The mix design
recommended a coarser aggregate gradation than the typical ones used in the past. A strong
and durable aggregate with LA abrasion values of 30 percent or less was recommended. The
aggregate should also be crushed, have minimal flat and elongated particles, and be low in
absorption. The criteria for binder selection should be regulated by environment, traffic, and
expected functional purposes of the pavement. In general, polymer-modified binders were
recommended with a desired addition of fiber stabilizer to resist draindown. The
recommended gradations are shown in Table 1 in comparison to FHWA gradations
mentioned before [7]. One of the important criteria of this mix design is to ensure the stone-
on-stone contact of the aggregates. In so doing, the voids in the coarse aggregate in the
compacted mixture (VCAmix) have to be less than or equal to the voids in the coarse
aggregate calculated from the dry rodded unit weight (VCAdrc.). Determination of the
optimum binder content is based on a series of defined laboratory tests both on samples
compacted with a gyratory compactor at 50 gyrations and uncompacted samples. The tests
included in this step are determining the air voids, abrasion on aged and unaged samples, and
binder draindown. The final step of this mix design is to evaluate the moisture susceptibility
using a modified Lottman test method that uses five freeze/thaw cycles instead of one.

7
Based on the previously mentioned principles, a mix design method was released by ASTM
designated as ASTM D 7064-04. To further improve the mix design methods, recently
researchers at Texas A&M University proposed several recommendations which are: the use
of dimensional analysis to compute air voids and bulk specific gravity, assessment of mixture
durability through the Cantabro test, and verification of stone-on-stone contact during the
mix design phase. Additionally, the out flow time and an expected permeability value were
also suggested to evaluate the drainability of the mixture [27].
Table 1 Comparison between FHWA and NCAT gradations
Sieve Sizes FHWA Gradations (percent passing)
NCAT Gradations (percent passing)
19 mm (3/4 in) - 100
12.5 mm (1/2 in) 100 85-100
9.5 mm (3/8 in) 95-100 55-75
4.75 mm (#4) 30-50 10-25
2.36 mm (#8) 5-15 5-10
.075 mm (#200) 2-5 2-4
Production and Construction
The production and construction practice for OGFCs are generally similar to the standard
dense graded HMA construction. Storage and mixing of asphalt binder are like typical HMA;
however, mixing times may be slightly longer in comparison to HMA mixtures to ensure the
fibers to be blended completely in the mix. The storage time for OGFC mixtures has to be
limited to minimize the risk of potential drain down. A typical storage time of 2 hours has
been reported by state agencies responded to a NCHRP survey [6].
The main concern while transporting OGFCs is to maintain the temperature as the mixture
loses temperature faster than compared to typical HMA. Agencies attempt to maintain the
appropriate temperatures by limiting hauling time, limiting hauling distance, or specifying a
minimum arrival temperature. Placement temperature restrictions for OGFCs are generally
more limiting than for the typical dense-graded HMA because of the thinner lift thickness
and modified binders used in OGFC.
Compaction of OGFCs is challenging as their usual thin lift thickness tends to cool down
quickly. Therefore, compaction needs to be done immediately after the placement [6]. The
use of Material Transfer Vehicle (MTV) can be beneficial to eliminate both thermal and

8
mixture segregation. For the compaction, steel rollers are recommended only in the static
mode. As OGFCs are usually placed in thin lifts (less than about 3 times the NMAS),
particles cannot rearrange under vibration. Therefore, vibratory rollers are strictly prohibited
to avoid the cracking of aggregates under excessive loading. However, thicker lifts may
accommodate vibratory/oscillatory rolling operation [28]. Clearing the pavement edge
should be acknowledged in OGFC placement as it can clog the pores near the edge and
eventually, hamper the drainability functionality of the pavement [29].
Limitations of OGFCs
Even though OGFCs provide numerous advantages on roadways, these mixtures are not free
from shortcomings. There has always been a question of the durability of OGFC mixtures.
The interconnected voids of OGFC mixtures help surface water to drain quickly but also
accelerate the aging process of mixtures as air can pass through the pavement structure
easily. However, recent improvements in materials, design and production, appropriate
storage, and hauling and placement with a low liquid draindrown quality showed the
potential to overcome the premature raveling failures of the past [26].
Maintenance of OGFCs in winter conditions is always a challenge to meet. While new
OGFC mixtures have been successfully used in the southern climates, recent surveys
indicated that its use in the northern ice and snow climates continues to have problems [1,
30]. The porous structure of OGFC surface can allow a faster accumulation of snow and ice
in comparison to conventional pavements.
Clogging of pavement pores with time is another major issue with OGFCs. Clogging can
reduce both the functional effectiveness, i.e., removal of water from pavement surface and
noise reducing capability of OGFC pavements [3, 19]. However, regular maintenance
treatment can minimize the clogging effectively.

9
OBJECTIVE
The purpose of this study was to monitor and document the construction and performance of
OGFC mixtures in several field projects in the state of Louisiana. This evaluation was
focused mainly on long-term performance based on wet weather safety improvement, surface
crack resistance, and pavement condition survey. In addition, laboratory performance of
OGFC mixtures was evaluated in an effort to determine an appropriate mix-design procedure
for Louisiana.


11
SCOPE
Four OGFC test sections were constructed on US 71, I-20, US 61, and US 171 to evaluate
pavement performance and safety benefits on the basis of their laboratory and field
performance. Permeability, Draindown, Loaded Wheel Tracking (LWT), and Tensile
Strength Ratio (TSR) tests were conducted in the laboratory test factorial in addition to
material and mixture design evaluation. Field performance evaluation was performed on the
basis of visual inspection, pavement condition survey, friction testing, and traffic safety data
analysis.


13
METHODOLOGY
Field Project Description
Four OGFC test sections were constructed on US 71, I-20, US 61, and US 171 roadways
under the scope of this study. The locations of those test sections are shown in the map
presented in Figure 1. A sample OGFC pavement surface and regular construction practice
are illustrated in Figure 2; whereas, Figure 3 shows the completed OGFC sections as
recorded in the LADOTD pavement management system (PMS). Brief descriptions of the
selected projects are as follows:
Figure 1 Locations of OGFC test sections
US 71, Grant Parish
This was the first OGFC test section included in this study to assess the improvement in the
existing surface characteristics and traffic safety. The 0.157-mile (from Log mile: 4.041 to
Log mile: 4.198) long test section was located on US 71, 4.041 miles north of the Rapides
Parish line and commences northward. The roadway consists of two 12-ft. travel lanes with

14
two 10-ft. improved hot mix shoulders. Roughly 94.0 tons of OGFC was placed at
approximately 3/4 in. compacted thickness over 5-in. asphaltic mixture and 8-in. Portland
Cement Concrete (PCC) base. The main reason behind selecting this section was to improve
safety due to the growing number of wet weather accidents and fatalities that had occurred
prior to the construction. The OGFC section was completed in one day on June 15, 2003.
I-20, Ouacita Parish
The four-lane interstate test section included in this study is located in West Monroe between
Britton Road and Vancil Road. This project entailed constructing a 1-in. thick OGFC over
10-in. thick asphalt mixture over 10-in. break and seat Jointed Reinforced Concrete pavement
(JRCP). All four lanes and the 4 ft. wide inside shoulder were overlaid. There was
approximately 9,500 tons of OGFC material placed in this 5.6 mile (from log mile: 6.11 to
log mile: 11.66) section of I-20. This project was also selected to improve the existing
surface characteristics and improve safety and was completed in July 2005.
US 61, Ascension Parish
This 5.6-mile long OGFC section was constructed in May 2007 on US 61 located between
LA 42 and LA 74 just south of Baton Rouge (from log mile: 6.47 to log mile: 12.02). The
project consisted of milling 2-in. of original surface, placing a 2-in. thick SMA and a 3/4-in.
thick OGFC. In addition, it had 5-9 in. of asphaltic mixture on top of the 8-in. PCC base.
This project was selected to evaluate the mixture’s ability to resist reflective cracking
predominant in composite pavements. Approximately 10,345 tons of OGFC was placed by
Coastal Bridge Contractors Company.
US 171, Desoto Parish
This project is located south of Shreveport constructed on the south bound lane only between
the Desoto Parish Line and LA 5 (from log mile: 0.00 to log mile: 4.33). The project
consisted of milling 1 in. and placing a 1.25-in. thick OGFC over 10-in. asphaltic concrete
and an 8-in. PCC base. The reason behind choosing this test section was to reduce the
impact of local flooding occurring at low vertical grades. Approximately 4,540 tons of
OGFC was placed on this 4.3 mile divided highway section of US 171. Madden contractors
finished the construction in May 2009.

15
Figure 2 Construction of OGFC
Freshly laid OGFC Milled Surface Construction of OGFC on I-20
OGFC Surface
Construction of OGFC on I-20

16
Figure 3 LADOTD OGFC test sections
US 71
I-20
US 61
US 171

17
Materials and Mixture Design
The OGFC mixtures included in this study were designed following the recommendations
outlined by NCAT [7]. A Superpave gyratory compactor was used with a design gyration
level of 50 during the mixture design process. The contractors were required to use a PG 76-
22m or higher grade asphalt cement. The design asphalt content was a minimum of 6.5
percent with a maximum draindown of 0.3 percent by total mixture weight. Cellulose fibers
or mineral fillers were used with an anticipation of improved draindown of asphalt and better
reinforcement against rutting and cracking. It was further specified that the aggregates,
coarse and fine, should be 100 percent crushed stone or slag from a source listed on the
Qualified Product List (QPL) of LADOTD and also comply with the requirements set forth
in subsections 1003.01, 1003.06, and 1003.06(b) of LADOTD Standard Specifications [31].
Anti-strip additive at a minimum rate of 0.5 percent by the weight of asphalt was added to
prevent stripping. A brief mixture description, volumetrics, and the aggregate gradation blend
of the various OGFC mixtures used in this study in comparison to the current LADOTD
specifications for OGFC mixtures are presented in Table 2. It can be noticed that the percent
voids and the aggregate percent passing No. 8 sieve did not comply with the specifications
for the US 171 project. There might be a contract modification however; the authors failed to
verify the possible reason behind that.
Voids in coarse aggregate for the compacted mix (VCAmix) and the voids in the same coarse
aggregate in a dry-rodded condition (VCAdrc) retained on a No. 4 (4.75-mm) sieve were
measured to check the stone on stone contact in mixtures. As recommended by NCAT, the
VCAdrc was determined by compacting the aggregates with a dry-rod as described in
AASHTO T 19 method [7]. On the other hand, VCAmix was calculated using the following
equation:
100 (1)
where,
Gmb = Bulk Specific Gravity of the compacted mixture,
GCA = Bulk Specific Gravity of the coarse aggregate fraction, and
PCA = Percent coarse aggregate in the total mixture.
The VCAmix values for US 71, I-20, and US 61 projects were found to be less than the
VCAdrc, which satisfies the stone on stone contact requirement (Table 2). To enhance the
bond between OGFC and the underlying layer, LADOTD chose to utilize a spray-paver to
apply the OGFC and tack coat material to the existing surface. Figure 4 provides a graphical
representation of blended aggregate gradations used in this study.

18
Table 2 Mixture description and volumetrics
Mixture Criteria
OGFC Projects LADOTD Specifications US 71 I-20 US 61 US 171
AC Type PG 76-22m PG 76-22m PG 76-22m PG 76-22m PG 76-22m or higher
PG grades
Primary Aggregate
Sandstone Sandstone Siliceous
Limestone Novaculite -
Anti-Strip 0.60 0.60 0.80 0.60 0.50 – 1.2
% Fibers 0.10 0.30 0.30 0.20 % Required from
draindown test
Volumetric
% Voids 19.3 21.7 20.5 16.0 18.0 – 24.0
% Design AC 6.6 6.5 6.5 6.5 6.5
Gmm 2.368 2.391 2.418 2.402 -
Gmb at Ndes 2.173 1.872 1.906 2.019 -
% VCAmix 23.0 38.8 40.4 - -
% VCAdrc 23.7 39.4 41.1 - -
Sieve Sizes Percent Passing
19 mm (¾ in) 100 100 100 100 100
12.5 mm (½ in) 92 93 95 91 85-100
9.5 mm (3/8 in) 64 68 67 65 55-75
4.75 mm (# 4) 16 21 17 25 10-25
2.36 mm (# 8) 8 8 8 14 5-13
1.18 mm (# 16) 6 6 6 9 -
0.6 mm (# 30) 5 6 5 7 -
0.3 mm (# 50) 4 5 5 5 -
0.15mm (# 100) 3.4 4 4 4 -
75 µm (# 200) 2.3 3.5 3 3 2-4

19
Figure 4 Blended aggregate gradations
Laboratory Testing
Permeability, Draindown, Loaded Wheel Tracking (LWT), and Tensile Strength Ratio (TSR)
tests were performed on laboratory-fabricated specimens prepared from plant produced
OGFC mixtures that were used in the different field projects.
Permeability Test
Mixtures with high permeability are believed to have greater interconnected voids. The
permeability test can determine the drainability of OGFC mixtures, an important
characteristic to measure the effectiveness of rapid removal of surface water from roadways
during light to moderate rainstorms. A falling head flexible wall permeameter (Figure 5) was
utilized to perform the permeability test in accordance with ASTM PS 129 test method. The
test was conducted on 6-in. (150-mm) diameter roadway core specimens collected from the
0
10
20
30
40
50
60
70
80
90
100%
Pas
sing
Sieve Sizes
Power Line US 71
I-20 US 61
US 171 Specification LimitsN
o. 2
00
No
. 50
No.
30
No.
16
No.
8
No.
4
3/8
in
1/2
in
3/4
in00.
0
0.07
5
0.30
0
1.18
0.60
0
2.36
4.75
9.50
19.0
12.5

20
aforementioned OGFC projects. A falling-head concept was used to determine the co-
efficient of permeability using the following equation:
(2)
where,
K = Coefficient of permeability (mm/s x 10-4),
L = Average thickness of specimen (mm),
D = Average specimen diameter (mm),
d = Average diameter of graduated cylinder (mm),
T = Total time of the test in seconds,
H1 = Initial height of water (mm), and
H2 = Final height of water (mm).
Figure 5 Falling head flexible wall permeameter
Draindown Test
The draindown phenomenon is described as the separation of asphalt binder or a combination
of binder, fine aggregate, and additives that separates itself from the mixture during
production, storage, and placement. Draindown increases the potential for flushing, rutting,

21
and loss of permeability. As OGFC mixtures possess a coarse aggregate skeleton, the typical
film thickness for these types of mixtures is about 3 to 4 times higher than the conventional
dense-graded mixtures [32]. The combination of uniform grading, low filler, and higher
asphalt film thickness can increase the potential for the binder to drain off the aggregate
particles [33]. Therefore, a draindown test is performed to determine the amount of binder
mastic that may get separated during production and construction. In this study, draindown
tests were conducted on loose OGFC mixes according to AASHTO T 305 test method at a
temperature 15°C higher than the mixing temperatures.
Loaded Wheel Tracker (LWT) Test
A Hamburg type LWT tester, as shown in Figure 6 was used in this study in accordance with
the AASHTO T 324 test method. The test was conducted by rolling a steel wheel across the
surface of the specimen submerged under 50°C water to predict the rutting potential and
moisture susceptibility of OGFC mixtures. The test continues until 20,000 wheel passes or
0.79 in. (20 mm) deformation, whichever is reached first. All LWT specimens were
compacted to 2.4 in. (60 mm) in thickness even though the actual pavement thicknesses were
varied from 0.75 to 1.25 in. The laboratory compactor used for sample preparation was
unable to compact the specimens to match the actual pavement thicknesses.
Figure 6 Loaded wheel tester device

22
Tensile Strength Ratio (TSR) Test
To evaluate the moisture induced damage for OGFC mixtures, TSR tests were conducted as
per the AASHTO T 283 method with an exception of air void content of the samples. Being
OGFC mixtures, air voids for all specimens were within 17.5 to 20.5 percent. In this test, two
sets of 6-in. (150-mm) diameter by 3.5-4.0 in. (90-100 mm) high gyratory compacted
cylindrical samples are tested in conditioned and control conditions. A compressive load is
applied to failure at a deformation rate of 2 in./min (50.8 mm/min) using a compression test
device manufactured by Humbolt (Figure 7). The change in tensile strengths resulting from
the saturation and accelerated moisture conditioning are computed and reported as the tensile
strength ratio (TSR). Mathematically,
%
100
Figure 7 Humbolt TSR device
Air Void Measurement
In the quest for an appropriate test method to determine the density of OGFC mixtures,
LADOTD carried out a round robin testing scheme within its nine district laboratories in

23
addition to the LTRC asphalt laboratory. A CoreLok testing device, as shown in Figure 8 was
implemented to compare AASHTO T 331 test method against the conventional AASHTO T
166 method to measure the bulk specific gravity of compacted asphalt mixture specimens
[34].
Early research has recommended that the conventional AASHTO T 166 test method is not
applicable to compute the density of coarse graded porous mixtures like OGFC, SMA, etc.
[35-37]. The volumetric error is caused by the free-flow of water from the OGFC samples
when determining the saturated surface dry (SSD) weight in the AASHTO T 166 method.
The AASHTO T 331 method employs a vacuum sealing device to seal asphalt samples so
that sample densities can later be measured by the water displacement method. In this study,
an InstroTek CoreLok device was used to seal the samples automatically in specially
formulated puncture resistant polymer bags. By removing all the air from the sample, an
accurate bulk specific gravity can be measured.
Figure 8
CoreLok testing device

24
Field Performance Tests
Pavement Friction Properties
One of the major functional benefits of an OGFC mixture is to improve the pavement friction
that develops at the contact area of the pavement tire and pavement surface. The friction of
the OGFC test sections considered in this study was measured using a Locked Wheel Skid
Tester (LWST) device (Figure 9) according to the ASTM E 274 method. This device tests
the friction properties of a pavement surface under emergency braking condition for a vehicle
without anti-lock brakes. Two types of tires: ribbed and smooth are used in this test method.
The smooth tires are more sensitive to macro-texture, hence chosen in this study. The friction
force was recorded while a LWST vehicle pulled a two-wheel trailer with a smooth-tire
arrangement at 50 mph (80.5 kmph). The coefficient of friction is presented in terms of FN.
Figure 9 Locked wheel skid tester
Since LADOTD does not collect friction data for every single roadway section, friction data
for roadway sections adjacent to the OGFC test sections were not available for comparison

25
with the OGFC test sections. However, based on the data availability, three additional asphalt
sections on I-10, US 190, and US 171 were selected and compared to the friction
performance of I-20, US 61, and US 171 OGFC sections, respectively. These three sections
were chosen because they provided a close comparison to the OGFC test sections. The traffic
conditions and other details of those companion projects are provided with the results in the
corresponding section of this report.
Distress Condition Survey
Every alternate year, LADOTD compiles a comprehensive set of distress data collected by an
automated mobile pavement data collection unit (Figure 10). The data generated by this unit
can be categorized as: measured data and interpreted data. Measured data include IRI,
rutting, faulting that are collected directly. Alternatively, the interpreted data (i.e., fatigue
cracking and patching data) are generated from videos of each pavement section. The
pavement data are collected continuously and reported for every 0.1 mile segment based on a
location reference system consisting of control sections as well as latitude and longitude GPS
coordinates. For most cases, data are collected only for the travel lane of the roadways.
“Visidata,” a software developed by Roadware, Inc. is used for analysis and presentation of
PMS data (Figure 11).
Figure 10 Automated pavement data collection unit
In this study, the evaluation is limited to performance of projects relative to age and not to
factors associated with materials and/or construction. The criteria used to evaluate
performance include International Roughness Index (IRI), rutting, alligator cracking and
random cracking. The IRI was developed by World Bank to characterize a standardized
roughness measurement of the longitudinal profile of a roadway. The IRI is a mathematical
model computed as the ratio of a standard vehicle's accumulated suspension motion (in mm,

26
inches, etc.) divided by the distance traveled by the vehicle during the measurement (km,
mile, etc.).
Figure 11 A screen shot of visidata software
The rut depth data used in this study were collected by two different rut measuring systems.
For years 2000-2003, a three point rut laser known as Smart Rutbar was used. Rutbar uses
ultrasonic transducers spaced at 4 in. (100 mm) across the measuring device to measure the
transverse cross section. To cover a 12-ft. wide lane, up to 37 transducers were used. Since
2004, a laser transverse profiler has been used. This profiler uses a dual synchronized
mounted scanning laser to measure the transverse profile up to 13 ft. in lane width [38]. The
reported rut depth is the average rut depth of left and right wheel path over every 0.1-mile
segment of the roadway.
The fatigue, or alligator, cracking are defined as the longitudinal cracks that are located
within a transverse width of 3 ft. centered at the middle of the wheel path. This type of
cracking is reported only for the flexible pavements and not for the composite ones. Any
other cracks not classified as fatigue or alligator cracks are considered as random cracks.
This includes both longitudinal and transverse cracks.

27
DISCUSSION OF RESULTS
Drainability, smoothness, and splash and spray were considered as functional performance
measures; whereas, rutting, cracking, and tensile strength properties were evaluated for
durability of Louisiana OGFC mixtures. Laboratory test results in conjunction with field
performance were investigated for the overall evaluation process. In addition, accident data
before and after the placement of OGFCs were analyzed to assess the safety benefits.
Laboratory Test Results
Permeability Test Results
The falling head permeability test results are illustrated in Figure 12, where each vertical bar
represents an average permeability result of at least three OGFC samples. It can be seen that
all OGFC mixtures had at least an average permeability of 450 ft/day (137 m/day). In a
previous study, NCAT recommended a minimum permeability value of 328 ft/day (100
m/day) for OGFC mixtures if the mixture is intended to remove the water from pavement
surface [7]. Alvarez et al. suggested a minimum permeability value of 196.85 ft/day (60
m/day) when the mixture is used mainly for noise reduction [1]. Results presented in Figure
12 illustrate that all OGFC mixtures considered in this study exceeded the permeability
requirement set by both above mentioned studies.
Figure 12 Permeability test results
0
200
400
600
800
US 71 I-20 US 61 US 171
Per
mea
bil
ity
(ft/
day
)
NCAT Minimum Permability: 328 ft/day.

28
Draindown Test Results
Results presented in Figure 13 illustrate the draindown results for mixtures considered in this
study. It is anticipated that the coarser the aggregate gradation, the higher the potential of
binder draindown. As expected, the minimum draindown of .04 percent was observed for US
171 mix that had the highest percentage (25 percent) of aggregate passing the No. 4 sieve.
Alternatively, the US 61 mix, which had the second coarser gradation, 17 percent passing
No. 4 sieve showed the maximum draindown of 0.12 percent. Notably, all OGFC mixtures
showed draindown results well below the LADOTD specification requirement of 0.3 percent.
It should also be noted that all mixtures reported contained cellulose fibers by an amount of
0.10 to 0.30 percent of the total aggregate weight. The combination of fibers and SBS
modified PG 76-22m binder possibly improved the resistance to draindown. However, no
direct correlation was observed between the percent draindown and amount of cellulose
fibers added to the mixtures.
Figure 13 Draindown test results
Loaded Wheel Tracking (LWT) Test Results
The LWT rut depths for US 71, US 61, and US 171mixtures are presented in Figure 14. Each
vertical bar in the figure represents the average rut depth of two individual specimens. The
results for I-20 could not be included due to the unavailability of data. It was observed that
after 20,000 wheel passes, laboratory compacted specimens for US 71 and US 61 test
sections experienced 0.13 in. (3.4-mm) and 0.21 in. (5.3-mm) rut depths respectively;
whereas, the US 171 specimen failed, lasting only 5,300 total wheel passes, which is an
indication of stripping . According to the current LADOTD specification for OGFC
0.00
0.05
0.10
0.15
0.20
0.25
0.30
0.35
US 71 I-20 US 61 US 171
Dra
ind
own
(%
)
LADOTD Maximum: 0.3% Draindown

29
mixtures, a maximum rut depth of 0.47 in. (12-mm) after 7,500 passes is acceptable. The rut
depths for three OGFC mixtures after 7,500 wheel passes show that both US 71 and US 61
OGFC test specimens passed the specification requirements convincingly; whereas, US 171
failed to meet it (Figure 14). However, the PMS data for the US 171 section has shown
comparable rut resistance in the field even though the lab fabricated samples failed to pass
LWT specification requirement. In addition, the rut profile of all OGFC mixtures indicated
that there was no stripping issue with any of the mixtures at the end of the test.
Figure 14 LWT test results
Tensile Strength Ratio (TSR) Test Results
Figure 15 shows the average TSRs reported for different OGFC mixtures. Three specimens
were tested per set separately in moisture-conditioned and control conditions. It is evident
that both I-20 and US 61 mixtures obtained average TSR values of 95.1 percent and 90.7
percent, respectively. These values are significantly higher than the minimum LADOTD
specification requirement of 80 percent retained strength after one freeze-thaw cycle.
Alternatively, the mixture from US 171 project failed to meet the existing TSR requirements.
The possible reason behind the failing TSR value is unknown at this time. However,
construction records indicate that the TSR requirement was waived for the US 171 project.
Experience from previous LADOTD projects and other state agencies revealed that the open
aggregate structure of OGFC mixtures does not always allow conditioning specimens as
described in the AASHTO T 283 test method.
0
4
8
12
16
20
US 71 US 61 US 171
Ru
t D
epth
(m
m)
LADOTD Specifications: Maximum Rut Depth = 12 mm

30
Figure 15 TSR test results
Air Void Measurement
The computed air voids utilizing the bulk specific gravity measured from AASHTO T 166
and CoreLok (AASHTO T 331) methods are presented in Figure 16. For the round robin
testing, the OGFC mixture was prepared to obtain an air void content of approximately 18
percent. As seen in Figure 16, no laboratory was able to achieve that result using the
AASHTO T 166 method. A maximum air void of 11.6 percent was obtained by District Lab
03. In contrast, air void results from the CoreLok method were within the range of 17.5 to
18.7 percent, which was very close to the target. It appears while taking a saturated surface
dry (SSD) weight in the AASHTO T 166 method, any water absorbed into the specimen
generally remains there for dense graded mixtures; whereas, the water flows out of the
specimen for OGFC mixtures and leads to an erroneous volume measurement. The outcome
of this round robin testing concurs with the previous studies and consequently, the AASHTO
T 331 test method has been specified instead of the AASHTO T 166 method in the latest
edition of the LADOTD specification for OGFC [35-37]. Detailed data of the round robin
testing scheme are provided in the Appendix.
0
20
40
60
80
100
I-20 US 61 US 171
TS
R (
%)

31
Figure 16 Comparison of air voids
Filed Performance Evaluation
Distress Condition Survey Results
Friction Measurement. The FNs collected from various projects are summarized in
Table 3. It is clearly evident that the OGFC sections always obtained higher FN values than
their corresponding dense-graded counterparts. Impressively, the I-20 OGFC section has a
significantly higher FN value even after 5 years under traffic.
Since the friction performance of the OGFC surfaces is known to be a function of a complex
interaction of both macro-texture and micro-texture, Jackson et al. recommended utilizing the
MPD value in addition to FN [38]. The MPD value represents the macro-texture of the
pavement surface, which largely depends on the aggregate gradation and mixture type rather
than the aggregate type. Surfaces with higher MPD values should provide greater resistance
to sliding, reduce hydroplaning, and help facilitate drainage. Figure 17 presents the current
MPDs collected from I-20, US 61, and US 171 test sections in comparison to the typical
macro-texture depth of 0.06 to 0.12 in. (1.5 to 3.0 mm) for new OGFC overlays as published
in a recent NCHRP study [39]. Results indicate that both US 61 and US 171 sections meet
the NCHRP recommendation; whereas, I-20 result is slightly below the minimum
recommended value (Figure 17). Note that, those typical MPD values are recommended only
for the new overlays. The I-20 and US 61 test sections have been under daily traffic for about
5
10
15
20
25
% A
ir V
oid
s
District Labs
Conventional: AASHTO T166 CoreLok: AASHTO T 331
Target 18.0 % Air Void

32
5 years. Polishing of the aggregate could have led to a decrease in macro-texture for the I-20
pavement section, which may be the possible reason behind the low MPD results. In another
study Kowalski et al., reported a MPD value of 1.4 mm for an OGFC roadway section in
Indiana under traffic for 4 years [3]. This result is similar to values observed at LADOTD’s
I-20 test section.
Table 3 Frictional properties of various roadway sections
Test Section
Mix Type Length (miles)
Year Constructed
Year Tested
Traffic Records FN
Standard Deviation ADT
(year) Percent Truck
OGFC Test Sections
US 71 OGFC Length of this test section was too small to analyze
I-20 OGFC 5.6 2005 2010 38,000
(in 2010) 18 49.8 5.2
US 61 OGFC 5.6 2007 2010 25,500
(in 2010) 13 36.4 0.8
US 171 OGFC 4.3 2009 2010 7,650
(in 2008) 12 41.5 1.9
Non-OGFC Sections
I-10 SMA 3.7 2009 2010 32,341
(in 2009) 17 38.4 3.8
US 190 Superpave 4.7 2008 2010 17,200
(in 2010) 14 31.7 1.9
US 171 Superpave 6.5 2009 2010 9,140
(in 2009) 6 36.5 5.6
In a recent study at LTRC, the MPDs of laboratory made OGFC, SMA, and Superpave
samples were measured using a Circular Texture Meter (CTM) [40]. It was observed that the
OGFC mixture had the highest MPD values followed by SMA and Superpave mixtures. For
a better representation of both micro- and macro-textures, the IFI friction index F(60) was
computed on the basis of the surface friction coefficient measured by a dynamic friction
tester at 20 mph (DF20) and MPD data. It was reported that OGFC and SMA mixtures
performed better than the Superpave mixtures.

33
Figure 17 MPD results
Rut, IRI, and Random Cracking. Figure 18 illustrates performance of the four
OGFC test sections on the basis of PMS rutting, IRI, and random cracking data. To compare
the performance, data associated with early Louisiana Superpave roadways (five Interstates:
15,000–60,000 ADT and four US routes: 8,000–25,000 ADT, constructed in the late 1990s),
which have already been reported in a previous study, were also included in the analyses
[41]. It should be noted that the construction, acceptance, and survey date for the OGFC
projects and their Superpave counterparts were different. However, the performance indices
are plotted in relation to the age of the pavement to offset this issue. The reported overall
values of the performance-criteria for individual projects (Figure 18) are the average values
of each 0.1-mile section within the project limits.
Based on the data presented, the overall rutting performance for the US 71, US 61, and US
171 OGFC sections is considerably better than the Superpave US routes. The I-20 OGFC
section exceeded the rut depth trends for interstate Superpaves. However, after 4 years under
traffic, the rut depth of this section was only 0.15 in., which looks very encouraging.
Interestingly, US 171 has shown good rutting performance in the field (0.12 in.) even though
the lab fabricated sample for this project did not meet the LWT rut depth requirement.
0.0
0.5
1.0
1.5
2.0
2.5
3.0
3.5
I-20 US 61 US 171
MP
D (
mm
)
Typical MPD range reported in NCHRP Report

34
Figure 18 Performance based on PMS data
0.00
0.10
0.20
0.30
0.40
0.50
0.0 2.0 4.0 6.0 8.0 10.0
Ru
t D
epth
(in
ch)
Time (Year)
I-20 OGFC US 71 OGFC
US 61 OGFC US 171 OGFC
Interstate Trend US Route Trend
25
50
75
100
125
150
175
0.0 2.0 4.0 6.0 8.0 10.0
IRI
(in
ch/m
ile)
Time (Year)
I-20 OGFC US 71 OGFC
US 61 OGFC US 171 OGFC
Interstate Trend US Route Trend
0
250
500
750
1000
1250
1500
0.0 2.0 4.0 6.0 8.0 10.0
Cra
ck (
ft/m
ile)
Time (Year)
I-20 OGFC US 71 OGFC
US 61 OGFC US 171 OGFC
Interstate Trend US Route Trend

35
The IRI for the OGFC sections illustrated in Figure 18 is very comparable to the Superpave
trends. Interestingly all roadway sections except US 171 met the LADOTD’s IRI
requirement of 75 inch/mile for 103 percent bonus pay. The US 171 had an IRI value of 83
inch/mile, which is below the LADOTD requirement for maximum allowable IRI of 85
inch/mile for 100 percent payment for new construction and overlays. It should be noted that
the pre-construction data indicated that US 171 section had a high IRI (154 inch/mile) record
before construction. The 1.25-in. OGFC overlay was not enough to bring the IRI down below
limit of 75 inch/mile yet there was about 46 percent improvement in smoothness after the
OGFC overlay.
The cracking data presented in Figure 18 represent a combination of longitudinal and
transverse cracks. In general, the amount of cracks for US 71, US 61 and I-20 OGFC sections
is lower than general Superpave pavements for the U.S. routes. However, the crack resistance
performance for I-20 OGFC section was slightly below the Superpave placed on interstates.
All OGFC sections considered here consisted of a 0.75 to 1.25 in. overlay over an existing
surface. On the other hand, the Superpave sections have at least 2 in. or thicker wearing
course over the existing surface. The pre-construction PMS data indicate that most of the
OGFC sections before overlay were in poor condition with considerable amount of rutting.
Considering these conditions, the OGFC mixes are found to be performing comparable if not
better than conventional Superpave mixes. The slightly higher asphalt content and the
presence of coarse material in a larger quantity might have enhanced the overall performance
of OGFC sections.
Reflective Crack Measures
A good quality and well-bonded OGFC mixture can also show better cracking performance.
A comparative study was performed only on projects within close proximity with US 61 to
normalize traffic patterns in order to identify the most effective treatment in controlling
reflective cracking on composite pavements. For comparison, three 3.5-in. thick Superpave
overlay sections were constructed with roadway reinforcing mesh (fiber-glass grid). Those
sections consisted of 2-in. Superpave, glass grid, and 1.5-in. Superpave surface mixture. The
traffic counts were 30,600, 31,200, 25,700 on roadway reinforced sections and 25,500 on the
OGFC section respectively. All of these sections experienced the same climatic conditions.
The PMS data was used to quantify the performances of these sections using a
comprehensive Pavement Condition Index (PCI). All the fiber-glass grid sections showed
deterioration in the value of PCI after 3 years of service; whereas, the project with OGFC
showed no drop in PCI even after 4 years of service (Table 4). Based on the PCI drop, the
predicted service lives for the sections with fiber-glass grid were 11, 17, and 8 years
respectively. Since there is no performance drop for the OGFC section, the model predicted

36
an infinite service life, which is not practical. However, by observing the performance index
it can be concluded that the section with OGFC outperformed the other sections with fiber-
glass grid reinforcement.
Table 4 PCI and predicted service life
Route/ Location
Treatment Type Predicted
Service life (years)
PCI @ Years from Construction
0 2 4 5 7
US 61 – I Fiber-Glass Grid 11 97 95 92 - -
US 61 – II Fiber-Glass Grid 17 - 94 - 90 87
US 61 – III Fiber-Glass Grid 8 92 90 - 81 73
US 61 – IV OGFC No
deterioration 100 100 100 100 -
Accident Reduction
To investigate whether OGFC pavements reduce the occurrence of accidents, especially in
wet weather conditions, comparisons were made between accident data on the same roadway
section before and after placement of the OGFC mixture (Table 5). Except for the US 171
project, five years pre-construction and post-construction accident data from the Louisiana
police report were collected and analyzed to evaluate the traffic safety benefits of OGFCs.
The construction of the US 171 section was completed in May 2009; hence, five years post-
construction data are yet to be generated and consequently only two years post-construction
data were utilized.
The data reflected significant reductions both in fatalities and total accidents regardless of the
weather condition for US 71, I-20 corridors. Interestingly, the reduction was the greatest
when the wet weather condition was considered. On average, the OGFC on I-20 test section
reduced total wet weather accidents by 76 percent over a five-year span and eliminated all
fatalities during that period. On the other hand, there was a complete elimination of any type
of wet weather accidents and fatalities on US 71 test section for the same duration. Also a 57
percent reduction in total accidents during wet weather condition was noticed for US 171
section. More importantly, no fatality was reported since the construction of that project.
Unlike the aforementioned three projects, an increase in accident rate was observed for US
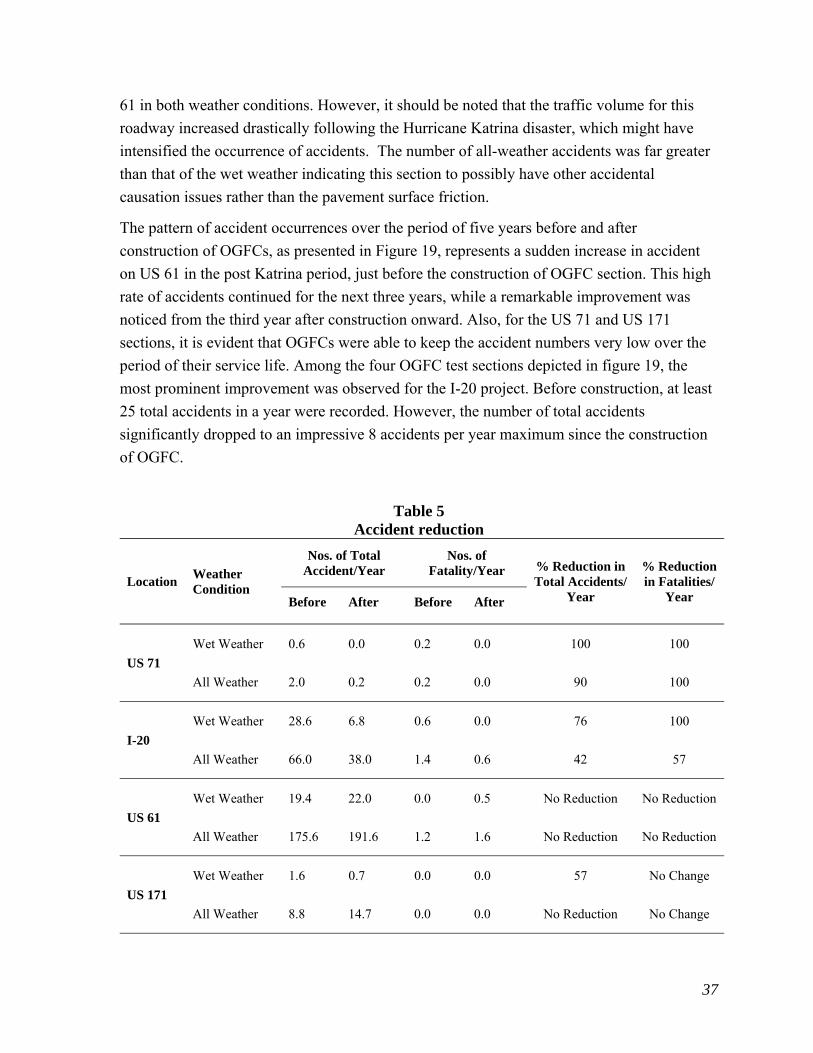
37
61 in both weather conditions. However, it should be noted that the traffic volume for this
roadway increased drastically following the Hurricane Katrina disaster, which might have
intensified the occurrence of accidents. The number of all-weather accidents was far greater
than that of the wet weather indicating this section to possibly have other accidental
causation issues rather than the pavement surface friction.
The pattern of accident occurrences over the period of five years before and after
construction of OGFCs, as presented in Figure 19, represents a sudden increase in accident
on US 61 in the post Katrina period, just before the construction of OGFC section. This high
rate of accidents continued for the next three years, while a remarkable improvement was
noticed from the third year after construction onward. Also, for the US 71 and US 171
sections, it is evident that OGFCs were able to keep the accident numbers very low over the
period of their service life. Among the four OGFC test sections depicted in figure 19, the
most prominent improvement was observed for the I-20 project. Before construction, at least
25 total accidents in a year were recorded. However, the number of total accidents
significantly dropped to an impressive 8 accidents per year maximum since the construction
of OGFC.
Table 5 Accident reduction
Location Weather Condition
Nos. of Total Accident/Year
Nos. of Fatality/Year % Reduction in
Total Accidents/ Year
% Reduction in Fatalities/
Year Before After Before After
US 71
Wet Weather 0.6 0.0 0.2 0.0 100 100
All Weather 2.0 0.2 0.2 0.0 90 100
I-20
Wet Weather 28.6 6.8 0.6 0.0 76 100
All Weather 66.0 38.0 1.4 0.6 42 57
US 61
Wet Weather 19.4 22.0 0.0 0.5 No Reduction No Reduction
All Weather 175.6 191.6 1.2 1.6 No Reduction No Reduction
US 171
Wet Weather 1.6 0.7 0.0 0.0 57 No Change
All Weather 8.8 14.7 0.0 0.0 No Reduction No Change

38
Figure 19 Pattern of accident occurrences
Splash and Spray of Rainwater
Splash and spray of rainwater can be an indicator of drainage capacity in the field. Quantified
measurements for splash and spray were not performed in this study. However, the visual
observations during rainstorm events indicated that the splash and spray in the OGFC
sections were considerably less than the adjacent regular Superpave pavement sections.
Figure 19 compares the splash and spray conditions on two adjacent I-20 sections
constructed with Superpave WC and OGFC mixtures, respectively. It clearly shows that the
OGFC section has almost no splash and spray. However, the improvement was more
significant in the presence of heavy vehicles such as tractor/ trailers. Due to the climatic
condition, the southern part of Louisiana usually experiences plenty of rainfalls. The
reduction in splash and spray may greatly enhance driving conditions during the rainy
season.
0
5
10
15
20
25
30
35
40
No.
of
Tot
al A
ccid
ents
Axis Title
Wet Weather Accidents
US 71 I-20 US 61 US 171
After OGFCBefore OGFC
1stY
r
2nd
Yr
3rdY
r
4thY
r
5thY
r
1stY
r
2nd
Yr
3rdY
r
4thY
r
5thY
r

39
Figure 20 Splash and spray comparison: (a) typical superpave (b) OGFC
Cost Comparisons
In general, OGFC mixtures are more expensive per ton when compared to regular Superpave
mixtures. However, the lower unit weight of OGFC partially offsets its higher costs. In
addition, the roadway safety benefits provided by OGFC are hard to ignore and cannot be
(a) Typical Superpave
(b) OGFC

40
measured in a monetary value. A comparative materials cost analysis was conducted on four
adjacent US 61 projects which included the project considered in this study. These four
roadway sections were constructed in an effort to mitigate reflective cracking and maximize
pavement performance. The OGFC section in combination with the SMA was compared to
Superpave sections that included Fiber-Glass Grids. Only the costs of HMA mixtures placed
in binder and wearing courses and the cost of glass-grid reinforcing mesh were considered.
Table 6 presents summarized costs per sq. yards for the four projects mentioned previously.
The data appear to indicate that the materials cost for OGFC and SMA section per sq. yard
was at least $1.98 lower than the companion glass-grid sections. This is almost a 14 percent
savings from the cost associated with the asphalt materials used. Also, as mentioned in a
previous section of this report, the OGFC section showed a prolonged service life in
comparison to glass-grid sections. This indicates a lower life cycle costs for OGFC in
comparison to the companion glass-grid sections.
Table 6 Cost comparison of OGFC and glass-grid sections
Route/ Location
Treatment Type Pavement Structure
Total Cost/ Sq.yd
US 61–I S.P.# 007-08-0030
Fiber-Glass Grid 2” Superpave BC,
1.5-in. Superpave WC, and Glass Grid
$15.17
US 61–II S.P.# 013-04-0036
Fiber-Glass Grid 2” Superpave BC,
1.5” Superpave WC, and Glass-grid
$14.67
US 61–III S.P.# 019-01-0031
Fiber-Glass Grid 2” Superpave BC,
1.5” Superpave WC, and Glass-grid
$14.41
US 61–IV S.P.# 019-01-0031
OGFC 2” SMA and 0.75” OGFC
$12.43

41
CONCLUSIONS
Based upon the experience obtained from the laboratory and field phases of this study, it can
be concluded that Louisiana OGFC mixtures are capable of delivering impressive
performance as well as providing a safe traveling surface. The following findings and
conclusions are shown based on the outcome of the study:
Test sections across the state paved with OGFC have proven to save lives.
Accident data analyses indicated that OGFC mixtures significantly improved the
wet weather accident rate for all test sections except US 61. An increase in the
traffic volume in the post hurricane Katrina period might have intensified the rate
of accidents on US 61 corridor. However, I-20 data indicated a 76 percent
reduction in wet weather accidents and a 100 percent reduction in fatalities.
The pavement design guide for LADOTD has been changed to require OGFCs for
new overlay sections of all Interstate highway surfaces and for any surface being
corrected for safety reason whenever a thin lift asphaltic concrete is constructed.
According to current LADOTD specifications, OGFCs are allowed for any traffic
level and can be substituted for other thin lift asphaltic concrete applications.
OGFC pavements always showed better friction properties than their Superpave
counterparts. Additionally, OGFC mixtures were able to show very good macro-
texture in terms of MPD results.
Five year pavement distress data indicate that the performance and projected life
of OGFC sections are comparable to the typical Superpave sections.
The OGFC-SMA combination provided a superior reflective crack relief section
for composite pavements. In comparison to the companion glass-grid sections, the
OGFC was found to save 14 percent of the materials costs.
The material and mixture design guidelines provided in the latest version of
LADOTD specifications for OGFC mixtures seem to work very well with
reasonable permeability, draindown, LWT, and TSR tests.
The CoreLok (AASHTO T 331) appeared to be the more accurate method for
determining bulk specific gravity and air voids of a compacted OGFC specimen.
This test has been added to the latest version of LADOTD specifications as the
required method to measure the air voids of OGFC specimen.


43
RECOMMENDATIONS
Based on the outcome of this study, the authors highly recommend the implementation of
OGFCs for any roadway surface having wet weather safety concern. In addition, it is
recommended that all new construction on Interstate roadways in urban areas have an OGFC
placed as the final lift.
LADOTD OGFC specifications should require a maximum of 0.472-in. (12-mm) rut depth
after 7500 passes in the LWT test. For interstate and high volume traffic areas, the mixture
shall be placed using the Spray Paver device, using a polymer based emulsion for the tack
coat. The use of the CoreLok device should be included in the specification for determining
air voids.
The authors recommend that LTRC continuously monitor all future OGFC projects, analyze
their LWT rut data, and provide further feedback to designers and provide recommendations
(if needed) for future LADOTD specifications.


45
ACRONYMS, ABBREVIATIONS, AND SYMBOLS
AASHTO American Association of State Highway and Transportation
Officials
HMA Hot Mix Asphalt
OGFC Open Graded Friction Course
FHWA Federal Highway Administration
DOT Department of Transportation
LADOTD Louisiana Department of Transportation and Development
LTRC Louisiana Transportation Research Center
NCHRP National Cooperative Highway Research Program
LWT Loaded Wheel Tester
TSR Tensile Strength Ratio
PMS Pavement Management System
IRI International Roughness Index
FN Friction Number
MPD Mean Profile Depth
lb. Pound(s)
m Meter(s)
cm Centimeter(s)
ft. Foot (feet)
in. Inch(es)
mph Miles per hour
kmph Kilometer per hour
PFC Permeable Friction Course
PA Porous Asphalt
MTV Material Transfer Vehicle
SSD Saturated Surface Dry
DGA Dense-graded Asphalt
CTM Circular Texture Meter
SMA Stone Matrix Asphalt
PCI Pavement Condition Index
PCC Portland Cement Concrete
JRCP Jointed Reinforced Concrete Pavement
LWST Locked Wheel Skid Tester


47
REFERENCES
1. Alvarez, A.E., Martin, A.E., Estakhri, C.K., Button, J.W., Glover, C.J., and Jung,
S.H. “Synthesis of Current Practice on the Design, Construction, and Maintenance of
Porous Friction Courses,” Report No. FHWA/TX-06/0-5262-1, Texas Transportation
Institute, Texas, July 2006.
2. Hanson, D.I. and James, R.S. “Colorado DOT Tire/Pavement Noise Study,” Report
No. CDOT-DTD-R-2004-5, National Center for Asphalt Technology, Alabama,
2004.
3. Kowalski, K.J., McDaniel, R.S., Shah, A., and Olek, J. “Long-Term Monitoring of
Noise and Frictional Properties of Three Pavements Dense-Graded Asphalt, Stone
Matrix Asphalt, and Porous Friction Course,” Transportation Research Record:
Journal of the Transportation Research Board, No. 2127, Washington, D.C., 2009,
pp 12-19.
4. Pierce, L.M., Mahoney, J.P., Muench, S., Munden, H.J., Waters, M., and Uhlmeyer,
J. “Quieter Hot-Mix Asphalt Pavements in Washington State,” Transportation
Research Record: Journal of the Transportation Research Board, No. 2095,
Washington, D.C., 2009, pp 84-92.
5. Trevino, M. and Dossey. T. “Noise Measurements of Highway Pavements in Texas,”
Report No. FHWA/TX-10/0-5185-3, Center for Transportation Research, University
of Texas at Austin, 2009.
6. Cooley, Jr., L.A., Brumfield, J.W., Mallick, R.B., Mogawer, W.S., Partl, M.,
Poulikakos, L., and Hicks, G. “Construction and Maintenance Practices for
Permeable Friction Courses,” NCHRP Report No. 640, Transportation Research
Board of the National Academies, Washington, D.C., 2009.
7. Mallick, R.B., Kandhal, P.S., Cooley, Jr., L.A., and Watson, D.E. “Design,
Construction, and Performance of New-Generation Open-Graded Friction Courses,”
NCAT Report 200-1, National Center for Asphalt Technology, Alabama, 2000.
8. Halstead, W.J. “Open-Graded Friction Courses for Highwasy,” NCHRP Synthesis 49,
Transportation Research Board of the National Academies, Washington, D.C., 1978.
9. Kandhal, P.S. and Mallick, R.B. “Open-Graded Friction Course: State of the
Practice,” Transportation Research Circular, No. E-C005, Transportation Research
Board, Washington, D.C., December, 1998.

48
10. Kline, L., Putman, B. “Comparison of Open-Graded Friction Course Mix Design
Procedures in the United States,” Paper No. 11-3747, Transportation Research Board
90th Annual Meeting Compendium of Papers CD-ROM, Washington, D.C., 2011.
11. Liu, K., A.E. Alvarez, A.E., Martin, A.E., Dossey, T., Smit, A., and Estakhri, C.K.
“Synthesis of Current Research on Permeable Friction Courses: Performance, Design,
Construction, and Maintenance,” Report No. FHWA/TX-10/0-5836-1, Texas
Transportation Institute, Texas, February 2010.
12. Huber, G. “Performance Survey on Open-Graded Friction Course Mixes,” NCHRP
Synthesis 284, Transportation Research Board of the National Academies,
Washington, D.C., 2000.
13. Kandahl, P.S. “How Asphalt Pavement Mitigate Tire-Pavement Noise. Better Roads,”
Vol. 73, No. 11, 2003, pp 16-22.
14. Herman, L.A. and Ambroziak, M.J. “Effects of Pavement Type on Traffic Noise
Levels,” Report No. FHWA/OH-99/012, Ohio Research Institute for Transportation
and the Environment, Athens, March 1999.
15. Bennert, T., Fee, F., Sheehy, E., Jumikis, A., and Sauber, R. “Comparison of Thin-
Lift Hot-Mix Asphalt Surface Course Mixes in New Jersey,” Transportation
Research Record: Journal of the Transportation Research Board, No. 1929,
Washington, D.C., 2005, pp 59-68.
16. Nilsson, R., Norlander, J., and Sliwa, N. “Design Guidelines for Durable, Noise-
Reducing Pavements. Sustainable Road Surfaces for Traffic Noise Control
(SILVIA),” Report No. SILVIA-SKANSKA-018-01-WP4-231105, European
Commission, 2005. (URL:
http://www.trl.co.uk/silvia/Silvia/pdf/Main_Outputs/SILVIA-SKANSKA-018-01-
WP4-231105.pdf).
17. Raaberg, J., Schmidt, B. and Bendtsen, H. “Technical Performance and Long-Term
Noise Reduction of Porous Asphalt Pavements,” Road Directorate, Danish Road
Institute, Copenhagen, Denmark, 2001.
18. Larson, R.M., Hoerner, T.E., Smith, K.D., and Wolters, A.S. “Relationship Between
Skid Resistance Numbers Measured with Ribbed and Smooth Tire and Wet-Accident
Locations,” Report No. FHWA/OH-2008/11, Ohio Department of Transportation,
Ohio, 2008.

49
19. Roque, R., Koh, C., Chen, Y., Sun, X., and Lopp, G. “Introduction of Fracture
Resistance to the Design and Evaluation of Open Graded Friction Courses in
Florida,” UF Project No. 00054539, Florida, July 2009.
20. Wang, H. and Flintsch, G.W. “Investigation of Short and Long-Term Variations of
Pavement Surface Characteristics at the Virginia Smart Road,” Paper No. 07-2753,
Transportation Research Board Annual Meeting Compendium of Papers CD-ROM,
Washington, D.C., 2007.
21. Huddleston, I.J., Zhou, H., and Hicks, R.G. “Evaluation of Open-Graded Asphalt
Concrete Mixtures Used in Oregon,” Transportation Research Record: Journal of the
Transportation Research Board, No. 1427, Washington, D.C., 1993, pp 5-12.
22. Moore, L.M., Hicks, R.G., and Rogge, D.F. “Design, Construction, and Maintenance
Guidelines for Porous Asphalt Pavements,” Transportation Research Record:
Journal of the Transportation Research Board, No. 1778, Washington, D.C., 2001,
pp 91-99.
23. McDaniel, R.S., Thornton, W.D., and Dominguez, J.G. “Field Evaluation of Porous
Asphalt Pavement,” Report No. SQDH 2004-3, North Central Superpave Center,
Indiana, May 2004.
24. Laxdal, J., Oliver, M., and Bishop, M. “Long Term Pavement Performance of an
Aging Open Graded Friction Course Asphalt Surface,” Proceedings of the 54th
Annual Conference of the Canadian Technical Asphalt Association (CTAA),
Moncton, November, 2009, pp 295-322.
25. Nicholls, J.C. “Review of UK Porous Asphalt Trials,” TRL Report 264, UK, 1997.
26. McGhee, K., Clark, T.M., and Hemp, C.C. “A Functionally Optimized Hot-Mix
Asphalt Wearing Course: Part I: Preliminary Results,” Report No. VTRC 09-R20,
Virginia Transportation Research Council, Virginia, April 2009.
27. Alvarez, A.E., Martin, A.E., and Estakhri, C. “Optimizing the Design of Permeable
Friction Course Mixtures,” Transportation Research Record: Journal of the
Transportation Research Board, No. 2209, Washington, D.C., 2011, pp 26-33.
28. Muench, S.T., Weiland, C., Hatfield, J., and Wallace, L.K. “Open-Graded Wearing
Courses in the Pacific Northwest,” Report No. FHWA-OR-RD-17, Oregon
Department of Transportation, Oregon, June 2011.
29. Estakhri, C.K., Alvarez, A.E., and Matrin, A.E. “Guidelines on Construction, and
Maintenance of Porous Friction Courses in Texas,” Report No. FHWA/TX-08/0-
5262-2, Texas Transportation Institute, Texas, February 2008.

50
30. Root, R.E. “Investigation of the Use of Open Graded Friction Courses in Wisconsin,”
Report No. WHRP 09-01, Wisconsin Department of Transportation, Madison,
Wisconsin, March 2009.
31. Louisiana Department of Transportation and Development. Louisiana Standard
Specifications for Roads and Bridges. Baton Rouge, Louisiana, 2006.
32. Watson, D., Johnson, A., and Jared, D. “Georgia Department of Transportation’s
Progress in Open-Graded Friction Course Development,” Transportation Research
Record: Journal of the Transportation Research Board, No. 1616, Washington, D.C.,
1998, pp 30-33.
33. Watson, D.E., Cooley Jr., L.A., Moore, K.A., and Williams, K. “Laboratory
Performance Testing of Open-Graded Friction Course Mixtures,” Transportation
Research Record: Journal of the Transportation Research Board, No. 1891,
Washington, D.C., 2004, pp 40-47.
34. King, Jr., W.B., Kabir, M., and Mohammad, L.N. “Implementation of Testing
Equipment for Asphalt Materials,” Report No FHWA/LA-09/458, Louisiana
Transportation Research Center, Louisiana, 2009.
35. Buchanan, M.S. and White, T.D. “Hot Mix Asphalt Mix Design Evaluation Using the
Corelok Vacuum-Sealing Device,” Journal of Materials in Civil Engineering, Vol.
17, No. 2, April 2005, pp 137-142.
36. Williams, S.G. “Bulk Specific Gravity Measurements of 25.0-mm and 37.5-mm
Coarse-Graded Superpave Mixes,” Transportation Research Record: Journal of the
Transportation Research Board, No. 2001, Washington, D.C., 2007, pp 110-117.
37. Huddleston, I.J., Zhou, H., and Hicks, R.G. “Evaluation of Open-Graded Asphalt
Concrete Mixtures Used in Oregon,” Transportation Research Record: Journal of the
Transportation Research Board, No. 1427, Washington, D.C., 1993, pp 5-12.
38. Jackson, N.M., Choubane, B., and Holzschuher, C. “Practical Approach to Measuring
and Reporting Friction and Macrotexture at Variable Test Speeds,” Transportation
Research Record: Journal of the Transportation Research Board, No. 2094,
Washington, D.C., 2009, pp 103-111.
39. Hall, J.W., Smith, K.L., Titus-Glover, L., Wambold, J.C., Yager, T.J., and Rado, Z.
“NCHRP Web-Only Document 108: Guide for Pavement Friction,” NCHRP Project
01-43, Transportation Research Board of the National Academies, Washington, D.C.,
2009.

51
40. Wu, Z. and King, W. “Development of Surface Friction Guidelines for LADOTD,”
LTRC Project No 09-2B, Louisiana Transportation Research Center, Louisiana, 2011.
41. Kabir, M.S., Icenogle, P., King, W., and Abadie, C. “Performance of Superpave
Projects in Louisiana,” Transportation Research Record: Journal of the
Transportation Research Board, No. 2207, Washington, D.C., 2011, pp 16-24.


53
APPENDIX
Table 7
Bulk specific gravity and air void data
District
Labs
Bulk Specific Gravity (Gmb) Maximum Specific
Gravity (Gmm)
Air Voids (%) Sample 1 Sample 2 Sample 3 Average
AASHTO T 166 Method
D 02 2.125 2.194 2.183 2.167 2.426 10.66
D 03 2.127 2.154 2.152 2.144 2.426 11.61
D 04 - 2.174 2.178 2.176 2.426 10.31
D 05 2.141 2.175 2.161 2.159 2.426 11.01
D 07 2.149 2.173 2.160 2.161 2.426 10.94
D 08 2.146 2.171 2.171 2.163 2.426 10.85
D 58 2.157 2.177 2.167 2.167 2.426 10.68
D 61 2.149 2.172 2.172 2.164 2.426 10.79
D 62 2.158 2.183 2.180 2.174 2.426 10.40
LTRC 2.174 2.158 2.163 2.165 2.426 10.76
CoreLok Method
D 02 1.961 1.987 2.008 1.985 2.426 18.16
D 03 1.959 1.987 1.975 1.974 2.426 18.65
D 04 1.972 1.994 2.033 2.000 2.426 17.57
D 05 1.956 - 2.015 1.986 2.426 18.16
D 07 1.979 1.983 2.016 1.993 2.426 17.86
D 08 1.962 1.987 2.016 1.988 2.426 18.04
D 58 1.958 1.986 2.006 1.983 2.426 18.25
D 61 1.968 1.990 2.013 1.990 2.426 17.96
D 62 1.976 1.993 2.018 1.996 2.426 17.73
LTRC 1.998 2.024 1.986 2.003 2.426 17.45

54
Louisiana superpave performance models used in this study:
Interstate Rut Trend Line: 0.0022 0.1095
Interstate IRI Trend Line: 0.7813 54.619
Interstate Crack Trend Line: 15.31 31.747
US Route Rut Trend Line: 0.0096 0.1209
US Route IRI Trend Line: 3.3107 56.934
US Route Crack Trend Line: 109.71 32.09