Technical Report - flyquietoak.com Reyes Aircraft Noise... · Davis 870 consisted of event time,...
15
Aircraft Noise Abatement Office Technical Report Aircraft Overflight and Noise Analysis at Mt. Vision Road Point Reyes National Seashore, California August 2000 Prepared by: Eugene M. Reindel Robert D. Behr HARRIS MILLER MILLER & HANSON INC. 945 University Avenue, Suite 201 Sacramento, California 95825 (916) 568-1116
Transcript of Technical Report - flyquietoak.com Reyes Aircraft Noise... · Davis 870 consisted of event time,...

Aircraft Noise Abatement Office
Technical Report
Aircraft Overflight and Noise Analysis
at
Mt. Vision Road Point Reyes National Seashore, California
August 2000
Prepared by:
Eugene M. Reindel Robert D. Behr
HARRIS MILLER MILLER & HANSON INC.
945 University Avenue, Suite 201 Sacramento, California 95825
(916) 568-1116

San Francisco International Airport Aircraft Overflight and Noise Analysis – Point Reyes
Harris Miller Miller & Hanson Inc
Page 1
August 2000
January 3, 2001 This preface clarifies the calculation procedures used by Harris Miller Miller & Hanson Inc. (HMMH) when determining aircraft-only Community Noise Equivalent Level (CNEL) and community-only CNEL such that their sum is the total daily CNEL, as measured. HMMH generally reports CNEL values in whole numbers due to the inability to know the values to any higher degree of certainty. When conducting noise measurements, the noise monitors used by HMMH record the noise levels and calculate the total daily CNEL value to the nearest tenth (one decimal place). During analysis this measured degree of accuracy is maintained for our calculations until we report the final values. When adding CNEL values logarithmically, HMMH uses the values to the nearest tenth, calculates the sum, and then rounds to the nearest whole number using standard rounding procedures for the final reported CNEL values. This may cause some confusion when looking at a table and trying to add the rounded numbers to give the resultant sum. For example, logarithmically adding rounded numbers 37 and 52 results in a sum of 52. However, the CNEL table of values may show the sum to be 53. This is the result of logarithmically adding the numbers before rounding (36.9 and 52.4) resulting in a sum of 52.5 which rounds to 53. Therefore, in cases where a value before rounding is near the rounding point ( .5 ), there may be a difference (1 dB) in the sum using rounded numbers versus the numbers to the nearest tenth.

San Francisco International Airport Aircraft Overflight and Noise Analysis – Point Reyes
Harris Miller Miller & Hanson Inc
Page 2
August 2000
INTRODUCTION Harris Miller Miller & Hanson Inc., in cooperation with San Francisco International Airport’s (SFO) Aircraft Noise Abatement Office, performed a noise monitoring survey at Mt Vision Road, Point Reyes National Seashore, CA from 6 June 2000 through 23 June 2000. On-site observations were conducted on Tuesday, 6 June 2000. Figure 1 shows the general location of the monitoring site in relation to SFO. 2. SUMMARY During the survey, a daily average of approximately 105 aircraft flew within a 2-mile hemispherical radius of the monitoring site as evidenced by actual radar data accumulated at SFO. The majority of these flights were arrivals to SFO on Runways 28L and 28R and to San Jose International Airport (SJC) on Runways 30L and 30R. Our analysis correlated the aircraft flights to the noise events collected by the noise monitors. The calculated aircraft Community Noise Equivalent Levels (CNEL) ranged from 27 dB to 39 dB which were 3 dB to 22 dB below the corresponding community CNEL. These results are consistent with aircraft noise levels at locations far removed from the airport environs; i.e., aircraft noise events are noticeable and detectable, but are not substantially contributing to the total CNEL. The community CNEL was higher than anticipated due most likely to the prevailing windy conditions at the site. 3. BACKGROUND 3.1 Aircraft Noise Terminology/Metrics Appendix A defines the aircraft noise terminology used in this report. 3.2 Instrumentation Set-up A Larson-Davis Type 870 Noise Monitor measured the noise environment. A Bruel & Kjaer microphone and Larson-Davis microphone pre-amp were placed on a 5-foot tripod and were connected to the monitor with the use of a microphone cable. The monitor was locked in “run-mode” and secured in a locked box. The monitor was powered by batteries that were replaced as needed. The data were downloaded at various intervals. For each recorded event, the data collected by the Larson-Davis 870 consisted of event time, duration, Lmax, and calculated SEL. 3.3 Measurement Site Description This site was approximately 43 miles from SFO and was located in the forest near a residence at an altitude of approximately 1000 feet above mean sea level (MSL). The community noise levels at this site were influenced by several factors including activities at the residence, wildlife (primarily birds), and the wind passing through the trees. Prior to taking measurements the monitor was calibrated and, through observation, an ambient or background noise level of 38 dB - 42 dB was determined; therefore, the exceedance or threshold level on the noise monitor was set to 47 dB. The minimum noise duration was set at five seconds. That is, for a noise event to be recorded, it had to exceed the established threshold of 47 dB for at least 5 seconds. The monitor stored the total CNEL value for each 24-hour day (midnight to midnight) during the monitoring period from 6 June 2000 through 23 June 2000.

San Francisco International Airport Aircraft Overflight and Noise Analysis – Point Reyes
Harris Miller Miller & Hanson Inc
Page 3
August 2000
Figure 1. Location of Monitoring Site
San Francisco International Airport Aircraft Overflight and Noise Analysis – Point Reyes
Harris Miller Miller & Hanson Inc
Page 4
August 2000
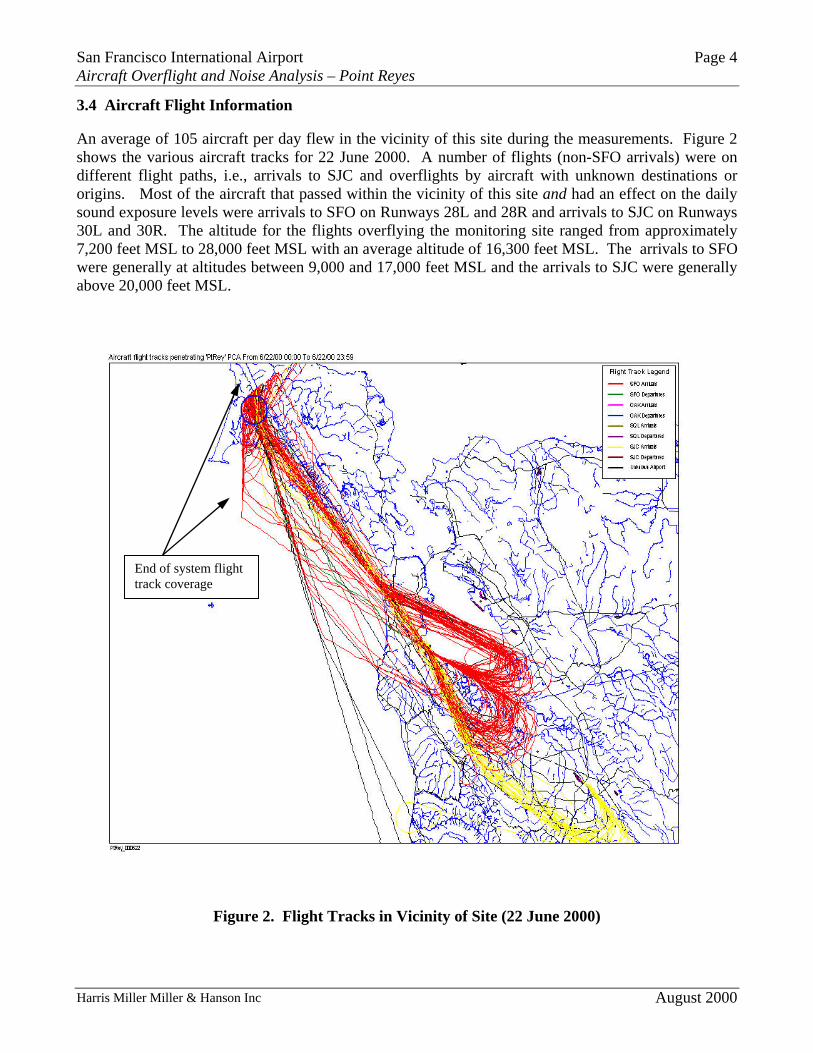
3.4 Aircraft Flight Information An average of 105 aircraft per day flew in the vicinity of this site during the measurements. Figure 2 shows the various aircraft tracks for 22 June 2000. A number of flights (non-SFO arrivals) were on different flight paths, i.e., arrivals to SJC and overflights by aircraft with unknown destinations or origins. Most of the aircraft that passed within the vicinity of this site and had an effect on the daily sound exposure levels were arrivals to SFO on Runways 28L and 28R and arrivals to SJC on Runways 30L and 30R. The altitude for the flights overflying the monitoring site ranged from approximately 7,200 feet MSL to 28,000 feet MSL with an average altitude of 16,300 feet MSL. The arrivals to SFO were generally at altitudes between 9,000 and 17,000 feet MSL and the arrivals to SJC were generally above 20,000 feet MSL.
End of system flight track coverage
Figure 2. Flight Tracks in Vicinity of Site (22 June 2000)
San Francisco International Airport Aircraft Overflight and Noise Analysis – Point Reyes
Harris Miller Miller & Hanson Inc
Page 5
August 2000
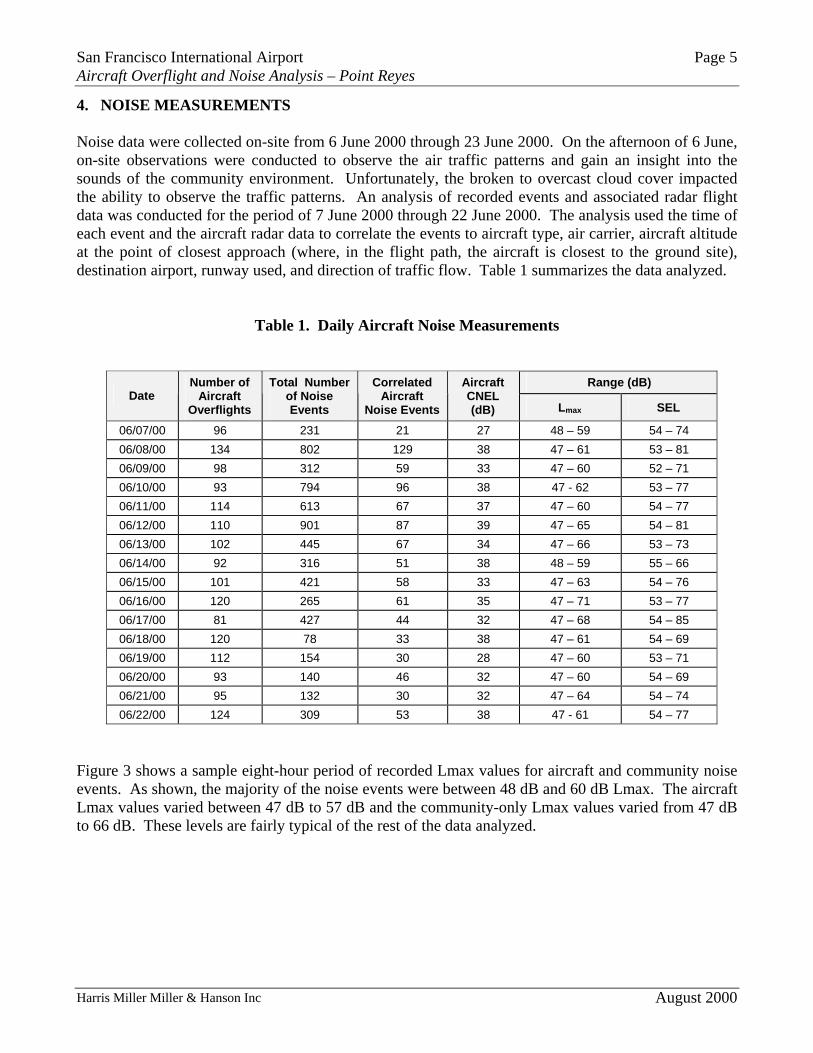
4. NOISE MEASUREMENTS Noise data were collected on-site from 6 June 2000 through 23 June 2000. On the afternoon of 6 June, on-site observations were conducted to observe the air traffic patterns and gain an insight into the sounds of the community environment. Unfortunately, the broken to overcast cloud cover impacted the ability to observe the traffic patterns. An analysis of recorded events and associated radar flight data was conducted for the period of 7 June 2000 through 22 June 2000. The analysis used the time of each event and the aircraft radar data to correlate the events to aircraft type, air carrier, aircraft altitude at the point of closest approach (where, in the flight path, the aircraft is closest to the ground site), destination airport, runway used, and direction of traffic flow. Table 1 summarizes the data analyzed.
Table 1. Daily Aircraft Noise Measurements
Range (dB) Date
Number of Aircraft
Overflights
Total Number of Noise Events
Correlated Aircraft
Noise Events
Aircraft CNEL (dB) Lmax SEL
06/07/00 96 231 21 27 48 – 59 54 – 74 06/08/00 134 802 129 38 47 – 61 53 – 81 06/09/00 98 312 59 33 47 – 60 52 – 71 06/10/00 93 794 96 38 47 - 62 53 – 77 06/11/00 114 613 67 37 47 – 60 54 – 77 06/12/00 110 901 87 39 47 – 65 54 – 81 06/13/00 102 445 67 34 47 – 66 53 – 73 06/14/00 92 316 51 38 48 – 59 55 – 66 06/15/00 101 421 58 33 47 – 63 54 – 76 06/16/00 120 265 61 35 47 – 71 53 – 77 06/17/00 81 427 44 32 47 – 68 54 – 85 06/18/00 120 78 33 38 47 – 61 54 – 69 06/19/00 112 154 30 28 47 – 60 53 – 71 06/20/00 93 140 46 32 47 – 60 54 – 69 06/21/00 95 132 30 32 47 – 64 54 – 74 06/22/00 124 309 53 38 47 - 61 54 – 77
Figure 3 shows a sample eight-hour period of recorded Lmax values for aircraft and community noise events. As shown, the majority of the noise events were between 48 dB and 60 dB Lmax. The aircraft Lmax values varied between 47 dB to 57 dB and the community-only Lmax values varied from 47 dB to 66 dB. These levels are fairly typical of the rest of the data analyzed.

San Francisco International Airport Aircraft Overflight and Noise Analysis – Point Reyes
Harris Miller Miller & Hanson Inc
Page 5
August 2000
Figure 3. Sample of Aircraft and Community Event Lmax Values - 22 June 2000
30
40
50
60
70
6:00
:48
6:03
:59
6:23
:58
7:57
:10
8:30
:52
8:55
:27
9:39
:01
9:55
:45
10:0
0:38
10:3
5:53
10:4
3:10
10:5
0:36
11:1
7:01
11:2
0:50
11:2
4:01
11:2
7:20
11:3
5:16
11:3
5:50
11:4
6:20
11:4
7:27
12:1
8:06
12:3
4:20
12:4
5:46
13:0
6:29
13:0
9:07
13:1
2:21
13:1
2:54
13:1
4:21
13:1
9:11
13:2
0:49
13:2
3:34
13:2
9:11
13:3
1:46
13:5
7:00
14:0
0:30
14:0
1:57
Time of Day
Max
imum
Sou
nd L
evel
(Lm
ax),
dB
Aircraft Lmax Community Lmax

San Francisco International Airport Aircraft Overflight and Noise Analysis – Point Reyes
Harris Miller Miller & Hanson Inc
Page 6
August 2000
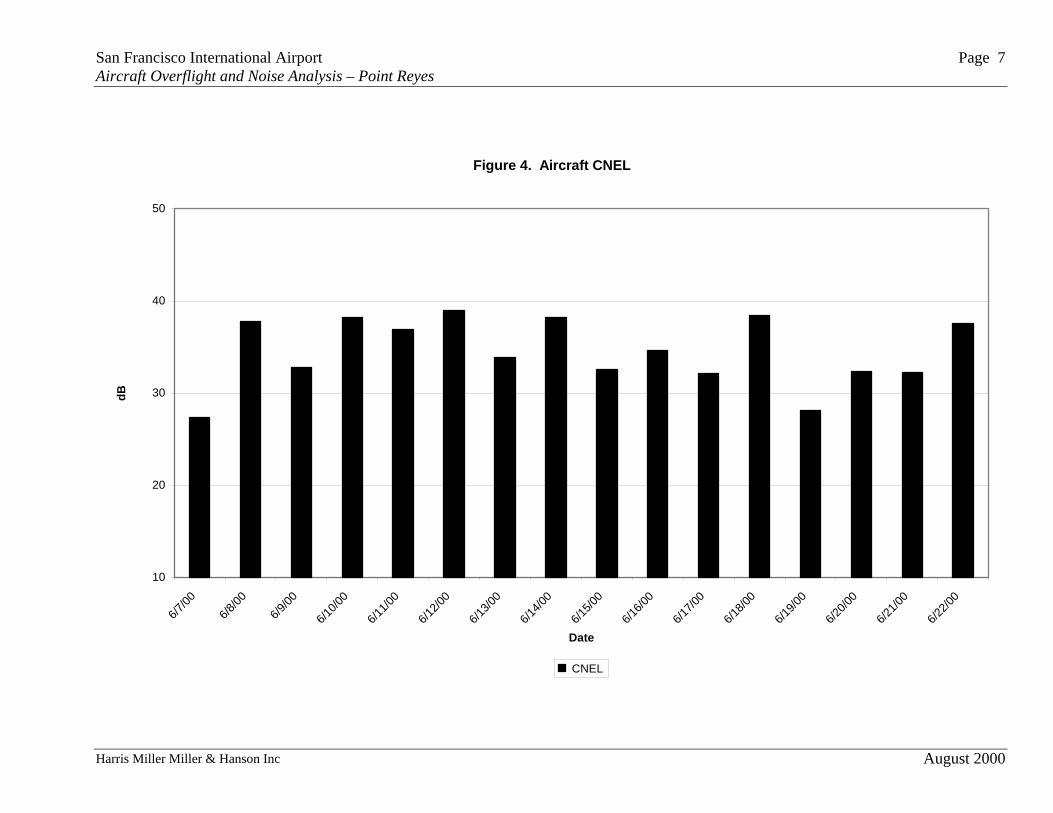
The measured SELs correlated to actual aircraft operations were used to compute the CNEL from aircraft operations at the site. Table 2 and Figure 4 show the aircraft CNEL varied between 27 dB and 39 dB throughout the measurement period with the median level being 34 dB. The total measured CNEL for the time period is also shown in Table 2 and Figure 5 and ranged from 45 dB to 60 dB with a median of 49 dB. We determined the community-only CNEL by removing the daily-calculated aircraft CNEL contribution from the measured total daily CNEL. Table 2 shows the community 24-hour noise exposure without aircraft noise ranged from 41 dB to 60 dB with the median level being 48.5 dB. We believe the prevailing windy conditions at the site affected the community and, thereby, total noise exposure levels. However, the community noise exposure range still corresponded to expected noise levels in quiet suburban living areas (Ref: “Information on Levels of Environmental Noise Requisite to Protect Public Health and Welfare with an Adequate Margin of Safety”, U.S. Environmental Protection Agency, March 1974). The results indicate the aircraft increased the total daily CNEL by 0 to 2 dB.
Table 2. Daily CNEL Measurements
Date Total-Daily CNEL (dB)
Aircraft-Only CNEL (dB)
Total SFO SJC Community-Only
CNEL (dB)
06/07/00 50 27 23 25 50 06/08/00 60 38 36 29 60 06/09/00 48 33 32 19 48 06/10/00 51 38 37 30 51 06/11/00 53 37 35 28 52 06/12/00 54 39 38 28 54
06/13/00 48 34 30 29 48
06/14/00 45 38 38 30 44
06/15/00 52 33 32 18 52
06/16/00 49 35 32 24 49
06/17/00 57 32 31 26 57
06/18/00 43 38 37 20 41
06/19/00 47 28 27 21 47
06/20/00 45 32 32 19 45
06/21/00 45 32 31 5 44
06/22/00 48 38 37 26 47
A review of the daily contributions to the aircraft CNEL at this site by specific airport revealed that SFO arrivals to Runways 28L and 28R dominated with SJC arrivals to Runways 30L and 30R also contributing. An energy average of the aircraft CNEL for the time period of measurement was 36 dB. SFO average aircraft CNEL contribution was 35 dB and that of SJC was 26 dB.
San Francisco International Airport Aircraft Overflight and Noise Analysis – Point Reyes
Harris Miller Miller & Hanson Inc
Page 7
August 2000
Figure 4. Aircraft CNEL
10
20
30
40
50
6/7/00
6/8/00
6/9/00
6/10/0
0
6/11/0
0
6/12/0
0
6/13/0
0
6/14/0
0
6/15/0
0
6/16/0
0
6/17/0
0
6/18/0
0
6/19/0
0
6/20/0
0
6/21/0
0
6/22/0
0
Date
dB
CNEL

San Francisco International Airport Aircraft Overflight and Noise Analysis – Point Reyes
Harris Miller Miller & Hanson Inc
Page 8
August 2000
Figure 5. Total Daily CNEL
10
20
30
40
50
60
70
6/7/00
6/8/00
6/9/00
6/10/0
0
6/11/0
0
6/12/0
0
6/13/0
0
6/14/0
0
6/15/0
0
6/16/0
0
6/17/0
0
6/18/0
0
6/19/0
0
6/20/0
0
6/21/0
0
6/22/0
0
Date
dB
CNEL

San Francisco International Airport Aircraft Overflight and Noise Analysis – Point Reyes
Harris Miller Miller & Hanson Inc
Page 9
August 2000
5. CONCLUSIONS Based on observations and collected data, we conclude the following:
1. Aircraft noise exposure measured 27 dB to 39 dB CNEL. 2. Aircraft noise was primarily due to arrivals at SFO and SJC at altitudes above 10,000 feet
MSL. 3. Aircraft arrivals to SFO dominated the aircraft contribution to the noise exposure level. 4. Aircraft increased the total daily CNEL by 0 to 2 dB. 5. Community, or non-aircraft, noise exposure of 41 dB - 60 dB exceeds aircraft noise
exposure and is most likely affected by the prevailing windy conditions at the site.

San Francisco International Airport Aircraft Overflight and Noise Analysis – Point Reyes
Harris Miller Miller & Hanson Inc
Page 1
August 2000
APPENDIX A
Aircraft Noise Terminology/Metrics
To assist in understanding the noise measurements and noise metrics used in evaluating airport noise, we provide a brief introduction to noise terminology used in this report. Specifically, the noise metrics discussed are the decibel (dB), the A-weighted sound level, the Maximum Noise Level (Lmax), the Single Event Noise Exposure Level (SENEL), the Sound Exposure Level (SEL), and the Community Noise Equivalent Level (CNEL). The decibel or dB is the unit of measure used to represent the change in sound pressure which is detected by the human ear. Since the range between the slightest and greatest sounds that we hear is extremely large, the decibel uses the logarithmic scale to compress this range to a more meaningful scale with 0 dB representing the slightest sound we can hear. Most sounds we experience in our day-to-day lives vary somewhere between 30 dB and 100 dB. Figure A-1 presents typical sound levels of several common environmental sources. Aircraft sound measurements generally use the metric known as A-weighted sound level. This is the sound level that has been filtered or weighted to reduce the influence of high and low frequency extremes. This closely replicates the sensitivity of the human ear in the frequency range of 500 – 10,000 Hz and correlates well with perceptions of the loudness of sounds. Thus, an aircraft noise event with a higher A-weighted sound level is perceived to be louder than an aircraft noise event with a lower A-weighted sound level. This correlation with human’s perception of loudness is the primary reason that A-weighted sound levels are used to evaluate environmental noise sources. Although A-weighted sound levels are normally written with units dBA, all sound levels in this report are A-weighted and the unit dB indicates A-weighted sound levels. Lmax, or the maximum noise level, is a measurement of the maximum sound level for a single event. Lmax can be directly measured in dB with a wide variety of sound measurement instruments. However, Lmax, by itself, provides no information on the cumulative noise exposure from a single source. The duration of a noise event also impacts our perception of annoyance. Therefore, a term or metric is needed that accounts for both intensity and duration and provides a uniform assessment of noise events with differing intensities and durations. This metric is SENEL or SEL. SENEL expressed in dB represents the cumulative sound energy detected above an established threshold for a single event considering both intensity and duration of the sound. For measurements, the threshold is 30 dB below an upper SENEL limit which depends on the aircraft type and distance from either the start of the take-off roll or the landing threshold. SEL is functionally equivalent to SENEL with the difference being that the threshold for SEL is referenced to the background noise level. The SEL is calculated by normalizing or standardizing the accumulated sound energy to a one-second duration. Thus, for example, two events with the same intensity but different durations can be differentiated with the longer duration event having higher SEL. This normalization will usually result in the SEL for most aircraft overflights being on the order of 7 dB to 12 dB higher than the corresponding Lmax. Thus, SEL gives us a common basis for comparing noise events that matches our instinctive impression – the higher the SEL, the more annoying it is likely to be.

San Francisco International Airport Aircraft Overflight and Noise Analysis – Point Reyes
Harris Miller Miller & Hanson Inc
Page 2
August 2000
APPENDIX A
Figure A-1. Common Environmental Sound Levels in dB

San Francisco International Airport Aircraft Overflight and Noise Analysis – Point Reyes
Harris Miller Miller & Hanson Inc
Page 3
August 2000
APPENDIX A The previous two metrics dealt with measuring noise on an event by event basis. To determine the cumulative effect of noise exposure on a community and to correlate that level of noise exposure to a community annoyance response, the CNEL was developed. CNEL looks at a 24-hour period and the associated noise events with corresponding SEL values and derives an average SEL or equivalent sound level for an entire day. To account for the perceived greater sensitivity to evening and nighttime noise, CNEL applies a weighting to aircraft events occurring during those time periods. For evening (7:00 PM – 9:59 PM) and nighttime (10:00 PM – 6:59 AM) aircraft noise events, CNEL logarithmically multiplies each operation by 3 and 10, respectively. This effectively adds 4.8 dB to evening event SELs and 10 dB to nighttime event SELs. The aircraft CNEL is then derived using the SELs from all aircraft generated events for the period. A total CNEL will include the aircraft generated events as well as other noise events generated in the community during the corresponding time period. Typically, total CNEL in our environment ranges from a low of 40-45 dB in very quiet locations to 80-85 dB immediately adjacent to an active noise source – busy traffic route or active airport. Figure A-2 shows representative values of CNEL in typically different environments. Aircraft CNEL is also used to depict noise contours of equal exposure levels around an airport to reflect long-term operations, usually one year.

San Francisco International Airport Aircraft Overflight and Noise Analysis – Point Reyes
Harris Miller Miller & Hanson Inc
Page 4
August 2000
APPENDIX A
Figure A-2. Representative Cumulative Sound Levels