Technical Report NREL/TP-560-41413 April 2007 Controlled Hydrogen Fleet and Infrastructure...
33
Technical Report NREL/TP-560-41413 April 2007 Controlled Hydrogen Fleet and Infrastructure Demonstration and Validation Project Spring 2007 Composite Data Products March 8, 2007 K. Wipke, S. Sprik, H. Thomas, and C. Welch
-
Upload
chris-ness -
Category
Documents
-
view
214 -
download
0
Transcript of Technical Report NREL/TP-560-41413 April 2007 Controlled Hydrogen Fleet and Infrastructure...
Technical ReportNREL/TP-560-41413
April 2007
Controlled Hydrogen Fleet and Infrastructure Demonstration and Validation Project
Spring 2007 Composite Data ProductsMarch 8, 2007
K. Wipke, S. Sprik, H. Thomas, and C. Welch

NOTICEThis report was prepared as an account of work sponsored by an agency of the United States government. Neither the United States government nor any agency thereof, nor any of their employees, makes any warranty, express or implied, or assumes any legal liability or responsibility for the accuracy, completeness, or usefulness of any information, apparatus, product, or process disclosed, or represents that its use would not infringe privately owned rights. Reference herein to any specific commercial product, process, or service by trade name, trademark, manufacturer, or otherwise does not necessarily constitute or imply its endorsement, recommendation, or favoring by the United States government or any agency thereof. The views and opinions of authors expressed herein do not necessarily state or reflect those of the United States government or any agency thereof.
Available electronically at http://www.osti.gov/bridge
Available for a processing fee to U.S. Department of Energyand its contractors, in paper, from:U.S. Department of EnergyOffice of Scientific and Technical InformationP.O. Box 62Oak Ridge, TN 37831-0062phone: 865.576.8401fax: 865.576.5728email: mailto:[email protected]
Available for sale to the public, in paper, from:U.S. Department of CommerceNational Technical Information Service5285 Port Royal RoadSpringfield, VA 22161phone: 800.553.6847fax: 703.605.6900email: [email protected] ordering: http://www.ntis.gov/ordering.htm
Printed on paper containing at least 50% wastepaper, including 20% postconsumer waste
3
Controlled Hydrogen Fleet and Infrastructure Demonstration and
Validation Project
Spring 2007 Composite Data Products
3/8/07
Keith Wipke, Sam Sprik, Holly Thomas, Cory Welch
4
Max Hrs Accumulated (1)(2) Avg Hrs Accumulated (1)(3)0
200
400
600
800
Tim
e (H
ou
rs)
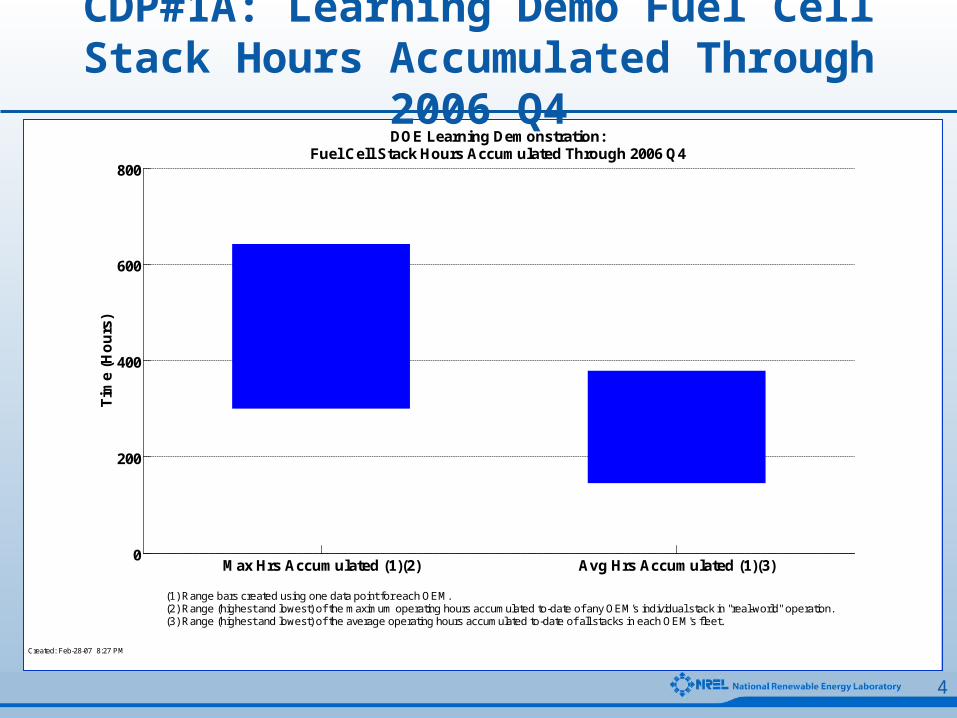
DOE Learning Demonstration:Fuel Cell Stack Hours Accumulated Through 2006 Q4
Created: Feb-28-07 8:27 PM
(1) Range bars created using one data point for each OEM.(2) Range (highest and lowest) of the maximum operating hours accumulated to-date of any OEM's individual stack in "real-world" operation.(3) Range (highest and lowest) of the average operating hours accumulated to-date of all stacks in each OEM's fleet.
CDP#1A: Learning Demo Fuel Cell Stack Hours Accumulated Through 2006 Q4
5
Projected Hours to 10% Voltage Degradation (1)(2)(3)0
200
400
600
800
1000
1200
1400
1600
1800
2000
2200
2400
2006 Target
2009 Target
Tim
e (H
ou
rs)
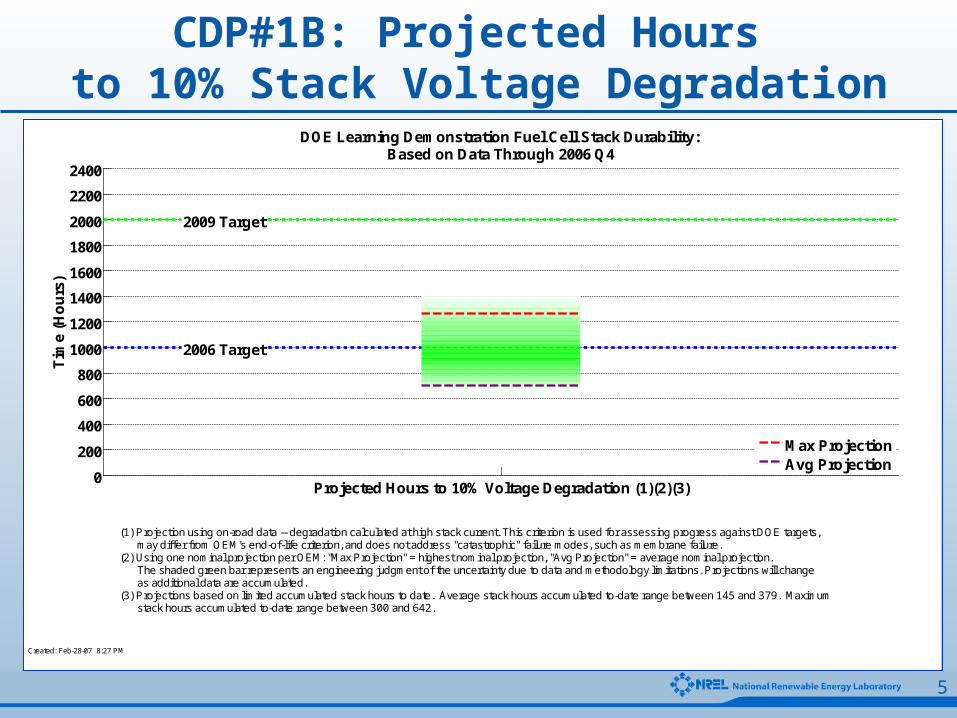
DOE Learning Demonstration Fuel Cell Stack Durability:Based on Data Through 2006 Q4
Max ProjectionAvg Projection
Created: Feb-28-07 8:27 PM
(1) Projection using on-road data -- degradation calculated at high stack current. This criterion is used for assessing progress against DOE targets, may differ from OEM's end-of-life criterion, and does not address "catastrophic" failure modes, such as membrane failure.(2) Using one nominal projection per OEM: "Max Projection" = highest nominal projection, "Avg Projection" = average nominal projection. The shaded green bar represents an engineering judgment of the uncertainty due to data and methodology limitations. Projections will change as additional data are accumulated.(3) Projections based on limited accumulated stack hours to date. Average stack hours accumulated to-date range between 145 and 379. Maximum stack hours accumulated to-date range between 300 and 642.
CDP#1B: Projected Hours to 10% Stack Voltage Degradation
6
0
200
400
600
800
1000
1200
1400
1600
1800
2000
2200
2400
2006 Target
2009 Target
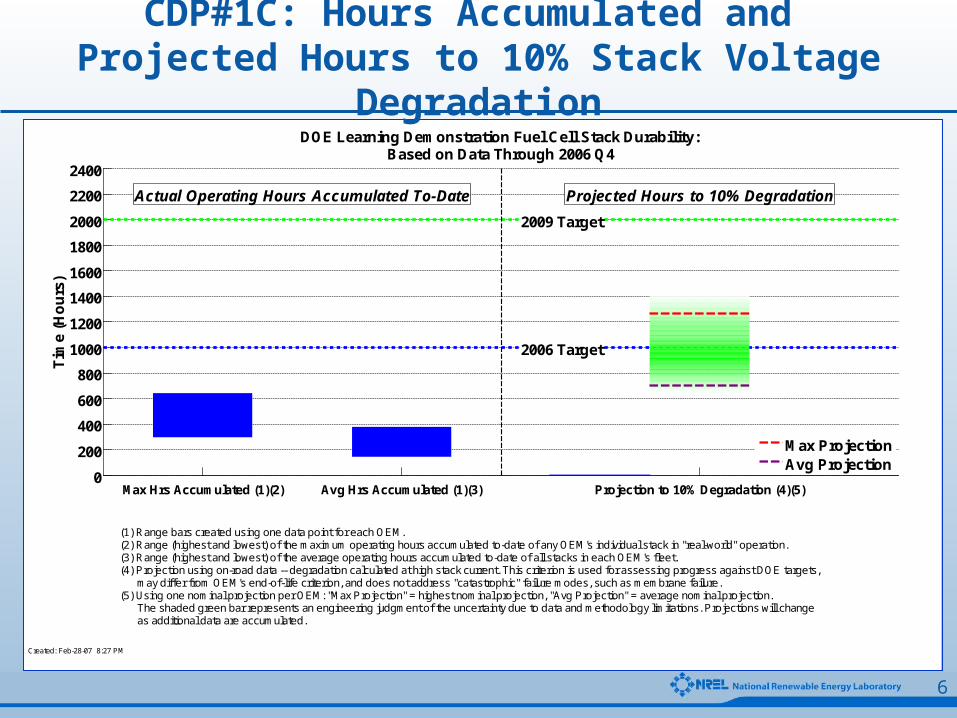
Actual Operating Hours Accumulated To-Date Projected Hours to 10% Degradation
Max Hrs Accumulated (1)(2) Avg Hrs Accumulated (1)(3) Projection to 10% Degradation (4)(5)
Tim
e (H
ou
rs)
DOE Learning Demonstration Fuel Cell Stack Durability:Based on Data Through 2006 Q4
Max ProjectionAvg Projection
Created: Feb-28-07 8:27 PM
(1) Range bars created using one data point for each OEM.(2) Range (highest and lowest) of the maximum operating hours accumulated to-date of any OEM's individual stack in "real-world" operation.(3) Range (highest and lowest) of the average operating hours accumulated to-date of all stacks in each OEM's fleet.(4) Projection using on-road data -- degradation calculated at high stack current. This criterion is used for assessing progress against DOE targets, may differ from OEM's end-of-life criterion, and does not address "catastrophic" failure modes, such as membrane failure.(5) Using one nominal projection per OEM: "Max Projection" = highest nominal projection, "Avg Projection" = average nominal projection. The shaded green bar represents an engineering judgment of the uncertainty due to data and methodology limitations. Projections will change as additional data are accumulated.
CDP#1C: Hours Accumulated and Projected Hours to 10% Stack Voltage Degradation
7
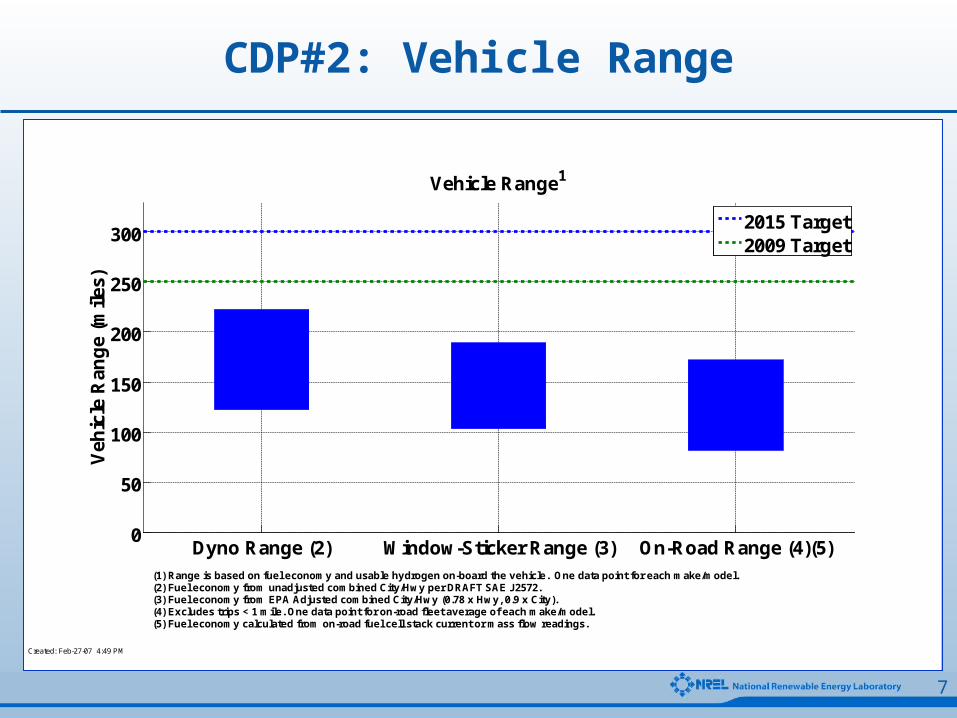
Dyno Range (2) Window-Sticker Range (3) On-Road Range (4)(5)0
50
100
150
200
250
300
Veh
icle
Ran
ge
(mile
s)
Vehicle Range1
2015 Target2009 Target
Created: Feb-27-07 4:49 PM
(1) Range is based on fuel economy and usable hydrogen on-board the vehicle. One data point for each make/model.(2) Fuel economy from unadjusted combined City/Hwy per DRAFT SAE J2572.(3) Fuel economy from EPA Adjusted combined City/Hwy (0.78 x Hwy, 0.9 x City).(4) Excludes trips < 1 mile. One data point for on-road fleet average of each make/model.(5) Fuel economy calculated from on-road fuel cell stack current or mass flow readings.
CDP#2: Vehicle Range
8
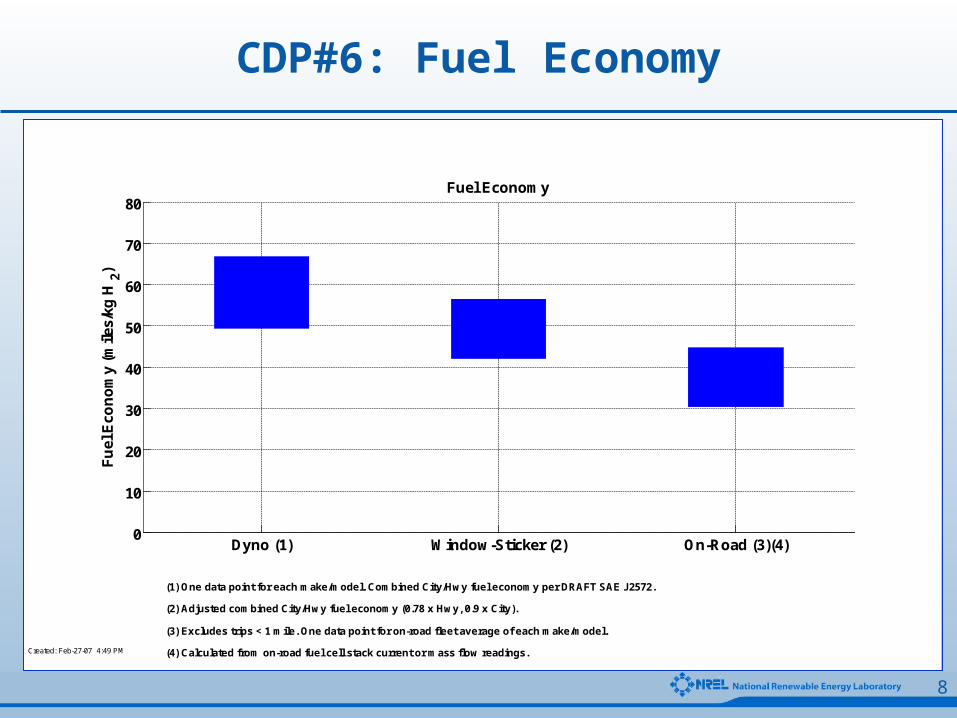
Dyno (1) Window-Sticker (2) On-Road (3)(4)0
10
20
30
40
50
60
70
80
Fu
el E
con
om
y (m
iles/
kg H
2)
Fuel Economy
Created: Feb-27-07 4:49 PM
(3) Excludes trips < 1 mile. One data point for on-road fleet average of each make/model.
(1) One data point for each make/model. Combined City/Hwy fuel economy per DRAFT SAE J2572.
(2) Adjusted combined City/Hwy fuel economy (0.78 x Hwy, 0.9 x City).
(4) Calculated from on-road fuel cell stack current or mass flow readings.
CDP#6: Fuel Economy
9
0
10
20
30
40
50
60
70
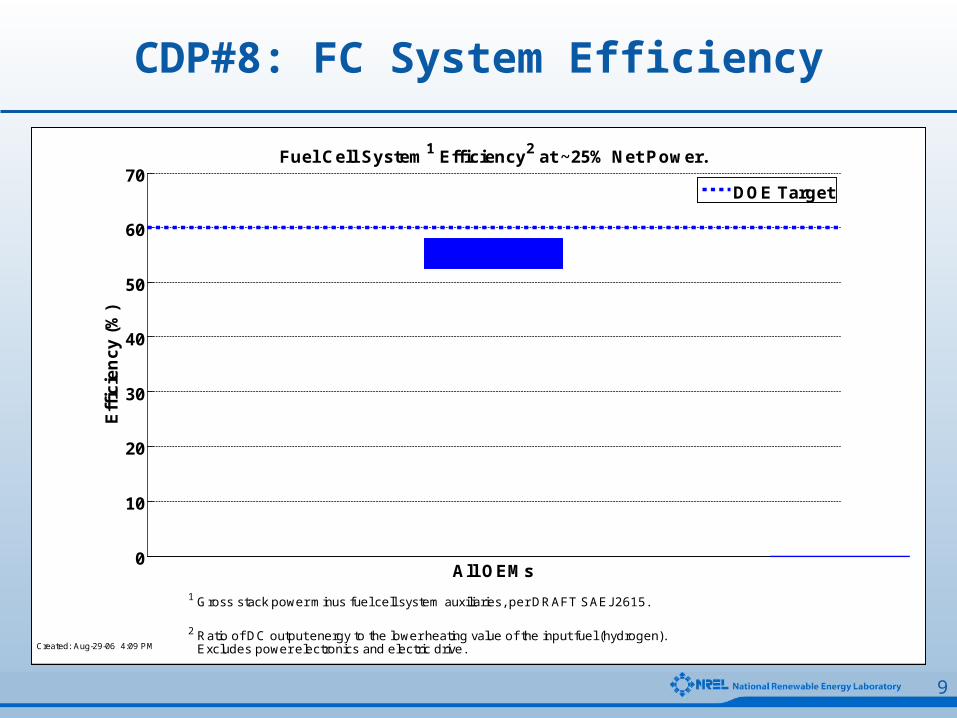
All OEMs
Eff
icie
nc
y (
%)
Fuel Cell System1 Efficiency2 at ~25% Net Power.
DOE Target
Created: Aug-29-06 4:09 PM
1 Gross stack power minus fuel cell system auxiliaries, per DRAFT SAEJ2615.
2 Ratio of DC output energy to the lower heating value of the input fuel (hydrogen).Excludes power electronics and electric drive.
CDP#8: FC System Efficiency
10
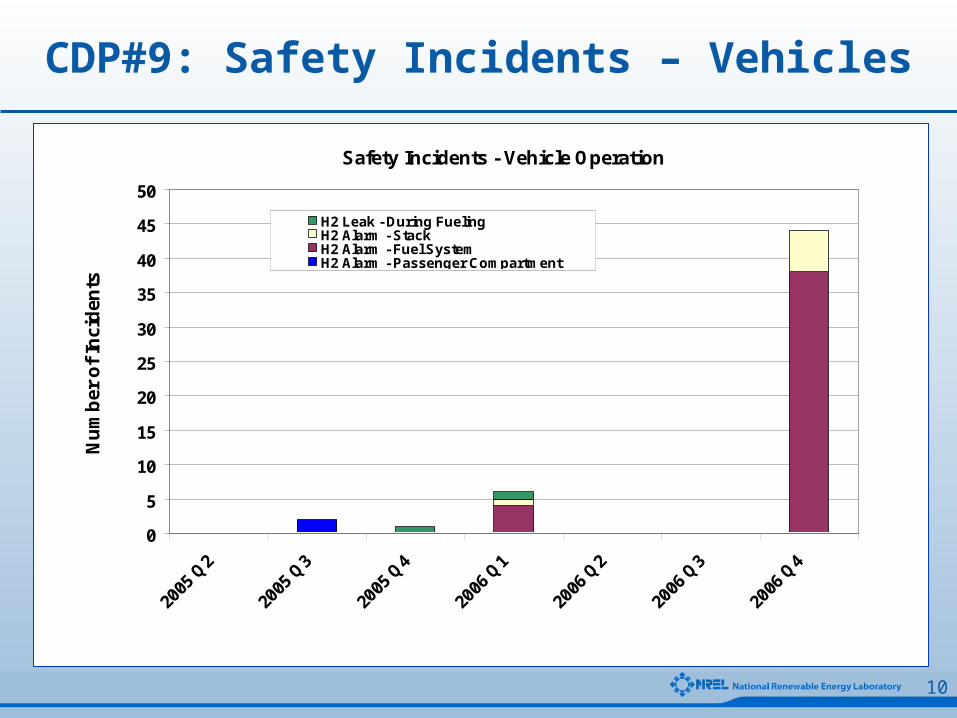
CDP#9: Safety Incidents – Vehicles
Safety Incidents - Vehicle Operation
0
5
10
15
20
25
30
35
40
45
50
2005
Q2
2005
Q3
2005
Q4
2006
Q1
2006
Q2
2006
Q3
2006
Q4
Nu
mb
er o
f In
cid
ents
H2 Leak - During FuelingH2 Alarm - StackH2 Alarm - Fuel SystemH2 Alarm - Passenger Compartment
Created: 2/28/07 8:45AM

11
CDP#10: Storage Weight % Hydrogen
0
1
2
3
4
5
6
7
8
9
All OEMs
We
igh
t P
erc
en
t H
yd
rog
en
(%
)
Weight Percent Hydrogen
2015 DOE MYPP Target1
2010 DOE MYPP Target1
2007 DOE MYPP Target1
Created: 23-Feb-20061Some near-term targets have been achieved with compressed and liquid tanks. Emphasis is on advanced materials-based technologies.

12
CDP#11: Volumetric Capacity of H2Storage
0
0.01
0.02
0.03
0.04
0.05
0.06
0.07
0.08
0.09
0.1
All OEMs
Ma
ss
H2
pe
r L
ite
r (k
g/L
)
Mass of Hydrogen Per Liter
2015 DOE MYPP Target1
2010 DOE MYPP Target1
2007 DOE MYPP Target1
Created: 23-Feb-20061Emphasis is on advanced materials-based technologies.

13
CDP#12: Vehicle Hydrogen Tank Cycle Life
0
2000
4000
6000
8000
10000
12000
All OEMs
Nu
mb
er
of
cy
cle
s
Hydrogen Tank Cycle Life
2015 DOE MYPP Target1
2010 DOE MYPP Target1
2007 DOE MYPP Target1
Created: 23-Feb-20061Some near-term targets have been achieved with compressed and liquid tanks. Emphasis is on advanced materials-based technologies.

14
0 0.2 0.4 0.6 0.8 1 1.2 1.4 1.6 1.8 20
102030405060708090
100110120130140150160170180190200210220230240250260270
Avg Fuel Rate (kg/min)
Nu
mb
er o
f F
uel
ing
Eve
nts
Histogram of Fueling RatesAll Light Duty Through 2006Q4
5 minute fill of5 kg at 350 bar
3 minute fill of5 kg at 350 bar
2006 Tech Val Milestone2010 MYPP Adv Storage Materials Target
Created: Feb-28-07 1:42 PM
CDP#18: Refueling Rates
15
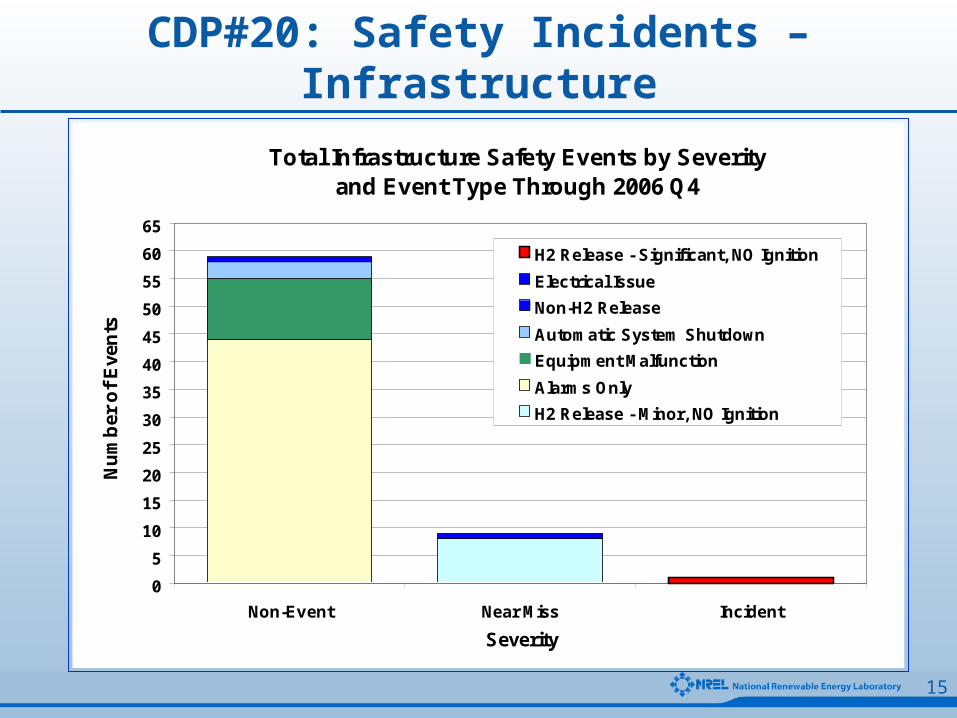
CDP#20: Safety Incidents – Infrastructure
Total Infrastructure Safety Events by Severity and Event Type Through 2006 Q4
0
5
10
15
20
25
30
35
40
45
50
55
60
65
Non-Event Near Miss Incident
Severity
Nu
mb
er o
f E
ven
ts
H2 Release - Significant, NO Ignition
Electrical Issue
Non-H2 Release
Automatic System Shutdown
Equipment Malfunction
Alarms Only
H2 Release - Minor, NO Ignition
Created 07-Mar-2007
16
-30
-20
-10
0
10
20
30
40
50
60
Deg
rees
Cel
siu
s
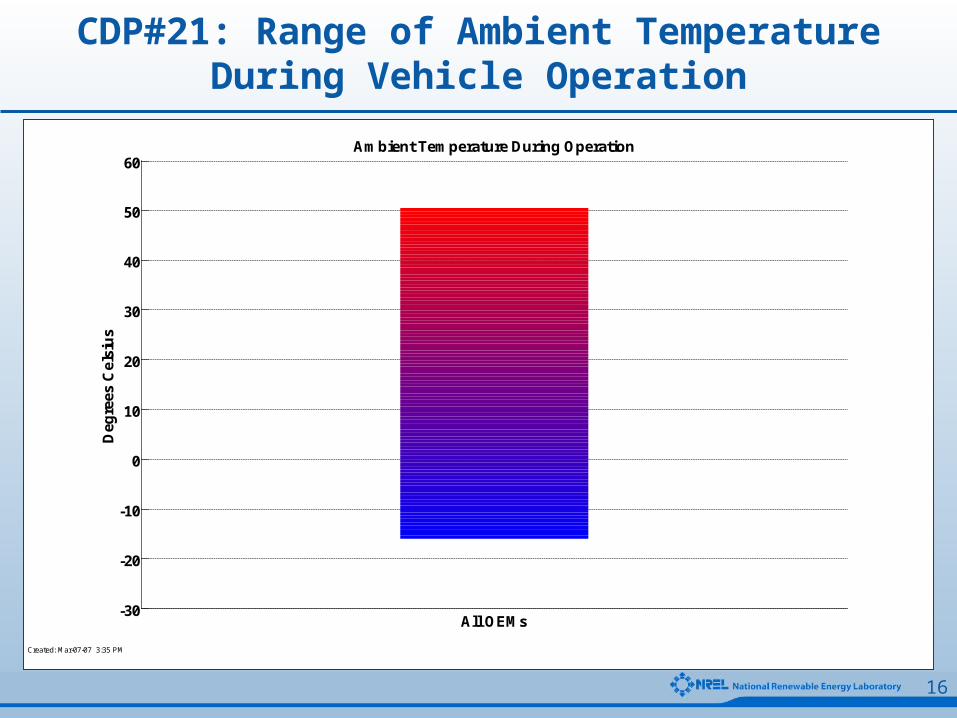
Ambient Temperature During Operation
All OEMs
Created: Mar-07-07 3:35 PM
CDP#21: Range of Ambient TemperatureDuring Vehicle Operation
17
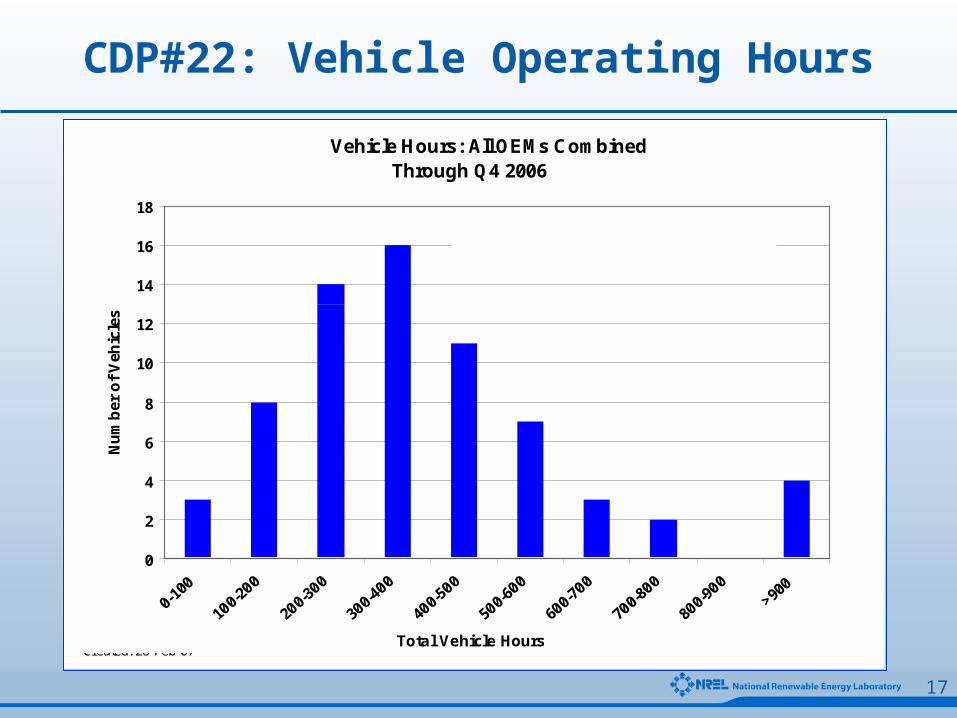
CDP#22: Vehicle Operating Hours
Vehicle Hours: All OEMs Combined
0
2
4
6
8
10
12
14
16
18
0-10
0
100-
200
200-
300
300-
400
400-
500
500-
600
600-
700
700-
800
800-
900
>900
Total Vehicle Hours
Nu
mb
er o
f V
ehic
les
Through Q4 2006
Created: 28-Feb-07
Total Vehicle Hours = 28,545
Through Q4 2006
Vehicle Hours: All OEMs Combined
0
2
4
6
8
10
12
14
16
18
0-10
0
100-
200
200-
300
300-
400
400-
500
500-
600
600-
700
700-
800
800-
900
>900
Total Vehicle Hours
Nu
mb
er o
f V
ehic
les
Through Q4 2006
Created: 28-Feb-07
Total Vehicle Hours = 28,545
Through Q4 2006
18
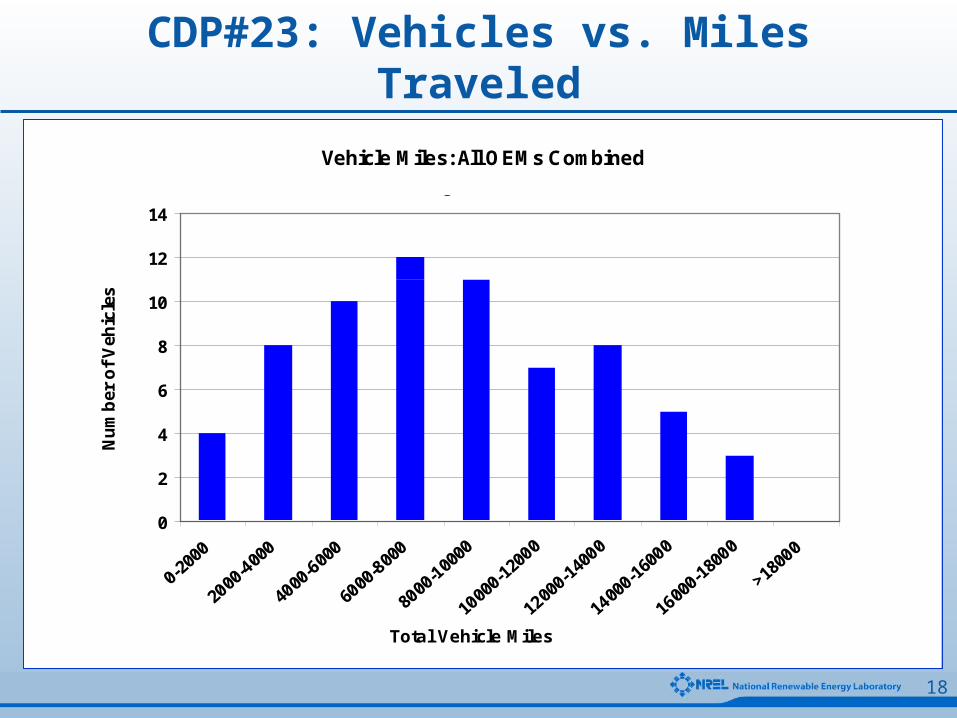
CDP#23: Vehicles vs. Miles Traveled
Vehicle Miles: All OEMs Combined
0
2
4
6
8
10
12
14
0-20
00
2000
-400
0
4000
-600
0
6000
-800
0
8000
-100
00
1000
0-12
000
1200
0-14
000
1400
0-16
000
1600
0-18
000
>1800
0
Total Vehicle Miles
Nu
mb
er o
f V
ehic
les
Total Miles Traveled = 573,064
Through Q4 2006
Created: 28-Feb-07
19
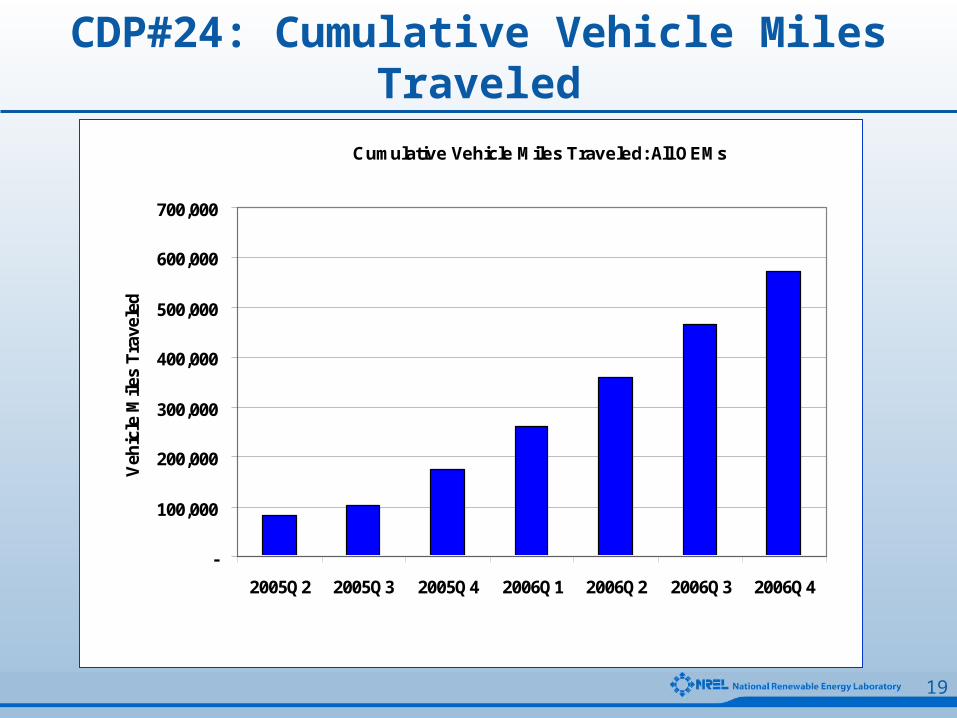
CDP#24: Cumulative Vehicle Miles Traveled
Cumulative Vehicle Miles Traveled: All OEMs
-
100,000
200,000
300,000
400,000
500,000
600,000
700,000
2005Q2 2005Q3 2005Q4 2006Q1 2006Q2 2006Q3 2006Q4
Veh
icle
Mile
s T
rave
led
Created: 28-Feb-07
20
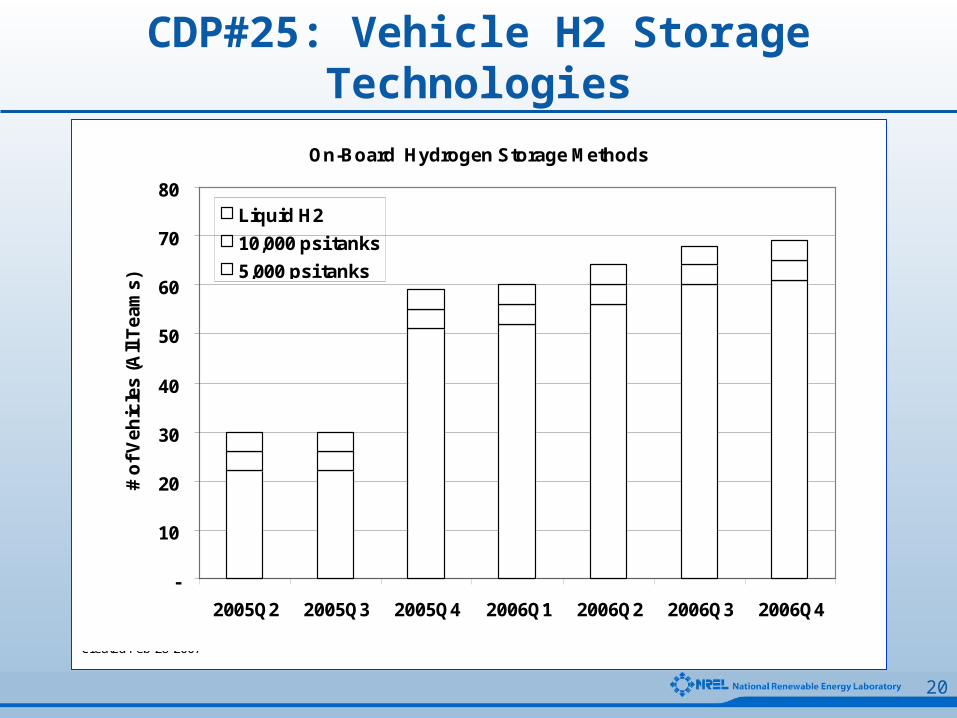
CDP#25: Vehicle H2 Storage Technologies
On-Board Hydrogen Storage Methods
-
10
20
30
40
50
60
70
80
2005Q2 2005Q3 2005Q4 2006Q1 2006Q2 2006Q3 2006Q4
# o
f V
eh
icle
s (
All
Te
am
s)
Liquid H2
10,000 psi tanks
5,000 psi tanks
Created Feb-28-2007

21
Cumulative Hydrogen Produced or Dispensed
0123456789
10111213141516171819202122
Q2 2005 Q3 2005 Q4 2005 Q1 2006 Q2 2006 Q3 2006 Q4 2006
Calendar Quarter
Mas
s o
f H
ydro
gen
(kg
) (t
ho
usa
nd
s)
Created 20-Feb-2007
CDP#26: Cumulative H2 Produced or Dispensed
22
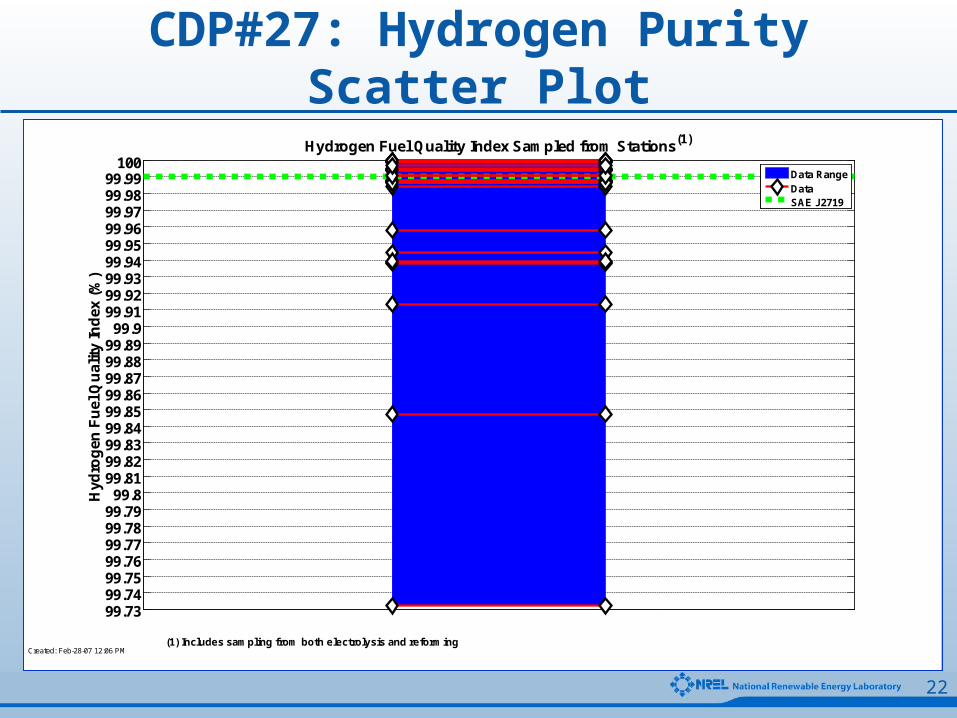
CDP#27: Hydrogen Purity Scatter Plot
99.7399.7499.7599.7699.7799.7899.7999.8
99.8199.8299.8399.8499.8599.8699.8799.8899.8999.9
99.9199.9299.9399.9499.9599.9699.9799.9899.99
100
Hyd
rog
en F
uel
Qu
alit
y In
dex
(%
)
Hydrogen Fuel Quality Index Sampled from Stations(1)
Data RangeDataSAE J2719
Created: Feb-28-07 12:06 PM(1) Includes sampling from both electrolysis and reforming

23
0 1 2 3 4 5 6 7 8 9 10
Particulates
g/L
H2 Impurities
Data Range SAE J2719 Measured Less Than or Equal To (Detection Limited)
0 500 1000 1500 2000 2500 3000
(N2 + He + Ar)
0 5 10 15 20 25 30 35 40
H20 Total HC
O2 CO2 CO
NH3
mol/mol (ppm)
0 10 20 30 40 50 60 70 80 90 100
Total S*
nmol/mol (ppb)Created: Feb-28-07 12:06 PM *Calculated from SO2, COS, H2S, CS2, and Methyl Mercaptan (CH3SH).
CDP #28: Hydrogen Impurities Scatter Plot
24
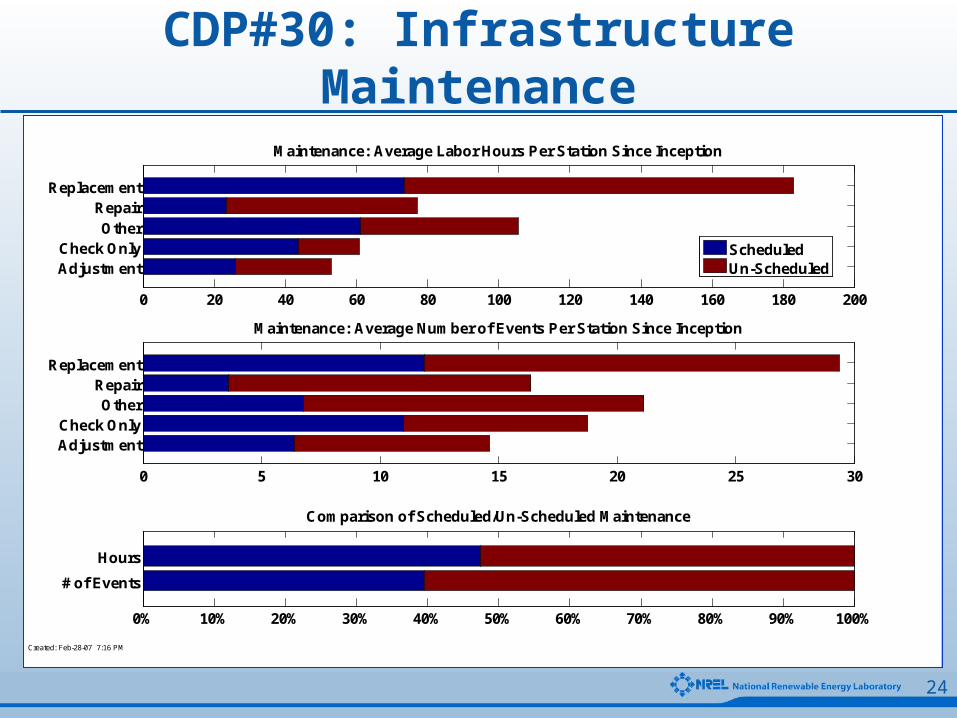
CDP#30: Infrastructure Maintenance
0 20 40 60 80 100 120 140 160 180 200
AdjustmentCheck Only
OtherRepair
Replacement
Maintenance: Average Labor Hours Per Station Since Inception
ScheduledUn-Scheduled
0 5 10 15 20 25 30
AdjustmentCheck Only
OtherRepair
Replacement
Maintenance: Average Number of Events Per Station Since Inception
0% 10% 20% 30% 40% 50% 60% 70% 80% 90% 100%
# of Events
Hours
Comparison of Scheduled/Un-Scheduled Maintenance
Created: Feb-28-07 7:16 PM

25
CDP#31: Number of Reporting Stations
Online Stations
0
2
4
6
8
10
12
2005 Q2 2005 Q3 2005 Q4 2006 Q1 2006 Q2 2006 Q3 2006 Q4
Reporting Period
Nu
mb
er o
f S
tati
on
s
Created 20-Feb-2007
26
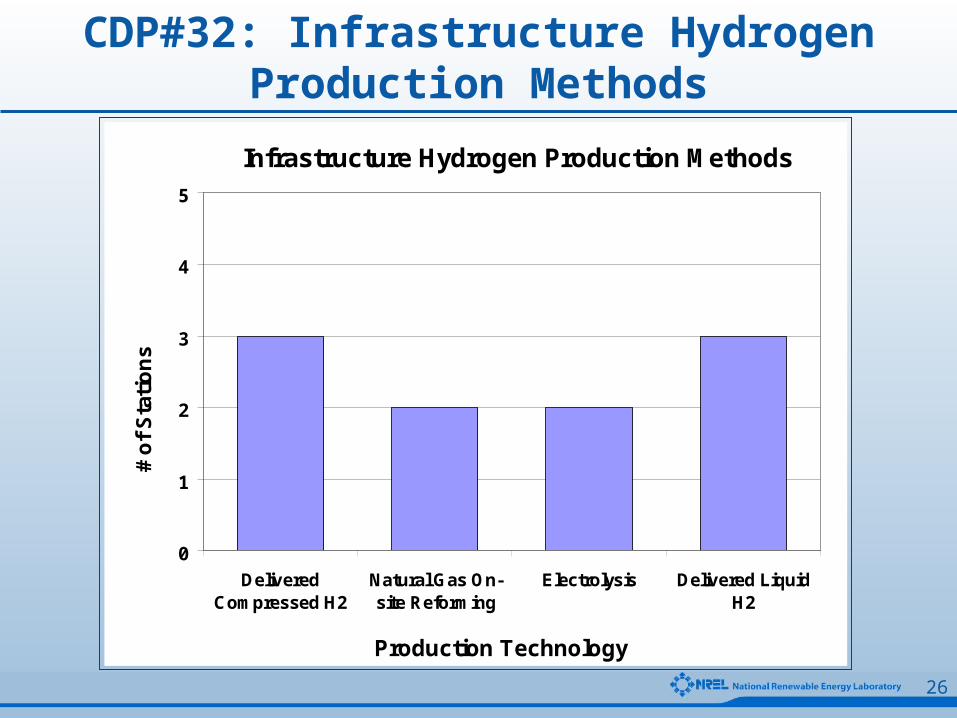
CDP#32: Infrastructure Hydrogen Production Methods
Infrastructure Hydrogen Production Methods
0
1
2
3
4
5
DeliveredCompressed H2
Natural Gas On-site Reforming
Electrolysis Delivered LiquidH2
Production Technology
# o
f S
tati
on
s
Created 07-Mar-2007
27
0 10 20 30 40 50 60 70 80 90 1000
10
20
30
40
50
60
70
80
90
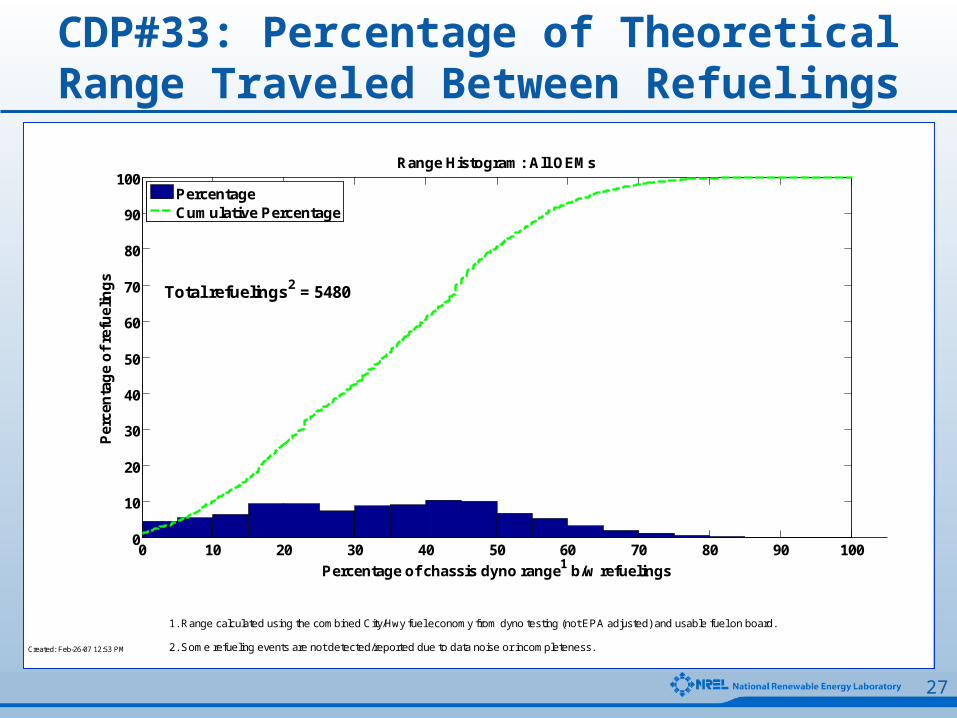
100Range Histogram: All OEMs
Percentage of chassis dyno range1 b/w refuelings
Per
cen
tag
e o
f re
fuel
ing
s
PercentageCumulative Percentage
Created: Feb-26-07 12:53 PM
Total refuelings2 = 5480
1. Range calculated using the combined City/Hwy fuel economy from dyno testing (not EPA adjusted) and usable fuel on board.
2. Some refueling events are not detected/reported due to data noise or incompleteness.
CDP#33: Percentage of Theoretical Range Traveled Between Refuelings
28
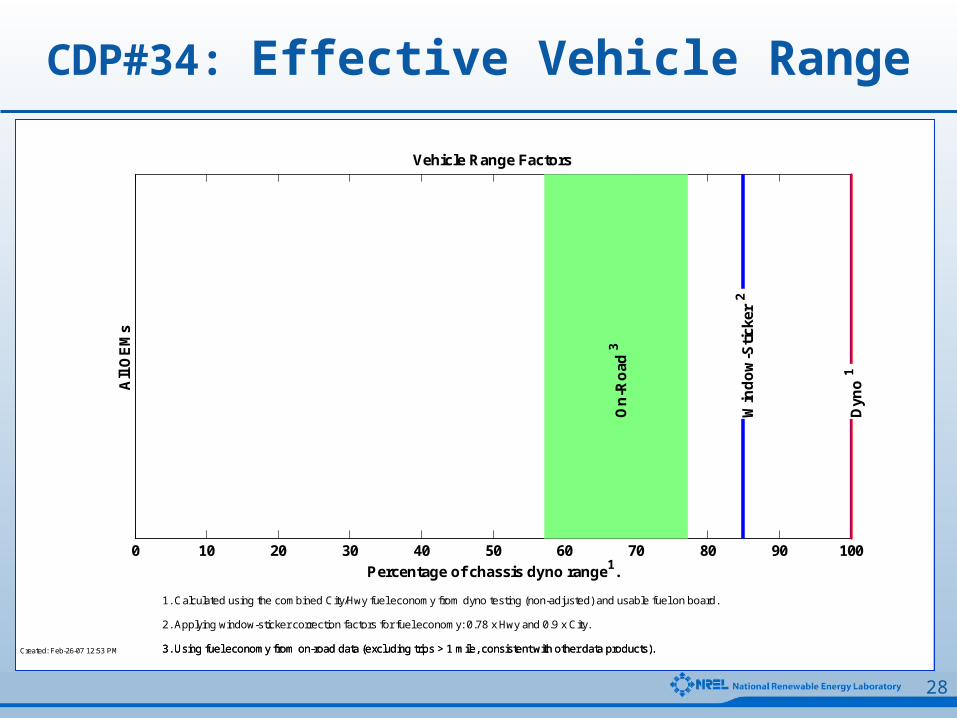
0 10 20 30 40 50 60 70 80 90 100
Vehicle Range Factors
Percentage of chassis dyno range1.
All
OE
Ms
Win
do
w-S
tick
er 2
On
-Ro
ad 3
Dyn
o 1
Created: Feb-26-07 12:53 PM
1. Calculated using the combined City/Hwy fuel economy from dyno testing (non-adjusted) and usable fuel on board.
2. Applying window-sticker correction factors for fuel economy: 0.78 x Hwy and 0.9 x City.
3. Using fuel economy from on-road data (excluding trips > 1 mile, consistent with other data products).3. Using fuel economy from on-road data (excluding trips > 1 mile, consistent with other data products).
CDP#34: Effective Vehicle Range
29
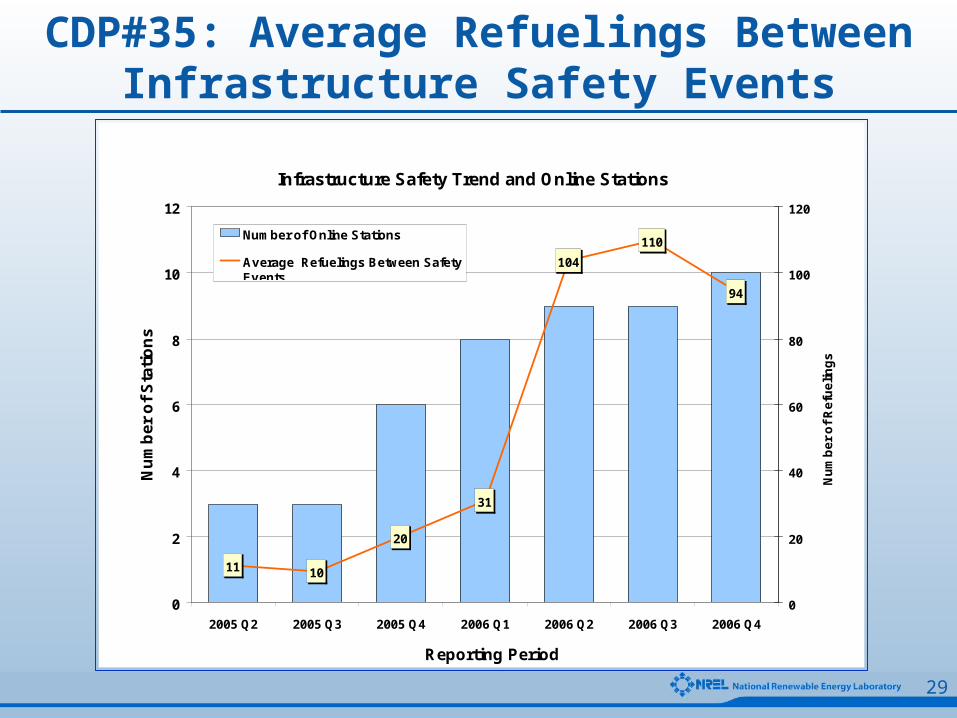
Infrastructure Safety Trend and Online Stations
11 10
20
31
104
110
94
0
2
4
6
8
10
12
2005 Q2 2005 Q3 2005 Q4 2006 Q1 2006 Q2 2006 Q3 2006 Q4
Reporting Period
Nu
mb
er o
f S
tati
on
s
0
20
40
60
80
100
120
Nu
mb
er
of
Re
fue
lin
gs
Number of Online Stations
Average Refuelings Between SafetyEvents
Created 28-Feb-2007
CDP#35: Average Refuelings Between Infrastructure Safety Events

30
CDP#36: Type of Infrastructure Safety Event By Quarter
Type of Infrastructure Safety Event by Quarter Through 2006 Q4
0
2
4
6
8
10
12
14
16
18
2005 Q2 2005 Q3 2005 Q4 2006 Q1 2006 Q2 2006 Q3 2006 Q4
Reporting Period
Nu
mb
er o
f E
ven
ts
IncidentNear MissNon-EventStations OnlineAverage # Events/Station
Created 07-Mar-2007
31
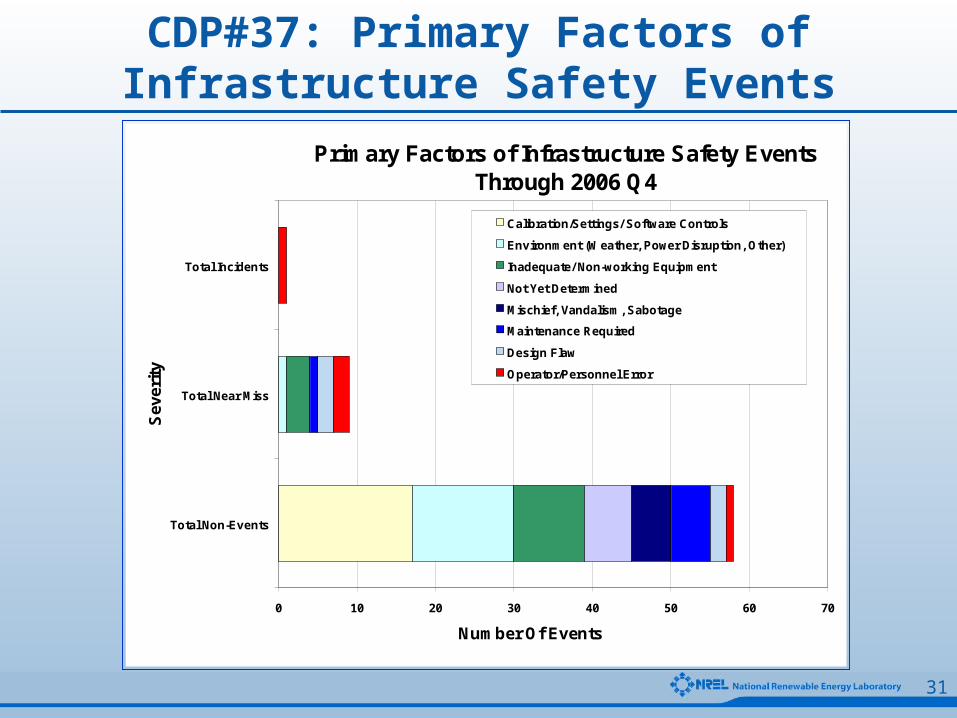
CDP#37: Primary Factors of Infrastructure Safety Events
Primary Factors of Infrastructure Safety Events Through 2006 Q4
0 10 20 30 40 50 60 70
Total Non-Events
Total Near Miss
Total Incidents
Sev
erit
y
Number Of Events
Calibration/Settings/ Software Controls
Environment (Weather, Power Disruption, Other)
Inadequate/ Non-working Equipment
Not Yet Determined
Mischief, Vandalism, Sabotage
Maintenance Required
Design Flaw
Operator/Personnel Error
Created 07-Mar-2007

32
CDP#38: Refueling Times
0 2 4 6 8 10 12 14 16 18 200
102030405060708090
100110120130140150160170180190200210220230240250
Time (min)
Nu
mb
er o
f F
uel
ing
Eve
nts
Histogram of Fueling TimesAll Light Duty Through 2006Q4
Created: Feb-28-07 1:43 PM
>
33
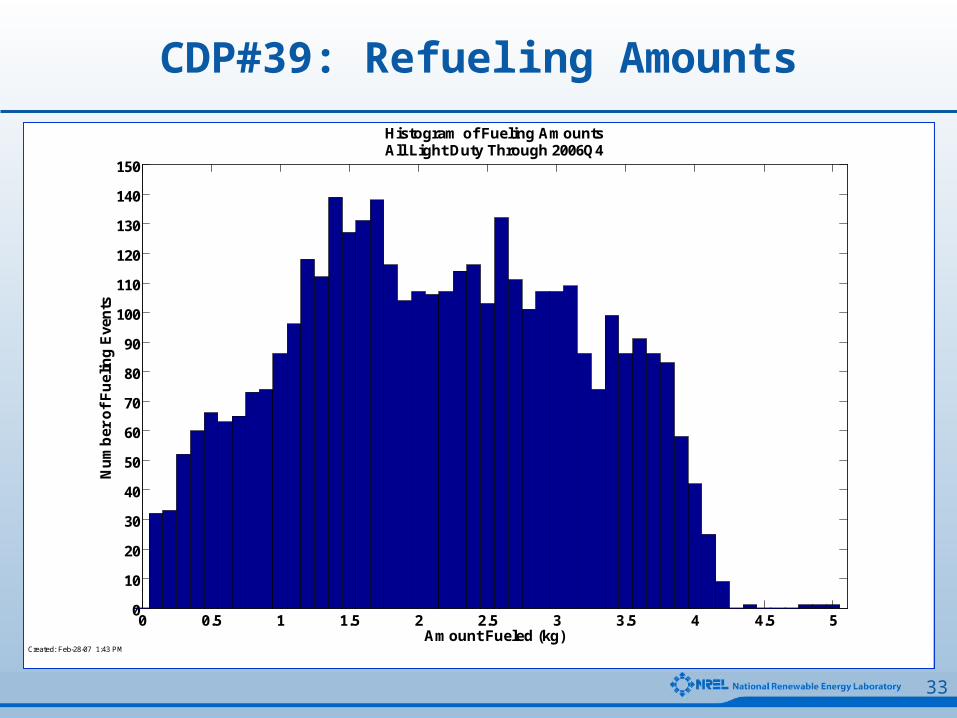
0 0.5 1 1.5 2 2.5 3 3.5 4 4.5 50
10
20
30
40
50
60
70
80
90
100
110
120
130
140
150
Amount Fueled (kg)
Nu
mb
er o
f F
uel
ing
Eve
nts
Histogram of Fueling AmountsAll Light Duty Through 2006Q4
Created: Feb-28-07 1:43 PM
CDP#39: Refueling Amounts