Technical Report No. 49 July 1971 Project Completion Report · Technical Report No. 49 July 1971...
56
THERMAL PROPERTIES OF SEA WATER by James C. S. Chou Technical Report No. 49 July 1971 Project Completion Report of PROPERTIES OF SEA WATER OWRR Project No. A-02S-HI, Grant Agreement No. 14-31-0001-3011 Principal Investigator: James C. S. Chou Project Period: July 1,1969 to June 30,1971 The programs and activities described herein were supported in part by funds provided by the United States Department of the Interior as authorized under the Water Resources Act of 1964, Public Law 88-379.
Transcript of Technical Report No. 49 July 1971 Project Completion Report · Technical Report No. 49 July 1971...

THERMAL PROPERTIES OF SEA WATER
by
James C. S. Chou
Technical Report No. 49
July 1971
Project Completion Report
of
THERI~AL PROPERTIES OF SEA WATER
OWRR Project No. A-02S-HI, Grant Agreement No. 14-31-0001-3011
Principal Investigator: James C. S. Chou
Project Period: July 1,1969 to June 30,1971
The programs and activities described herein were supported in part by funds provided by the United States Department of the Interior as authorized under the Water Resources Act of 1964, Public Law 88-379.

ABSTRACT
The interpotation fopmulae fop vapop ppessupes, specific volumes, enthatpies and heats of vapoPization of opdinaPY sea ~atep have been detePmined in the tempepatupe Pange 0° to 200°C fop satinities of 0 to 120 ppt, based on the published data. These fopmutae may facilitate calculations fop designing desalting evaporators. The accupacies of vapor ppessupe data ~epe found insuffiaient; ho~evep, the accupate measupements of vapor pressupes by otheps are in progPess. A ctose corpelation ~as found be~een the aompressibitities of sea ~ater and those of aqueous sodium chloride solution at tow temperatures. Because the tack of experimentat data on aompressibitities of sea water at eZevated temperatupes, comppessibilities of aqueous sodium chloPide sotution for pressures up to 350 atmospheres are used as apppoximations to those of sea water in ordep to account fop the effect of ppessure on othep thermat ppoperties.
iii


CONTENTS
LIST OF TABLES ........ ,..,..,.,.,.,. ........... ",.,. ... ,. .. " .... ,.,..,..,.,. ... ,. .... ,. ... v
INTRODUCTION,. ................ " .. " .... ,. ...... " . ., .. " " .. ,. ., .. ,. • ,. .............. ., ., ..... 1
VAPOR PRESSURE .. I' .................... ., ...... ., It .. ., ., ., • ,. • ., .... " • ., • ., ., ., ., .. ., .. ., ...... ., " • ., .......... 3
SPECIFIC VOLUME ..•.•......................•.......................... 11
ENTHALPY AND HEAT OF VAPORIZATION ...........•........................ 24
SUMMARY .... ., • ., . ., ., ... ., ., ... ., .......... ., ., ..... ., ., ., .. ., ., .. ., ........ ., .. ., ........................ ., .... ., ... 37
RE FERENCES" .. ., ., ., ... ., ..... ., . ., ., ., .... ., .... ., ., .. ., " .... " ., ., .. ., .. ., ., .. ., ., .... ., .......... ., .. ., ........ ., .... ., 40
APPENDI CES . ., ., ., ., ..... ., .. ., ., ., ., . ., .. ,. ..... ., .. ., ..... ., .... ,. ., . ., ...... ., ........ ., ...................... 43
LIST OF TABLES
Vapor Pressure of Water .............................•.............. 4 2 Comparison of Calculated Boiling Point Elevations,oC ............... 9 3 Comparison of Vapor Pressure Lowerings, mm Hg ..•.................. 10 4 Specific Volume of Water .......................................... 13 5 Comparison of Specific Volumes at 34.99 ppt Salinity ..•........... 16 6 Comparison of Specific Volumes at Low Pressure .................... 18 7 Comparison of Partial Derivatives of Specific
Volume with Respect to Pressure ................................... 23 8 Enthalpy at 25°C and 1 Atmosphere ................................. 26 9 Enthalpy of Saturated Water ....................................... 27
10 Specific Heat of Water ........................................•... 29 11 Enthalpy Difference between Compressed and Saturated
Water ......... "." .... ""."" .. ".""."""""" .. "."."." .. "." ... "".,, ...... 30 12 Constant-Pressure Specific Heat of Sea Water near
Vapor Pressure ... "" ..... "."" .. "."." ... " .... " .. """"""" .. " .......... 31
13 Values of cp minus cf ............................................. 32 14 Comparison of Specific Heats ...................................... 33 15 Enthalpy in Calories per Gram ..................................... 35 16 Comparison of Enthalpies .......................................... 36
v


INTRODUCTION
Oceanography is a science which depends upon the measurements of
physical properties of the sea. Although early explorers occasionally
recorded natural phenomena of their environment at sea, the systematic
measurements of thermal properties of sea water was embarked only in
the beginning of this century. For oceanographic work, the interest is
limited to a temperature range of 0° to 40°C and for salinity up to
40 ppt. Recently there has been a growing concern to extend the measure
ments over a wider range because of the increasing importance of con
verting sea water to potable water. The objective of this study is
to compare available data and to formulate equations for the calculations
of vapor pressures, specific volumes, enthalpies, and heats of vapori
zation in the region of 1 to 350 atmosphere pressure, 0° to 150°C temper
ature and 0 to 12 percent salt weight.
No equation can be found to represent the relations among the pro
perties of substance in an absolutely correct manner without complete " understanding of the fundamental nature of substance. The Debye-Huckel
theory explains the behavior of strong electrolytes in very dilute solu
tions but fails to fit the experimental results accurately for solutions
with salts higher than 0.1 mole per 1,000 grams of solvent. The real
nature of electrolytic solutions has yet to be discovered. Several mod-" ified versions of the Debye-Huckel equations have been proposed for fit-
ting data at higher concentrations and, as a rule, extra terms are added
to the basic equation without sound justification. Equations that cor
relate data are designated as empirical if they are not derived from
established physical laws or theories. In reality, all the modified " Debye-Huckel equations are empirical equations. An equation which
adequately represents the property relations, even if it is empirical,
can be used to interpolate experimental data, to facilitate calculations,
and to provide a concise representation of a large mass of data. An
efficient evaluation of the properties is nearly impossible without inter-
polation formulae. It hoped that some formulae in this report can
be helpful to the solutions of certain practical problems. Some of the
rather cumbersome formulae developed by this study would be definitely
impractical in pre-computer days, but they present no difficulty today.

2
The sea constantly loses a great amount of pure water by evaporation
and receives an equal amount through atmospheric cycle and streamflow.
Sea water is an aqueous solution with dissolved materials mostly in the
form of ions. Since all chemical elements on earth are represented in
sea water, the exact determination of the composition of sea water is
difficult and nearly impossible. The major constituents of the dissolved
salts were first determined by Dittmar (1884) who made careful analyses
of samples collected from three oceans. It was found that, regardless
of the absolute concentration of the total solids which vary from about
34 to 38 ppt, the relative proportions of the major constituents are
constant to within 10 ppm except in regions of high dilution. For most
practical applications, it is only necessary to know the concentration
of one major constituent in order to determine the concentrations of
others. In fact, the validity of many published data on physical pro
perties of sea water depends upon the assumption that the ionic ratios
of the constituents are substantially constant. To simplify the problem,
sea water is considered as an aqueous solution of a constant chemical
composition in the present study and is treated as if it were a binary
solution, although each constituent makes a certain contribution to
the thermal properties.
The residue of completely evaporated sea water is a complex in
organic mixture together with a small but variable proportion of organic
materials. Salinity is a definitive property which is approximately
equal to the total amount of dry solids in grams contained in one kilo
gram of sea water. Salinity, under such a definition, is not equivalent
to the total salt content. Estimates of total salt content made by
Lyman and Fleming (1940) show that the ratio of total salt content to
salinity is 1.0046. Although information on the physical properties of
sea water is frequently found in literature in terms of salinity, the
direct determination of salinity is rarely ever carried out because
the process is too difficult and slow. The oldest, and still often
applied, method of determining salinity is based on the determination of
the chlorine content by titration with lver nitrate, assuming that
there a linear relationship between chlorinity and salinity. The
term chlorinity internationally defined as parts of equivalent
chloride per thousand parts of sea water and the ratio of salinity to

chlorinity is close to 1.811. Other indirect methods of determining
salinity incl.ude the measurements of electrical conductivity, density,
sound velocity, or refractive index. The difficulty of accurate deter
mination of the salt content, in addition to the lack of truly repre
sentative samples, causes considerable discrepancies in experimental
data. As a consequence, the interpolation formulae for thermal pro
perties of sea water can not be expected to be as precise as those for
pure water or laboratory-prepared solutions.
VAPOR PRESSURE
A great deal of laboratory work has been done on-the measurements
of the physical properties of water in the last century. In 1963, the
Sixth International Conference on the Properties of Stream adopted the
latest International Skeleton Tables which constitute a criterion to
judge the reliability of steam tables (Meyer, et aZ' J 1967), There
no restriction on the interpolation formulae so long as the formulae
can reproduce data in satisfactory agreement with data which were
internationally agreed upon. An equation which fits the vapor pressure
data of ordinary pure water from 0° to 170°C is as follows:
In p = 71.023834 - 7380.400l/T - 9.0977349 InT w
+ 0.0070871862T (1)
where Pw the pressure in bars and T is the temperature in degrees
3
Kelvin, given by the relation, T = 273.15 + t, where t is the centigrade
temperature on the international scale. If the first coefficient is
changed to 71.010771, the pressure unit becomes atmosphere. The form
of this equation was originally suggested by Nernst because heat of
vaporization may be expressed in the form of a power series. Table 1
shows how well Equation (1) fits the experimental data. The standard
error of estimate of Pw is 0.00147 bars.
Among many different empirical forms of equation for vapor pressure,
another interesting one is the Antoine equation,
In Pw (2)

4
TABLE 1. VAPOR PRESSURE OF WATER.
VAPOR PRESSURE (BAR)
t,OC ICST DATN: DATN::: DIFFERENCE
0 0.005108 0.005107 0.000001
0.01 0.006112 0.006111 0.000001
10 0.012271 0.012273 -0.000002
20 0.023368 0.023344 0.000024
30 0.042418 0.042429 -0.000011
40 0.073750 0.073765 -0.000011
50 0.12335 0.12336 -0.00001
50 0.19919 0.19919 0.0
70 0.31151 0.31158 0.00003
80 0.47358 0.47353 0.00005
90 0.70109 0.70103 0.00005
100 1. 01325 1. 0 1325 0.0
110 1.4327 1.4329 -0.0002
120 1.9854 1. 9859 -0.0005
130 2.7011 2.7022 -0.0011
140 2.5136 3.5152 -0.0025
150 4.7597 4.7515 -0.0029
150 6.1804 6.1819 -0.0015
170 7.9202 7.9197 0.0005
l(DATA RECOMMENDED BY THE SIXTH INTERNATIONAL CONFERENCE ON STEAM TABLES (MEYERJ et al., 1957).
::::DATA DERIVED BY USING EQUATION (1).
TOLERANCE
(+ OR -)
0.000006
0.000006
0.000010
0.000020
0.000030
0.000038
0.00006
0.00010
0.00016
0.00024
0.00036
0.0
0.0010
0.0013
0.0015
0.0021
0.0032
0.0042
0.0053
The best values of the coefficients for fitting the vapor pressure data
of water from OOto 170°C are:
A = 11.809452, B = -3902.2336, C = -42.407613
for the unit pressure in bars and temperature in degrees Kelvin. The
standard error of estimate of p is 0.00525 bars. The upper limit on w
the magnitude of the relative error, defined as the ratio of the
difference between the recommended data and the calculated data to the
calculated data is 0.397 percent. The Antoine equation does not fit
the data as accurately as the Nernst equation, but it has the advantage
of expressing temperature in terms of pressure explicitly.
The published data on the thermal properties of sea water are
usually restricted to a narrow range of concentration and temperature.

5
Higashi, Nakamura, and Hara (1931) published their measurements of vapor
pressure in the concentration range of 3.5 to 18 percent total solids
by weight and in the temperature range of 25° to 175°C. Their sea
water sample was taken at 1.5 meters below the surface along the coast
of Mizushima, Japan where the depth of the water was 10 meters. Solu
tions of high concentration were obtained by evaporating the sea water
at 50°C. Some precipitates (CaC0 3 and CaS04) appeared during concen
tration and the samples of concentrated solutions were filtered.
Arons and Kientzler (1954) of Woods Hole Oceanographic Institute made
measurements in 1953 over the same concentration range at temperatures
between freezing points and 25°C. Concentration was determined by
sil ver nitrate titration and expressed in chlorinity,. which is inter
nationally defined as the total amount of chlorine, bromine, and iodine
in grams contained in one kilogram of sea water, assuming that the
bromine and the iodine had been replaced b} chlorine. Large discrepancies
were found when their results were compared with Higashi's measurements
at 25°C, although their data were claimed to be in reasonably good agree
ment with Witting's (1908) at chlorinities of 10 and 20 ppt.
The vapor pressure p of a salt solution may be expressed by the
Othmer equation as a function of the salt concentration and vapor pres
sure p of pure water without directly specifying the temperature: w
In p = f1 (x) In Pw + f2 ex)
where f1 ex) and f2 ex) are the empirical functions to be found by curve
fitting. For aqueous sodium chloride solutions, Chou (1968) showed that
the following form of the Othmer equation can fit the data to a degree
of experimental precision:
Equation (3) satisfies the condition that p equals Pw when the con
centration of salts in sea water is zero. Based on the smoothed data
by Arons and Kientzler in the region from 10 to 160 ppt chlorinity and
OOto 175°C, the best values of coefficients for sea water with concen-
tration x in ppt ch10rinity were found to be:
a = 0.54675794 x 10- 4 b = -0.15410306 X 10- 5
c = -0.99478110 X 10- 3 d = 0.11895489 X 10- 3
e -0.137l6509 x 10- 4
6
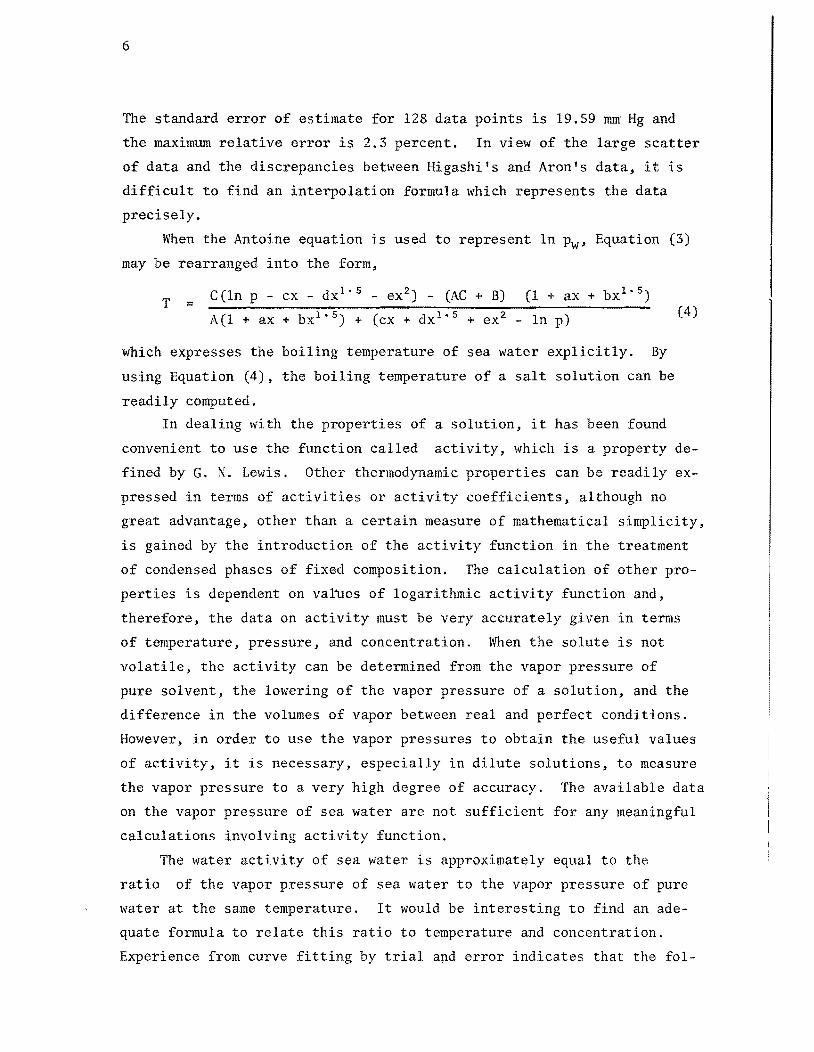
The standard error of estimate for 128 data points is 19.59 mm' Hg and
the maximum relative error is 2.3 percent. In view of the large scatter
of data and the discrepancies between Higashi's and Aron's data, it is
difficult to find an interpolation formula which represents the data
precisely.
When the Antoine equation is used to represent In Pw' Equation (3)
may be rearranged into the form,
T = CCln p - cx - dX 1•
5 - ex2
) - CAe + B) (1 + ax + bX 1•
5)
A(l + ax + bX 1•
5) + (cx + dX 1 ' 5 + ex 2 - In p)
which expresses the boiling temperature of sea water explicitly. By
using Equation (4), the boiling temperature of a salt solution can be
readily computed.
(4)
In dealing with the properties of a solution, it has been found
convenient to use the function called activity, which is a property de
fined by G. N. Lewis. Other thermodynamic properties can be readily ex
pressed in terms of activities or activity coefficients, although no
great advantage, other than a certain measure of mathematical simplicity,
is gained by the introduction of the activity function in the treatment
of condensed phases of fixed composition. The calculation of other pro
perties is dependent on values of logarithmic activity function and,
therefore, the data on activity must be very accurately given in terms
of temperature, pressure, and concentration. When the solute is not
volatile, the activity can be determined from the vapor pressure of
pure solvent, the lowering of the vapor pressure of a solution, and the
difference in the volumes of vapor between real and perfect conditions.
However, in order to use the vapor pressures to obtain the useful values
of activity, it is necessary, especially in dilute solutions, to measure
the vapor pressure to a very high degree of accuracy. The available data
on the vapor pressure of sea water are not sufficient for any meaningful
calculations involving activity function.
The water activity of sea water is approximately equal to the
ratio of the vapor pressure of sea water to the vapor pressure of pure
water at the same temperature. It would be interesting to find an ade
quate formula to relate this ratio to temperature and concentration.
Experience from curve fitting by trial and error indicates that the fol-

lowing form is a satisfactory equation for a salt solution:
In L ::: Pw
ax + bX 1 ' 5 + cx2 + (dx + ex 1 • 5 + fx2)/T
+ (gx + hX 1 ' 5 + ix2) In T
7
(5)
For the smoothed data given by Arons and Kientzler in the 10 to 160 ppt
range of chlorinity and 0° to 175°C temperature region, the least squares
method has been used to determine the best values of the coefficients.
With the temperature in degrees Kelvin and the concentration in chlori
nity, the results are:
a = -0.051807014 b -0.66809879 x 10- 2
c = 0.68897827 X 10- 3 d = 2.153011
e = 0.38508979 f = -0.037231985
g = 0.75964905 X 10- 2 h ::: 0.97136709 X 10- 3
i ::: -0.10158384 X 10- 3
In this case, the standard error of estimate of In p/Pw on T and x is
0.00423.
Arons and Kientzler correlated their data by plotting the logarithm
of vapor pressure lowering versus the reciprocal of absolute temperature.
An effort was made to replace the logarithm plots of vapor pressure
lowering directly with In pip to create an equation similar to Equation w (S). Unexpectedly, the values of vapor pressure lowering can be esti-
mated more accurately with Equation (5).
A systematic study of the thermodynamic properties of aqueous solu
tions of the major components of sea water was carried out by Fabuss and
Korosi (1966, 1968). Vapor pressures of binary and ternary solutions
were measured at concentrations corresponding to that of sea water and
its concentrates up to fivefold concentrations over the 2S0to 150°C
temperature range. The results were correlated by applying the additivity
rule of Robinson and Bower which states that the lowering of vapor pres
sure of an aqueous solution containing two salts, A and B, can be com
pounded additively from the vapor pressure lowerings of a solution con
taining salt A alone and another solution containing salt B alone at the
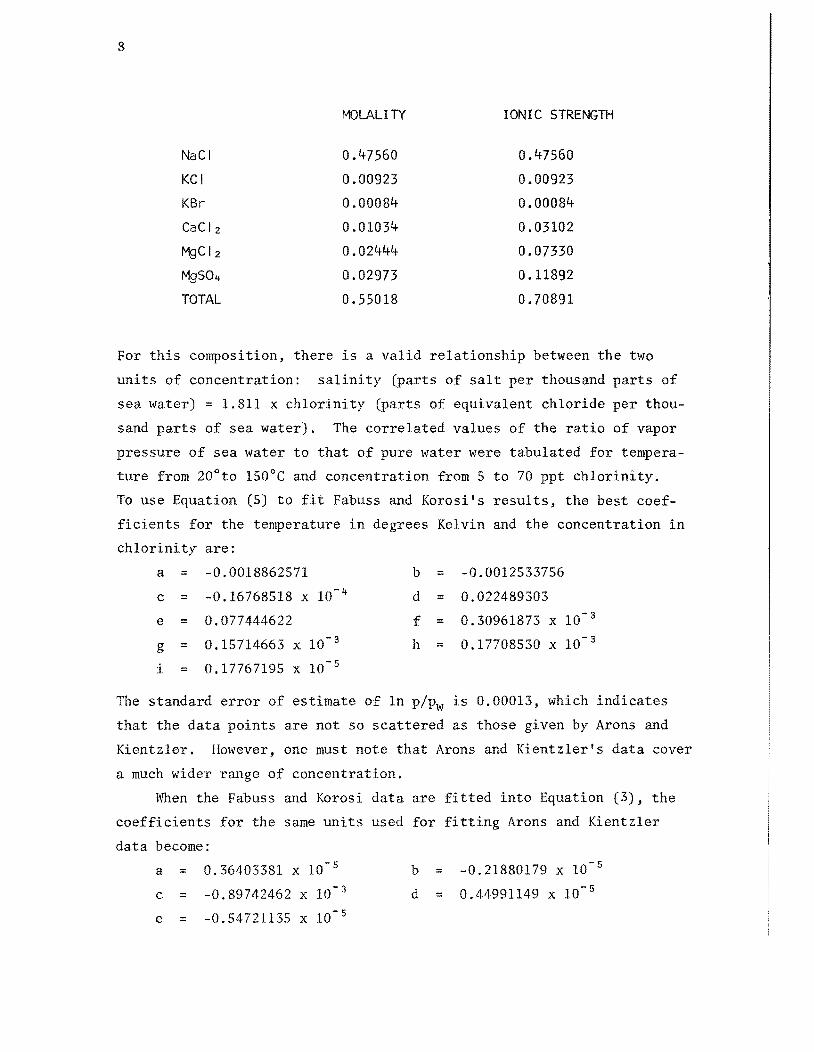
total ionic strength of the mixed solution. The normal composition of
sea water was simulated as follows:
8
MOLALITY IONIC STRENGTH
NaCI 0.47560 0.47560
KCI 0.00923 0.00923
KBr 0.00084 0.00084
CaClz 0.01034 0.03102
MgClz 0.02444 0.07330
MgS04 0.02973 0.11892
TOTAL 0.55018 0.70891
For this composition, there is a valid relationship between the two
units of concentration: salinity (parts of salt per thousand parts of
sea water) = 1.811 x chlorinity (parts of equivalent chloride per thou
sand parts of sea water). The correlated values of the ratio of vapor
pressure of sea water to that of pure water were tabulated for tempera
ture from 20° to 1S0°C and concentration from 5 to 70 ppt ch1orinity.
To use Equation (5) to fit Fabuss and Korosi's results, the best coef
ficients for the temperature in degrees Kelvin and the concentration in
ch10rinity are:
a = -0.0018862571 b = -0.0012533756
c = -0.16768518 X 10- 4 d = 0.022489303
e = 0.077444622 f = 0.30961873 X 10- 3
g = 0.15714663 X 10- 3 h = 0.17708530 X 10- 3
i = 0.17767195 X 10- 5
The standard error of estimate of In p/pw is 0.00013, which indicates
that the data points are not so scattered as those given by Arons and
Kientzler. However, one must note that Arons and Kientzler's data cover
a much wider range of concentration.
When the Fabuss and Korosi data are fitted into Equation (3), the
coefficients for the same units used for fitting Arons and Kientzler
data become:
a = 0.36403381 x 10- 5
c = -0.89742462 X 10- 3
e = -0.54721135 x 10- 5
b = -0.21880179 X 10- 5
d = 0.44991149 X 10- 5

The standard error of estimate reduced to 0.892 mm Hg. Obviously,
Fabuss and Korosi's data are much better correlated than Arons and
Kientzler's.
9
When sea water gives off vapor by boiling, the condensing tempera
ture of the water vapor is lower than the temperature of the boiling sea
water. The difference between the two temperatures at the same vapor
pressure is called the boiling point elevation. Information on boiling
point elevation is important to the design and operation of an evaporator.
A comparison of the boiling point elevation calculated by Equation (4)
is given in Table 2 at a series of temperatures and concentrations
with the coefficients which give the best fit to the data. The cal
culated values based on Fabuss and Korosi's results are higher than those
based on Arons and Kientzler's. The higher the concentration and the
temperature, the greater the deviation.
TABLE 2. COMPARISON OF CALCULATED BOILING POINT ELEVATIONS~ °C.
WATER CHLORINITY, ppt
TEMP~ °C 19 38 57
(a) (b) (c) (a) (b) (c) (a) (b) 20 0.30 0.29 0.28 0.65 0.64 0.58 1.06 0.04
40 0.34 0.34 0.31 0.75 0.75 0.64 1.23 1.23
60 0.40 0.40 0.33 0.88 0.88 0.70 1.44 1.43
80 0.47 0.46 0.36 1. 02 1.01 0.77 1.66 1.65
100 0.53 0.52 0.39 1.16 1.15 0.83 1.86 1.89
120 0.59 0.59 0.42 1.29 1.30 0.90 2.08 2.14
140 0.66 0.66 0.45 1.42 1.46 0.97 2.28 2.41
160 0.71 0.74 0.48 1. 54 1.64 1.04 2.48 2.69 ---- ".~"""..., .. -",-.......... -"",-, .. -,.,--..... ~ ---...----------
(a) CALCULATED BY FABUSS AND KOROSI (1968) (b) CALCULATED FROM EQUATION (4) WITH THE BEST COEFFICIENTS TO FIT
THE RELATIVE VAPOR PRESSURES B( FABUSS AND KOROS I
CC) 0.96
1.06
1.17
1.29
1.41
1.54
1.66
1. 79
(c) CALCULATED FROM EQUATION (4) WITH THE BEST COEFFICIENTS TO FIT THE ARONS AND KIENTZLER DATA ON VAPOR PRESSURE LOWERING (1954).
The work by Fabuss and Korosi covers concentrations ranging from
5 to 70 ppt chlorinity, while Arons and Kientzler's data encompass the
concentrations from 10 to 160 ppt chlorinity. Calculations have been
done to check the values reported in Table 2 under column (c), which

10
were based on Arons and Kientzler's data from 10 to 160 ppt chlorinity,
with a different set of coefficients for Equation (4) to fit their data
from 10 to 70 ppt. No significant difference was found. Apparently,
there is a basic discrepancy among the data from the two sources.
Table 3 gives a comparison of the vapor pressure lowerings calculated
by Equations (2) and (3). Again, large discrepancies are evident at
the high concentrations and temperatures.
TABLE 3. COMPARISON OF VAPOR PRESSURE LOWERINGS, mm Hg.
CHLORINITY opt
Cal (c) Co) (D) (c)
10 lB.5 2".1 33.5 9.7 12.3 16.3 ".75 5.71 7.08 2.31 2.69 0.74 0.79 0.86 0.20 0.22 0.22
20 "1.0 47.1 70.5 21.1 24.1 34. 10.2 ILl 1'+.8 4.40 4.49 5.61 1.5'+ 1.54 1.78 0.43 0.43 0.'+5
30 65.8 72.4 111 34.0 40.0 53.6 16.4 17.0 23.2 7.08 6.85 3.79 2.50 2.34 2.79 0.68 0.65 0.71
40 94.5 101 154 h9.3 51.5 74.6 23.9 23.6 32.3 9.99 9.49 12.2 3.58 3.23 3.87 0.92 0.89 0.98
50 128 135 2Q1 66.5 68.4 97.0 32.1 31.2 42.0 13.2 12.5 15.8 4.75 4.22 5.03 1.24 1.15 1. 27
60 168 174 250 86.2 87.5 121 41.0 39.7 52.3 16.6 15.8 19.7 5.96 5.33 6.25 1.58 1."5 1.58
70 213 217 303 108 109 146 52.0 49.3 63.2 21.1 19.5 23.8 7.41 6.56 7.54 1.88 1.77 1.90
---_ ....... __ ._--------------------------(1954)
WITH THE BEST COEfFICIENTS TO FIT THE ARONS AI\[) KIENTZlER DATA WITH TH" BEST COEFFICIENTS TO FIT THE .~ELAnVE VAPoR PRESSURES BY
Forrest and Worthley (1964) reported their measurements on sea water
from St. Vincent, South Australia in the temperature range from lOOto
100oe. A detailed comparison of their data with others is impractical,
as their concentrations are expressed as percentage of magnesium ions
by weight. Nevertheless, an interpolation of their tabulated values shows
that the vapor pressure lowering at 1000 e and 70 ppt chlorinity is about
75 mm Hg., which is much higher than the correspondent value in Table 3;
however, their data at 2Soe agree exactly with Arons and Kientzler's.
Since the data from direct measurements are scarce and doubtful at
high temperatures and concentrations, Equations (3), (4), and (5) with
the coefficients based on Fabuss and Korosi's data can furnish values
expediently for engineering purposes. The estimates of vapor pressure
and boiling temperature of sea water are as good as estimates which are
available at present from other sources. The reliability of Fabuss and
Korosi's results is dependent on the validity of additivity rule. Lind
say and Liu (1968) made careful measurements and analyses on vapor pres-

11
sure lowerings of a three-salt simulant for sea water at a concentration
of 29 ppt chlorinity. At 125°C and above, the deviation of the cal
culated values by the additivity rule from the experimental values was
found to be within the 5 percent or better validity claimed by Robinson
and Bower, the inventor of the rule; however, the deviation at 106°C
was much higher than 5 percent.
Fabuss and Korosi's results are further supported by Stoughton and
Lietzke (1965) who calculated the vapor pressures of sea water from the
vapor pressure data for aqueous NaCl solutions by fitting the limiting
slope of an extended Debye-Hlickel equation. Up to the concentration of
15 percent salt by weight, the discrepancies between the results obtained
by using the extended Debye-Hlickel ~quation and those calculated by means
of the simple Raoult's Law are within ±O.loC of the boiling point eleva
tion. There is no way to ascertain the degree of accuracy of the present
data derived from the vapor pressures of solutions other than for sea
water. It is doubtful that the boiling point elevations reported in
literature are accurate to within 5 percent throughout the range of in
terest. Although Equations (3), (4), and (5) with the coefficients
based on Fabuss and Korosi's data might be sufficient for engineering
applications, further direct measurements of high precision are desirable.
Accurate determination of boiling point elevation of sea water by Bromley
(1970) is in progress and the results will be available soon.
SPECIFIC VOLUME
Since most of environmental processes of mankind ultimately depend
on the unique physical properties of water, numerous measurements of the
p-v-T properties of water have been carried. The early data have been
compiled by Dorsey (1940). Published values to 1 part per million over
the range of OOto 40°C at 1 atmosphere are available. Because of the
isotopic composition, the sixth decimal of the values of water density
has hardly any significance.
Liquids have neither the rigid geometrical structure of solids nor
the complete randomness of gases. Hence, the theory of the behavior of
a liquid not well developed because there are no clear-cut limiting
cases, such as the crystalline phase at absolute zero temperature for

12
solids and the perfect gas for the real gases. Numerous equations of
state have been developed over the years, but most of them can be applied
only to gases. To deal with liquids, tables, graphs, or power series
are usually used instead. An empirical equation used for describing
the p-v-T relation of a liquid is generally more cumbersome than that
for a gas. The problem of fitting the p-v-T data of water into an
equation is further complicated by the unique properties of water. Nearly
all material substances expand when heated and contract when cooled, but
water only partially follows this rule. At temperatures below 4°C it
expands with further cooling. Its freezing and boiling points should
be much lower in comparison with other chemically related compounds. Of
the many interpolation formulas that may be found in the literature for
the specific volume of water, none is simple even within a small tempera
ture range.
In this study, the data for the specific volume of water are based on
those recommended by the Sixth International Conference on Steam Tables
(Meyer, et aZ,,, 1967). Since the absolutely pure water only a "lab
oratory curiosity," the accuracy of the recommended data is amply suf
ficient for engineering use. The following mathematical expression was
arbitrarily chosen to fit these data:
v = ACT) + P • BCT) + p2 • CCT) (6)
where v is the specific volume in cubic centimeters per gram, p is the
pressure in bars, and T the temperature in degrees Kelvin. The three
functions of temperature for specific volumes in the temperature range
between OOto 180°C for pressures up to 1,000 bars have been found as fol
lows:
ACT) =
BeT) =
C CT) =
6.0144854 - 0.010534515T + 0.93870049 x 10-sT2
l15l.3402/T + 102807.62/T2
-0.18255854 X 10- 4 + 0.91609812 x 10⁻⁶T - 0.18469734 x
10-sT2 - 0.05376905/T + 3.8567955/T2
-0.18454378 X 10- 6 + 0.29498505 x 10⁻⁹T +
0.30447954 lO-4/T
The values calculated from Equation (6) are compared in Table 4 with
the accepted values. The deviations of the calculated values from the
data are within the tolerances accepted by the Sixth International Con-

13
TABLE 4. SPECIFIC VOLUME OF WATER.
SP. VOL. Cll1'/g TOLERPNCE
t, °C p, BARS leST DATA" EST. DATA"" DlFF. +00-
0.0 0.006108 1. 0002l 1.00023 -0.00002 0.00005 0.01 0.006112 1.00021 1.00023 -0.00002 0.00005
10.00 0.012271 1.00040 1. 00035 a 00004 0.00010 20.00 0.0233&8 1.00180 1. 00182 -0.00002 0.00010 30.00 0.042418 1. 00440 1.00438 0.00002 0.00010 40.00 0.073750 1.00790 1.00786 0.00004 0.00010 50.00 0.123350 1.01210 1.01214 -0.00004 0.00020 60.00 0.199190 1. 01710 1.01712 -0.00002 0.00020 70.00 0.311610 1. 02280 1.02277 0.00003 0.00020 80.00 0.473580 1. 02900 1.02904 -0.00004 0.00030 90.00 0.701090 1. 03590 1.03592 -0.00002 0.00030
100.00 1. 013249 1. 04350 1.04342 0.00008 D. 00030 110.00 1.432699 1. 05150 1.05154 -0.00004 0.00040 120.00 1. 985399 1.06030 1.06029 0.00001 0.00040 130.00 2.701099 1.06970 1.06970 0.00000 0.00040 140.00 3.613600 1. 07980 1. 07978 O. 00002 0.00040 150.00 4.759700 1. 09060 1.09058 0.00002 0.00040 160. 00 6.180400 1.10210 1.10210 0.00000 0.00040 170.00 7.920199 1.11440 1.11438 0.00002 0.00040 180.00 10.026999 1.12750 1.12743 0.00007 0.00040
0.0 1. 000000 1. 00020 1.00018 O. 00002 0.00010 50.00 1.000000 1.01210 1.01210 0.00000 0.00020 0.0 5.000000 0.99990 0.99997 -0.00007 0.00020
50.00 5.000000 1.01190 1.01192 -0.00002 0.00020 100. 00 5.000000 1. 04330 1. 04322 0.00008 0.00020 150.00 5. 000000 1.09060 1. 09056 0.00004 0.00030
0.0 10.000000 0.99970 0.99972 -0.00002 0.00020 50.00 10.000000 1. 0 1170 1.01170 0.00000 0.00020
100.00 10.000000 1.04310 1.04297 0.00013 0.00020 150.00 10.000000 1.09030 1.09023 0.00007 O. 00030
0.0 25.000000 0.99890 0.99896 -0. 00006 0.00020 50.00 25.000000 1.01100 1.01103 -0.00003 0.00020
100.00 25.000000 1.04230 1.04223 0.00007 O. 00020 150.00 25.000000 1.08940 1.08923 0.00017 0.00030 200.00 25.000000 1.15560 1.15508 0.00052 0.00030
0.0 50.000000 0.99760 0.99770 -0.00010 0.00020 50.00 50.000000 1.00990 1.00993 -0.00003 0.00020
100.00 50.000000 1.04100 1.04099 0.00001 0.00020 150.00 50.000000 1. 08780 1.08758 0.00022 0.00030 200.00 50.000000 1.15310 1.15275 0.00035 0.00030
0.0 75.000000 0.99640 0.99645 -0.00005 0.00020 50.00 75.000000 1.00880 1.00883 -0.00003 0.00020
100.00 75.000000 1. 03980 1.03976 0.00004 0.00030 150.00 75.000000 1.08620 1.08595 0.00025 0.00040 200.00 75.000000 L 15070 1.15044 0.00026 0.00040
0.0 100.000000 0.99520 0.99520 -0.00000 0.00020 50.00 100.000000 1. 00770 1.00774 -0.ooob4 0.00020
100.00 100.000000 1.03860 1.03854 0.00006 0.00040 150.00 100.000000 1. 08460 1. 08433 0.00027 0.00040 200.00 100.000000 1.14830 1.14816 O.OOOlll 0.00040
0.0 125.000000 0.99400 0.99397 0.00003 0.00020 50.00 125.000000 1.006&0 1. 006&5 -0.00005 0.00020
100.00 125.000000 1.03730 1. 03733 -0.00004 0.00040 150.00 125.000000 1.08300 1. 08273 0.00027 0.00040 200.00 125.000000 1.14600 1.14590 0.00010 0.00040
0.0 150.000000 0.99280 0.99275 0.00005 0.00020 50.00 150.000000 1.00550 1. 00557 -0.00007 0.00020
100.00 150.000000 1. 03610 1.03613 -0.00003 0.00040 150.00 150.000000 1.08130 1.08114 0.00016 0.00040 200.00 150.000000 1.14360 1.14367 -0.00007 0.00040
0.0 175.000000 0.99150 0.99154 -0.00004 0.00020 50.00 175.000000 1.00440 1. 00450 -0.00010 0.00020
100.00 175.000000 1.03480 1. 03494 -0.00014 0.00040 150.00 175.000000 1.0798Q 1. 07957 0.00023 0.00040 200.00 175.000000 1.14140 1.14146 -0.00006 0.00040
0.0 200.000000 0.99040 0.99033 0.00007 0.00020 50.00 200.000000 1. 00330 1.00343 -0.00013 0.00020
100.00 200.000000 1. 03360 1.03376 -0.00016 0.00040 150.00 200.000000 1. 07820 1.07801 0.00019 0.00040 200.00 200.000000 1.13910 1.13927 -0.00017 0.00040
0.0 250.000000 0.98800 0.98795 0.00005 0.00020 50.00 250.000000 1.00120 1.00132 -0.00012 0.00020
100.00 250.000000 1. 03130 1.03142 -0.00012 0.00040 150.00 250.000000 1.07510 1.07495 0.00015 0.00040 200.00 250.000000 1.13470 1.13497 -0.00027 0.00040
0.0 275. 000000 0.98680 0.98677 0.00003 0.00020 50.00 275.000000 1. 00020 1.00027 -0.00007 0.00020
100.00 275.000000 1. 03010 1.03026 -0.00016 0.00040 150.00 275.000000 1.07360 1. 07343 0.00016 0.00040 200.00 275.000000 1.13260 1.13286 -0.00026 0.00040
" MEYERS, et al., Cl967). ""DATA DERIVED FROM EQUATION (6).

14
TABLE 4. SPECIFIC VOLUME OF WATER (CONT.).
SP. VOL. cm'Jg TOLERANCE t,1°C P, BARS ICST DATA" EST. DATA'''' DIFF. + OR
0.0 300.000000 0.98560 0.98561 -0.00001 0.00020 50.00 300.000000 0.99920 0.99923 -0.00003 0.00020
100. 00 300.000000 1.02890 1. 02912 -0.00022 0.00040 150.00 300.000000 1.07210 1.07194 0.00016 0.00040 200.00 300.000000 1.13040 1.13077 -0.00037 0.00040
0.0 350.000000 0.98340 0.98330 0.00010 0.00020 50.00 350.000000 0.99720 0.99716 0.00004 0.00020
100.00 350.000000 1.02670 1.02685 -0.00015 0.00040 150.00 350.000000 1.06920 1. 06899 0.00021 0.00040 200.00 350.000000 1.12640 1.12667 -0.00027 O. 00040
0.0 400.000000 0.98110 0.98103 0.00007 0.00020 50.00 400.000000 0.99510 0.99512 -0.00002 0.00020
100.00 400.000000 1.02440 1. 02462 -0.00022 0.00040 150.00 400.000000 1.0661+0 1. 06611 0.00029 0.00040 200.00 400.000000 1.12240 1.12266 -0.00026 0.00040
0.0 450.000000 0.97880 0.97880 -0.00000 0.00020 50.00 450.000000 0.99320 0.99311 0.00009 0.00020
100.00 450.000000 1.02220 1. 02242 -0.00022 0.00040 150.00 450.000000 1. 06360 1. 06329 0.00031 0.00040 200.00 450.000000 1.11860 1.11875 -0.00015 0.00040
0.0 500.000000 0.97660 0.97661 -0.00001 0.00020 50.00 500.000000 0.99120 0.99112 0.00008 0.00030
100.00 500.000000 1.02000 1. 02026 -0.00026 0.00040 150.00 500.000000 1.05090 1.06053 0.00037 0.00050 200.00 500.000000 1. 11480 1.11493 -0.00013 0.00050
0.0 550.000000 0.97450 0.97446 0.00004 0.00030 50.00 550.000000 0.98920 0.98916 0.00004 0.00030
100.00 550. 000000 1. 01780 1.0181" -0.00034 0.00040 150.00 550.000000 1. 05820 1.05783 0.00037 0.00050 200.00 550.000000 1.11110 1.11121 -0.00011 0.00050
0.0 600.000000 0.97230 0.97234 -0.00004 0.00030 50.00 600.000000 0.98730 0.98722 0.00008 0.00030
100.00 600.000000 1.01570 1. 01605 -0.00035 0.00.04.0 150.00 600 . .000000 1. .05560 1..05519 0.00041 0.00050 200.00 6.00.000000 1.1.075.0 1.10759 -0 • .00.0.09 .0 • .00.05.0
0.0 650.000000 0.97.030 0.97026 .0.00.0.04 .0 • .00.030 5.0.00 650.0.00000 .0.9854.0 0.9853.0 0.00010 0.0.0.03.0
100 • .0.0 65.0.000000 1..0137.0 1. 01399 -.0 . .0.0.029 0.0.0.04.0 150.00 650 • .00000.0 1..053.0.0 1. .05261 0 • .00.039 0 • .0.0050 200.00 650.000000 1.1.0400 1.101,07 -0.00007 .0 • .0.005.0
0.0 7.00.000.000 0.9682.0 .0.95821 -0.00001 .0 • .0.0.030 50.00 700.00.0000 0.98360 0.98341 0.00019 0.00030
100.00 700.000000 1. .ol160 1.01197 -0.00037 0.00040 150.00 700.0.00000 1. .05.050 1..050.09 0 • .00.041 0.0005.0 200.00 70.0.0.000.00 1.10060 1.1.0064 -.0 .0.0004 0 • .00.050
0 • .0 750.000000 0.96620 .0.96521 -.0.00001 0.0003.0 50.00 750.000000 0.98180 0.98155 0.00025 0.00030
100.00 750.000000 1.00960 1. 00999 -0.nD039 0.00040 150.00 750.000.000 1.048cro 1. 04764 0.00035 0.00050 200.00 750. 000000 1. 09730 1.09731 -0.00001 0.00050
0.0 800.000000 0.96420 0.96424 -0.00004 0.0.0030 50.00 800.000000 0.98000 0.97971 -0.00029 0.00029
100.00 800.000000 1. 00760 1. 00804 -0.00044 0.00040 150.00 800.00.0.000 1.04560 1.04524 0.00036 0.00050 200.00 800.000000 1. 09410 1.09408 0.00002 0.00050
0.0 850.000000 0.95220 0.96231 -0.00011 .0.00030 50. 00 850.000000 0.97820 0.97789 0.00031 0.00030
100.00 850.000000 1.0057.0 1.00613 -0.00043 0.00040 15.0 .00 850.000000 1.04320 1.04291 0.00029 0 • .00050 200.00 850.000000 1..09100 0.09094 0.00006 0.00050
0.0 900.000000 0.96.030 0.96042 -0.00012 0.00030 50.00 900.000000 0.97550 0.97510 .0 .00040 0.00.030
100.00 900.000000 1.00380 1. 00/.26 -0.00046 0.00040 150.00 goo. 000000 1. 04090 1.04064 0.00026 0.00050 200.00 900.00.0000 1. 08790 1.08790 -0.00000 0.00050
0.0 950.00.0000 .0.95840 0.95856 -0.00015 .0.00030 50.00 950.000000 0.97480 0.97434 .0.00046 0.00030
100. 00 950.000000 1. 00190 0.00242 -0.00052 0.00040 150. 00 950.000000 1. .0386.0 1. 03843 0.00017 0.00050 200. 00 950.000000 1. 08480 1.08496 -0.00016 0.00050
0.0 1000.000000 0.95660 0.95675 -0.00015 0.00030 50.00 1000.000000 0.97310 0.97260 0.00050 0.00030
100.00 1000.000000 1. 00000 1.00061 -0.00061 0.00040 150.00 1000.000000 1. 03630 1.03628 O. 00002 0.00050 200.00 1000.000000 1.08180 1. 08212 -0.00032 0.00050
" MEYERS, et al.. 1967. ""DATA DERIVED FROM EQUATION (6).

15
ference on Steam Tables, with few exceptions. The function ACT) may be
interpreted as the specific volume in a hypothetical state of zero pres
sure. Since the compressibilities of liquids are in the order of 10- 5
per bar, ACT) is approximately equal to the specific volume at the vapor
pressure, if the temperature is not over lSO°C.
The density of sea water is of great concern in oceanography and
has been determined with extraordinary precision by several oceanographic
laboratories. The latest systematic measurements were done by Wilson
and Bradley (1968) in the salinity range 0 to 40 ppt for temperatures
between OOand 40°C and for pressures between 1 and 1,000 bars. The data
from 795 measurements were fitted into an empirical equation, and the
results were compared with other published data. For the same set of
data, the variation of the forms of the interpolation formula is unlim
ited. Another version of the formula, which can represent the specific
volume of aqueous sodium chloride solutions adequately CRowe and Chou,
1970), has been used to fit the Wilson and Bradley data for sea water,
as follows:
v '. = A (T) + P • B (T) + P 2 • C (T) + s D (T) + s 2 • E (T)
sp • FCT) + S2p • GeT) + Sp2 • H(T) (7)
where s is the salinity in ppt. If s becomes zero, Equation (7) is
reduced to Equation (6). of which the functions A(T), B(T), and C(T)
have already been determined. For sea water in a hypothetical state of
zero pressure, Equation (7) becomes
v = ACT) + s • DCT) + S2 • E(T) (8)
Equation (8) may be used to estimate specific volume at low pres
sure. Since the values of compressibility of liquid are on the order
of 10- 5 per bar, the correction of specific volume for a pressure change
of 10 bar at a given temperature and concentration would not affect the
first three significant figures of the value of specific volume. With
pressure, p, in bars, concentration, s, in ppt salinity, temperature, T,
in degrees Kelvin, and specific volume in cubic centimeter per gram, the
temperature functions pertaining to sea water were found by multiple
regression as follows:

16
DeT) = -0.18709793 x 10- 2 + 0.56979828 x 10- 5T - 0.63673703 x 10- aT2
EeT) = 0.95512317 x 10- 6 + 0.33121172 x 10- aT - 0.24416926 x 10- 10T2
FeT) = 0.25199326 x 10- 5 0.13059294 X 10- 7T + 0.16902530 x 1O- lOT2
G (T) = -0.37331747 x 10- a + 0.17245872 x 10- lOT 0.51083200 x 10- 11tT2
HeT) = -0.28427144 X lO- a + 0.17387053 x 10-lOT 0.26619490 x 1O- 13T2
The standard error of estimate of v on p, s, and Twas 0.00029 cubic centi
meter per gram.
Wilson and Bradley compared their results with the data from hydro
graphic tables and other sources to show that the first three significant
figures are in excellent agreement. Table 5 presents a comparison of the
TABLE 5. COMPARISON OF SPECIFIC VOLUMES AT 34.99 PPT SALINTIY.
SPECIFIC VOLU/IE, CM'/G
t, °c p, BARS (1) (2) (3)
5 0.9730 0.9731 0.9728 200 0.9645 0.9646 0.9646 400 0.9566 0.9565 0.9567
600 0.9489 0.9490 0.9492 800 0.9417 0.9419 0.9421
1000 0.9349 0.9351 0.9354
15 0.9747 0.9747 0.9742 200 0.9664 0.9665 0.0662
400 0.9587 0.9588 0.9586 500 0.9513 0.9515 0.9512 800 0.9444 0.9446 0.9443
1000 0.9377 0.9381 0.9377
25 0.9772 0.9770 0.97&8 200 0.9691 0.9691 0.9689 400 0.9615 0.9616 0.9614 600 0.9542 0.9544 0.9542
800 0.9474 0.9477 0.9474 1000 0.9409 0.9413 0.9409
40 0.9820 0.9825 200 0.9742 0.9746 400 0.9667 0.9671 600 0.9597 0.9600 800 0.9530 0.9533
1000 0.9467 0.9469
(1) FROM NEWTON AND KENNEDY'S EXPERIMENT (1965). (2) BY WI LSON Ai'!) BRADLEy t 5 FORI-1ULA (968). (3) BY EQUATION (7).

17
calculated values from Equation (7) with others at a salinity of 35 ppt.
The density of sea water would be a unique function of the total salt
content if the ratios of constituents are invariant. Since the composi
tion of sea water is not absolutely constant everywhere, it is expected
that the consistency of the physical properties of sea water will be
inferior to its counterpart of ordinary water. Furthermore, the methods
of determining salt concentration are usually not clearly described by
the investigators and the units are often not defined precisely. For de
salination purposes, Equation (7), with the respective temperature
functions, is sufficient to express the specific volume of sea water over
the range of variables considered.
Experimental data on densities of sea water at temperatures above
40°C are more scarce than those below 40°C. Hampel (1950) measured the
density of sea water from the Atlantic Ocean in the temperature range
20° to 90°C for salinities between 32 and 138 ppt. Higashi, Nagamura,
and Hara (1931) sampled sea water on the coast of Mizushima to determine
the densities in the temperature range 0° to 175°C for salinities between
30 to 268 ppt. As a rule, the experimental data from various sources
on the physical properties of sea water are mostly in non-coinciding
ranges of the parameters. Interpolations of the data are always nec
essary for a comparative evaluation of. the reliability of the data.
Fabuss, Korosi, and Shamsulhuq (1966) measured the densities of binary
and ternary aqueous solutions of sea salts and correlated sea water den
sities by calculating the apparent molal volumes of the salt components
of sea water and by finding the interaction constants from others'
experimental data. All the measurements were carried out at pressures
near the atmospheric pressure.
The published data by Fabuss and Korosi (1966) in the temperature
range from 20 0 to lSO°C and the concentration range from S to 70 ppt
ch10rinity can be well represented by the following interpolation formula:
v = 5.5839889 - 0.009661Sl79T + 0.8724311 x lO-sT2 - 10S7.246fT
~ _4 + 95l22.242fTL
- x(0.00638ll748 - 0.31038891 x 10 T
+ 0.47689449 x 10⁻⁷T2) + x2 (0.53558009 x 10⁻⁴
- 0.31012679 x
10-6T + 0.45483252 x 10⁻⁹T2 ). (9)
where v is the specific volume of sea water in cubic centimeter per gram,

18
TABLE 6. COMPARISON OF SPECIFIC VOLUMES AT LOW PRESSURE.
SPECIFIC VOLUME, CC/G COEFFICIENT CHLORINITY, OF ERROR
t,OC PPT DATAl: EST. DATA OF EST. DATA BY EQ. (9)
20 S 0.99S0 0.99S0 -O.OOOOS 30 5 0.9977 0.9977 -0.00005 40 5 1.0012 1.0012 0.0 SO 5 1. 00S4 1.0055 0.00007 60 5 1.0104 1.0105 0.00006 70 5 1.0160 1.0161 0.00010 80 5 1.0221 1.0222 0.00014 90 5 1.0288 1. 0290 0.00014
100 5 1. 0362 1.0363 0.00009 no 5 1. 0440 1.0441 0.00018 120 5 1.0522 1. OS26 0.00039 130 5 1. 0611 1.0617 0.00052 140 5 1.0710 1.0714 0.00035 150 5 1. 0813 1. 0818 0.00041
20 25 0.9689 0.9684 -0.00051 30 25 0.9717 0.9714 -0.00036 40 25 0.9752 0.9751 -0.00016 SO 2S 0.9794 0.9794 -O.OOOOS 60 25 0.9842 0.9842 0.00007 70 25 0.9894 0.9896 0.00014 80 25 0.9952 0.9953 0.00010 90 2S 1. 0014 1. 00 15 0.00013
100 25 1.0081 1.0082 0.00011 110 25 1. 0152 1. 0153 0.00002 120 25 1.0226 1. 0228 0.00017 130 25 1. 0306 1.0308 0.00016 140 25 1. 0393 1.0393 -0.00002 150 25 1.0484 1. 0483 -0.00014
20 50 0.9375 0.9372 -0.0003S 30 50 0.9403 0.9400 -0.00028 40 50 0.9438 0.9434 -0.00018 50 50 0.9478 0.9777 -0.00011 60 SO 0.9523 0.9522 -0.00005 70 50 0.9S72 0.9572 0.0 80 50 0.9626 0.9626 0.00001 90 50 0.9683 0.9683 -O.OOOOS
100 50 0.9746 0.9744 -0.00020 110 50 0.9811 0.9808 -0.00025 120 50 0.9878 0.9877 -0.00009 130 50 0.9950 0.9949 -0.00012 140 50 1. 0029 1. 0026 -0.00033 150 SO 1.0112 1.0107 -0.00052
20 70 0.9132 0.9137 0.00058 30 70 0.9158 0.9162 0.00036 40 70 0.9192 9.9193 0.00014 50 70 0.9230 0.9231 0.00005 60 70 0.9273 0.9273 0.0 70 70 0.9321 0.9320 -0.00009 80 70 0.9372 0.9371 -0.00017 90 70 0.9427 0.9425 -0.00018
100 70 0.9487 0.9484 -0.00031 110 70 0.9548 0.9546 -0.00020 120 70 0.9613 0.9613 0.00005 130 70 0.9682 0.9684 0.00018 140 70 0.9759 0.9760 0.00009 150 70 0.9838 0.9840 0.00026
::DATA GIVEN BY FABUSS AND KOROSI (966) .

19
TABLE 6. COMPARISON OF SPECIFIC VOLUMES AT LOW PRESSURE (CONT.).
SPECIFIC VOLUME, CC/G COEFFICIENT CHLORINITY, OF ERROR
t,"C PPT DATA EST. DATA OF EST. DATA BY
25 16.29 0.9812"" 0.9811 -0.00002 25 49.64 0.9396 0.9389 -0.00069 50 16.29 0.9901 0.9907 0.00058 50 49.64 0.9491 0.9481 -0.00106 75 16.29 1.0030 1.0039 0.00092 75 49.64 0.9620 0.9603 -0.00175
100 16.29 1.0178 1.0203 0.00243 100 49.64 0.9790 0.9749 -0.00419 125 16.29 1.0375 1. 0397 0.00218 125 49.64 0.9973 0.9917 -0.00560 150 16.29 1. 0623 1.0625 0.00023 150 49.64 1. 0180 1.0112 -0.00669
::"DATA IN THIS COLUMN GIVEN BY HIGASHI, NAGAMURA, AND HARA (1931).
22.5 17.69 0.9782t 0.9786 0.00043 27 17.69 0.9797 0.9799 0.00018 44 17.69 0.9855 0.9862 0.00068 64 17.69 0.9954 0.9959 0.00044 70 17.59 0.9987 0.9992 0.00047 86 17.&9 1.0084 1. 0087 0.00048 22.7 38.16 0.9525 0.9524 -o.aOOOG 28 38.16 0.9541 0.9540 -0.00010 41 38.16 0.9588 0.9587 -0.00005 52.7 38.15 0.9641 0.9638 -0.00036 63.6 38.16 0.9695 0.9691 -0.00039 82 38.16 0.9798 0.9791 -0.00071 88.3 38.16 0.9838 0.9829 -0.00093 22.8 62.58 0.9221 0.9229 0.00089 25.4 62.58 0.9228 0.9236 0.00088 38.1 62.58 0.9273 0.9276 0.00027 49.5 62.58 0.9321 0.9319 -0.00015 59.3 62.58 0.9365 0.9362 -0.00036 76 62.58 0.9446 0.9443 -0.00033 86.4 62.58 0.9502 0.9500 -0.00027
tDATA IN THIS COLUMN GIVEN BY HAMPEL (1950).
0.30 5.65 0.9918§ 0.9921 0.00022 5.28 0.9920 0.9921 0.00014 9.89 5. 0.9923 0.9924 0.00018
15.02 5.65 0.9930 0.9931 0.00015 19.29 5.65 0.9938 0.9940 0.00013 24.79 5.65 0.9952 0.9953 0.00012 29.88 5.65 0.9967 0.9968 0.00009 35.22 5.65 0.9984 0.9986 0.00012 39.27 5.65 1.0000 1.0001 0.00011 0.62 17 .09 0.9757 0.9761 0.00034 5.14 17 .09 0.9760 0.9763 0.00027
10.15 17.09 0.9766 0.9768 0.00022 14.94 17.09 0.9775 0.9776 0.00016 20.67 17.09 0.9788 0.9789 0.00011 25.31 1].09 0.9800 0.9802 0.00022 29.91 17 .09 0.9816 0.9816 0.00005 34.73 17 .09 0.9832 0.9833 0.00008 40.05 17.09 0.')352 0.9353 ".')'11116
0.09 22.35 0.9684 0.9690 0.00054 5.11 22.35 0.9590 0.9692 0.00028
10.49 22.35 0.9697 0.9699 0.00023 15.22 22.35 0.9707 0.9708 0.00010 19.96 22.35 0.9718 0.9718 0.00001 24.63 22.35 0.9731 0.9731 0.00002 30.15 22.35 0.9748 0.9748 0.00001 34.84 22.35 0.9765 0.9765 0.00001 39.93 22.35 0.9784 0.9785 0.00005
§DATA IN THIS COLUMN GIVEN BY WILSON AND BRADLEY (1968).

20
T is the temperature in degrees Kelvin, and x is the concentration in ppt
chlorinity. The standard error of estimate of v from 196 data points
was 0.0002 cubic centimeter per gram. The abridged comparison of the
given data with the estimated values by Equation (9) is given in Table
6. The numbers were rounded and recorded with five significant figures.
The relative errors of the estimated values are given in the last column.
The agreement between reported values and estimated values is better
than one partin a thousand throughout the entire range.
A partial tabulation of the estimated values by Equation (9) with
experimental data obtained by other investigators is given in Table 6 also.
Higashi, Nagamura, and Hara covered a wide temperature range in their
experiments. Unfortunately their results are not as precise as others.
The data obtained by each investigator was fitted separately to equations
similar to Equation (9), and it was found that the standard error of
estimate for Higashi, Nagamura, and Hara's data is about 10 times higher
than that of the others. The large discrepancies at high temperatures
are partly caused by the inherent inaccuracies in the salinity determina
tion because of the precipitation of calcium sulfate. Closer agreement
is found between the Hampel data and the values computed from Equation
(9), which is based on the data by Fabuss and Korosi. Judging from the
comparison with Wilson and Bradley's data at one atmosphere pressure, it
appears that the lower temperature limit for Equation (9) may be extrap
olated from 20°C to O°C without sacrifice of the three significant decimal
places.
The first five terms on the left side of Equation (9) are only
slightly different from the function A(T) in Equation (6), which fits
the specific volumes of water into the specified range of pressure. When
x = 0, v in Equation (9) represents the specific volume of pure water
at its vapor pressure. The purpose of Equation (9) is to describe the
relationship among the variables v, x, and T for sea water at a pressure
not more than 10 atmospheres above the vapor pressure.
The compressibility of a substance decreases with increasing pres
sure or, simply, the more a substance is compressed, the less it can be
compressed. The salt water has a lower compressibility than pure water

under the same external pressure. The greater the salt content, the
lower the compressibility, as if the salt creates an internal pressure
in the solution.
21
A salt crystal dissolves because electrostatic forces that exist
between its ions are weakened by the presence of the water dipoles
adjacent to the salt ions. These dissolved ions, being charged, orient
the electrical dipoles of the water around them. Hence, a positive
ion pulls the negatively charged oxygen end of a water molecule towards
it and, conversely, a negative ion pulls the positively charged hydrogen
end towards it. The field of ions exerts large electrostatic pressure
on the water dipoles to produce a strong compression of the aqueous
medium. Each ion is; therefore, surrounded by a little sphere within
which both the specific heat and the compressibility of water are reduced
by the pressure. Gucker and Rubin (1935) determined from the experimental
data at 25°C that the effect of one gram NaCl per 100 grams of solution
is analogous to a rise in pressure to about 500 atmospheres. An ana
lytical method is still not available for predicting the behavior of
sea water because of the complicated nature of the mixed electrolytes in
solution.
Compressibility measurements for sea water and its concentrates are
non existent at salinities over 40 ppt and at temperatures above 40°C.
Since sodium chloride constitutes close to 78 percent by weight of the
total dissolved solids in sea water, the thermal properties of aqueous
NaCl solutions would be good approximations to those of sea water and
its concentrates at the same salinities. The validity of the approxima
tion is supported by a comparison of the partial derivatives of specific
volume v with respect to pressure p in the low temperature and low
concentration region.
Rowe and Chou (1970) reported compressibilities of aqueous NaCl
solutions in the temperature range OOto l75°C for NaCl concentrations of
o to 25 grams per 100 grams of solution and pressures up to 350 bars.
The difference between the derivative (dv/dP)T w for a NaCI solution at , the weight fraction wand the derivative (av/ P)T,w = 0 for pure water
is given by
T, w (
dV ) - dp = w . F(T) + w2
• G(T) + wp • H(T) (10) T, w=o

22
For v in cubic centimeter per gram, T in degrees Kelvin, w in grams
salt per 100 grams solution., and p in bars, the empirical expressions of
the three temperature functions are as follows:
FCT) = 0.0015107 - 0.84608 x 10-sT + 0.12715 x 10⁻⁷T2
G(T) = -0.0027677 + 0.15695 x 10⁻⁴T - 0.23103 x 10⁻⁷T2
H(T) = -0.64639 x 10- 6 + 0.41674 x 10-aT - 0.68605 x 10⁻¹¹T2
The values of Cov/oP)T, w=O can be determined from Equation (6) and
its two temperature functions,
= B(T) + 2p . C(T) T, w=O
(11)
By combining Equations (10) and (11), one can readily calculate the values
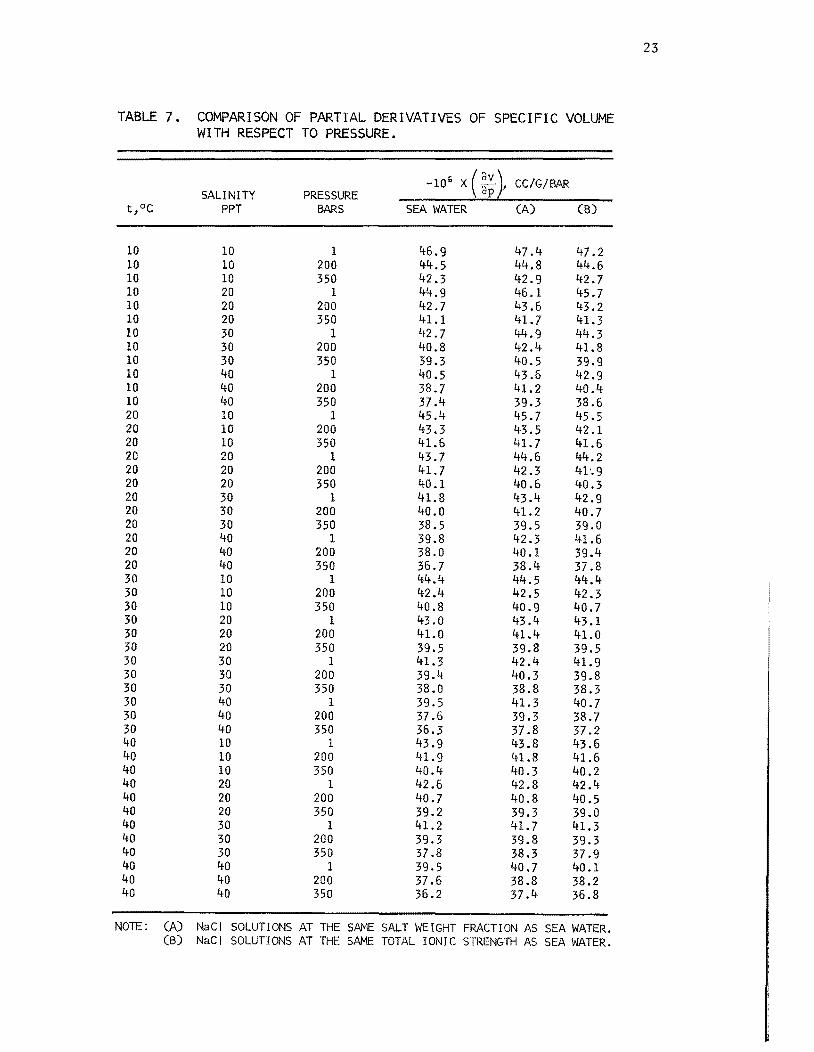
of (3v/3p)T w . , Differentiation of Equation (7), the coefficients of which are based
on experimental results for sea water in the salinity range from 0 to 40
ppt and temperature range from OOto 40°C, leads to
( 3V) _ B(T) + 2p. C(T) + s· FCT) + S2. G(T) + 2 sp· HCT) (12) 3p T s -,
Using temperature functions applicable to Equation (7), the values of
(dv/3p)T,s have been calculated and tabulated in Table 7. Comparisons
using the derivative C3v/3p)T for NaCl solutions were made at the same ,x salt weight, x = O.OOls, and at the same total ionic strength, based on
the composition of sea water given by Fabuss and Korosi (1966).
In curve fitting, it is very rare to find exact agreement between
the derivatives of two empirical equations which fit the same set of
data with equal preCIsIon. Even for pure water, the values of com
pressibility at the same state often differ by one or two percent when
they are derived from two different equations which fit the p-v-T data
within the international tolerances. The agreement between the deriva
tives of sea water and those of NaCl solutions as shown in Table 7 is
surprisingly good. This finding was further substantiated by comparing
the derivatives calculated by Wilson and Bradley's formula for sea water
(1968) •
23
TABLE 7. COMPARISON OF PARTIAL DERIVATIVES OF SPECIFIC VOLUME WITH RESPECT TO PRESSURE.
-106 X(av) CC/G/BAR SALINITY PRESSURE ap ,
t,OC PPT BARS SEA WATER (A) (B)
10 10 1 46.9 47.4 47.2 10 10 200 44.5 44.8 44.6 10 10 350 42.3 42.9 42.7 10 20 1 44.9 46.1 45.7 10 20 200 42.7 43.6 43.2 10 20 350 41.1 41.7 41.3 10 30 1 42.7 44.9 44.3 10 30 200 40.8 42.4 41.8 10 30 350 39.3 40.5 39.9 10 40 1 40.5 43.6 42.9 10 40 200 38.7 41.2 40.4 10 40 350 37.4 39.3 38.6 20 10 1 45.4 45.7 45.5 20 10 200 43.3 43.5 42.1 20 10 350 41.6 41.7 41.6 20 20 1 43.7 44.6 44.2 20 20 200 41.7 42.3 41'.9 20 20 350 40.1 40.6 40.3 20 30 1 41.8 43.4 42.9 20 30 200 40.0 41.2 40.7 20 30 350 38.5 39.5 39.0 20 40 1 39.8 42.3 41.6 20 40 200 38.0 40.1 39.4 20 40 350 36.7 38.4 37.8 30 10 1 44.4 44.5 44.4 30 10 200 42.4 42.5 42.3 30 10 350 40.8 40.9 40.7 30 20 1 43.0 43.4 43.1 30 20 200 41.0 41.4 41.0 30 20 350 39.5 39.8 39.5 30 30 1 41.3 42.4 41.9 30 30 200 39.4 40.3 39.8 30 30 350 38.0 38.8 38.3 30 40 1 39.5 41.3 40.7 30 40 200 37.6 39.3 38.7 30 40 350 36.3 37.8 37.2 40 10 1 43.9 43.8 43.6 40 10 200 41.9 41.8 41.6 40 10 350 40.4 40.3 40.2 40 20 1 42.6 42.8 42.4 40 20 200 40.7 40.8 40.5 40 20 350 39.2 39.3 39.0 40 30 1 41.2 41.7 41.3 40 30 200 39.3 39.8 39.3 40 30 350 37.8 38.3 37.9 40 40 1 39.5 40.7 40.1 40 40 200 37.6 38.8 38.2 40 40 350 36.2 37.4 36.8
NOTE: (A) NaCI SOLUTIONS AT THE SAME SALT WEIGHT FRACTION AS SEA WATER. (6) NaCI SOLUTIONS AT THE SAME TOTAL IONIC STRENGTH AS SEA WATER.

24
The concentration of sea water is usually either expressed in sali
nity or chlorinity. For the composition used by Fabuss and Korosi, as
given in "Vapor Pressure," the ratio of salinity s to chlorinity x 1.811.
With this conversion factor, s in Equation (12) can be easily converted
into x. An equation which satisfies the derivative given by Equation (12)
is as follows:
v = A(T) + P • B(T) + p2 • CeT) + x • D(T) + x2 • E(T)
+ xp • F(T) + x2p • G(T) + xp2 • H(T) (13)
The temperature functions A(T), BeT), and C(T), which fit the specific
volume of pure water for temperatures between OOto lSO°C and for pres
sures up to 1,000 bars, have already been given after Equation (6).
By adjusting Fabuss and Korosi's density data for zero pressure with the
information on compression and by curve fitting, the empirical coefficients
of the temperature functions, D(T) and E(T), for x in ppt chlorinity and
T in degrees Kelvin were found to be as follows:
D(T) = -0.0061042589 + 0.29591261 x 10⁻⁴T - 0.45896932 x 10⁻⁷T2
E(T) =
Since the magnitude of the derivative (dv/3p)T x is on the order of 10- 5, ,
two percent of the relative error on the estimated value of the derivative
would induce an error of not over 0.0003 cubic centimeter per gram in the
specific volume at 350 bars. Assuming that the derivative for sea water
is equal to that of NaCl solution at the same salt weight, the expressions
for the other three temperature functions are as follows:
F (T)
G (T)
H(T)
:::
::::
=
0.27359 X 10- 5 - 0.15323 x 10⁻⁷T + 0.23027 x 10-IOT2
-0.90773 X 10- 8 + 0.51475 x la-lOT 0.75771 x 10- 13r 2
-0.11706 x 10- 8 + 0.75472 x 10-IIT 0.12424 x 10⁻¹³T2
According to the available information, Equation (13) represents the
p-v-T-x relation of sea water for temperatures between OOto l75°C in the
chlorinity range 0 to 70 ppt and for pressures up to 350 bars and gives
three significant decimal places for the values of a specific volume.
ENTHALPY AND HEAT OF VAPORIZATION
An important phenomenon which occurs during the mixing of two solu-

25
tions at different concentrations is the change in temperature. In
some cases, a warming effect is observed; in others, a cooling effect.
In order to keep the temperature constant, the heat must be removed or
added, and the effect may be expressed in terms of heat of mixing. The
enthalpy of a solution after mixing is equal to the sum of the enthalpies
of the two solutions before mixing plus the heat of mixing. The heat of
mixing of a single salt solution at 25°C and 1 atmosphere can be cal
culated from the heats of formation compiled by Rossini (1952). How
ever, the heat of mixing of sea salt solutions had not been measured
prior to the experiment conducted by Bromley (1968).
In the calculation of the enthalpy of a solution, the standard
states of zero enthalpy for the solvent and the solute must first be
arbitrarily chosen. To be consistent with the values of enthalpy given
in the steam tables, the enthalpy of water is taken to be 25.0365 calories
per gram at 25°C and 1 atmosphere. For convenience, infinite dilution is
chosen as the reference state of zero enthalpy of the solute. With the
standard state so chosen, the enthalpy h of the solution can be related
to the weight fraction w of the solute and the integral heat of dilution
qd by the equation
h = 25.0365 (1 - w) - wqd (14)
Assuming the salinity to be lower than the total dissolved solute by
about 4 parts per 1,000, Bromley's data on the enthalpy of sea water
solutions, which are referred to pure water at 25°C and 1 atmosphere,
were adjusted and fitted to Equation (14). An interpolation formula for
qd was found as follows:
= -37.99l497wo. 5 + l82.625l7w - 208.77039w 1 ' 5 + 40.5034l9w 2 (15)
At very low concentration, an equation modified from the Debye-HUckel
theory would be the best for correlating experimental data. Nevertheless,
Equation (15) can represent the data satisfactorily above 0.005 percent
salt concentration by weight, as shown in Table 8. For its simplicity,
this equation will be used later for the calculation of enthalpies at
other temperatures and pressures.
Cox and Smith (1959) determined the specific heat of sea water

26
TABLE 8. ENTHALPY AT 25°C AND 1 ATMOSPHERE.
SALT WT. ENTHALPY~ CAL/GM SEA WATER HEAT OF DILUTION
FRACTION, X DATN: CAL. DATNm CAL/GM SALT
0 0 0 0
0.0005 0.0004 0.0004 -0.76
0.001 0.0011 0.0010 -1.03
0.002 0.0028 0.0027 -1.35
0.003 0.0048 0.0047 -1.57
0.004 0.0070 0.0069 -1. 72
0.005 0.0094 0.0092 -1.85
0.01 0.022 0.022 -2.18
0.02 0.046 0.046 -2.29
0.03 0.064 0.065 -2.15
0.04 0.076 0.076 -1.90
0.05 0.080 0.080 -1.60
0.06 0.076 0.076 -1.27
0.07 0.066 0.066 -0.94
0.08 0.048 0.048 -0.60
0.09 0.024 0.024 -0.27
0.10 -0.005 -0.005 0.05
0.11 -0.040 -0.040 0.36
0.12 -0.079 -0.079 0.66
::DATA GIVEN BY L. A. BROMLEY (1968), ASSUMING ZERO ENTHALPY AT 25°C AND 1 ATMOSPHERE FOR PURE WATER.
::::VALUES DERIVED BY USING EQUATION (15).
taken from the surface of the Red Sea near the southern end of the Gulf
of Suez at atmospheric pressure over a temperature range of _2° to
30°C and a salinity range of 0 to 40 ppt. None of the earlier data
prior to their experiments is satisfactory more than moderate ac-
curacy is desired. Recently Bromley, Desaussure, Clipp, and Wright
(1967, 1970) sampled sea water at La Jolla, California and measured its
specific heat with a pressurized calorimeter. Their recent measurements
cover the range 2° to 200°C and extend to salinity values of 12 percent. The
equivalent heat capacity was determined with pure water in the calorimeter,
taking the values for the specific heat of water given by Osborne, Stimson,

27
and Ginnings (1939). To check the degree of accord in the work done in
different laboratories, a comparison was first made between the pub
lished values by Bromley, et al., for pure water and the calculated
values based on the enthalpies from the steam tables.
The values of the enthalpy of saturated water from 0° to 200°C in
the 1963 International Skeleton Steam Tables (Meyer, et al., 1967) can
be adequately fitted into the following interpolation formula:
= -1283.242127 + 5.515545094T - 0.4189722589 x 10⁻²T2
+ 0.4378267038 X 10-sT 3 (16)
where hf denotes the enthalpy of saturated water in joules per gram,
and T is the temperature in degrees Kelvin. Table 9 shows that the
TABLE 9. ENTHALPY OF SATURATED WATER.
ENTHALPY, j/GM
t, °c ISST DATAl: EST. DATAl::: DIFFERENCE
0 -0.0416 -0.0415 -0.0001
0.01 0.000611 0.000611 0.0
10 41.99, 41. 97 0.02
20 83.86 83.89 -0.03
30 125:66 125.74 -0.08
40 167.47 167.54 -0.07
50 209.3 209.34 -0.04
60 251.1 251.14 -0.04
70 293.0 292.98 0.02
80 334.9 334.88 0.02
90 376.9 376.88 0.02
100 419.1 418.99 0.11
110 461. 3 461.24 0.06
120 503.7 503.66 0.04
130 546.3 546.28 0.02
140 589.1 589.11 -0.01
150 632.2 632.20 0.00
160 675.5 675.55 -0.05
170 719.1 719.21 -0.11
180 763.1 763.20 -0.10
190 807.5 807.53 -0.03
200 852.4 852.25 0.15
::DATA AND TOLERANCES TAKEN FROM THE 1963 INTERNATIONAL SKELETON STEAM TABLES (MEYER, et aZ., 1967).
::::VALUES DERIVED BY USING EQUATION (16).
TOLERANCE (+ OR -)
0.0004
0.000001
0.04
0.08
0.08
0.08
0.1
0.1
0.1
0.2
0.2
0.2
0.2
0.2
0.3
0.3
0.3
0.3
0.4
0.4
0.4
0.4

28
differences between the data and the estimated values by Equation (16)
are within the internationally recommended tolerances. It is imp,ortant
to note that the state for zero enthalpy (-0.0416 joule per gram for
saturated water at DOC) and the thermodynamic temperature of the ioe
point (273.l5°K) of the new standard are both slightly different f~om
the old ones (Mechanical Engineeping. 1935).
Differentiating hf with respect to temperature gives the changes in
the enthalpy of saturated water per unit rise of temperature. The specific
heat cf along the saturation line can be related to the constant-pressure
specific heat cp at vapor pressure by the following equation:
.! ~ == J dT
where J is Joule's constant.
(17)
For a pure substance, the specific heat is a function of temperature
and pressure, but principally the former. If a sufficiently accurate
p-v-T relation is available, the change in cp for a change in pressure
from PI to P2 at a constant temperature can be evaluated by
c == C PI P2
(18) T (b) dp aT2
p
With the p-v-T relation as described by Equation (6), the specific
heats of water at a constant pressure were calculated by means of
Equations (16), (17), and (18) and tabulated in Table 10 for comparison
with the published data by Bromley (1970). Below 180°C, the agreement
is within one part per thousand.
Provided the p-v-T relations the region of interest are known,
the pressure dependency of enthalpy may be evaluated by the following
equation:
h PI h + J PI [ T (~~ ~p ] dp
P2 P2 V J (19)
Based on p-v-T relation as described by Equation (6), the enthalpy
differences between the compressed and saturated water, h - hf' have
been calculated (the results are tabulated in Table 11). The close agree-

TABLE 10. SPECIFIC HEAT OF WATER.
SPECIFIC HEAT~ CAL/GM - °c
°c cf
C (VAPOR PR. V~ t, P
0 1. 005 1. 005
10 1.002 1.002
20 1.000 1.000
30 0.999 0.999
40 0.998 0.998
50 0.998 0.998
60 0.999 . 0.999
70 1.000 1.000
80 1.002 1.002
90 1.003 1.004
100 1.006 1.007
110 1. 009 1.010
120 1.013 1.014
130 1.018 1.019
140 1.023 1.024
150 1.028 1.030
160 1.035 1.037
170 1.042 1.044
180 1.049 1.052
190 1.054 1.060
200 1.064 1.069
~:BY EQUATIONS (16), (7), AND (18). :mDATA FROM BROMLEY, et aZ. 0967, 1970).
C (VAPOR PR. yo: P
1.005
1.002
1.000
0.999
0.998
0.998
0.999
1.001
1.003
1.005
1.008
1.011
1.015
1.019
1.024
1.030
1.037
1.045
1.054
1.064
1.075
tDATA FROM OSBORNE, STIMSON AND GINNINGS (1939). NOTE: 1 CALORIE = 4.1868 JOULES.
29
C P
o ATM.) t
1.007
1.001
0.999
0.998
0.998
0.999
0.999
1. 001
1.002
1.004
1.007
ment between the calculated values and the values given by Keenan, et aZ."
(1969) is also shown in Table 11.
Based on Bromley's data on constant-pressure specific heats near
vapor pressure for sea water from 0° to 80°C, an interpolation formula
was found as follows:
= 1.5651785 - 0.3608443 x 10- 2T + 0.57252694 x 10- sT2
- (0.02458979 - 0.14470982 x 10⁻³T + 0.22311467 x 10⁻⁶T2) s
+ (0.15246268 X 10- 3 - 0.94150958 x 10⁻⁶T + 0.1460181 x 10- 8T2 ) 52
(20)

30
TABLE 11. ENTHALPY DIFFERENCE BETWEEN COMPRESSED AND SATURATED WATER.
TEMP. of
32
32
32
32
32
50
50
50
50
50
100
100
100
100
100
200
200
200
200
200
300
300
300
300
300
PRESSURE PSIA
1000
2000
3000
4000
5000
1000
2000
3000
4000
5000
1000
2000
3000
4000
5000
1000
2000
3000
4000
5000
1000
2000
3000
4000
5000
::KEENAN" et al., 1969.
3.00
5.96
8.91
11.81
14.71
2.88
5.75
8.59
11.41
14.20
2.63
5.25
7.86
10.47
13.06
2.27
4.55
6.84
9.13
11.42
1.85
3.72
5.62
7.54
9.47
h - he BTU/LB.
EST. DATA~~~:
3.00
5.98
8.94
11.88
14.79
2.88
5.74
8.58
11.41
14.21
2.63
5.25
7.86
10.46
13.04
2.25
4.53
6.81
9.09
11.38
1.72
3.59
5.48
7.39
9.32
::::DATA DERIVED BY EQUATIONS (6) AND (19).
In Equation (20)~ ~ is the constant-pressure specific heat in calories
per gram per degree centigrade, T is the temperature in degrees Kelvin,
and s represents the salinity in ppt. The standard error of estimate
of ~ on T and s for 117 data points 0.00065.
To fit Bromley's data over a wider temperature range, 0° to 200°C,
it was necessary to add three more coefficients to improve the precision

31
of curve fitting, and the form of equation became:
cp = A + BT + CT2 + D/T + (E + FT + GT2 + HIT) s
+ (I + JT + KT2 + LIT) S2 (21)
The best values of the coefficients are:
A = 1.7875111
C = 0.43603294 X 10- 5
E = 0.45477025 X 10- 2
G = -0.16410434 X 10- 7
I = 0.59886571 X 10- 4
K = 0.27592503 X 10- 9
B = -0.3331851 X 10- 2
D = -53.950447
F = 0.7704077 X 10- 6
H = -1.4014369
J = -0.23457641 X 10- 6
L = -0.35977131 X 10- 2
The corresponding standard error of estimate for 273 data points is
0.00097. Table 12 shows the partial comparisons of the values calculated
from Equation (21) with the given data.
TABLE 12. CONSTANT-PRESSURE SPECIFIC HEAT OF SEA WATER NEAR VAPOR PRESSURE.
SP. HEAT, CAL/GM °c SALINITY
t, °c PPT DATA" EST. DATAl:;: DIFFERENCE
0 a 1. 0080 1. 0052 -0.0028
50 a 0.9992 0.9992 0.0000
100 0 1. 0076 1. 0068 -0.0008
150 0 1. 0300 1. 0309 0.0009
200 0 1.0747 1.0732 -0.0015
0 30 0.9601 0.9602 0.0001
50 30 0.9638 0.9632 -0.0006
100 30 0.9715 0.9716 0.0001
150 30 0.9893 0.9910 0.0017
200 30 1.0254 1.0242 -0.0012
0 60 0.9198 0.9210 0.0012
50 60 0.9313 0.9303 -0.0010
100 60 0.9387 0.9385 -0.0002
150 60 0.9529 0.9538 0.0009
200 60 0.9572 0.9581 0.0009
0 90 0.8874 0.8877 0.0003
50 90 0.9009 0.9006 -0.0003
100 90 0.9097 0.9075 -0.0022
150 90 0.9191 0.9194 0.0003
200 90 0.9450 0.9429 -0.0021
0 120 0.8637 0.8601 -0.0036
50 120 0.8729 0.8741 0.0012
100 120 0.8791 0.8784 -0.0007
150 120 0.8873 0.8877 0.0004
200 120 0.9096 0.9105 0.0009
::DATA FROM BROMLEY, et al. (1970). ::::DATA ESTIMATED BY USING EQUATION (20).

32
The Cox and Smith measurements, restricted to a narrower range of
temperature and concentration, have been compared with Bromley's results
by using Equation (21) and the agreement is remarkably close. Cox and
Smith used absolute joules as the energy unit (1 calorie = 4.184 absolute
joules). The deviation of the calculated values by Equation (21) from
their observed data is on the whole less than 0.001 calorie per gram per
degree centigrade.
For a fixed composition of solution, the differences between the
constant-pressure specific heat cp at vapor pressure and the specific
heat cf along saturation line may be evaluated by Equation (17). By
Equation (3) with the coefficients for Fabuss and Korosi's vapor pres
sure data and Equation (13) which approximates the p-v-T-x relations
of sea water, the values of cp minus cf for sea water have been calculated
and tabulated in Table 13 for comparison. There is a close agreement
between the calculated values and the values reported by Bromley.
TABLE 13. VALUES OF ~ MINUS cf'
-It CAL/GM - °c cp - cf~ 10
SALINITY t,OC PPT DATA:: EST. DAT N:::
80 20 1 1.0
80 60 1 0.9
80 120 1 0.8
120 20 5 4.9
120 60 4 4.3
120 120 4 3.7
160 20 18 17.7
160 60 16 14.9
160 120 12 13.0
200 20 54 50.6
200 60 46 42.4
200 120 36 37.2
xDATA FROM BROMLEY~ 1970. :mDATA DERIVED BY USING EQUATIONS 0) AND (13).
Daley, Hilding, and Fisher (1970) have just published their values
of specific heats of sea water at saturation over a range of temperature
from 32° to 400°F and of concentrations from 1 to 28 percent salinity
based on the measurements with a Bunsen ice calorimeter. The test

33
sample was prepared from natural sea water collected from the Atlantic
Ocean. In the process of preparation, sulfuric acid was added to the
sample to prevent the precipitation of calcium carbonate from solution.
Their values of specific heats at saturation have been converted to
constant-pressure specific heats at vapor pressure by Equation (17) and
fitted into Equation (21), of which the best values of the coefficients
become:
A = 1.3958222 B = -0.23878998 X 10- 2 C '" 0.36362594 x .1:0- 5
D = -2.3078127 E = -0.70418481 X 10- 3 F = 0.78180236 X 10- 5
G = -0.1626327 X 10- 7 H = -0.43916216 I = -0.44503885 X 10- 5
J = -0.14563778 X 10- 7 K = 0.40243346 X 10- 10 L = 0.20799146 X 10⁻²
If the salinity s is zero, Equation (21) gives the specific heat of pure
water. This equation can represent Daley's values of specific heats for
pure water over the entire range with a deviation of less than 0.00013
ca1/(gm) (CO). However, his data for sea water are more scattered than
Bromley's, and the corresponding standard error of estimate for 260
data points is increased to 0.0034.
Bromley's values of specific heats are compared with Daley's in
Table 14. These values were calculated by using Equation (21) and its
TABLE 14. COIVIPARISON OF SPECIFIC HEATS.
Cp ' CAL/GM °c
SALINITY t, Qc PPT DATA~ DATA"" DI FFERENCE, %
0 0 1.0052 1.0064 -0.12
0 40 0.9465 0.9543 -0.82
80 0.8981 0.9092 -1.24
0 120 0.8601 0.8712 -1.29
50 0.9992 0.9967 0.25
50 Lt~ 0.9519 0.9497 Q.23
50 80 0.9102 0.9074 0.31
50 120 0.8741 0.8699 0.49
100 0 1.0068 1. 0049 0.19
100 40 0.9604 0.9578 0.26
100 80 0.9167 0.9149 0.29
100 120 0.8784 0.8761 0.26
150 1. 0309 1. 0310 -0.01
150 40 0.9783 0.9796 -0.13
150 80 0.9305 0.9330 -0.27
150 120 0.8877 0.8912 -0.39
200 1.0732 1. 0752 -0.19
200 40 1.0091 1. 0155 -0.63
200 80 0.95Lt9 0.9624 -0.79
200 120 0.9105 0.9160 -0.60
"BROMLEY I 1970. l~I<DALEY, 1970.

34
respective coefficients. Both the order of magnitude of the discord and
the trend of discrepancies, which vary with temperature and salinity,
are in accord with those reported in Daley's dissertation (1970).
For a homogeneous system of invariable composition, the differential
of its enthalpy may be expressed in terms of the two independent prop
erties, temperature and pressure, as
dhx = (~~) dT p,x
This leads to the expression
h = x
c dT p,x
+ (~h ) dp P T x ,
(22)
where c is the constant-pressure specific heat at a given pressure and p,x concentration. Equation (21) is only for c at vapor pressure of so-.. p,x lution. At a pressure higher than the vapor pressure,
determined by employing Equations (18), (13), and (3).
c may be p,x Calculated values
of enthalpy at vapor pressure and at 100, 200, and 300 atmospheres
are given in Table 15. Values of the coefficients used with Equation
(21) are based upon Bromley's measurements. The computer program for
obtaining values shown in Table 15 is given as Appendix A.
There are two sets of coefficients for Equation (21) derived from
Daley's and Bromley's experiments. A comparison of the calculated values
of enthalpies at vapor pressures with the two sets of coefficients is
shown in Table 16. The agreement is better than 0.3 calories per gram
throughout the range of Bromley's experiments and serves to verify the
results of these two investigators. In consideration of differences
in the seawater samples and experimental apparatus used, the measure
ments by Daley and Bromley are admirable in quality.
For the present calculation, the standard state of zero enthalpy
for salts in sea water is chosen at infinite dilution at 25°C. To com
pare the calculated values with the values of seawater enthalpy published
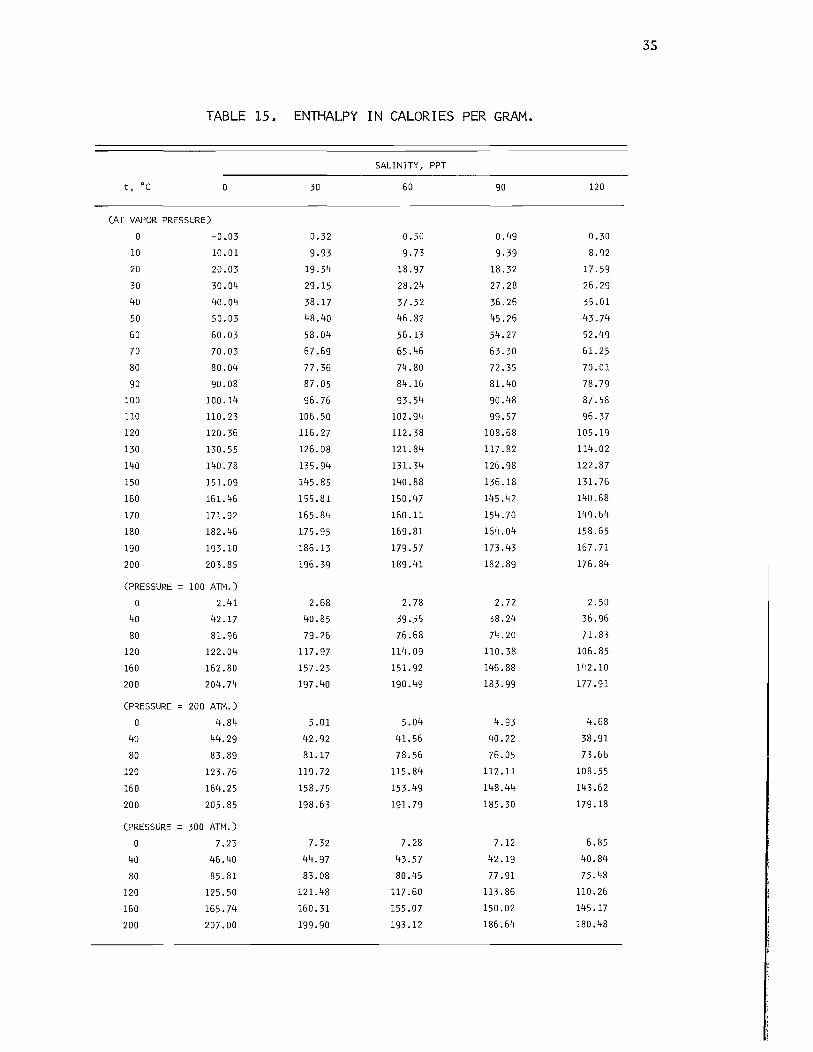
35
TABLE 15. ENTHALPY IN CALORIES PER GRAM.
SALINITY, PPT
t, °c 0 30 50 90 120
(AT VAPOR PRESSURE)
0 -0.03 0.32 0.50 0.49 0.30
10 10.01 9.93 9.73 9.39 8.92
20 20.03 19.54 18.97 18.32 17.59
30 30.04 29.15 28.24 27.28 25.29
40 40.04 38.17 37.52 35.25 35.01
50 50.03 48.40 45.82 45.25 43.74
50 50.03 58.04 55.13 54.27 52.49
70 70.03 57.59 55.45 53.30 51.25
80 80.04 77.35 74.80 72.35 70.01
90 90.08 87.05 84.15 81.40 78.79
100 100.14 95.75 93.54 90.48 87.58
110 110.23 105.50 102.94 99.57 95.37
120 120.35 115.27 112.38 108.58 105.19
130 130.55 125.08 121. 84 117.82 114.02
140 140.78 135.94 131. 34 125.98 122.87
150 151. 09 145.85 140.88 135.18 131. 75
150 151. 45 155.81 150.47 145.42 140.58
170 171.92 155.84 150.11 154.70 149.54
180 182.45 175.95 159.81 154.04 158.55
190 193.10 185.13 179.57 173.43 157.71
200 203.85 195.39 189.41 182.89 175.84
(PRESSURE = 100 ATM.)
0 2.41 2.58 2.78 2.72 2.50
40 42.17 40.85 39.55 38.24 35.95
80 81.95 79.25 75.58 74.20 71. 83
120 122.04 117.97 114.09 110.38 105.85
150 152.80 157.23 151.92 145.88 142.10
200 204.74 197.40 190.49 183.99 177.91
(PRESSURE = 200 ATM.)
0 4.84 5.01 5.04 4.93 4.58
40 44.29 42.92 41.55 40.22 38.91
80 83.89 81.17 78.55 75.05 73.55
120 123.75 119.72 115.84 112.11 108.55
150 154.25 158.75 153.49 148.44 143.52
200 205.85 198.53 191.79 185.30 179.18
(PRESSURE = 300 ATM.)
0 7.23 7.32 7.28 7.12 5.85
40 45.40 44.97 43.57 42.19 40.84
80 85.81 83.08 80.45 77 .91 75.48
120 125.50 121. 48 117.50 113.85 110.25
150 155.74 150.31 155.07 150.02 145.17
200 207.00 199.90 193.12 185.54 180.48

36
TABLE 16. COMPARISON OF ENTHALPIES.
hJ CALIGM SALINITY
t, "c PPT DATAl: DATAl::: DIFFERENCE
0 0 -0.03 -0.03 0 0 40 0.40 0.30 0.10 a 80 0.51 0.37 0.14 0 120 0.30 0.18 0.12
50 0 50.03 49.98 0.05 50 40 47.87 47.85 0.02 50 80 45.77 45.75 0.02 50 120 43.74 43.68 0.06
100 0 100.14 99.97 0.17 100 40 95.67 95.51 0.16 100 80 91.48 91.29 0.19 100 120 87.58 87.31 0.27 150 0 151.09 150.87 0.22 150 40 144.16 143.96 0.20 150 80 137.72 137.51 0.21 150 120 131.76 131. 52 0.24 200 0 203.85 203.69 0.16 200 40 194.01 194.00 0.01 200 80 185.01 185.06 -0.05 200 120 176.84 176.86 -0.02
l:BROMLEYJ 1970. lmDALEY, 1970 .
by Bromley (1970) and Daley (l!:;Jiu) , "the enthalpy for salts in the in-
finitely dilute solution at 25°C should be assigned a value of -12.50
and 34.58 calories per gram, respectively. With the same datum values
so adjusted, the enthalpies calculated by the equations given in this
report differ from published values by less than 0.3 calories per gram.
The latent heat of vaporization of sea water L differs from that s of pure water L. The difference can be calculated from the activity
w of water if accurate data on either vapor pressure or osmotic coef-
ficient are available. Vapor pressure of sea water reported in lit
erature is not precise enough for accurate determination of such dif
ference. Sodium chloride constitutes close to 80 percent of the dissolved
solids in sea water and the latent heat of vaporization of aqueous sodium

37
chloride solution has been calculated from the osmotic coefficient data
by Chou (1968). In a narrow range, the vapor-pressure depression of
sea water may be approximated by that of an aqueous sodium chloride so
lution with an equal number of ions. This approximation gives the in
terpolation formula for determining the difference between Land L in s w calories per gram:
Ls - Lw = T(0.92968267 X 10⁻⁴s 0.1282345 X 10⁻⁴ S 1.5
+ 0.195061 x 10⁻⁵s 2) - (0.77803108 x 10⁻² s
+ 0.75123967 X 10- 3 S 1. 5 + 0.38753341 x 10⁻³s 2) (23)
where s is the salinity in ppt and T is the temperature in degrees
Kelvin. In accordance with the data established by the Sixth Inter
national Conference on the Properties of Steam held in New York in 1963
(Meyer~ et al.~ 1967), the latent heat of pure water in calories per
gram from 0° to 200°C can be given by the following equation with a maxi
mum deviation of three parts per ten thousand:
Lw = 854.52547 - 1.5939341T + 0.34368756 x 10-zTz
- 0.38341991 x 10 3 (24)
where T is the temperature in degrees Kelvin. For salinities less than
120 ppt, the effect of salts on latent heat of vaporization was found
to change pure water value by no more than 0.5 percent at the same
temperature.
SUMMARY
This study has yielded practical equations for computing the
thermal properties of sea water in the 0° to 200°C temperature range
for salinities from 0 to 120 ppt, based on available data. Because of
the unknown reliabilities of the data in the literature and the complex
nature of sea water, rigorous estimates of probable error are not pos
sible for each property presented; nevertheless, an effort was made to
compare the experimental data and the derived values obtained from
various sources. The available values of vapor pressure differ consi
derably and none of them is of high accuracy. However, further measure
ments are not hereby proposed since the direct measurements of

38
boiling point elevation, accurate to O.OOloe, in the concentration
range of 0 to 12 percent sea salts and temperature range of 25 to 200 0 e
is being conduct~d by Bromley (1970) under a contract with the Office
of Saline Water. From his projected results, accurate values of vapor
pressure and osmotic coefficient can be derived. For the time being,
Equation (3) with coefficients which fit Fabuss and Korosi's data is
recommended for the calculation of vapor pressure. With the best
coefficients determined by the method of least square, Equation (3)
could satisfactorily fit the more accurate data which will be available
soon.
Among the most basic data for the calculations 0.£ thermal prop
erties Ot a solution is the pressure-volume-temperature-concentration
(p-v-T-x) relations. Experimental data on density of sea water being
reported in oceanographic literature are limited to the salinity range
of 0 to 40 ppt for temperatures between 0° and 40 0 e and for pressure
between 1 and 1,000 bars. Fabuss, Korosi, and Shamsulhuq (1966) meas
ured the densities of binary and ternary solutions of sea salts and ex
tended the density data of sea water to 1500 e near vapor pressures.
Higashi, Nagamura, and Hara (1931) directly measured the densities of
sea water in the temperature range 0° to l7Soe. With the compressi
bility data of aqueous sodium chloride solution to account for the
effect of pressure on the density of sea water above 40 0 e, Equation (13)
was developed to describe the p-v-T-x relations of sea water. The
values of specific volume calculated by this equation differ from the
data in literature by less than 0.001 ~ubic centimeter per gram or
about 1 part in 1,000, with few exceptions. For practical purposes,
Equation (13) is adequate for describing the p-v-T-x relations of sea
water in the range of 0° to 17Soe and 0 to 120 ppt salinity for pres
sures up to 350 bars.
Based on the data given by Bromley (1970) and by Daley (1970), two
respective sets of coefficients were found for Equation (21) for the
interpolation of the experimental values of specific heaLS. By using
Equations (13), (21), and (22), the enthalpies of sea water in the de
signated range of temperature, pressure, and concentration can be calcu
lated. The values of enthalpy computed with Bromley's data on specific
heat have been compared with those of Daley and the agreement is all that
could be desired. Throughout the entire range, the calculated values of en-

39
thalpies are consistent within ±0.2S calories per gram. The enthalpies
of water in steam tables agree with the calculated enthalpies at zero
salinity to 1.5 parts per thousand. Equation (23), which gives the
difference between the latent heat of vaporization of sea water and that
of pure water, is based on the calculated values of the vapor pressure
of aqueous sodium chloride solutions. This equation should be modified
after the accurate measurements of vapor pressure of sea water being
made by Bromley become available (Bromley, 1970).
If the pressure is not over 10 atmospheres, the pressure dependencies
of specific volume and enthalpy may be neglected so that the computations
can be simplified. A short list of Fortran arithmetic functions which
may be called for in the computations of vapor pressure, heat of vaporiza
tion, specific volume, and enthalpy at a moderate pressure is given in
Appendix B. By adding a few terms to the arithmetic function, the pres
sure dependency of specific volume can be easily included.
The recommended formulae by which the values of the respective
properties may be closely reproduced are summarized as follows:
VAPOR PRESSURE:
In p (3)
where In Pw is given by Equation (1), in which Pw is the vapor pressure
of pure water, p is the vapor pressure of sea water in bars in the
temperature range 20° to 150°C for chlorinities x, ranging from 0 to 70
ppt, and the values of coefficients a, b, -- e are given at the bottom
of Page 8.
SPECIFIC VOLUME;
v z ACT) + P • B(T) + p2 • C(T) + x • OCT) + x2 • ECT)
+ xp • FCT) + x2p • GCT) + Xp2 • HeT) (13)
where v is the specific volume in cubic centimeters per gram, p the
pressure applied to the sea water in bars, the temperature function
ACT), B(T), --- HCT) are given on Page 12 and 24, and x is the chlorinity
in ppt. This equation applies to sea water in the temperature range 0°
to 175°C for chlorinities ranging from 0 to 70 ppt and for pressures up
to 350 bars.

40
ENTHALPY AT 25°C AND 1 ATMOSPHERE:
h -x, 2SoC, 1 atm - 25.0356 (1 - w) - wqd (14)
where w is the weight fraction of the salts, qd is the heat of dilution
given by Equation (15), and the unit of enthalpy is calories per gram.
The reference state of zero enthalpy of the salts is at infinite dilution.
CONSTANT-PRESSURE SPECIFIC HlAT:
cp = A + BT + CT~ + D/T + (E + FT + GT 2 + H/T)s + (I + JT +
+ KT2 + L/T) (21)
in which the values of coefficients A, B, --- L are given on Page 31
for constant-pressure specific heat cp in calories per gram per degree
centigrade, temperature T in degrees Kelvin and salinity s in ppt. This
formula is for sea water from 0° to 200°C near vapor pressure.
ENTHALPY IN THE REGION 0° TO 200°C, 0 TO 120 PPT SALINITY" AND 1 TO 350 ATMOSPHERES;
h = h 25°C, 1 atm + f p (v - T (~~) ] 25°C dp x x, 1 atm P' x
+ f:soc c dT p, x
in conjunction with Equations (3), (13), (14), (18), and (21).
HEAT OF VAPORIZATION:
(22)
Equations (23) and (24) may be used to estimate the heat of vapo
rization in calories per gram for sea water in the temperature range
0° to 200°C for salinities up to 120 ppt.

REFERENCES
Arons, A.B. and C.F. Kientzler. 1954. "Vapor pressure of sea-salt solutions." Transactions of American Geophysical Union. 35:722.
Bromley, L.A. 1968. "Relative enthalpies of sea salt solutions at 25°C." Journal of Chemical and Engineering Data. 13,: 3'99.
Bromley, L.A. 1970. Further studies of properties of sea water and its concentrates to 200°C. Research and Development Progress Report No. 522. U.S. Office of Saline Water. 55 p.
Bromley, L.A., V.A. Dessaussure, J.C. Clipp, and J.S. Wright. 1967. "Heat capacity of sea water solutions at salinity of 1 to 12%
41
and temperatures of 2° to BO°C." Journal of Chemical and Engineering Data. 12:202.
Chou, J.C.S. 1968. Thermodynamic properties of aqueous sodium chloride solutions from 32 to 350°F. Thes • Oklahoma State University.
Cox, R.A. and N.D. Smith. 1959. The specific heat of sea water. Proceedings of the Royal Society (London). A series. 252:51.
Daley, J.G. 1970. Thermodynamic properties of seawater concentrates. Ph.D. Dissertation, University of Connecticut.
Daley, J.G. W.E. Hilding, and D.A. Fisher. 1970. Thermodynamic properties of seawater concentrates. Proceedings of the Fifth Symposium on Thermophysical Properties. American Society of Mechanical Engineers. 134 p.
Dittmar, W. water.
1884. Report on researches into the composition of ocean H.M.S. Challenger Reports (London). 1:251.
Dorsey, N.E. 1940. Properties of ordinary water-substance. Reinhold Publishing Corporation, New York. p. 203.
Fabuss, B.M. and A. Korosi. 1966. water and its concentrates.!1 Data. 11 : 606.
"Boiling point elevation of sea Journal of Chemical and Engineering
Fabuss, B.M. and A. Korosi. 1968. Properties of sea water and aqueous eZectrolyte solutions containing NaCl, KCZ" Na2S04 and MgS04. Report submitted to the Office of Saline Water by Monsanto Research Corporation.
Fabuss, B.M., A. Korosi. and A.K.M. Shamsulhuq. 1966. "Densities of binary and ternary aqueous solutions of NaCl, NaS04 and MgS04, of sea water, and sea water concentrates." Journal of Chemical and Engineering Data. 11:325.

42
Forrest, W.W. and S.R. Worthley. 1964. liThe vapor pressure of concentrated sea-water. II AustraUan Journa~ of AppUed Saienae. 15(53):53.
Gucker, F.T. and T.R. Rubin. 1935. "The apparent molal isochric heat capacity of electrolytes .• II Journa~ of Ameriaan Chemiaal Soaiety. 57:78.
Hampel, C .A. 1950. "Densities and boiling points of sea water concentrates." Industrial and Engineering Chemistry. 42:383.
Higashi, K., K. Nakamura, and R. Hara. 1931. "The specific gravities and the vapor pressure of the concentrated sea water at a - 175°C." Journal of Society of Chemical Industry (Japan). 34:166.
Keenan, J.H., F.G. Keyes, P.G. Hill, and J.G. Moore. 1969. Steam tables. John Wiley and SonS. 194 p.
Lindsay Jr., W.T. and C.T. Liu. 1968. Vapor pressure lowering of aqueous so~utions at elevated temperatures. Progress Report 347, U.S, Office of Saline Water. p. 139.
Lyman, J. and R.H. Fleming. 1940. "Composition of sea water." Journal of Marine Research. 3(2):134.
Meahanical Engineering. 1935. "The third international conference on steam tables.!1 57: 710.
Meyer, C.A., R.B. McClintock, G.J. Silvestri, and R.C. Spencer, Jr. 1967. ASME Steam Tables. The American Society of Mechanical Engineers.
Newton, M. and G. Kennedy. 1965. "An experimental study of the p-v-T-s relations in sea water." Journal of Marine Research. 23:88.
Office of Saline Water. 1969. Saline water aonversion report. U.S. Department of Interior. 268 p.
Osborne, N.S., H.F. Stimson, and D.C. Ginnings. 1939. "Measurements of heat capacity and heat of vaporization of water in the range 0° to 100°C." Journal of Researah. u.s. Bureau of Standard. 23:239.
Rowe, A.M. and J.C.S. Chou. 1970. "Pressure-vo1ume-temperatureconcentration relation of aqueous NaCl solutions." JournaZ of Chemical and Engineering Data. 15:61.
Stoughton, R.W. and M.H. Lie'tzke. 1965. "Calculation of some thermodynamic properties of sea salt solutions at elevated temperatures from data on NaCl solutions." Journal of Chemiaal and Engineering Data. 10:254.

43
Tait, P.G. 1889. Report on some of the physioaZ properties of fresh water and of sea. Her Majestyts Stationery Office, London. p. 61.
Wilson, W. and D. Bradley. 1968. "Specific volume of sea water as a function of temperature, pressure and salinity." Deep Sea Researoh. 15:355.
Witting, R. 1908. untersuohungen zur Kenntnis der Wasserbewegungen und der Wasserumsetzung in den FinZand umgebenden Merren$ 1'. Fin1andische Hydrog.-Bio1ogische Untersuchungen (Finland). No.2. p. 173.


APPENDICES

l , ,

47
APPENDIX A. FORTRAN PROGRAM FOR CALCULATION OF ENTHALPY.
The values of enthalpy, listed in Table 15, for the given tempera
tures, pressures, and concentrations of salts were calculated by this program.
DIMENSION T(IO), TCClO), PWL(IO),TT(IO),TTT(lO),TI(lO),TTI(lO), IFTl(lO),FT2CIO),FT3ClO),TFlClO),TF2(lO),TF3(lO),TF4(10)
DIMENSION SL(lO),CL(10),WXCIO),FPSICIO),FPS2CIO),FSl(lO), IFS2(10),H25CIO),PACIO),PCIO),PFl(lO),PF2ClO),PF3ClO)
DIMENSION FPICIO,lO,lO),FP2(lO,lO,lO),FP3(lO,10,lO),HC(10,10,10), IH(10,10,lO),E(10,10),HP(lO,10),PVCIO,lO) NI=6 NJ=S NK=3 READ(S,1) (TC(I),I=l,NI)
1 FORMAT(16F5.0) READC5,1) CSL(J),J=l,NJ) READ(5,1) (PA(K),K=l,NK)
C PRESSURE COEFFICIENTS. P IN BARS. PWl=71.023834
C P IN BARS PW2=-7380.4001 PW3=-9.0977349 PW4=O.0070871862 PSl=O.36403381E-OS PS2=-O.21880179E-OS PS3=-O.89742462E-03 PS4=O.44991149E-05 PS5=-O.S4721135E-05
C VOLUME COEFFICIENTS. AVl=O.6014485E 1 AV2=-O.1053451E-Ol AV3=O.9387005E-05 AV4=-O.1151340E 4 AV5=O.1028076E 6 BVl=-O.18255854E-04 BV2= O.91609812E-06 BV3=-O.18469734E-08 BV4=-O.537690S0E-Ol BV5= 0.38567955E 01 CVl=-O.18454378E-06 CV2= 0.29498S0SE-09 CV3= O.304479S4E-04 DVl=-O.0061042589 DV2= 0.29591261E-04 DV3=-O.45896932E-07 EV1= O.45998748E-04 EV2=-O.2685863E-06 EV3= 0.39934387E-09

48
C
10
FV1= O.27358765E-05 FV2=-0.15322502E-07 FV3= O.23026844E-10 GV1=-O.90772758E-08 GV2= O.51475171E-10 GV3=-0.75771312E-13 HV1=-O.11706118E-08 HV2= 0.75471539E-11 HV3=-O.12424361E-13 SPECIFIC HEAT COEFFICIENTS, BASED ON BROMLEY'S DATA. CP1= 0.17875111E 01 CP2=-0.33318510E-02 CP3= 0.43603294E-05 CP4=-O.53950447E 02 CP5= O.45477025E-02 CP6= 0.7704077E-06 CP7=-0.16410434E-07 CP8=-O.14014359E '1 CP9= D.59886571E-04 CP10=-O.23457641E-06 CPl1= O.27592503E-09 CP12=-0.35977131E-02 T25-298.15 TT25=298 .15~c298 .15 TI25-1./T25 TTI25=1./TT25 TTT25=298.15:cTT25 ALG25=ALOG(298.15) BAR=1.01325 BAR2=BAR:~BAR
BAR3=BAR2~cBAR HPA=AVI-AV3~cTT25+2 .~:AV4::TI 25+3 .::AV5:cTTI 25 HPD=DV I-DV3::TT 2 5 HPE=EVI-EV3::TT25 HPB=BVI-BV3::TT25+2 .::BV4::TI 25+3 .::BV5::TTI 25 HPF=FVI-FV3::TT25 HPG=GVI-GV3::TT25 HPH=HVI-HV3:cTT25 HPC=CVl+2. ::CV3::TI 25 DO 10 I=l,NI T(I)=TC(I)+273.15 pwLCI )=PWl+PW2/TCI )+PW3::ALOG(TCI) )+PW4:cTCI) TT(I)=T(I)::TCI) TTTCI )=TTCI )::T(I) TI (I)=1./T(I) TTl CI )=l./TT(I) FTl(I)=TT(I)-TT25 FT2(I)=TI(I)-TI25 FT3(I)=TTI(I)-TTI25 TFl(I)=T(I)-298.15 TF2(I)=FTl(I) TF3(I)=TTT(I)-TTT25 TF4(I)=ALOG(T(I))-ALG25
i 4
1 , , ,
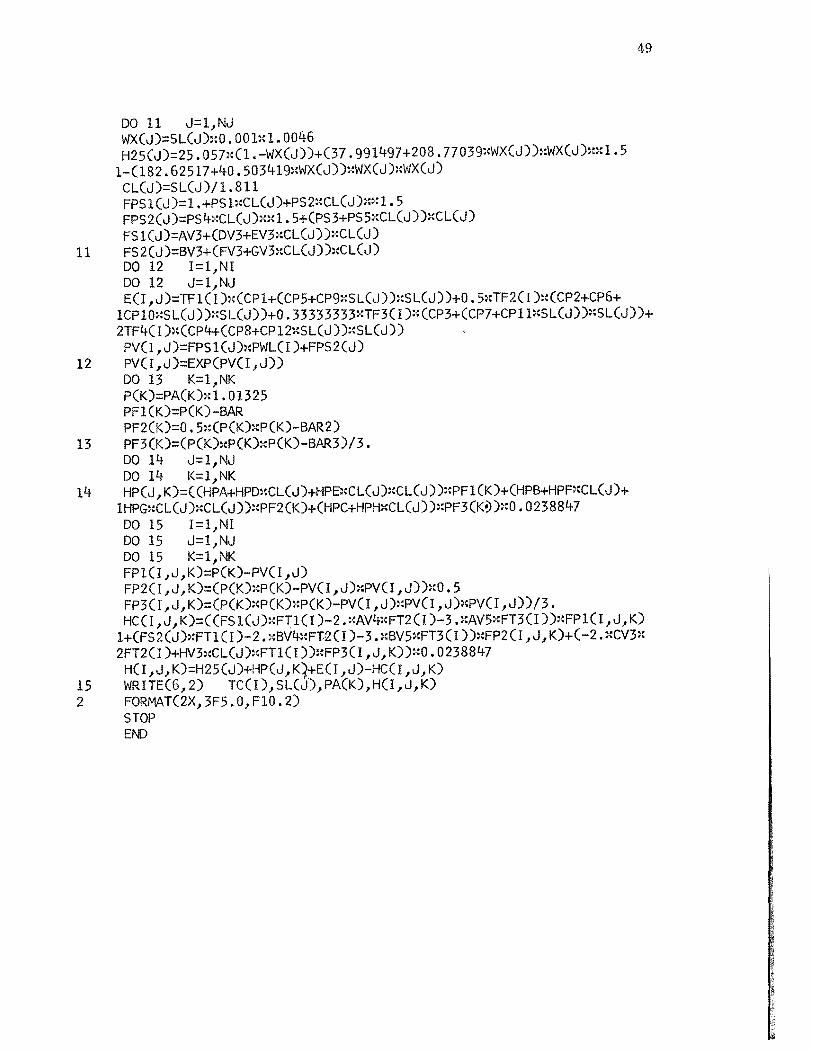
11
12
13
14
15 2
DO 11 J=l,NJ WX(J)=SL(J)::O. OOb~l. 0046 H25(J)=25. 057::(1. -WX(J))+C37 • 991497+208. 77039:MX(J))::WX(J):~::1. 5
1-082.62517+40. 503419::WX(J))::WX(J):~WX(J) CL(J)=SL(J)/1.811 FPS1(J)=1.+PS1::CL(J)+PS2::CL(J)m:1.5 FPS2(J)=PS4~(CL(J):m1. 5+(PS3+PS5::CL(J))::CL(J) FS 1 (J)=AV3+(DV3+EV3::CL(J) )::CL(J) FS 2 (J)=BV3+(FV3+GV3::CL(J) )::CL(J) DO 12 I=l,NI
49
DO 12 J=l,NJ E(I,J)=TF1(I)x(CPl+(CP5+CP9XSL(J))XSL(J))+0.5xTF2(I)X(CP2+CP6+
1CPlO::SL(J) ):SL(J) )+0. 33333333::TF3CI )::(CP3+(CP7+CPl1::SL(J)):SL(J))+ 2TF4(I )~:(CP4+(CP8+CP 12::SL(J) )~:SL(J))
pvCI ,J)=FPSl(J):PWLCI )+FPS2(J) PV(I,J)=EXP(PV(I,J)) DO 13 K=l,NK P(K)=PA(K)::1.01325 PFl(K)=P(K)-BAR PF2(K)=0.5::(P(K)::P(K)-BAR2) PF3(K)=(P(K)::P(K)::P(K)-BAR3)!3. DO 14 J=I,NJ DO 14 K=l,NK HP (J, K)=( (HPA+HPD::CL(J)+HPE::CL(J)::CL(J) )::PFl (K)+(HPB+HPF::CL(J)+
IHPG::CL(J)::CL(J))::PF2(K)+(HPC+HPH:cCL(J))::PF3(K!»::0. 0238847 DO 15 I=l,NI DO 15 J=l,NJ DO 15 K=I,NK FPl(I,J,K)=P(K)-PV(I,J) FP2CI, J, K)=(P(K)::P(K)-PV(I, J)::PVCI, J) )::0.5 FP3Cr ,J, K)=(P(K)::P(K)::P(K)-PVCI ,J)::PV(I, J)::pvCI ,J))/3. HC(I ,J, K)=((FSl(J):WTl(I )-2 .::AV4:WT2(I )-3 .::AV5::FT3CI )):wPlCI ,J,K)
1+(FS2(J)::FTl CI )-2. ::BV4::FT2(I )-3. ::BV5::FT3(I) )::FP2(I, J, K)+( -2 .::CV3:: 2FT2CI )+HV3::CL(J):WTlCI ))::FP3CI ,J,K))::O. 0238847
H(I,J,K)=H25(J)+HP(J,K1+E(I,J)-HC(I,J,K) WRITE(6,2) TCCl), SL(J), PA(K) ,HCI ,J, K) FORMAT(2X,3F5.0,FI0.2) STOP END

so
APPENDIX B. FORTRAN ARITHM.ETIC FUNCTIONS FOR VAPOR PRESSURE, ENTHALPY, HEAT OF VAPORIZATION, AND SPECIFIC VOLUME.
Since sea water is only slightly compressible, the difference in
thermal properties between sea water at vapor pressure and sea water at
a higher pressure at the same temperature is negligible if the pressure
is only 100 psi or so higher than the vapor pressure. A correction for
pressure dependency of this order of magnitude is not warranted by the
accuracy of the experimental data. In such a case, the following
arithmetic functions may be inserted in a Fortran program to compute
vapor pressure, heat of vaporization, specific volume, and enthalpy
for salinities up to 120 ppt and temperatures up to 200°C when they are
called for.
C TC=TEMP IN DEG. C., ABS. TEMP. T=TC+273.15, S=SALINITY IN PPT, C C=CHLORINITY IN PPT, C=S/1.811, WEIGHT FRACTION W=0.0010046~~S. p( C T,C)=VAPOR PRESSURE IN BARS, H(T,S,W)=ENTHALPY IN CAL./G., HV(T,5) C =HEAT OF VAPORIZATION IN CAL./G., V(T,C)=SPECIFIC VOLUME IN CC/G.
PLG(T ,C)=(l.+. 36403381E-05~:C-. 21880 179E-05~:C~ml. 5)~:(. 71023834E 2-1.7380400 lE 4/T -. 90977349E 1~:ALOG(T)+. 70871862E-02~:T)-. 89742462E-2 3~~C+.44991l49E-05::c:m1. 5-. 54721135E-05:~C:C P(T,C)=EXP(PLG(T, C)) Fl(S)=.13958222EI -(.70418481E-03+.44503885E-05x5)xS F2(5)=-.23878998E-02+(.78180236E-05-.14563778E-07xS)X5 F3CS)=.36362594E-05-(.1626327E-07-.40243346E-I0xS)x5 F4(S)=-.23078127E 1-(.43916216E O-.20799146E-02X5)X5 H(T ,S,W)=25. 0365~:(l.-W)+(. 37991497E 2~~W::::O. 5-(. 18262517E 3+
1. 40503419E 2~M):cW+. 20877039E 3::w:ml. 5):~W+FICS)::CT -298 • 15)+F2CS):: 20. 5:: (T::T -. 88893423E 5)"I-F3(S)::. 33333333~:(T::::3. -. 26503574E 8)+F4(S 3)::(ALOG(T)-. 5697596 5E 1) HV(T,S)=.85451547E 3+C-.1593941E 1+(.34368756E- 2 -.38341991E- 5
1::T)::T)::T+(.92968267E- 4 :n-.77803108E- 2 +(.195061E- 5 ::T-.38753341E-2 3)::S)::S+C-.1282345E- 4 ::T-.75123967E- 3)::S::~n.5 V(T,C)=5.5839889-(.96615179E- 2 -.872431lE- 5 ::T)::T-(.1057246E 4-.9
15122242E 5/T)/T-C::(.63811748E- 2 -(.31038891E- 4 -.47689449E 7~:T):~ 2T+C::(.53558009E- 4 -(.31012679E- 6 -.45483252E- 9 :q)~:T))
READ(5,1) rc,s 1 FORMATC2F5.0)
T=TC+273.15 C=5/1. 811 W=O. 0010046::5 VP=PCT,C) HF=HCT,5,W) HFG=HVCT,S) VF=VCT,C) WRITE(6,2) VP,HF,HFG,VF
2 FORMAT(5X,4EI6.8) STOP END