Technical Report Documentation Page - Minnesota ... to help us finalize, format, publish and...
26
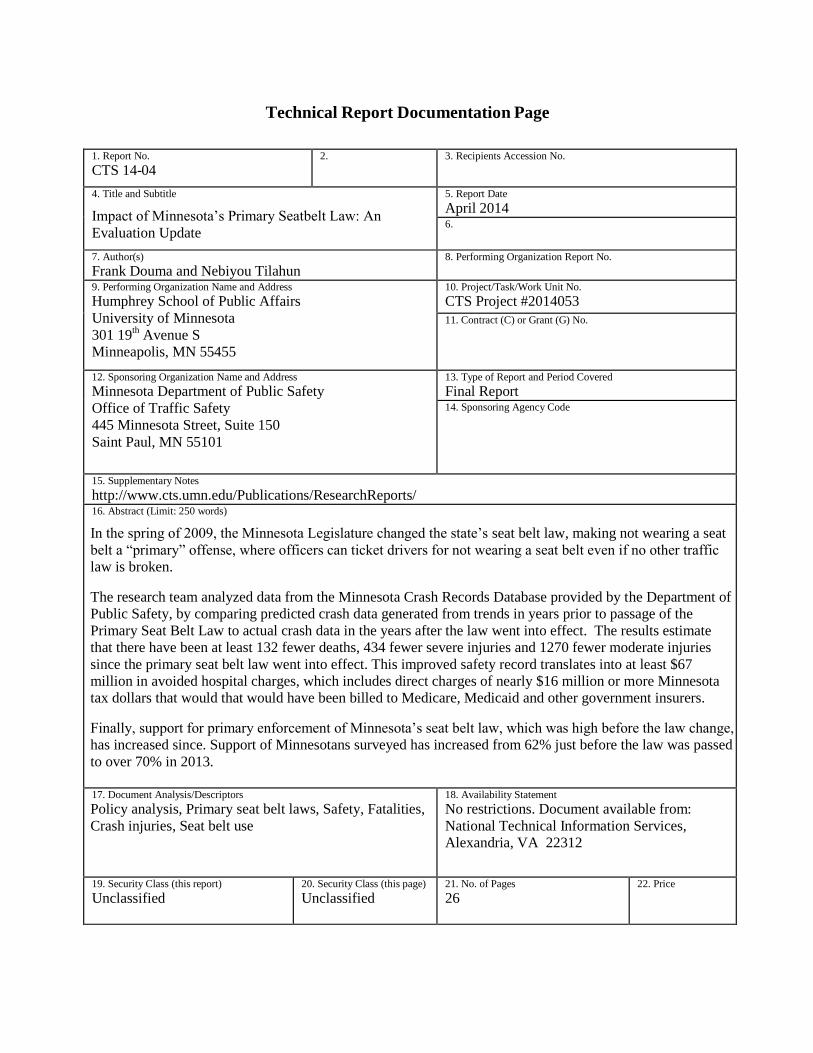
Technical Report Documentation Page 1. Report No. CTS 14-04 2. 3. Recipients Accession No. 4. Title and Subtitle Impact of Minnesota’s Primary Seatbelt Law: An Evaluation Update 5. Report Date April 2014 6. 7. Author(s) Frank Douma and Nebiyou Tilahun 8. Performing Organization Report No. 9. Performing Organization Name and Address Humphrey School of Public Affairs University of Minnesota 301 19 th Avenue S Minneapolis, MN 55455 10. Project/Task/Work Unit No. CTS Project #2014053 11. Contract (C) or Grant (G) No. 12. Sponsoring Organization Name and Address Minnesota Department of Public Safety Office of Traffic Safety 445 Minnesota Street, Suite 150 Saint Paul, MN 55101 13. Type of Report and Period Covered Final Report 14. Sponsoring Agency Code 15. Supplementary Notes http://www.cts.umn.edu/Publications/ResearchReports/ 16. Abstract (Limit: 250 words) In the spring of 2009, the Minnesota Legislature changed the state’s seat belt law, making not wearing a seat belt a “primary” offense, where officers can ticket drivers for not wearing a seat belt even if no other traffic law is broken. The research team analyzed data from the Minnesota Crash Records Database provided by the Department of Public Safety, by comparing predicted crash data generated from trends in years prior to passage of the Primary Seat Belt Law to actual crash data in the years after the law went into effect. The results estimate that there have been at least 132 fewer deaths, 434 fewer severe injuries and 1270 fewer moderate injuries since the primary seat belt law went into effect. This improved safety record translates into at least $67 million in avoided hospital charges, which includes direct charges of nearly $16 million or more Minnesota tax dollars that would that would have been billed to Medicare, Medicaid and other government insurers. Finally, support for primary enforcement of Minnesota’s seat belt law, which was high before the law change, has increased since. Support of Minnesotans surveyed has increased from 62% just before the law was passed to over 70% in 2013. 17. Document Analysis/Descriptors Policy analysis, Primary seat belt laws, Safety, Fatalities, Crash injuries, Seat belt use 18. Availability Statement No restrictions. Document available from: National Technical Information Services, Alexandria, VA 22312 19. Security Class (this report) Unclassified 20. Security Class (this page) Unclassified 21. No. of Pages 26 22. Price
Transcript of Technical Report Documentation Page - Minnesota ... to help us finalize, format, publish and...
Technical Report Documentation Page
1. Report No.
CTS 14-04 2. 3. Recipients Accession No.
4. Title and Subtitle
Impact of Minnesota’s Primary Seatbelt Law: An
Evaluation Update
5. Report Date
April 2014 6.
7. Author(s)
Frank Douma and Nebiyou Tilahun 8. Performing Organization Report No.
9. Performing Organization Name and Address
Humphrey School of Public Affairs
University of Minnesota
301 19th Avenue S
Minneapolis, MN 55455
10. Project/Task/Work Unit No.
CTS Project #2014053 11. Contract (C) or Grant (G) No.
12. Sponsoring Organization Name and Address
Minnesota Department of Public Safety
Office of Traffic Safety
445 Minnesota Street, Suite 150
Saint Paul, MN 55101
13. Type of Report and Period Covered
Final Report 14. Sponsoring Agency Code
15. Supplementary Notes
http://www.cts.umn.edu/Publications/ResearchReports/ 16. Abstract (Limit: 250 words)
In the spring of 2009, the Minnesota Legislature changed the state’s seat belt law, making not wearing a seat
belt a “primary” offense, where officers can ticket drivers for not wearing a seat belt even if no other traffic
law is broken.
The research team analyzed data from the Minnesota Crash Records Database provided by the Department of
Public Safety, by comparing predicted crash data generated from trends in years prior to passage of the
Primary Seat Belt Law to actual crash data in the years after the law went into effect. The results estimate
that there have been at least 132 fewer deaths, 434 fewer severe injuries and 1270 fewer moderate injuries
since the primary seat belt law went into effect. This improved safety record translates into at least $67
million in avoided hospital charges, which includes direct charges of nearly $16 million or more Minnesota
tax dollars that would that would have been billed to Medicare, Medicaid and other government insurers.
Finally, support for primary enforcement of Minnesota’s seat belt law, which was high before the law change,
has increased since. Support of Minnesotans surveyed has increased from 62% just before the law was passed
to over 70% in 2013.
17. Document Analysis/Descriptors
Policy analysis, Primary seat belt laws, Safety, Fatalities,
Crash injuries, Seat belt use
18. Availability Statement
No restrictions. Document available from:
National Technical Information Services,
Alexandria, VA 22312
19. Security Class (this report)
Unclassified 20. Security Class (this page)
Unclassified 21. No. of Pages
26 22. Price

Impact of Minnesota’s Primary Seat Belt Law:
An Evaluation Update
Final Report
Prepared by:
Frank Douma
Humphrey School of Public Affairs
University of Minnesota
Nebiyou Tilahun
Department of Urban Planning & Policy
University of Illinois at Chicago
April 2014
Published by:
Center for Transportation Studies
University of Minnesota
200 Transportation and Safety Building
511 Washington Ave. S.E.
Minneapolis, Minnesota 55455

Table of Contents I. Introduction ............................................................................................................................................. 1
II. Before-After Comparison of Crash Outcomes ......................................................................................... 2
Method 1: Accounting for Time-trends in the Injury/Fatality Data .......................................................... 3
Method 2: Analysis Based on Injury Data for the Three Years Pre-primary ............................................. 6
Comparison with 2012 Report .................................................................................................................. 9
III. Charges by Injury Type and Differences in Hospital Charges between Belted and Unbelted Injuries .. 10
Differences in Hospital Charges between Belted and Unbelted Travelers ............................................. 10
Differences in Hospital Charges by Persons Sustaining Different Injury Types ...................................... 11
Estimates of Savings as a Result of the Primary Seat Belt Law ............................................................... 11
IV. Hospital Charge Payers .......................................................................................................................... 13
V. Impact of Law on Seat Belt Use ............................................................................................................. 14
VI. Public Support for Primary Seat Belt Law .............................................................................................. 15
VII. Conclusions ..................................................................................................................................... 17
VIII. References ...................................................................................................................................... 18

List of Figures Figure 1. Observed and predicted injury and fatality counts on a yearly basis from 07/2004
– 06/2013.. ............................................................................................................................... 5
List of Tables Table 1. Estimated Safety Effects of the Primary Seat Belt Law Accounting for a Potential Time
Trend .................................................................................................................................................... 6
Table 2. Count of Different Injury Types in the Study Periods Before and After Primary ................ 7
Table 3. Estimated Safety Effects of the Primary Seat Belt Law (Using Average of Three Year Prior
Data) ..................................................................................................................................................... 8
Table 4. Estimate of Hospital Charges for Belted and Unbelted Injured Persons in Minnesota (in
2012 $) ................................................................................................................................................ 10
Table 5. Average Hospital Charges by Injury Type .............................................................................. 11
Table 6. Average Comprehensive Costs by Injury Severity ................................................................. 11
Table 7. Estimated Net Savings, Accounting for Time Trends, Since the Passage of the 2009
Primary Seat Belt Law (Using 2009-2012 CODES Data Injury Cost Estimates and NSC
Estimated Comprehensive Costs) .................................................................................................... 12
Table 8. Estimated Net Savings, Based on 3 Year Averages, Since the Passage of the 2009 Primary
Seat Belt Law (Using 2009-2012 CODES Data Injury Cost Estimates and NSC Estimated
Comprehensive Costs) ...................................................................................................................... 12
Table 9. Breakdown of Hospital Charges by Payer (2009-2012, expressed in 2012$) ........................ 13
Table 10. Estimated Reductions in Charges to Medicaid, Medicare, and Other Government Payers
(to the nearest 100) ............................................................................................................................ 13
Table 11: Seat Belt Usage, Observed and Self-reported, 2007 – 2011 .................................................. 14
Table 12. Support for Primary Seat Belt Law ........................................................................................ 15

Acknowledgements The authors would like to acknowledge the invaluable assistance they received whose support
made this report possible. We would like to thank the Department of Public Safety/Office of
Traffic Safety for their assistance in providing data and feedback regarding this report, as well as
for their efforts to bring this work to our attention in the first place. We are grateful for the
assistance provided by Anna Gaichas and her colleagues at the Minnesota Department of Health,
who spent considerable time preparing the CODES data to meet our needs. Our analysis of
hospital cost data would have been impossible without their tireless and dedicated support.
Finally, we would also like to thank our colleagues at the Humphrey School of Public Affairs
and the Center for Transportation Studies at the University of Minnesota for their continual
efforts to help us finalize, format, publish and publicize the findings of this report. Of course, we
also should point out that those findings, along with any omissions or errors that managed to
remain despite our best efforts, remain with us, as the authors of this work.

Executive Summary In the spring of 2009, the Minnesota Legislature changed the state’s seat belt law. Until June of
that year, not wearing a seat belt was a “secondary” offense, which allowed law enforcement
officers to ticket for failure to wear seat belts, but only when they were stopped for another
citable moving violation. On June 9, 2009, not wearing a seat belt became a “primary” offense,
where officers can ticket drivers for not wearing a seat belt without any other law being broken.
Currently, 33 states have primary seat belt laws for front seat occupants, and Minnesota is one of
16 states where the primary seat belt law applies to all seating positions. 1
In 2012, researchers at the University of Minnesota’s Humphrey School of Public Affairs
analyzed the impact of the primary seat belt law on crash fatalities and injuries in Minnesota, and
the associated hospital charges for those injuries. This work found there were 68 fewer deaths,
321 fewer severe injuries, and 432 fewer moderate injuries since the law became effective,
although minor injuries increased by 442, possibly suggesting injuries moved down to less
severe categories. Further, these reductions translated into at least $45 million in avoided
hospital charges, including a direct savings of nearly $10 million or more tax dollars that would
have paid for expenses charged to Medicare, Medicaid and other government insurers.
This report follows up on the 2012 study to discern whether the existence of the law appears to
continue to save lives and reduce the number of serious and moderate injuries.
Impact of Law on Crash Fatalities and Injuries in Minnesota Data for this report came from the Minnesota Crash Records Database, which is maintained by
the Department of Public Safety. As with the 2012 report, two methods of analysis were
utilized. The first method compared actual crash data from July 2009 - June 2013 to the
expected data based upon crash trends over time from July 2004 - June 2009. The second method
used the three year July 2006 - June 2009 pre-law change data to estimate expected crashes and
compared that to post-primary crash data from July 2009 through June 2013. Given the overall
downward trend in fatalities and serious injuries, the former method gave a more conservative
estimate, and those figures are used here.
The results indicate that the trends found in 2012 have continued. Since the law became
effective in June 2009, there have been at least 132 fewer deaths, 434 fewer severe injuries and
1270 fewer moderate injuries. Minor injuries did increase by 1110, suggesting a reduction in
severity of injuries, as was the case in the 2012 study. The 2011-2013 period saw an almost
equal reduction in fatalities as the first two years after the law change (64 vs. 68 in 2009-2011)
while there were fewer severe injury reductions in the 2011-2013 period as compared to the first
two years following the law change (113 vs. 321 in 2009-2011 period).
Impact of Law on Minnesota’s Economy
In addition to their significant emotional and societal toll, traffic crashes also have economic
consequences. Using data from the Minnesota Department of Health’s Crash Outcomes Data
Evaluation System (CODES), these safety benefits translate into at least $67 million in avoided
hospital charges, plus a great deal more in benefits from continued productivity and earnings.
1 Governors Highway Safety Association: http://www.ghsa.org/html/stateinfo/laws/seatbelt_laws.html Last accessed
March 27, 2014
This includes direct charges of nearly $16 million or more Minnesota tax dollars that would that
would have been billed to Medicare, Medicaid and other government insurers.
Impact of Law on Seat Belt Use
The public has responded to the Legislature’s action by buckling up at increased rates. The
statewide observational survey of seat belt use showed observed use rose from 86.7% in 2008 to
94.8% in 2013, and results of self-reported seat belt use from random telephone surveys showed
use rose from less than 85% in 2008 to 91% in 2013.
Public Support for Primary Seat Belt Law
Finally, support for primary enforcement of Minnesota’s seat belt law was high before the law
change and has increased since. Support of Minnesotans surveyed has increased from 62% just
before the law was passed to over 70% in 2013.

1
I. Introduction In the spring of 2009, the Minnesota Legislature changed the state’s seat belt law. Until June of
that year, not wearing a seat belt was a “secondary” offense, which allowed law enforcement
officers to ticket for failure to wear seat belts, but only when they were stopped for another
citable moving traffic violation. Beginning on June 9, 2009, not wearing a seat belt became a
“primary” offense, where officers could ticket drivers for not wearing a seat belt without any
other traffic law being broken. Currently, 33 states have primary seat belt laws for front seat
occupants and 16 states, including Minnesota, cover all seating positions. (GHSA 2014).
The safety impact of enacting and enforcing primary seat belt laws has been the focus of a
number of research studies in the U.S. Those studies estimated a potential seven to eight percent
reduction in fatalities among unbelted outboard front seat occupants age 13 and greater in
passenger vehicles (Knapp 2009).2
In 2012, researchers at the University of Minnesota’s Humphrey School of Public Affairs
analyzed the impact of the primary seat belt law on crash fatalities and injuries in Minnesota, and
the associated hospital charges for those injuries. This work found there were 68 fewer deaths,
321 fewer severe injuries, and 432 fewer moderate injuries since the law became effective,
although minor injuries increased by 442, possibly suggesting injuries moved down to less
severe categories. These reductions translated into at least $45 million in avoided hospital
charges, including a direct savings of nearly $10 million or more tax dollars that would have
been charged to Medicare, Medicaid and other government insurers.
This report follows up on the 2012 study to discern whether the existence of the law appears to
continue to save lives and reduce the number of fatalities and injuries.
2 Knapp’s paper includes a much more detailed discussion of previous research that lead to this estimate.
2
II. Before-After Comparison of Crash Outcomes The initial task of this study was to determine whether the passage of the primary seat belt law in
Minnesota has led to changes in crash outcomes to vehicle occupants. To answer this question,
the evaluators compared crash reports, which indicate the outcome of a crash (type of injury or
fatality) for each individual involved in an incident, from before and after the primary seat belt
law was passed to isolate the impact of the law from engineering, technological, legal and other
changes to the driving environment. Injury outcomes for a person involved in a crash are
classified into one of five categories: Type K (fatality), Type A (Severe), Type B (moderate),
Type C (minor), or Type N (no injuries).
One cannot determine causality, however, by simply comparing the count of particular injuries
before the law was passed to the numbers observed afterwards. Hauer (1997) cautions that many
factors, (e.g. traffic, weather, user behavior and fleet turnover) change over time, which makes
direct comparison of before and after numbers a naïve approach. In addition, other treatments
and programs designed to reach the same end may overestimate the effect of a given
intervention, if those changes are also not taken into account. Therefore, rather than directly
comparing the before numbers to current outcomes, the comparison of outcome estimates since
primary passed should be made to the unobserved (but predicted) expected count of a given
injury type during the period since primary. This estimate has the benefit of controlling for other
factors known to affect the expected number of crashes or injuries of interest. In this framework,
an attempt is made to control factors that may have changed from the period before primary.
The data for this analysis came from the Minnesota Crash Records Database for the period
07/2004 to 06/2013 and was supplied by the Minnesota Department of Public Safety. The crash
data is kept in three separate databases, one database contains information on each crash, a
second database contains information on each person in a crash and their injury outcome, and a
third database contains information on each vehicle involved. The three are linked through crash
identification, person identification, and vehicle identification variables. For this analysis, only
injuries sustained by people travelling in a motor vehicle (cars, vans, trucks, and SUVs) normally
equipped with seat belts are considered since these are the individuals whose injury outcomes the
seat belt law can affect.
Two methods were applied that provided estimates of the changes in different injury types over
the four year period since the primary seat belt law came into effect. Method 1 accounted for an
underlying time trend in the number of each injury type that had started in the period prior to the
passage of the primary seat belt law. Here each injury type is analyzed independently of the
others. Separate models are estimated for each injury type using data from before the primary
law went into effect, and these models are used to predict what would have been expected to
happen in the after (post June 2009) period if the seat belt law had remained a secondary offense
and no other changes to the motor vehicle safety laws or regulations occurred. These predictions
are then compared to what was observed after June 9, 2009 through June 30, 2013.
Method 2 looks at data from July 2006 – June 2009 and used the counts of those years to project
out what the expected injury types of each class would be after that time while also accounting
for the total number of crashes that occurred during that period. This assumes that the effect of
the seat belt law is to increase the rate of wearing a seat belt, which alters what would have
happened to the driver/passengers in vehicles involved in a crash, which in turn alters the

3
likelihood of a person getting into one of the classes of injuries referenced on page 2. This effect
would express itself through an increase/decrease in the count of injuries of a given type that is
observed post primary after controlling for other factors that may change the number of injuries
observed. This also assumed that the seat belt law had no impact on whether a vehicle was
actually involved in a crash.
While method 1 required estimating a time trend using limited years of data (5 years), it provides
a conservative estimate of the changes in fatalities and injuries in the years after passage of the
primary seat belt law by accounting for the overall decline in injury counts in the period prior to
the law change.
Method 1: Accounting for Time-trends in the Injury/Fatality Data
A plot of the counts of each injury type for the five years preceding the primary seat belt law
suggests that there is a time trend where annual counts of severe injury and fatalities have been
declining. For this analysis, the annual count of each injury/fatality was assumed to be a Poisson
random variable with mean Yt which depends on the time period of observation. This assumes
that over time, different factors (policy, enforcement or otherwise) have from year to year been
affecting the frequency of different injury types at some rate. Instead of trying to account for
these factors explicitly, the pace of change was estimated through a best-fit model for the period
before primary. This model was then used to predict the count of each injury type in the period
after primary.
The model used for the expected count of a particular injury level at period t is ln(𝑌𝑡) = 𝛼 +𝛽𝑓(𝑡), with f(t) being either equal to t or ln(𝑡). The variables and are estimated using the
pre-06/2009 data by a generalized linear model. These models are then used to estimate the
number of crash/injury types expected in the after period had no changes been made to the law.
We define, the following variables, following Hauer (1997):
it: The expected number of target injuries or fatalities i in the after period t had The
passage of the seat belt law not occurred. This value is predicted based on the
estimated model.
it: The number of target injuries or fatalities i in the after period t after passage of the
seat belt law. This value is estimated by using the observed counts in the after
period.
it: The expected change in the number of injury type i in time period t.
The estimated model’s predictions along with the observed injury/fatality counts are shown in
Figure 1. For a given injury type, the model’s predictions for the after period are then estimated
by �̂�t for each period t. The counts for the after period serve as the estimates for the mean
crashes in the after periods (�̂�t). The expected change is estimated by 𝛿�̂� = 𝜋�̂� − 𝜆�̂�.
Table 1 summarizes the predictions from the model and the estimated changes in each injury
type in the period after primary as a result of the change in the seat belt law. Positive values in
Table 1 imply a reduction in the indicated injury type while negative numbers indicate an
increase in the indicated injury type. As can be seen from the table, estimates of change for

4
fatalities and injuries types A and B are positive. A large increase in Injury type C is also
estimated. Specifically, the estimates are (plus or minus standard deviation):
132 ± 49 fewer fatalities;
434 ± 84 fewer Type A injuries; and
1,270 ± 221 fewer Type B injuries.
The estimates also indicate that the number of Type C injuries experienced was 1,110 + 400
more than would have been expected, and the number of no-injury cases has decreased by
12,300 + 1,062. As can be seen in Table 1, type N injuries show substantial fluctuations year on
year and much of this reduction comes from the period 07/2011-06/2012. This fluctuation may
be due to the fact that crashes with no injuries may go unreported.

5
Figure 1. Observed and predicted injury and fatality counts on a yearly basis from 07/2004 – 06/2013. Each
year spans the 12 months from July to end of June of the next year.

6
Table 1. Estimated Safety Effects of the Primary Seat Belt Law Accounting for a Potential Time
Trend
Type K Type A Type B Type C Type N
�̂�year1 327.8 1,005.5 6,561.3 20,702.2 145,554.6
�̂�year2 318.4 957.2 6,336.5 20,160.2 143,262.5
�̂�year3 310.4 917.3 6,148.1 19,632.5 141,306.3
�̂�year4 303.5 883.5 5,986.5 19,118.5 139,602.9
�̂�year1 293.0 845.0 6,266.0 20,183.0 138,082.0
�̂� year2 278.0 794.0 6,172.0 21,444.0 149,848.0
�̂�year3 273.0 880.0 5,578.0 18,870.0 128,946.0
�̂� year4 284.0 811.0 5,746.0 20,226.0 140,550.0
�̂�tot 1,260.1 3,763.5 25,032.4 79,613.4 569,726.3
�̂� tot 1,128.0 3,330.0 23,762.0 80,723.0 557,426.0
�̂� 132.1 433.5 1,270.4 -1,109.6 12,300.3
SD(�̂�) 48.9 84.2 220.9 400.4 1,061.7
Method 2: Analysis Based on Injury Data for the Three Years Pre-primary
The period before primary for this analysis spans the three year period from 7/2006 through
6/2009 and the period after primary spans the four year period from 7/2009 through 6/2013. The
three year time period before primary was chosen so that there was sufficient data to predict what
the injuries for the period after primary would have been while limiting the effect of confounding
factors, such as vehicle fleet turnover, which could impact the results. The four year period after
primary is the maximum time period for which data was available. While the analysis did adjust
for the total number of crashes in the period after primary which may have resulted from
different factors including other policy interventions, it assumed that the proportion of crashes
that fall into any of the categories is relatively stable and can be used to estimate future injury
proportions given total crashes. The effect of the seat belt law is assumed to be expressed
through an increase/decrease in the count of injuries of a given type relative to the total injuries
observed post-primary.
The unit of analysis in this study was the number of injuries of each type observed in this period.
The numbers of injuries sustained in the periods before and after primary are given in Table 2.

7
Table 2. Count of Different Injury Types in the Study Periods Before and After Primary
Period Type K Type A Type B Type C Type N Total
7/2006-6/2007 379 1,316 7,774 22,584 156,486 188,539 7/2007-6/2008 371 1,113 7,282 21,945 152,202 182,913 7/2008-6/2009 317 1,059 6,703 21,067 147,420 176,566 7/2009-6/2010 293 845 6,266 20,183 138,082 165,669 7/2010-6/2011
278 794 6,172 21,444 149,848 178,536
7/2011-6/2012
273 880 5,578 18,870 128,946 154,547
7/2012-6/2013
284 811 5,746 20,226 140,550 167,617
The basic analysis here followed Hauer (1997) for before-after studies. The estimation of
changes in the after period involved estimating the following variables:
i: The expected number of target injuries i in the after period had the passage of the
seat belt law not occurred. This value is predicted based on the observed counts in
the before period (K) along with some adjustment factors.
i: The number of target injuries i in the after period after passage of the seat belt
law. We estimate this value by using the observed counts (L) in the after period.
i=I -I : The expected change in the number of injury type.
In addition, estimates of the variance of , , and were made. The counts of each injury type
were treated as a Poisson random variable. The estimation of for injury type i was done by
taking the before period count and adjusting for factors that may have affected the total numbers
observed in the after period in addition to the seat belt law. Duration of the before and after
periods, as well as weather conditions and other factors such as total Vehicle Miles Traveled
(VMT), and occupancy in vehicles, played a role in contributing to crashes. While such variables
can be used as part of the adjustment factors, since they eventually express themselves in the
total count of injuries observed in the before and after periods, the adjustment factor used here
employed the total number of crashes reported for the before and after periods.
Thus we estimate and by �̂�and �̂� for any injury type to be:
�̂�= L and 𝝅 ̂=𝒓�̂�*K, where 𝒓�̂�=Ca/Cb,
The variable 𝒓�̂� is an estimator of rc, which is an adjustment factor that incorporates the changes
in other factors that may have led to a reduction in total number of injuries, and hence injuries of
each kind. Ca and Cb are the after and before total injury counts. L is the observed counts of the

8
injury type under consideration in the after period, K is the count of injury type under
consideration in the before period. An additional assumption is that the effect of the different
factors that have led to lower crash numbers in the after period, which we attempt to capture by
rc, affects each injury type in the same way. A method which would lead to the same estimates is
to treat the distribution of outcomes as a multinomial variable with probabilities ki/Cb for each
injury type and to use these probabilities to estimate the number of injuries in the after period by
multiplying by Ca.
Since injury numbers are counts observed over a given time period, we treat them as Poisson
random variables. The Poisson distribution has the property that its mean and variance are equal.
Thus our variance estimates will be var(�̂�var(�̂�)+var(�̂�) = var(rc*K)+L. Since the prediction of �̂� involves the multiplication by rc, which is itself derived from other random variables, its
variance estimate also enters into the estimation of the variance of �̂� (see Hauer (1997) pp. 95-
113 for details).
Applying this analysis to the values given in Table 2 provided estimates of reduction (or
increase) in each injury type in the after period as shown in Table 3. Negative values in Table 3
suggest that there has been an increase in period after primary for the particular injury type.
Positive values suggest there has been a decrease in the injury type under consideration.
Table 3. Estimated Safety Effects of the Primary Seat Belt Law (Using Average of Three Year Prior
Data)
Type K Type A Type B Type C Type N
hat 1,297.4 4,241.3 26,458.1 79,762.2 554,609.9
hat 1,128 3330 23,762 80,723 557,426
Var(hat) 1,583.2 5217 34,500 118,144.3 1,697,260.1
Var(hat) 1,128 3,330 23,762 80,723 557,426
hat 169.4 911.3 2,696.1 -960.8 -2,816.1
SD(hat) 52.1 92.5 241.4 445.9 1,501.6
This analysis indicates that, after adjusting for changes in total number of crashes in the period
since the law was passed, there have been
169 + 52 fewer fatalities;
911 + 93 fewer Type A injuries; and
2696 + 241 fewer Type B injuries
since the mandatory seat belt law went into effect. While these serious injury types have seen a
decline, other minor (type C) and no injury (type N) cases have increased by the following
estimated amounts:
961 + 446 minor injuries; and
2816 + 1502 crashes with no injuries.

9
Comparison with 2012 Report3
These results indicate that the trends found in 2012 have continued. In both time periods
analyzed, the time trend method (method 1) provided a more conservative estimate of the change
in crashes and related injuries. Using this method, which projects a continued reduction in
fatalities each year, and despite an increase in fatalities from 2012 -2013 (from 273 to 284), there
were still at least 30 fewer fatalities each year since the primary seat belt law was passed than
predicted had the primary seat belt law not been passed. The 2011-2013 period saw an almost
equal reduction in fatalities as the first two years: 68 in 2009-2011 and 64 in 2011-2013.
A trend towards reduced severity of injuries continued. While there were only 113 fewer severe
(A) injuries than predicted had the law not passed in the 2011-2013 period, compared to 321
during the first 2 years following the law change, the data show the reduction in moderate (B)
injuries was almost twice as high in 2011-2013 (838) than in the first two years (432). As found
in the earlier report, there were more minor (C) injuries than predicted, but while the earlier
report found 810 more Type C injuries, there were only an additional 300 more than predicted in
2011-2013. Finally, there continued to be fewer crashes with no injuries than would have been
expected had the law not passed. The 2012 report found there were 722 fewer crashes with no
injuries than predicted, but the data show a very large reduction of nearly 12,000 crashes with no
injury in the subsequent 2 years. Given that the researchers assumed that the seat belt law had no
impact on whether a vehicle was actually involved in a crash, this reduction may be due to any
number of extraneous factors not related to seat belt use, e.g. reporting of people who are not
injured in a crash is not as rigorous.
3 This section compares shifts observed in the two consecutive two year periods after the Primary Seat Belt Law
went into effect. While the patterns are of interest, the shorter two year periods are also more susceptible to random
shifts in any given year than the four year analysis.

10
III. Charges by Injury Type and Differences in Hospital Charges
between Belted and Unbelted Injuries This section reviews the potential economic impacts from belted and unbelted injured vehicle
occupants, as well as the hospital and total economic impacts of vehicle injuries. These values,
along with the changes in expected injury types are used to estimate the economic impacts of the
primary seat belt law.
Changing the likely crash outcome through seat belt use has implications beyond the personal
wellbeing of those involved in the crash. Medical expenses for serious injuries are considerable
to the injured as well as other stakeholders, including public institutions, which may end up
covering part or all of the costs. The analysis in this section looks first at the differences in costs
between belted and unbelted persons injured in a crash. Second, it looks at the difference in
costs by injury type. Third, it estimates the total change in economic costs as a result of
injuries/fatalities sustained in a vehicle crash.
Differences in Hospital Charges between Belted and Unbelted Travelers
The data used for this analysis is from 2009-2012 Crash Outcome Data Evaluation System
(CODES) which is linked to traffic crash records and is provided by the Minnesota Department
of Health. The data has been preprocessed to handle missing values through multiple
imputations. Five imputations of each record are present in this data. In addition to crashes that
are linked to hospital records, the data also includes two subset of records – first, those which
arise when a person is treated in a hospital due to a crash but the crash is not recorded in the
crash data base; and second, where a person experiences a crash but is not medically treated.
The latter records are assigned a $0.00 medical charge. In the analysis in this section, only
records for which injury and charge information are available, with the injured having been
inside a motor vehicle or truck and over the age of 8, is used in calculating these average
charges. The researchers made the assumption that cases where injury classifications of A, B, or
C are given and charges of $0.00 were reported are not likely. The researchers allowed for
charges of $0.00 for persons for whom no injuries were reported. Persons who died at the crash
site are excluded from this analysis.
Average hospital charge values for the period 2009-2012, separated by whether or not the person
was wearing a seat belt, are provided in Table 4. The values are expressed in 2012 dollars using
the Consumer Price Index (CPI) for these years. For this period, the average unbelted injury
charges were over 25 times greater than the average belted injury.
Table 4. Estimate of Hospital Charges for Belted and Unbelted Injured Persons in Minnesota (in
2012 $)
Year Belted Unbelted
2009 $860 $18,150
2010 $966 $22,715
2011 $1,004 $28,961
2012 $1,288 $36,858
Average (Weighted) $1,025 $25,649

11
Differences in Hospital Charges by Persons Sustaining Different Injury Types
The CODES data for hospital-treated motor vehicle traffic injuries, excluding pedestrians,
bicyclists and motorcyclists between January 2009-December 2012, is used to compute average
costs by injury category. The data included a description of the type of injury as indicated by the
Injury Severity Score (ISS) and the associated charges with these injuries. Total charges for each
person were aggregated over the several visit records. In addition, injury severity scores were
converted into one of the classifications based on the following ranges (ISS=1-4 as C, ISS=5-15
as B and ISS 16+ as A). For consistency with the 2012 report, the same classification is used
here. Average charges for each injury type for the 2009-2012 period is given in Table 5.
Table 5. Average Hospital Charges by Injury Type
Injury Type Average Hospital
Charges
A (Severe injury) $94,943 B (Moderate injury) $21,927
C (Minor injury) $3,296 N (No injury) $135
The National Safety Council (2012) estimates a comprehensive cost of motor vehicle crashes by
injury type, which includes such costs as medical expenses, wage and productivity losses,
vehicle damage, employers’ uninsured costs for 2009 as well as a measure of the value of lost
quality of life which are considerably larger than the above estimates. The NSC suggests that
these values ought to be used in cost-benefit analysis. The 2012 numbers are given in Table 6.
Table 6. Average Comprehensive Costs by Injury Severity
Injury Type Comprehensive costs
K (Fatality) $4,538,000
A (Severe injury) $230,000
B (Moderate injury) $58,700
C (Minor injury) $28,000
N (No injury) $2,500
Estimates of Savings as a Result of the Primary Seat Belt Law
The discussion in the preceding sections allows the calculation of i) hospital costs avoided as a
result of the different injury outcomes that require hospitalization since the passage of the
primary seat belt law, and ii) what the total change in comprehensive economic costs was in the
state of Minnesota using the comprehensive cost estimates from the NSC. Tables 7 and 8
summarize these results.

12
Table 7. Estimated Net Savings, Accounting for Time Trends, Since the Passage of the 2009
Primary Seat Belt Law (Using 2009-2012 CODES Data Injury Cost Estimates and NSC Estimated
Comprehensive Costs)
Injury Type
Change in Number
of Injuries
Total Hospital Charges
Comprehensive Costs
Type K 132 $599,469,800
Type A 434 $41,157,731 $99,705,000
Type B 1,270 $27,855,597 $74,572,480
Type C -1,110 ($3,656,809) ($31,068,800)
Type N 12,300 $1,656,174 $30,750,750
Net Estimate: $67,012,692 $773,429,230
Table 8. Estimated Net Savings, Based on 3 Year Averages, Since the Passage of the 2009 Primary
Seat Belt Law (Using 2009-2012 CODES Data Injury Cost Estimates and NSC Estimated
Comprehensive Costs)
Injury Type
Change in Number
of Injuries
Total Hospital Charges
Comprehensive Costs
Type K 169 $768,873,340
Type A 911 $86,518,582 $209,592,100
Type B 2,696 $59,116,619 $158,261,657
Type C -961 ($3,166,290) ($26,901,280)
Type N -2,816 ($379,167) ($7,040,125)
Net Estimate: $142,089,743 $1,102,785,692
Under the more conservative estimate in Table 7, the estimated reduction in medical charges is
over $67 million since passage of the Primary Seat Belt Law through June 30, 2013. In addition,
the comprehensive economic costs avoided as a result of a reduction in injuries and fatalities are
estimated at $773 million.

13
IV. Hospital Charge Payers This section reviews who paid for the injury charges that are recorded in the CODES data to get
a sense of what proportion of these charges are reimbursed by public programs. For these
purposes, records from the CODES data starting from January 2009-December 31, 2012 were
used. The total hospital charges summed over all visits of persons in the database was
$1,056,608,584. Charges were assigned to payers after dividing the different payers into a
smaller set of categories. While there may be multiple payers for a given injury, since the
breakdown of payer costs is not available, all costs in this case are assigned to the primary payer
(payer1 in the data). The breakdown of charges by the primary payer is as shown in Table 9.
While the charges reflect the highest amount an insurer may pay, either because of the presence
of multiple payers or due to insurer policies, actual payments are likely to be less than what
hospitals charge for the care provided.
Table 9. Breakdown of Hospital Charges by Payer (2009-2012, expressed in 2012$)
Payer Charges Percent of Total Charges Medicaid $ 90,744,812 9%
Medicare $ 110,937,313 10%
Commercial Insurance $ 725,440,375 69%
Other Government $ 51,166,083 5%
Self/other $ 59,106,257 6%
Workers comp $ 19,210,744 2%
Total $1,056,605,584 100%
For this analysis, Medicaid, Medicare, and Other Government payers are of particular interest as
their payments come from tax revenues. As the table shows, charges where Medicaid was the
primary payer were about 9%, Medicare another 10%, and government or government-related
entities were primary payers for another 5% of these hospital charges. Assuming that the
medical charges avoided (from Tables 7 and 8) would have been applied in similar proportions
to these payers, the estimated reductions in charges to Medicaid, Medicare, and other
Government payers range from $16 million to $34 million depending on the crash reduction
estimation procedure, as shown in Table 10.
Table 10. Estimated Reductions in Charges to Medicaid, Medicare,
and Other Government Payers (to the nearest 100)
Payer Time Trend 3 Year Average
Medicaid $ 5,755,300 $ 12,203,100
Medicare $ 7,035,900 $ 14,918,600
Other Government Insurance
$ 3,245,100 $ 6,880,700
Total $ 16,036,300 $ 34,002,400

14
V. Impact of Law on Seat Belt Use Since Minnesota changed its seat belt law by making it a primary reason for an officer to ticket,
the public has responded by buckling up at increased rates. The Minnesota Department of Public
Safety (DPS) measures seat belt use in two different ways. The primary method is through an
observational survey, where a sample of vehicles is observed on various roadways, and use of
seat belts by the occupants is noted by the surveyor. This method and results are reported to and
certified by the National Highway Traffic Safety Administration (NHTSA). In addition, DPS
also conducts a statewide random telephone survey of Minnesota residents to obtain information
about the effectiveness of various safety campaigns, including the seat belt laws. As part of this
survey, respondents are asked to state their seat belt use. As shown in Table 10, the statewide
observational seat belt use rate has continually risen from 86.7% in 2008 to 92.7% in 2011.
During this same time period, respondents to the telephone survey who stated they used seat
belts “all of the time” rose from less than 84% in 2007 to 92% in 2011 (Corona Research 2007,
2011). While this number appears to have stabilized at 91% in 2012 and 2013, an additional
small percentage each year since 2010 has indicated they wear their seat belts “most of the time”
to bring the total up to 97% each year.
Table 11: Seat Belt Usage, Observed and Self-reported, 2007 – 2011
Seat Belt Use Percent Observed Percent Self-reported
2007 87.8 84
2008 86.7 85
2009 (after primary passed) 90.2 88
2010 92.3 90
2011 92.7 92
2012 93.6 91
2013 94.8 91

15
VI. Public Support for Primary Seat Belt Law Support for the primary seat belt law has also been measured. In statewide telephone surveys that
were conducted in conjunction with “Click It or Ticket” (COIT) campaigns, respondents were
asked, “In your opinion, SHOULD police be allowed to stop a vehicle if they observe a seat belt
violation when no other traffic laws are being broken?” (Corona Research, 2007 – 2011). Table
12 shows that support increased from 62% just before the law was passed to over 70% since it
was passed. However, unlike the use of seat belts, support for the primary seat belt law has
varied over time. While the most recent level of support, 70%, is not much different from the
level in 2007 (68%), the low point of 62% occurred shortly before the law was passed in 2009,
returning to 68% after the law was passed and reaching a high of 75% in 2010 before falling
back to 70% in 2011. It is interesting to note that most of these changes occurred at the same
time that the law was most prominently debated in the legislature. It was introduced as a bill in
2007 and 2008, before passing in 2009, after which time it enjoyed its greatest popularity.
However, the support dwindled a bit in 2011, when a bill to repeal the law was introduced,
putting the concept up for public debate once again. Regardless of this volatility, however, the
concept of allowing police to stop a vehicle for an occupant not wearing his or her seat belt has
always been supported by a strong majority of Minnesotans surveyed.
Table 12. Support for Primary Seat Belt Law
Time of Survey Percent Supporting Primary Seat Belt Law
2007 (both): 68%
2008 (pre-campaign): 70%
2008 (post-campaign): 65%
2009 (before primary passed, pre-campaign): 62%
2009 (after primary passed, post-campaign): 68%
2010 (pre-campaign): 74%
2010 (post-campaign): 75%
2011 (pre-campaign): 74%
2011 (post-campaign): **70%
DPS changed its method of determining public support for the primary seat belt law in 2012 and
2013, asking simply, “How important do you think it is for the Minnesota Seat Belt Law to be
Primary?” In each year, 58% of respondents stated that it was “very important,” and an
additional 16% (17% in 2013) stated it was “fairly important.” Taken together, these equal the
highest numbers (74% - 75%) seen in the earlier surveys.
Minnesota is not unique in its level of support for a primary seat belt law. In a national survey
conducted by the Center for Excellence in Rural Safety (CERS) in 2010, 72% of respondents
In 2009, respondents were more likely to support a primary seat belt law after the CIOT campaign (an increase of
six percentage points was observed). This difference was statistically significant at the 95% level.
**
In 2011, support for the primary seat belt law decreased by 4 percentage points from the pre-CIOT campaign to
the post-CIOT campaign. This difference was statistically significant at the 90% level

16
supported primary seat belt laws (41% “very supportive,” 31% “somewhat supportive”),
(Munnich and Loveland).
An additional question added by DPS in 2012, however, provides even greater insight into the
support for the primary seat belt law, and its impact on behavior. This question asked, “How
likely do you think you are to get a ticket if you don’t wear your seat belt?” Roughly 70% (72%
in 2013) stated that they believed it was very likely or somewhat likely they would be ticketed,
with the number in the former category increasing from 35% in 2012 to 39% in 2013.
The increase in the percentage of those thinking it is very likely they will be ticketed, when
combined with a comparison of the number of people who buckle up most or all of the time
points to a possible direct impact of the law on people’s behavior. While the percent of
respondents who believe a ticket is very likely remains less than 40%, and support for the law
remains between 70 and 75%, nearly 19 out of every 20 people are wearing their seat belts.
Consequently, it appears that as many as 15 to 20 percent of Minnesotans wear their seat belt due
to the external motivation of obeying the law.

17
VII. Conclusions It is clear that Minnesota’s primary seat belt law continues to have its intended effect. Fatalities
and severe and moderate injuries from motor vehicle crashes continue to occur at lower rates
than would have otherwise been predicted since the law went into effect in June 2009. This has
translated into at least $67 million in avoided hospital charges, plus a great deal more in benefits
from continued productivity and earnings. This includes direct charges of nearly $16 million or
more Minnesota tax dollars that would that would have been billed to Medicare, Medicaid and
other government insurers. Further, while the law continues to enjoy the support of more than
70% of all Minnesotans, the percentage wearing their seat belts is at an all-time high, 94.8
percent. The greater percentage wearing their seat belts than supporting the law indicates that a
number of Minnesotans now buckle up because they have to, and may not if they were not
required to do so by law. When this increased seat belt use caused by the law is combined with
the reduction in fatalities and injuries, it further demonstrates that more people survive, and even
walk away from, crashes that would have had different results if the primary seat belt law had
not been in effect.

18
VIII. References Corona Research (2007), Seat Belt Usage and Campaign Awareness Survey, 2007:
Minnesota Department of Public Safety, Office of Traffic Safety. Denver, CO.
Corona Research (2008), Seat Belt Usage and Campaign Awareness Survey, 2008:
Minnesota Department of Public Safety, Office of Traffic Safety. Denver, CO.
Corona Research (2009), Seat Belt Usage and Campaign Awareness Survey, 2009:
Minnesota Department of Public Safety, Office of Traffic Safety. Denver, CO.
Corona Research (2010), Seat Belt Usage and Campaign Awareness Survey, 2010:
Minnesota Department of Public Safety, Office of Traffic Safety. Denver, CO.
Corona Research (2011), Seat Belt Usage and Campaign Awareness Survey, 2011:
Minnesota Department of Public Safety, Office of Traffic Safety. Denver, CO.
Corona Insights, (2012). 2012 Traffic Safety Behaviors Survey: Minnesota Department of
Public Safety, Office of Traffic Safety. Denver, CO.
Corona Insights, (2013). 2013 Traffic Safety Behaviors Report: Minnesota Department of
Public Safety, Office of Traffic Safety. Denver, CO.
Governors Highway Safety Association (GHSA):
http://www.ghsa.org/html/stateinfo/laws/seatbelt_laws.html Last Accessed March 27, 2014.
Hauer, E., “Observational Before-After Studies in Road Safety: Estimating the effect of
highway and traffic engineering measures on road safety” (1997) Emerald Group Publishing
Limited, Bingley, U.K.
Knapp, K. et. al., “Feasibility of a Quantitative Rural Safety Policy Improvement Index
(RSPII): Phase I” (2009). Available at
http://www.cts.umn.edu/Publications/ResearchReports/reportdetail.html?id=1766 last
accessed March 1, 2012.
Knapp, K. and Utecht, B., “Application of a Rural Safety Policy Improvement Index (RSPII)
Framework” (2010). Available at
http://www.cts.umn.edu/Publications/ResearchReports/reportdetail.html?id=1926 last
accessed March 1, 2012.
Minnesota Departments of Education, Health, Human Services, & Public Safety “Minnesota
Student Survey: 1992-2010 Trends,” p. 40. Available at:
http://www.health.state.mn.us/divs/chs/mss/trendreports/msstrendteport2010.pdf Last
accessed March 6, 2012.
Minnesota Department of Health. (2014). Crash Outcome Data Evaluation System [Data
files: January 2009 – December 2012]. Provided by the Minnesota Department of Health.
19
Minnesota Department of Public Safety, Minnesota Crash Records Database, available at
https://dps.mn.gov/divisions/ots/reports-statistics/Pages/default.aspx last accessed March 1,
2012.
Munnich, L., and Loveland, J., “Do Americans Oppose Controversial Evidence-Based Road
Safety Policies?” Transportation Research Record: Journal of the Transportation Research
Board, No. 2213, Transportation Research Board of the National Academies, Washington,
D.C., 2011, pp. 9–12.
National Safety Council, “Estimating the Costs of Unintentional Injuries” available at:
http://www.nsc.org/news_resources/injury_and_death_statistics/Pages/EstimatingtheCostsof
UnintentionalInjuries.aspx, accessed: March 28, 2014.