Technical Report ‘Culvert A’ Hydraulic Analysis · PDF fileTechnical Report...
10
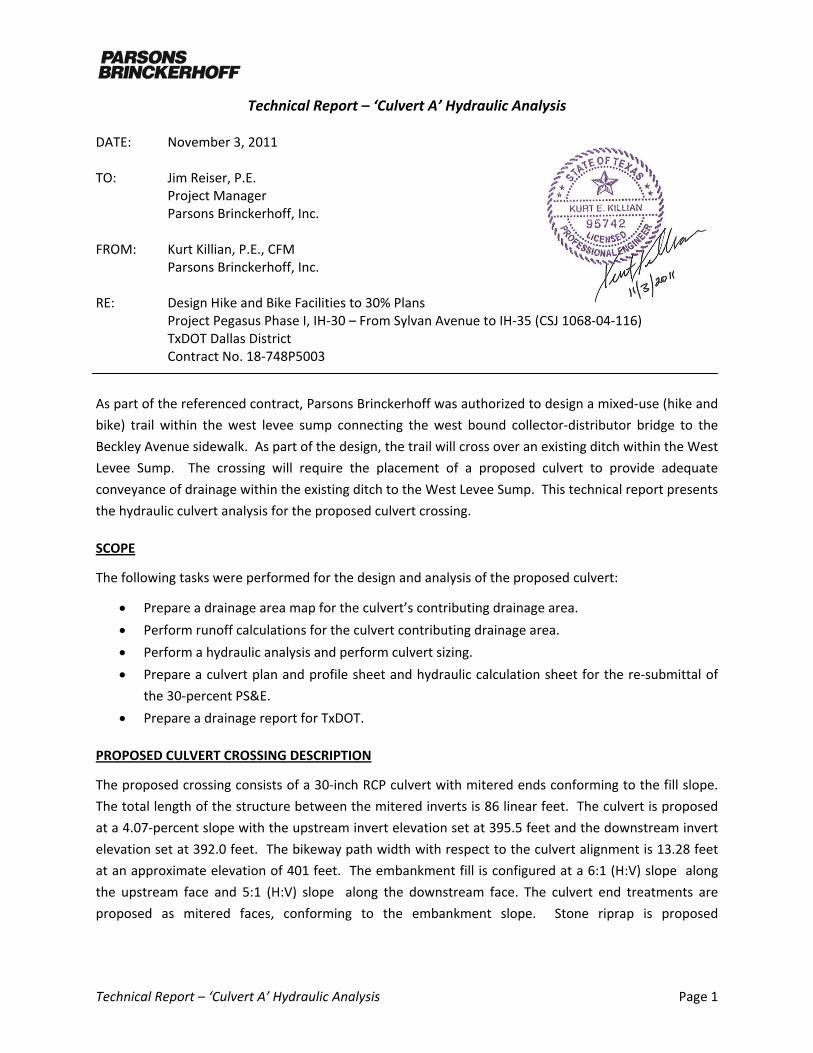
Technical Report – ‘Culvert A’ Hydraulic Analysis Page 1 Technical Report – ‘Culvert A’ Hydraulic Analysis DATE: November 3, 2011 TO: Jim Reiser, P.E. Project Manager Parsons Brinckerhoff, Inc. FROM: Kurt Killian, P.E., CFM Parsons Brinckerhoff, Inc. RE: Design Hike and Bike Facilities to 30% Plans Project Pegasus Phase I, IH‐30 – From Sylvan Avenue to IH‐35 (CSJ 1068‐04‐116) TxDOT Dallas District Contract No. 18‐748P5003 As part of the referenced contract, Parsons Brinckerhoff was authorized to design a mixed‐use (hike and bike) trail within the west levee sump connecting the west bound collector‐distributor bridge to the Beckley Avenue sidewalk. As part of the design, the trail will cross over an existing ditch within the West Levee Sump. The crossing will require the placement of a proposed culvert to provide adequate conveyance of drainage within the existing ditch to the West Levee Sump. This technical report presents the hydraulic culvert analysis for the proposed culvert crossing. SCOPE The following tasks were performed for the design and analysis of the proposed culvert: • Prepare a drainage area map for the culvert’s contributing drainage area. • Perform runoff calculations for the culvert contributing drainage area. • Perform a hydraulic analysis and perform culvert sizing. • Prepare a culvert plan and profile sheet and hydraulic calculation sheet for the re‐submittal of the 30‐percent PS&E. • Prepare a drainage report for TxDOT. PROPOSED CULVERT CROSSING DESCRIPTION The proposed crossing consists of a 30‐inch RCP culvert with mitered ends conforming to the fill slope. The total length of the structure between the mitered inverts is 86 linear feet. The culvert is proposed at a 4.07‐percent slope with the upstream invert elevation set at 395.5 feet and the downstream invert elevation set at 392.0 feet. The bikeway path width with respect to the culvert alignment is 13.28 feet at an approximate elevation of 401 feet. The embankment fill is configured at a 6:1 (H:V) slope along the upstream face and 5:1 (H:V) slope along the downstream face. The culvert end treatments are proposed as mitered faces, conforming to the embankment slope. Stone riprap is proposed
Transcript of Technical Report ‘Culvert A’ Hydraulic Analysis · PDF fileTechnical Report...
Technical Report – ‘Culvert A’ Hydraulic Analysis Page 1
Technical Report – ‘Culvert A’ Hydraulic Analysis DATE: November 3, 2011 TO: Jim Reiser, P.E. Project Manager Parsons Brinckerhoff, Inc. FROM: Kurt Killian, P.E., CFM Parsons Brinckerhoff, Inc. RE: Design Hike and Bike Facilities to 30% Plans Project Pegasus Phase I, IH‐30 – From Sylvan Avenue to IH‐35 (CSJ 1068‐04‐116) TxDOT Dallas District Contract No. 18‐748P5003
As part of the referenced contract, Parsons Brinckerhoff was authorized to design a mixed‐use (hike and
bike) trail within the west levee sump connecting the west bound collector‐distributor bridge to the
Beckley Avenue sidewalk. As part of the design, the trail will cross over an existing ditch within the West
Levee Sump. The crossing will require the placement of a proposed culvert to provide adequate
conveyance of drainage within the existing ditch to the West Levee Sump. This technical report presents
the hydraulic culvert analysis for the proposed culvert crossing.
SCOPE
The following tasks were performed for the design and analysis of the proposed culvert:
• Prepare a drainage area map for the culvert’s contributing drainage area.
• Perform runoff calculations for the culvert contributing drainage area.
• Perform a hydraulic analysis and perform culvert sizing.
• Prepare a culvert plan and profile sheet and hydraulic calculation sheet for the re‐submittal of
the 30‐percent PS&E.
• Prepare a drainage report for TxDOT.
PROPOSED CULVERT CROSSING DESCRIPTION
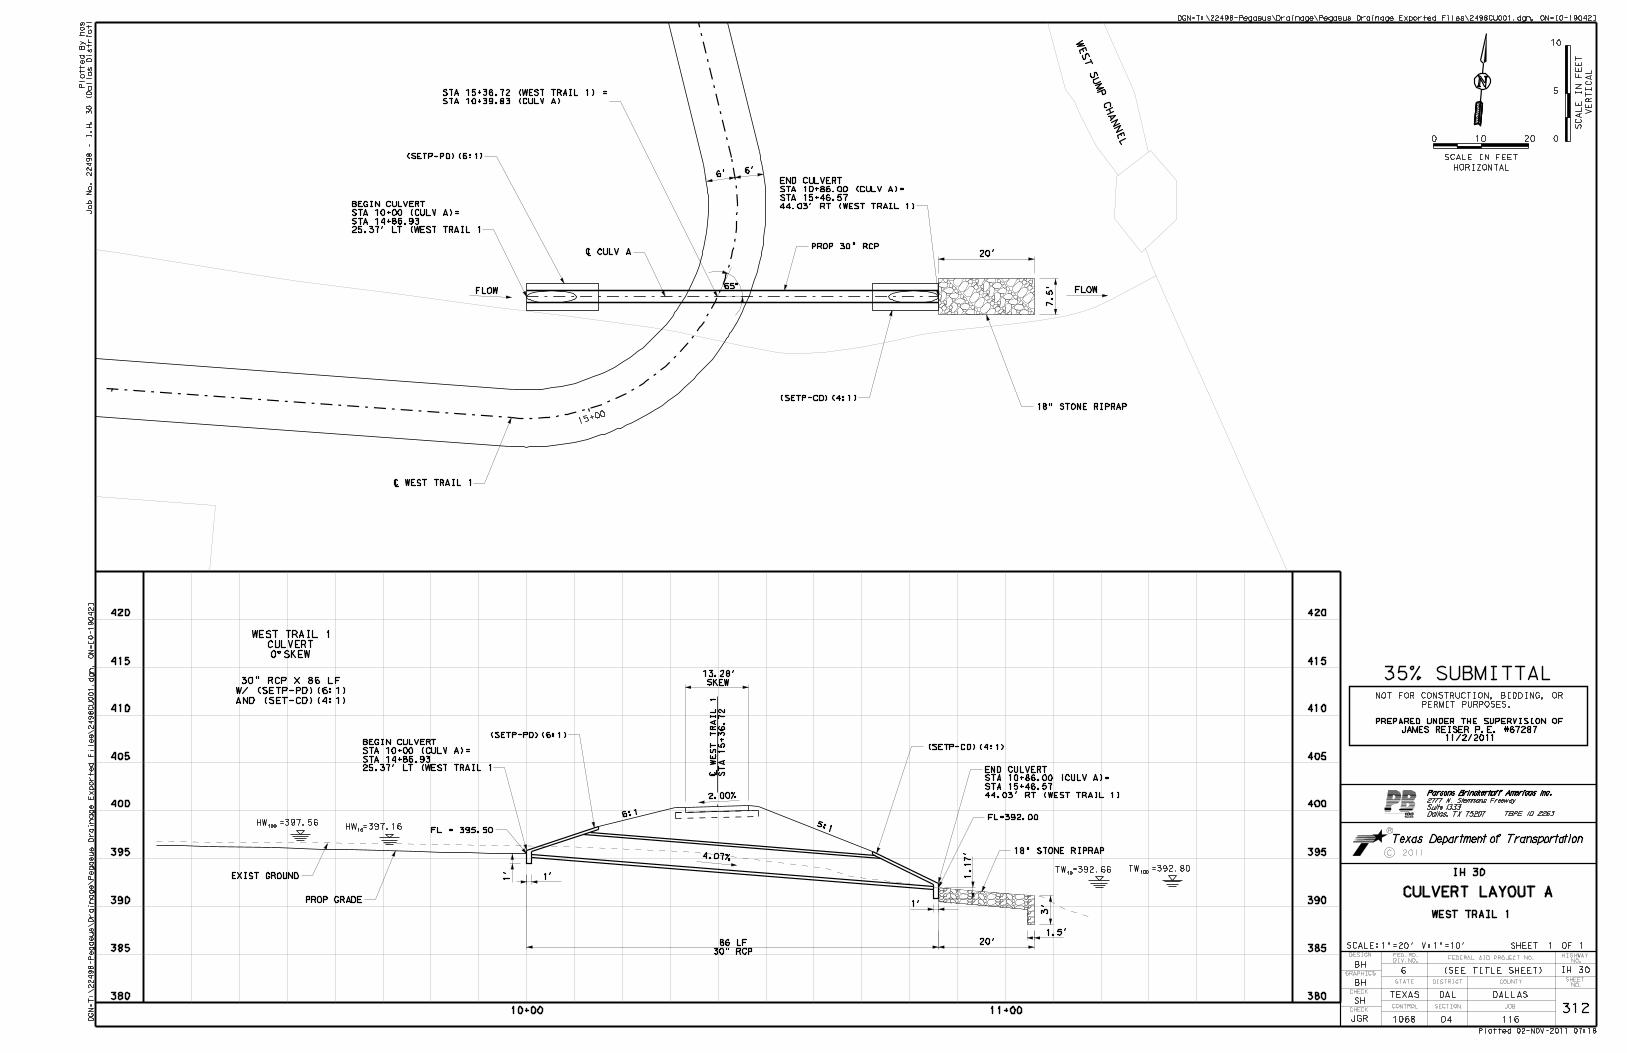
The proposed crossing consists of a 30‐inch RCP culvert with mitered ends conforming to the fill slope.
The total length of the structure between the mitered inverts is 86 linear feet. The culvert is proposed
at a 4.07‐percent slope with the upstream invert elevation set at 395.5 feet and the downstream invert
elevation set at 392.0 feet. The bikeway path width with respect to the culvert alignment is 13.28 feet
at an approximate elevation of 401 feet. The embankment fill is configured at a 6:1 (H:V) slope along
the upstream face and 5:1 (H:V) slope along the downstream face. The culvert end treatments are
proposed as mitered faces, conforming to the embankment slope. Stone riprap is proposed
Technical Report – ‘Culvert A’ Hydraulic Analysis Page 2
downstream of the culvert for erosion protection. The culvert plan and profile is shown in the attached
plan set “Culvert Layout A”.
DATA COLLECTION
As part of the culvert analysis, the following data was collected:
• H‐GAC 2‐foot contours, dated 2007
• H‐GAC aerial, dated 2009
• Field visit and photographs
• City of Dallas Interior Levee Drainage Study West Levee – Phase II, dated January 2009 by
Jacobs/ Carter Burgess.
• Dallas County FIRM Panel No. 48113C0340J, effective date August 23, 2001.
FEMA EFFECTIVE DATA
The proposed Hike and Bike Trail at the ‘Culvert A’ crossing is located along the City of Dallas West Levee
Sump adjacent to the Trinity River. Based on the referenced FEMA data, the proposed project is located
outside of the delineated Zone AE flood hazard area, within a shaded Zone X delineated area. The
current effective FIRM panel is shown in Figure 1. The referenced flood hazard base flood (100‐year)
elevation is 404 feet within the West Levee Sump area. From the project survey and proposed trail
layout at ‘Culvert A’, the proposed trail crossing and the drainage ditch will be inundated and
overtopped by the effective base flood elevation due to backwater from the sump area.

Technical Report – ‘Culvert A’ Hydraulic Analysis Page 3
Figure 1 – FEMA FIRM Panel
Technical Report – ‘Culvert A’ Hydraulic Analysis Page 4
HYDROLOGY
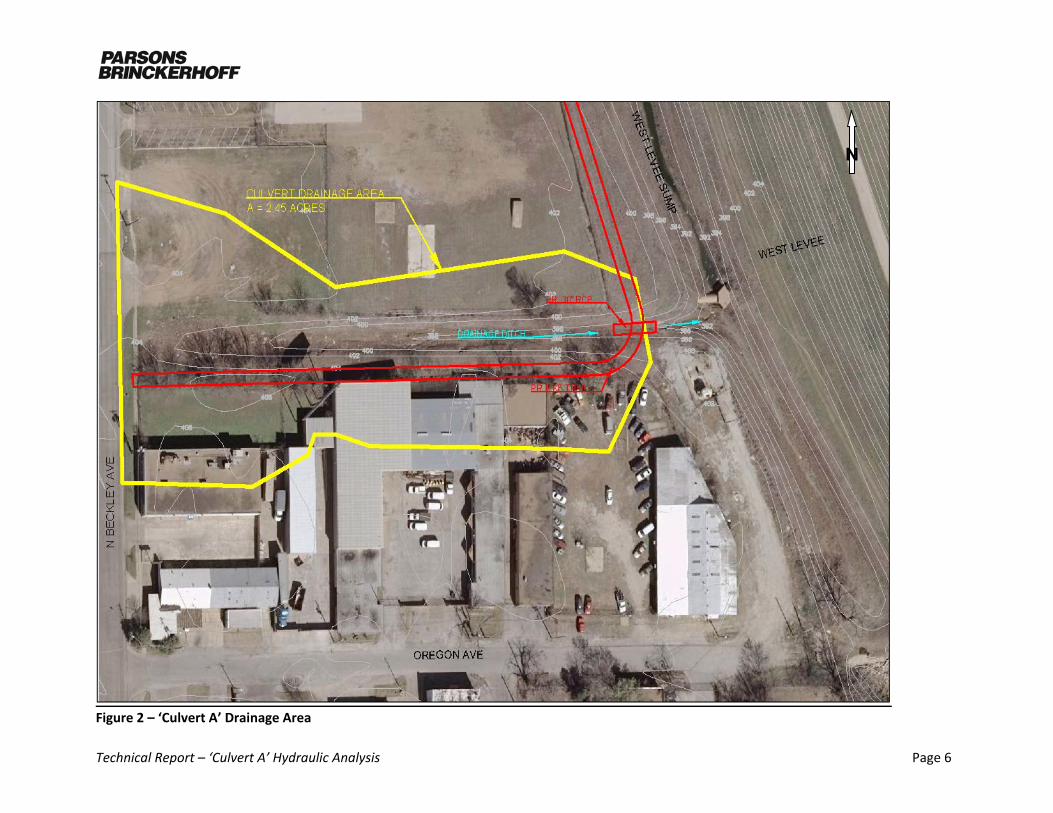
The contributing drainage area for the culvert was delineated using the overland 2‐foot contours, aerial
photography, and a field visit. The overall contributing drainage area for the culvert is approximately
2.45 acres. The contributing drainage area is limited to the area east of North Beckley Avenue and the
adjacent tracts along the drainage ditch. The culvert drainage area is shown in Figure 2.
The Rational Method was used to compute the drainage area peak runoff rates. The Rational Method
equation being Q = CIA, where Q is the computed peak runoff rate; C is the runoff coefficient; I is the
frequency runoff intensity; and A is the drainage area.
Using the aerial photography, a runoff coefficient averaged c‐value of 0.652 was computed for the
contributing drainage area. The contributing area land use consists of a mixture of light commercial,
undeveloped tracts, drainage channels, and road right‐of‐way. The following table presents a
breakdown of the land use and the calculations for the average c‐value.
Table 1 ‐ Land Use & Runoff Coefficients
Type Area (ac) C Grassy Tract Area 0.88 0.35 Commercial Tract/ Buildings 0.59 0.90 Ditch Channel Area 0.53 0.90 Ditch Overbank Area 0.35 0.55 Pavement 0.10 0.90 TOTALS: 2.45 0.652
The longest flow path within the drainage area is approximately 660 feet. The estimated travel time
within the drainage area was computed to be 5 minutes. Therefore, the minimum time of concentration
(Tc) of 10 minutes was used for the peak flow calculations based on TxDOT criteria. The time of
concentration is used to compute the runoff intensity using the equation: I = b/ (Tc + d)e . The b, d, e
coefficients are frequency and region dependent. Agencies will have differing intensity coefficients and
therefore, equivalent time of concentrations will result in differing intensity values. A comparison of the
computed intensity values for Dallas County using the TxDOT and iSWM b, d, e coefficients was
performed. The TxDOT values were determined to be more conservative; therefore they were used for
this project. The following table presents the multiple frequency intensity comparison.

Technical Report – ‘Culvert A’ Hydraulic Analysis Page 5
Table 2 – Intensity Value Comparison: TxDOT and iSWM
Frequency: 2‐Year 5‐Year 10‐Year 25‐Year 50‐Year 100‐Year TxDOT Values for Dallas County for Tc = 10 min e (in) 0.791 0.782 0.777 0.774 0.771 0.762 b 54 68 78 90 101 106 d (mins) 8.3 8.7 8.7 8.7 8.7 8.3 Intensity (in/hr) 5.42 6.89 8.01 9.33 10.56 11.57 NCTCOG iSWM Values for Dallas County for Tc = 10 min e (in) 0.81545 0.80449 0.79827 0.78187 0.77019 0.75870 b 55.179 70.024 79.931 87.970 94.058 100.079 d (mins) 10.0 12.0 13.0 13.0 13.0 13.0 Intensity (in/hr) 4.80 5.82 6.54 7.58 8.41 9.27
The design frequency utilized to size the proposed culvert for the hike and bike trail was a 10‐year storm
event and the check flood frequency was for 100‐year storm event. Flows were computed for the 10‐
year and 100‐year storm events for the contributing drainage area and are presented in Table 3 along
with the drainage area parameters.
Table 3 – Culvert Drainage Area Parameters and Flows Summary
Drainage Area (ac) C‐Value
Tc (min)
I10(in/hr)
I100(in/hr)
Q10(cfs)
Q100 (cfs)
2.45 0.652 10 8.01 11.57 12.8 18.5
Technical Report – ‘Culvert A’ Hydraulic Analysis Page 6
Figure 2 – ‘Culvert A’ Drainage Area
N

Technical Report – ‘Culvert A’ Hydraulic Analysis Page 7
HYDRAULIC COMPUTATIONS
The proposed culvert crossing was analyzed using the Federal Highway Administration (FHWA) HY‐8
Culvert Hydraulic Analysis Program, Version 7.2 build date July 2011. The design (10‐year) and check
(100‐year) computed flows were used for the hydraulic computations. The proposed culvert dimensions
were taken from the culvert layout sheet; this data is described previously.
The tailwater condition was computed within the HY‐8 model. The downstream channel cross‐section,
which was taken from survey data, was incorporated into the model. The program used normal depth
calculations to compute a downstream channel water surface elevation as well as an outlet depth at the
culvert face. The highest of these elevations was reported as the culvert’s tailwater condition.
Because the current version of HY‐8 does not have options for modeling mitered inlets, the
“conventional ‐ projecting” inlet type was selected for the analysis. This selection provides similar
entrance loss results as would the “mitered, conformed to fill slope” inlet type proposed for the
crossing. Because of the inlet type selection, the full length of the culvert crossing (86 feet) was
modeled within the HY‐8 analysis. The HY‐8 model computations results are presented in the following
table.
Table 4 – ‘Culvert A’ HY‐8 Computation Summary Table
Total Discharge
(cfs)
Culvert Discharge
(cfs)
Headwater Elevation
(ft)
Inlet Control Depth(ft)
Outlet Control Depth(ft)
Flow Type
Normal Depth (ft)
Critical Depth (ft)
Outlet Depth (ft)
Tailwater Depth (ft)
Outlet Velocity (ft/s)
Tailwater Velocity (ft/s)
0.00 0.00 396.00 0.00 0.0* 0‐NF 0.00 0.00 0.00 0.00 0.00 0.00
1.84 1.84 396.57 0.57 0.0* 1‐S2n 0.25 0.43 0.25 0.26 7.20 2.53
3.68 3.68 396.82 0.82 0.0* 1‐S2n 0.33 0.62 0.34 0.38 8.76 3.10
5.52 5.52 397.02 1.02 0.0* 1‐S2n 0.41 0.77 0.41 0.47 10.14 3.47
7.36 7.36 397.19 1.19 0.0* 1‐S2n 0.48 0.89 0.49 0.54 10.92 3.76
9.20 9.20 397.36 1.36 0.0* 1‐S2n 0.54 1.01 0.55 0.60 11.73 4.00
11.04 11.04 397.52 1.52 0.0* 1‐S2n 0.59 1.11 0.60 0.66 12.18 4.20
12.80 12.80 397.66 1.66 0.0* 1‐S2n 0.63 1.20 0.64 0.71 12.76 4.37
14.72 14.72 397.80 1.80 0.0* 1‐S2n 0.68 1.29 0.71 0.76 12.83 4.53
16.56 16.56 397.93 1.93 0.0* 1‐S2n 0.73 1.37 0.73 0.80 13.79 4.69
18.40 18.40 398.05 2.05 0.0* 1‐S2n 0.77 1.45 0.77 0.84 14.29 4.80
Based on the culvert dimensions and supported by the HY‐8 computations, the culvert is inlet
controlled. The computed design (10‐year) frequency headwater elevation is 397.66 feet and the 100‐
year headwater elevation is 398.05 feet.
Based on the survey data along the drainage ditch, the 100‐year headwater elevation is still contained
within the upstream ditch banks. The drainage ditch bank elevations range from an approximate
elevation of 400 feet near the bike path crossing to 404 feet at its upstream end near North Beckley
Avenue.

Technical Report – ‘Culvert A’ Hydraulic Analysis Page 8
SUMMARY
Based on the hydraulic analysis and HY‐8 modeling presented within this technical report, the proposed
30‐inch RCP culvert will provide adequate capacity to convey the contributing 2.45 acres of drainage
area runoff for the 10‐year design and 100‐year check storm events. It was further determined that the
backwater effects from the proposed culvert crossing will not raise the upstream water surface
elevation within the drainage ditch above the ditch banks for storm events up to and including the 100‐
year storm event.