Technical Report: Commerce Resources Corp. (January 2011)
145
Blue River Ta-Nb Project NI 43-101 Technical Report Blue River, British Columbia Prepared for: Commerce Resources Corporation Prepared by: Albert Chong, P.Geo Tomasz Postolski, P.Eng Effective Date: 31 January 2011 Project No. 162230
-
Upload
rocky-mountain-rare-metal-belt -
Category
Investor Relations
-
view
979 -
download
2
description
AMEC Americas Limited (AMEC) was commissioned by Commerce Resources Corp., to provide a Preliminary Assessment (PA) of Commerce’s wholly-owned Blue River tantalum and niobium Project (the Project) located in the Province of British Columbia. As part of the on-going PA, AMEC completed anindependent Qualified Person’s review and prepared an updated mineral resource estimate. This report documents the updated mineral resource estimate for theUpper Fir and Bone Creek areas, collectively herein called the Blue River deposit.
Transcript of Technical Report: Commerce Resources Corp. (January 2011)
Blue River Ta-Nb Project
NI 43-101 Technical ReportBlue River, British Columbia
Prepared for:
Commerce Resources Corporation
Prepared by:
Albert Chong, P.Geo
Tomasz Postolski, P.Eng
Effective Date: 31 January 2011
Project No. 162230

AMEC Americas Limited 111 Dunsmuir Street, Suite 400 Vancouver, B.C. V6B 5W3 Tel (604) 664-4315 Fax (604) 669-9516 www.amec.com
CERTIFICATE OF QUALIFIED PERSON
Albert Chong, P.Geo. AMEC Americas Limited
111 Dunsmuir Street, Suite 400 Vancouver, B.C. V6B 5W3
Phone: (604) 664-4116 E-mail: [email protected]
I, Albert Chong, P.Geo., am employed as a Senior Geologist with AMEC Americas Limited.
This certificate applies to the Technical Report titled “Blue River Ta-Nb Project, Blue River, B.C., NI
43-101 Technical Report” and dated 31 January 2011 (the “Technical Report”)
I am a Professional Geoscientist in the Province of British Columbia (P.Geo. #23773). I graduated
from McMaster University, Canada with a B.Sc. degree in Geology, and from the University of
Tasmania, Australia with a M.Sc. degree in Exploration Geoscience.
I have practiced my profession for 25 years since graduation. I have been directly involved in green
fields and brown fields exploration, mining operations, consulting, and resource estimation of base
metal, precious metal and rare metal deposits.
As a result of my experience and qualifications, I am a Qualified Person as defined in National
Instrument 43–101 Standards of Disclosure for Mineral Projects (NI 43–101).
I visited the Blue River property from July 11 to 16, 2010.
I am responsible for Sections 2 to 16, Sections 18, 19, 22, 23, and those portions of the Summary,
Interpretation and Conclusions, and Recommendations (Sections 1, 20, and 21) that pertain to these
sections of the Technical Report.
I am independent of Commerce Resources Corporation as independence is described by Section
1.4 of NI 43–101.
I have been involved with the Blue River Ta-Nb Project since January 2010 as part of data
verification, geology and preparation of the Technical Report.
I have read NI 43–101 and this report has been prepared in compliance with that Instrument.
As of the date of this certificate, to the best of my knowledge, information and belief, the Technical
Report contains all scientific and technical information that is required to be disclosed to make the
Technical Report not misleading.
“Signed and sealed”
Albert Chong, P.Geo.
Dated: 02 February 2011

AMEC Americas Limited 111 Dunsmuir Street, Suite 400 Vancouver, B.C. V6B 5W3 Tel (604) 664-4315 Fax (604) 669-9516 www.amec.com
CERTIFICATE OF QUALIFIED PERSON
Tomasz Postolski, P.Eng. AMEC Americas Limited
111 Dunsmuir Street, Suite 400 Vancouver, B.C. V6B 5W3
Phone: (604) 664-6096 E-mail: [email protected]
I, Tomasz Postolski, P.Eng., am employed as a Senior Geostatistician with AMEC Americas Limited.
This certificate applies to the Technical Report titled “Blue River Ta-Nb Project, Blue River, B.C., NI
43-101 Technical Report” dated 31 January 2011 (the “Technical Report”)
I am a Professional Engineer in the Province of British Columbia (P.Eng. #34784). I have graduated
from The University of Mining and Metallurgy, Krakow, Poland with a Magister Inzynier degree in
Geological Engineering, and from the University of British Columbia with a Master of Applied
Science degree also in Geological Engineering. I have completed the Citation Program in Applied
Geostatistics at the Centre for Computational Geostatistics at the University of Alberta.
I have 17 years of consulting, mine operations, and academic experience specializing in
geostatistical ore resource estimation and geological evaluation of gold, copper, rare earth metals
and other mineral deposits in Canada and abroad.
As a result of my experience and qualifications, I am a Qualified Person as defined in National
Instrument 43–101 Standards of Disclosure for Mineral Projects (NI 43–101).
I did not visit the Blue River property.
I am responsible for Section 17 and those portions of the Summary, Interpretation and Conclusions,
and Recommendations (Sections 1, 20, and 21) that pertain to this section of the Technical Report.
I am independent of Commerce Resources Corporation as independence is described by Section
1.4 of NI 43–101.
I have been involved with the Blue River Ta-Nb Project in February 2010 conducting geostatistical
drill hole spacing study and again since July 2010 preparing the Mineral Resource estimate and the
Technical Report.
I have read NI 43–101 and this report has been prepared in compliance with that Instrument.
As of the date of this certificate, to the best of my knowledge, information and belief, the Technical
Report contains all scientific and technical information that is required to be disclosed to make the
Technical Report not misleading.
“Signed and sealed”
Tomasz Postolski, P.Eng.
Dated: 02 February 2011

IMPORTANT NOTICE
This report was prepared as a National Instrument 43-101 Technical
Report by AMEC Americas Limited (AMEC). The quality of
information, conclusions, and estimates contained herein is consistent
with the level of effort involved in AMEC’s services, based on: i)
information available at the time of preparation, ii) data supplied by
outside sources, and iii) the assumptions, conditions, and qualifications
set forth in this report. This report is intended to be used by
Commerce Resources Corporation (Commerce), subject to the terms
and conditions of its contract with AMEC. That contract permits
Commerce to file this Technical Report with Canadian Securities
Regulatory Authorities pursuant to provincial securities legislation.
Except for the purposes legislated under provincial securities law, any
use of this report by any third party is at that party’s sole risk.
Prepared by: “Signed and Stamped”
Albert Chong, P.Geo
“Signed and Stamped”
Tomasz Postolski, P.Eng
Reviewed by: “Signed and Stamped”
Greg Gosson, Ph.D, P.Geo
Approved by: “Signed”
Arndt Brettschneider, Manager Geology & Mining

COMMERCE RESOURCES CORPORATION
BLUE RIVER TA-NB PROJECT
BLUE RIVER, BRITISH COLUMBIA
NI 43-101 TECHNICAL REPORT
Project No.: 162230 TOC i 31 January 2011
C O N T E N T S
1.0 SUMMARY ................................................................................................................................... 1-1 1.1 Principal Findings ............................................................................................................ 1-1 1.2 Project Location and Access ........................................................................................... 1-1 1.3 Mineral Tenure, Surface Rights, and Permits ................................................................. 1-1 1.4 Geology, Deposit Type, and Mineralization..................................................................... 1-2 1.5 History, Exploration, and Drilling ..................................................................................... 1-2 1.6 Sample Preparation and Analysis ................................................................................... 1-2 1.7 Data Verification .............................................................................................................. 1-3 1.8 Processing and Metallurgical Testwork ........................................................................... 1-3 1.9 Market Study ................................................................................................................... 1-3 1.10 Commodity Price ............................................................................................................. 1-4 1.11 Mineral Resource Estimation........................................................................................... 1-4 1.12 Mineral Resource Statement ........................................................................................... 1-4 1.13 Exploration Potential ........................................................................................................ 1-5 1.14 Conclusions ..................................................................................................................... 1-6 1.15 Recommendations ........................................................................................................... 1-7
2.0 INTRODUCTION .......................................................................................................................... 2-1 2.1 Qualified Persons ............................................................................................................ 2-1 2.2 Site Visit ........................................................................................................................... 2-1 2.3 Effective Dates ................................................................................................................ 2-1 2.4 Sources of Information and Data ..................................................................................... 2-2 2.5 Technical Report Sections and Required Items under NI 43-101 ................................... 2-2
3.0 RELIANCE ON OTHER EXPERTS .............................................................................................. 3-1 3.1 Mineral Tenure ................................................................................................................ 3-1 3.2 Permitting and Environment ............................................................................................ 3-1 3.3 Market Analysis ............................................................................................................... 3-1
4.0 PROPERTY DESCRIPTION AND LOCATION ............................................................................ 4-1 4.1 Property Area and Location ............................................................................................. 4-1 4.2 Mineral Tenure ................................................................................................................ 4-1 4.3 Surface Rights ................................................................................................................. 4-1 4.4 Permitting and Environmental Liabilities ......................................................................... 4-4 4.5 Royalties, Payments, and Agreements ........................................................................... 4-4 4.6 Location of Known Mineralization .................................................................................... 4-4 4.7 Comment on Section 4 .................................................................................................... 4-5
5.0 ACCESSIBILITY, CLIMATE, LOCAL RESOURCES, INFRASTRUCTURE AND PHYSIOGRAPHY ......................................................................................................................... 5-1 5.1 Accessibility ..................................................................................................................... 5-1 5.2 Climate ............................................................................................................................. 5-1 5.3 Local Resources .............................................................................................................. 5-1 5.4 Infrastructure ................................................................................................................... 5-1 5.5 Physiography ................................................................................................................... 5-2 5.6 Comment on Section 5 .................................................................................................... 5-2
6.0 HISTORY ...................................................................................................................................... 6-1

COMMERCE RESOURCES CORPORATION
BLUE RIVER TA-NB PROJECT
BLUE RIVER, BRITISH COLUMBIA
NI 43-101 TECHNICAL REPORT
Project No.: 162230 TOC ii 31 January 2011
6.1 Previous Work ................................................................................................................. 6-1 6.2 Commerce Exploration .................................................................................................... 6-2 6.3 Commerce Mineral Resource Estimates ......................................................................... 6-2
7.0 GEOLOGICAL SETTING ............................................................................................................. 7-1 7.1 Regional Geology ............................................................................................................ 7-1 7.2 Local Geology .................................................................................................................. 7-3 7.3 Blue River Project Geology ............................................................................................. 7-3
7.3.1 Metasedimentary Rocks ..................................................................................... 7-3 7.3.2 Intrusive Rocks ................................................................................................... 7-4 7.3.3 Structural Geology and Metamorphism ............................................................ 7-14 7.3.4 Geochronology ................................................................................................. 7-15
7.4 Fir and Verity Geology ................................................................................................... 7-16 7.4.1 Fir Carbonatite Geology ................................................................................... 7-16 7.4.2 Verity Carbonatite ............................................................................................. 7-16
7.5 Comment on Section 7 .................................................................................................. 7-17
8.0 DEPOSIT TYPES ......................................................................................................................... 8-1 8.1 Comment on Section 8 .................................................................................................... 8-3
9.0 MINERALIZATION ....................................................................................................................... 9-1 9.1 Blue River Mineralization ................................................................................................. 9-1
9.1.1 Carbonatite Mineralization .................................................................................. 9-1 9.1.2 Fenite Mineralization .......................................................................................... 9-3
9.2 Fir and Verity Mineralization ............................................................................................ 9-3 9.2.1 Fir Mineralization ................................................................................................ 9-3 9.2.2 Verity Mineralization ........................................................................................... 9-3
9.3 Comment on Section 9 .................................................................................................... 9-4
10.0 EXPLORATION .......................................................................................................................... 10-1 10.1 Data Compilation ........................................................................................................... 10-1
10.1.1 Historical Data Compilation .............................................................................. 10-1 10.1.2 Current Data Compilation ................................................................................. 10-1
10.2 Grids and Surveys ......................................................................................................... 10-2 10.3 Mapping ......................................................................................................................... 10-2 10.4 Geochemistry (stream sediment, soil, and rock) ........................................................... 10-2
10.4.1 Stream-Sediment Sampling ............................................................................. 10-3 10.4.2 Soil Sampling .................................................................................................... 10-3 10.4.3 Rock Sampling ................................................................................................. 10-5
10.5 Geophysical Surveys ..................................................................................................... 10-5 10.6 Drilling ............................................................................................................................ 10-6 10.7 Bulk Density ................................................................................................................... 10-6 10.8 Exploration Potential ...................................................................................................... 10-6
10.8.1 Blue River Exploration Targets ......................................................................... 10-6 10.8.2 Other Targets ................................................................................................... 10-6
10.9 Other Studies ................................................................................................................. 10-7 10.9.1 Bulk Samples .................................................................................................... 10-7 10.9.2 Academic Research ......................................................................................... 10-7 10.9.3 Environmental Geochemistry ........................................................................... 10-7 10.9.4 Geotechnical ..................................................................................................... 10-8 10.9.5 Tailings Location ............................................................................................... 10-8 10.9.6 Timber Assessment .......................................................................................... 10-9

COMMERCE RESOURCES CORPORATION
BLUE RIVER TA-NB PROJECT
BLUE RIVER, BRITISH COLUMBIA
NI 43-101 TECHNICAL REPORT
Project No.: 162230 TOC iii 31 January 2011
10.10 Comment on Section 10 ................................................................................................ 10-9
11.0 DRILLING ................................................................................................................................... 11-1 11.1 Drill Campaigns ............................................................................................................. 11-1 11.2 Drilling Equipment ......................................................................................................... 11-2 11.3 Core Drilling ................................................................................................................... 11-2
11.3.1 Core Drilling Strategy ....................................................................................... 11-2 11.3.2 Core Sizes ........................................................................................................ 11-3 11.3.3 Collar Surveys .................................................................................................. 11-3 11.3.4 Downhole Surveys ............................................................................................ 11-3 11.3.5 Oriented Drill Core ............................................................................................ 11-3 11.3.6 Core Handling ................................................................................................... 11-3 11.3.7 Core Recovery .................................................................................................. 11-4
11.4 Planned Drill Programs .................................................................................................. 11-4 11.5 Comment on Section 11 ................................................................................................ 11-4
12.0 SAMPLING METHOD AND APPROACH .................................................................................. 12-1 12.1 Comment on Section 12 ................................................................................................ 12-3
13.0 SAMPLE PREPARATION, ANALYSES, AND SECURITY ........................................................ 13-1 13.1 Sample Preparation ....................................................................................................... 13-1 13.2 Sample Analysis ............................................................................................................ 13-1 13.3 Quality Control ............................................................................................................... 13-2
13.3.1 Assessment of Accuracy with SRM Control Samples ...................................... 13-2 13.3.2 Assessment of Accuracy with Secondary Lab Pulp Checks ............................ 13-5 13.3.3 Assessment of Precision with Duplicates ......................................................... 13-8 13.3.4 Assessment of Contamination Using Blanks.................................................. 13-15
13.4 Density ......................................................................................................................... 13-16 13.5 Security ........................................................................................................................ 13-18 13.6 Comment on Section 13 .............................................................................................. 13-18
14.0 DATA VERIFICATION ................................................................................................................ 14-1 14.1 Database Data Entry Check .......................................................................................... 14-1 14.2 Site Visit ......................................................................................................................... 14-2
14.2.1 Drill Collar Location Check ............................................................................... 14-2 14.2.2 Logging and Sampling Facilities ....................................................................... 14-2 14.2.3 Core Storage .................................................................................................... 14-3 14.2.4 Inspection of Drill Core and Verification of Mineralization ................................ 14-3
14.3 Comment on Section 14 ................................................................................................ 14-4
15.0 ADJACENT PROPERTIES ........................................................................................................ 15-1
16.0 MINERAL PROCESSING AND METALLURGICAL TESTING .................................................. 16-1 16.1 Head Samples for Initial Testing ................................................................................... 16-2 16.2 Phase I Testing .............................................................................................................. 16-2 16.3 Phase II Testing ............................................................................................................. 16-5 16.4 Review of Concentrate Treatment Options ................................................................... 16-7 16.5 Accuracy of Assaying .................................................................................................... 16-7 16.6 Comment on Section 16 ................................................................................................ 16-8
17.0 MINERAL RESOURCE AND MINERAL RESERVE ESTIMATES ............................................. 17-1 17.1 Introduction .................................................................................................................... 17-1 17.2 Assay Data and Capping ............................................................................................... 17-1

COMMERCE RESOURCES CORPORATION
BLUE RIVER TA-NB PROJECT
BLUE RIVER, BRITISH COLUMBIA
NI 43-101 TECHNICAL REPORT
Project No.: 162230 TOC iv 31 January 2011
17.3 Composites .................................................................................................................... 17-1 17.4 Exploratory Data Analysis ............................................................................................. 17-2 17.5 Contact Analysis ............................................................................................................ 17-4 17.6 Variography ................................................................................................................... 17-4 17.7 Carbonatite Solid Modeling ........................................................................................... 17-5 17.8 Block Model Dimensions ............................................................................................... 17-5 17.9 Assignment of Lithology and Specific Gravity to Blocks ............................................... 17-6 17.10 Block Model Grade Estimate ......................................................................................... 17-6 17.11 Block Model Validation .................................................................................................. 17-7
17.11.1 Visual Validation ............................................................................................... 17-7 17.11.2 Global Grade Bias Check ................................................................................. 17-9 17.11.3 Local Grade Bias Check (Swath Plots) .......................................................... 17-10 17.11.4 Selectivity Check ............................................................................................ 17-11
17.12 Preliminary Results from 2010 Drilling ........................................................................ 17-13 17.13 Mineral Resource Classification .................................................................................. 17-14 17.14 Reasonable Prospects for Economic Extraction ......................................................... 17-16
17.14.1 Market Study .................................................................................................. 17-16 17.14.2 Commodity Price ............................................................................................ 17-17 17.14.3 Physical Assumptions..................................................................................... 17-18 17.14.4 Operational Considerations ............................................................................ 17-18 17.14.5 Economic Assumptions .................................................................................. 17-18 17.14.6 Economic Cut-off ............................................................................................ 17-19
17.15 Mineral Resource Statement ....................................................................................... 17-19
18.0 ADDITIONAL REQUIREMENTS FOR TECHNICAL REPORTS ON DEVELOPMENT PROPERTIES AND PRODUCTION PROPERTIES .................................................................. 18-1
19.0 OTHER RELEVANT INFORMATION ......................................................................................... 19-1
20.0 INTERPRETATION AND CONCLUSIONS ................................................................................ 20-1
21.0 RECOMMENDATIONS .............................................................................................................. 21-1 21.1 Comment on Section 20 ................................................................................................ 21-2
22.0 DATE AND SIGNATURE PAGE ................................................................................................ 22-1
23.0 REFERENCES ........................................................................................................................... 23-1
T A B L E S
Table 1-1: Blue River Project Estimated Mineral Resources; Effective Date 30 June, 2010,
Tomasz Postolski, P. Eng., Qualified Person ..................................................................... 1-5 Table 2-1: Site Visit and Sections of Responsibility ............................................................................. 2-1 Table 2-2: Form 43-101F1 Prescribed Items in Relation to Report Contents ..................................... 2-3 Table 6-1: Blue River Exploration History Summary ........................................................................... 6-1 Table 11-1: Drill Campaign Summary .................................................................................................. 11-1 Table 11-2: Upper Fir Deposit Trench and Bulk Samples ................................................................... 11-2 Table 12-1: Selected Ta and Nb Composite Values in Carbonatite .................................................... 12-2 Table 13-1: Primary Analysis Lower Detection Limits ......................................................................... 13-2 Table 13-2: Control Samples and Insertion Rates by Year ................................................................. 13-2 Table 13-3: “Robert” Standard Reference Material “Best Values” ....................................................... 13-3

COMMERCE RESOURCES CORPORATION
BLUE RIVER TA-NB PROJECT
BLUE RIVER, BRITISH COLUMBIA
NI 43-101 TECHNICAL REPORT
Project No.: 162230 TOC v 31 January 2011
Table 13-4: Pulp Check Bias in Percent .............................................................................................. 13-8 Table 13-5 Field Duplicate Precision by Year ................................................................................... 13-10 Table 13-6: Specific Gravity Measurements for Blue River Rock Types ........................................... 13-17 Table 14-1: AMEC Site Visit Confirmation of Mineralization ................................................................ 14-4 Table 15-1: List of Adjacent Property Claims....................................................................................... 15-1 Table 16-1: Results from F81............................................................................................................... 16-6 Table 16-2: Results of a Sequential Hydrochloric Acid Leach of Flotation “Middling” ......................... 16-7 Table 17-1: Capped Assays vs. 2.5m Composites Statistics Inside Carbonatites .............................. 17-1 Table 17-2: Composite Statistics in Carbonatite .................................................................................. 17-2 Table 17-3: Ta2O5 and Nb2O5 Correlogram Parameter in Carbonatite ................................................ 17-5 Table 17-4: Block Model Dimensions .................................................................................................. 17-5 Table 17-5: Estimation Parameters for Ta2O5 and Nb2O5 ................................................................... 17-6 Table 17-6: Mean Grades for NN, OK and ID3 Models ....................................................................... 17-9 Table 17-7: Blue River Project Estimated Mineral Resources; Effective Date 30 June, 2010,
Tomasz Postolski, P.Eng, Qualified Person ................................................................... 17-20 Table 17-8: Blue River Project Sensitivity of Estimated Mineral Resources to Tantalum Price;
Effective Date 30 June, 2010, Tomasz Postolski, P.Eng, Qualified Person .................. 17-21 Table 21-1: Recommendations Summary ........................................................................................... 21-1
F I G U R E S
Figure 4-1: Location Map ...................................................................................................................... 4-2 Figure 4-2: Blue River Mineral Tenure Map .......................................................................................... 4-3 Figure 7-1: Tectonic Belts of British Columbia and Carbonatite Occurrences ...................................... 7-2 Figure 7-2: Local Geology Map ............................................................................................................. 7-5 Figure 7-3: Deposit Area Surface Geology Map ................................................................................... 7-6 Figure 7-4: Drill Collar and Vertical Section Locations .......................................................................... 7-9 Figure 7-5: Lower Road Longitudinal Section 352800 E .................................................................... 7-10 Figure 7-6: Geology Section 5796737 N ............................................................................................. 7-11 Figure 7-7: Geology Section 5796425 N ............................................................................................. 7-12 Figure 7-8: Folding Indicators (Hole F08-150 121.8 m to 129.8 m) .................................................... 7-13 Figure 7-9: Folding Indicators (Hole F08-150: 143.5 m and 147.0 m) ................................................ 7-13 Figure 7-10: Folding Indicators (Hole F08-151: 204.0 m to 204.5 m) ................................................... 7-14 Figure 9-1: Tantalum and Niobium Rich Mineralogy within Carbonatite ............................................... 9-3 Figure 10-1: Soil Geochemistry Map ..................................................................................................... 10-4 Figure 13-1: SRM BR-01 Control Chart ................................................................................................ 13-3 Figure 13-2: 2008 “Robert” SRM Ta Performance ................................................................................ 13-4 Figure 13-3: 2008 “Robert” SRM Nb Performance ............................................................................... 13-4 Figure 13-4: 2009 “Robert” SRM Ta Performance ................................................................................ 13-5 Figure 13-5: 2005 Pulp Check Sample Ta RMA Plots .......................................................................... 13-6 Figure 13-6: 2005 Pulp Check Sample Nb RMA Plots ......................................................................... 13-6 Figure 13-7: 2008 Acme Pulp Check Sample Ta RMA Plots ................................................................ 13-7 Figure 13-8: 2008 Acme Pulp Check Sample Nb RMA Plots ............................................................... 13-7 Figure 13-9: Min-Max Plot – Ta Precision for Field Duplicates Between 2006 and 2009 .................... 13-9 Figure 13-10: Min-Max Plot – Nb Precision for Field Duplicates Between 2006 and 2009 .................... 13-9
COMMERCE RESOURCES CORPORATION
BLUE RIVER TA-NB PROJECT
BLUE RIVER, BRITISH COLUMBIA
NI 43-101 TECHNICAL REPORT
Project No.: 162230 TOC vi 31 January 2011
Figure 13-11: 2008 Pulp Duplicate Failure Min Max Ta Chart .............................................................. 13-11 Figure 13-12: 2008 Pulp Duplicate ARD vs. Grade Ta Chart ............................................................... 13-11 Figure 13-13: 2008 Pulp Duplicate Failure Min Max Nb Chart ............................................................. 13-12 Figure 13-14: 2008 Pulp Duplicate ARD vs. Grade Nb Chart ............................................................... 13-12 Figure 13-15: 2008 Pulp Duplicate RMA Ta Chart................................................................................ 13-13 Figure 13-16: 2008 Pulp Duplicate RMA Nb Chart ............................................................................... 13-13 Figure 13-17: 2009 Pulp Duplicate RMA Ta Chart................................................................................ 13-14 Figure 13-18: 2009 Pulp Duplicate ARD vs. Grade Ta Chart ............................................................... 13-14 Figure 13-19: 2009 Pulp Duplicate RMA Nb Chart ............................................................................... 13-15 Figure 13-20: 2009 Pulp Duplicate ARD vs. Grade Nb Chart ............................................................... 13-15 Figure 13-21: Blank Control Chart for Tantalum Analyses ................................................................... 13-16 Figure 13-22: Blank Control Chart for Niobium Analyses ..................................................................... 13-16 Figure 14-1: Drill Hole Collar Identification ............................................................................................ 14-3 Figure 16-1: Sample BS-2F – Gravity Separation (Different Grinds) .................................................... 16-3 Figure 16-2: Sample BS-2G – Gravity Separation (Different Grinds) ................................................... 16-3 Figure 16-3: Rougher and Cleaners by Centrifugal Gravity Concentration .......................................... 16-4 Figure 16-4: Upgrading by Wilfley & Mozley Units ................................................................................ 16-5 Figure 17-1: Ta2O5 Histograms and Probability Plot Within Carbonatite .............................................. 17-3 Figure 17-2: Nb2O5 Histograms and Probability Plot Within Carbonatite .............................................. 17-4 Figure 17-3: Ta2O5 ID3 Model Within Carbonatite – plan 1146.25 ....................................................... 17-7 Figure 17-4: Ta2O5 ID3 Model Within Carbonatite – section N5796932.5 ............................................ 17-8 Figure 17-5: Nb2O5 ID3 Model Within Carbonatite – plan 1146.25 ....................................................... 17-8 Figure 17-6: Nb2O5 ID3 Model Within Carbonatite – section N5796932.5 ........................................... 17-9 Figure 17-7: Swath Plot for Ta2O5 ID3 Model ...................................................................................... 17-10 Figure 17-8: Swath Plot for Nb2O5 ID3 Model ..................................................................................... 17-11 Figure 17-9: Herco Grade – Tonnage Curves for Ta2O5 ID3 Model ................................................... 17-12 Figure 17-10: Herco Grade – Tonnage Curves for Nb2O5 ID3 Model ................................................... 17-13 Figure 17-11: Lithology in 2010 Drill Holes vs. Current Solids – Section N5796902.5 ......................... 17-14 Figure 17-12: Resource Classification - Plan 1,161.25 ......................................................................... 17-15 Figure 17-13: Resource Classification – Section N 5,796,882.5 .......................................................... 17-16
A P P E N D I C E S
Appendix A: List of Claims

COMMERCE RESOURCES CORPORATION
BLUE RIVER TA-NB PROJECT
BLUE RIVER, BRITISH COLUMBIA
NI 43-101 TECHNICAL REPORT
Project No.: 162230 TOC vii 31 January 2011
U N I T S O F M E A S U R E
Centimetre ...................................................................................................... cm Cubic centimetre ............................................................................................. cm
3
Cubic metre .................................................................................................... m3
Cubic yard ....................................................................................................... yd3
Degree ............................................................................................................ ° Degrees Celsius ............................................................................................. °C Dry metric ton ................................................................................................. dmt Gram ............................................................................................................... g Grams per litre ................................................................................................ g/L Grams per tonne ............................................................................................. g/t Greater than .................................................................................................... > Hectare (10,000 m
2) ....................................................................................... ha
Kilo (thousand)................................................................................................ k Kilogram .......................................................................................................... kg Kilometre ......................................................................................................... km Less than ........................................................................................................ < Litre ................................................................................................................. L Metre ............................................................................................................... m Metres per second .......................................................................................... m/s Metric ton (tonne)............................................................................................ t Micrometre (micron)........................................................................................ µm Milligram ......................................................................................................... mg Milligrams per litre........................................................................................... mg/L Millilitre ............................................................................................................ mL Millimetre ........................................................................................................ mm Million .............................................................................................................. M Million tonnes .................................................................................................. Mt Minute (plane angle) ....................................................................................... ' Minute (time) ................................................................................................... min Month .............................................................................................................. mo Niobium ........................................................................................................... Nb Ounce ............................................................................................................. oz Parts per billion ............................................................................................... ppb Parts per million .............................................................................................. ppm Percent ........................................................................................................... % Pound(s) ......................................................................................................... lb Second (plane angle) ..................................................................................... " Second (time) ................................................................................................. s Short ton (2,000 lb) ......................................................................................... st Short ton (US) ................................................................................................. t Short tons per day (US) .................................................................................. tpd Short tons per hour (US) ................................................................................ tph Short tons per year (US) ................................................................................. tpy Specific gravity ................................................................................................ SG Square centimetre .......................................................................................... cm
2
Square foot ..................................................................................................... ft2
Square inch ..................................................................................................... in2

COMMERCE RESOURCES CORPORATION
BLUE RIVER TA-NB PROJECT
BLUE RIVER, BRITISH COLUMBIA
NI 43-101 TECHNICAL REPORT
Project No.: 162230 TOC viii 31 January 2011
Square kilometre............................................................................................. km2
Square metre .................................................................................................. m2
Tantalum ......................................................................................................... Ta Thousand tonnes ............................................................................................ kt Tonne (1,000 kg) ............................................................................................ t Tonnes per day ............................................................................................... t/d Tonnes per hour ............................................................................................. t/h Tonnes per year.............................................................................................. t/a Week ............................................................................................................... wk Yard ................................................................................................................ yd Year (annum) .................................................................................................. a Year (US) ........................................................................................................ yr
C O N V E R S I O N F A C T O R S
1 ppm Ta = 1.2211 ppm Ta2O5
1 ppm Nb = 1.4305 ppm Nb2O5
One tonne is the equivalent of 2,204.6 lbs.
Dollars are expressed in United States currency (USD).
Universal Transverse Mercator (UTM) coordinates are provided in the NAD83 datum of Canada, Zone 11.
COMMERCE RESOURCES CORPORATION
BLUE RIVER TA-NB PROJECT
BLUE RIVER, BRITISH COLUMBIA
NI 43-101 TECHNICAL REPORT
Project No.: 162230 Page 1-1 31 January 2011
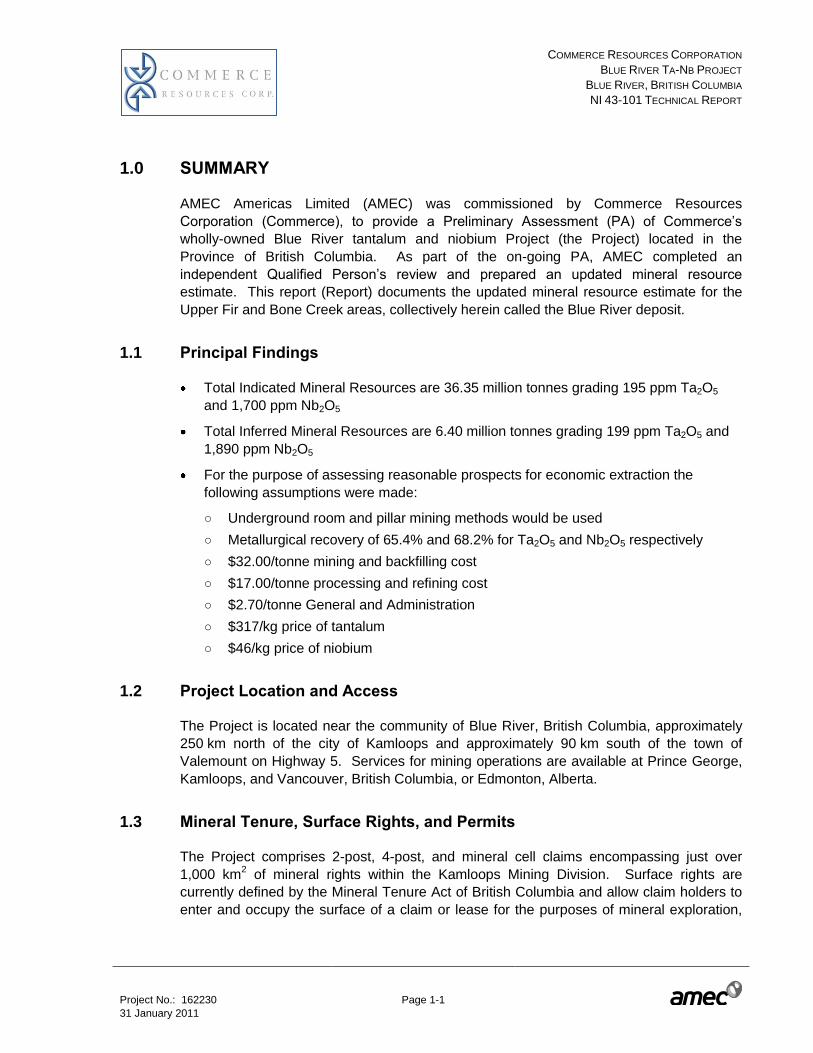
1.0 SUMMARY
AMEC Americas Limited (AMEC) was commissioned by Commerce Resources
Corporation (Commerce), to provide a Preliminary Assessment (PA) of Commerce’s
wholly-owned Blue River tantalum and niobium Project (the Project) located in the
Province of British Columbia. As part of the on-going PA, AMEC completed an
independent Qualified Person’s review and prepared an updated mineral resource
estimate. This report (Report) documents the updated mineral resource estimate for the
Upper Fir and Bone Creek areas, collectively herein called the Blue River deposit.
1.1 Principal Findings
Total Indicated Mineral Resources are 36.35 million tonnes grading 195 ppm Ta2O5
and 1,700 ppm Nb2O5
Total Inferred Mineral Resources are 6.40 million tonnes grading 199 ppm Ta2O5 and
1,890 ppm Nb2O5
For the purpose of assessing reasonable prospects for economic extraction the
following assumptions were made:
○ Underground room and pillar mining methods would be used
○ Metallurgical recovery of 65.4% and 68.2% for Ta2O5 and Nb2O5 respectively
○ $32.00/tonne mining and backfilling cost
○ $17.00/tonne processing and refining cost
○ $2.70/tonne General and Administration
○ $317/kg price of tantalum
○ $46/kg price of niobium
1.2 Project Location and Access
The Project is located near the community of Blue River, British Columbia, approximately
250 km north of the city of Kamloops and approximately 90 km south of the town of
Valemount on Highway 5. Services for mining operations are available at Prince George,
Kamloops, and Vancouver, British Columbia, or Edmonton, Alberta.
1.3 Mineral Tenure, Surface Rights, and Permits
The Project comprises 2-post, 4-post, and mineral cell claims encompassing just over
1,000 km2 of mineral rights within the Kamloops Mining Division. Surface rights are
currently defined by the Mineral Tenure Act of British Columbia and allow claim holders to
enter and occupy the surface of a claim or lease for the purposes of mineral exploration,

COMMERCE RESOURCES CORPORATION
BLUE RIVER TA-NB PROJECT
BLUE RIVER, BRITISH COLUMBIA
NI 43-101 TECHNICAL REPORT
Project No.: 162230 Page 1-2 31 January 2011
development, or production. All work is controlled through an established permitting
process. Commerce holds appropriate exploration permits and reclamation bonds.
1.4 Geology, Deposit Type, and Mineralization
Carbonatites represent a diverse carbonate-rich, igneous rock type commonly designated
as magmatic segregation deposits. They result from the intrusion, cooling, and
crystallization of a primary (magmatic) Ca-Fe-Mg rich carbonate melt, often with some late
stage hydrothermal activity that can alter their host rocks. Almost all the known carbonatite
occurrences are either intrusive or subvolcanic intrusive rocks. They are comprised of
significant and variable amounts of calcite, dolomite, or siderite of igneous origin.
Carbonatites can contain economic or anomalous concentrations of incompatible elements
such as rare earth elements, niobium-tantalum, zirconium-hafnium, iron-titanium-
vanadium, uranium-thorium and industrial minerals such as apatite, vermiculite, magnetite,
and barite.
The Blue River deposit is hosted within a carbonatite sill swarm with an average thickness
of 30 m and a strike length of 1,000 m. The carbonatite is part of Late Proterozoic
supracrustal rocks which lie on the north-eastern margin of the Shuswap Metamorphic
Complex within the Omineca terrane. Mineralization comprises niobium and tantalum
bearing minerals that have crystallized in carbonatite by primary magmatic concentration
and in fenite formed by metasomatic alteration of the host metasedimentary rocks.
Primary economic minerals are ferrocolumbite and pyrochlore.
1.5 History, Exploration, and Drilling
The Blue River area has been the subject of intermittent exploration since the discovery of
vermiculite bearing carbonatite rock in 1949. Commerce acquired the property in 2000
and initiated exploration for new carbonatite deposits which culminated in the discovery
and delineation of the Upper Fir and Bone Creek carbonatites. Diamond drilling is the
most extensively used exploration tool at Blue River. There are a total of 215 drill holes
within the Upper Fir, Bone Creek and Fir (Lower) carbonatites comprising 41,115 m of HQ
and NQ diameter drill holes.
1.6 Sample Preparation and Analysis
Sampling was on average 1 m length half core, logged and sawn at a facility in the
community of Blue River. Samples were shipped to Acme Analytical Laboratories or
PRA/Inspectorate Laboratories for preparation. Analyses were completed at Acme
Analytical Laboratories. Between 2005 and 2008, Ta and Nb were analysed by ICP-MS
following a lithium metaborate / tetraborate fusion and nitric acid digestion. Analysis in
2009 was by X-Ray fluorescence methods following a lithium metaborate fusion.
COMMERCE RESOURCES CORPORATION
BLUE RIVER TA-NB PROJECT
BLUE RIVER, BRITISH COLUMBIA
NI 43-101 TECHNICAL REPORT
Project No.: 162230 Page 1-3 31 January 2011
1.7 Data Verification
Commerce implemented an industry-acceptable quality control program to manage
logging, sampling, and analysis. Check samples for initial sample batches identified
discrepancies. In 2008 Commerce prepared matrix-matched standard reference material
control samples to monitor accuracy and initiated insertion of intra-lab pulp duplicates in
addition to secondary pulp check control samples. Primary lab precision and accuracy has
been poor but no significant biases are apparent for the bulk of results. AMEC completed
a database verification check and concludes the collar coordinates, down-hole surveys,
lithologies, and assay databases are sufficiently free of error and that the data are suitable
to support mineral resource estimation.
1.8 Processing and Metallurgical Testwork
A mineral processing method using a standard grind-flotation procedure to make a
concentrate of ferrocolumbite-pyrochlore is assumed for Blue River material. Metallurgical
testing indicates a mineral concentrate assaying about 30% combined Nb-Ta pentoxide
within the recovery range of 65% to 70% is possible. The proposed process is similar to
that being used commercially at Iamgold’s Niobec Mine in Quebec. This concentrate
would be further processed to produce marketable separate Ta and Nb products. The
proposed processes are mature, are already used industrially, and consist of reducing the
concentrate to metals as either carbide or ferroalloys in a standard aluminothermic, or
carbothermic, or silicothermic furnace followed by chlorinating the alloys and distilling the
product to separate high purity metal chlorides, TaCl5 and NbCl5. Recoveries from
concentrate to pure chlorides are expected to be 97%. Both Ta and Nb chloride products
are then readily converted and marketed as high purity oxides Ta2O5 and Nb2O5
respectively. These results are suitable to support the mineral resource classification of
the deposit.
1.9 Market Study
Commerce has prepared assessments of the tantalum and niobium markets which outline
their supply and demand. The tantalum assessment was prepared by a tantalum market
expert. Although not independent of Commerce, his analysis reflects the general
consensus of other analysts regarding the tantalum market expressed in publicly available
information. The niobium market assessment was prepared by an independent niobium
expert and reflects the publicly available general consensus of analysts for the niobium
market.
As the Project is still at an early evaluation stage, Commerce has not initiated requests for
expression of interests in the proposed Blue River products and has not negotiated any
purchase or off-take agreements.

COMMERCE RESOURCES CORPORATION
BLUE RIVER TA-NB PROJECT
BLUE RIVER, BRITISH COLUMBIA
NI 43-101 TECHNICAL REPORT
Project No.: 162230 Page 1-4 31 January 2011
1.10 Commodity Price
The proposed mineral process route by Commerce refines the Blue River concentrate to
high purity oxides Ta2O5 and Nb2O5. For tantalum price, tantalum metal scrap was used
as a reasonable proxy for price of high purity Ta2O5. For niobium, high purity Nb2O5 is
marketed as such and also traded as Nb metal, or ferroalloy.
Cut-off grade assumptions of US$317/kg tantalum and US$46/kg niobium, sold as high
purity Ta2O5 and Nb2O5 are used to constrain the Mineral Resources. These prices are
slightly higher than market information (beginning of Q4 2010) of US$280/kg of tantalum
metal and US$44/kg of Nb metal. AMEC considers the slightly higher price assumption is
appropriate and is consistent with industry practices of using more optimistic assumptions
regarding inputs for resource estimation than what would be used for estimating mineral
reserves.
The base case price for tantalum metal scrap is reasonable for constraining Mineral
Resources based on recent market conditions, but it should be noted it is significantly
higher than historical prices. There is a risk that using current price assumptions may not
reflect the long term price of Ta and Nb, particularly in the present volatile market
conditions.
1.11 Mineral Resource Estimation
Ta2O5 and Nb2O5 were estimated using an inverse distance to the power of 3 method for
the carbonatite domains. Capped drill core assays were composited down the hole to a
fixed length of 2.5 m honouring geology boundaries. A four pass interpolation approach
was used with each successive pass having greater search distances. A hard boundary
was used, meaning that composites from outside the carbonatite were ignored in the
interpolation process.
The model was validated by comparing composites to block grades on screen, declustered
global statistics checks, local bias checks using swath plots, and finally model selectivity
checks.
Eighty per cent of the carbonatite blocks are classified as Indicated. Fourteen per cent of
the carbonatite blocks are classified as Inferred, and six per cent of the block model in
carbonatite is unclassified.
1.12 Mineral Resource Statement
The Mineral Resources were classified in accordance with the 2005 Canadian Institute of
Mining, Metallurgy, and Petroleum (CIM) Definition Standards for Mineral Resources and
COMMERCE RESOURCES CORPORATION
BLUE RIVER TA-NB PROJECT
BLUE RIVER, BRITISH COLUMBIA
NI 43-101 TECHNICAL REPORT
Project No.: 162230 Page 1-5 31 January 2011
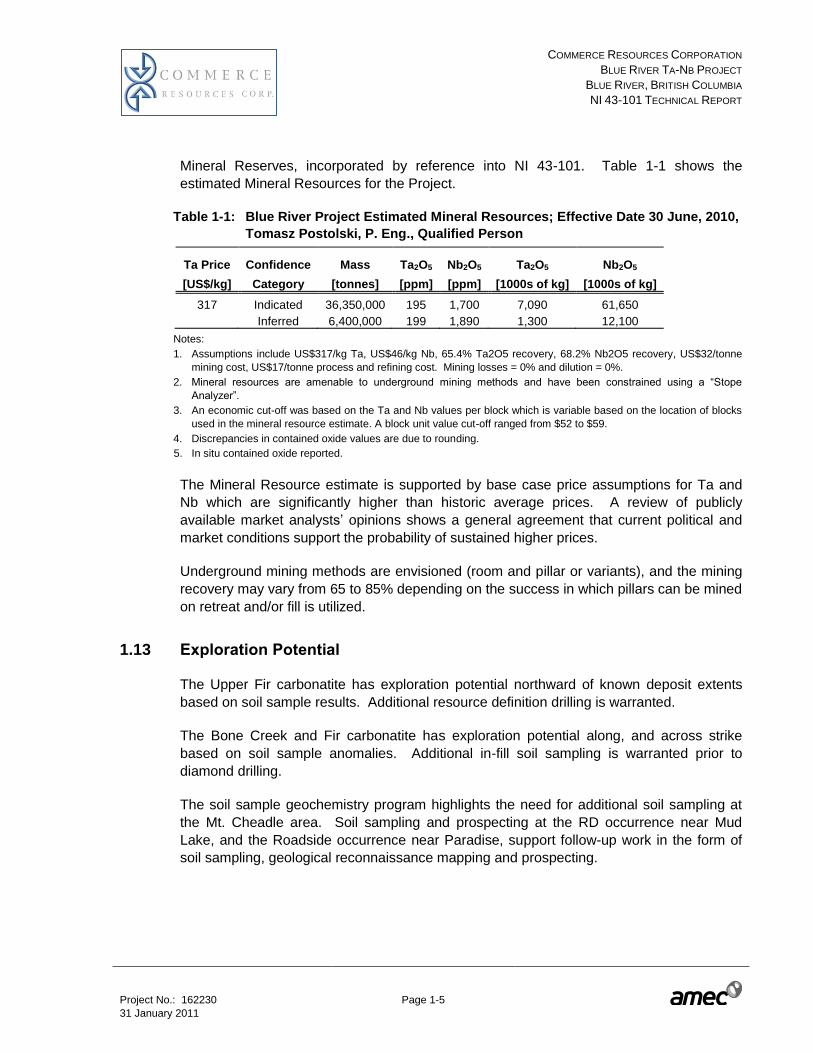
Mineral Reserves, incorporated by reference into NI 43-101. Table 1-1 shows the
estimated Mineral Resources for the Project.
Table 1-1: Blue River Project Estimated Mineral Resources; Effective Date 30 June, 2010,
Tomasz Postolski, P. Eng., Qualified Person
Ta Price Confidence Mass Ta2O5 Nb2O5 Ta2O5 Nb2O5
[US$/kg] Category [tonnes] [ppm] [ppm] [1000s of kg] [1000s of kg]
317 Indicated 36,350,000 195 1,700 7,090 61,650
Inferred 6,400,000 199 1,890 1,300 12,100
Notes:
1. Assumptions include US$317/kg Ta, US$46/kg Nb, 65.4% Ta2O5 recovery, 68.2% Nb2O5 recovery, US$32/tonne
mining cost, US$17/tonne process and refining cost. Mining losses = 0% and dilution = 0%.
2. Mineral resources are amenable to underground mining methods and have been constrained using a “Stope
Analyzer”.
3. An economic cut-off was based on the Ta and Nb values per block which is variable based on the location of blocks
used in the mineral resource estimate. A block unit value cut-off ranged from $52 to $59.
4. Discrepancies in contained oxide values are due to rounding.
5. In situ contained oxide reported.
The Mineral Resource estimate is supported by base case price assumptions for Ta and
Nb which are significantly higher than historic average prices. A review of publicly
available market analysts’ opinions shows a general agreement that current political and
market conditions support the probability of sustained higher prices.
Underground mining methods are envisioned (room and pillar or variants), and the mining
recovery may vary from 65 to 85% depending on the success in which pillars can be mined
on retreat and/or fill is utilized.
1.13 Exploration Potential
The Upper Fir carbonatite has exploration potential northward of known deposit extents
based on soil sample results. Additional resource definition drilling is warranted.
The Bone Creek and Fir carbonatite has exploration potential along, and across strike
based on soil sample anomalies. Additional in-fill soil sampling is warranted prior to
diamond drilling.
The soil sample geochemistry program highlights the need for additional soil sampling at
the Mt. Cheadle area. Soil sampling and prospecting at the RD occurrence near Mud
Lake, and the Roadside occurrence near Paradise, support follow-up work in the form of
soil sampling, geological reconnaissance mapping and prospecting.

COMMERCE RESOURCES CORPORATION
BLUE RIVER TA-NB PROJECT
BLUE RIVER, BRITISH COLUMBIA
NI 43-101 TECHNICAL REPORT
Project No.: 162230 Page 1-6 31 January 2011
1.14 Conclusions
Commerce and its contractor Dahrouge have executed a professional work program that
has resulted in the delineation of a tantalum and niobium resource.
The Blue River Mineral Resources have the following characteristics:
The mineralization is hosted by a poly-folded carbonatite sill swarm averaging 30 m
thick and 1,100 m long
Close-spaced drilling has confirmed local continuity of the carbonatite
Tantalum and niobium occur in ferrocolumbite and pyrochlore minerals and are
amenable to conventional flotation and refining processes with estimated recoveries of
65% to 70%
The mineral resource estimate is based on information of reasonable quality
Flat to moderate dips of the deposit allow large-scale room-and pillar mining.
The risk factors are:
The base case mineral resource estimate is supported by current Ta and Nb prices
which are significantly higher than historic average prices and may not reflect long term
prices. Market analysts are in general agreement that current political and market
conditions support the probability of sustained higher prices, but this may not occur.
The proposed refining methods have been used in commercial applications but have
not been demonstrated in test work of Blue River material.
Mining recovery is assumed at 70% but could be lower and dilution increased in areas
with moderate dips greater than 10°.
An extensional faulting event has potential for displacements of greater than 10 m in
the carbonatite. Such offsets would likely impact deposit geometry and future mine
designs.
Uranium and thorium are present in the resource and waste rocks. Any radon
produced in the mine and process plant is likely manageable with ventilation, dust
control, and monitoring. Expected capex and opex costs will not be significantly
increased as a result of these safety measures.
Exploration programs completed on the Blue River Project have met their objective of
identifying tantalum and niobium mineralization that has reasonable prospects of economic
extraction.

COMMERCE RESOURCES CORPORATION
BLUE RIVER TA-NB PROJECT
BLUE RIVER, BRITISH COLUMBIA
NI 43-101 TECHNICAL REPORT
Project No.: 162230 Page 1-7 31 January 2011
1.15 Recommendations
AMEC recommends a work program for an estimated total cost of $4.35 M in Canadian
currency. The recommendations are based on the stated Mineral Resource estimate and
the assumed commodity price assumptions.
The program involves completing the on-going Preliminary Assessment and updating the
mineral resource block model with 2010 drilling data and interpretations. Looking forward,
a program is recommended based on field work and supporting studies to prepare for
more advanced studies.
The field based component of the recommendations includes 8,250 m of HQ diameter
diamond drilling, a staged re-assay program, metallurgical testwork, soil geochemistry
surveys, analyses, geo-metallurgy studies, structural geology studies, marketing studies,
core farm security improvements, manpower and field support costs. A Mineral Resource
update is recommended upon completion of the recommended field program.

COMMERCE RESOURCES CORPORATION
BLUE RIVER TA-NB PROJECT
BLUE RIVER, BRITISH COLUMBIA
NI 43-101 TECHNICAL REPORT
Project No.: 162230 Page 2-1 31 January 2011
2.0 INTRODUCTION
Commerce Resources Corporation (Commerce) commissioned AMEC Americas Limited
(AMEC) to provide an independent Qualified Person’s review and NI 43-101 Technical
Report (Report) for the Blue River tantalum-niobium Project (the Project). The Report was
prepared to support a Mineral Resource estimate on the Upper Fir and Bone Creek
deposits of the Project.
2.1 Qualified Persons
The following professionals served as the Qualified Persons (QPs) responsible for the
preparation of the Report as defined in National Instrument 43-101, Standards of
Disclosure for Mineral Projects, and in compliance with Form 43-101F1:
Mr. Albert Chong, P.Geo., Senior Geologist (AMEC, Vancouver)
Mr. Tomasz Postolski, P.Eng, Senior Geostatistician (AMEC, Vancouver)
The QPs have been assisted in the preparation of this report by Mr. Greg Kulla, P.Geo.
(data verification), Mr. Tony Lipiec, P.Eng. (process and metallurgy), Mr. Ramon Mendoza,
P.Eng., (reasonable prospects for economic extraction), and Mr. Graham Wood, M.Sc.,
M.B.A. (commodity pricing).
2.2 Site Visit
Mr. Chong completed a data verification site visit to the Project during July 11 to 16, 2010.
Outcrops, surface geology, drill hole collars, diamond drilling, logging, and sampling
protocols were inspected. Independent quarter-core samples were collected to verify
presence of the tantalum and niobium mineralization. Mr. Ramon Mendoza, P.Eng.
assisted Mr. Chong during the site visit regarding sites amenable for locating potential
infrastructure. Sections of responsibility are summarized in Table 2-1.
Table 2-1: Site Visit and Sections of Responsibility
Qualified Person Site Visit Sections of Responsibility
Albert Chong, P.Geo. July 11 to 16, 2010 1, 2, 3, 4, 5, 6, 7, 8, 9, 10, 11, 12, 13, 14, 15,
16, 18, 19, 20, 21, 22, 23
Tomasz Postolski, P.Eng. No visit 1, 17, 20, 21
2.3 Effective Dates
The effective date of the Report is 31 January 2011, which represents the date of the
most recent scientific or technical information included in the Report.
COMMERCE RESOURCES CORPORATION
BLUE RIVER TA-NB PROJECT
BLUE RIVER, BRITISH COLUMBIA
NI 43-101 TECHNICAL REPORT
Project No.: 162230 Page 2-2 31 January 2011
The effective date of the Mineral Resource estimate is 30 June 2010, which represents
the date at which the drill hole database was closed.
Commerce initiated a drill program 1 July 2010. These holes were not used in preparing
the Mineral Resource estimate. AMEC inspected the lithology logged for these holes but
complete assay data for these holes was not available as of the effective date of this
report.
There were no material changes to the scientific and technical information of the Project
between the effective date of the Report and the signature date of the Report.
2.4 Sources of Information and Data
AMEC sourced information from reference documents as cited in the text and summarized
in Section 22 of this Report.
Two technical reports were previously filed on the Project by Commerce:
Gorham. J. (2007). Technical Report on the Upper Fir Ta-Nb Bearing Carbonatite 20-June-
2007, 48 p. plus appendices.
Stone, M., and Selway, J., 2010. Independent Technical Report, Blue River Property, Blue
River, British Columbia, Canada. 116 p.
A portion of the background information and technical data for this Report was obtained
from the above reports. Additional information was requested from, and provided by
Commerce.
2.5 Technical Report Sections and Required Items under NI 43-101
Table 2-2 relates the sections as shown in the contents page of this Report to the
Prescribed Items in Form 43-101F1.
COMMERCE RESOURCES CORPORATION
BLUE RIVER TA-NB PROJECT
BLUE RIVER, BRITISH COLUMBIA
NI 43-101 TECHNICAL REPORT
Project No.: 162230 Page 2-3 31 January 2011
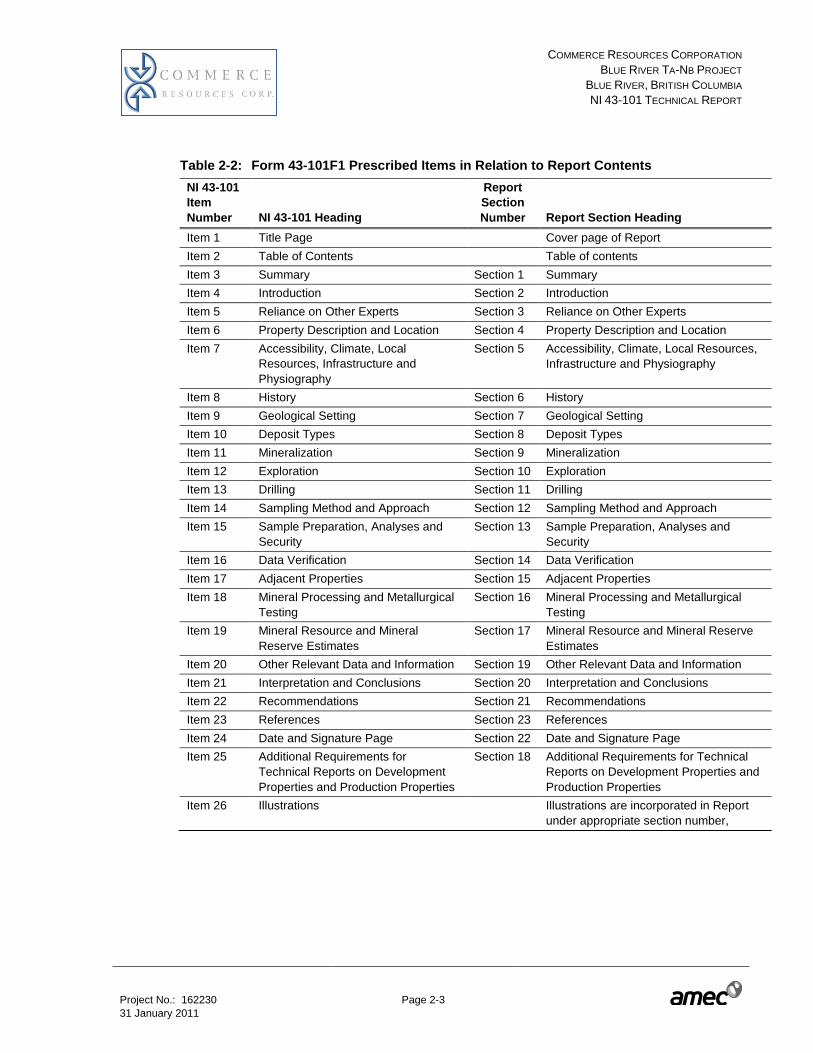
Table 2-2: Form 43-101F1 Prescribed Items in Relation to Report Contents
NI 43-101
Item
Number NI 43-101 Heading
Report
Section
Number Report Section Heading
Item 1 Title Page Cover page of Report
Item 2 Table of Contents Table of contents
Item 3 Summary Section 1 Summary
Item 4 Introduction Section 2 Introduction
Item 5 Reliance on Other Experts Section 3 Reliance on Other Experts
Item 6 Property Description and Location Section 4 Property Description and Location
Item 7 Accessibility, Climate, Local
Resources, Infrastructure and
Physiography
Section 5 Accessibility, Climate, Local Resources,
Infrastructure and Physiography
Item 8 History Section 6 History
Item 9 Geological Setting Section 7 Geological Setting
Item 10 Deposit Types Section 8 Deposit Types
Item 11 Mineralization Section 9 Mineralization
Item 12 Exploration Section 10 Exploration
Item 13 Drilling Section 11 Drilling
Item 14 Sampling Method and Approach Section 12 Sampling Method and Approach
Item 15 Sample Preparation, Analyses and
Security
Section 13 Sample Preparation, Analyses and
Security
Item 16 Data Verification Section 14 Data Verification
Item 17 Adjacent Properties Section 15 Adjacent Properties
Item 18 Mineral Processing and Metallurgical
Testing
Section 16 Mineral Processing and Metallurgical
Testing
Item 19 Mineral Resource and Mineral
Reserve Estimates
Section 17 Mineral Resource and Mineral Reserve
Estimates
Item 20 Other Relevant Data and Information Section 19 Other Relevant Data and Information
Item 21 Interpretation and Conclusions Section 20 Interpretation and Conclusions
Item 22 Recommendations Section 21 Recommendations
Item 23 References Section 23 References
Item 24 Date and Signature Page Section 22 Date and Signature Page
Item 25 Additional Requirements for
Technical Reports on Development
Properties and Production Properties
Section 18 Additional Requirements for Technical
Reports on Development Properties and
Production Properties
Item 26 Illustrations Illustrations are incorporated in Report
under appropriate section number,

COMMERCE RESOURCES CORPORATION
BLUE RIVER TA-NB PROJECT
BLUE RIVER, BRITISH COLUMBIA
NI 43-101 TECHNICAL REPORT
Project No.: 162230 Page 3-1 31 January 2011
3.0 RELIANCE ON OTHER EXPERTS
3.1 Mineral Tenure
The AMEC QPs have not reviewed the mineral tenure, nor independently verified the legal
status, ownership of the Project area or underlying property agreements. AMEC has fully
relied upon, and disclaims responsibility for, information derived from legal experts for this
information through the following document:
Letter from Clark Wilson LLP titled Commerce Resources Corp. – Mineral Claim Title
Opinion to Mr. Greg Kulla, dated October 29, 2010
Information from this letter and memos has been used in Section 4 of this Report.
3.2 Permitting and Environment
The AMEC QPs have not reviewed the permitting requirements, nor independently verified
the permitting status of the Project area. AMEC has fully relied upon, and disclaims
responsibility for information derived from experts for this information through the following
document:
Letter from Sage Resource Consultants Ltd. titled Commerce Resources Corp. Upper Fir
Deposit Preliminary Economic Assessment – Independent Professional Opinion on
Environmental Permitting and Liability Issues to Mr. Greg Kulla and dated September 29,
2010.
Information from this letter and memos has been used in Section 4 of this Report.
3.3 Market Analysis
The AMEC QPs have relied on tantalum and niobium market analyses derived from
experts for this information through the following documents:
Confidential memo from Dr. Axel Hoppe titled “Ap#6 Introduction to Tantalum
Markets_Finalpdf_2June09.pdf” received 18 October 2010
Confidential memo from Michel Robert titled “Niobium_v3jh.doc” received 18 October 2010
Confidential memo from Michel Robert titled “Niobium_v3jh.doc” received 19 October 2010
Dr. Hoppe is an internationally acknowledged leader in the tantalum field and is Chairman
of the Board of Directors for Commerce Resources.

COMMERCE RESOURCES CORPORATION
BLUE RIVER TA-NB PROJECT
BLUE RIVER, BRITISH COLUMBIA
NI 43-101 TECHNICAL REPORT
Project No.: 162230 Page 3-2 31 January 2011
Mr. Robert has extensive experience in niobium markets and is independent of the
company.
Information from these memos has been used in Section 17 of this Report.

COMMERCE RESOURCES CORPORATION
BLUE RIVER TA-NB PROJECT
BLUE RIVER, BRITISH COLUMBIA
NI 43-101 TECHNICAL REPORT
Project No.: 162230 Page 4-1 31 January 2011
4.0 PROPERTY DESCRIPTION AND LOCATION
4.1 Property Area and Location
The Project is located within the North Thompson River valley of east-central British
Columbia 25 to 60 km north and northeast of the community Blue River, British Columbia
(Figure 4-1). The NTS sheets which cover the Project are: 83D.004-.006; 83D.014-.016;
83D.024-.027; 83D.034-.037; 83D.045-.047. The Project is centered at approximately 52°
19' N latitude and 119° 10' W longitude.
4.2 Mineral Tenure
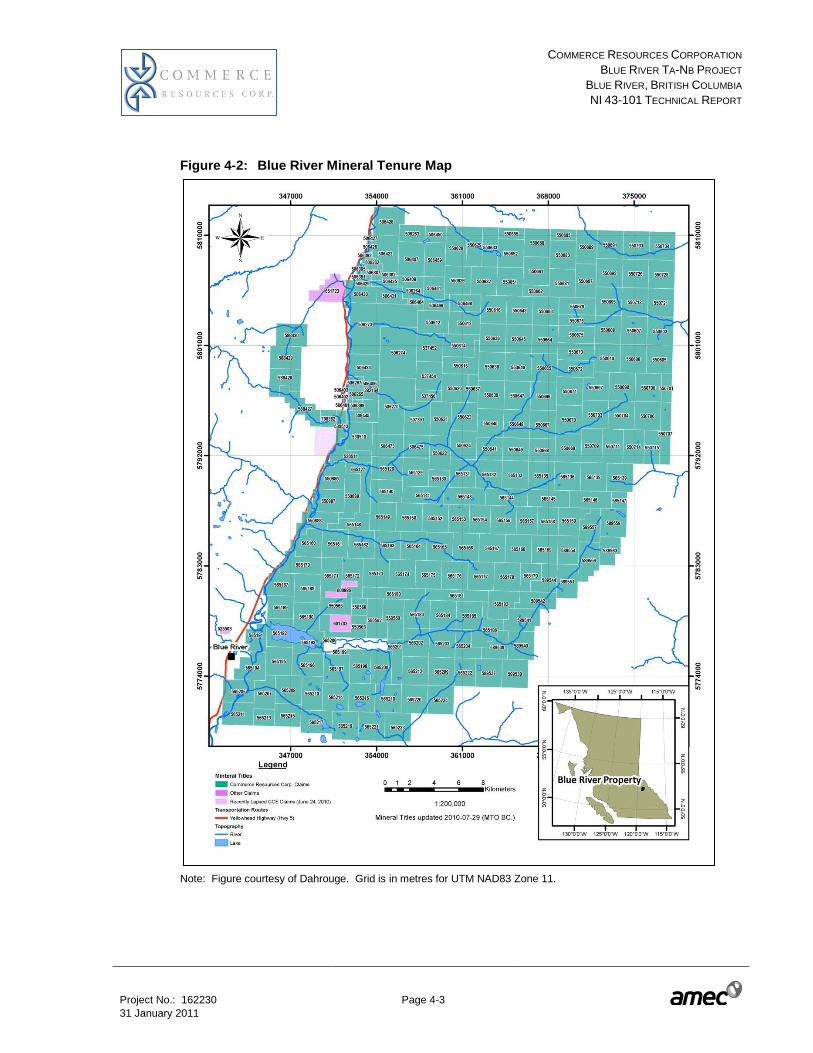
The Project comprises 249 2-post claim, 4-post claim, and mineral cell title submission
(MCX) mineral claims in good standing that encompass just over 1,000 km2
(105,373.23 ha) within the Kamloops Mining Division. These claims are wholly owned by
Commerce. The claim boundaries are shown in Figure 4-2 and a table listing claim details
is included in Appendix A. The Project’s 2011 annual work assessment cost is $ 834,607.
An additional $ 42,149 is required for filing fees.
Property boundaries are established in accordance with the Mineral Tenure Act of British
Columbia. Commerce has staked the claims by a combination of ground and on-line
staking. McElhanney Associates Land Surveying Limited of Vancouver B.C. has installed
differential GPS control points. Two-post and 4-post claims were established through a
legacy system of ground staking which involved physically establishing claim posts on the
ground. MCX claims are established using the Government of British Columbia’s Mineral
Titles Online (MTO) staking system. MTO is an Internet-based mineral titles administration
system that allows mineral exploration industry to acquire and maintain mineral titles by
selecting the area on a seamless digital GIS map of British Columbia. The electronic
Internet map allows selection of single or multiple adjoining grid cells. Cells range in size
from approximately 21 hectares (457 m x 463 m) in the south to approximately 16 hectares
at the north of the province. All boundaries are oriented north-south and east-west
4.3 Surface Rights
The Mineral Tenure Act of British Columbia provides for a recorded claim holder to use,
enter and occupy the surface of a claim or lease for the exploration and development or
production of minerals or placer minerals, including the treatment of ore and concentrates,
and all operations related to the exploration and development or production of minerals or
placer minerals and the business of mining. Access to surface rights held by third parties
typically requires compensation. No mining activity may be initiated until the recorded
claim holder receives the permit under section 10 of the Mines Act.

COMMERCE RESOURCES CORPORATION
BLUE RIVER TA-NB PROJECT
BLUE RIVER, BRITISH COLUMBIA
NI 43-101 TECHNICAL REPORT
Project No.: 162230 Page 4-2 31 January 2011
Two of Commerce’s mineral claims (530510 and 530511) along the North Thompson River
overlap surface rights owned by other parties. The overlapped area may require
negotiations in the future for land use purposes. AMEC is not aware of any known material
issues regarding access and land use for the claims.
Figure 4-1: Location Map
Note: Figure courtesy of Dahrouge Consulting Ltd (Dahrouge). Grid is in metres for UTM NAD83 Zone 11.
COMMERCE RESOURCES CORPORATION
BLUE RIVER TA-NB PROJECT
BLUE RIVER, BRITISH COLUMBIA
NI 43-101 TECHNICAL REPORT
Project No.: 162230 Page 4-3 31 January 2011
Figure 4-2: Blue River Mineral Tenure Map
Note: Figure courtesy of Dahrouge. Grid is in metres for UTM NAD83 Zone 11.

COMMERCE RESOURCES CORPORATION
BLUE RIVER TA-NB PROJECT
BLUE RIVER, BRITISH COLUMBIA
NI 43-101 TECHNICAL REPORT
Project No.: 162230 Page 4-4 31 January 2011
4.4 Permitting and Environmental Liabilities
There are no known environmental or permitting issues particular or unique to the Upper
Fir and Bone Creek deposits.
Commerce currently holds a multi-year Mineral and Coal Exploration Activities and
Reclamation Permit, permit number MX-15-138, which was issued by the British Columbia
Ministry of Energy Mines and Petroleum Resources under the Mines Act in September
2001 and most recently amended in June 2010. This permit grants permission for
Commerce to continue carrying out exploration activities that will support the ongoing
economic evaluation of the Upper Fir and Bone Creek deposit. The permit is valid until
31 December 2012 after which time an application to amend the permit will need to be
prepared and submitted, if required. There are no foreseeable reasons that additional
permit amendments would not be approved by the British Columbia Ministry of Energy
Mines and Petroleum Resources for continued exploration activities.
Associated with permit MX-15-138 is a reclamation security bond in the amount of
$83,000. This bond is currently posted as Safekeeping Agreements held by both BMO
and the B.C. Ministry of Finance. Commerce’s current reclamation practice is to reclaim
areas disturbed during mineral exploration on an ongoing basis as they become available,
thereby limiting their environmental liability.
4.5 Royalties, Payments, and Agreements
There are no known royalties, back-in rights, agreements, or encumbrances attributed to
the claims.
4.6 Location of Known Mineralization
Locations of known tantalum-niobium enriched carbonatite mineralization are noted in
Figure 4-1. Two main clusters of carbonatite occurrences are known at the Project. The
first cluster hosts the Fir, Upper Fir and Bone Creek deposits and is located between Bone
and Gum Creeks. The second cluster hosts the Verity, Mill, Serpentine, plus Roadside
deposits and is located approximately 7 km further north and occurs between Serpentine
and Mill Creeks.
COMMERCE RESOURCES CORPORATION
BLUE RIVER TA-NB PROJECT
BLUE RIVER, BRITISH COLUMBIA
NI 43-101 TECHNICAL REPORT
Project No.: 162230 Page 4-5 31 January 2011
4.7 Comment on Section 4
AMEC concludes:
Commerce owns 100% of the property mineral rights.
Commerce has paid annual claim-holding fees for the property.
Commerce holds a valid mineral exploration permit for the property.
The property is not subject to any known environmental liabilities.
The property is not subject to any royalties, back-in rights, agreements, or
encumbrances.

COMMERCE RESOURCES CORPORATION
BLUE RIVER TA-NB PROJECT
BLUE RIVER, BRITISH COLUMBIA
NI 43-101 TECHNICAL REPORT
Project No.: 162230 Page 5-1 31 January 2011
5.0 ACCESSIBILITY, CLIMATE, LOCAL RESOURCES,
INFRASTRUCTURE AND PHYSIOGRAPHY
5.1 Accessibility
The Project is located 23 km north of the community Blue River, British Columbia,
approximately 250 km north of the city Kamloops and approximately 90 km south of the
town of Valemount. The property is accessed from B.C. Highway 5 (Yellowhead Highway)
via a 4 km well groomed gravel road.
The Upper Fir and Bone Creek deposits can be reached from the Bone and Gum Creek
forestry service road which branches from Highway 5 approximately 23 km north of Blue
River. The east side of the property can be reached by forest service roads along the west
side of Kinbasket Lake and up Howard Creek. Logging roads on Serpentine, Bone,
Hellroar and Mud Creeks allow four-wheel drive and quad bike access to most of the
property. Access to remaining portions of the property is by helicopter.
5.2 Climate
In July, the average daily temperature is 16.4°C and the average rainfall accumulation is
97.5 mm for Blue River (Environment Canada Climate Normals 1971-2000 web site:
http://climate.weatheroffice.gc.ca/climate_normals/index_e.html). In January, the average
daily temperature is -9°C and the average snowfall accumulation is 109 cm for Blue River.
The average snow depth is 83 cm in February. Local rainfall and snowfall accumulations
on parts of the property may be much higher due to elevation and orographic effects.
Drilling is feasible from mid May through early to mid October. Snowfall can exceed 10 m
making winter drilling very expensive and difficult, but not impossible.
5.3 Local Resources
The city of Kamloops currently supports mining operations at the New Afton and Highland
Valley mines, and mineral exploration for the surrounding area. Services for mining
operations are reasonably available at Prince George, Vancouver or Edmonton.
5.4 Infrastructure
Power transmission lines, rail, paved, and gravel roads are all adjacent to the Project near
the Yellowhead Highway. The Yellowhead Highway runs sub-parallel to the North
Thompson River. The community of Blue River has a municipal airport for light aircraft and
helicopter support.

COMMERCE RESOURCES CORPORATION
BLUE RIVER TA-NB PROJECT
BLUE RIVER, BRITISH COLUMBIA
NI 43-101 TECHNICAL REPORT
Project No.: 162230 Page 5-2 31 January 2011
The main line of the Canadian National Railway passes through the western part of the
property. Sidings currently exist at Lempriere (16.5 km north) and Blue River (23.7 km
south of the Upper Fir deposit). The flat area immediately north of Bone Creek may be
suitable for a siding and is 4.9 km from the Upper Fir deposit.
The BC Hydro 136,000 volt supply line for the North Thompson valley also passes through
the west side of the property adjacent to the rail line. An 18 megawatt Bone Creek run-of-
river hydroelectricity project is under construction near the Project by Transalta Corp.
5.5 Physiography
The Project topography ranges from 700 m to 3,100 m elevation above sea level and is
located largely along the steep, west-facing slopes of the Monashee Mountains, to the east
of the North Thompson River.
The highest peak, Mt. Lempriere, is 3,183 m. Ice fields, glaciers and nevé dominate the
higher elevations on the property. Significant major tributaries feeding into the North
Thompson River in the area include Serpentine Creek, Pyramid Creek, Gum Creek, Bone
Creek, Hellroar Creek and Mud Creek.
Mountain slopes are typically covered by thick undergrowth consisting of grasses, buck
brush, devil’s club, and shrubs of willow, alder, rhododendron, huckleberry, currants,
gooseberry, thimbleberry, and raspberry. White spruce is common in replanted logging
areas. Former trails and flat wet areas are typically overgrown by dense alder and willow.
Areas not subjected to recent logging are covered by dense stands of hemlock, cedar, fir
and white pine. Within the area, the tree line is at approximately 2,000 m elevation. Except
for the Paradise Lake, Felix, Howard Creek and Gum Creek localities, all other
carbonatites are below the tree line, and outcrop exposure is generally poor.
5.6 Comment on Section 5
AMEC concludes:
There is sufficient area within the defined Project to accommodate mining-related
infrastructure such as a plant, mine, or waste rock facilities.
The physiography and climate are reasonable to enable future mining.
There is sufficient potential availability of manpower, power, water, communications
facilities, and infrastructure for transportation of supplies to support any future mine.
Area within the Project amenable for potential wet tailings facilities is limited. This is a
minor to moderate logistical risk for the Project which may be mitigated through other
options such as dry stacked tailings, underground disposal, or facilities external to the
existing Property boundary.

COMMERCE RESOURCES CORPORATION
BLUE RIVER TA-NB PROJECT
BLUE RIVER, BRITISH COLUMBIA
NI 43-101 TECHNICAL REPORT
Project No.: 162230 Page 6-1 31 January 2011
6.0 HISTORY
The following has been taken largely from Stone and Selway (2010), Aaquist (1981a,b,c),
McCrea (2001, 2002), Dahrouge (2001a, 2001b), Dahrouge and Reeder (2001, 2002),
Smith and Dahrouge (2002a, 2003), Davis (2006), Rukhlov and Gorham (2007), Gorham
(2008), and Mariano (1982).
6.1 Previous Work
The Blue River area has been the subject of intermittent exploration since the discovery of
vermiculite bearing carbonatite rock in 1949. A summary of exploration activities on the
Project is described below and summarized in Table 6-1.
Table 6-1: Blue River Exploration History Summary
Year Company Exploration
1949-1951
Oliver E.
French
Staking and prospecting; Discovered vermiculite-bearing
carbonatite near Blue River, discovered uranpyrochlore in
dolomitic carbonatite
1952-1955 St. Eugene
Optioned property, geologic mapping, prospecting,
stripping, trenching, and sampling
1967-1968 Vestor
Staking, reconnaissance surface mapping in the area south
of Paradise Lake
1976 J. Kruszewski Re-staked the area as the Verity and AR claims
1977-1978
J. Kruszewski /
E. Meyers
Magnetometer and scintillometer surveys, trenching and
sampling
1980 AMC
Optioned property, discovery of Fir and Bone Creek
carbonatites
1980-1982 AMC
3,954.2 m of NQ diamond drilling at Verity, Mill, Fir and
Bone Creek
1989 Diegel et al.
Government survey discovered two new carbonatite
localities near Serpentine Creek and Gum Creek
2000-Present Commerce
Surface mapping, trenching, soil sampling, geophysics,
diamond drilling, metallurgical testing, bulk sampling
Abbreviations: St. Eugene = St. Eugene Mining Corporation Ltd.; Vestor = Vestor Exploration Ltd; AMC = Anschutz
(Canada) Mining Ltd.; Commerce = Commerce Resources Corp.
Mr. Oliver E. French first discovered vermiculite-bearing carbonate rock near Blue River in
1949, leading to the staking of several claims in 1950 over what became known as the
Verity carbonatite. Zonalite Corporation conducted the first examination of the property but
did not prove economic potential for vermiculite. In 1951 French discovered
uranpyrochlore in dolomitic carbonatite. Having optioned the property, St. Eugene Mining

COMMERCE RESOURCES CORPORATION
BLUE RIVER TA-NB PROJECT
BLUE RIVER, BRITISH COLUMBIA
NI 43-101 TECHNICAL REPORT
Project No.: 162230 Page 6-2 31 January 2011
Corporation Ltd. conducted geologic mapping, prospecting, stripping, trenching, and
sampling between 1952 and 1955. In 1976, J. Kruszewski re-staked the area as the AR 1
to 3 claims, and optioned the Verity claim from E. French. In October 1977, 4.9 line km of
magnetometer and scintillometer surveys, as well as 4.2 line km of scintillometer surveys
only were conducted in the area of the Verity and Mill showings near the mouth of
Paradise Creek. During the summer of 1978, the uranium exploration program known as
“Paradise Creek Uranium-Columbium Prospect” was completed by E. Meyers for J.
Kruszewski. This program consisted of excavating and sampling of six trenches in the
Verity-Mill showing area near Paradise Creek
In 1980, Anschutz (Canada) Mining Ltd. (AMC) optioned the property and initiated
extensive exploration programs focused on tantalum and niobium potential. This resulted
in discovery of several new occurrences throughout the property, including the Fir and
Bone Creek carbonatites. During 1980-1981, Anschutz completed 3,954.2 m of NQ
diameter diamond drilling at the Verity, Mill, Fir and Bone Creek deposits. A tantalum-
niobium resource was estimated at Verity as part of an economic assessment of the
property, but the company abandoned the property due to a market drop in tantalum price.
The carbonatites and alkaline rocks of the Blue River area have also been described by
the following government and academic workers: Rowe (1958), Campbell (1968), Currie
(1976), Ghent et al. (1977), Meyers (1977), Simony et al. (1980), Pell and Simony (1981),
White (1982, 1985), Raeside and Simony (1983), Pell (1987, 1991, 1994), Pell and Hoy
(1989), and Diegel et al. (1989). Two new carbonatite occurrences were discovered by
government geologists in 1989 near Serpentine Creek and Gum Creek during detailed
mapping and sampling surveys.
6.2 Commerce Exploration
In 2000, Commerce acquired the Property and confirmed known tantalum mineralization at
the Fir and Verity carbonatites, and explored for new carbonatite deposits. During the
summer of 2002, the Upper Fir Carbonatite showing was discovered and defined by drilling
between 2005 and 2008.
6.3 Commerce Mineral Resource Estimates
During 2001 and 2002, Commerce commissioned preliminary Mineral Resource estimates
on limited data for the Verity and Fir carbonatite deposits (McRae, 2001, 2002).
During 2009-2010, Commerce commissioned Caracle Creek International Consulting Inc.
(CCIC) to prepare a mineral resource estimate for the Upper Fir. This estimate was based
on the interpretation of 168 Upper Fir drill holes completed between during 2005 to 2008.
As part of the estimate, the Verity and Fir Mineral Resource estimates were audited. CCIC
concluded the Verity and Fir estimates could not be verified, and therefore should not be
COMMERCE RESOURCES CORPORATION
BLUE RIVER TA-NB PROJECT
BLUE RIVER, BRITISH COLUMBIA
NI 43-101 TECHNICAL REPORT
Project No.: 162230 Page 6-3 31 January 2011
relied upon. An initial NI 43-101 compliant Mineral Resource estimate for the Upper Fir
tantalum and niobium rich carbonatite was completed in early 2010 by CCIC (Stone and
Selway, 2010).
During 2010, Commerce commissioned AMEC to complete a Preliminary Assessment
(PA) study which is on-going. As part of the PA, the Upper Fir Mineral Resources were
updated and initial Bone Creek Mineral Resources were established using drill holes
completed during 2005 to 2009 and new geological interpretations of the data.

COMMERCE RESOURCES CORPORATION
BLUE RIVER TA-NB PROJECT
BLUE RIVER, BRITISH COLUMBIA
NI 43-101 TECHNICAL REPORT
Project No.: 162230 Page 7-1 31 January 2011
7.0 GEOLOGICAL SETTING
Carbonatites represent a diverse, carbonate-rich, igneous rock type commonly designated
as magmatic segregation deposits. They result from the intrusion, cooling, and
crystallization of a primary (magmatic) Ca-Fe-Mg rich carbonate melt, often with some late
stage hydrothermal activity that can alter their host rocks. Almost all the known carbonatite
occurrences are either intrusive or subvolcanic intrusive rocks. The susceptibility of
carbonatites to chemical erosion in the atmosphere has resulted in their poor preservation
throughout Earth’s history.
Carbonatites are comprised of significant and variable amounts of calcite, dolomite, or
siderite of igneous origin. They can contain economic or anomalous concentrations of
incompatible elements such as: rare earth elements, niobium-tantalum, zirconium-hafnium,
iron-titanium-vanadium, uranium-thorium; and industrial minerals such as apatite,
vermiculite, magnetite, and barite.
7.1 Regional Geology
The regional geology is taken largely from Currie (1976), Pell (1987 and 1994), Gorham
(2007), and Stone and Selway (2010).
British Columbia is divided into three discrete areas hosting carbonatites and alkaline rocks
(Figure 7-1):
Eastern Area: the Foreland Belt, east of the Rocky Mountain Trench
Central Area: the eastern edge of the Omineca Belt
Western Area: the core of the Omineca Belt.
The Eastern Area hosts northwest to southeast trending carbonatite occurrences. They
are often associated with syenite intrusions. Most of the Eastern Area carbonatites have
relatively high niobium and rare earth element (REE) levels, and little or no tantalum.
Some known Eastern Area carbonatite or carbonatite-associated properties are: Aley,
Prince, Ice River and Rock Canyon Creek.
The Central Area carbonatite intrusions occur along the eastern edge of the Omineca Belt.
The carbonatites of the Omineca Belt commonly have high concentrations of niobium but
low REE values. Known carbonatite complexes include the Blue River and Mud Lake
areas.
The Western Area includes both intrusive and extrusive carbonatites and syenitic gneisses
in the core of the Omineca Belt. Examples are Mount Copeland, Mount Grace, and Three
Valley Gap.
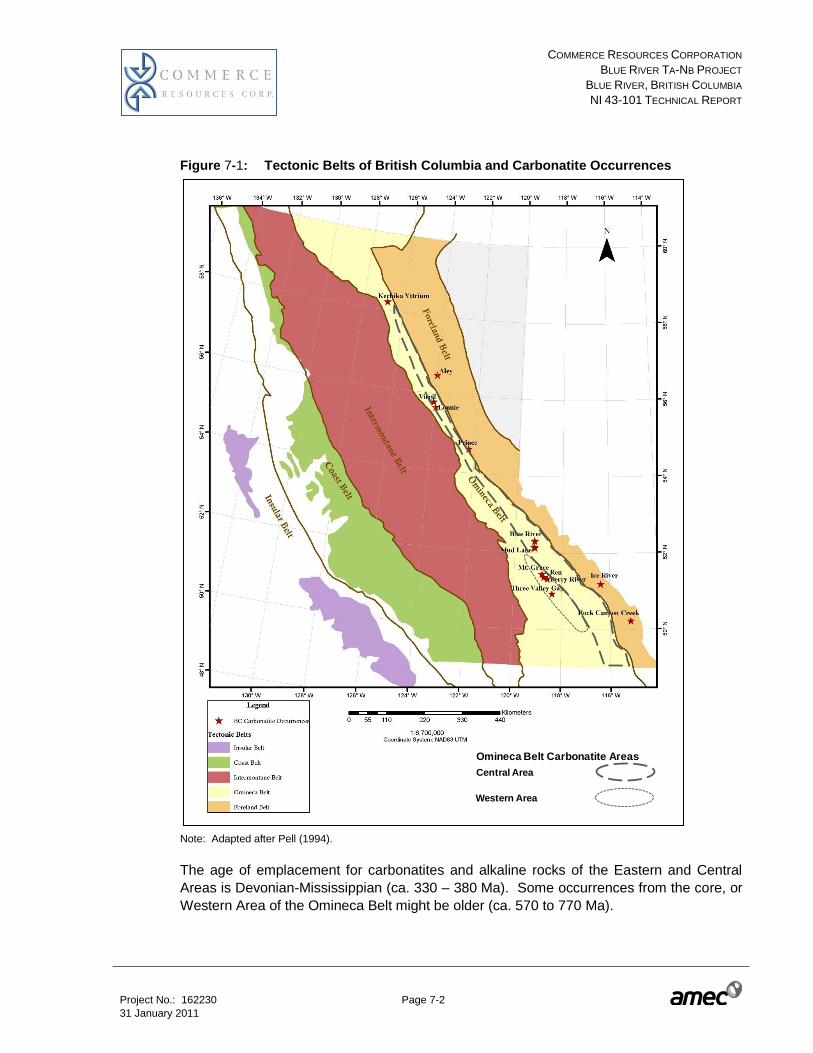
COMMERCE RESOURCES CORPORATION
BLUE RIVER TA-NB PROJECT
BLUE RIVER, BRITISH COLUMBIA
NI 43-101 TECHNICAL REPORT
Project No.: 162230 Page 7-2 31 January 2011
Figure 7-1: Tectonic Belts of British Columbia and Carbonatite Occurrences
Note: Adapted after Pell (1994).
The age of emplacement for carbonatites and alkaline rocks of the Eastern and Central
Areas is Devonian-Mississippian (ca. 330 – 380 Ma). Some occurrences from the core, or
Western Area of the Omineca Belt might be older (ca. 570 to 770 Ma).
Central Area
Western Area
Omineca Belt Carbonatite Areas

COMMERCE RESOURCES CORPORATION
BLUE RIVER TA-NB PROJECT
BLUE RIVER, BRITISH COLUMBIA
NI 43-101 TECHNICAL REPORT
Project No.: 162230 Page 7-3 31 January 2011
All of the alkaline and carbonatite complexes and their host rocks within the Omineca Belt
rocks were deformed and metamorphosed during the Jurassic-Cretaceous Columbian
Orogeny and have been subjected to upper amphibolite facies metamorphism.
7.2 Local Geology
The local geology is taken largely from Digel et al. (1998).
The Project is located in the Central Area within the north-eastern margin of the Shuswap
Metamorphic Complex. The area is composed of polyfolded, metamorphosed Late
Proterozoic (ca. 700-550 Ma) supracrustal rocks and is bounded on the east and west by
steep Eocene west-side down normal faults in the southern Rocky Mountain Trench to the
east and the North Thompson valley to the west. The Malton gneissic complex lies to the
north.
The supracrustal rocks are part of a belt dominated by the Late Proterozoic Horsethief
Creek Group and the overlying Kaza Group. The belt is continuous from the northern
Selkirk Mountains in the southeast, through the Monashee Mountains, and into the Cariboo
Mountains in the northwest. The Blue River carbonatites are hosted in the Mica Creek
assemblage of the Horsethief Creek Group (Figure 7-2).
7.3 Blue River Project Geology
The following descriptions have been summarized from Kraft (2010), Chudy (2010),
Raeside and Simony (1983), and Simonetti (2008).
7.3.1 Metasedimentary Rocks
Two units of the Mica Creek assemblage underlie much of the study area. The units are at
least 1,000 m thick and comprise the lower pelite unit, and the stratigraphically overlying
semipelite–amphibolite unit (Figure 7-3). The Mica Creek metasedimentary rock types
include: biotite gneiss; muscovite-biotite schist and gneiss; garnet-muscovite biotite schist
and gneiss; calc-silicate biotite gneiss; amphibolites; garnet amphibolites; and calc-
amphibolite.
The high intensity of deformation precludes determination of tops in metasedimentary
rocks, thus relative ages of individual units are not clear. Layering in the gneiss is
interpreted as relict bedding, not metamorphic segregation.

COMMERCE RESOURCES CORPORATION
BLUE RIVER TA-NB PROJECT
BLUE RIVER, BRITISH COLUMBIA
NI 43-101 TECHNICAL REPORT
Project No.: 162230 Page 7-4 31 January 2011
Gneisses and Schists
Metamorphosed quartzo-feldspathic biotite gneiss is the most abundant lithology at
surface. The biotite gneiss is ubiquitous and is inter-layered with all other lithologies on the
property.
Outcrops are moderately weathered with characteristic 0.2 to >1 m thick layers of uniform,
massive, medium grained quartz-feldspar-biotite±muscovite divided by recessive schistose
bands or fine partings. Fresh surfaces have a uniform, equigranular, salt and pepper
texture of quartz, feldspar and biotite. Muscovite occurs as thin schistose partings from
trace to abundant amounts. Sub-one mm diameter red garnet occurs in varying amounts.
These units are interpreted to represent deformed and moderately re-crystallized turbidite.
Calc-silicate bearing biotite gneiss has pale green bands a few centimetres thick likely
related to microscopic trace actinolite +/- diopside.
Amphibolites
The amphibolite units occur as lenses within all gneiss and schist units. They are typically
medium grained, massive to moderately foliated amphibolites and can contain red garnets
(almandine) typically < 1 cm in diameter. Plagioclase and hornblende occur in varying
proportions forming rocks ranging from tonalite to hornblendite composition (<10%
hornblende to >90% hornblende respectively). Weak mineral lineations are present as
observed by the alignment of hornblende. Rare banding is observed at centimetre scale.
Locally, calc-amphibolite units are distinguished by an increase in mineral grain size, a
strong contrasting black and white colour, local presence of garnets, and effervescent
reaction with dilute hydrochloric acid. The amphibolites units are interpreted as
metamorphosed mafic sills, dikes, and possibly subaqueous flows.
7.3.2 Intrusive Rocks
Ultramafic Rocks
Ultramafic rocks associated with the carbonatites include fine- to medium-grained
pyroxenites and cumulate pyroxene-hornblendites. The ultramafic units likely represent a
metamorphosed ultramafic intrusion associated with mafic volcanism (amphibolite) roughly
the same age as the intruded metasediments (Figure 7-3).

COMMERCE RESOURCES CORPORATION
BLUE RIVER TA-NB PROJECT
BLUE RIVER, BRITISH COLUMBIA
NI 43-101 TECHNICAL REPORT
Project No.: 162230 Page 7-5 31 January 2011
Figure 7-2: Local Geology Map
Note: Figure courtesy of Dahrouge.

COMMERCE RESOURCES CORPORATION
BLUE RIVER TA-NB PROJECT
BLUE RIVER, BRITISH COLUMBIA
NI 43-101 TECHNICAL REPORT
Project No.: 162230 Page 7-6 31 January 2011
Figure 7-3: Deposit Area Surface Geology Map
Note: Figure courtesy of Dahrouge.

COMMERCE RESOURCES CORPORATION
BLUE RIVER TA-NB PROJECT
BLUE RIVER, BRITISH COLUMBIA
NI 43-101 TECHNICAL REPORT
Project No.: 162230 Page 7-7 31 January 2011
Carbonatite
The Blue River carbonatite is approximately 330 million years old (and possibly older)
according to U-Pb geochronology data. The carbonatite was emplaced as dikes or sills
into the metasedimentary rocks prior to regional deformation and metamorphism
(c.a. 200 Ma).
The carbonatite forms sill-like bodies with average thicknesses of 30 m, ranging between
5 m to about 90 m thick, and with strike lengths ranging between 50 m to 1,100 m (Figure
7-4, Figure 7-5, Figure 7-6 and Figure 7-7). Bedding parallel foliation in metasedimentary
gneisses and the contacts of carbonatite intrusions, generally strike 335° and 155° with
shallow to moderate northeast and southeast dips.
Both dolomitic carbonatites and calcitic carbonatite occur at Blue River. Dolomitic
carbonatites are often referred to as magnesio-carbonatite, or rauhaugite, or beforsite.
Coarse-grained, calcitic carbonatites are also often referred to as calcio-carbonatite or
sövite.
Dolomitic and calcitic carbonatites usually form separate bodies but can occur together
within single intrusions. At Blue River, dolomitic carbonatite typically makes up the cores
of the carbonatite bodies. Crosscutting or gradational relationships can be observed from
one variety of carbonatite into another.
Dolomitic and calcitic carbonatites are medium to coarse-grained and have secondary
tectonically-imposed textures. A cataclastic (porphyroclastic) texture is common in all the
carbonatites. Most exposures display layering defined by varying quantities of accessory
minerals. Accessory minerals include amphibole, pyroxene, phlogopite, olivine, magnetite,
apatite, pyrite/pyrrhotite, ilmenite, zircon, and various tantalum and niobium bearing
minerals.
Contacts between carbonatite and the host metasediments are typically sharp and mantled
by zones of metasomatized host rock, known as fenite (Figure 7-7).
Fenite
The following general description of fenites is from the website:
http://umanitoba.ca/geoscience/faculty/arc/fenite. Fenites were described in the Fen area
of Norway and are Na- and K-rich silicate rocks developed at the contact of alkaline
igneous intrusions and their surrounding country rocks. Fenites are not necessarily
confined to the intrusive contact and may develop at a significant distance from the
intrusion through interaction of the country rock with percolating fluids, or inside the
intrusion through reaction of xenoliths with their entraining magma. Fenites typically
comprise potassium feldspar, albite, aegirine, various sodic amphiboles and, in some

COMMERCE RESOURCES CORPORATION
BLUE RIVER TA-NB PROJECT
BLUE RIVER, BRITISH COLUMBIA
NI 43-101 TECHNICAL REPORT
Project No.: 162230 Page 7-8 31 January 2011
cases, nepheline. A variety of more exotic silicate, phosphate and oxide minerals can be
found in these rocks.
At Blue River, the fenite rocks commonly, but not always, envelope the carbonatite rocks
and can extend up to 50 m from the carbonatite intrusions (Figure 7-5 to 7-7). The
metasedimentary host rocks are characterized by foliated calcite-richterite-biotite
(± apatite, ± vermiculite) rock. Of lesser importance are contact metasomatic veins
commonly less than 1 m thick that are comprised of amphibole-pyroxene (± vermiculite
± carbonate).

COMMERCE RESOURCES CORPORATION
BLUE RIVER TA-NB PROJECT
BLUE RIVER, BRITISH COLUMBIA
NI 43-101 TECHNICAL REPORT
Project No.: 162230 Page 7-9 31 January 2011
Figure 7-4: Drill Collar and Vertical Section Locations
Note: See Figure 7-5 for the Lower Road longitudinal section; see Figure 7-6 for section 5796737 N; see Figure 7-7 for
section 5796425 N. Bulk sample locations are noted at BS1, BS2 and BS3.

COMMERCE RESOURCES CORPORATION
BLUE RIVER TA-NB PROJECT
BLUE RIVER, BRITISH COLUMBIA
NI 43-101 TECHNICAL REPORT
Project No.: 162230 Page 7-10 31 January 2011
Figure 7-5: Lower Road Longitudinal Section 352800 E
Note: The figure illustrates the carbonatite geometry and its north-south geological continuity. View is to the east.
Section influence is +/- 25 m. Carbonatite = blue coloured domains; fenite = dashed green outlines; undifferentiated
metasediments = non-filled area below topography. Drill hole 2 m composites are colour coded for Ta2O5 grade in
ppm.
100 m
North South
Fenite
Upper Fir
Carbonatite
Bone Creek
Carbonatite
Undifferentiated
metasediments
Ta2O5

COMMERCE RESOURCES CORPORATION
BLUE RIVER TA-NB PROJECT
BLUE RIVER, BRITISH COLUMBIA
NI 43-101 TECHNICAL REPORT
Project No.: 162230 Page 7-11 31 January 2011
Figure 7-6: Geology Section 5796737 N
Note: Illustrates the carbonatite geometry, its east-west geological continuity, and relationship between drilled
thickness versus true thickness. View is to the north. Section influence is +/- 25 m. Carbonatite = blue coloured
domains; fenite = dashed green outlines; undifferentiated metasediments = non-filled area below topography. Drill hole
2 m composites are colour coded for Ta2O5 grade in ppm.
West East
Bone Creek
Carbonatite
Upper Fir
Carbonatite
Amphibolite
Fenite
Undifferentiated
metasediments 100 m
Ta2O5

COMMERCE RESOURCES CORPORATION
BLUE RIVER TA-NB PROJECT
BLUE RIVER, BRITISH COLUMBIA
NI 43-101 TECHNICAL REPORT
Project No.: 162230 Page 7-12 31 January 2011
Figure 7-7: Geology Section 5796425 N
Note 1: Illustrates the carbonatite geometry, east-west geological continuity, folding, and relationship between drilled
thickness versus true thickness. View is to the north. Section influence is +/- 25 m. Carbonatite = blue coloured
domains; fenite = dashed green outlines; undifferentiated metasediments = non-filled area below topography. Drill hole
2 m composites are colour coded for Ta2O5 grade in ppm.
Fold indicators in core intersections observed in holes F08-150 and F08-151 (Figure 7-7:
locations A, B, and C) are shown in Figures 7-8 to 7-10 respectively.
West East
Upper Fir
Carbonatite
Fenite
Fenite
Undifferentiated
metasediments 100 m
(A)
(B)
(C)
Ta2O5

COMMERCE RESOURCES CORPORATION
BLUE RIVER TA-NB PROJECT
BLUE RIVER, BRITISH COLUMBIA
NI 43-101 TECHNICAL REPORT
Project No.: 162230 Page 7-13 31 January 2011
Figure 7-8: Folding Indicators (Hole F08-150 121.8 m to 129.8 m)
Notes: Left: Hole F08-150: 121.8m to 129.8m. HQ diameter diamond drill core. Hole was drilled vertical.
Compositional layering (L) of biotite-quartz gneiss is typically at a high angle to the core axis indicating a sub-horizontal
attitude when related to the sub-vertical dip of the drill hole. A ptygmatic fold is also observed (T). Top of hole is
towards the top left of photo.
Right: Hole F08-150: 125m. Indications of folding include asymmetric parasitic folds with short and long limbs (P)
bracketed by sub-horizontal compositional layering. Centimetre scale ptygmatic folds (T) are noted.
Figure 7-9: Folding Indicators (Hole F08-150: 143.5 m and 147.0 m)
Note: Left: F08-150: 143.5 m. Right: F08-150: 147.0 m. Indications of folding include high and low angle layering
indicating possible fold closures. Top of hole is towards the top left of photos.
P
T
L, T

COMMERCE RESOURCES CORPORATION
BLUE RIVER TA-NB PROJECT
BLUE RIVER, BRITISH COLUMBIA
NI 43-101 TECHNICAL REPORT
Project No.: 162230 Page 7-14 31 January 2011
Figure 7-10: Folding Indicators (Hole F08-151: 204.0 m to 204.5 m)
Note: F08-151: 204.0 m to 204.5 m (top to bottom). Folding indicators include repetition of carbonatite to biotite-quartz
gneiss and back into carbonatite. Upper carbonatite in figure has a contact at a high angle to core axis indicating that it
is a flat lying contact (upper right dashed line). Middle gneiss has a trend of compositional layering with high - to low -
to high angles relative to core axis (middle curved dashed line and lower middle dashed line). Black box highlights a
possible fold closure which gives a characteristic bulls-eye appearance to the layering. Top of hole is towards the top
left of photo.
Pegmatite Dykes
Pegmatite dykes and pods up to 500 m long and 15 m thick crosscut all lithologies
throughout the property. At least some of the pegmatites are folded. Among the
pegmatites, two mineralogically distinct types exist: (1) two-mica (± garnet, ± tourmaline)
granitic pegmatites, and (2) syenitic pegmatites with minor biotite (± amphibole,
± pyroxene).
7.3.3 Structural Geology and Metamorphism
The structural geology is summarized largely from Kraft (2010), Ghent et al. (1977),
Simony et al. (1980), and Raeside and Simony (1983).
The style of structural deformation at the Project directly impacts the carbonatite geometry.
A deformation model was developed on behalf of Commerce by J. Kraft during 2009 and
early 2010. The structural deformation model was confirmed and enhanced by field work
completed by J. Kraft during July and September of 2010. The following descriptions
include the 2010 supporting observations and interpretations.
Carbonatite
Carbonatite
Towards top of hole
Towards bottom of hole

COMMERCE RESOURCES CORPORATION
BLUE RIVER TA-NB PROJECT
BLUE RIVER, BRITISH COLUMBIA
NI 43-101 TECHNICAL REPORT
Project No.: 162230 Page 7-15 31 January 2011
Regionally, three phases of compressional deformation have been mapped throughout
most of the region, from the northern Selkirk Mountains into the Cariboo Mountains. At the
Project, at least two additional deformation events are observed.
The first deformation event (D1) produced large recumbent folds (F1) with limbs
approximately 50 km long and an associated early foliation (S1). Features from F1 are not
observed within the immediate deposit area.
The second deformation event (D2) is associated with peak, mid-amphibolite facies
metamorphism with an associated foliation (S2). In general the S1 and S2 foliations can
rarely be distinguished from one another in the field and are mapped as S1+S2. D2 has
created boudinage, or pinch and swell features attributed to competency contrasts
between rock type layers.
The third deformation event (D3) is characterized by centimetre to decametre scale
recumbent folds (F3) that deform the S2 foliation. Axial planar schistosity that deforms
S1+S2, within micaceous lithologies such as fenite, are known as S3. The style and
attitude of F3 folds are variable, but axial planes are generally southwest-dipping.
The fourth deformation event (D4) is characterized by inclined, southwest trending folds
that re-fold larger F3 folds in the deposit area. Open to tight upright folds with easterly to
southeasterly hinges occur sporadically. D4 is suggested to include thrust faulting with top
to the south west vergence.
The fifth deformation event (D5) is described as a brittle extensional event characterized
by normal faults with slickensides, weak quartz-pyrite alteration of wall rocks, and cross-
cutting relationships with D4 structures.
Folding is observed in waste rocks adjacent to the carbonatite in outcrop, in drill core, and
is interpreted for carbonatite intercepts on large scale geological sections. Within
carbonatite, compressional deformation with weak southeasterly elongation is suggested
by zones with cataclastic to mylonitic foliation (Chudy, pers. comm.) and weakly to
moderately developed mineral lineations defined by amphiboles. Carbonatite bodies are
folded at metres to deposit scale, however their thickness and massive (non-layered)
nature makes observation of folding indicators within the carbonatite comparatively difficult
to observe in outcrop or drill core.
7.3.4 Geochronology
The geochronology is summarized largely from Pell (1994), Simonetti (2008), and Gervais
(2009).
A uranium-lead date of about 325 Ma was obtained from zircons from the Verity
carbonatite. A lead-lead date of 332.5 +/- 5.7 Ma age was obtained from zircons for the

COMMERCE RESOURCES CORPORATION
BLUE RIVER TA-NB PROJECT
BLUE RIVER, BRITISH COLUMBIA
NI 43-101 TECHNICAL REPORT
Project No.: 162230 Page 7-16 31 January 2011
Upper Fir carbonatite. A preliminary uranium-lead date of 328 +/- 30 Ma was obtained
from zircons from the Mud Lake area carbonatite.
Zircons separated from syenites at Paradise Lake yielded a uranium-lead age of about
340 Ma and lead-lead ages of about 351 and 363 Ma. Ongoing research on U/Th/Pb
dating of zircons and monazites from the property shows a complex thermal history,
indicating that the age of emplacement of the Blue River area carbonatites may be older
than initial results have shown.
7.4 Fir and Verity Geology
The geology for the Fir and Verity carbonatite occurrences are described due to their past
and current exploration activities. This section has been taken largely from the British
Columbia Geological Survey website.
7.4.1 Fir Carbonatite Geology
The Fir showing is located 1.25 km north of the Bone Creek carbonatite. Carbonatite
consisting of dolomitic and lesser calcitic carbonatite occurs as sills within the quartz-
hornblende-mica schist of the Semipelite Amphibolite division of the Horsethief Creek
Group. Other lithologies include amphibole-biotite schist, biotite-muscovite gneiss and
amphibole-biotite-garnet gneiss.
The Fir carbonatite likely strikes 400 m in a northerly direction based on outcrop
exposures. A 2 m exposure of dolomitic carbonatite was located 400 m north of the
discovery outcrops. Dolomitic outcrops are coarsely crystalline and typically weather
white. Accessory minerals in the carbonatites include apatite, amphibole, olivine,
magnetite, pyrite, pyrrhotite, pyrochlore and columbite. The dolomitic carbonatite is almost
devoid of biotite and magnetite. Three distinct textures were observed: breccias
composed of tightly packed dolomite fragments within a finely crystalline dolomite
groundmass; a porphyritic texture with ghost dolomitic crystals in a fine grained matrix; and
a massive texture with local banding of accessory minerals.
7.4.2 Verity Carbonatite
The Verity carbonatite is located about 40 km north of the community Blue River. The
Verity carbonatite has the most varied stratigraphy of all the carbonatites in the area and is
similar texturally and compositionally to the Paradise and Lempriere carbonatite showings.
The Verity carbonatite consists of banded dolomitic and calcitic carbonatite that locally
intrude each other. It occurs as a 15 to 30 m thick sill within quartz-hornblende-mica schist
of the Horsethief Creek Group. It can be traced up the hillside for 800 m to the east-

COMMERCE RESOURCES CORPORATION
BLUE RIVER TA-NB PROJECT
BLUE RIVER, BRITISH COLUMBIA
NI 43-101 TECHNICAL REPORT
Project No.: 162230 Page 7-17 31 January 2011
northeast. It potentially continues to the Paradise showing located about 4,500 m to the
east-northeast.
A tectonic breccia showing hairline fractures is common in the dolomitic carbonatite. A
banded texture caused by layering of the accessory minerals apatite, amphibole, olivine,
magnetite, vermiculite, biotite, pyrite, pyrrhotite, pyrochlore, columbite, and zircon is
common in calcitic carbonatite and less developed in the dolomitic carbonatite. Coarse
olivine and apatite in calcitic dolomite form bands 1 to 5 cm thick. Magnetite occurs as
discontinuous lenses in calcitic carbonatite layers up to 20 cm in diameter.
7.5 Comment on Section 7
AMEC concludes:
The geological setting, lithological and structural controls at Blue River are reasonably
well understood.

COMMERCE RESOURCES CORPORATION
BLUE RIVER TA-NB PROJECT
BLUE RIVER, BRITISH COLUMBIA
NI 43-101 TECHNICAL REPORT
Project No.: 162230 Page 8-1 31 January 2011
8.0 DEPOSIT TYPES
The mineralization identified to date at the Project is consistent with magmatic, carbonatite
associated deposits. Carbonatite associated deposits are classified as either magmatic,
replacement, or residual. Global examples of magmatic carbonatite complexes, or
deposits include Oka, Niobec, and St. Honore (Quebec), Kovdor (Russia), Iron Hill
(Colorado) and Gardiner (Greenland) (Mitchell, 2010). Examples of replacement
carbonatite deposits are Rock Canyon (B.C.), Bayan Obo (China), and Palabora (South
Africa). Araxa and Catalao (Brazil) are classified as residual carbonatite deposits due to
the degree of lateritic weathering. Carbonatites are the main source of niobium +/-
tantalum, and important sources of rare earth elements.
Magmatic carbonatite deposits have the following common features (Birkett and Simandl,
1998).
Commodities: niobium, tantalum, rare earth elements, phosphate, vermiculite, copper,
titanium, strontium, fluorine, thorium, uranium, magnetite.
Geological setting: Carbonatites intrude all types of rocks and are emplaced at a
variety of depths. Carbonatites occur mainly in a continental environment, rarely in
oceanic environments (Canary Islands) and are generally related to large-scale, intra-
plate fractures, grabens or rifts that correlate with periods of extension and may be
associated with broad zones of uplift.
Age of Mineralization: Carbonatite intrusions are early Precambrian to Recent in age;
they appear to be increasingly abundant with decreasing age. In British Columbia,
carbonatites are mostly upper Devonian, Mississippian or Eocambrian in age.
Host Rocks: Host rocks are varied, including calcite carbonatite (sövite), dolomite
carbonatite (beforsite), ferroan or ankeritic calcite-rich carbonatite (ferrocarbonatite),
magnetite-olivine-apatite ± phlogopite rock, nephelinite, syenite, pyroxenite, peridotite
and phonolite. Carbonatite lava flows and pyroclastic rocks are not known to contain
economic mineralization. Country rocks are of various types and metamorphic grades.
Deposit Form: Carbonatites are small, pipe-like bodies, dikes, sills, small plugs or
irregular masses. The typical pipe-like bodies have sub-circular or elliptical cross
sections and are up to 3-4 km in diameter. Magmatic mineralization within pipe-like
carbonatites is commonly found in crescent-shaped and steeply-dipping zones.
Metasomatic mineralization occurs as irregular forms or veins. Residual and other
weathering-related deposits are controlled by topography, depth of weathering and
drainage development.
Deposit Mineralogy:
○ Magmatic: bastnaesite, pyrochlore, columbite, apatite, anatase, zircon,
baddeleyite, magnetite, monazite, parisite, fersmite.

COMMERCE RESOURCES CORPORATION
BLUE RIVER TA-NB PROJECT
BLUE RIVER, BRITISH COLUMBIA
NI 43-101 TECHNICAL REPORT
Project No.: 162230 Page 8-2 31 January 2011
○ Replacement/Veins: fluorite, vermiculite, bornite, chalcopyrite and other sulphides,
hematite.
○ Residual: anatase, pyrochlore and apatite, locally crandallite-group minerals
containing rare earth elements.
Gangue Mineralogy: Calcite, dolomite, siderite, ferroan calcite, ankerite, hematite,
biotite, titanite, olivine, quartz.
Alteration: A fenite halo (alkali metasomatized country rocks) commonly surrounds
carbonatite intrusions; alteration mineralogy depends largely on the composition of the
host rock. Most fenites are zones of desilicification with addition of Fe3+, Na and K.
Ore Controls: Intrusive form and cooling history control primary igneous deposits
(fractional crystallization). Tectonic and local structural controls influence the forms of
metasomatic mineralization. The depth of weathering and drainage patterns control
residual pyrochlore and apatite deposits, and vermiculite deposits.
Many features of the mineralization identified within the Project to date are analogous to
magmatic carbonatite deposits, in particular the Oka (Husereau Hill) and St. Honore
deposits, Quebec.
Key features of the Blue River deposits supporting a magmatic carbonatite model are:
Commodities: niobium and tantalum.
Geological Setting: occurs along the eastern portion of the Omineca Crystalline Belt
and hence its tectonic setting is along a large scale zone with associated uplift.
Age of Mineralization: data yields results of about 330 Ma which is consistent with
other British Columbia carbonatite deposits.
Host Rocks: dolomite and calcite-rich carbonatite intrusion rocks.
Deposit Form: the Blue River carbonatites occur as sills and dykes.
Deposit Mineralogy: ferrocolumbite and pyrochlore.
Gangue Mineralogy: dolomite, calcite, amphibole (richterite), quartz, pyroxene,
phlogopite, olivine, magnetite, apatite, pyrite/pyrrhotite, ilmenite, and zircon.
Alteration: Fenite halos occur around most carbonatites at Blue River.
Ore Controls: The Blue River carbonatites have been deformed by multiple episodes
of folding and faulting. The internal cooling history of the deposit is not clear.
COMMERCE RESOURCES CORPORATION
BLUE RIVER TA-NB PROJECT
BLUE RIVER, BRITISH COLUMBIA
NI 43-101 TECHNICAL REPORT
Project No.: 162230 Page 8-3 31 January 2011
8.1 Comment on Section 8
AMEC concludes:
A polyfolded sill-like carbonatite model suitably describes the Blue River deposits.
The deposit concepts being applied as the basis for exploration planning at the Project
are reasonable.

COMMERCE RESOURCES CORPORATION
BLUE RIVER TA-NB PROJECT
BLUE RIVER, BRITISH COLUMBIA
NI 43-101 TECHNICAL REPORT
Project No.: 162230 Page 9-1 31 January 2011
9.0 MINERALIZATION
The discussion in this section is summarized largely from observations during AMEC’s site
visit, and from Stone and Selway (2010), Chudy (2008 and 2010), Woolley and Kempe
(1989), Aaquist (1982a), and Mariano (2000).
Blue River mineralization comprises niobium and tantalum bearing minerals that have
co-crystallized in carbonatite by primary magmatic concentration and in fenite formed by
metasomatic alteration of enclosing host rocks. The mineralization has the same or similar
geometry and structural controlling features as the carbonatite on a deposit scale. See
Section 7.3.2, Section 7.3.3, Figure 7.3, Figure 7.5, Figure 7.6 and Figure 7.7 for a
discussion on the geometry of the Blue River deposit.
9.1 Blue River Mineralization
9.1.1 Carbonatite Mineralization
This sub-section describes the Blue River carbonatite niobium and tantalum mineralization.
There are two principal and one minor niobium or tantalum bearing minerals known at the
Project. The minerals are:
ferrocolumbite: (Fe,Mn,Mg)(Nb,Ta)2O6,
pyrochlore: (Ca,Na,U)2(Nb,Ti,Ta)2O6(OH,F), and
fersmite: (Ca,Ce,Na)(Nb,Ta,Ti)2(O,OH,F)6.
Ferrocolumbite
Ferrocolumbite occurs predominantly in medium to coarse-grained, granoblastic dolomitic
carbonatites which typically form thin intervals (<6 m) or occur at margins of thicker
intervals of carbonatite. Ferrocolumbite forms subhedral to anhedral, sometimes strongly
poikilitic, individual grains or agglomerates of grains (Figure 9-1).
Mineral liberation analyses show that the majority (~80%) of liberated grains are less than
110 μm in diameter. Locally, individual grains and agglomerates of ferrocolumbite may
exceed 2 cm in diameter.
Ferrocolumbite grains from marginal zones may contain large amounts of tiny inclusions
such as thorite (Th-silicate), monazite (La, Ce-phosphate) and pyrochlore. Ferrocolumbite
may also occur sporadically as inclusions in apatite and amphibole. It is often associated
with layers and micro-veins of apatite that fill the interstices between anhedral ferroan-
dolomite grains.

COMMERCE RESOURCES CORPORATION
BLUE RIVER TA-NB PROJECT
BLUE RIVER, BRITISH COLUMBIA
NI 43-101 TECHNICAL REPORT
Project No.: 162230 Page 9-2 31 January 2011
Element abundances in Upper Fir ferrocolumbite average 67.8% Nb2O5, 9.3% Ta2O5 and
1.6% TiO2 with a Nb2O5 / Ta2O5 ratio of about 12.
Pyrochlore
Pyrochlore occurs predominantly in the fine-grained and porphyroblastic dolomitic
carbonatite which is commonly developed in the central portions of carbonatite intervals
greater than 10 m thick. Such zones are less abundant or absent in thinner carbonatite
intersections. Pyrochlore is the only tantalum mineral in the calcitic carbonatites where it
occurs in accessory amounts. Black and brownish-yellow coloured varieties of pyrochlore
are present.
The majority of the pyrochlore occur as liberated grains in the dolomitic matrix. The vast
majority (~ 85%) of pyrochlore forms subhedral to anhedral, rounded grains less than
200 μm in diameter. There are local larger grains and agglomerates (Figure 9-1), as well
as accumulations or veins less than a few tens of centimetres in width with high pyrochlore
abundance. This style of mineralization can result in high tantalum values (> 450 ppm Ta).
Pyrochlore also occurs as inclusions in amphiboles (richterite), fluorapatite, and inclusions
in ferrocolumbite. In some rare cases the pyrochlore grains can be coated with a thin film
of pyrrhotite or pyrite.
Element abundances in Upper Fir pyrochlore average 35.7% Nb2O5, 20.4% Ta2O5,
5.5% TiO2 and 15.4% UO2 with a Nb2O5/Ta2O5 ratio of about 1.8. The UO2 / Ta2O5 ratio
averages about 0.8.
Fersmite
Fersmite occurs as anhedral inclusions in apatite and is considered a minor economic
mineral at the Project.
Mineral Zoning
Mineral zoning or distribution, of ferrocolumbite and pyrochlore within the carbonatites is
not clear due to the variable thicknesses and polyfolded geometry of the carbonatite.
Further work is required to improve the understanding of the mineral zoning and to locate
potential material types defined by metallurgical testwork.

COMMERCE RESOURCES CORPORATION
BLUE RIVER TA-NB PROJECT
BLUE RIVER, BRITISH COLUMBIA
NI 43-101 TECHNICAL REPORT
Project No.: 162230 Page 9-3 31 January 2011
Figure 9-1: Tantalum and Niobium Rich Mineralogy within Carbonatite
Note: Hole F08-150 162.0 m. Carbonatite host rock with dark red-brown opaque mineral ferrocolumbite intergrown
with semi-transparent yellowish mineral pyrochlore which has a vitreous lustre. The dark green mineral is an
amphibole named richterite. Left: Agglomerates of ferrocolumbite +/- pyrochlore can reach up to 5 mm in diameter
,but do not form a significant portion of the total of these minerals.
9.1.2 Fenite Mineralization
Mineralization in the fenite is dominantly ferrocolumbite, concentrated in apatite-rich layers.
Ilmenite with ferrocolumbite inclusions appear to be a subdominant source of both niobium
and tantalum. Niobium and tantalum grades within fenite at Blue River are considered to
be sub-economic, but locally will provide grade-bearing mining dilution material.
9.2 Fir and Verity Mineralization
This section has been taken largely from the British Columbia Geological Survey website.
9.2.1 Fir Mineralization
Tantalum and niobium mineralization in the Fir carbonatite occurs in the minerals
pyrochlore and columbite. The Fir carbonatite has the highest background niobium and
tantalum values of all carbonatites in the area. Tantalum averages greater than 0.015 per
cent. Sampling of the discovery outcrops returned assays of 1.02 per cent Nb2O5, 0.06 per
cent Ta2O5, and 6.31 per cent P2O5. A sample from drill core returned values of 0.18 per
cent tantalum and 8.51 per cent phosphate.
9.2.2 Verity Mineralization
Tantalum and niobium mineralization in the Verity carbonatite occurs in the minerals
pyrochlore and columbite. The pyrochlore and columbite crystals occur as octahedrons up

COMMERCE RESOURCES CORPORATION
BLUE RIVER TA-NB PROJECT
BLUE RIVER, BRITISH COLUMBIA
NI 43-101 TECHNICAL REPORT
Project No.: 162230 Page 9-4 31 January 2011
to 4 cm diameter. Calcitic carbonatite at the Verity occurrence also contains greater than 4
per cent phosphate and has abundant apatite relative to other nearby carbonatites at the
Project. Rare earth elements are thought to be hosted in fluorine-rich carbonate.
9.3 Comment on Section 9
AMEC concludes:
The geological controls and extent of the mineralization is reasonably well understood
The drill sections show that carbonatite thickness, and hence the mineralization
thickness varies locally
Mineral zoning work is required to better understand the distribution of niobium,
tantalum, and potential material types within the carbonatite
Blue River is a tantalum and niobium rich carbonatite which also has associated
uranium and thorium. Uranium and thorium are present in low levels in the resource
and waste rocks. The estimated blocks within the carbonatite have a mean grade of
41 ppm uranium and 6 ppm thorium. Any radon produced in a mine and process plant
at Blue River would likely be manageable with ventilation, dust control, and monitoring.
COMMERCE RESOURCES CORPORATION
BLUE RIVER TA-NB PROJECT
BLUE RIVER, BRITISH COLUMBIA
NI 43-101 TECHNICAL REPORT
Project No.: 162230 Page 10-1 31 January 2011
10.0 EXPLORATION
Exploration work conducted at the Project has been completed, on behalf of Commerce,
by Dahrouge Geological Consulting Ltd. (Dahrouge), an independent consulting firm based
in Edmonton, Alberta.
The following summary of exploration potential at the Project is based upon discussions
with Dahrouge Geological Consulting geologists and is summarized from the following
reports: Stone and Selway (2010), Gorham (2008), plus Gorham, Ulry and Brown (2009).
10.1 Data Compilation
10.1.1 Historical Data Compilation
Prior to commencement of on-ground exploration in 2001, a review of historical data was
compiled by Dahrouge for Commerce. This work comprised collation of the following:
Review existing government mapping, thesis driven mapping, and structural studies of
the Horsethief Creek Group
Review of publicly available assessment reports
Compilation of AMC data on the Verity and Fir deposits
Identification of target drill holes for twinning.
The collated data was used to identify areas that were considered more prospective within
the Project.
10.1.2 Current Data Compilation
Prior to, and during, completion of the Mineral Resource update reported herein, the
following data capture and compilation work was completed by Dahrouge for Commerce:
Implemented and updated a diamond drilling database (2009 to June 2010)
Re-coded geology within the database (2010)
Re-mapped surface outcrops for structural geology features and developed a
preliminary deformation history interpretation (2009-2010)
Reviewed analytical QAQC data based on 2005 to 2009 drill core samples
Reviewed check analysis programs based on 2008 and 2009 core pulps and coarse
rejects.

COMMERCE RESOURCES CORPORATION
BLUE RIVER TA-NB PROJECT
BLUE RIVER, BRITISH COLUMBIA
NI 43-101 TECHNICAL REPORT
Project No.: 162230 Page 10-2 31 January 2011
10.2 Grids and Surveys
All surveys to date are in UTM NAD83 Zone 11 coordinates.
In 2007, orthophotography and Lidar surveys were flown to create a 1:2,000 base map of
the Upper Fir area. A topography map with 2 m contour intervals was created by Eagle
Mapping Ltd.
Drill collar surveys in 2006 and 2007 were initially determined by handheld GPS units. In
2008 and 2009, drill collar surveys were measured by conventional theodolite surveys.
The mineral resource estimate drill collar data comprises the 2008-2009 survey data.
In 2010, all legacy drill collars that could be clearly identified were re-surveyed using
differential GPS, including 2010 drill collars. Differential GPS control points were set up at
6 independent locations in the Upper Fir area. The 2010 differential GPS collar data were
not used for the current model and will require updating in the database and next model
update.
10.3 Mapping
Geological and structural mapping has been completed at 1:2,500 scale on a continuous
basis since 2006. The mapping area coverage is between Bone and Gum Creeks; and
from the North Thompson River to the ridge top located about three km east on the slope
that is known locally as either Fir or Cedar Mountain. The mapping area includes the Fir,
Upper Fir and Gum carbonatites plus the nearby Hodgie Zone.
Natural outcrops are best exposed at the top of the ridge and along the steep south slope
above Gum Creek. Most of the exposure on the property was created by construction of
roads, trails and drill pads.
10.4 Geochemistry (stream sediment, soil, and rock)
Geochemical sampling programs commenced in 2001. Program objectives were to:
Test areas of interest from the geological interpretations
Test existing mineral occurrences and reports of surface indicators of mineralization.
Quality control of the data was maintained by Dahrouge. Data processing was completed
using Microsoft Excel.

COMMERCE RESOURCES CORPORATION
BLUE RIVER TA-NB PROJECT
BLUE RIVER, BRITISH COLUMBIA
NI 43-101 TECHNICAL REPORT
Project No.: 162230 Page 10-3 31 January 2011
10.4.1 Stream-Sediment Sampling
Reconnaissance stream sediment sampling was completed during 2001 to 2003, and 2006
to 2007. During 2008, 531 stream sediment samples were collected and analysed for the
streams throughout the entire property. The key exploration pathfinder elements at Blue
River are tantalum, niobium, and rare earth elements. Detailed sample analysis using
microscopic mineral characterization was utilized, focusing on identifying pyrochlore,
apatite, richterite, and monazite as pathfinders.
During the 2009 field season a total of 20 stream pan concentrate samples was taken in
the Fir and Mud Creek areas to follow up on creek-mouth areas inaccessible during the
2008 field season. Samples were analyzed at Acme Laboratories of Vancouver B.C.
primarily for tantalum, niobium, rare earth elements, phosphate, and carbonate using
Acme’s 4B02 package (lithium metaborate fusion-ICP-MS technique).
Several samples anomalous in tantalum and niobium indicate that the Fir carbonatite likely
extends further south. Anomalous samples on the north side of Mud Creek indicate that
the Mud Creek carbonatite, discovered in 2008, is potentially more extensive than initially
believed.
10.4.2 Soil Sampling
Soil sampling has proven the best way to follow up stream pan concentrate sampling in the
Blue River area as the niobium-tantalum bearing ferrocolumbite and pyrochlore are
residual in soils. The key exploration pathfinder elements from soil sampling are tantalum
and niobium. During the 2002 follow-up on an anomalous stream sediment sample led to
the discovery of the Upper Fir carbonatite.
Reconnaissance soil sampling was completed during 2001 to 2003, and 2006 to 2007.
During the 2008 season, 4,181 soil samples were collected from several area grids (Figure
10-1). Sample grids typically have 200 m spaced lines and samples are taken at 25 m
intervals. Soil sampling in 2009 followed up on 2008 stream or soil sampling anomalies.
Sample grids were laid out at Switch Creek, and in the area of the Fir deposit to test lateral
extensions of known carbonatite showings. The Hellroar soil sampling grid is located
approximately 8 km south of the study area near Hellroar Creek. Sampling on the Hellroar
soil grid occurred during 2008 and 2009 to follow up on tantalum anomalies from stream
sediment samples.
A total of 1,694 samples were taken by Dahrouge and analyzed by Acme Laboratories of
Vancouver, B.C. using Acme’s 4B02 package (lithium metaborate fusion-ICP-MS
technique). Tantalum and niobium results yielded several potential targets for more
detailed sampling and exploration work (Figure 10-1).

COMMERCE RESOURCES CORPORATION
BLUE RIVER TA-NB PROJECT
BLUE RIVER, BRITISH COLUMBIA
NI 43-101 TECHNICAL REPORT
Project No.: 162230 Page 10-4 31 January 2011
Figure 10-1: Soil Geochemistry Map
Note: Figure courtesy of Dahrouge.
COMMERCE RESOURCES CORPORATION
BLUE RIVER TA-NB PROJECT
BLUE RIVER, BRITISH COLUMBIA
NI 43-101 TECHNICAL REPORT
Project No.: 162230 Page 10-5 31 January 2011
Targets shown on Figure 10-1 from soil sampling at the Project in order of importance are:
Upper Fir Extension target: strong tantalum anomalies on 4 adjacent lines north-
northwest of Bulk Sample Pit #2 indicate that the carbonatite subcrop likely extends
north, past the current drill coverage.
Bone Creek Extension target: strong tantalum anomalies on two widely spaced lines
centered at UTM 5,797,000 N indicate a near surface carbonatite body that is on strike
with the Bone Creek carbonatite.
Fir Exploration target: strong tantalum anomalies on widely spaced lines located north,
south and above the known Fir showing indicate possible extensions of the Fir
carbonatite.
Mt. Cheadle Exploration target: a large diffuse tantalum anomaly, with several spikes,
stretching over 2 km is located north of Gum Creek and along strike from the Upper Fir
carbonatite.
3050 Road target: Strong tantalum anomalies on lines to the north and east of current
drilling on the Upper Fir deposit near 3050 Road indicate another carbonatite body
may be located above the known extents of the deposit.
10.4.3 Rock Sampling
Rock samples from various new and known localities were taken during 2009 prospecting
to test or verify the presence and abundance of tantalum-niobium mineralization. A total of
100 in situ bedrock grab, chip, and channel samples were taken at the Paradise,
Roadside, Howard Creek, Gum Creek, and Mud Creek area carbonatites. The locations of
these carbonatites are shown in Figure 4-1.
Analytical result highlights are as follows. The upper five metres of the Roadside
carbonatite had 5 continuous chip samples that averaged 1,373 ppm Nb and 101 ppm Ta.
At the Paradise carbonatite, the best channel sample assay result was 82 ppm Ta and
375 ppm Nb for one sample over a 1 m continuous interval.
Southeast of Mud Creek, a new carbonatite called the “RD” occurrence was discovered
during the 2009 regional prospecting program. This carbonatite is approximately on strike
with the Mud Creek carbonatite and may be part of the same system. Grab samples from
the RD carbonatite ranged up to a maximum of 118 ppm Ta and 4,703 ppm Nb.
10.5 Geophysical Surveys
No geophysical surveys were conducted by Commerce in 2009 other than ground
scintillometer surveys at soil sampling stations. The scintillometer readings were part of a
permit compliance requirement to report U and Th values of all exploration work. The

COMMERCE RESOURCES CORPORATION
BLUE RIVER TA-NB PROJECT
BLUE RIVER, BRITISH COLUMBIA
NI 43-101 TECHNICAL REPORT
Project No.: 162230 Page 10-6 31 January 2011
surveys tested for possible radiometric responses from pyrochlore-bearing carbonatite float
or sub-crop. While some Ta and Nb bearing carbonatite has been found in this manner,
the carbonatites of the Upper Fir system yields relatively low radiometric signatures
averaging 225 counts per second (cps). Drill core geochemistry collected from 7,377 2005
to 2008 Upper Fir samples show averages of 38 ppm U and 7 ppm Th, supporting the low
averaged cps for these carbonatite systems.
10.6 Drilling
Drill programs are discussed in Section 11 of this Report.
10.7 Bulk Density
Density is discussed in Section 13 of this Report.
10.8 Exploration Potential
10.8.1 Blue River Exploration Targets
The Upper Fir carbonatites have exploration potential north of known extents based on soil
sample results. Additional resource definition drilling is warranted.
The Bone Creek and Fir carbonatites have exploration potential along, and across strike
based on soil sample anomalies in tantalum and niobium. Additional expansion and in-fill
soil sampling is warranted prior to diamond drilling to refine and prioritize the existing
anomalies.
10.8.2 Other Targets
The soil geochemistry program results show a tantalum and niobium anomaly that is open
south of the current Mt. Cheadle exploration soil grid (Figure 10-1). The southward
expansion of this soil grid will define the surface extent of this anomaly and aid in
identifying near surface carbonatite drill targets.
Rock sampling and prospecting at the RD occurrence near Mud Lake, and the Roadside
occurrence near Paradise, provide encouragement for follow-up work in the form of soil
sampling, mapping and prospecting.
COMMERCE RESOURCES CORPORATION
BLUE RIVER TA-NB PROJECT
BLUE RIVER, BRITISH COLUMBIA
NI 43-101 TECHNICAL REPORT
Project No.: 162230 Page 10-7 31 January 2011
10.9 Other Studies
10.9.1 Bulk Samples
A bulk sample program was undertaken in the fall of 2008 by Dahrouge on behalf of
Commerce as part of on-going evaluation of the Upper Fir carbonatite. Approximately
2,000 tonnes from a 10,000 tonnes permitted volume were extracted from three bulk
sample pits (BS-1, BS-2, and BS-3) and placed into 75 to 150 tonne stockpiles comprised
largely of minus 50 cm carbonatite muck. The stockpiles have been stored on a well-
drained pad at the property for later metallurgical testing.
For each pit area, geological mapping was completed along with sampling of blast hole
material and channel samples of the bench walls. Both primary igneous and metamorphic
textures and structures were revealed in the sample pits. Microscopic examination of
oxide phases in the bulk sample material indicates that pyrochlore is the dominant ore
mineral in pit BS-1 with the exception of benches at the upper and lower contacts.
Pit BS-1 is dominantly fine to medium-grained, granular apatite-bearing dolomitic
carbonatite. Pits BS-2 and BS-3 are dominantly light-grey coarse-grained, porphyroclastic
apatite-bearing dolomitic carbonatite. Crosscutting veins of dark-green actinolite-calcite-
diopside up to 20 cm wide are common. Contacts in each pit are marked by approximately
1 m of fenite, with contorted layers of dolomitic carbonatite up to 10 cm thick.
Material from the 2008 bulk sampling program appears to provide a sufficient range of
tantalum and niobium grades to represent the Upper Fir carbonatite mineralization for
initial metallurgical testing.
Both pits, BS-1 and BS-2, have been stabilized. The bulk sampling permit expired on
December 31st, 2009 and has not been renewed.
10.9.2 Academic Research
Doctoral and post-doctoral studies on the geology, petrology and ore microscopy of the
carbonatite mineralization at Blue River are underway at the University of British Columbia.
These studies are scheduled for completion in 2012.
10.9.3 Environmental Geochemistry
In 2007, Commerce retained MESH Environmental Inc to initiate geochemical
characterization evaluations for the Upper Fir carbonatite deposit. The primary objectives
of the characterization program were to develop a baseline geochemical dataset for the
various lithological units in the deposit area and to identify potential geochemical issues
associated with anticipated waste rock.
COMMERCE RESOURCES CORPORATION
BLUE RIVER TA-NB PROJECT
BLUE RIVER, BRITISH COLUMBIA
NI 43-101 TECHNICAL REPORT
Project No.: 162230 Page 10-8 31 January 2011
The waste rock geochemical characterization program has been carried out in two phases.
Phase 1 of the study, included a sampling and static test analytical program on drill core
and surface outcrop samples (MESH, 2008). Phase 2 of the program included additional
sampling of drill cores and static testwork on the expanded waste rock sample database
(MESH, 2009).
10.9.4 Geotechnical
In 2007, Commerce retained Westrek Geotechnical Services Ltd. (Westrek) to conduct a
slope stability assessment of the Upper Fir area. This work consisted of a detailed
literature review, compilation, and a site examination (Smith, 2008).
In 2009, Westrek completed a geotechnical review of access roads and trails, drill sites
and bulk sample sites at the Upper Fir deposit area. Site inspections were completed by
Westrek to review work and make recommendations for the 2010 field season.
In 2010, Westrek assessed conditions for proposed drill access plus reviewed reclamation
and slope stabilization work completed in 2009. The recommendations and completed
work included lowering of some ditch blocks, reducing slopes in cut banks at some points,
additional seeding and barricading of some steeper slopes. Some deepening of ditches
and additional cross ditches, or culverts were recommended and installed.
AMEC initiated geotechnical site investigations during June – August of 2010 as part of the
on-going PA. Geotechnical data was collected from 6 HQ diameter oriented diamond drill
holes by Dahrouge on behalf of Commerce, and under the direction of AMEC. This data
included documenting rock type description, faults, shear zones, total core recovery, rock
quality designation, rock weathering and strength, plus fracture and joint characterization.
10.9.5 Tailings Location
In 2009, Commerce commissioned two tailings storage studies with Klohn Crippen Berger
Ltd. of Vancouver, British Columbia. The first study included a two day site visit and desk-
top study comprising the area within a 20 km radius of the Upper Fir deposit. This study
considered a variety of factors such as topography, drainage, and precipitation plus
considered various scenarios regarding volume and character of tailings. Five potential
sites were identified and ranked. The follow-up site visit narrowed this choice to one
preferred site and one alternate site.
The second study was similar to the first study noted above, but the desktop study portion
reviewed and ranked 5 possible sites within 20 km of the town Valemount.
During March and April of 2010, AMEC initiated preliminary desktop tailings location
screening assessments for storage of conventional slurry tailings. During September

COMMERCE RESOURCES CORPORATION
BLUE RIVER TA-NB PROJECT
BLUE RIVER, BRITISH COLUMBIA
NI 43-101 TECHNICAL REPORT
Project No.: 162230 Page 10-9 31 January 2011
2010, a third desktop screening study was initiated regarding the storage of slurry tailings,
expanding the study area north to the town of Valemount. In December 2010, AMEC
initiated a conceptual assessment for surface storage of filtered tailings at locations
proposed in the initial Klohn Crippen Berger 2009 study. The studies are part of the on-
going PA.
10.9.6 Timber Assessment
In 2009, Commerce retained Bushtech BC of Hope, British Columbia to lay out access for
a permit amendment, complete a timber assessment, and an application for an Occupant’s
Licence to Cut (OLTC) in the area northwest of the Upper Fir deposit. The field study,
layout report and the OLTC application was completed during September 2009.
10.10 Comment on Section 10
AMEC concludes:
The exploration program at Blue River has delineated a tantalum and niobium bearing
polyfolded carbonate sill complex
The exploration procedures used to delineate the deposit are appropriate for the
deposit and were executed in a professional manner
All exploration work was carried out under the supervision of Dahrouge Geological
Consulting Ltd.

COMMERCE RESOURCES CORPORATION
BLUE RIVER TA-NB PROJECT
BLUE RIVER, BRITISH COLUMBIA
NI 43-101 TECHNICAL REPORT
Project No.: 162230 Page 11-1 31 January 2011
11.0 DRILLING
Drill programs were completed by contract drill crews, typically supervised by Dahrouge
geologists on behalf of Commerce. Core drilling was utilized for deposit delineation
purposes.
11.1 Drill Campaigns
Table 11-1 lists the diamond drilling campaigns at the Upper Fir and Bone Creek deposits.
There are a total of 215 drill holes within the Upper Fir, Bone Creek and Fir (Lower)
carbonatites comprising 41,115 m of HQ and NQ diameter drill holes.
Table 11-2 lists 3 bulk sample pits (BS-1, BS-2, and BS-3, Figure 7-4) and 4 trenches
(TR0, 0A, 1, and 1A) which have been sampled. These were only used for geology
interpretation and domain modeling, not grade interpolation.
Table 11-1: Drill Campaign Summary
Category Deposit Operator Year # Holes Series Type
#
Metres
#
Samples
%
Samples
Resource Bone
Creek
Commerce 2005 4 CF05-01 to
CF05-04
HQ 300 14
0%
Resource Upper
Fir
Commerce 2005 4 CF0505 to
CF0508
HQ 505 44 1%
Resource Upper
Fir
Commerce 2006 17 CF0601 to
CF0617
HQ 3,021 1,139 14%
Resource Upper
Fir
Commerce 2007 18 F0718 to F0735 HQ 4,310 1,053 13%
Resource Upper
Fir
Commerce 2008 118 F08-36 to F08-
153
HQ 23,723 5,126 62%
Resource Upper
Fir
Commerce 2009 22 F09-154 to F09-
176
HQ 5,587 842 10%
Resource Subtotal 183 37,446 8,218 100%
Historical Bone
Creek
AMC 1980-1981 17 BC-1 to BC-17 NQ 697 na-
Historical Fir AMC 1981 4 BC1-18 to BC-21 NQ 829 na-
Target Fir
(twins)
Commerce 2001-2002 11 F-01 to F-11 HQ 2,144 na-
Target Subtotal 32 3,670
Total Drilling 215 41,115
Abbreviations: AMC = Anschutz Mining Corp.
Note: The Commerce 2010 campaign comprises 54 HQ diameter drill holes totalling 12,949 m. These holes were not
completed during the database audit or block modeling for this mineral resource estimate. Assay data for the 2010
sampling are still pending.

COMMERCE RESOURCES CORPORATION
BLUE RIVER TA-NB PROJECT
BLUE RIVER, BRITISH COLUMBIA
NI 43-101 TECHNICAL REPORT
Project No.: 162230 Page 11-2 31 January 2011
Table 11-2: Upper Fir Deposit Trench and Bulk Samples
Category Deposit Operator Year
Number Series Type
#
(m)
Metallurgy Upper Fir Commerce 3 BS01 to BS03 Bulk Sample 138
Exploration Upper Fir Commerce 4 TR0,0A,1,1A Trench-Chip 73
11.2 Drilling Equipment
Road building on the hillside is used to establish drill pads. Drill roads were created by
Scott McDonald of Spaz Logging Ltd., Valemount B.C. Equipment included a D7 Cat
bulldozer, a Volvo 230 excavator, and a 30 tonne rock truck. Blasting was by Leaverite
Drilling and Blasting Ltd. of Clearwater, B.C.
The diamond drills are operated by R.J. Beaupre Drilling Ltd. of Princeton, B.C. The drill
models were a Boyles 56 and a Longyear 50, both capable of drilling HQ diameter holes to
depths of 2,000 m.
All road building and diamond drilling is supervised by Dahrouge on behalf of Commerce.
11.3 Core Drilling
Core drilling by Commerce commenced in 2005 and continues to the present. As of
30 June 2010, there are 183 resource holes within the Upper Fir and Bone Creek
carbonatite areas comprising 37,446 m of HQ diameter core drilling and a total of 8,221
samples.
11.3.1 Core Drilling Strategy
The holes are collared on 3 primary drill roads (Upper, Middle, and Lower roads) that are
oriented sub-parallel to the Upper Fir carbonatite along the hillside. Set-ups are spaced
about 50 m apart along drill roads (Figure 7-4 and Figure 7-5). The majority of the known
portions of the Upper Fir deposit are defined on 50 m centres. The at-depth Bone Creek
carbonatite has only been intersected by a limited number of drill holes (Figure 7-6 and
Figure 7-7).
The drill hole orientations appear to be oriented sub-perpendicular to the carbonatites
based on Figure 7-5 to Figure 7-7. The relationship between sample length and true
thickness varies with the dip of holes. True thicknesses are slightly less than drilled
intercepts.

COMMERCE RESOURCES CORPORATION
BLUE RIVER TA-NB PROJECT
BLUE RIVER, BRITISH COLUMBIA
NI 43-101 TECHNICAL REPORT
Project No.: 162230 Page 11-3 31 January 2011
11.3.2 Core Sizes
Core holes are typically HQ diameter (96 mm) producing core with a diameter of
(63.5 mm). Hole diameter reduction due to poor ground conditions generally are not an
issue at the Project. Drill hole orientations have typical azimuths of vertical, 090°, or 270°
and inclinations that range from vertical to -60°. Drill hole depths range from a minimum of
32 m and a maximum of 388 m, averaging about 200 m.
11.3.3 Collar Surveys
The drill hole collars are spotted in the field with a hand-held GPS and lined up with a
Brunton compass. Drill hole collars were initially surveyed using a Garmin 60 CSx
handheld GPS unit and later surveyed accurately using a laser theodolite system by Steve
Mosdell of Align Surveys of Louis Creek, B.C.
11.3.4 Downhole Surveys
Vertical holes were generally not surveyed down hole. The dip and azimuth of inclined drill
holes were typically tested at three points in each hole using Flexit Single Shot down-hole
orientation tools. The instruments record magnetic inclination, azimuth, temperature and
magnetic susceptibility at each survey depth.
The Flexit instruments were calibrated at the start of each field season for 2005 – 2009 drill
holes.
11.3.5 Oriented Drill Core
No oriented drill holes were drilled prior to the June 30, 2010 diamond drilling cut-off date
for this Mineral Resource estimate. At the request of AMEC, as part of the on-going PA,
6 drill holes comprised of 1,271 m of HQ diameter oriented core were completed after the
diamond drilling cut-off date of 30 June 2010.
11.3.6 Core Handling
Core was obtained using wire-line methods and was washed prior to placement in core
trays. Wooden core trays were placed near the core barrel so that the core was placed in
the tray in the same orientation as it came out of the barrel. Rubble, which was rarely
encountered, was piled to about the length of the whole core that its volume would
represent. Trays were marked with drill hole name and box number. The end of every run
is marked by a wooden block depth marker.

COMMERCE RESOURCES CORPORATION
BLUE RIVER TA-NB PROJECT
BLUE RIVER, BRITISH COLUMBIA
NI 43-101 TECHNICAL REPORT
Project No.: 162230 Page 11-4 31 January 2011
The core trays are transported by pick-up truck down to the core logging facility at the
community of Blue River, B.C.
11.3.7 Core Recovery
Core recovery was determined prior to sampling. Typically, recovery measurements were
completed before detailed logging was initiated. Standard core recovery forms were
usually completed for each hole by the field assistant or geologist.
AMEC visually observed that the core recovery for the 2010 drill core was very good within
the waste and carbonatite rocks (typically >95%). The only area that may have core
recovery issues would be within the fenite rocks located in the immediate hanging wall to
the carbonatite.
11.4 Planned Drill Programs
Additional diamond drilling is anticipated to increase the confidence of the existing
resource. The lower portions of the Upper Fir carbonatite and selected areas of the Bone
Creek carbonatite require additional definition drilling.
11.5 Comment on Section 11
AMEC concludes:
The quantity and quality of the lithological, geotechnical, collar, and down-hole survey
data collected in the core drill programs is sufficient to support Mineral Resource
estimation.
Drill intersections are typically greater than the true width of the mineralization due to
the orientation of the drill holes. Drill hole orientations are generally appropriate for the
mineralization style.
Collar surveys were performed using industry-standard instrumentation.
Down-hole surveys accurately represent the trajectories of the inclined core holes.
The core recoveries from core drill programs are good.
The drill hole spacing is suitable for delineating this style of mineralization.

COMMERCE RESOURCES CORPORATION
BLUE RIVER TA-NB PROJECT
BLUE RIVER, BRITISH COLUMBIA
NI 43-101 TECHNICAL REPORT
Project No.: 162230 Page 12-1 31 January 2011
12.0 SAMPLING METHOD AND APPROACH
Commerce has collected stream sediments, soils, outcrop grabs and chips, and bulk rock
samples from the Blue River property. These samples were used to guide exploration but
were not used in preparing the Mineral Resource estimate. A description of the sampling
method and approach for these samples is provided in a previous technical report (Selway
and Stone, 2010).
Commerce has a database of 215 drill holes. Of the 215 holes, there are 183 drill holes
totalling 37,446 m of HQ diameter core, and 8,218 samples within the Mineral Resource
area. Of the 215 holes, Commerce drilled 11 holes in the Fir carbonatite area which are
not part of this Mineral Resource update. Of the 215 holes, 21 legacy holes were drilled by
operators prior to Commerce’s involvement in the project. No sample intervals are present
in the database for the 21 legacy holes and hence these holes have not been used to
estimate grades in this Mineral Resource update, but they were used to interpret geology.
An additional 54 holes, totalling 12,949 m of HQ drill core were drilled in 2010. The 2010
holes were not used in the preparation of the Mineral Resource estimate. Results of this
drilling are discussed in Section 17.12
All work on the core since 2005 was completed under the supervision of Dahrouge on
behalf of Commerce.
Samples were collected from an area approximately 1,600 m north-south by 1,000 m
east-west. Sampling is from a combination of vertical and inclined holes drilled from
common collar locations. This results in a drill hole or sample spacing which increases
with depth. Average spacing between drill hole intercepts in the resource area is 50 m.
Core sampling method and approach has been consistent through the 2005 to 2010 drill
programs. Core was boxed onsite and delivered each day to a core facility in Blue River
where the core was logged and sawn. Core logging involved both geotechnical and
geological information. Geotechnical logging involved measuring core recovery per run,
rock quality designation (RQD), fracture roughness and orientation. Core recovery and
RQD was generally good for most core, typically greater than 95% recovery. The
geological logging included observations of colour, lithology, texture, structure,
mineralization, and alteration. All drill core was photographed prior to splitting.
The sampling procedure used to collect core at Blue River is as follows:
The entire carbonatite intersection and shoulder samples on each side of the
intersection are sampled.
Samples intervals, generally 1 m in length, are marked on the core by a geologist.
Sample intervals are assigned a unique sample number.

COMMERCE RESOURCES CORPORATION
BLUE RIVER TA-NB PROJECT
BLUE RIVER, BRITISH COLUMBIA
NI 43-101 TECHNICAL REPORT
Project No.: 162230 Page 12-2 31 January 2011
The geological contacts are generally respected.
Specific gravity measurements for the carbonatite are collected approximately once
every 3 m.
Carbonatite samples are checked at regular intervals with a GR-130 miniSPEC gamma
ray spectrometer for the presence of U and Th.
Core is sawn in half by diamond saw.
Half of the core is sent for analysis.
Half of the core is retained for reference or further sampling.
A summary of relevant sample intervals and results are shown in Table 12-1. Figures 7-6
and 7-7 in this Report illustrate the relationship between intersected thickness and true
thickness of the carbonatite. In general, intersected thicknesses are slightly longer than
true thickness.
Table 12-1: Selected Ta and Nb Composite Values in Carbonatite
Hole No
Depth
From
(m)
Depth
To
(m)
Intercept
Thickness
(m)
Ta2O5
(ppm)
Nb2O5
(ppm) Hole No
Depth
From
(m)
Depth
To
(m)
Intercept
Thickness
(m)
Ta2O5
(ppm)
Nb2O5
(ppm)
F0718 34.5 76.4 41.9 158 2,488 F08-084 110 162 52 125 2,045
F0718 113.5 141.7 28.2 153 1,266 F08-084 185 202.3 17.3 93 2,439
F0718 210.9 215.9 5 199 1,396 F08-084 214.3 223.4 9.1 197 1,042
F0718 218.4 221.5 3.1 148 1,173 F08-084 249.6 253.8 4.2 167 892
F0719 34.8 37.3 2.5 182 3,528 F08-084 262.3 268 5.7 197 1,626
F0719 39.8 105 65.2 214 2,258 F08-085 122.1 176.4 54.3 114 309
F0719 112.1 138.3 26.2 174 1,472 F08-085 203 256.7 53.7 190 1,541
F0719 231.8 236.8 5 126 940 F08-147 143.1 164.1 21 103 2,893
F0719 239.3 240.8 1.5 136 1,750 F08-147 190.9 203.9 13 175 1,837
F0720 38.4 86.4 48 120 2,032 F08-150 129.7 136.8 7.1 222 3,149
F0720 146.7 158.5 11.8 129 1,456 F08-150 150.8 165.8 15 165 3,184
F0720 244.1 248.8 4.7 150 1,240 F08-150 190 202.1 12.1 247 2,110
F0727 16.4 17.5 1.1 14 906 F08-151 133.8 139.4 5.6 242 2,737
F0727 109.3 142.1 32.8 211 2,255 F08-151 188.2 207.8 19.6 246 2,626
F0727 222.6 225.8 3.2 167 945 F08-151 216.3 221.3 5 126 1,653
F0728 27.3 30 2.7 13 745 F08-151 223.8 243.5 19.7 271 1,911
F0728 93 150.4 57.4 188 1,417 F08-152 168 173.4 5.4 122 1,321
F0729 13.7 17.3 3.6 32 1,243 F08-152 208.9 221.6 12.7 240 1,753
F0729 132.7 137.9 5.2 141 1,293 F08-152 230.3 252.2 21.9 176 1,058
F0730 75.1 149.5 74.4 163 1,583 F09-169 78.4 126.9 48.5 232 651
F0731 79.8 173.2 93.4 172 1,518 F09-169 156.1 198.6 42.5 171 1,085
F08-064 95.7 130.4 34.7 172 1,754

COMMERCE RESOURCES CORPORATION
BLUE RIVER TA-NB PROJECT
BLUE RIVER, BRITISH COLUMBIA
NI 43-101 TECHNICAL REPORT
Project No.: 162230 Page 12-3 31 January 2011
12.1 Comment on Section 12
AMEC concludes:
The sampling procedures are suitable for this style of deposit
No drilling, sampling or recovery factors are apparent that could materially impact the
accuracy, and reliability of the results
The sampling method has resulted in samples of reasonable quality which show no
material biases and are considered representative of the mineralization present in the
Blue River deposits.
COMMERCE RESOURCES CORPORATION
BLUE RIVER TA-NB PROJECT
BLUE RIVER, BRITISH COLUMBIA
NI 43-101 TECHNICAL REPORT
Project No.: 162230 Page 13-1 31 January 2011
13.0 SAMPLE PREPARATION, ANALYSES, AND SECURITY
Commercial analytical labs are generally not set up to provide a high level of accuracy and
precision at the lower range of the economically significant grades of Ta and Nb that exist
in the Blue River deposit. The ability to assess accuracy and precision was difficult
because of this. However, Acme has worked closely with Commerce to improve the
accuracy and precision for the Blue River samples. The assessment that follows uses a
combination of techniques to provide an opinion on the reliability of the Blue River sample
results. Although some issues were identified, the samples are considered suitable to
support resource estimation.
13.1 Sample Preparation
Between 2005 and 2008 sawn core samples were shipped to Acme Analytical Laboratories
in Vancouver where the entire sample was crushed in a jaw crusher to 70% passing
10 mesh (2 mm) and a 250 g riffle split sample of the crushed material was pulverized in a
mild steel ring and puck mill to 85% passing 200 mesh (75 microns).
Split core samples from the 2009 drill program were shipped to PRA/Inspectorate
Laboratories in Richmond, B.C. where the entire sample was crushed to 80% passing 10
mesh and a 300 g split of the crushed material was pulverized to 100% passing 200 mesh.
13.2 Sample Analysis
Between 2005 and 2008 primary samples were analyzed at Acme by packages 4A and 4B.
Package 4A allows reporting of total abundances of the major oxides and several minor
elements using a 0.2 g sample analyzed by ICP-emission spectrometry following a lithium
metaborate/ tetraborate fusion and dilute nitric digestion. Package 4B provided reporting
of rare earth and refractory elements determined by ICP mass spectrometry following a
lithium metaborate / tetraborate fusion and nitric acid digestion of a 0.2 g pulp. Primary
samples from the 2009 drill program were initially analyzed at Global Discovery Laboratory
in Vancouver and later at Acme by packages 8X, 4A, and 4B. Package 8X is an X-Ray
fluorescence analysis following a lithium metaborate fusion.
Table 13-1 lists the posted laboratory lower detection limits for the primary sample analysis
procedures.

COMMERCE RESOURCES CORPORATION
BLUE RIVER TA-NB PROJECT
BLUE RIVER, BRITISH COLUMBIA
NI 43-101 TECHNICAL REPORT
Project No.: 162230 Page 13-2 31 January 2011
Table 13-1: Primary Analysis Lower Detection Limits
* Acme certificates reported below detection limits at 5 and 10 ppm Ta
Acme, GDL, and PRA/Inspectorate are well recognised ISO certified laboratories.
13.3 Quality Control
Quality control procedures used by Commerce to monitor laboratory results have evolved
over the life of the project. Between 2005 and 2007 there was minimal insertion of blank,
duplicate, or standard reference material (SRM) control samples. During this period,
analysis of several pulp check samples was completed at 4 different laboratories. In 2008
the control sample insertion rate was increased to an average of 3% for each of blanks,
quarter core field duplicates, and SRM control samples. In 2009 control sample insertion
rates were increased to an average of 5% per control sample type and included pulp
duplicates. Control sample and insertion rates are summarized in Table 13-2.
Table 13-2: Control Samples and Insertion Rates by Year
13.3.1 Assessment of Accuracy with SRM Control Samples
In 2005 a SRM control sample, BR-01, was prepared for Commerce by Acme, using
sample material from the nearby Verity Carbonatite. This SRM was inserted by Acme into
primary sample batches submitted between 2005 and 2008.
Figure 13-1 summarizes the Ta results returned for all primary lab analysis of BR-01. The
average of all results (best value) is 117 ppm Ta. The moving average (green line) shows
the control sample results were generally within ±5% of the best value. Less than 5% of
the results exceed ±2 standard deviations.
Ta
(ppm)
Nb
(ppm)
Acme 4A na 5
Acme 4B 0.1 0.1
Acme 8X 100* 100*
Lower Detection Limit
YearNo. of primary
samples
1/4 core field
duplicates
insertion
rate
pulp
duplicates
insertion
rate
"Robert"
SRMS
insertion
rate
"BR"
SRMs
insertion
rateBlanks
insertion
rate
pulp
checks
insertion
rate
2009 794 49 6.2% 48 6.0% 49 6.2% 0 0.0% 34 4.3% 49 6.2%
2008 5882 591 10.0% 268 4.6% 68 1.2% 206 3.5% 222 3.8% 232 3.9%
2007 1017 72 7.1% 0 0.0% 0 0.0% 49 4.8% 63 6.2% 373 36.7%
2006 1140 4 0.4% 0 0.0% 0 0.0% 0 0.0% 48 4.2% 102 8.9%
2005 58 0 0.0% 0 0.0% 0 0.0% 3 5.2% 0.0% 58 100.0%

COMMERCE RESOURCES CORPORATION
BLUE RIVER TA-NB PROJECT
BLUE RIVER, BRITISH COLUMBIA
NI 43-101 TECHNICAL REPORT
Project No.: 162230 Page 13-3 31 January 2011
Figure 13-1: SRM BR-01 Control Chart
In 2008, fifteen SRMs were prepared for Commerce by Process Research Associates
(PRA) by pulverizing core samples from within the resource area to 100% passing 200
mesh. Three samples of each standard were sent to 6 labs, for Ta, and 7 labs for Nb
analysis. Analytical procedures included XRF/fusion and XRF/pellet, ICP-AES, ICP-MS,
ICP-M, and INAA. Results were compiled by PRA. The results indicate that, with the
exception of a few higher grade Nb samples, the Blue River Standards do not achieve
typical tolerance thresholds for certified standards. This may be in part due to the difficulty
in assessing low grade Ta and Nb. “Robert” standards 3, 4, 6, 7, 13, and 15 are
considered suitable for use for assessing Nb grades greater than 900 ppm. Standards 8, 9,
10, 12, and 14 are considered acceptable for assessing Ta grades greater than 170 ppm.
A summary of SRM “Robert SRM” Best Values is provided in Table 13-3.
Table 13-3: “Robert” Standard Reference Material “Best Values”
80859095
100105110115120125130135140145150
2005
2007
2007
2007
2007
2007
2008
2008
2008
2008
2008
2008
2008
2008
2008
2008
2008
2008
2008
2008
2008
2008
2008
2008
2008
Sta
nd
ard
BR
-01
, T
a 4
B p
pm
In order Assayed, by Batch & Sample
Acme BR01 Standard Excludes outliers
Data
Mean +/- 2
std.dev.s
Best Value
Moving Average
1.05 x Best
0.95 x Best
High Clusters
Low Clusters
Tantalum in ppm Niobium in ppm
Standard Best Value Count STDEV STDEV/BV 95%CI 95%CI/BV Standard Best Value Count STDEV STDEV/BV 95%CI 95%CI/BV
1 - - - - - 1 - - - - -
2 14 3 2 17% ±6 43% 2 349 7 35 10% ±32 9%
3 74 4 11 15% ±18 24% 3 3,048 7 90 3% ±83 3%
4 122 5 14 11% ±17 14% 4 3,907 7 126 3% ±117 3%
5 107 4 9 9% ±15 14% 5 120 6 12 10% ±13 11%
6 172 5 16 10% ±20 12% 6 2,297 7 93 4% ±86 4%
7 179 5 14 8% ±17 10% 7 1,753 7 78 4% ±72 4%
8 175 5 9 5% ±11 6% 8 244 7 31 13% ±29 12%
9 193 5 12 6% ±15 8% 9 313 7 31 10% ±29 9%
10 221 5 12 5% ±14 7% 10 956 7 100 10% ±92 10%
11 265 5 17 7% ±21 8% 11 421 7 45 11% ±41 10%
12 241 5 14 6% ±17 7% 12 1,478 7 92 6% ±85 6%
13 280 5 23 8% ±28 10% 13 1,744 7 81 5% ±74 4%
14 256 5 16 6% ±20 8% 14 282 7 37 13% ±35 12%
15 377 5 25 7% ±31 8% 15 2,524 7 102 4% ±95 4%

COMMERCE RESOURCES CORPORATION
BLUE RIVER TA-NB PROJECT
BLUE RIVER, BRITISH COLUMBIA
NI 43-101 TECHNICAL REPORT
Project No.: 162230 Page 13-4 31 January 2011
Figure 13-2 shows all but two “Robert” SRM Ta results returned for 2008 core analysis by
Acme (ICP-MS) were within ±10% of the best values. Only 4 out of 10 Nb results were
within ±10% of the best values Figure 13-3.
Figure 13-2: 2008 “Robert” SRM Ta Performance
Figure 13-3: 2008 “Robert” SRM Nb Performance
Figures 13-4 shows a negative bias for “Robert” SRM Ta values for 2009 core analysed
by Acme XRF (fusion) methods. No bias was observed for Nb.
0
50
100
150
200
250
300
350
400
ST
D-0
5
ST
D-0
6
ST
D-0
7
ST
D-0
8
ST
D-0
9
ST
D-0
9
ST
D-0
9
ST
D-1
0
ST
D-1
0
ST
D-1
5
Ta
pp
m
Standard Name
2008 Acme "Robert" Standards
ACME Ta ppm Best Value Ta ppm Greater or less than 10% BV
0
500
1000
1500
2000
2500
3000S
TD
-05
ST
D-0
6
ST
D-0
7
ST
D-0
8
ST
D-0
9
ST
D-0
9
ST
D-0
9
ST
D-1
0
ST
D-1
0
ST
D-1
5
Ta
pp
m
Standard Name
2008 Acme "Robert" Standards Nb
ACME Ta ppm Best Value Ta ppm Greater or less than 10% BV
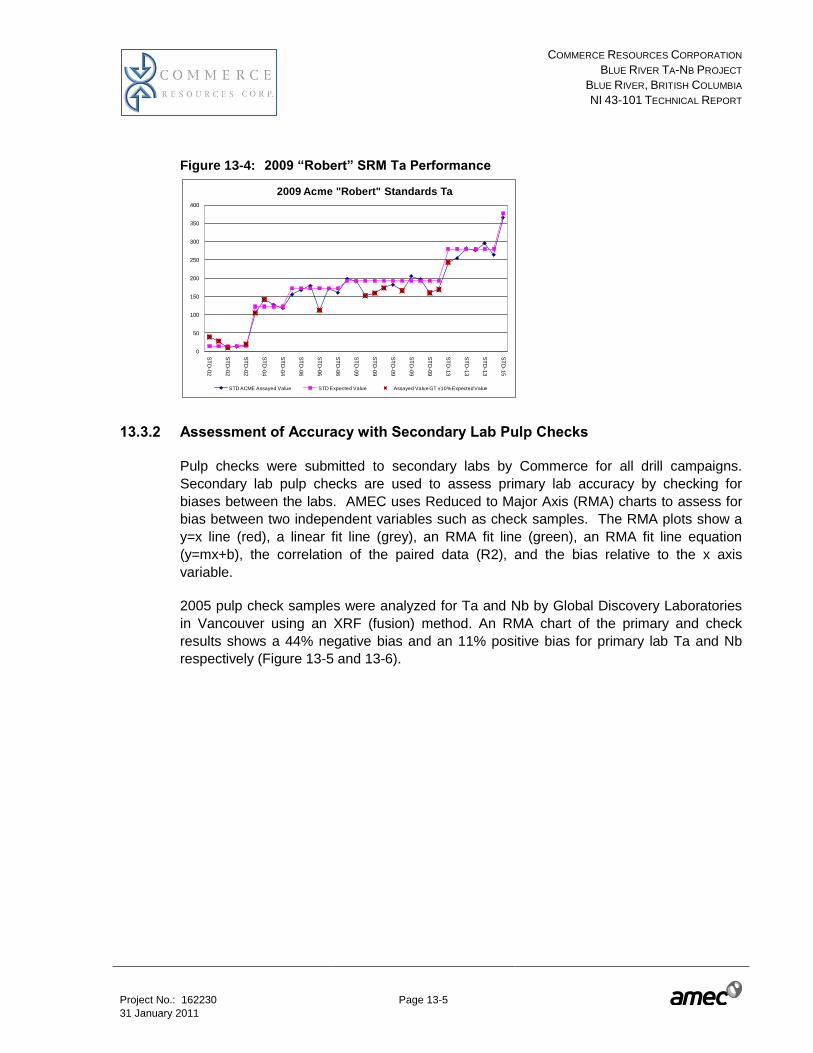
COMMERCE RESOURCES CORPORATION
BLUE RIVER TA-NB PROJECT
BLUE RIVER, BRITISH COLUMBIA
NI 43-101 TECHNICAL REPORT
Project No.: 162230 Page 13-5 31 January 2011
Figure 13-4: 2009 “Robert” SRM Ta Performance
13.3.2 Assessment of Accuracy with Secondary Lab Pulp Checks
Pulp checks were submitted to secondary labs by Commerce for all drill campaigns.
Secondary lab pulp checks are used to assess primary lab accuracy by checking for
biases between the labs. AMEC uses Reduced to Major Axis (RMA) charts to assess for
bias between two independent variables such as check samples. The RMA plots show a
y=x line (red), a linear fit line (grey), an RMA fit line (green), an RMA fit line equation
(y=mx+b), the correlation of the paired data (R2), and the bias relative to the x axis
variable.
2005 pulp check samples were analyzed for Ta and Nb by Global Discovery Laboratories
in Vancouver using an XRF (fusion) method. An RMA chart of the primary and check
results shows a 44% negative bias and an 11% positive bias for primary lab Ta and Nb
respectively (Figure 13-5 and 13-6).
0
50
100
150
200
250
300
350
400
ST
D-0
2
ST
D-0
2
ST
D-0
2
ST
D-0
4
ST
D-0
4
ST
D-0
6
ST
D-0
6
ST
D-0
6
ST
D-0
9
ST
D-0
9
ST
D-0
9
ST
D-0
9
ST
D-0
9
ST
D-1
3
ST
D-1
3
ST
D-1
3
ST
D-1
5
2009 Acme "Robert" Standards Ta
STD ACME Assayed Value STD Expected Value Assayed Value GT ±10% Expected Value

COMMERCE RESOURCES CORPORATION
BLUE RIVER TA-NB PROJECT
BLUE RIVER, BRITISH COLUMBIA
NI 43-101 TECHNICAL REPORT
Project No.: 162230 Page 13-6 31 January 2011
Figure 13-5: 2005 Pulp Check Sample Ta RMA Plots
Figure 13-6: 2005 Pulp Check Sample Nb RMA Plots
Figures 13-7 and 13-8 are Ta and Nb RMA charts that show there is no significant bias for
samples collected in 2008 after removal of outliers.
R² = 0.9197
y = 1.4357x - 8.4025
0.0
100.0
200.0
300.0
400.0
500.0
600.0
0.0 100.0 200.0 300.0 400.0 500.0 600.0
2005 GDL Pulp Checks Ta ppm
Sample Pairs
y=x
RMA
GD
L X
RF
(F)
Ta p
pm
Acme ICP-MS Ta ppm
-43.57%Bias=
R² = 0.9515
y = 0.8835x - 143.72
0.0
500.0
1000.0
1500.0
2000.0
2500.0
3000.0
3500.0
4000.0
0.0 500.0 1000.0 1500.0 2000.0 2500.0 3000.0 3500.0 4000.0
2005 GDL Pulp Checks Nb ppm
Sample Pairs
y=x
RMA
GD
L X
RF
(F)
Nb
pp
m
Acme ICP-MS 4B Nb ppm
11.65%Bias=

COMMERCE RESOURCES CORPORATION
BLUE RIVER TA-NB PROJECT
BLUE RIVER, BRITISH COLUMBIA
NI 43-101 TECHNICAL REPORT
Project No.: 162230 Page 13-7 31 January 2011
Figure 13-7: 2008 Acme Pulp Check Sample Ta RMA Plots
Figure 13-8: 2008 Acme Pulp Check Sample Nb RMA Plots
Table 13-4 is summary of calculated biases between primary and secondary lab results
by year and indicates there was improvement in accuracy between 2005 and 2009. The
pulp check sample analyses were not systematically performed between 2005 and 2008,
R² = 0.8862
y = 0.9602x + 1.8076
0.0
100.0
200.0
300.0
400.0
500.0
600.0
700.0
0.0 100.0 200.0 300.0 400.0 500.0 600.0 700.0
2008 PRA0906710 Pulp Checks Ta ppm
Sample Pairs
y=x
RMA
Acm
e
ICP
-MS
Ta p
pm
Acme ICP -MS Ta ppm
3.98%Bias=
R² = 0.9545
y = 0.95x + 21.295
0.0
500.0
1000.0
1500.0
2000.0
2500.0
3000.0
3500.0
4000.0
4500.0
5000.0
0.0 1000.0 2000.0 3000.0 4000.0 5000.0
2008 PRA0906710 Pulp Checks Nb ppm
Sample Pairs
y=x
RMA
Acm
e
ICP
-MS
Nb
pp
m
Acme ICP -MS Nb ppm
5.00%Bias=

COMMERCE RESOURCES CORPORATION
BLUE RIVER TA-NB PROJECT
BLUE RIVER, BRITISH COLUMBIA
NI 43-101 TECHNICAL REPORT
Project No.: 162230 Page 13-8 31 January 2011
and SRMs were not consistently included with the checks. Therefore the results are
considered an indicator of lab bias, but are not on their own definitive. The pulp check
results indicate that there was improvement in agreement between labs between 2005
and 2009.
Table 13-4: Pulp Check Bias in Percent
Year Ta Bias Nb Bias Check Lab
2005 -43.6 11.65 GDL
2006 -1.9 - Becquerel
2007 -6.6 36.8 ActLab
2007 -0.6 22 ALS
2008 -3.4 -9.4 GDL
2008 4.0 5.0 Acme
2009 -0.21 2.61 Starck
13.3.3 Assessment of Precision with Duplicates
Between 2006 and 2009, 716 quarter-core field duplicates were submitted as control
samples to support primary assay result. Duplicates are used to assess for sampling bias
and the ability of the lab to reproduce their results. A duplicate result is considered a
failure if the absolute relative difference (ARD) between the pairs exceeds a given
threshold. ARD is calculated using the following formula;
ARD % = absolute (original value – duplicate value) / ((original value +
duplicate value) / 2) * 100
ARD and AVRD (absolute value relative difference) are used interchangeably in Figures in
this report. Field duplicate pairs returning an ARD of <30% and pulp duplicate pairs
returning an ARD <10% (error limit), at least nine times out of ten are an industry standard
acceptable failure rate of acceptable precision of assays for use in resource estimation.
Min-Max plots are used to assess the ARD failure rate. On these plots the minimum of a
paired value is plotted on the X axis and the maximum paired value is plotted on the Y
axis. The red squares indicate paired duplicates with an ARD greater than the error limit.
The error limit is shown as the red line. The error limit is a hyperbolic function to
accommodate for lower precision at lower grades. Good precision is generally not
achieved for results returning less than 10 times the lower detection limit.
Figures 13-9 and 13-10 show field duplicate pairs sampled between 2006 and 2009 have a
7.2% and a 18.8% failure rate for Ta and Nb respectively.
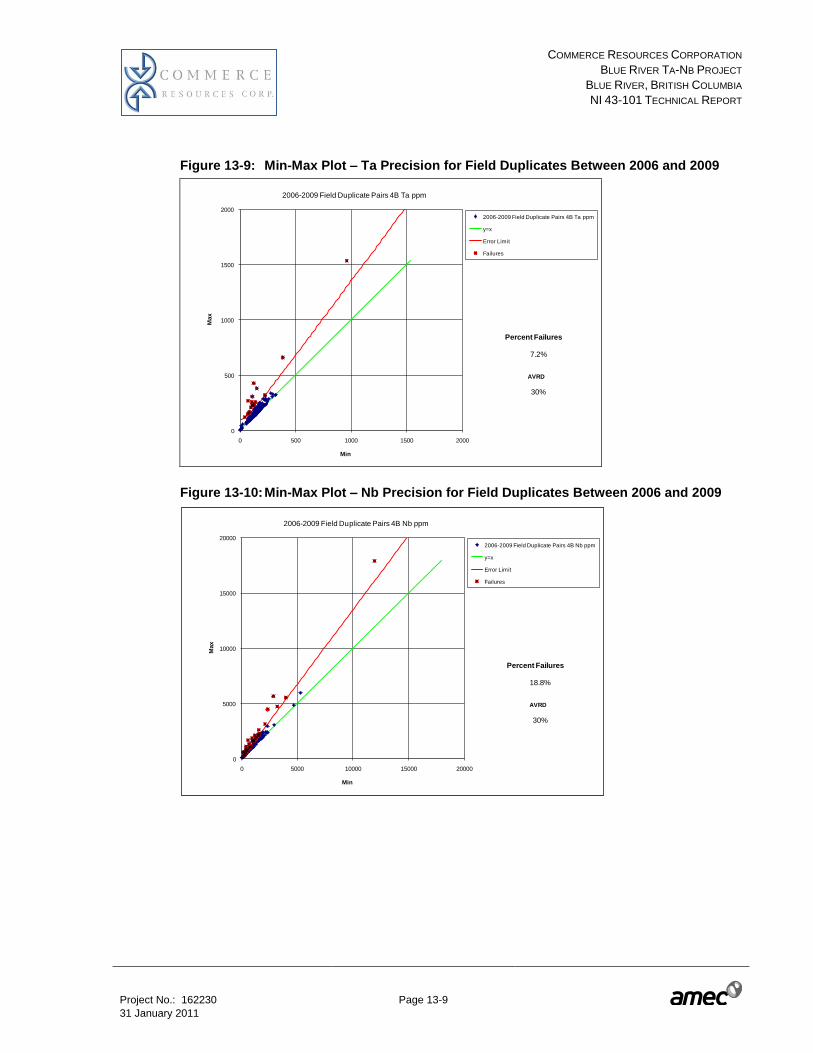
COMMERCE RESOURCES CORPORATION
BLUE RIVER TA-NB PROJECT
BLUE RIVER, BRITISH COLUMBIA
NI 43-101 TECHNICAL REPORT
Project No.: 162230 Page 13-9 31 January 2011
Figure 13-9: Min-Max Plot – Ta Precision for Field Duplicates Between 2006 and 2009
Figure 13-10: Min-Max Plot – Nb Precision for Field Duplicates Between 2006 and 2009
0
500
1000
1500
2000
0 500 1000 1500 2000
Max
Min
2006-2009 Field Duplicate Pairs 4B Ta ppm
y=x
Error Limit
Failures
Percent Failures
7.2%
2006-2009 Field Duplicate Pairs 4B Ta ppm
AVRD
30%
0
5000
10000
15000
20000
0 5000 10000 15000 20000
Max
Min
2006-2009 Field Duplicate Pairs 4B Nb ppm
y=x
Error Limit
Failures
Percent Failures
18.8%
2006-2009 Field Duplicate Pairs 4B Nb ppm
AVRD
30%

COMMERCE RESOURCES CORPORATION
BLUE RIVER TA-NB PROJECT
BLUE RIVER, BRITISH COLUMBIA
NI 43-101 TECHNICAL REPORT
Project No.: 162230 Page 13-10 31 January 2011
Table 13-5 summarizes field duplicate precision failure rate by year.
Table 13-5 Field Duplicate Precision by Year
Field Duplicate Precision Failure Rate
Ta (%) Nb (%)
2007 (ICP) 5.6 33.3
2008 (ICP) 5.2 16.8
2009 (XRF-F) 19.6 17.9
All but the 2007 and 2008 Ta results are above the acceptable 10% failure rate threshold.
Ta precision failure rate increased in 2009, which is coincident with a move to XRF (fusion)
analysis. A better assessment of precision would be to use pulp duplicate pairs, so the
results are not considered a definitive assessment of precision.
In 2008, 268 pulps were resubmitted to Acme for ICP-MS analysis. Min-Max plots shown
in Figures 13-11 and 13-13 indicate excessive failure rates suggesting analytical precision
was not under control for Ta or Nb.
ARD is commonly related to grade. As sample grades approach the lower detection limits
of the given analytical procedure, the ARD typically increases. A Practical Detection Limit
(PDL) for an analytical procedure is the grade at which the ARD exceeds 100%. The PDL
is generally greater than the lower detection limits reported by laboratories for a given
analytical procedure. Figures 13-12 and 13-14 show the ARD relative to grade and
indicate the ARD generally exceeds the 10% threshold for both Ta and Nb at all grades.
Neither of these figures shows a clear PDL which is possible if the selected pulp duplicates
had grades well above the lower detection limit. Despite the apparent imprecision, Figures
13-15 and 13-16 show that there is no significant bias between the duplicate pairs for Ta or
Nb.

COMMERCE RESOURCES CORPORATION
BLUE RIVER TA-NB PROJECT
BLUE RIVER, BRITISH COLUMBIA
NI 43-101 TECHNICAL REPORT
Project No.: 162230 Page 13-11 31 January 2011
Figure 13-11: 2008 Pulp Duplicate Failure Min Max Ta Chart
Figure 13-12: 2008 Pulp Duplicate ARD vs. Grade Ta Chart
0
200
400
600
800
1000
1200
1400
1600
0 200 400 600 800 1000 1200 1400
Max
Min
PRA0906209B 2008 Acme Pulp Duplicate Pairs ICP-MS Ta ppm
y=x
Error Limit
Failures
Percent Failures
51.9%
PRA0906209B 2008 Acme Pulp Duplicate Pairs ICP-MS Ta ppm
AVRD
10%
0%
20%
40%
60%
80%
100%
120%
140%
160%
180%
0.00 100.00 200.00 300.00 400.00 500.00
AR
D
PRA0906209B 2008 Acme Pulp Duplicate Pairs ICP-MS Ta ppm
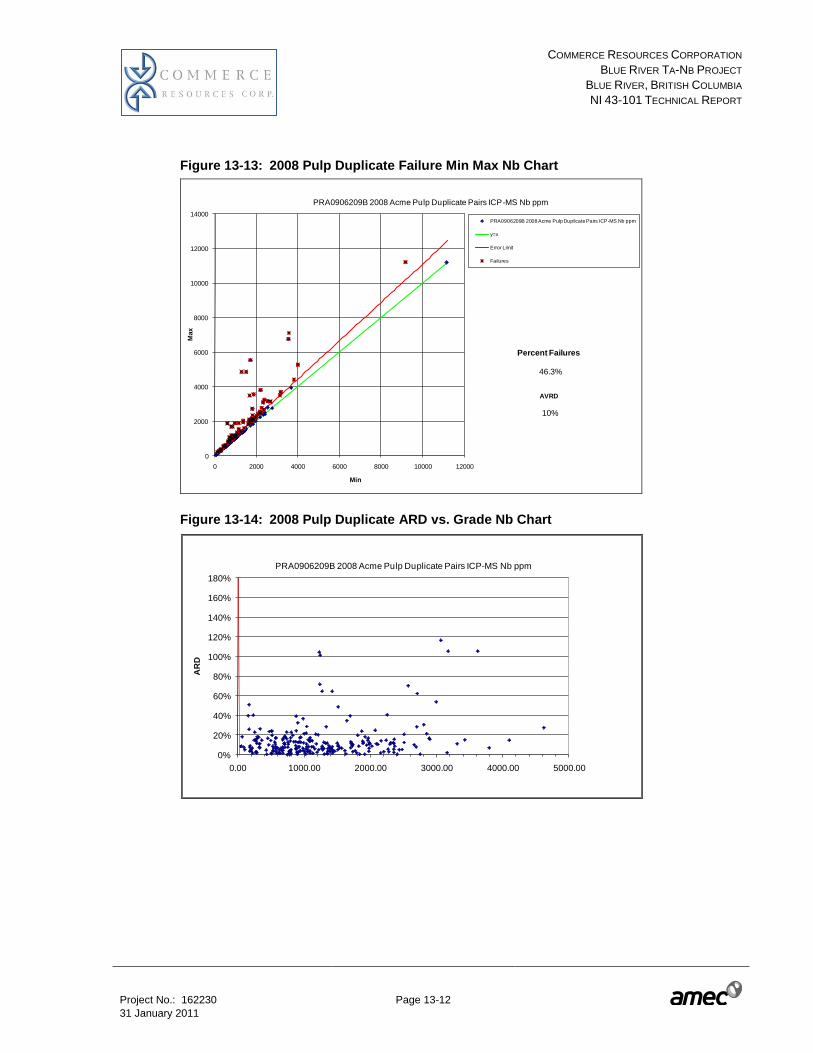
COMMERCE RESOURCES CORPORATION
BLUE RIVER TA-NB PROJECT
BLUE RIVER, BRITISH COLUMBIA
NI 43-101 TECHNICAL REPORT
Project No.: 162230 Page 13-12 31 January 2011
Figure 13-13: 2008 Pulp Duplicate Failure Min Max Nb Chart
Figure 13-14: 2008 Pulp Duplicate ARD vs. Grade Nb Chart
0
2000
4000
6000
8000
10000
12000
14000
0 2000 4000 6000 8000 10000 12000
Max
Min
PRA0906209B 2008 Acme Pulp Duplicate Pairs ICP-MS Nb ppm
y=x
Error Limit
Failures
Percent Failures
46.3%
PRA0906209B 2008 Acme Pulp Duplicate Pairs ICP-MS Nb ppm
AVRD
10%
0%
20%
40%
60%
80%
100%
120%
140%
160%
180%
0.00 1000.00 2000.00 3000.00 4000.00 5000.00
AR
D
PRA0906209B 2008 Acme Pulp Duplicate Pairs ICP-MS Nb ppm

COMMERCE RESOURCES CORPORATION
BLUE RIVER TA-NB PROJECT
BLUE RIVER, BRITISH COLUMBIA
NI 43-101 TECHNICAL REPORT
Project No.: 162230 Page 13-13 31 January 2011
Figure 13-15: 2008 Pulp Duplicate RMA Ta Chart
Figure 13-16: 2008 Pulp Duplicate RMA Nb Chart
In 2009 Commerce initiated an extensive re-assay program which culminated in a decision
to move to XRF (fusion) analysis for Ta and Nb. Analysis of pulp duplicates from these
tests showed that despite Ta and Nb detection limits being reported down to 5 and 10
R² = 0.6335
y = 0.9371x - 9.9785
0.0
200.0
400.0
600.0
800.0
1000.0
1200.0
1400.0
0.0 200.0 400.0 600.0 800.0 1000.0 1200.0 1400.0
PRA0906209B Acme - Acme Pulp Checks Ta ppm
Sample Pairs
y=x
RMA
Acm
e I
CP
-MS
Ta p
pm
Acme ICP-MS Ta ppm
6.29%Bias=
R² = 0.8448
y = 0.9309x + 10.542
0.0
1000.0
2000.0
3000.0
4000.0
5000.0
6000.0
7000.0
8000.0
0.0 1000.0 2000.0 3000.0 4000.0 5000.0 6000.0 7000.0 8000.0
PRA0906209B Acme - Acme Pulp Checks Nb ppm
Sample Pairs
y=x
RMA
Acm
e I
CP
-MS
Nb
pp
m
Acme ICP-MS Nb ppm
4.72%Bias=
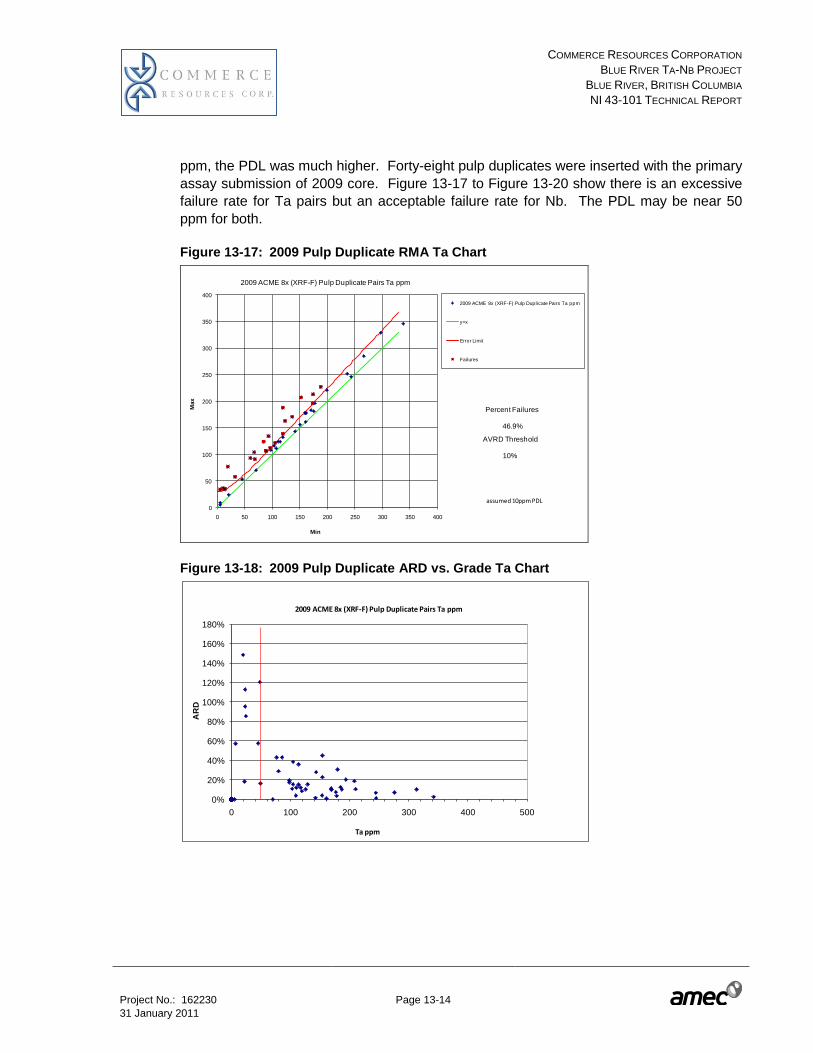
COMMERCE RESOURCES CORPORATION
BLUE RIVER TA-NB PROJECT
BLUE RIVER, BRITISH COLUMBIA
NI 43-101 TECHNICAL REPORT
Project No.: 162230 Page 13-14 31 January 2011
ppm, the PDL was much higher. Forty-eight pulp duplicates were inserted with the primary
assay submission of 2009 core. Figure 13-17 to Figure 13-20 show there is an excessive
failure rate for Ta pairs but an acceptable failure rate for Nb. The PDL may be near 50
ppm for both.
Figure 13-17: 2009 Pulp Duplicate RMA Ta Chart
Figure 13-18: 2009 Pulp Duplicate ARD vs. Grade Ta Chart
0
50
100
150
200
250
300
350
400
0 50 100 150 200 250 300 350 400
Max
Min
2009 ACME 8x (XRF-F) Pulp Duplicate Pairs Ta ppm
y=x
Error Limit
Failures
Percent Failures
46.9%
2009 ACME 8x (XRF-F) Pulp Duplicate Pairs Ta ppm
AVRD Threshold
10%
assumed 10ppm PDL
0%
20%
40%
60%
80%
100%
120%
140%
160%
180%
0 100 200 300 400 500
AR
D
2009 ACME 8x (XRF-F) Pulp Duplicate Pairs Ta ppm
Ta ppm
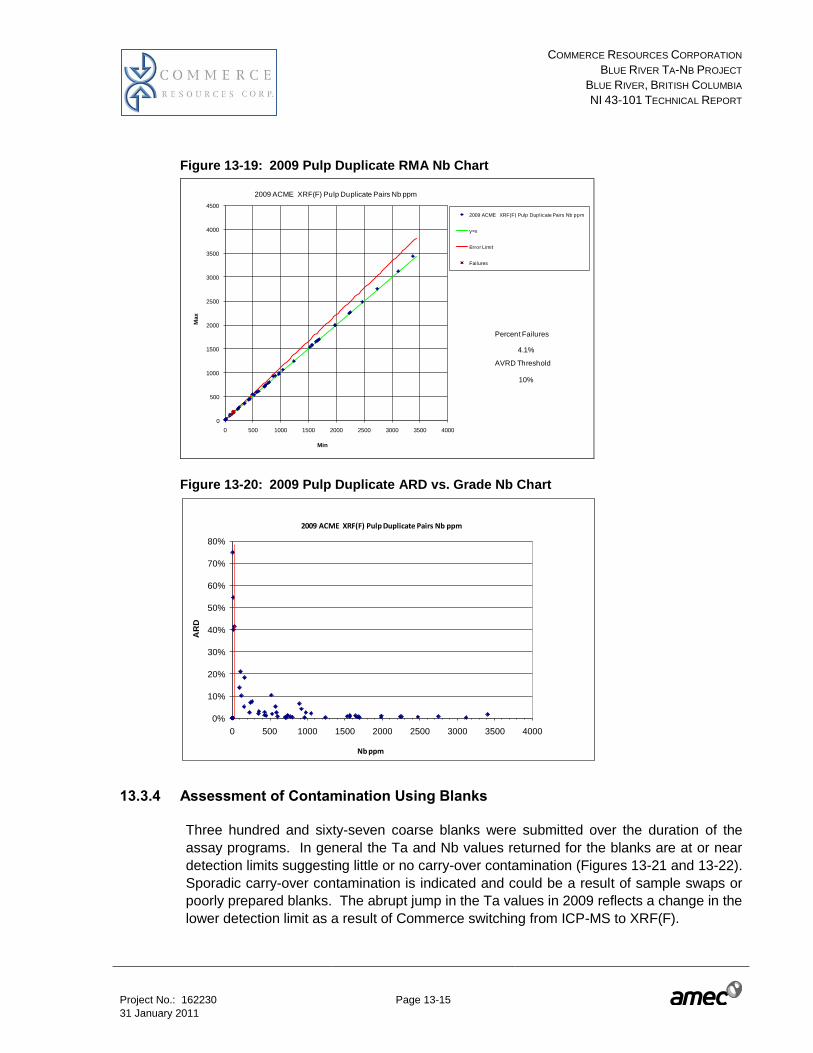
COMMERCE RESOURCES CORPORATION
BLUE RIVER TA-NB PROJECT
BLUE RIVER, BRITISH COLUMBIA
NI 43-101 TECHNICAL REPORT
Project No.: 162230 Page 13-15 31 January 2011
Figure 13-19: 2009 Pulp Duplicate RMA Nb Chart
Figure 13-20: 2009 Pulp Duplicate ARD vs. Grade Nb Chart
13.3.4 Assessment of Contamination Using Blanks
Three hundred and sixty-seven coarse blanks were submitted over the duration of the
assay programs. In general the Ta and Nb values returned for the blanks are at or near
detection limits suggesting little or no carry-over contamination (Figures 13-21 and 13-22).
Sporadic carry-over contamination is indicated and could be a result of sample swaps or
poorly prepared blanks. The abrupt jump in the Ta values in 2009 reflects a change in the
lower detection limit as a result of Commerce switching from ICP-MS to XRF(F).
0
500
1000
1500
2000
2500
3000
3500
4000
4500
0 500 1000 1500 2000 2500 3000 3500 4000
Max
Min
2009 ACME XRF(F) Pulp Duplicate Pairs Nb ppm
y=x
Error Limit
Failures
Percent Failures
4.1%
2009 ACME XRF(F) Pulp Duplicate Pairs Nb ppm
AVRD Threshold
10%
0%
10%
20%
30%
40%
50%
60%
70%
80%
0 500 1000 1500 2000 2500 3000 3500 4000
AR
D
2009 ACME XRF(F) Pulp Duplicate Pairs Nb ppm
Nb ppm

COMMERCE RESOURCES CORPORATION
BLUE RIVER TA-NB PROJECT
BLUE RIVER, BRITISH COLUMBIA
NI 43-101 TECHNICAL REPORT
Project No.: 162230 Page 13-16 31 January 2011
Figure 13-21: Blank Control Chart for Tantalum Analyses
Figure 13-22: Blank Control Chart for Niobium Analyses
13.4 Density
Commerce regularly collected density measurements using a water displacement method.
Five to 10 cm pieces of whole core were weighed with a balance beam scale and then
were placed into a beaker of water. The volume of water displaced was measured with a
clear plastic ruler to approximate the volume of the core. Density was calculated using:
Weight of core / volume of water displaced
0
20
40
60
80
100
120
140
160
1802
00
6
20
06
20
06
20
06
20
07
20
07
20
07
20
07
20
08
20
08
20
08
20
08
20
08
20
08
20
08
20
08
20
08
20
08
20
08
20
08
20
08
20
08
20
09
20
09
20
09
Blanks ICP-MS 4B Ta ppm
0
200
400
600
800
1000
1200
1400
1600
1800
20
06
20
06
20
06
20
06
20
07
20
07
20
07
20
07
20
08
20
08
20
08
20
08
20
08
20
08
20
08
20
08
20
08
20
08
20
08
20
08
20
08
20
08
20
09
20
09
20
09
Blanks ICP-MS 4B Nb ppm

COMMERCE RESOURCES CORPORATION
BLUE RIVER TA-NB PROJECT
BLUE RIVER, BRITISH COLUMBIA
NI 43-101 TECHNICAL REPORT
Project No.: 162230 Page 13-17 31 January 2011
No check samples were completed.
AMEC recommended a check on the density data and additional measurements for waste
rock types. A water immersion specific gravity (SG) method was used in addition to the
water displacement method. For the water displacement checks an ASTM approved
cylinder with 2 mm graduations was used. For the water immersion method core was
placed on a scale, weighed (weight in air), submerged in a bucket of water, and then
weighed again (weight in water). SG was calculated using:
Specific gravity = (core weight in air) / (core weight in air – core weight in water)
Four hundred and twenty-five pieces of whole and half-sawn HQ diameter drill core
measuring at least 10 to 20 cm long were checked. The samples chosen covered the
spatial and time aspects of the different Commerce drill campaigns.
Thirty-nine of the 425 samples were sent to MetSolve Laboratories Inc. of Burnaby, B.C.
for measurement of SG by a wax coated water immersion method to assess for possible
water porosity. Original water displacement, check water displacement, and check water
immersion measurements were compared to the 39 MetSolve wax coated water immersion
SG measurements.
Original water displacement density measurements had poor correlation
Check water displacement density measurements had adequate correlation
Check water immersion SG measurements had excellent correlation.
Based on this, the 425 water immersion check measurements were used to calculate SG
values for each major rock type at Blue River. The means are used as constants to
support the Mineral Resource update.
Table 13-6: Specific Gravity Measurements for Blue River Rock Types
Domain Count Min Max Mean StDev CV
Gneiss 81 2.69 3.16 2.82 0.09 0.03
Amphibolite 30 2.93 3.19 3.05 0.07 0.02
Fenite+CalcAmphibolite 55 2.87 3.16 2.97 0.05 0.02
Carbonatite 168 2.85 3.24 3.01 0.08 0.03
Pegmatite 44 2.57 2.68 2.62 0.02 0.01
Other 29 2.81 3.20 3.03 0.10 0.03
Fault Zone (mixed) 17 2.54 3.06 2.85 0.15 0.05
Total 424 2.54 3.24 2.92 0.15 0.05

COMMERCE RESOURCES CORPORATION
BLUE RIVER TA-NB PROJECT
BLUE RIVER, BRITISH COLUMBIA
NI 43-101 TECHNICAL REPORT
Project No.: 162230 Page 13-18 31 January 2011
13.5 Security
The core is delivered by the drillers in the back of a pick-up truck to the Commerce field
office in Blue River. The boxes are laid out in order on saw horses and inspected by the
project manager. The core is logged by Dahrouge geologists. The core logging supervisor
completes spot checks for quality on a daily basis. The core storage, logging and
sampling facilities are not secured. Samples are placed in pails and stored in the locked
quonset hut for security prior to shipping. The core samples are commercially transported
via Monashee Painting and Services of Blue River, B.C. to the preparatory laboratory.
Sample sheet manifests are submitted with the core samples. The manifests include
information on the operator, sample preparation laboratory, and a sample list. Sample
rejects returned from the lab are stored in the quonset hut.
13.6 Comment on Section 13
AMEC and Commerce have carefully examined the sample preparation and analysis of
Blue River core. The principal findings of this work are as follows:
Significant inter-lab grade biases are evident for Ta and Nb in the initial sampling
Acceptable inter-lab biases were achieved through the remaining sampling programs
SRM control samples indicate acceptable levels of accuracy are occasionally achieved
for Ta and Nb. Where acceptable levels are not achieved the SRM results suggest a
low bias for the primary results may exist
Poor precision is evident for Ta and Nb results collected in 2008 and 2009. However
no consistent bias is evident
The Blue River sample results show imprecision but no consistent bias and are
considered suitable for use in mineral resource estimation. Caution should be applied
in assigning a high level of confidence to the results until precision and accuracy
issues are resolved.
COMMERCE RESOURCES CORPORATION
BLUE RIVER TA-NB PROJECT
BLUE RIVER, BRITISH COLUMBIA
NI 43-101 TECHNICAL REPORT
Project No.: 162230 Page 14-1 31 January 2011
14.0 DATA VERIFICATION
14.1 Database Data Entry Check
The resource database that was used for the 2010 resource estimate is stored in a
Gems™ database format. In the drill hole resource database, there are 183 drill holes
used in the mineral resource update consisting of 183 collar records, 510 hole orientation
records, 8,218 assays records, and 8,434 lithology records. AMEC performed a data entry
verification check of the database to assess frequency of data entry errors using original
source documentation. A data entry error rate of less than 1.0% is considered an industry
acceptable level of accuracy.
Drill Collar Coordinate Checks
All drill collar coordinates are collected in UTM NAD 83 Zone 11 coordinate system.
Nineteen randomly selected drill collar records, representing 10% of all drill collar records
were examined. No errors were noted.
All drill collar elevations were compared to the topographic surface used in the resource
estimation. No discrepancies were noted.
Down-Hole Deviation Checks
Fifty-two holes have collar orientation measurements only. The remainder have at least
two down-hole measurements. Holes with measurements have been surveyed using a
Flexit Single Shot down-hole orientation tool. The Flexit data are down-loaded
electronically and then hand-entered into the Gems™ database. Spacing between
measurements averages 90 m and ranges from 0.9 m to 327 m.
Eighty-four randomly selected down-hole survey records, representing 5% of all the down-
hole survey records were checked. Minor errors were noted.
The magnetic declination applied to down-hole surveys was checked against the
Geological Survey of Canada’s magnetic declination for the area and was confirmed.
AMEC checked the down-hole survey records for indications of excessive bends in the drill
hole trace. “Kinkcheck” is a proprietary software program that calculates deviation
between consecutive down-hole survey measurements and compares to an allowable
tolerance set by the QP. Deviations in excess of allowable tolerance are flagged. No
unusual “kinks” were noted.

COMMERCE RESOURCES CORPORATION
BLUE RIVER TA-NB PROJECT
BLUE RIVER, BRITISH COLUMBIA
NI 43-101 TECHNICAL REPORT
Project No.: 162230 Page 14-2 31 January 2011
Lithology Checks
AMEC checked 1,740 lithology records, representing 21% of all lithology records. Twenty
errors were noted which represents a 1.1% error rate for the geology table. The errors
were reported to Dahrouge, who subsequently checked and fixed the errors.
Assay Data Checks
AMEC performed a data entry check on 100% of the Ta and Nb assay records. Database
records were compared to assay certificates. One error was noted.
14.2 Site Visit
14.2.1 Drill Collar Location Check
AMEC checked the location of 20 drill collars from 10 setups for the 2006 to 2009 drilling
campaigns using a hand-held Garmin GPS Map 60 CSX unit. All holes checked were
within ±8 m and most were within ±3 m. The drill hole locations with discrepancies greater
than 3 m were related to disturbance of markers from drill road construction.
Upon completion of a drill hole, 4" x 4" wooden posts are placed into the hole. The drill
hole collar casings are in some cases still in place. Steel plates with the drill hole names
have been cemented into the ground adjacent to the hole collars making hole identification
relatively easy (Figure 14-1).
14.2.2 Logging and Sampling Facilities
The core is logged and sampled by Dahrouge employees in an open field behind the Blue
River field office.
Core is half sawn with a 10" diamond blade. The samples are cut along the length of the
sample, and perpendicular to the core at the end of each sample interval. The saw is
cleaned with fresh running water at the end of each sample. The sludge at the bottom of
the saw basin is cleaned and placed into a separate sample bag for possible check
sampling. After the core is cut, half is placed in a uniquely numbered plastic bag and half
is placed back into the core box. Sample identification tags are inserted into the sample
bags. The sample bags are secured with plastic zip ties and then placed into 5 gallon
pails. Dahrouge has arranged for sample bar-tag labels employing a system which can be
used by the primary laboratory Acme-Vancouver.
The pails are labelled on the exterior surface with list of samples contained within the pail.
The empty bags for QA/QC blanks and SRMs are typically placed at the top of the pail for
filling by the sample preparation lab.
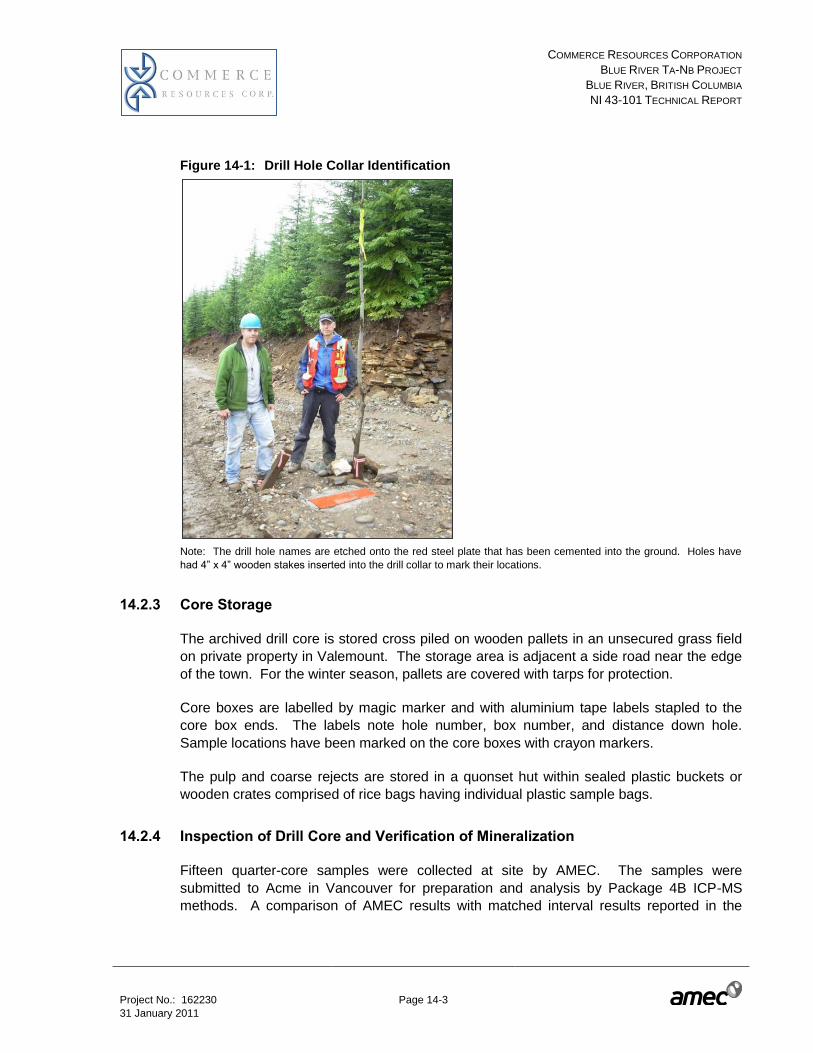
COMMERCE RESOURCES CORPORATION
BLUE RIVER TA-NB PROJECT
BLUE RIVER, BRITISH COLUMBIA
NI 43-101 TECHNICAL REPORT
Project No.: 162230 Page 14-3 31 January 2011
Figure 14-1: Drill Hole Collar Identification
Note: The drill hole names are etched onto the red steel plate that has been cemented into the ground. Holes have
had 4” x 4” wooden stakes inserted into the drill collar to mark their locations.
14.2.3 Core Storage
The archived drill core is stored cross piled on wooden pallets in an unsecured grass field
on private property in Valemount. The storage area is adjacent a side road near the edge
of the town. For the winter season, pallets are covered with tarps for protection.
Core boxes are labelled by magic marker and with aluminium tape labels stapled to the
core box ends. The labels note hole number, box number, and distance down hole.
Sample locations have been marked on the core boxes with crayon markers.
The pulp and coarse rejects are stored in a quonset hut within sealed plastic buckets or
wooden crates comprised of rice bags having individual plastic sample bags.
14.2.4 Inspection of Drill Core and Verification of Mineralization
Fifteen quarter-core samples were collected at site by AMEC. The samples were
submitted to Acme in Vancouver for preparation and analysis by Package 4B ICP-MS
methods. A comparison of AMEC results with matched interval results reported in the

COMMERCE RESOURCES CORPORATION
BLUE RIVER TA-NB PROJECT
BLUE RIVER, BRITISH COLUMBIA
NI 43-101 TECHNICAL REPORT
Project No.: 162230 Page 14-4 31 January 2011
resource database is summarized in Table 14-1. The check sample results support the
grades reported in the resource database.
Table 14-1: AMEC Site Visit Confirmation of Mineralization
AMEC Quarter Core Samples Original Half Core Samples
DHID From (m) To (m) Ta (ppm) Nb (ppm) Ta (ppm) Nb (ppm)
CF0612 103.3 104.3 131 328 121 360
CF0612 104.3 105.3 146 367 194 506
CF0612 105.3 106.3 287 1,305 365 1,494
CF0612 106.3 107.3 146 565 122 466
CF0612 108.2 109.2 112 392 43 128
F0728 133.0 134.0 141 1,734 75 910
F0728 134.0 135.0 64 553 128 1,261
F0728 135.0 136.0 244 2,404 421 4,405
F08-150 129.7 131.0 143 1,727 210 4,739
F08-150 133.0 134.0 118 1,566 101 1,365
F08-150 134.0 135.0 189 2,667 181 2,742
F08-150 158.0 159.0 134 2,034 86 1,559
F08-151 192.0 193.0 140 798 143 744
F08-151 194.3 195.0 187 2,084 219 2,887
F08-151 195.0 196.0 78 1,786 91 2,040
Average 151 1,354 167 1,707
14.3 Comment on Section 14
AMEC concludes:
Based on the database verification performed by AMEC, the collar coordinates, down-
hole surveys, lithologies, and assays are considered sufficiently free of error and that
the data are suitable to support Mineral Resource estimation.

COMMERCE RESOURCES CORPORATION
BLUE RIVER TA-NB PROJECT
BLUE RIVER, BRITISH COLUMBIA
NI 43-101 TECHNICAL REPORT
Project No.: 162230 Page 15-1 31 January 2011
15.0 ADJACENT PROPERTIES
The Commerce Blue River claim boundaries surround 7 adjacent claims owned by
prospectors (Figure 4-1 and Table 15-1). These claims are centred on the Mud Lake
carbonatite outcrop showings located at about 52° 8' 5" N, 119° 10' 35" W. Exploration
work on the adjacent claims is at an early stage.
Table 15-1: List of Adjacent Property Claims
Claim Number Owner
597901 Kelly Brent Funk
525503 Darrel Wayne Davis
590258 Duane Paul Hennig
599718 Luis Alberto Botto
599637 Dwayne Edward Kress
601703 Dwayne Edward Kress
600986 Dwayne Edward Kress
601703 Dwayne Edward Kress
600986 Dwayne Edward Kress
AMEC has not verified any information related to carbonatite mineralization on the
adjacent claims. The mineralization on the adjacent claims is not necessarily indicative of
the carbonatites or mineralization found at Commerce’s Blue River Project.

COMMERCE RESOURCES CORPORATION
BLUE RIVER TA-NB PROJECT
BLUE RIVER, BRITISH COLUMBIA
NI 43-101 TECHNICAL REPORT
Project No.: 162230 Page 16-1 31 January 2011
16.0 MINERAL PROCESSING AND METALLURGICAL TESTING
Testwork began in 2009 and continued into 2010 to develop a process flowsheet for the
Blue River Project. The testwork was based on material produced from two bulk samples,
BS-2F and BS–2G. Mineralogical analysis was performed to obtain knowledge on the
occurrence of the tantalum and niobium within the material. Given the complexities with
assaying for the tantalum, a fair amount of effort also went into developing the appropriate
routine for the assaying of samples.
The testwork primarily took place in two Phases;
Phase I – concentrated on the recovery of the tantalum-niobium minerals by gravity
although grinding and mineralogy were also performed.
Phase II – concentrated on the recovery and upgrading of the tantalum-niobium
minerals by flotation.
A large amount of work was performed in Phase I that showed gravity could concentrate
the material to a low-grade product but that upgrading increasingly gave lower levels of
benefit as grade was sought. Grinding work done at this time showed a material which
had low to moderate hardness. Mineralogical work completed before and during this
period showed that the tantalum was not present as tantalite but rather as pyrochlore
minerals which limits recovery by the gravity route.
Phase II saw the employment of the flotation technology similar to that being used for
niobium carbonatites at the Niobec Mine in Quebec, Canada. There was immediate
success in the first phases of the work. Although there are several stages to the
concentration, the overall level of equipment, risk and complexity to produce a saleable or
treatable concentrate are lower than the gravity route. Process development work is
continuing in this area, but for this report, the process suggested by Test F81 has been
chosen as the basis of initial concentration design as recoveries were good (approx. 70%
for Ta) for this type of ore and due to a combined grade of 10% Ta-Nb being achieved. It
is expected that with further work, a combined grade of 30% Ta-Nb should be achievable.
In both phases, the emphasis of concentration techniques was to create a material which
would be easily upgraded by hydrometallurgical methods, pyrometallurgical methods, or a
combination of both. This led to an in-depth review of those technologies for the
production of high value intermediate products and final products. There is confidence that
the concentrate could be reduced to metal by the aluminothermic process. Subsequently
there would be chlorination of the granulated metal alloy product and distillation of the
anhydrous metal chloride products to produce high purity Nb and Ta chlorides. Tantalum
chloride is the precursor to capacitor grade Ta powder,that can be marketed as such.
However, both Ta and Nb chlorides can be hydrolyzed and calcined to generate high purity
oxide products for other applications.

COMMERCE RESOURCES CORPORATION
BLUE RIVER TA-NB PROJECT
BLUE RIVER, BRITISH COLUMBIA
NI 43-101 TECHNICAL REPORT
Project No.: 162230 Page 16-2 31 January 2011
16.1 Head Samples for Initial Testing
In 2009, two bulk samples BS-2F and BS–2G weighing approximately 200 tonnes total
were contract-crushed to a particle size of <1 inch diameter. After crushing, each group of
samples was homogenized separately by a standard coning and quartering procedure.
The well mixed samples were bagged into one tonne bags and put into storage. One
tonne of each sample was delivered to MetSolve Laboratory in Burnaby B.C to air dry and
further reduce the size to -10 mesh for bench testing.
The mineralogical examinations of all the bulk samples taken during the 2009 exploration
program is presented in the report “Mineral Characterization of Bulk Samples from Bulk
Sample Pits 1, 2 and 3, Upper Fir Carbonatite” by Thomas Chudy and dated 2009.
Additional mineralogical examinations were performed on some of the test products during
the mineral processing investigations.
The head assays for the two bulk samples were (using XRF) :
Sample Ta (ppm) Nb (ppm)
BS-2F 194 1300
BS -2G 114 764
16.2 Phase I Testing
Grinding size
Each sample was subjected to gravity separation tests at five different grind sizes of 80%
passing 500 µm, 230 µm, 100 µm, 74 µm and 45 µm to determine the liberation size using
a centrifugal concentrator. A standard 7 pass procedure was used to simulate continuous
concentrator action.
This work indicates that the liberation size for both samples is coarser than P80 of 76 µm.
The relative position of the curves (Figure 16-1 and 16-2) indicates that effective liberation
for gravity is likely achievable at a grind size slightly coarser than 120 µm. The results for
niobium are similar.

COMMERCE RESOURCES CORPORATION
BLUE RIVER TA-NB PROJECT
BLUE RIVER, BRITISH COLUMBIA
NI 43-101 TECHNICAL REPORT
Project No.: 162230 Page 16-3 31 January 2011
Figure 16-1: Sample BS-2F – Gravity Separation (Different Grinds)
Figure 16-2: Sample BS-2G – Gravity Separation (Different Grinds)
Assaying of the individual size fractions of the tails from the BS-2G tests indicate that there
are still a few locked particles between 74 and 106 µm when ground to P80 112 µm but
that material coarser than 150 µm does not contain any tantalum. Given the natural size
0
10
20
30
40
50
60
70
80
90
100
0 200 400 600 800 1000 1200 1400 1600 1800 2000
Re
co
ve
ry (
%)
Grade Ta (ppm)
BS-2F - Gravity SeparationTantalum Grade/Recovery Curves
P80 500 um
P80 233 um
P80 112 um
P80 76 um
P80 45 um
0
10
20
30
40
50
60
70
80
90
100
0 100 200 300 400 500 600 700 800 900 1000
Re
co
ve
ry (
%)
Grade Ta (ppm)
BS-2G - Gravity SeparationTantalum
P80 650 um
P80 250 um
P80 120 um
P80 76 um
P80 45 um

COMMERCE RESOURCES CORPORATION
BLUE RIVER TA-NB PROJECT
BLUE RIVER, BRITISH COLUMBIA
NI 43-101 TECHNICAL REPORT
Project No.: 162230 Page 16-4 31 January 2011
distribution obtained in grinding, this implies that effective liberation for processing, is about
P80 of 125 µm for gravity treatment and slightly coarser for flotation (P80 up to 160 µm).
These numbers are in line with independent findings from the mineralogical examination of
all bulk samples of the 2009 exploration program.
Roughing & Cleaning Gravity Concentration
With the establishment of the grind size and initial gravity results, it was decided to
progress with the gravity concentration work. The two samples were treated with a
centrifugal concentrator, using ten (10) consecutive stages for rougher concentration
followed by three (3) cleaning stages of the combined rougher concentrates. Four different
grind sizes were tested for each sample. All results were similar, with recoveries falling off
quickly in cleaning and inability to raise the grades any higher than Ta 3,500 ppm
(0.35% Ta). Results from sample BS-2G are shown on Figure 16-3.
Figure 16-3: Rougher and Cleaners by Centrifugal Gravity Concentration
Large batch samples of 60 kg were tested using the Falcon Centrifugal Gravity
Concentrator in ten consecutive stages to produce a rougher and a scavenger concentrate
at a grind size of P80 100 µm. The rougher concentrate only was screened to produce
three size fractions as follows:
+74 µm
37 to 74 µm
-37 µm.
Each fraction was then cleaned by gravity using a Wilfley shaking table, with a medium
size deck. Results were similar to the above gravity separation using centrifugal separator
only with no improvement in recoveries or grades. These fractions were also tested using
0
10
20
30
40
50
60
70
80
90
100
0 500 1000 1500 2000 2500 3000 3500 4000
Ta R
eco
very
, %
Ta Grade, ppm
Ta Grade Recovery Curve
P80 116um
P80 83 um
P46 um
P80 238 um

COMMERCE RESOURCES CORPORATION
BLUE RIVER TA-NB PROJECT
BLUE RIVER, BRITISH COLUMBIA
NI 43-101 TECHNICAL REPORT
Project No.: 162230 Page 16-5 31 January 2011
a Mozley Table Concentrator to determine the upgrading characteristics of the products.
Results showed that while it would be possible to increase the grades by up to six times at
the lab level, the recoveries would drop accordingly. The results are shown in Figure 16-4.
Figure 16-4: Upgrading by Wilfley & Mozley Units
Tests were also performed to determine the benefits of de-sliming, de-sulphidization, etc.
These procedures were incorporated into the testwork but essentially it was felt that
concentration by gravity as the primary method was not the optimum choice.
16.3 Phase II Testing
Flotation Tests
A series of tests were performed by MetSolve using varying desliming procedures followed
by flotation with various combinations of reagents. Results were not successful, with
recoveries generally below 15%.
A few tests were then performed using the flotation procedures used at the Niobec Mine.
The first tests were immediately successful with higher recoveries and grades in the
roughers than the gravity method. While the rougher stage gave good results, the cleaning
stage was problematic due primarily to non-optimized conditions at this preliminary stage
of testing. Cleaning tests were performed and it was shown that a total oxide grade of
more than 30% combined Nb2O5 and Ta2O5 is achievable although not at high recoveries.
Until such time as the procedures have been well established and stabilized and are
reproducible on larger test weights, the recoveries indicated should be considered semi-
quantitative and indicative of the possibilities.
Once improved desliming equipment was purchased, a series of desliming tests were
performed to determine the best range of operating parameters which indicated optimum
ranges are similar to Niobec. Tests were then performed to optimize the kinetics of the
rougher tantalum niobium flotation. It has been shown that control of the pH through the
40
50
60
70
80
90
100
100 1,000 10,000 100,000
Ta
Re
co
ve
ry (
%)
Grade Ta (ppm)
Gravity Concentration
Mozley Characterization
Wilfley Table
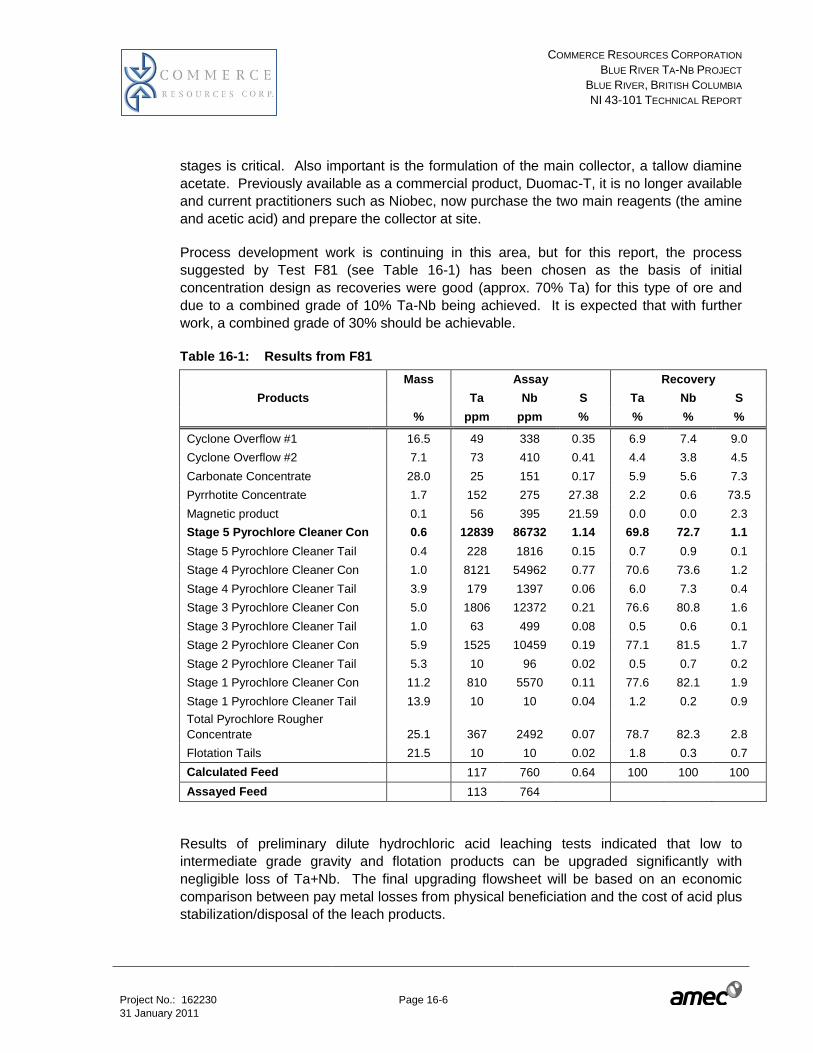
COMMERCE RESOURCES CORPORATION
BLUE RIVER TA-NB PROJECT
BLUE RIVER, BRITISH COLUMBIA
NI 43-101 TECHNICAL REPORT
Project No.: 162230 Page 16-6 31 January 2011
stages is critical. Also important is the formulation of the main collector, a tallow diamine
acetate. Previously available as a commercial product, Duomac-T, it is no longer available
and current practitioners such as Niobec, now purchase the two main reagents (the amine
and acetic acid) and prepare the collector at site.
Process development work is continuing in this area, but for this report, the process
suggested by Test F81 (see Table 16-1) has been chosen as the basis of initial
concentration design as recoveries were good (approx. 70% Ta) for this type of ore and
due to a combined grade of 10% Ta-Nb being achieved. It is expected that with further
work, a combined grade of 30% should be achievable.
Table 16-1: Results from F81
Mass Assay Recovery
Products Ta Nb S Ta Nb S
% ppm ppm % % % %
Cyclone Overflow #1 16.5 49 338 0.35 6.9 7.4 9.0
Cyclone Overflow #2 7.1 73 410 0.41 4.4 3.8 4.5
Carbonate Concentrate 28.0 25 151 0.17 5.9 5.6 7.3
Pyrrhotite Concentrate 1.7 152 275 27.38 2.2 0.6 73.5
Magnetic product 0.1 56 395 21.59 0.0 0.0 2.3
Stage 5 Pyrochlore Cleaner Con 0.6 12839 86732 1.14 69.8 72.7 1.1
Stage 5 Pyrochlore Cleaner Tail 0.4 228 1816 0.15 0.7 0.9 0.1
Stage 4 Pyrochlore Cleaner Con 1.0 8121 54962 0.77 70.6 73.6 1.2
Stage 4 Pyrochlore Cleaner Tail 3.9 179 1397 0.06 6.0 7.3 0.4
Stage 3 Pyrochlore Cleaner Con 5.0 1806 12372 0.21 76.6 80.8 1.6
Stage 3 Pyrochlore Cleaner Tail 1.0 63 499 0.08 0.5 0.6 0.1
Stage 2 Pyrochlore Cleaner Con 5.9 1525 10459 0.19 77.1 81.5 1.7
Stage 2 Pyrochlore Cleaner Tail 5.3 10 96 0.02 0.5 0.7 0.2
Stage 1 Pyrochlore Cleaner Con 11.2 810 5570 0.11 77.6 82.1 1.9
Stage 1 Pyrochlore Cleaner Tail 13.9 10 10 0.04 1.2 0.2 0.9
Total Pyrochlore Rougher
Concentrate 25.1 367 2492 0.07 78.7 82.3 2.8
Flotation Tails 21.5 10 10 0.02 1.8 0.3 0.7
Calculated Feed 117 760 0.64 100 100 100
Assayed Feed 113 764
Results of preliminary dilute hydrochloric acid leaching tests indicated that low to
intermediate grade gravity and flotation products can be upgraded significantly with
negligible loss of Ta+Nb. The final upgrading flowsheet will be based on an economic
comparison between pay metal losses from physical beneficiation and the cost of acid plus
stabilization/disposal of the leach products.
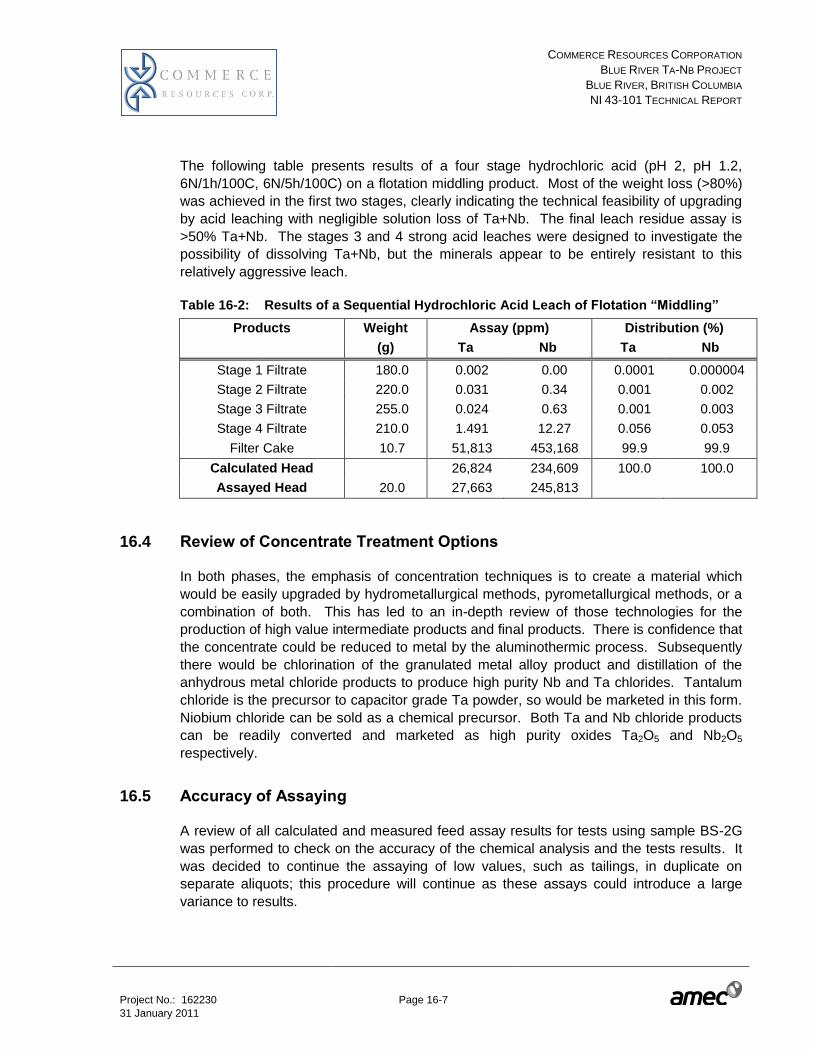
COMMERCE RESOURCES CORPORATION
BLUE RIVER TA-NB PROJECT
BLUE RIVER, BRITISH COLUMBIA
NI 43-101 TECHNICAL REPORT
Project No.: 162230 Page 16-7 31 January 2011
The following table presents results of a four stage hydrochloric acid (pH 2, pH 1.2,
6N/1h/100C, 6N/5h/100C) on a flotation middling product. Most of the weight loss (>80%)
was achieved in the first two stages, clearly indicating the technical feasibility of upgrading
by acid leaching with negligible solution loss of Ta+Nb. The final leach residue assay is
>50% Ta+Nb. The stages 3 and 4 strong acid leaches were designed to investigate the
possibility of dissolving Ta+Nb, but the minerals appear to be entirely resistant to this
relatively aggressive leach.
Table 16-2: Results of a Sequential Hydrochloric Acid Leach of Flotation “Middling”
Products Weight Assay (ppm) Distribution (%)
(g) Ta Nb Ta Nb
Stage 1 Filtrate 180.0 0.002 0.00 0.0001 0.000004
Stage 2 Filtrate 220.0 0.031 0.34 0.001 0.002
Stage 3 Filtrate 255.0 0.024 0.63 0.001 0.003
Stage 4 Filtrate 210.0 1.491 12.27 0.056 0.053
Filter Cake 10.7 51,813 453,168 99.9 99.9
Calculated Head 26,824 234,609 100.0 100.0
Assayed Head 20.0 27,663 245,813
16.4 Review of Concentrate Treatment Options
In both phases, the emphasis of concentration techniques is to create a material which
would be easily upgraded by hydrometallurgical methods, pyrometallurgical methods, or a
combination of both. This has led to an in-depth review of those technologies for the
production of high value intermediate products and final products. There is confidence that
the concentrate could be reduced to metal by the aluminothermic process. Subsequently
there would be chlorination of the granulated metal alloy product and distillation of the
anhydrous metal chloride products to produce high purity Nb and Ta chlorides. Tantalum
chloride is the precursor to capacitor grade Ta powder, so would be marketed in this form.
Niobium chloride can be sold as a chemical precursor. Both Ta and Nb chloride products
can be readily converted and marketed as high purity oxides Ta2O5 and Nb2O5
respectively.
16.5 Accuracy of Assaying
A review of all calculated and measured feed assay results for tests using sample BS-2G
was performed to check on the accuracy of the chemical analysis and the tests results. It
was decided to continue the assaying of low values, such as tailings, in duplicate on
separate aliquots; this procedure will continue as these assays could introduce a large
variance to results.

COMMERCE RESOURCES CORPORATION
BLUE RIVER TA-NB PROJECT
BLUE RIVER, BRITISH COLUMBIA
NI 43-101 TECHNICAL REPORT
Project No.: 162230 Page 16-8 31 January 2011
16.6 Comment on Section 16
Metallurgical testwork has shown that it is possible to concentrate the tantalum and
niobium minerals into a concentrate suitable for extraction of the metals into saleable
products. The first step of the process uses typical grinding followed by flotation. The
secondary treatment or metal extraction of the material is possible by existing methods.
These results are suitable to support the classification of the deposit in the resource
category.

COMMERCE RESOURCES CORPORATION
BLUE RIVER TA-NB PROJECT
BLUE RIVER, BRITISH COLUMBIA
NI 43-101 TECHNICAL REPORT
Project No.: 162230 Page 17-1 31 January 2011
17.0 MINERAL RESOURCE AND MINERAL RESERVE ESTIMATES
17.1 Introduction
The resource block model was constructed inside carbonatite only. All surrounding
lithologies including fenite carry fairly low Ta2O5 and Nb2O5 grade and are considered sub-
economic. Generally assay data exists only for carbonatite. There are some assay values
for fenite and other wall rocks but not in sufficient numbers to create a block model for
these lithologies.
17.2 Assay Data and Capping
The resource model was constructed inside carbonatite using 183 diamond drill holes.
Collar, survey, lithology and assay files were exported from the database as csv files,
imported into MineSight® commercial mine modeling software, and combined into a
drillhole assay file.
AMEC conducted grade capping on original samples that are mostly 1 m long. Capping
was required to limit the influence of outliers. The choice of capping was based on visual
inspection of histograms and probability plots. The amount of capping was small; top-cuts
of 1,000 ppm Ta2O5 and 10,000 ppm Nb2O5 were used in carbonatite. Only 4 Ta2O5
samples and 8 Nb2O5 samples were capped resulting in an expected metal removal of
0.12% Ta2O5 and 0.26% Nb2O5.
17.3 Composites
Capped drill core assays were composited down the hole to a fixed length of 2.5 m.
Compositing of Ta2O5 and Nb2O5 was performed in MineSight®
software honouring
geologic boundaries. Composites with length less than 1.25 m were merged with the
previous composite. AMEC confirmed that the compositing produced Ta2O5 and Nb2O5
means the same as pre-compositing means and that compositing resulted in a reduced
variability as indicated by lower CV (CV=coefficient of variation ; CV=standard deviation /
mean). This exercise demonstrated that no bias was introduced during compositing. Table
17-1 shows a summary of this check for carbonatite.
Table 17-1: Capped Assays vs. 2.5 m Composites Statistics Inside Carbonatites
Variable
assay capped
mean
assay capped
CV
2.5 m
Composites
mean
2.5 m
Composites
CV
Mean diff (from
assays capped
to comps)
Ta2O5 183.3 0.47 183.3 0.36 0.0%
Nb2O5 1394.9 0.88 1394.6 0.76 0.0%

COMMERCE RESOURCES CORPORATION
BLUE RIVER TA-NB PROJECT
BLUE RIVER, BRITISH COLUMBIA
NI 43-101 TECHNICAL REPORT
Project No.: 162230 Page 17-2 31 January 2011
17.4 Exploratory Data Analysis
Exploratory data analysis (EDA) was performed on the composites to better understand
the data used in the resource estimation. This type of investigation reveals the underlying
characteristics of the data. Table 17-2 contains a summary of univariate statistics for
Ta2O5 and Nb2O5 in carbonatite.
Table 17-2: Composite Statistics in Carbonatite
Area/Variable No. Mean Min Max Std. Dev. CV
Carbonatite
Ta2O5 2,989 183.3 0.1 596.8 65.9 0.36
Nb2O5 2,989 1,394.6 110.5 8,329.2 1,064.7 0.76
Note CV is the Coefficient of Variation and is equal to the standard deviation divided by mean
Figures 17-1 and 17-2 show arithmetic and log histograms and probability plots of Ta2O5
and Nb2O5 composites in carbonatite. Both distributions are skewed, and Nb2O5
distribution is approximately lognormal. The coefficients of variation are low and support
the use of linear grade interpolation methods such as kriging or inverse distance methods.

COMMERCE RESOURCES CORPORATION
BLUE RIVER TA-NB PROJECT
BLUE RIVER, BRITISH COLUMBIA
NI 43-101 TECHNICAL REPORT
Project No.: 162230 Page 17-3 31 January 2011
Figure 17-1: Ta2O5 Histograms and Probability Plot Within Carbonatite

COMMERCE RESOURCES CORPORATION
BLUE RIVER TA-NB PROJECT
BLUE RIVER, BRITISH COLUMBIA
NI 43-101 TECHNICAL REPORT
Project No.: 162230 Page 17-4 31 January 2011
Figure 17-2: Nb2O5 Histograms and Probability Plot Within Carbonatite
17.5 Contact Analysis
AMEC calculated contact profiles on assay data in MineSight®
software to analyze grade
behaviour at lithology boundaries. There were sharp differences in grade for each of the
variables on the carbonatite and fenite boundary, meaning that values from outside the
carbonatite should be disregarded in the interpolation process of Ta2O5 and Nb2O5 grade
inside the carbonatite.
17.6 Variography
Variogram / correlogram are tools used to quantify spatial continuity of a variable in a
deposit. AMEC used both in-house software and commercially available Sage2001
software to produce variogram maps and to construct down-the-hole and directional
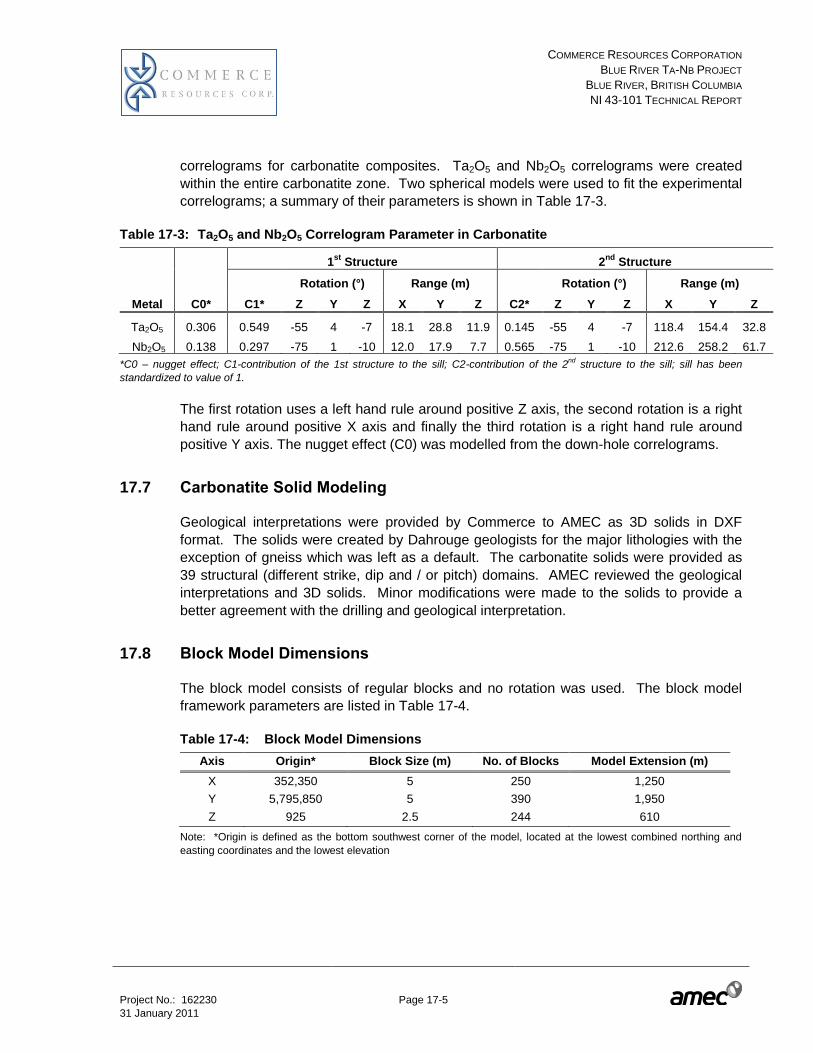
COMMERCE RESOURCES CORPORATION
BLUE RIVER TA-NB PROJECT
BLUE RIVER, BRITISH COLUMBIA
NI 43-101 TECHNICAL REPORT
Project No.: 162230 Page 17-5 31 January 2011
correlograms for carbonatite composites. Ta2O5 and Nb2O5 correlograms were created
within the entire carbonatite zone. Two spherical models were used to fit the experimental
correlograms; a summary of their parameters is shown in Table 17-3.
Table 17-3: Ta2O5 and Nb2O5 Correlogram Parameter in Carbonatite
Metal C0*
1st
Structure 2nd
Structure
Rotation (°) Range (m) Rotation (°) Range (m)
C1* Z Y Z X Y Z C2* Z Y Z X Y Z
Ta2O5 0.306 0.549 -55 4 -7 18.1 28.8 11.9 0.145 -55 4 -7 118.4 154.4 32.8
Nb2O5 0.138 0.297 -75 1 -10 12.0 17.9 7.7 0.565 -75 1 -10 212.6 258.2 61.7
*C0 – nugget effect; C1-contribution of the 1st structure to the sill; C2-contribution of the 2nd
structure to the sill; sill has been
standardized to value of 1.
The first rotation uses a left hand rule around positive Z axis, the second rotation is a right
hand rule around positive X axis and finally the third rotation is a right hand rule around
positive Y axis. The nugget effect (C0) was modelled from the down-hole correlograms.
17.7 Carbonatite Solid Modeling
Geological interpretations were provided by Commerce to AMEC as 3D solids in DXF
format. The solids were created by Dahrouge geologists for the major lithologies with the
exception of gneiss which was left as a default. The carbonatite solids were provided as
39 structural (different strike, dip and / or pitch) domains. AMEC reviewed the geological
interpretations and 3D solids. Minor modifications were made to the solids to provide a
better agreement with the drilling and geological interpretation.
17.8 Block Model Dimensions
The block model consists of regular blocks and no rotation was used. The block model
framework parameters are listed in Table 17-4.
Table 17-4: Block Model Dimensions
Axis Origin* Block Size (m) No. of Blocks Model Extension (m)
X 352,350 5 250 1,250
Y 5,795,850 5 390 1,950
Z 925 2.5 244 610
Note: *Origin is defined as the bottom southwest corner of the model, located at the lowest combined northing and
easting coordinates and the lowest elevation

COMMERCE RESOURCES CORPORATION
BLUE RIVER TA-NB PROJECT
BLUE RIVER, BRITISH COLUMBIA
NI 43-101 TECHNICAL REPORT
Project No.: 162230 Page 17-6 31 January 2011
17.9 Assignment of Lithology and Specific Gravity to Blocks
Blocks in the block model were coded by lithology solids, and the volume of each lithology
solid was compared with the volume of the blocks inside a particular solid. A block was
tagged by a particular solid code if at least 50% of the block volume belonged to this solid.
The block model and corresponding lithology solid volumes compare within ±1%.
Resource block model specific gravity was not estimated; instead it was assigned to all
blocks in the block model (including blocks outside of carbonatite) as follows:
3.01 value was assigned to all blocks in carbonatite
2.97 value was assigned to all blocks in fenite
2.82 value was assigned to all blocks in gneiss
3.05 value was assigned to all blocks in amphibolites
2.62 value was assigned to all blocks in pegmatite.
All the above specific gravity values were derived as described in Section 13.4.
17.10 Block Model Grade Estimate
Ta2O5 and Nb2O5 grade was estimated in the carbonatite using both Ordinary Kriging (OK)
and Inverse Distance to power 3 (ID3) interpolation methods. A four pass interpolation
approach was used with each successive pass having greater search distances. A hard
boundary was used, meaning that composites from outside the carbonatite were ignored in
the interpolation process. Estimation was done separately within each limb of the
carbonatite folds. Thirty-nine different limbs / structural domains were identified and used
in the estimation process. They differ in the orientation of the search ellipse. Table 17-5
shows the estimation search parameters for Ta2O5 and Nb2O5.
Table 17-5: Estimation Parameters for Ta2O5 and Nb2O5
Domain Pass
Search Ellipse
Min. No.
Comp
Max. No.
Comp
Max. Comp. /Hole
Rotation (°) Ranges(m)
Z X Z X Y Z
Common to all domains
1 differ
by domain
differ by
domain
differ by
domain
50 50 10 5 8 2
2 100 100 10 3 8 2
3 150 150 10 2 8 2
4 300 300 50 2 8 2

COMMERCE RESOURCES CORPORATION
BLUE RIVER TA-NB PROJECT
BLUE RIVER, BRITISH COLUMBIA
NI 43-101 TECHNICAL REPORT
Project No.: 162230 Page 17-7 31 January 2011
The rotation angles of the search ellipse are the same for each pass, but they are different
for each of the 39 structural domains. They reflect average strike, dip, and pitch of each
fold limb / domain.
17.11 Block Model Validation
The block model grades were validated by visual inspection comparing composites to
block grades on screen, declustered global statistics checks, local biases checks using
swath plots, and finally model selectivity checks.
17.11.1 Visual Validation
AMEC completed a visual inspection of composites and blocks in vertical sections and
plan views. Figures 17-3 to 17-6 show colour-coded Ta2O5 or Nb2O5 composites and
corresponding ID3 block models on plan and in section. The model generally honours
both Ta2O5 and Nb2O5 data well, and grade extrapolation is well-controlled where sufficient
data exists.
Figure 17-3: Ta2O5 ID3 Model Within Carbonatite – plan 1146.25
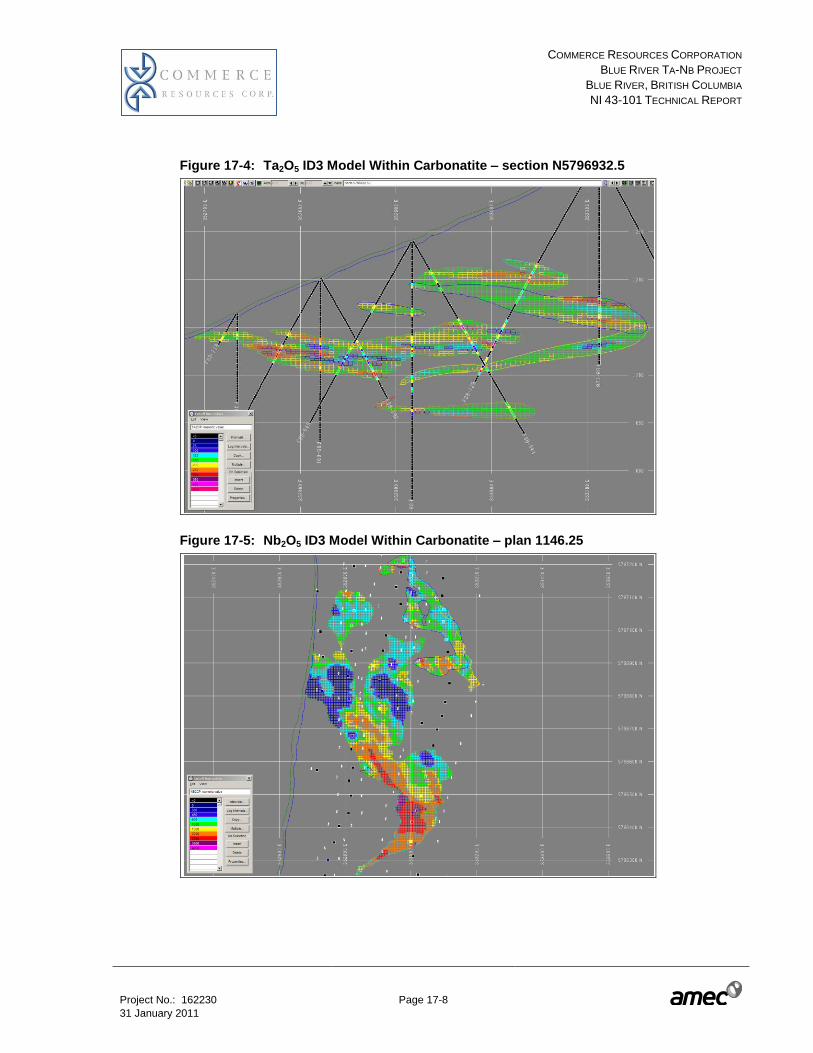
COMMERCE RESOURCES CORPORATION
BLUE RIVER TA-NB PROJECT
BLUE RIVER, BRITISH COLUMBIA
NI 43-101 TECHNICAL REPORT
Project No.: 162230 Page 17-8 31 January 2011
Figure 17-4: Ta2O5 ID3 Model Within Carbonatite – section N5796932.5
Figure 17-5: Nb2O5 ID3 Model Within Carbonatite – plan 1146.25

COMMERCE RESOURCES CORPORATION
BLUE RIVER TA-NB PROJECT
BLUE RIVER, BRITISH COLUMBIA
NI 43-101 TECHNICAL REPORT
Project No.: 162230 Page 17-9 31 January 2011
Figure 17-6: Nb2O5 ID3 Model Within Carbonatite – section N5796932.5
17.11.2 Global Grade Bias Check
The OK and ID3 block models were checked for global bias by comparing the average
grade (with no cut-off) from these models with that obtained from nearest-neighbour (NN)
model estimates (Table 17-6). The nearest-neighbour estimator produces a theoretically
globally unbiased estimate of the average value when no cut-off grade is imposed and is a
good basis for checking the performance of the different estimation methods. Table 17-6
shows that global biases are well below the recommended AMEC guidelines of ±5%
(relative difference).
Table 17-6: Mean Grades for NN, OK and ID3 Models
Model Ta2O5 Nb2O5
Nearest Neighbour 185.1 1,394.8
Inverse Distance (ID3) 185.6 1,377.5
Ordinary Kriging (OK) 185.6 1,391.6
% Diff (ID3 – NN)/NN 0.3% -1.2%
% Diff (OK – NN)/NN 0.3% -0.2%
AMEC also estimated the impact of outlier capping on the estimated global mean of the
model. A comparison of global means of capped and uncapped OK and ID3 models

COMMERCE RESOURCES CORPORATION
BLUE RIVER TA-NB PROJECT
BLUE RIVER, BRITISH COLUMBIA
NI 43-101 TECHNICAL REPORT
Project No.: 162230 Page 17-10 31 January 2011
showed the amount of metal removed by capping is minor (0.1% for Ta2O5 and 0.3%
Nb2O5).
17.11.3 Local Grade Bias Check (Swath Plots)
Checks for local biases were performed for Ta2O5 and Nb2O5 by creating and analyzing
local trends in the grade estimates using swath plots. This was done by plotting the mean
values from the NN estimate versus the OK / ID3 estimates in east-west, north-south and
vertical swaths or increments. Swath intervals are 50 m in both the northerly and easterly
directions, and 10 m vertically. Swath plot checks using only Indicated blocks for the ID3
Ta2O5 model are shown on Figure 17-7. Figure 17-8 shows corresponding swath plots for
Nb2O5.
Figure 17-7: Swath Plot for Ta2O5 ID3 Model

COMMERCE RESOURCES CORPORATION
BLUE RIVER TA-NB PROJECT
BLUE RIVER, BRITISH COLUMBIA
NI 43-101 TECHNICAL REPORT
Project No.: 162230 Page 17-11 31 January 2011
Figure 17-8: Swath Plot for Nb2O5 ID3 Model
In the upper row of the swath plots, the black line represents the ID3 model grades, the red
line represents the NN model grades, and the blue line represents the composite grades.
In the lower row of swath plots, these lines represent the number of blocks contained in
each swath, and the number of composites. Because the NN model is declustered, it is a
better reference model to validate the resource block model. Composites are not
declustered and only provide an indicative check. Swath plot checks, conducted by
AMEC, show that there are no local biases between ID3 / OK and NN models for
estimated Ta2O5 and Nb2O5 in carbonatite.
17.11.4 Selectivity Check
Selectivity analysis for Ta2O5 and Nb2O5 was completed using the Discrete Gaussian
Model for change of support from composite size units to an SMU size. This was done
using AMEC in-house software (Herco). The aim of this analysis is to assess if the
estimated resource reasonably represents the recoverable resources (represented by
Herco curves) relative to the proposed mining method. The selectivity analysis assumed a
10 m by 10 m by 5 m block as the smallest selective mining unit (SMU) for Blue River.
The results of the Herco analysis are generally discussed in terms of smoothness. An
over-smoothed model may over estimate the tonnes and under estimate the grade. The
model with an appropriate amount of smoothing will follow the Herco grade and tonnage
curves for values corresponding to different economic, or grade cut-offs.

COMMERCE RESOURCES CORPORATION
BLUE RIVER TA-NB PROJECT
BLUE RIVER, BRITISH COLUMBIA
NI 43-101 TECHNICAL REPORT
Project No.: 162230 Page 17-12 31 January 2011
The Herco analyses were undertaken using only Indicated blocks in order to obtain a good
understanding of the model selectivity, or smoothness. Inferred blocks are often
extrapolated and are not recommended for use in this analysis. Herco grade–tonnage
curves checks using only Indicated blocks for ID3 Ta2O5 model are shown on Figure 17-9.
Figure 17-10 shows corresponding Herco checks for Nb2O5. On both graphs, the upward
trending blue line represents the ID3 model grades, while the paired red line represents the
Herco model grades. The downward trending blue line represents the ID3 model tonnage,
while the paired red line represents the Herco model tonnes.
The Herco selectivity analyses show that the Ta2O5 and Nb2O5 ID3 models are properly
smoothed. The ID3 model produces slightly higher average grades of Ta2O5 and Nb2O5
compared to the OK models above cut-off grades of 140 ppm Ta and 900 ppm Nb. The
ID3 model was chosen for tabulating the Blue River Mineral Resources as the OK model is
considered too smooth.
Figure 17-9: Herco Grade – Tonnage Curves for Ta2O5 ID3 Model
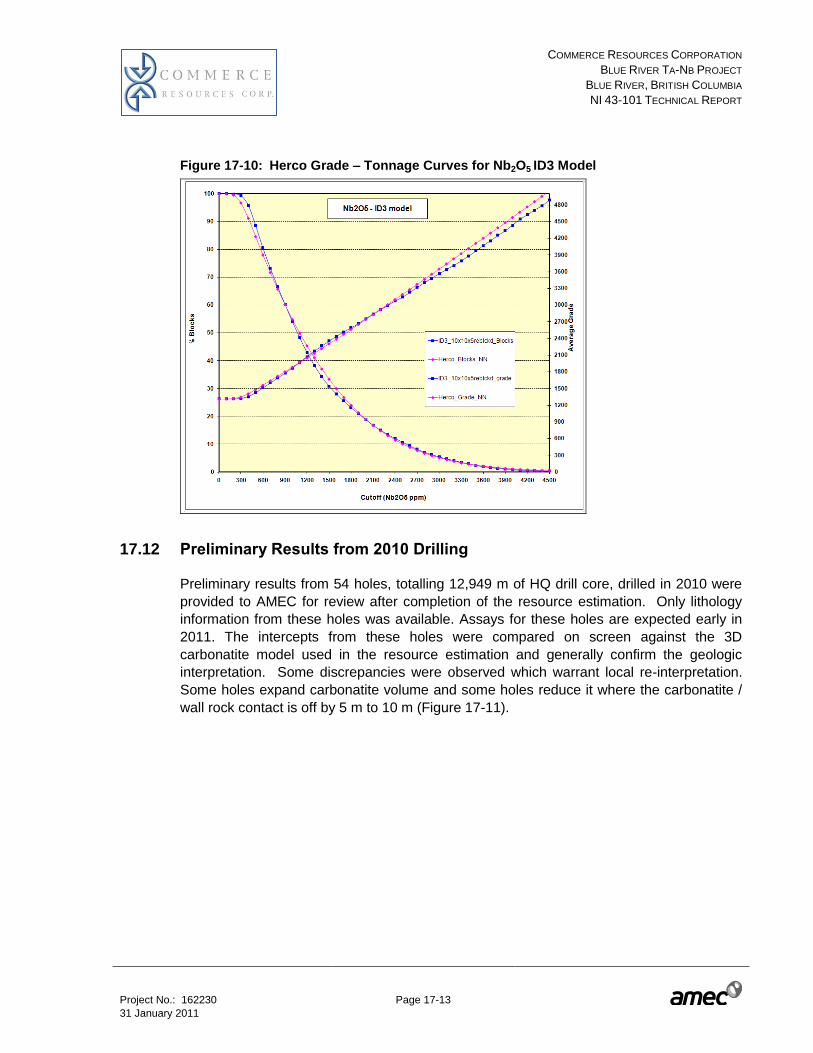
COMMERCE RESOURCES CORPORATION
BLUE RIVER TA-NB PROJECT
BLUE RIVER, BRITISH COLUMBIA
NI 43-101 TECHNICAL REPORT
Project No.: 162230 Page 17-13 31 January 2011
Figure 17-10: Herco Grade – Tonnage Curves for Nb2O5 ID3 Model
17.12 Preliminary Results from 2010 Drilling
Preliminary results from 54 holes, totalling 12,949 m of HQ drill core, drilled in 2010 were
provided to AMEC for review after completion of the resource estimation. Only lithology
information from these holes was available. Assays for these holes are expected early in
2011. The intercepts from these holes were compared on screen against the 3D
carbonatite model used in the resource estimation and generally confirm the geologic
interpretation. Some discrepancies were observed which warrant local re-interpretation.
Some holes expand carbonatite volume and some holes reduce it where the carbonatite /
wall rock contact is off by 5 m to 10 m (Figure 17-11).
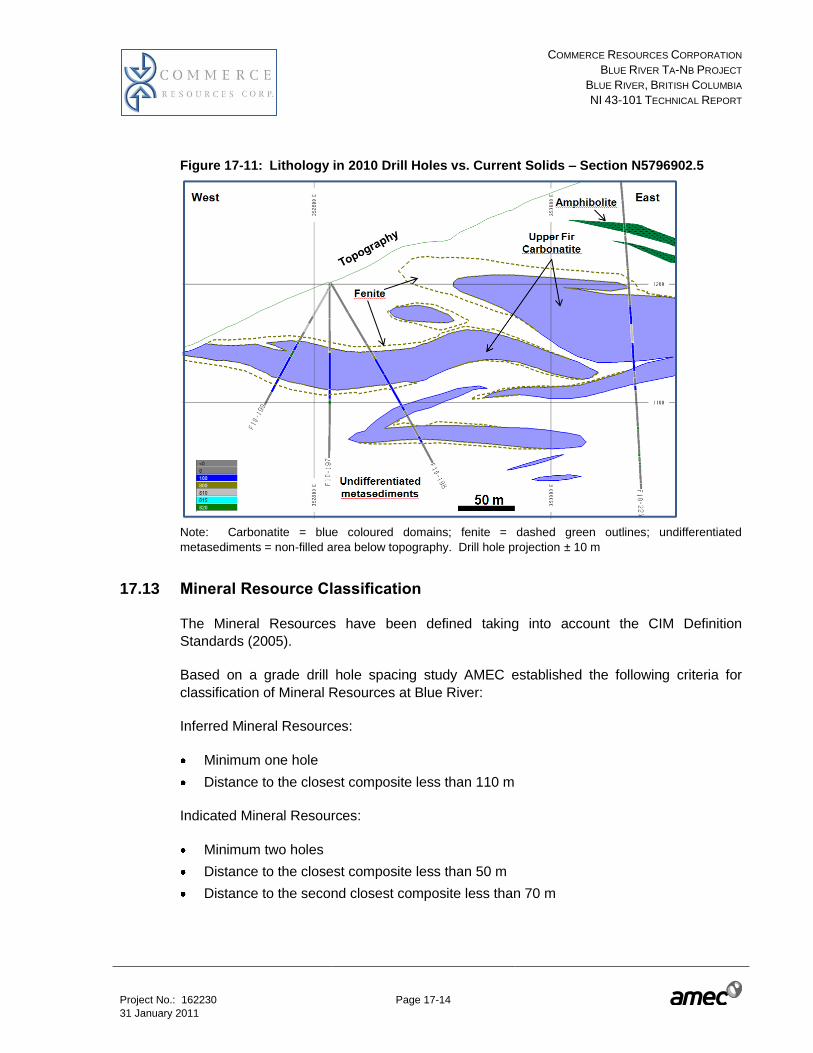
COMMERCE RESOURCES CORPORATION
BLUE RIVER TA-NB PROJECT
BLUE RIVER, BRITISH COLUMBIA
NI 43-101 TECHNICAL REPORT
Project No.: 162230 Page 17-14 31 January 2011
Figure 17-11: Lithology in 2010 Drill Holes vs. Current Solids – Section N5796902.5
Note: Carbonatite = blue coloured domains; fenite = dashed green outlines; undifferentiated
metasediments = non-filled area below topography. Drill hole projection ± 10 m
17.13 Mineral Resource Classification
The Mineral Resources have been defined taking into account the CIM Definition
Standards (2005).
Based on a grade drill hole spacing study AMEC established the following criteria for
classification of Mineral Resources at Blue River:
Inferred Mineral Resources:
Minimum one hole
Distance to the closest composite less than 110 m
Indicated Mineral Resources:
Minimum two holes
Distance to the closest composite less than 50 m
Distance to the second closest composite less than 70 m
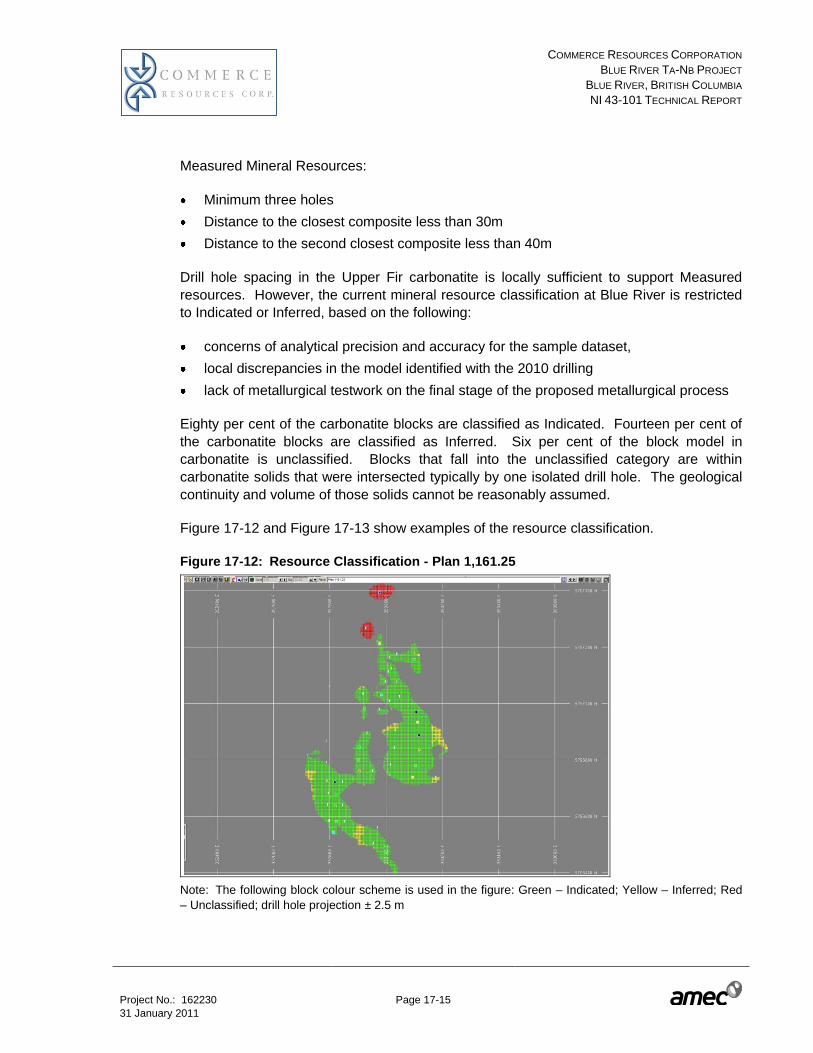
COMMERCE RESOURCES CORPORATION
BLUE RIVER TA-NB PROJECT
BLUE RIVER, BRITISH COLUMBIA
NI 43-101 TECHNICAL REPORT
Project No.: 162230 Page 17-15 31 January 2011
Measured Mineral Resources:
Minimum three holes
Distance to the closest composite less than 30m
Distance to the second closest composite less than 40m
Drill hole spacing in the Upper Fir carbonatite is locally sufficient to support Measured
resources. However, the current mineral resource classification at Blue River is restricted
to Indicated or Inferred, based on the following:
concerns of analytical precision and accuracy for the sample dataset,
local discrepancies in the model identified with the 2010 drilling
lack of metallurgical testwork on the final stage of the proposed metallurgical process
Eighty per cent of the carbonatite blocks are classified as Indicated. Fourteen per cent of
the carbonatite blocks are classified as Inferred. Six per cent of the block model in
carbonatite is unclassified. Blocks that fall into the unclassified category are within
carbonatite solids that were intersected typically by one isolated drill hole. The geological
continuity and volume of those solids cannot be reasonably assumed.
Figure 17-12 and Figure 17-13 show examples of the resource classification.
Figure 17-12: Resource Classification - Plan 1,161.25
Note: The following block colour scheme is used in the figure: Green – Indicated; Yellow – Inferred; Red
– Unclassified; drill hole projection ± 2.5 m

COMMERCE RESOURCES CORPORATION
BLUE RIVER TA-NB PROJECT
BLUE RIVER, BRITISH COLUMBIA
NI 43-101 TECHNICAL REPORT
Project No.: 162230 Page 17-16 31 January 2011
Figure 17-13: Resource Classification – Section N 5,796,882.5
Note: The following block colour scheme is used in the figure: Green – Indicated; Yellow – Inferred; Red
– Unclassified; drill hole projection ± 30 m; view north.
17.14 Reasonable Prospects for Economic Extraction
To assess reasonable prospects for economic extraction, AMEC considered the concept of
mining the Blue River deposit utilizing variations of room and pillar methods under a
conceptual scenario that considers mining and processing at a rate of 7,500 tonnes per
day. Mining and economic parameters were adjusted from AMEC’s experience with
analogous deposits and mining methods.
17.14.1 Market Study
Commerce has prepared assessments of the tantalum and niobium markets which outline
the supply and demand for tantalum and niobium. The tantalum assessment was
prepared by a tantalum market expert, although he is not independent of Commerce. His
analysis reflects the general consensus of other analysts regarding the tantalum market
expressed in publicly available information. The niobium assessment was prepared by an
independent niobium expert and also reflects the general consensus of analysts in publicly
available information for the niobium market.
As the Project is still at an early evaluation stage, Commerce has not initiated requests
from potential buyers for expression of interests from potential buyers of the proposed Blue
River products and has not negotiated any purchase or off-take agreements.

COMMERCE RESOURCES CORPORATION
BLUE RIVER TA-NB PROJECT
BLUE RIVER, BRITISH COLUMBIA
NI 43-101 TECHNICAL REPORT
Project No.: 162230 Page 17-17 31 January 2011
17.14.2 Commodity Price
Tantalum
Tantalum is commonly quoted in two separate forms:
Ta2O5 in tantalite concentrate: a non-refined, tantalum-bearing concentrate of variable
composition and trace element content
Tantalum metal scrap (99.9% pure Ta): this form of tantalum product receives a
premium price in the market relative to tantalite concentrate
Over the last six years tantalite concentrate prices ranged from US$75/kg contained Ta2O5
to US$100/kg contained Ta2O5 (US$35/lb to US$45/lb). In the same period tantalum metal
scrap prices ranged from US$110/kg Ta to US$180/kg Ta metal (US$50/lb to US$80/lb).
In 2010, prices rose dramatically in response to changing market conditions including
reduced production, increased concerns about conflict-tantalum production in Africa,
depletion of known strategic stockpiles, and curtailed exports from China. In mid-October
2010 the price for Ta2O5 in tantalite concentrate was US$195/kg and for tantalum metal
scrap was US$280/kg.
The higher price for tantalum metal scrap compared to the price for Ta2O5 in concentrate is
considered a proxy to the added value Commerce should recognize by refining the Blue
River concentrate to high purity Ta2O5.
In AMEC’s opinion, the base case price for tantalum metal scrap is reasonable for
constraining Mineral Resources based on recent market conditions, but notes it is
significantly higher than historical prices. There is a risk that using current price
assumptions may not reflect the long term price of Ta and Nb, particularly in the present
volatile market conditions.
Niobium
Niobium generally trades as Nb metal, or ferroalloy, and the price has remained relatively
constant at US$44/kg Nb metal (US$20/lb Nb) over the last several years. A base case
price of US$46/kg Nb metal was assumed.
Comment on Price Assumptions
The cut-off grade assumptions at US$317/kg tantalum metal and US$46/kg niobium metal
are slightly more optimistic than current price assumptions of US$280/kg tantalum metal
price and US$44/kg niobium metal price. AMEC considers the slightly higher price
assumption is appropriate and is consistent with industry practices of using more optimistic

COMMERCE RESOURCES CORPORATION
BLUE RIVER TA-NB PROJECT
BLUE RIVER, BRITISH COLUMBIA
NI 43-101 TECHNICAL REPORT
Project No.: 162230 Page 17-18 31 January 2011
assumptions regarding inputs for resource estimation than what would be used for
estimating mineral reserves.
17.14.3 Physical Assumptions
Tantalum-niobium mineralization is hosted in carbonatite
Continuous mineralization is found in moderately flat and wide carbonatite bodies with
modest dips.
Mineralized areas 20 to 70m in height are expected in several zones
Steep topography provides access to the mineralized areas in the form of adits on the
hillsides
Fair to good rock conditions are expected in the majority of the deposit
Identified faulted zones may require wider pillars to avoid unstable mining conditions.
17.14.4 Operational Considerations
Underground mining method envisaged is room and pillar with backfill in most areas
70% of the resources could be recovered by mining with 30% of the resource expected
to remain as unrecoverable pillars for stability considerations
A bulk mining method with minimum stope size of 10m x10m rooms with 15m height is
assumed in order to attain a relatively high production rate of 7,500 tonnes per day
A more selective method with stopes size of 10m x 10 m rooms with 5m height is
assumed to capture material located on the thinner edges of the mineralized zones
An external dilution factor was not considered during this estimation
The concentration method considered is flotation followed by a refining process on site;
global recoveries to obtain metal grade products were assumed at 65% for tantalum
and 68% for niobium.
17.14.5 Economic Assumptions
Most of the operating cost assumptions were extrapolated from previous studies prepared
by AMEC (all figures in USD):
Mining and backfilling cost $32.00/tonne
Processing and refining cost $17.00/tonne
General and Administration $ 2.70/tonne
Base case scenario price of tantalum $317/kg Ta
Price of Niobium $46/kg Nb

COMMERCE RESOURCES CORPORATION
BLUE RIVER TA-NB PROJECT
BLUE RIVER, BRITISH COLUMBIA
NI 43-101 TECHNICAL REPORT
Project No.: 162230 Page 17-19 31 January 2011
17.14.6 Economic Cut-off
Block Unit Value
The block model was adapted to represent the two payable metal contents in terms of
Block Unit Value (BUV) in $/t using the following formula:
BUV = (Ta2O5 grade in ppm * Ta recovery factor * Ta price in $/g *
proportion of 2Ta:Ta2O5) + (Nb2O5 grade in ppm * Nb recovery factor * Nb
price in $/g * proportion of 2Nb:Nb2O5)
For the base case scenario:
BUV = (Ta2O5 * 0.654 * 0.317 * 0.819) + ( Nb2O5 * 0.682 * 0.046 * 0.699 )
Considering the direct operating costs, a cut-off value of $52/t was considered for the
material to be mined by the bulk method and a cut-off value of $59/t for the material to be
mined by the selective method.
The tool “Stope Analyzer” from Vulcan® was utilized to identify the blocks that exceed the
cut-off value while complying with the aggregation constraint of the specified minimum
stope size. This tool “floats” a stope with the specified dimensions and flags each block
when the average block unit value of the contained blocks within a stope exceeds the
designated cut-off value.
For constraining resources deemed to be mined by underground methods, the use of this
tool as an alternative to a conventional economic grade-shell provides an advantage based
on the ability to aggregate blocks into the minimum stope dimensions and the automatic
elimination of outliers that do not comply with this condition.
17.15 Mineral Resource Statement
The Mineral Resources were classified in accordance with the 2005 CIM Definition
Standards for Mineral Resources and Mineral Reserves, whose definitions are
incorporated by reference into NI 43-101.
Table 17-7 shows the estimated Mineral Resources. The Indicated Mineral Resources are
36.35 million tonnes containing 195 ppm Ta2O5 and 1,700 ppm Nb2O5. Inferred Mineral
Resources are 6.40 million tonnes containing 199 ppm Ta2O5 and 1,890 ppm Nb2O5.
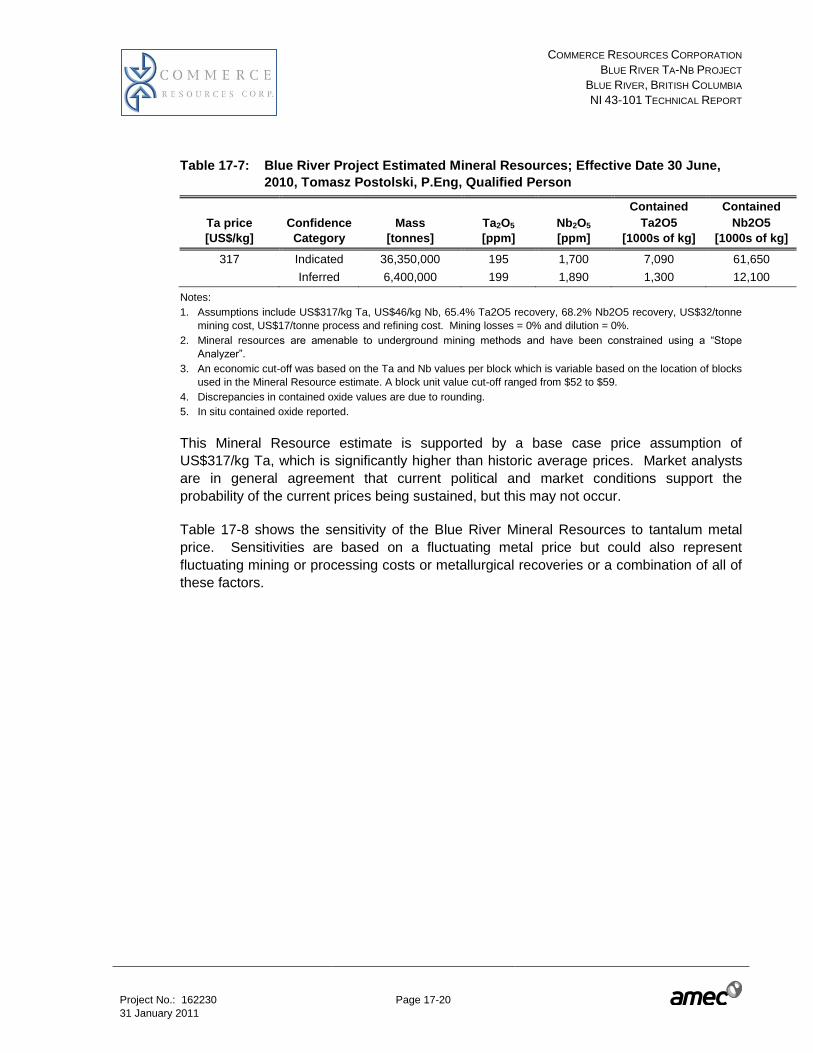
COMMERCE RESOURCES CORPORATION
BLUE RIVER TA-NB PROJECT
BLUE RIVER, BRITISH COLUMBIA
NI 43-101 TECHNICAL REPORT
Project No.: 162230 Page 17-20 31 January 2011
Table 17-7: Blue River Project Estimated Mineral Resources; Effective Date 30 June,
2010, Tomasz Postolski, P.Eng, Qualified Person
Ta price
[US$/kg]
Confidence
Category
Mass
[tonnes]
Ta2O5
[ppm]
Nb2O5
[ppm]
Contained
Ta2O5
[1000s of kg]
Contained
Nb2O5
[1000s of kg]
317 Indicated 36,350,000 195 1,700 7,090 61,650
Inferred 6,400,000 199 1,890 1,300 12,100
Notes:
1. Assumptions include US$317/kg Ta, US$46/kg Nb, 65.4% Ta2O5 recovery, 68.2% Nb2O5 recovery, US$32/tonne
mining cost, US$17/tonne process and refining cost. Mining losses = 0% and dilution = 0%.
2. Mineral resources are amenable to underground mining methods and have been constrained using a “Stope
Analyzer”.
3. An economic cut-off was based on the Ta and Nb values per block which is variable based on the location of blocks
used in the Mineral Resource estimate. A block unit value cut-off ranged from $52 to $59.
4. Discrepancies in contained oxide values are due to rounding.
5. In situ contained oxide reported.
This Mineral Resource estimate is supported by a base case price assumption of
US$317/kg Ta, which is significantly higher than historic average prices. Market analysts
are in general agreement that current political and market conditions support the
probability of the current prices being sustained, but this may not occur.
Table 17-8 shows the sensitivity of the Blue River Mineral Resources to tantalum metal
price. Sensitivities are based on a fluctuating metal price but could also represent
fluctuating mining or processing costs or metallurgical recoveries or a combination of all of
these factors.

COMMERCE RESOURCES CORPORATION
BLUE RIVER TA-NB PROJECT
BLUE RIVER, BRITISH COLUMBIA
NI 43-101 TECHNICAL REPORT
Project No.: 162230 Page 17-21 31 January 2011
Table 17-8: Blue River Project Sensitivity of Estimated Mineral Resources to Tantalum
Price; Effective Date 30 June, 2010, Tomasz Postolski, P.Eng, Qualified
Person
Ta price
[US$/kg]
Confidence
Category
Mass
[tonnes]
Ta2O5
[ppm]
Nb2O5
[ppm]
Contained
Ta2O5
[1000s of kg]
Contained
Nb2O5
[1000s of kg]
470 Indicated 51,130,000 188 1,410 9,610 72,300
Inferred 8,100,000 192 1,700 1,600 13,800
381 Indicated 44,430,000 192 1,530 8,530 68,020
Inferred 7,300,000 196 1,780 1,400 13,000
317 Indicated 36,350,000 195 1,700 7,090 61,650
Inferred 6,400,000 199 1,890 1,300 12,100
272 Indicated 29,990,000 197 1,850 5,910 55,480
Inferred 5,500,000 201 2,010 1,100 11,100
238 Indicated 25,130,000 197 2,000 4,950 50,240
Inferred 4,900,000 202 2,110 1,000 10,400
Notes:
1. Ta price was varied and all other assumptions remain the same as base case.
2. Base case is in bold.
3. Mineral resources are amenable to underground mining methods and have been constrained using a “Stope
Analyser”.
4. Discrepancies in contained oxide values are due to rounding.
5. In situ contained oxide reported.
The Mineral Resources have been assessed for reasonable prospects for economic
extraction using assumptions based on similar deposits. Economic viability of the Mineral
Resource can only be demonstrated by Pre-Feasibility and Feasibility Studies, and there is
no assurance that the stated resources can be upgraded in confidence and converted to
mineral reserves. Further, since underground mining methods are envisioned (room and
pillar or variants), the mining recovery may vary from 65% to 85% depending on the
success in which pillars can be mined on retreat and/or fill is utilized.

COMMERCE RESOURCES CORPORATION
BLUE RIVER TA-NB PROJECT
BLUE RIVER, BRITISH COLUMBIA
NI 43-101 TECHNICAL REPORT
Project No.: 162230 Page 18-1 31 January 2011
18.0 ADDITIONAL REQUIREMENTS FOR TECHNICAL REPORTS ON
DEVELOPMENT PROPERTIES AND PRODUCTION PROPERTIES
This section is not relevant as the Project is not a development or production property.

COMMERCE RESOURCES CORPORATION
BLUE RIVER TA-NB PROJECT
BLUE RIVER, BRITISH COLUMBIA
NI 43-101 TECHNICAL REPORT
Project No.: 162230 Page 19-1 31 January 2011
19.0 OTHER RELEVANT INFORMATION
AMEC is not aware of any other relevant data or required information for inclusion to make
the report more understandable and not misleading.

COMMERCE RESOURCES CORPORATION
BLUE RIVER TA-NB PROJECT
BLUE RIVER, BRITISH COLUMBIA
NI 43-101 TECHNICAL REPORT
Project No.: 162230 Page 20-1 31 January 2011
20.0 INTERPRETATION AND CONCLUSIONS
Commerce and its contractor Dahrouge have executed a professional work program that
has resulted in the delineation of a tantalum and niobium resource.
The Blue River Mineral Resources have the following characteristics:
The mineralization is hosted by a polyfolded carbonatite sill swarm averaging 30 m
thick and 1,100 m long.
Close-spaced drilling has confirmed local continuity of the carbonatite.
Tantalum and niobium occur as ferrocolumbite and pyrochlore which are amenable to
conventional flotation and proven refining processes with estimated recoveries of 65%
to 70%.
Optimization of the supply and pricing of reagents for the refining process may support
lower operating cost assumptions.
The Mineral Resource estimate is based on information of reasonable quality.
There are reasonable prospects for economic extraction.
Flat to moderate dips, allow large-scale room-and pillar mining
Geotechnical work completed to date is suitable to support a pre-feasibility study.
The risk factors are:
The base case Mineral Resource estimate is supported by current price assumptions
which are significantly higher than historic average prices. Market analysts are in
general agreement that current political and market conditions support the probability
of the current prices being sustained, but this may not occur.
Metallurgical testing has not yet been able to demonstrate a 35% Ta2O5 concentrate
grade as a feed for the refining stage.
The proposed refining methods have been used in commercial applications but have
not been demonstrated in test work of Blue River material.
Mining recovery is assumed at 70% but could be lower and dilution increased in areas
with moderate dips greater than 10°.
The existence of extensional faults may have caused unrecognized displacements of
greater than 10 m in the carbonatite. Such offsets would certainly impact deposit
geometry and future mine designs.
Uranium and thorium are present in the resource and waste rocks. Any radon
produced in the mine and process plant is likely manageable with ventilation, dust

COMMERCE RESOURCES CORPORATION
BLUE RIVER TA-NB PROJECT
BLUE RIVER, BRITISH COLUMBIA
NI 43-101 TECHNICAL REPORT
Project No.: 162230 Page 20-2 31 January 2011
control, and monitoring. Expected capex and opex costs will not be significantly
increased as a result of these safety measures.
Exploration programs completed on the Blue River Project have met their objective of
identifying tantalum and niobium mineralization that has reasonable prospects of economic
extraction. Additional work required to assess potential mining and milling methods that
are suitable to the local geology and mineralization style and that can support an economic
mining operation is on-going.

COMMERCE RESOURCES CORPORATION
BLUE RIVER TA-NB PROJECT
BLUE RIVER, BRITISH COLUMBIA
NI 43-101 TECHNICAL REPORT
Project No.: 162230 Page 21-1 31 January 2011
21.0 RECOMMENDATIONS
AMEC recommends a work program for an estimated total cost of CDN$4.35 M. The
recommendations are based on the stated Mineral Resource estimate and the assumed
commodity price assumptions. A summary of recommended work and estimated costs is
shown in Table 21-1.
The recommended program involves completing the on-going PA and updating the Mineral
Resource block model with 2010 drilling data and interpretations. Recommendations also
includes field work and supporting studies to prepare for more advanced studies.
The field work includes 8,250 m of HQ diameter diamond drilling, a re-sampling program,
metallurgical testwork, soil geochemistry surveys, analyses, geo-metallurgy studies,
structural geology studies, marketing studies, core farm security improvements, manpower
and field support costs. A mineral resource update is recommended upon completion of
the recommended field program.
Limitations on classification confidence applied to the current Resource estimate due to
precision and accuracy concerns could be removed through a re-assay program. A staged
re-assay program on remaining pulps or rejects is recommended. An initial program should
focus on re-assaying samples within an area where the first 3 to 5 years of mining is likely
to occur. This recommendation assumes improvements recently achieved in the laboratory
for assaying tantalum and niobium are maintained.
Table 21-1: Recommendations Summary
Topic Estimated Cost
Complete on-going PA $ 100,000
Geologic Interpretation, Data Reviews, and Mineral Resource Update (2010 drilling) $ 120,000
2011 Field Based and Studies Program
Project Management, Claims, Socio-Economic, and Office Based Work $ 670,000
2011 Drilling: Upgrade Inferred or Indicated for Mine Plan (Years 1 to 3) $ 1,010,000
2011 Drilling: Test for Fault Offsets $ 1,070,000
Assay QAQC Re-sampling Program $ 20,000
Metallurgical Testwork $ 350,000
Non-drilling Manpower, Field Costs, Transport, Safety $ 520,000
Geo-metallurgical and Structural Geology Studies $ 150,000
Soil Geochemistry Analyses $ 30,000
Core Farm Security $ 80,000
Marketing Studies $ 50,000
Geologic Interpretation, Data Reviews, and Mineral Resource Update (2011 drilling) $ 180,000
Total $ 4,350,000

COMMERCE RESOURCES CORPORATION
BLUE RIVER TA-NB PROJECT
BLUE RIVER, BRITISH COLUMBIA
NI 43-101 TECHNICAL REPORT
Project No.: 162230 Page 21-2 31 January 2011
21.1 Comment on Section 20
The Project is subject to Commerce’s management objectives, market conditions, and
commodity prices. Based on the assumed commodity price assumptions and the stated
Mineral Resource estimate, it is AMEC’s opinion that all or significant portions of the
recommendations are reasonable for the Project.

COMMERCE RESOURCES CORPORATION
BLUE RIVER TA-NB PROJECT
BLUE RIVER, BRITISH COLUMBIA
NI 43-101 TECHNICAL REPORT
Project No.: 162230 Page 22-1 31 January 2011
22.0 DATE AND SIGNATURE PAGE
The effective date of this Technical Report, addressed to Commerce Resources
Corporation, and entitled “Blue River Ta-Nb Project, Blue River, British Columbia,
NI 43-101 Technical Report” is 31 January 2011.
On behalf of AMEC Americas Limited.
“Signed”
Michael Radcliffe
Operations Manager, Mining & Metals
AMEC Americas Limited
Dated: 31 January 2011

COMMERCE RESOURCES CORPORATION
BLUE RIVER TA-NB PROJECT
BLUE RIVER, BRITISH COLUMBIA
NI 43-101 TECHNICAL REPORT
Project No.: 162230 Page 23-1 31 January 2011
23.0 REFERENCES
Aaquist, B. (1982a). Blue River Carbonatites, British Columbia, Final Report. B.C. Min.
Energy, Mines Petr. Res. Ass. Rept. 10 274, 30 p.
Aaquist, B. (1982b). Assessment Report Blue River Carbonatites, British Columbia,; B.C.
Min. Energy Mines Petr. Res. Ass. Rept. 11 130, 15 p.
Aaquist, B. (1982c). Assessment Report on Verity First 1,2,3, Claims, Blue River British
Columbia. B.C. Min. Energy Mines Petr. Res. Ass. Rept. 10 955.
Birkett, T.C. and Simandl, G.J. (1999): Carbonatite-associated Deposits: Magmatic,
Replacement and Residual; in Selected British Columbia Mineral Deposit Profiles,
Volume 3, Industrial Minerals, G.J. Simandl, Z.D. Hora and D.V. Lefebure, Editors,
British Columbia Ministry of Energy and Mines.
Canadian Institute of Mining, Metallurgy and Petroleum (CIM), (2005). CIM Standards for
Mineral Resources and Mineral Reserves, Definitions and Guidelines: Canadian
Institute of Mining, Metallurgy and Petroleum, December 2005,
http://www.cim.org/committees/CIMDefStds_Dec11_05.pdf
Chudy, T. (2008). Mineralogical Report on samples from the Upper Fir Carbonatite, Blue
River, British Columbia. PART A: Petrographic description; PART B: Mineral
Liberation Analysis. December 2008.
Chudy, T. (2010). The niobium-tantalum mineralization in the Upper Fir carbonatite: a
summary of current knowledge. 4 p.
Currie, K.L. (1976). The Alkaline Rocks of Canada. Geol. Surv. Can., Bull. 239, 228 p.
Dahrouge, J. (2001a). 2000 Geologic Mapping and Sampling on the Verity Property. B.C.
Min. Energy, Mines Petr. Res. Ass. Rept 26550, 7 p.
Dahrouge, J. (2001b). 2000 Geologic Mapping and Sampling on the Fir Property. B.C. Min.
Energy, Mines Petr. Res. Ass. Rept 26549, 7 p.
Dahrouge, J. and Reeder J. (2001). 2001 Geologic Mapping, Sampling and Geophysical
Surveys on the Mara Property. B.C. Min. Energy, Mines Petr. Res. Ass. Rept.
26733, 14 p.
Dahrouge, J. & Reeder J. (2002). 2001 Geologic Mapping, Sampling and Geophysical
Surveys on the Fir Property. B.C. Min. Energy, Mines Petr. Res. Ass. Rept. 26781,
9 p.
COMMERCE RESOURCES CORPORATION
BLUE RIVER TA-NB PROJECT
BLUE RIVER, BRITISH COLUMBIA
NI 43-101 TECHNICAL REPORT
Project No.: 162230 Page 23-2 31 January 2011
Davis, C. (2006). 2005 Diamond Drilling and Exploration at the Blue River Property. B.C.
Min. Energy Mines Petr. Res. Ass. Rept, 10 p.
Diegel, S.G., Ghent, E.D., and Simony, P.S. (1989). Metamorphism and Structure of the
Mount Cheadle area, Monashee Mountains. In Current Research, Part E, Geol.
Surv. Can., Paper 89-1E, pp. 95-100.
Ghent, E.D., Simony, P.S., Mitchell, W., Perry, J., Robbins, D. and Wagner, J. (1977).
Structure and Metamorphism in the Southeast Canoe River area, British Columbia.
In Report of Activities, Part C, Geological Survey of Canada, Paper 77-1C, pp. 13-
17.
Gervais, F. (2009). Personal Communication to John Gorham.
Gorham. J. (2007). Technical Report on the Upper Fir Ta-Nb Bearing Carbonatite 20-June-
2007, 48 p. plus appendices.
Gorham, J. (2008). Report on 2007 Diamond Drilling and Exploration at the Blue River
Property 20-June-2008, 48 p. plus appendices and maps.
Gorham, J., Ulry, B. And Brown, J., (2009) 2008 Diamond Drilling and Exploration at the
Blue River Property, Kamloops Mining Division B.C Ministry of Energy, Mines and
Petroleum Resources, Assessment Report 31174, 79 p (plus appendices and
maps)..
Klohn, Crippen Berger, (2009a). Blue River-Upper Fir Deposit Tailings and Waste Rock
Scoping Study; Prepared for Commerce Resources Corp.
Klohn, Crippen Berger, (2009b). Valemount Tailings Storage Options Scoping Study;
Prepared for Commerce Resources Corp.
Kraft, J. (2010). Structural geology of the Upper Fir carbonatite deposit, Blue River, British
Columbia. Confidential report for Dahrouge Geological Consulting Ltd. and
Commerce Resources Corp., 15 p.
Mariano, A.N. (1982). Petrology, Mineralogy and Geochemistry of the Blue River
Carbonatites. Confidential report, 130 p.
Mariano, A.N. (2000). Personal communication to J. Dahrouge.
MESH Environmental Inc. (2008). Static test characterization of rock units from the Upper
Fir deposit, Blue River tantalum-niobium project. Confidential report prepared for
Commerce Resources, August 2008.
COMMERCE RESOURCES CORPORATION
BLUE RIVER TA-NB PROJECT
BLUE RIVER, BRITISH COLUMBIA
NI 43-101 TECHNICAL REPORT
Project No.: 162230 Page 23-3 31 January 2011
MESH Environmental Inc. (2009). Static test characterization of rock units from the Upper
Fir deposit, Blue River tantalum-niobium project. Phase 2 static test report.
Confidential report prepared for Commerce Resources, April 2009.
McCrea, J. (2001). Summary Report on the Blue River Carbonatite Property, East-Central
British Columbia. Prepared for Commerce Resources Corp., 34 p.
McCrea, J. (2002). Fir Carbonatite Property, Resource Estimate. Prepared for Commerce
Resources Corp.
Mitchell, R.H., 2010b. Niobium mineralization in carbonatites: parageneses and origins.
In International Workshop of Geology of Rare Metals, edited by Simandl, G.J. and
Lefebure, D.V., extended abstracts volume, November 9-10, 2010, Victoria,
Canada British Columbia Geological Survey, Open File 2010-10, pp 13-14.
Pell, J. (1987). Alkaline Ultrabasic Rocks in British Columbia: Carbonatites, Nepheline
Syenites, Kimberlites and Related Rocks. B.C. Min. Energy, Mines Petr. Res.
Open File 1987-17, 109 p.
Pell, J. (1994). Carbonatites, Nepheline Syenites, Kimberlites and Related Rocks in British
Columbia. B.C. Min. Energy, Mines, Petr. Res., Bulletin 88, 136 p.
Pell, J. and Hoy, T. (1989). Carbonatites in a Continental Margin Environment - the
Canadian Cordillera. In Pp. 200 – 220: Carbonatites: Genesis and Evolution (K.
Bell, ed.). Unwin Hyman, London, UK.
Raeside, R.P. and Simony, P.S. (1983). Stratigraphy and Deformational History of the
Scripp Nappe, Monashee Mountains, British Columbia. Canadian Journal of Earth
Sciences, 20, pp. 639-650.
Rukhlov, A and Gorham, J. (2007) 2006 Diamond Drilling and Exploration at the Blue River
Property B.C., Min. Energy, Mines Petr. Res. Ass. Rept. 29024, 383 p. with
appendices.
Simonetti, A. (2008). Personal communication to John Gorham.
Simony, P.S., Ghent, E.D., Craw, D, Mitchell, W., and Robbins, D.B. (1980). Structural and
Metamorphic Evolution of the Northeast Flank of the Shuswap Complex, Southern
Canoe River Area, British Columbia. Geological Society of America, Memoir 153,
pp. 445-461.
Smith, M. and Dahrouge, J. (2002a). 2001 Diamond Drilling on the Fir Property. B.C. Min.
Energy, Mines Petr. Res. Ass. Rept. 26911, 13 p. with appendices.

COMMERCE RESOURCES CORPORATION
BLUE RIVER TA-NB PROJECT
BLUE RIVER, BRITISH COLUMBIA
NI 43-101 TECHNICAL REPORT
Project No.: 162230 Page 23-4 31 January 2011
Smith, M. and Dahrouge, J. (2003). 2002 Diamond Drilling and Exploration on the Blue
River Property. B.C. Min. Energy, Mines Petr. Res. Ass. Rept. 27131, 20 p. with
appendices.
Smith, T (2008). Terrain stability study for the development of an environmental baseline
for the Fir Property near Blue River B.C. Confidential report prepared for
Commerce Resources Corp.
Stone, M., and Selway, J., 2010. Independent Technical Report, Blue River Property, Blue
River, British Columbia, Canada. 116 p.
White, G.P.E. (1985). Further notes on carbonatites in central British Columbia, B.C.
Ministry of Energy, Mines and Petroleum Resources, Geological Fieldwork, 1984,
Paper 1985-1, pp. 95-100.
Woolley, A.R. and Kempe, D.R.C. (1989). Carbonatites: Nomenclature, Average Chemical
Compositions, and Element Distribution. In Pp. 1 – 37: Carbonatites, Genesis and
Evolution (K. Bell, ed.). Unwin Hyman, London.
COMMERCE RESOURCES CORPORATION
BLUE RIVER TA-NB PROJECT
BLUE RIVER, BRITISH COLUMBIA
NI 43-101 TECHNICAL REPORT
Project No.: 162230 Appendix 31 January 2011
A P P E N D I X A
List of Claims
COMMERCE RESOURCES CORPORATION
BLUE RIVER TA-NB PROJECT
BLUE RIVER, BRITISH COLUMBIA
NI 43-101 TECHNICAL REPORT
Project No.: 162230 Appendix 31 January 2011
Tenure Number Claim Name Ownership
Tenure Type
Tenure Sub-Type
Map Number Issue Date Good To Date Area (ha)
374665 FIR 3 100% Mineral Claim 083D025 2000/feb/16 2019/mar/31 25.000
374670 FIR 8 100% Mineral Claim 083D035 2000/feb/16 2019/mar/31 25.000
380034 MARA 5 100% Mineral Claim 083D045 2000/aug/18 2019/mar/31 25.000
382164 FIR 11 100% Mineral Claim 083D035 2000/oct/28 2019/mar/31 500.000
506262 100% Mineral Claim 083D 2005/feb/08 2019/mar/31 98.623
506263 100% Mineral Claim 083D 2005/feb/08 2019/mar/31 295.727
506264 100% Mineral Claim 083D 2005/feb/08 2019/mar/31 236.800
506265 100% Mineral Claim 083D 2005/feb/08 2019/mar/31 79.069
506267 100% Mineral Claim 083D 2005/feb/08 2019/mar/31 98.817
506270 100% Mineral Claim 083D 2005/feb/08 2019/mar/31 1,225.766
506273 100% Mineral Claim 083D 2005/feb/08 2019/mar/31 1,619.061
506274 100% Mineral Claim 083D 2005/feb/08 2019/mar/31 1,244.470
506387 100% Mineral Claim 083D 2005/feb/09 2019/mar/31 98.638
506391 100% Mineral Claim 083D 2005/feb/09 2019/mar/31 39.459
506392 100% Mineral Claim 083D 2005/feb/09 2019/mar/31 39.460
506393 100% Mineral Claim 083D 2005/feb/09 2019/mar/31 39.447
506395 100% Mineral Claim 083D 2005/feb/09 2019/mar/31 39.452
506397 100% Mineral Claim 083D 2005/feb/09 2019/mar/31 19.728
506399 100% Mineral Claim 083D 2005/feb/09 2019/mar/31 79.084
506401 100% Mineral Claim 083D 2005/feb/09 2019/mar/31 39.542
506402 100% Mineral Claim 083D 2005/feb/09 2019/mar/31 19.768
506403 100% Mineral Claim 083D 2005/feb/09 2019/mar/31 19.766
506405 100% Mineral Claim 083D 2005/feb/09 2019/mar/31 19.765
506407 100% Mineral Claim 083D 2005/feb/09 2019/mar/31 591.699
506408 100% Mineral Claim 083D 2005/feb/09 2019/mar/31 118.380
506423 100% Mineral Claim 083D 2005/feb/09 2019/mar/31 591.653
506425 100% Mineral Claim 083D 2005/feb/09 2019/mar/31 157.847
506426 100% Mineral Claim 083D 2005/feb/09 2019/mar/31 39.439
506427 100% Mineral Claim 083D 2005/feb/09 2019/mar/31 19.717
506428 100% Mineral Claim 083D 2005/feb/09 2019/mar/31 551.916
506429 100% Mineral Claim 083D 2005/feb/09 2019/mar/31 78.924
506430 100% Mineral Claim 083D 2005/feb/09 2019/mar/31 414.436
506431 100% Mineral Claim 083D 2005/feb/09 2019/mar/31 315.765
506433 100% Mineral Claim 083D 2005/feb/09 2019/mar/31 533.482
506445 100% Mineral Claim 083D 2005/feb/09 2019/mar/31 355.921
506450 100% Mineral Claim 083D 2005/feb/09 2019/mar/31 236.589
506459 100% Mineral Claim 083D 2005/feb/09 2019/mar/31 473.370
506461 100% Mineral Claim 083D 2005/feb/09 2019/mar/31 315.725

COMMERCE RESOURCES CORPORATION
BLUE RIVER TA-NB PROJECT
BLUE RIVER, BRITISH COLUMBIA
NI 43-101 TECHNICAL REPORT
Project No.: 162230 Appendix 31 January 2011
Tenure Number Claim Name Ownership
Tenure Type
Tenure Sub-Type
Map Number Issue Date Good To Date Area (ha)
506464 100% Mineral Claim 083D 2005/feb/09 2019/mar/31 78.950
506466 100% Mineral Claim 083D 2005/feb/09 2019/mar/31 217.118
506468 100% Mineral Claim 083D 2005/feb/09 2019/mar/31 355.271
506473 100% Mineral Claim 083D 2005/feb/09 2019/mar/31 474.810
506475 100% Mineral Claim 083D 2005/feb/09 2019/mar/31 395.675
507391 100% Mineral Claim 083D 2005/feb/17 2019/mar/31 553.698
530510 LIGHTNING 100% Mineral Claim 083D 2006/mar/24 2019/mar/31 494.525
530511 LIGHTNING 2 100% Mineral Claim 083D 2006/mar/24 2019/mar/31 395.741
530513 LIGHTNING 3 100% Mineral Claim 083D 2006/mar/24 2019/mar/31 217.556
537452 PYRAMID 1 100% Mineral Claim 083D 2006/jul/20 2019/mar/31 493.795
537454 PYRAMID 2 100% Mineral Claim 083D 2006/jul/20 2019/mar/31 494.024
537456 PYRAMID 3 100% Mineral Claim 083D 2006/jul/20 2019/mar/31 197.674
550560 MUD 10 100% Mineral Claim 083D 2007/jan/29 2019/mar/31 495.976
550562 MUD 11 100% Mineral Claim 083D 2007/jan/29 2019/mar/31 475.263
550563 MUD 13 100% Mineral Claim 083D 2007/jan/29 2019/mar/31 454.377
550565 MUD 14 100% Mineral Claim 083D 2007/jan/29 2019/mar/31 376.880
550568 MUD15 100% Mineral Claim 083D 2007/jan/29 2019/mar/31 178.524
550603 ARIANE1 100% Mineral Claim 083D 2007/jan/30 2019/mar/31 493.608
550605 ARIANE2 100% Mineral Claim 083D 2007/jan/30 2019/mar/31 493.837
550607 ARIANE3 100% Mineral Claim 083D 2007/jan/30 2019/mar/31 493.618
550608 ARIANE4 100% Mineral Claim 083D 2007/jan/30 2019/mar/31 493.846
550609 ARIANE5 100% Mineral Claim 083D 2007/jan/30 2019/mar/31 493.629
550610 ARIANE6 100% Mineral Claim 083D 2007/jan/30 2019/mar/31 493.856
550612 ARIANE7 100% Mineral Claim 083D 2007/jan/30 2019/mar/31 473.847
550613 ARIANE8 100% Mineral Claim 083D 2007/jan/30 2019/mar/31 473.846
550614 ARIANE9 100% Mineral Claim 083D 2007/jan/30 2019/mar/31 493.768
550615 ARIANE10 100% Mineral Claim 083D 2007/jan/30 2019/mar/31 474.159
550616 ARIANE11 100% Mineral Claim 083D 2007/jan/30 2019/mar/31 493.484
550620 ARIANE12 100% Mineral Claim 083D 2007/jan/30 2019/mar/31 494.116
550621 4512124519227380 100% Mineral Claim 083D 2007/jan/30 2019/mar/31 474.593
550622 ARIANE13 100% Mineral Claim 083D 2007/jan/30 2019/mar/31 474.855
550623 ARIANE 14 100% Mineral Claim 083D 2007/jan/30 2019/mar/31 494.343
550624 ARIANE 15 100% Mineral Claim 083D 2007/jan/30 2019/mar/31 494.571
550626 ARIANE 16 100% Mineral Claim 083D 2007/jan/30 2019/mar/31 493.252
550628 ARIANE17 100% Mineral Claim 083D 2007/jan/30 2019/mar/31 492.997
550629 ARIANE 18 100% Mineral Claim 083D 2007/jan/30 2019/mar/31 473.249
550632 ARIANE 19 100% Mineral Claim 083D 2007/jan/30 2019/mar/31 493.249
550633 ARIANE 20 100% Mineral Claim 083D 2007/jan/30 2019/mar/31 414.104
COMMERCE RESOURCES CORPORATION
BLUE RIVER TA-NB PROJECT
BLUE RIVER, BRITISH COLUMBIA
NI 43-101 TECHNICAL REPORT
Project No.: 162230 Appendix 31 January 2011
Tenure Number Claim Name Ownership
Tenure Type
Tenure Sub-Type
Map Number Issue Date Good To Date Area (ha)
550636 ARIANE 20 100% Mineral Claim 830 2007/jan/30 2019/mar/31 493.708
550637 ARIANE 21 100% Mineral Claim 083D 2007/jan/30 2019/mar/31 197.646
550638 ARIANE 22 100% Mineral Claim 083D 2007/jan/30 2019/mar/31 493.938
550639 ARIANE 23 100% Mineral Claim 083D 2007/jan/30 2019/mar/31 494.165
550640 ARIANE 24 100% Mineral Claim 830 2007/jan/30 2019/mar/31 494.391
550641 ARIANE 25 100% Mineral Claim 083D 2007/jan/30 2019/mar/31 395.676
550643 ARIANE 26 100% Mineral Claim 083D 2007/jan/30 2019/mar/31 493.494
550645 ARIANE 27 100% Mineral Claim 083D 2007/jan/30 2019/mar/31 493.716
550646 ARIANE 28 100% Mineral Claim 830 2007/jan/30 2019/mar/31 493.945
550647 ARIANE 29 100% Mineral Claim 083D 2007/jan/30 2019/mar/31 494.170
550648 ARIANE 30 1 100% Mineral Claim 083D 2007/jan/30 2019/mar/31 494.394
550649 ARIANE 31 100% Mineral Claim 083D 2007/jan/30 2019/mar/31 395.677
550651 ARIANE 32 100% Mineral Claim 083D 2007/jan/3D 2019/mar/31 493.274
550652 ARIANE 33 100% Mineral Claim 083D 2007/jan/30 2019/mar/31 493.054
550655 ARIANE 34 100% Mineral Claim 083D 2007/jan/30 2019/mar/31 197.162
550658 ARIANE 35 100% Mineral Claim 083D 2007/jan/30 2019/mar/31 492.968
550661 ARIANE 36 100% Mineral Claim 083D 2007/jan/30 2019/mar/31 493.180
550662 ARIANE 37 100% Mineral Claim 083D 2007/jan/30 2019/mar/31 197.334
550663 ARIANE 38 100% Mineral Claim 083D 2007/jan/30 2019/mar/31 493.490
550664 ARIANE 39 100% Mineral Claim 083D 2007/jan/30 2019/mar/31 493.712
550665 ARIANE 40 100% Mineral Claim 083D 2007/jan/30 2019/mar/31 493.941
550666 ARIANE 41 100% Mineral Claim 083D 2007/jan/30 2019/mar/31 494.167
550667 ARIANE 42 100% Mineral Claim 083D 2007/jan/30 2019/mar/31 494.391
550668 ARIANE 43 100% Mineral Claim 083D 2007/jan/30 2019/mar/31 395.674
550669 ARIANE 44 100% Mineral Claim 083D 2007/jan/30 2019/mar/31 494.573
550670 ARIANE 45 100% Mineral Claim 083D 2007/jan/30 2019/mar/31 494.351
550671 ARIANE 46 100% Mineral Claim 083D 2007/jan/30 2019/mar/31 494.129
550672 ARIANE 47 100% Mineral Claim 083D 2007/jan/30 2019/mar/31 414.919
550673 ARIANE 48 100% Mineral Claim 083D 2007/jan/30 2019/mar/31 414.800
550675 ARIANE 49 100% Mineral Claim 083D 2007/jan/30 2019/mar/31 414.687
550676 ARIANE 51 100% Mineral Claim 083D 2007/jan/30 2019/mar/31 276.396
550679 ARIANE 52 100% Mineral Claim 083D 2007/jan/30 2019/mar/31 414.499
550681 ARIANE 53 100% Mineral Claim 083D 2007/jan/30 2019/mar/31 493.269
550683 ARIANE 54 100% Mineral Claim 083D 2007/jan/30 2019/mar/31 493.051
550685 ARIANE 55 100% Mineral Claim 083D 2007/jan/30 2019/mar/31 197.165
550687 ARIANE 56 100% Mineral Claim 083D 2007/jan/30 2019/mar/31 473.522
550689 ARIANE 57 100% Mineral Claim 083D 2007/jan/30 2019/mar/31 473.277
550691 ARIANE 58 100% Mineral Claim 083D 2007/jan/30 2019/mar/31 492.977

COMMERCE RESOURCES CORPORATION
BLUE RIVER TA-NB PROJECT
BLUE RIVER, BRITISH COLUMBIA
NI 43-101 TECHNICAL REPORT
Project No.: 162230 Appendix 31 January 2011
Tenure Number Claim Name Ownership
Tenure Type
Tenure Sub-Type
Map Number Issue Date Good To Date Area (ha)
550693 ARIANE 59 100% Mineral Claim 083D 2007/jan/30 2019/mar/31 493.181
550695 ARIANE 60 100% Mineral Claim 083D 2007/jan/30 2019/mar/31 493.406
550697 ARIANE 61 100% Mineral Claim 083D 2007/jan/30 2019/mar/31 454.564
550698 ARIANE 62 100% Mineral Claim 083D 2007/jan/30 2019/mar/31 494.077
550700 ARIANE 63 100% Mineral Claim 083D 2007/jan/3D 2019/mar/31 494.066
550701 ARIANE 64 100% Mineral Claim 083D 2007/jan/30 2019/mar/31 197.625
550703 ARIANE 65 100% Mineral Claim 083D 2007/jan/30 2019/mar/31 494.305
550704 ARIANE 66 100% Mineral Claim 083D 2007/jan/30 2019/mar/31 494.299
550706 ARIANE 67 100% Mineral Claim 083D 2007/jan/30 2019/mar/31 494.292
550707 ARIANE 68 100% Mineral Claim 083D 2007/jan/30 2019/mar/31 435.094
550709 ARIANE 69 100% Mineral Claim 083D 2007/jan/30 2019/mar/31 474.767
550711 ARIANE 70 100% Mineral Claim 083D 2007/jan/30 2019/mar/31 474.763
550714 ARIANE 71 100% Mineral Claim 083D 2007/jan/30 2019/mar/31 474.759
550715 ARIANE 72 100% Mineral Claim 083D 2007/jan/30 2019/mar/31 356.068
550718 ARIANE 73 100% Mineral Claim 083D 2007/jan/30 2019/mar/31 493.392
550721 ARIANE 74 100% Mineral Claim 083D 2007/jan/30 2019/mar/31 493.379
550726 ARIANE 75 100% Mineral Claim 083D 2007/jan/30 2019/mar/31 493.166
550728 ARIANE 76 100% Mineral Claim 083D 2007/jan/30 2019/mar/31 493.150
550731 ARIANE 77 100% Mineral Claim 083D 2007/jan/30 2019/mar/31 492.964
550734 ARIANE 78 100% Mineral Claim 083D 2007/jan/30 2019/mar/31 492.950
550886 HELLROAR 100% Mineral Claim 083D 2007/feb/01 2019/mar/31 435.471
550887 HELLROARS 100% Mineral Claim 083D 2007/feb/01 2019/mar/31 475.246
550888 BAT OUT OF HELL 100% Mineral Claim 083D 2007/feb/01 2019/mar/31 475.396
550889 THE MONSTER IS LOOSE 100% Mineral Claim 083D 2007/feb/01 2019/mar/31 475.203
565127 PROSPER 1 100% Mineral Claim 083D 2007/aug/28 2019/mar/31 475.099
565128 PROSPER 2 100% Mineral Claim 083D 2007/aug/28 2019/mar/31 474.985
565129 PROPSER 3 100% Mineral Claim 083D 2007/aug/28 2019/mar/31 494.798
565130 PROSPER 4 100% Mineral Claim 083D 2007/aug/28 2019/mar/31 237.525
565131 PROSPER 5 100% Mineral Claim 083D 2007/aug/28 2019/mar/31 494.798
565132 PROSPER 6 100% Mineral Claim 083D 2007/aug/28 2019/mar/31 494.799
565133 PROSPER 7 100% Mineral Claim 083D 2007/aug/28 2019/mar/31 494.799
565135 PROSPER 8 100% Mineral Claim 083D 2007/aug/28 2019/mar/31 494.798
565136 PROSPER 9 100% Mineral Claim 083D 2007/aug/28 2019/mar/31 494.802
565138 PROSPER 10 100% Mineral Claim 083D 2007/aug/28 2019/mar/31 494.800
565139 PROSPER 11 ' 100% Mineral Claim 083D 2007/aug/28 2019/mar/31 494.798
565140 PROSPER 12 100% Mineral Claim 083D 2007/aug/28 2019/mar/31 475.159
565141 PROSPER 13 100% Mineral Claim 083D 2007/aug/28 2019/mar/31 475.181
565143 PROSPER 14 100% Mineral Claim 083D 2007/aug/28 2019/mar/31 475.182
COMMERCE RESOURCES CORPORATION
BLUE RIVER TA-NB PROJECT
BLUE RIVER, BRITISH COLUMBIA
NI 43-101 TECHNICAL REPORT
Project No.: 162230 Appendix 31 January 2011
Tenure Number Claim Name Ownership
Tenure Type
Tenure Sub-Type
Map Number Issue Date Good To Date Area (ha)
565144 PROSPER 15 100% Mineral Claim 830 2007/aug/28 2019/mar/31 475.184
565145 PROSPER 15 100% Mineral Claim 083D 2007/aug/28 2019/mar/31 475.185
565146 PROSPER 16 100% Mineral Claim 083D 2007/aug/28 2019/mar/31 475.188
565147 PROSPER 17 100% Mineral Claim 083D 2007/aug/28 2019/mar/31 178.195
565148 PROSPER 18 100% Mineral Claim 083D 2007/aug/28 2019/mar/31 336.751
565149 PROSPER 19 100% Mineral Claim 083D 2007/aug/28 2019/mar/31 495.163
565150 PROSPER 20 100% Mineral Claim 083D 2007/aug/28 2019/mar/31 495.163
565152 PROSPER 21 100% Mineral Claim 083D 2007/aug/28 2019/mar/31 495.164
565153 PROSPER 22 100% Mineral Claim 083D 2007/aug/28 2019/mar/31 396.131
565154 PROSPER 23 100% Mineral Claim 083D 2007/aug/28 2019/mar/31 396.131
565156 PROSPER 25 100% Mineral Claim 083D 2007/aug/28 2019/mar/31 495.166
565157 PROSPER 26 100% Mineral Claim 083D 2007/aug/28 2019/mar/31 396.133
565158 PROSPER 27 100% Mineral Claim 083D 2007/aug/28 2019/mar/31 396.133
565159 PROSPER 28 100% Mineral Claim 083D 2007/aug/28 2019/mar/31 455.547
565160 PROSPER 29 100% Mineral Claim 083D 2007/aug/28 2019/mar/31 495.400
565161 PROSPER 30 100% Mineral Claim 083D 2007/aug/28 2019/mar/31 495.390
565162 PROSPER 31 100% Mineral Claim 083D 2007/aug/28 2019/mar/31 495.391
565163 PROSPER 31 100% Mineral Claim 083D 2007/aug/28 2019/mar/31 495.391
565164 PROSPER 32 100% Mineral Claim 083D 2007/aug/28 2019/mar/31 495.392
565165 PROSPER 33 100% Mineral Claim 083D 2007/aug/28 2019/mar/31 495.393
565166 PROSPER 34 100% Mineral Claim 083D 2007/aug/28 2019/mar/31 495.393
565167 PROSPER 35 100% Mineral Claim 083D 2007/aug/28 2019/mar/31 495.394
565168 PROSPER 35 100% Mineral Claim 083D 2007/aug/28 2019/mar/31 495.395
565169 PROSPER 36 100% Mineral Claim 083D 2007/aug/28 2019/mar/31 495.394
565170 PROSPER 37 100% Mineral Claim 083D 2007/aug/28 2019/mar/31 495.568
565171 SHADOWI 100% Mineral Claim 083D 2007/aug/28 2019/mar/31 495.650
565172 SHADOW 2 100% Mineral Claim 083D 2007/aug/28 2019/mar/31 436.167
565173 SHADOW 3 100% Mineral Claim 083D 2007/aug/28 2019/mar/31 495.621
565174 SHADOW 4 100% Mineral Claim 083D 2007/aug/28 2019/mar/31 495.621
565175 SHADOW 5 100% Mineral Claim 083D 2007/aug/28 2019/mar/31 495.622
565176 SHADOW 6 100% Mineral Claim 083D 2007/aug/28 2019/mar/31 495.622
565177 SHADOW 7 100% Mineral Claim 083D 2007/aug/28 2019/mar/31 495.622
565178 SHADOW 8 100% Mineral Claim 083D 2007/aug/28 2019/mar/31 495.623
565179 SHADOW 8 100% Mineral Claim 083D 2007/aug/28 2019/mar/31 317.188
565180 SHADOW 9 100% Mineral Claim 083D 2007/aug/28 2019/mar/31 475.952
565181 SHADOW 10 100% Mineral Claim 083D 2007/aug/28 2019/mar/31 475.952
565182 SHADOW 11 100% Mineral Claim 083D 2007/aug/28 2019/mar/31 495.840
565183 SHADOW 12 100% Mineral Claim 083D 2007/aug/28 2019/mar/31 495.942

COMMERCE RESOURCES CORPORATION
BLUE RIVER TA-NB PROJECT
BLUE RIVER, BRITISH COLUMBIA
NI 43-101 TECHNICAL REPORT
Project No.: 162230 Appendix 31 January 2011
Tenure Number Claim Name Ownership
Tenure Type
Tenure Sub-Type
Map Number Issue Date Good To Date Area (ha)
565184 SHADOW 13 100% Mineral Claim 083D 2007/auq/28 2019/mar/31 495.942
565185 SHADOW 13 100% Mineral Claim 083D 2007/aug/28 2019/mar/31 495.941
565186 SHADOW 15 100% Mineral Claim 083D 2007/aug/28 2019/mar/31 456.366
565187 FALKOR 1 100% Mineral Claim 083D 2007/aug/28 2019/mar/31 456.085
565188 FALKOR 2 100% Mineral Claim 083D 2007/aug/28 2019/mar/31 495.763
565189 FALKOR 3 100% Mineral Claim 083D 2007/aug/28 2019/mar/31 396.745
565190 FALKOR 4 100% Mineral Claim 083D 2007/aug/28 2019/mar/31 495.993
565191 FALKOR 5 100% Mineral Claim 083D 2007/aug/28 2019/mar/31 374.644
565192 FALKOR 6 100% Mineral Claim 083D 2007/aug/28 2019/mar/31 496.139
565193 FALKOR 7 100% Mineral Claim 083D 2007/aug/28 2019/mar/31 473.723
565194 FALKOR 8 100% Mineral Claim 083D 2007/aug/28 2019/mar/31 496.445
565195 FALKOR 9 100% Mineral Claim 083D 2007/aug/28 2019/mar/31 496.370
565196 FALKOR 10 100% Mineral Claim 083D 2007/aug/28 2019/mar/31 476.525
565197 FALKOR 11 100% Mineral Claim 083D 2007/aug/28 2019/mar/31 496.401
565198 FALKOR 12 100% Mineral Claim 830 2007/au•/28 2019/mar/31 495.497
565199 MINI 100% Mineral Claim 083D 2007/aug/28 2019/mar/31 39.701
565200 FALKOR 13 100% Mineral Claim 083D 2007/aug/28 2019/mar/31 476.517
565201 FALKOR 14 100% Mineral Claim 083D 2007/aug/28 2019/mar/31 357.344
565202 FALKOR 15 100% Mineral Claim 083D 2007/aug/28 2019/mar/31 496.168
565203 FALKOR 15 100% Mineral Claim 083D 2007/aug/28 2019/mar/31 496.169
565204 FALKOR 16 100% Mineral Claim 083D 2007/aug/28 2019/mar/31 377.098
565205 FALKOR 17 100% Mineral Claim 083D 2007/aug/28 2019/mar/31 476.778
565206 MINI 2 100% Mineral Claim 083D 2007/aug/28 2019/mar/31 39.694
565207 FALKOR 18 100% Mineral Claim 083D 2007/au /28 2019/mar/31 437.056
565208 FALKOR 19 100% Mineral Claim 083D 2007/aug/28 2019/mar/31 496.588
565209 FALKOR 20 100% Mineral Claim 083D 2007/aug/28 2019/mar/31 496.396
565210 FALKOR 21 100% Mineral Claim 083D 2007/aug/28 2019/mar/31 476.746
565211 FALKOR 22 100% Mineral Claim 083D 2007/aug/28 2019/mar/31 476.955
565212 FALKOR 23 100% Mineral Claim 083D 2007/aug/28 2019/mar/31 496.394
565213 FALKOR 24 100% Mineral Claim 083D 2007/aug/28 2019/mar/31 238.488
565214 FALKOR 25 100% Mineral Claim 083D 2007/aug/28 2019/mar/31 496.633
565215 FALKOR 26 100% Mineral Claim 083D 2007/aug/28 2019/mar/31 397.437
565216 FALKOR 27 100% Mineral Claim 083D 2007/aug/28 2019/mar/31 496.627
565217 FALKOR 28 100% Mineral Claim 083D 2007/aug/28 2019/mar/31 476.970
565218 FALKOR 29 100% Mineral Claim 083D 2007/aug/28 2019/mar/31 496.626
565219 FALKOR 30 100% Mineral Claim 083D 2007/aug/28 2019/mar/31 496.863
565220 FALKOR 31 100% Mineral Claim 083D 2007/aug/28 2019/mar/31 496.628
565221 FALKOR 32 100% Mineral Claim 083D 2007/aug/28 2019/mar/31 496.859
COMMERCE RESOURCES CORPORATION
BLUE RIVER TA-NB PROJECT
BLUE RIVER, BRITISH COLUMBIA
NI 43-101 TECHNICAL REPORT
Project No.: 162230 Appendix 31 January 2011
Tenure Number Claim Name Ownership
Tenure Type
Tenure Sub-Type
Map Number Issue Date Good To Date Area (ha)
565222 FALKOR 33 100% Mineral Claim 083D 2007/aug/28 2019/mar/31 397.116
565223 FALKOR 34 100% Mineral Claim 083D 2007/aug/28 2019/mar/31 496.859
565224 FALKOR 35 100% Mineral Claim 083D 2007/aug/28 2019/mar/31 496.629
588427 WASTED 1 100% Mineral Claim 083D 2008/jul/18 2011/jul/31 494.294
588428 WASTED 2 100% Mineral Claim 083D 2008/jul/18 2011/jul/31 474.330
588429 WASTED 3 100% Mineral Claim 083D 2008/jul/18 2011/jul/31 474.151
588430 WASTED 4 100% Mineral Claim 083D 2008/jul/18 2011/jul/31 473.977
589537 FELIX1 100% Mineral Claim 083D 2008/aug/05 2019/mar/31 496.396
589538 FELIX2 100% Mineral Claim 083D 2008/aug/05 2019/mar/31 496.398
589539 FELIX3 100% Mineral Claim 083D 2008/aug/05 2019/mar/31 377.104
589540 FELIX4 100% Mineral Claim 083D 2008/aug/05 2019/mar/31 496.170
589541 FELIX5 100% Mineral Claim 083D 2008/aug/05 2019/mar/31 495.966
589542 FELIX6 100% Mineral Claim 083D 2008/aug/05 2019/mar/31 436.310
589544 FELIX7 100% Mineral Claim 083D 2008/aug/05 2019/mar/31 376.684
589551 FELIX8 100% Mineral Claim 083D 2008/aug/05 2019/mar/31 475.820
589554 FELIX9 100% Mineral Claim 083D 2008/aug/05 2019/mar/31 396.317
589556 FELIX10 100% Mineral Claim 083D 2008/aug/05 2019/mar/31 495.472
589557 FELIX11 100% Mineral Claim 083D 2008/aug/05 2019/mar/31 415.973
589559 FELIX12 100% Mineral Claim 083D 2008/aug/05 2019/mar/31 495.167
589563 FELIX13 100% Mineral Claim 083D 2008/aug/05 2019/mar/31 356.679
798362 JOIN 100% Mineral Claim 083D 2010/jun/25 2011/jun/25 177.980