Technical Report 2017-03 State of the art in managing …€¦ · cost-benefit analysis and...
56
Technical Report 2017-03 State of the art in managing road traffic noise: cost-benefit analysis and cost-effectiveness analysis January 2017
Transcript of Technical Report 2017-03 State of the art in managing …€¦ · cost-benefit analysis and...
Technical Report 2017-03 State of the art in managing road traffic noise: cost-benefit analysis and cost-effectiveness
analysis
January 2017

This report was drawn up by CEDR Task Group Road Noise. The main authors were; Mr Jakob Fryd, Danish Road Directorate
Ms Helena Axelsson, Norwegian Public Roads Administration
Mr Villu Lükk, Estonian Road Administration
Ms Patrizia Bellucci, ANAS S.p.A., National Autonomous Roads Corporation in Italy
Ms Rosa María Izquierdo López, Spanish Road Administration
Mr Lars Dahlbom, Swedish Transport Administration
With contributions from the following countries and people:
Austria Mr Klaus Gspan and Mr Christof Rehling
Belgium Ms Barbara Vanhooreweder and Mr Sébastien Marcocci
Cyprus Ms Elena Sophocleous
Denmark Mr Hans Bendtsen
Greece Ms Efterpi Giannopoulou
Ireland Mr Vincent O’Malley
Italy Mr Alberto De Leo
Netherlands Mr Wiebe Alberts, Mr Nico Faber, Mr Michiel Roebben. Mr. Dick van der Gugten and Mr. Jan van Donkelaar
Poland Mr Łukasz Łach and Mr Piotr Buczek
Approved by the CEDR Executive Board in December 2016 Edited and published by CEDR's Secretariat. Ref: CEDR Technical Report 2017-03 State of the art in managing road traffic noise: cost-benefit analysis and cost-effectiveness analysis ISBN: 979-10-93321-28-8 Disclaimer: This document details the outputs of a CEDR working group. It does not express any view of opinions of CEDR. Readers should not regard any views as a statement of the official position of CEDR or its member countries.

Page 3 / 56
CEDR Technical Report 2017-03- Noise cost-benefit analysis and cost-effectiveness analysis
1 Executive summary
Evidence-based and successful policies for noise abatement require making investment decisions on objective and verifiable methods. Road noise is a major challenge for all national road administrations. This applies, for example, to demands for noise-reducing measures along existing roads, but also to the integration of appropriate noise mitigation measures in the planning and construction of new roads. For decision-makers and for society as a whole, it is important to use available means in the best possible way. Money for noise mitigation measures is in general limited and the use of measures such as noise barriers are associated with high costs. A key challenge in managing environmental noise from an economic perspective is to balance the costs of noise for society with the costs of controlling noise. Cost-benefit analysis (CBAs) and cost-effectiveness analysis (CEAs) may provide answers to such questions.
Cost-benefit analysis takes a more holistic approach than cost-effectiveness analysis by expanding the scope of analysis to all impacts of a measure or a project. The objective of the CBA is to achieve the best overall performance in money terms, versus the cost of a measure or a project. The CBA approach is more demanding than is CEA, because all relevant effects need to be assigned a monetary value. When such cost factors are available, the cost-efficiency of a noise reduction method can be calculated. The CEA method is best suited to prioritise interventions to reduce noise. For instance, one can prioritise between different residential areas where there is a desire to reduce noise or assessing which noise-reducing measure is the most cost-effective in an area. The CEDR Task Group Road Noise determined to improve the knowledge and awareness of theories and techniques to carry out CBA and CEA among CEDR member countries to cope with the challenges of road noise. This report presents an introduction to economical assessment methods in general and their potential role in the decision-making process of noise impact assessments or implementation of noise mitigation measures in national road administrations. Economic quantification of benefits by reducing noise or disadvantages of noise pollution is an essential part of cost-benefit analysis. This is done by different monetarisation techniques, where health impacts and annoyance, and willingness-to-pay to avoid impacts from noise, form the corner stone of such assessments. In that sense cost factors for noise greatly influence CBA cost estimates. The report provides examples of cost-based pricing of noise in different countries showing that the unit cost for noise differ substantially from country to country. Some CEDR member countries have unit cost values for road noise. Never the less there are strong indications that many CEDR member countries do not have established any unit costs for road noise, making it impossible to include noise in cost-benefit analysis. The report also concludes that values provided by EC are not robust. Still, the unit cost values for road noise provided by EC are the only ´official´ general European values available at this moment for the use in CBA.
Figure 1 Difference in costs of road noise (EU price = index 100) at 55 dB and 65 dB for four different European countries and the recommended EU value (WGHSEA, 2003). Lden EU
(price 2003) DK
(price 2015) UK
(price 2015) SE
(price 2015) NL
(price 2010)
55 dB 100 122 202 144 85
65 dB 100 194 320 877 96

Page 4 / 56
CEDR Technical Report 2017-03- Noise cost-benefit analysis and cost-effectiveness analysis
Moreover, the report provides examples of how cost-benefit analysis can be used in practice as a decision tool for implementation of noise-reducing measures and how noise is included in the CBAs of major road projects in the process of the environmental impact assessment. It is recommended, that road administrations in countries where there are no fixed unit costs of noise, alternatively use unit costs for noise from countries where there have been more systematic surveys of the topic. In this context, it is noted that the UK seems to have made the latest more detailed update of unit prices. Cost-effectiveness analysis is a simple but effective instrument for evaluating and prioritising projects. For example, it may be desirable for NRAs that actions against road noise are prioritised to achieve the best value for money. Cost-effectiveness analysis seeks to identify and place monetary value on the costs of a program or project. It then relates these costs to specific measures of program effectiveness. The report provides examples of how cost-effectiveness analysis are used in various countries. It also shows that there are some wide variations in the approach to such analysis. In case a CEDR member country has no methods or experience in conducting CEAs, the report describes a simple method to compare the total costs of noise reducing measures with shift in the total noise annoyance in an area before and after an intervention. All in all, it appears from the above that there are needs for further qualification of analytical methods and to provide the reliable underlying basis for these. Therefore, the focus areas for future improvements are:
achieving better knowledge of the costs factors for road traffic noise by adding this issue to future CEDR research topics;
investing in the dissemination of knowledge of using cost-benefit analysis and cost-effectiveness analysis for more effective noise abatement, by organising a workshop about the use of CBA and CEA in NRAs’ practice.
And last but not least, if a CEDR member country has no cost-benefit analysis or cost-effectiveness analysis, the technical report provides examples of CBA and CEA, that can be used after some adjustments to the national context.
Page 5 / 56
CEDR Technical Report 2017-03- Noise cost-benefit analysis and cost-effectiveness analysis
2 Table of contents
1 EXECUTIVE SUMMARY ........................................................................................................................... 3
2 TABLE OF CONTENTS ............................................................................................................................. 5
3 PURPOSE .................................................................................................................................................. 6
4 INTRODUCTION TO COST-BENEFIT ANALYSIS AND COST-EFFECTIVENESS ANALYSIS ............. 7
5 METHODS TO MONETISE SOCIAL COSTS OF NOISE ......................................................................... 9
5.1 MONETARY VALUATION ........................................................................................................................ 10 5.2 UNIT COSTS FOR ROAD NOISE IN DIFFERENT COUNTRIES AND EU ........................................................... 13 5.3 ECONOMIC IMPACTS OF NOISE IN EU .................................................................................................... 16
6 PRATICAL USE OF COST-BENEFIT ANALYSIS AND COST-EFFECTIVENESS ANALYSIS ............ 17
7 PRACTICAL EXAMPLES OF THE USE OF CBAS ................................................................................ 19
7.1 ENLARGEMENT OF A MOTORWAY .......................................................................................................... 19 7.2 REDUCTION OF SPEED LIMIT ................................................................................................................. 21 7.3 USE OF NOISE-REDUCING ASPHALT ....................................................................................................... 22
8 COSTS OF NOISE IN ROAD PLANNING PROJECTS: EXAMPLES FROM DENMARK, NORWAY AND THE NETHERLANDS............................................................................................................................. 24
8.1 VALUING NOISE COST/BENEFITS FROM A ROAD PROJECT IN DENMARK .................................................... 24 8.2 VALUING NOISE COST/BENEFIT FROM A ROAD PROJECT IN NORWAY ........................................................ 29 8.3 VALUING COST-BENEFITS FOR A ROAD PROJECT IN THE NETHERLANDS .................................................. 32 8.4 VALUES FOR NOISE IN SWEDEN ............................................................................................................ 36
9 PRACTICAL EXAMPLES OF USE OF COST-EFFECTIVENESS ANALYSIS ...................................... 38
9.1 USE OF CEAS IN DENMARK ................................................................................................................. 38 9.2 THE DUTCH COST-EFFECTIVENESS ANALYSIS FOR NOISE MEASURES ...................................................... 40 9.3 NOISE ACTION PLANNING: PROBLEMS WITH PRIORITIZATION OF ACTIONS ................................................. 45 9.4 RECOMMENDED CEA METHOD ............................................................................................................. 48
10 SUMMARY ............................................................................................................................................... 50
10.1 CONCLUSIONS ..................................................................................................................................... 50
11 REFERENCES ......................................................................................................................................... 53

Page 6 / 56
CEDR Technical Report 2017-03- Noise cost-benefit analysis and cost-effectiveness analysis
3 Purpose
Environmental noise is a pervasive issue across the EU and internationally. In 2011 the Burden of Disease from Environmental Noise by the World Health Organisation (WHO, 2011) identified environmental noise as the second largest environmental risk to public health across Western Europe. Furthermore, WHO point out that noise exposure is increasing across Europe.
Road noise is a major challenge for all national road administrations. This applies, for example, to demands for noise-reducing measures along existing roads, but also to the integration of appropriate noise mitigation measures in the planning and construction of new roads.
Money for noise mitigation measures is general limited and the use of measures such as noise barriers is associated with high costs. A key challenge in managing environmental noise from an economic perspective is to balance the costs of noise with the costs of controlling noise.
In order to carry out assessments of the overall impacts of noise, it is important to have knowledge of methods to price the impact of noise and noise reduction. For example, it is important to analyse the economic consequences of noise to assess the importance of noise mitigation measures. It is also important to prioritise efforts against noise; for example, where is it most cost-effective to establish noise barriers, where is it most profitable to use noise-reducing asphalt, etc.? Cost-benefit analysis (CBA) and cost-effectiveness analysis (CEA) may provide answers to such questions.
The Road Noise Task Group has determined the need to improve the knowledge and awareness of theories and techniques to carry out CEAs and CBAs in the handling of noise from roads. The purpose of this report is therefore to introduce the general principles for carrying out CBAs and CEAs and the methodological background of evaluation noise impacts. Another purpose is to provide examples of how such methods are used in different member countries.
The type of questions this report seek answers to are as follows:
What is CBAs and what is CEAs and what are the differences in principle?
What can CBAs and CEAs be used for with regard to noise planning?
Why is it interesting for national road authorities (NRAs) to use CBA/CEA?
Which methods are used today in Europe and are there any good examples of use?
Can NRAs be inspired to use economic assessments for noise reducing purposes?
Page 7 / 56
CEDR Technical Report 2017-03- Noise cost-benefit analysis and cost-effectiveness analysis
4 Introduction to cost-benefit analysis and cost-effectiveness analysis
Cost-benefit analysis (CBA) is an economic technique that attempts to quantify and compare the economic advantages (benefits) and disadvantages (costs) associated with a particular project or policy for society as a whole (Kuik, undated). CBA is most useful when analysing a single project or policy to determine whether the project’s total benefits to society exceed the costs or when comparing alternative projects to see which one achieves the greatest benefit to society.
In technical terms, CBA involves a translation of all benefits and costs related to a project into monetary values. Benefits include direct positive and negative effects, such as noise reduction, and indirect effects, such as non-marketed environmental and social impacts (UN, 2013). The direct benefits are usually measured in physical units, for instance the insertion loss due to the implementation of a noise mitigation measure. Other benefits, such as the reduction of noise annoyance or sleep disturbance, are intangible and difficult to estimate in physical or monetary terms. To assess the value of social costs different methods can be applied, such as the Stated Preference approach (or indirect approach) or Revealed Preference approaches (direct approach) (see explanation in Chapter 5), both leading to monetary results depending on many local or individual factors (geographical area, sensitivity to noise, age, etc.). Benefits and costs of different project options must be converted into monetary values in a given time period and compared with a reference scenario that would prevail if no action is taken. The net benefit of each alternative option is given by the difference between costs and benefits. The most economically efficient option is the one with the highest net present value (total benefits-total costs), assuming that various options involve equal investment costs. Options are economically viable only when the net present value is positive or the present value of total benefits equals or exceeds the present value of total costs (Benefits/Costs >=1).
Cost-benefit analysis (CBA)
An analysis method for establishing the monetary value of all the benefits and disbenefits experienced by all parties in a (national) society as a result of a given project being implemented, supplemented by (preferably quantitative) information on impacts that cannot be satisfactorily expressed in monetary terms.
When benefits are difficult to assess, or when the information required is difficult to determine, or in any other case, when any attempt to make a precise monetary measurement of benefits would be tricky or open to considerable dispute, a cost-effectiveness analysis can help to ensure an efficient use of investment resources.
Cost-effectiveness analysis (CEA) is an efficient way to identify the most cost-effective option for achieving a set of predefined objectives (EC, 2014). The most cost-effective solution is the option that, for a given output level, minimises the actual value of costs, or, alternatively, for a given cost, maximises the output level. The efficiency of measures are assessed by dividing costs by units of effectiveness (Celline & Kee, 2015). Units of effectiveness are simply a measure of any quantifiable outcome central to the project’s objectives, for example the cost needed to reduce the number of people exposed to noise by one.

Page 8 / 56
CEDR Technical Report 2017-03- Noise cost-benefit analysis and cost-effectiveness analysis
CEA is most useful when you know the outcome you desire (for example noise reduction), one main objective for the project, and you are determining which of a set of alternative solutions achieves the greatest noise reduction for the costs (for example, the use of noise barriers compared to noise reducing asphalt). It is also useful in cases where major outcomes are either intangible or otherwise difficult to monetize. In summary, CEA can be used as a second-best option when a full CBA is not achievable or as a final step, when the objectives of the projects have been identified and the only remaining question is to find the least-cost option (Gorlach, undated) for example to fulfil required noise guidelines. The disadvantage of cost-effectiveness analysis is that it does not identify the benefits of actions or society’s willingness to pay for improving the environment.
Cost-effectiveness analysis (CEA)
The ratio between the costs and actual impacts of a given project, programme or government policy. Cost-effectiveness can be defined from the perspective of government, end users or society as a whole.
Page 9 / 56
CEDR Technical Report 2017-03- Noise cost-benefit analysis and cost-effectiveness analysis
5 Methods to monetize social costs of noise
When using cost-benefit analysis, benefits should be translated into monetary terms to be compared to costs. Benefits are calculated as the difference between social costs associated with a reference scenario, reflecting the present situation with regard to traffic volume, speed distribution, vehicle technologies etc., and the case scenario, which is based on the reference scenario, but includes the changes following from the project alternative considered (Kuik, undated).
Social costs incorporate mainly the effect of annoyance, reflecting the disturbance which individuals experience when exposed to (traffic) noise, and the damage inflicted on public health due to long-term exposure to noise, such as hypertension and myocardial infarction. In addition, transport noise can also create sleep disturbance, thus resulting in a decrease of subjective sleep quality (WHO, 2011). These negative impacts of noise on human health generate various types of costs, like medical costs and costs attributable to productivity loss or increased mortality.
Annoyance and health disease can be considered as two independent effects; therefore the potential long-term health risk is not taken into account in people's perceived noise annoyance. However, previous studies have shown that quantifiable health effects are of minor importance compared to nuisance and annoyance (Ken Hume, 2010). This is the reason why in many studies health costs have been neglected.
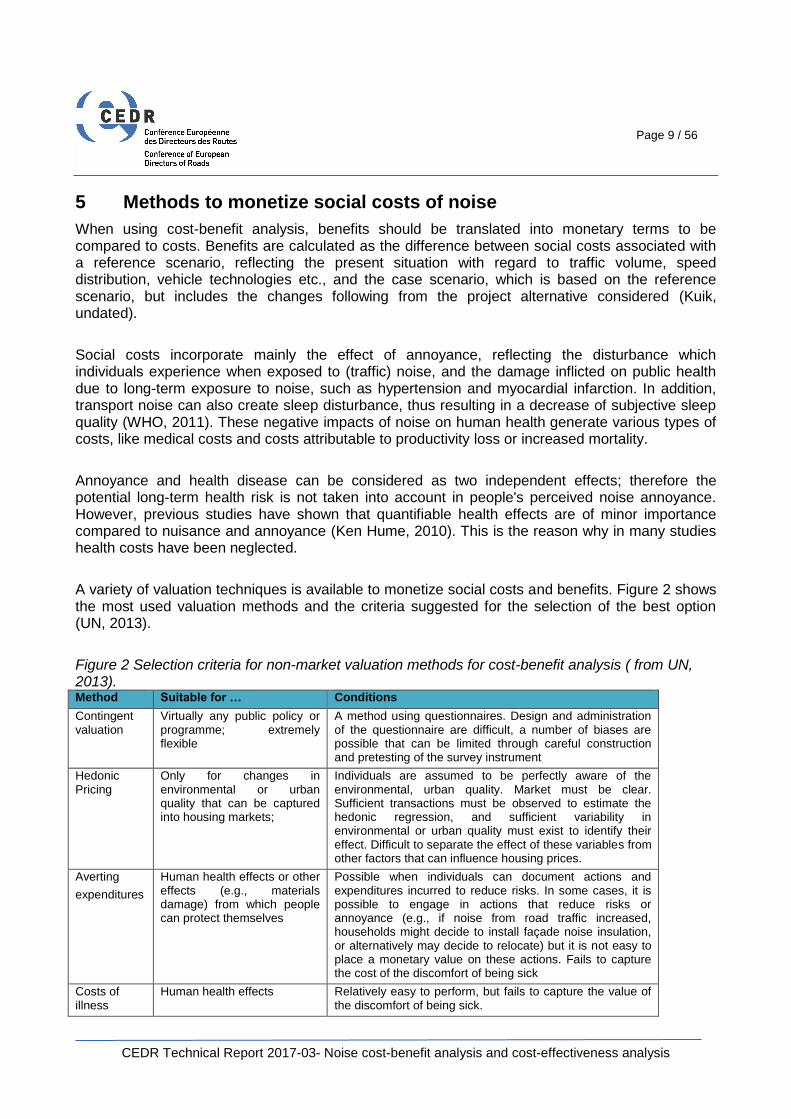
A variety of valuation techniques is available to monetize social costs and benefits. Figure 2 shows the most used valuation methods and the criteria suggested for the selection of the best option (UN, 2013).
Figure 2 Selection criteria for non-market valuation methods for cost-benefit analysis ( from UN, 2013). Method Suitable for … Conditions
Contingent valuation
Virtually any public policy or programme; extremely flexible
A method using questionnaires. Design and administration of the questionnaire are difficult, a number of biases are possible that can be limited through careful construction and pretesting of the survey instrument
Hedonic Pricing
Only for changes in environmental or urban quality that can be captured into housing markets;
Individuals are assumed to be perfectly aware of the environmental, urban quality. Market must be clear. Sufficient transactions must be observed to estimate the hedonic regression, and sufficient variability in environmental or urban quality must exist to identify their effect. Difficult to separate the effect of these variables from other factors that can influence housing prices.
Averting
expenditures
Human health effects or other effects (e.g., materials damage) from which people can protect themselves
Possible when individuals can document actions and expenditures incurred to reduce risks. In some cases, it is possible to engage in actions that reduce risks or annoyance (e.g., if noise from road traffic increased, households might decide to install façade noise insulation, or alternatively may decide to relocate) but it is not easy to place a monetary value on these actions. Fails to capture the cost of the discomfort of being sick
Costs of illness
Human health effects Relatively easy to perform, but fails to capture the value of the discomfort of being sick.
Page 10 / 56
CEDR Technical Report 2017-03- Noise cost-benefit analysis and cost-effectiveness analysis
Two main evaluation categories are distinguished in Figure 2 that refers to the following different approaches:
1. Revealed Preference approach (RP) or indirect approach 2. Stated Preferences approach (SP) or direct approach
In both cases, the evaluation of the impacts in terms of monetary value is based on the idea that changes in the welfare of individuals are interpreted as changes in utility (Celline & Kee, 2015). Such changes can be expressed as willingness to pay (WTP) or willingness to accept (WTA). WTP is the maximum amount that a person is willing to pay to enjoy a benefit (for instance, a decrease in noise levels), while WTA is the minimum amount that a person is willing to accept as compensation for noise disturbance.
The two concepts, WTP and WTA, should be theoretically coincident, but substantial differences were highlighted by empirical investigations. In particular, WTA was found to be greater than WTP, probably due to the different values generally attributed to economic compensation for continuing to live in a noisy environment and the willingness to pay to improve the quality of life. The benefits resulting from changes in environmental quality, expressed by WTP and WTA, are estimated using two approaches from which a shadow price is obtained (not a real market price) (EC, 2014):
Revealed approach (RP) or indirect approach. This approach is based on the assumption that prices of goods and services are influenced by environmental characteristics. For instance, noise can reduce the market price of houses located in a noise polluted area. Therefore, the willingness to pay or to accept is estimated by comparing the behaviour of consumers related to market areas with different environmental characteristics. The hedonic price method belongs to this approach and it can be used to evaluate the cost of noise in terms of rental or sale house prices.
Stated Preferences approach (SP) or direct approach. Individuals express directly their willingness to pay for a better environment or to accept the status quo in monetary terms: the preferences are hypothetical (stated preferences). A questionnaire is typically used for such investigation. The contingent valuation method belongs to this category. It consists in asking the involved individuals directly, through a questionnaire, how much they would be willing to pay to live in a quieter environment. A more recent development of the direct approach is the choice experiment methodology, where respondents are required to select the preferred alternative from a set of possible choices.
5.1 Monetary Valuation
Noise is defined as any unwanted sound. Whilst some noise is inevitable, exposure to noise can have detrimental effects on human health, amenity and productivity, and on the natural environment. Figure 3 illustrates some of the key noise impacts on amenity and health.

Page 11 / 56
CEDR Technical Report 2017-03- Noise cost-benefit analysis and cost-effectiveness analysis
Figure 3 Key noise impacts on amenity and health (DEFRA, 2014).
The main cost component of annoyance is disutility experienced, for which no market exists. Stated Preference (SP) and Revealed Preference (RP) methods have been employed to estimate the economic value of changes in noise levels. The noise valuation literature is dominated by Hedonic Price (HP) studies (most of them old) on road traffic and aircraft noise of varying quality. HP studies analyse the housing market to explore the extent to which differences in property prices reflect individuals’ willingness-to-pay (WTP) for lower noise levels. Resulting values seem to be problematic to transfer, however, both theoretically and in practice.
The number of Stated Preference studies on road traffic noise is increasing, but only a few present WTP in terms of “euro per annoyed person per year” for different annoyance levels (little annoyed, annoyed and highly annoyed), which correspond to the endpoints of exposure-response functions.
Due to the low number of studies that can be used for this approach, a “second-best” alternative was to evaluate the Stated Preference studies available with regard to quality (e.g. avoid using studies with scenarios based on changes in exposure rather than annoyance and health impacts), choose the best ones, and calculate a value in terms of “euro per dB per person per year”. This was done by Ståle Navrud (Gorlach, undated) to establish an EU value.
To enable the application of the exposure-response functions predicting annoyance reactions on the population level as recommended by the European Commission (2002), in the HEATCO project Stated Preference surveys were carried out in five European countries (Klaeboe et al., 2011). Based on surveys in Germany, Hungary, Norway, Spain, Sweden and the UK, values for application in Europe were derived for the annoyance levels highly annoyed, annoyed and little annoyed. The same was done in the framework of the UNITE project (Hume, 2010) based on

Page 12 / 56
CEDR Technical Report 2017-03- Noise cost-benefit analysis and cost-effectiveness analysis
hedonic pricing studies. In both cases, results were given in terms of monetary factors, as a function of noise levels that provide the cost of noise per annoyed person, per year, per dB.
The monetisation of road noise effects can be split in two types of approach. One approach relates to the cost of lost productivity caused by exposure to road noise, which commonly requires the estimation of the Disability Adjusted Life Years (DALY) as suggested by the WHO. The DALYs combines mortality and morbidity into a single numerical unit, which represents the economic value in terms of loss in productivity (due to either early mortality or due to disability). This is an approach used for quantification and associated monetisation of road noise effects on health.
The other approach relies on the estimation of the willingness to pay to avoid (WTP) or to accept (WTA) a certain level of noise, which can be undertaken using either revealed preference (e.g. hedonic pricing, HP) or Stated Preference - SP (e.g. contingent valuation) techniques. HP uses house market prices as a proxy of the preference that consumers revealed for noise. SP uses questionnaires in which people state their preferences based on hypothetical situations. This approach is commonly used to monetise the “cost of road noise”, without a specific reference to any particular effect.
Figure 4 summarises the above-mentioned approaches for monetising the effects of road noise on health and quality of life.
Figure 4: Approaches for monetisation
Page 13 / 56
CEDR Technical Report 2017-03- Noise cost-benefit analysis and cost-effectiveness analysis
5.2 Unit costs for road noise in different countries and EU
5.2.1 Specific unit costs used in various countries and recommended value from the commission
The CEDR Task Group Road Noise has collected information on unit costs for road noise used in the pricing of road traffic noise in Denmark, Holland, Sweden and the UK which is presented in Figure 5. In addition, the values are presented side by side with the recommended value1 from the EU Commission’s position paper on “Valuation of noise” from 2003 (WGHSEA, 2003). Several countries have no unit prices for the cost of road traffic noise. The Task Group has not been able to identify the unit cost of noise from other CEDR countries.
It must be emphasised that prices in Figure 5 are not directly comparable because they are based on different methodologies. Nevertheless, they still give an overview of the huge differences in the pricing of road noise throughout Europe.
Both the Swedish and Danish valuations of road traffic noise take both life quality (annoyance) and health considerations into account. In the UK approach, amenity and noise annoyance values are added to the independently derived health values of an increase or decrease of 1 dB. These vary depending on the noise level. The Disability-Adjusted Life-Year (DALY) method, provided by the WHO (WHO, 2016), calculates the burden of disease based on exposure–response relationship, exposure distribution, background prevalence of disease, and disability weights of the outcome. The excess noise annoyance, sleep disturbances, mortality and morbidity due to living in a noisy environment are assessed and accumulated in one indicator. After assigning a monetary value to one DALY, the results can be converted to monetary terms. However, assigning such a monetary value raises a number of difficult questions concerning the value of life, whether a life in one country is worth the same as in another and so on (see chapter 5.2.2)
When taking health effects into account, as is done in the UK, the value of reducing noise at high levels with one dB increases – which means that economic calculations will indicate that projects focusing on reducing high-noise situations, all things being equal, will ‘pay more’ than reducing noise levels in medium- and low-level situations (CEDR, 2015).
1 For road transport, the (interim) use of the median value change in noise perceived by households of EUR 25 per dB (Lden), per household per year. The validity range of this interim value is between 50/55 Lden and 70/75 Lden and it should be adjusted as new research on the value of noise becomes available (WGHSEA, 2003). It is assumed that the value of 50 dB (Lden) is EUR 25.

Page 14 / 56
CEDR Technical Report 2017-03- Noise cost-benefit analysis and cost-effectiveness analysis
Figure 5: Unit cost for road noise for four different countries and the recommended EC value from (WGHSEA, 2003)2.
As can be seen from Figure 5, unit prices for noise vary enormously especially at higher noise exposure levels. The “EU value” and the Dutch unit values are by far the lowest. At 55 dB, the differences between DK, NL, SE and UK vary by up to about 100%. At 65 dB, the unit values for noise vary by more than 800 %. The differences can be seen in Figure 6 where costs are indexed to the “EU value” price as index 100.
Figure 6 Difference in costs of road noise (EU price = index 100) at 55 dB and 65 dB for four different European countries and the recommended value from (WGHSEA, 2003). EU
(price 2003) DK
(price 2015) UK
(price 2015) SE
(price 2015) NL
(price 2010)
55 dB 100 122 202 144 85
65 dB 100 194 320 877 96
2 The Swedish cost factors, determined in LAaeq,24h and euros per person, are adjusted by assuming that Lden-values are 3 dB higher than
LAeq,24h-values and by presuming that there are two persons per household. The values from the Netherlands are also based on the assumption that there are two persons per household. The UK values use the UK noise indicator LAeq,18h instead of Lden (LAeq,18h may differ approx. 0.5 dB from Lden).
0
500
1000
1500
2000
2500
3000
3500
4000
4500
5000
45 46 47 48 49 50 51 52 53 54 55 56 57 58 59 60 61 62 63 64 65 66 67 68 69 70 71 72 73 74 75 76 77 78 79
Euro
pe
r h
ou
seh
old
pe
r ye
ar
Noise level dB (Lden)
SE (price level 2015) DK (price level 2015) EC (2003)
UK (price level 2015) NL (pricelevel 2010)
Page 15 / 56
CEDR Technical Report 2017-03- Noise cost-benefit analysis and cost-effectiveness analysis
5.2.2 Costs factors from the HEATCO project
The project Harmonised European Approaches for Transport Costing and Project Assessment (HEATCO) (HEATCO, 2004a) developed a set of harmonised guidelines for project assessment and transport costing on the EU level in different areas like costs from health impacts and costs of other nuisances due to noise (annoyance). For noise costs, it is suggested to use country-specific values per person exposed to a certain noise level. The suggested impact indicator, which should be reported alongside with the monetary results, is the number of persons highly annoyed.
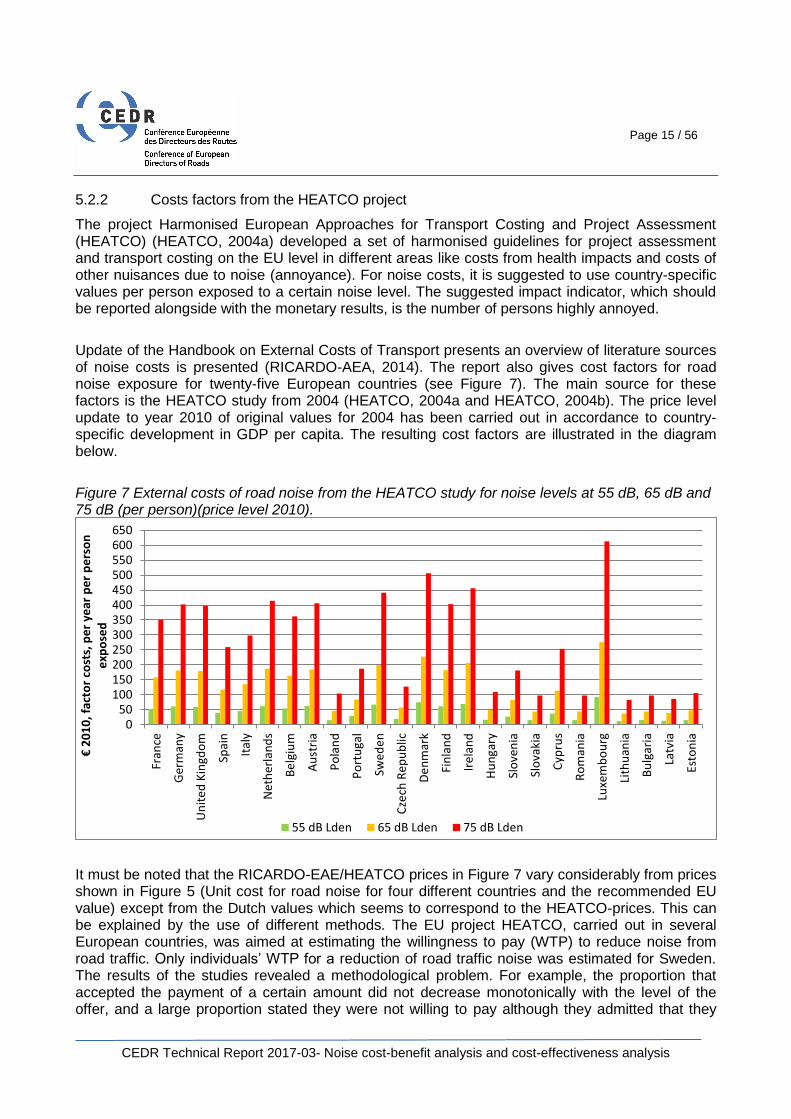
Update of the Handbook on External Costs of Transport presents an overview of literature sources of noise costs is presented (RICARDO-AEA, 2014). The report also gives cost factors for road noise exposure for twenty-five European countries (see Figure 7). The main source for these factors is the HEATCO study from 2004 (HEATCO, 2004a and HEATCO, 2004b). The price level update to year 2010 of original values for 2004 has been carried out in accordance to country-specific development in GDP per capita. The resulting cost factors are illustrated in the diagram below.
Figure 7 External costs of road noise from the HEATCO study for noise levels at 55 dB, 65 dB and 75 dB (per person)(price level 2010).
It must be noted that the RICARDO-EAE/HEATCO prices in Figure 7 vary considerably from prices shown in Figure 5 (Unit cost for road noise for four different countries and the recommended EU value) except from the Dutch values which seems to correspond to the HEATCO-prices. This can be explained by the use of different methods. The EU project HEATCO, carried out in several European countries, was aimed at estimating the willingness to pay (WTP) to reduce noise from road traffic. Only individuals’ WTP for a reduction of road traffic noise was estimated for Sweden. The results of the studies revealed a methodological problem. For example, the proportion that accepted the payment of a certain amount did not decrease monotonically with the level of the offer, and a large proportion stated they were not willing to pay although they admitted that they
050
100150200250300350400450500550600650
Fran
ce
Ger
man
y
Un
ite
d K
ingd
om
Spai
n
Ital
y
Net
her
lan
ds
Be
lgiu
m
Au
stri
a
Po
lan
d
Po
rtu
gal
Swed
en
Cze
ch R
epu
blic
De
nm
ark
Fin
lan
d
Ire
lan
d
Hu
nga
ry
Slo
ven
ia
Slo
vaki
a
Cyp
rus
Ro
man
ia
Luxe
mb
ou
rg
Lith
uan
ia
Bu
lgar
ia
Latv
ia
Est
on
ia
€ 2
01
0, f
acto
r co
sts,
pe
r ye
ar p
er
pe
rso
n
exp
ose
d
55 dB Lden 65 dB Lden 75 dB Lden

Page 16 / 56
CEDR Technical Report 2017-03- Noise cost-benefit analysis and cost-effectiveness analysis
were disturbed, while others had a positive WTP even though they were not disturbed. As a consequence, the validity of the estimations in the HEATCO project is open to question (Andersson et al., 2013).
All in all, it must be concluded that the cost factors for road traffic noise are not robust. It will be beneficial to CEDR member countries to call for further research regarding this issue.
5.3 Economic impacts of noise in EU
When the European Commission presented its Green Paper on Future Noise Policy in 1996, it estimated the annual economic damage to the EU due to environmental noise as potentially ranging from EUR 13 million to EUR 30 billion (EC, 1996). The Green Paper considered that the key elements contributing to these external costs were a reduction of house prices, reduced possibilities of land use, increased medical costs, and the cost of lost productivity in the workplace due to illness caused by the effects of noise pollution. Subsequently, in its 2011 report on the implementation of the Environmental Noise Directive (END) (Directive 2002/49/EC), the European Commission estimated the social cost of rail and road traffic noise in the EU as being EUR 40 billion per year, of which 90 % was related to passenger cars and goods vehicles (EC, 2011).
According to the European Environmental Agency (EEA, 2014), a number of EU member states have made their own analysis of the costs associated with exposure to noise. In Sweden, the social cost of road traffic noise in that country was estimated as being over SEK 16 billion. In the United Kingdom, the Intergovernmental Group on Costs and Benefits estimated the social cost of environmental noise in England alone as GBP 7-10 billion per annum. This places it at a similar magnitude to road accidents (GBP 9 billion) and significantly greater than the impact of climate change (GBP 1–4 billion). The most severe health effects of noise, such as the impact upon cardiovascular disease, were estimated in the same report as costing GBP 2–3 billion per year. Effects on amenity, which reflects consumer annoyance through noise exposure, was estimated as costing GBP 3–5 billion each year. Furthermore, the impact upon productivity relating to factors such as reduced work quality as a result of tiredness or noise acting as a distraction was estimated to cost GBP 2 billion every year.
In Switzerland, the external costs of transport noise have been estimated as approximately EUR 1.5 billion, of which 81 % is attributable to road traffic, 15 % to railways and 4 % to aircraft noise.
Concerning the former approach, a European Commission working group earlier developed a position paper on 'Valuation of noise' (WGHSEA, 2003) based on the willingness-to-pay principle, drawing upon data from (Navrud, 2002). The paper recommends the use of a benefit of €25 per household per decibel per year above noise levels of Lden = 50–55 dB. Even though this figure has been criticised by some as being too low, it appears that most noise-abatement measures do deliver a positive cost/benefit ratio (EEA, 2010). Hedonic pricing data come from studies of real estate markets, for which it is found that properties exposed to higher noise levels will typically have a lower value on the market than similar buildings exposed to lower noise levels. This relationship is well documented for residential houses (for which there is extensive literature) and probably may be similar for commercial office buildings. A best estimate is that house prices lose 0.5 % of their value per decibel over 50–55 dB Lden. The range of research results is between 0.2 % and 1.5 %, with a tendency for higher values for aircraft noise (EEA, 2010).

Page 17 / 56
CEDR Technical Report 2017-03- Noise cost-benefit analysis and cost-effectiveness analysis
6 Practical use of cost-benefit analysis and cost-effectiveness analysis
Both cost-benefit analysis and cost-effectiveness analysis are useful tools for programme evaluation. Cost-effectiveness analysis is a technique that relates the costs of a programme to its key outcomes or benefits. Cost-benefit analysis takes that process one step further, attempting to compare costs with the monetary value of all (or most) of a programme’s many benefits (RICARDO-AEA, 2014). These seemingly straightforward analysis can be applied any time before, after, or during the implementation of a programme, and they can greatly assist decision makers in assessing a programme’s efficiency. However, the process of conducting a CBA or CEA is much more complicated than it may sound from a summary description. Cost-effectiveness analysis seeks to identify and place monetary value on the costs of a programme. It then relates these costs to specific measures of programme effectiveness. Analysts can obtain a programme’s cost-effectiveness (CE) ratio by dividing costs by what we term units of effectiveness:
Cost-Effectiveness Ratio = Total Cost
Units of Effectiveness
Units of effectiveness are simply a measure of any quantifiable outcome central to the programme’s objectives. For example, a programme for prioritisation of noise control would likely consider the reduced number of dwellings exposed to noise to be the most important outcome. Using the formula just given and dividing e.g. units of noise reduced dwellings by the costs of implementing the measures you can calculate a cost-effectiveness ratio, interpreted as “euros per noise reduced dwelling“. You could then compare CE ratios for different kinds of noise mitigation measures, to determine which mitigation measure costs less per unit of outcome (in this case reduced number of noise exposed dwellings). The method can be used for a myriad of other outcomes of interest as well. For example, an analyst could also compute cost-effectiveness ratios for which noise exposed residential areas should have the highest priority with regard to noise reduction. In this case, you divide the estimated cost of noise barriers for each residential area in the study with the estimated noise reduction per noise barrier. The smaller cost-effectiveness ratio is the better project.
Like cost-effectiveness analysis, cost-benefit analysis also identifies and places monetary values on the costs of programmes, but it goes further, weighing those costs against the monetary value of programme benefits. Typically, analysts subtract costs from benefits to obtain the net benefits of the policy (if the net benefits are negative, they are referred to as net costs):
Net Benefits = Total Benefits – Total Cost In that way, CBA takes a more comprehensive approach than CEA, expanding the scope of analysis to include all impacts for those affected by the measure. The objective of the CBA is to achieve the best overall performance in money terms, versus the cost (Cellini & Kee, 2015).

Page 18 / 56
CEDR Technical Report 2017-03- Noise cost-benefit analysis and cost-effectiveness analysis
Many countries use cost-benefit analysis as a part of the basis for decision-making in connection with individual road planning projects where all the impacts are valuated in monetary units and added to the overall value of the project (Danish Transport Research Institute, 2007). The CBA approach is more demanding than CEA because all relevant effects need to be assigned a monetary value. When such assignments are available, the cost efficiency of a noise reduction method can be calculated. Note that efficiency is different from effectiveness. Figure 8 shows the main components included in cost-benefit analysis of road projects.
Figure 8 Overview of main issues per cost category (RICARDO-AEA, 2014). Cost-benefit component Cost-benefit elements
Construction costs Direct costs of the project
Congestion costs (road) Time and operating costs Additional safety and environmental costs
Accident costs Medical costs Production losses Loss of human life
Air pollution Health costs Years of human life lost Crop losses Building damage Costs to nature and biosphere
Noise costs Annoyance costs Health costs Rent losses
Climate change Prevention costs to reduce risk of climate change Damage costs of increasing temperature
Costs to nature and landscape Costs to reduce separation effects Compensation costs to ensure biodiversity
Additional environmental costs (water, soil) Costs to ensure soil and water quality
Additional costs in urban areas Separation costs for pedestrians Costs of scarcity of non-motorised traffic

Page 19 / 56
CEDR Technical Report 2017-03- Noise cost-benefit analysis and cost-effectiveness analysis
7 Practical examples of the use of CBAs
In the following, there are three different examples of CBAs that on an overall level show to what extent noise impacts influence costs or benefits in different projects with different purposes:
1. Enlargement of a motorway – where the main purpose is to counteract congestion
2. Lowering speed limit – where the main purpose is to reduce noise
3. Use of noise-reducing asphalt – where the main purpose is to reduce noise
The three example projects are evaluated using the Danish method of calculating economic costs of transport (Danish Ministry of Transport, 2015), which consist of practically the same cost-benefit components as shown in Figure 8.
In policy making, the economic analysis is a key part of the overall decision making. The analysis can predict whether a given action or project leads to an economic benefit to society.
The economic method gives an indication of the situations where you get value (or best value) for money, but the method does not tell the whole story. The method thus does not capture whether the distribution of advantages and disadvantages of a project is desirable. For example, it is a political balancing act, to what extent it is desired to prevent or reduce noise for humans. In the economic analysis, distribution of benefits/disadvantages is not included. For example, a disadvantage such as noise can be characterised as affecting a minority of people in society, and it is typically the same individuals who are exposed to the noise every day.
7.1 Enlargement of a motorway
The first example describes the consequences of enlargement of 13 km of motorway south of Odense (Denmark) from 4 to 6 lanes (Danish Road Directorate, 2011a).
Figure 9 Section of motorway to be enlarged.
Using a traffic model, the overall average number of kilometres driven and volume of time savings per. day was calculated. The numbers of kilometres driven is more or less the same no matter if
Page 20 / 56
CEDR Technical Report 2017-03- Noise cost-benefit analysis and cost-effectiveness analysis
the road expanded or not, namely by approximately 76,000 km per. day. Compared to the existing road (Alternative 0) the enlargement of the 13 kilometres of motorway results in reduced time consumption for the users' of the road. The total time consumption is reduced by about 4,800 hours per. day. The total number of dwellings exposed to more than 58 dB Lden decreases from about 2,117 homes (Alternative 0) to 2,064 homes due to approx. 5 km of noise barriers as a part of the overall road project.
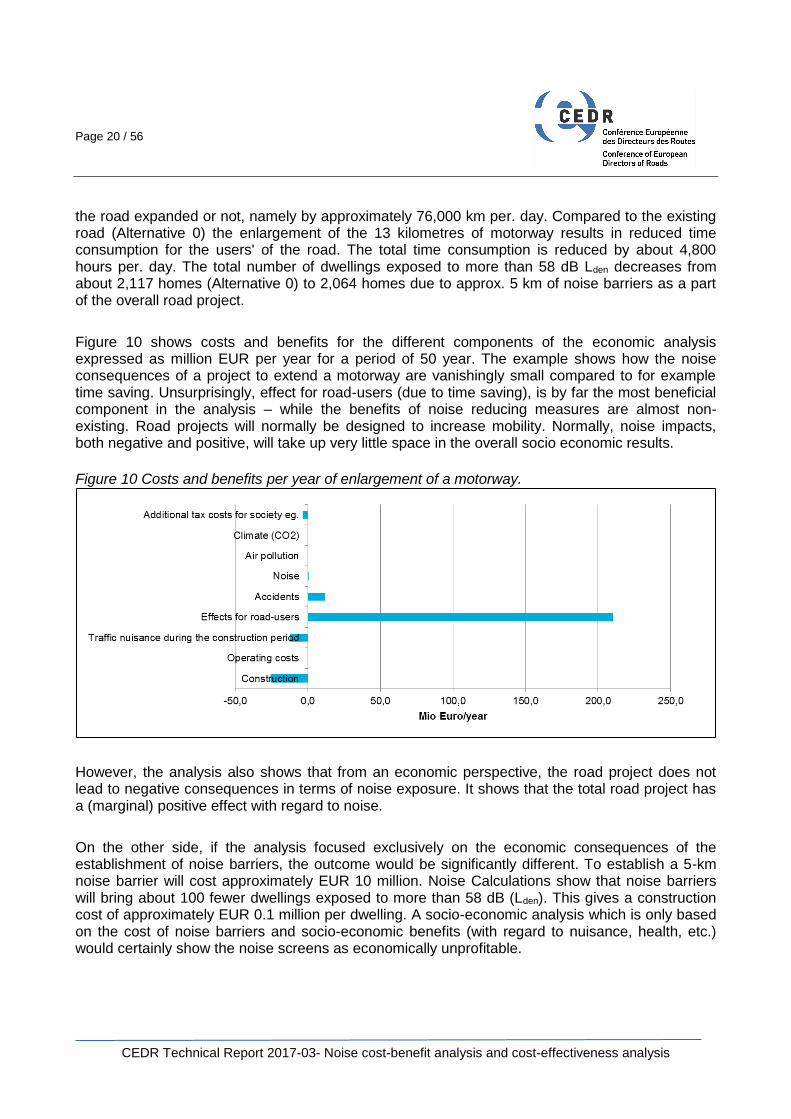
Figure 10 shows costs and benefits for the different components of the economic analysis expressed as million EUR per year for a period of 50 year. The example shows how the noise consequences of a project to extend a motorway are vanishingly small compared to for example time saving. Unsurprisingly, effect for road-users (due to time saving), is by far the most beneficial component in the analysis – while the benefits of noise reducing measures are almost non-existing. Road projects will normally be designed to increase mobility. Normally, noise impacts, both negative and positive, will take up very little space in the overall socio economic results.
Figure 10 Costs and benefits per year of enlargement of a motorway.
However, the analysis also shows that from an economic perspective, the road project does not lead to negative consequences in terms of noise exposure. It shows that the total road project has a (marginal) positive effect with regard to noise.
On the other side, if the analysis focused exclusively on the economic consequences of the establishment of noise barriers, the outcome would be significantly different. To establish a 5-km noise barrier will cost approximately EUR 10 million. Noise Calculations show that noise barriers will bring about 100 fewer dwellings exposed to more than 58 dB (Lden). This gives a construction cost of approximately EUR 0.1 million per dwelling. A socio-economic analysis which is only based on the cost of noise barriers and socio-economic benefits (with regard to nuisance, health, etc.) would certainly show the noise screens as economically unprofitable.

Page 21 / 56
CEDR Technical Report 2017-03- Noise cost-benefit analysis and cost-effectiveness analysis
7.2 Reduction of speed limit
The second example shows how CBA has been used to assess the socio-economic costs by lowering the speed limit on a very busy motorway through densely populated areas (Fryd, 2015). Once again it is the road-users’ transportation time which is crucial for the outcome.
An economic analysis has been made of the costs and benefits of reducing the speed limit from 110 km/h to 80 km/h in the evening and night time periods on weekdays and all day at weekends, on a very busy motorway in Copenhagen. The motorway passes through densely populated areas – approx. 40,000 dwellings are exposed to noise over 58 dB (Lden) along the sections of the motorway network (in total approx. 36 km) where it is assumed that the speed is reduced.
Using a traffic model, the overall average number of kilometres driven and the volume of time loss per day (due to lower speed limits) were calculated. Additionally, noise calculations were made for the reference situation and for a situation with new speed limits. Model calculations of the traffic and noise were then incorporated in the economic calculation.
Figure 11 shows the reduction of noise due to the reduced speed limit. The “green lines” indicate sections of the motorways where the noise is reduced from 1 dB to 2.6 dB as an average over the year. This is where the speed limit is assumed to be reduced. The “orange” and “red lines” indicate sections of roads where the noise will increase – due to slightly more traffic. Road users will choose other routes because of the speed reduction on the motorway they normally use.
Figure 11 Reduction of noise emission due to reduced speed limit from 110 to 80 km/h in the evening and night time periods on weekdays and all day at weekends.
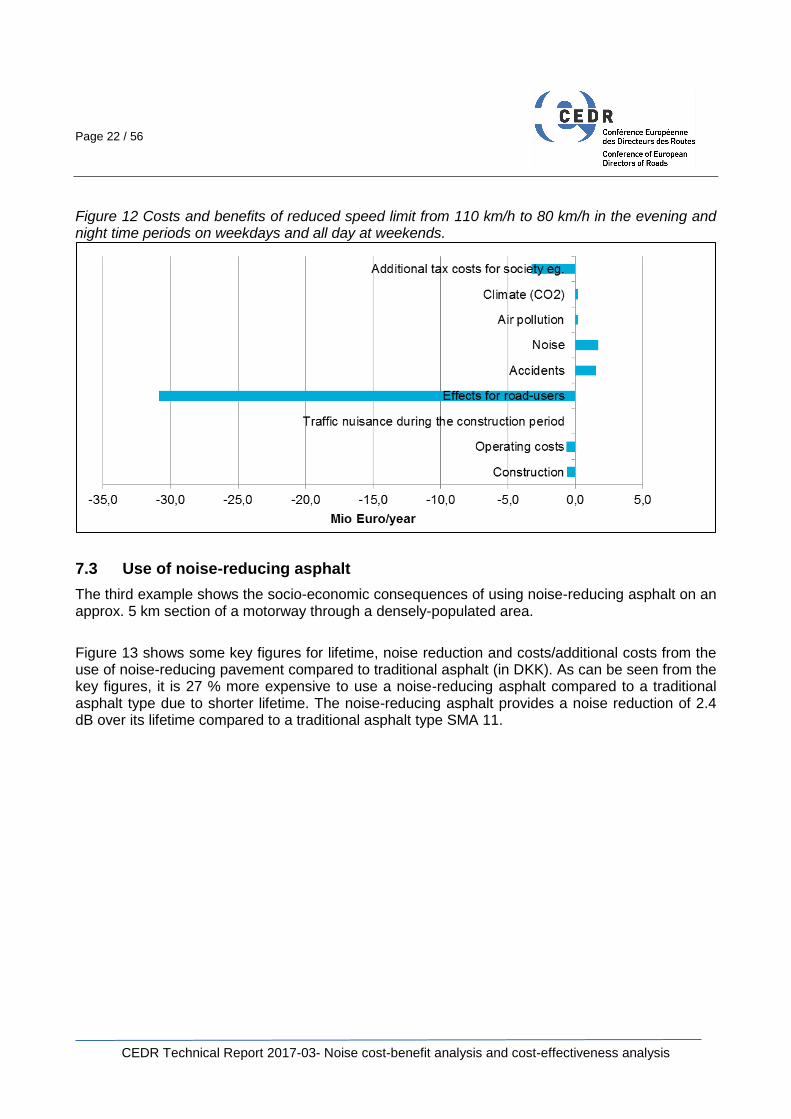
Figure 12 show that the total external effects (especially accidents and noise) provide a gain of approximately EUR 3.7 million per year in net present value as a result of reduced accidents and less noise. There are also minor gains for climate and air pollution. The overall economic outcome is a cost of about EUR 31.7 mil. per year in net present value. It is the loss of time which causes the negative result. The proposal will have a positive impact on the approximately 40,000 noise-exposed dwellings along the sections of motorway where speed reduction is proposed, but the positive noise-reducing effect will far from compensate for the negative effects due to loss of time.
Page 22 / 56
CEDR Technical Report 2017-03- Noise cost-benefit analysis and cost-effectiveness analysis
Figure 12 Costs and benefits of reduced speed limit from 110 km/h to 80 km/h in the evening and night time periods on weekdays and all day at weekends.
7.3 Use of noise-reducing asphalt
The third example shows the socio-economic consequences of using noise-reducing asphalt on an approx. 5 km section of a motorway through a densely-populated area.
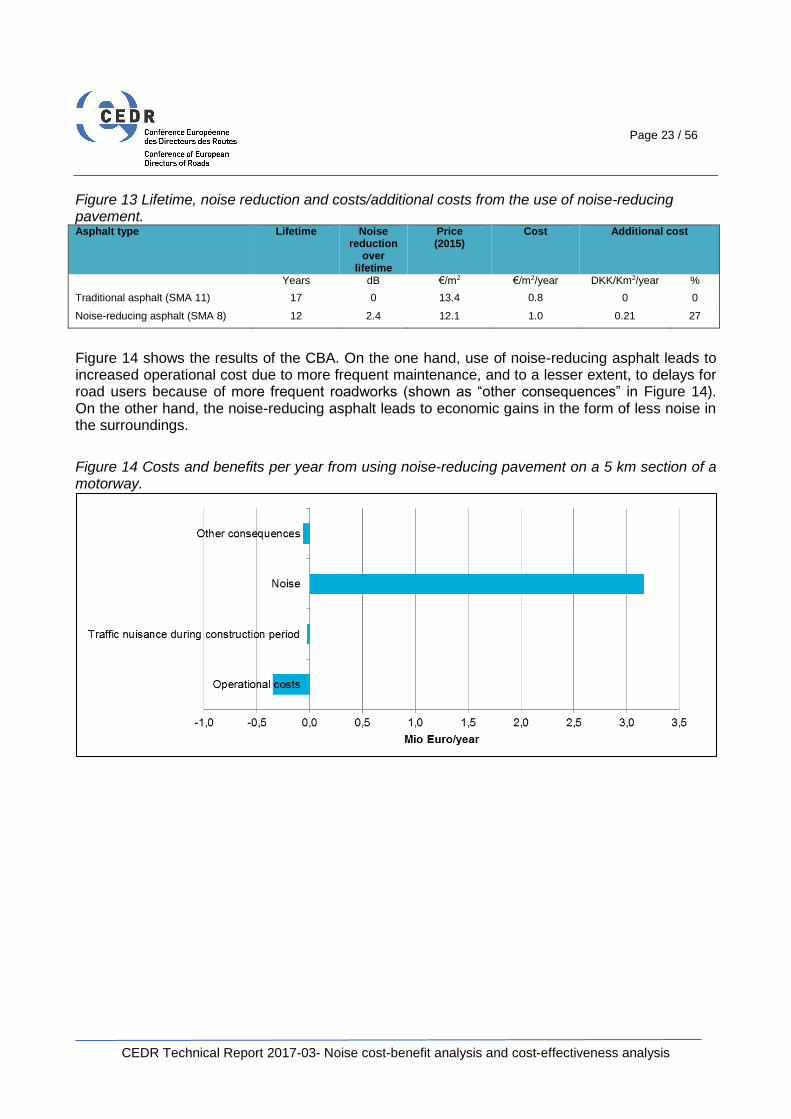
Figure 13 shows some key figures for lifetime, noise reduction and costs/additional costs from the use of noise-reducing pavement compared to traditional asphalt (in DKK). As can be seen from the key figures, it is 27 % more expensive to use a noise-reducing asphalt compared to a traditional asphalt type due to shorter lifetime. The noise-reducing asphalt provides a noise reduction of 2.4 dB over its lifetime compared to a traditional asphalt type SMA 11.
Page 23 / 56
CEDR Technical Report 2017-03- Noise cost-benefit analysis and cost-effectiveness analysis
Figure 13 Lifetime, noise reduction and costs/additional costs from the use of noise-reducing pavement. Asphalt type Lifetime Noise
reduction over
lifetime
Price (2015)
Cost Additional cost
Years dB €/m2 €/m2/year DKK/Km2/year %
Traditional asphalt (SMA 11) 17 0 13.4 0.8 0 0
Noise-reducing asphalt (SMA 8) 12 2.4 12.1 1.0 0.21 27
Figure 14 shows the results of the CBA. On the one hand, use of noise-reducing asphalt leads to increased operational cost due to more frequent maintenance, and to a lesser extent, to delays for road users because of more frequent roadworks (shown as “other consequences” in Figure 14). On the other hand, the noise-reducing asphalt leads to economic gains in the form of less noise in the surroundings.
Figure 14 Costs and benefits per year from using noise-reducing pavement on a 5 km section of a motorway.

Page 24 / 56
CEDR Technical Report 2017-03- Noise cost-benefit analysis and cost-effectiveness analysis
8 Costs of noise in road planning projects: examples from Denmark, Norway and The Netherlands
This chapter present examples of how cost-benefit analysis and cost effectiveness analysis are used in different countries. We present examples of approaches and policies for reducing noise from national roads. Additionally, there are examples of how different countries have priced the cost of the noise.
8.1 Valuing noise cost/benefits from a road project in Denmark
8.1.1 Methodology
The basis for calculating the costs of noise lies in calculating the total noise exposure. To calculate this, the so-called Noise Exposure Score (NES) is used (Danish EPA, 2010). The NES is an expression of the accumulated noise load on all dwellings in an area, calculated as the sum of the weighted noise loads on dwellings. Dwellings with high noise levels weigh more than dwellings with lower noise levels.
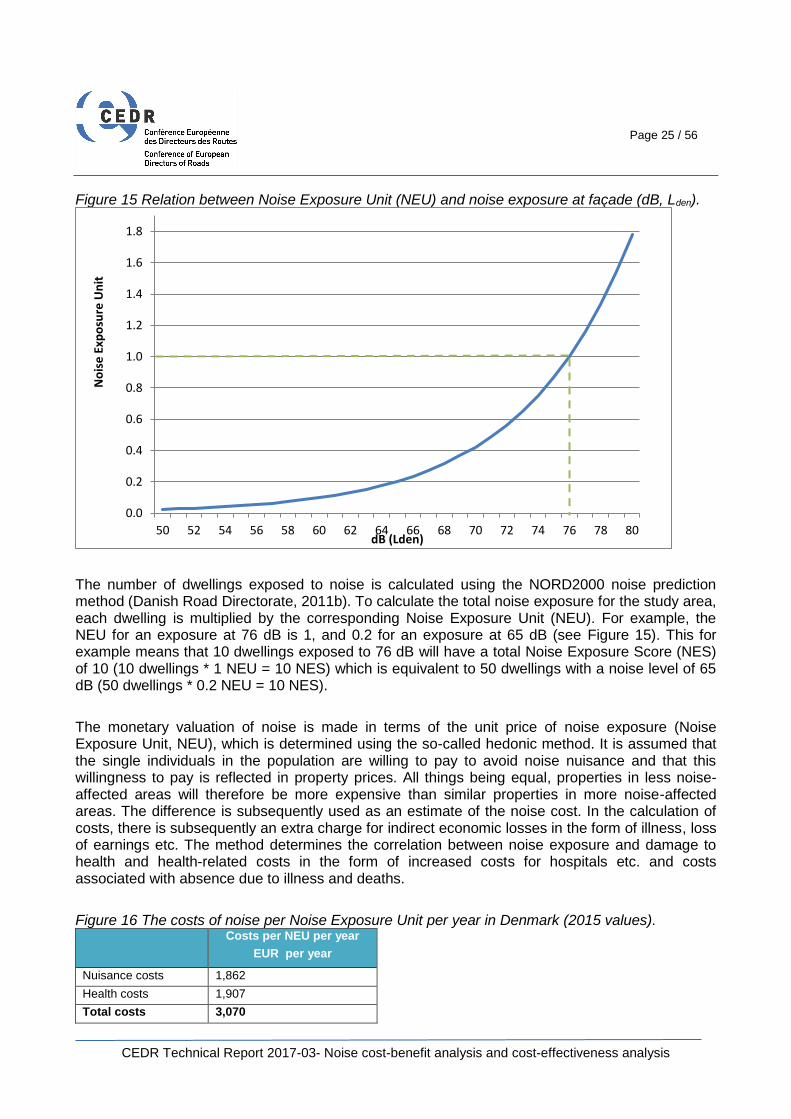
The calculation of the NES is based on noise levels outside the façade of the dwelling. It is calculated as free-field values on the facade and can be interpreted as the noise level to which the inhabitants are exposed when the windows are open. The NES is based on a dose-response relation called the Noise Exposure Unit (NEU):
Noise Exposure Unit = 0.01*4.220.1(Lden-C), where:
C is a constant = 44 and
Lden is the calculated noise exposure at the façade.
The relation between the Noise Exposure Unit and the noise level is shown in Figure 15.
Page 25 / 56
CEDR Technical Report 2017-03- Noise cost-benefit analysis and cost-effectiveness analysis
Figure 15 Relation between Noise Exposure Unit (NEU) and noise exposure at façade (dB, Lden).
The number of dwellings exposed to noise is calculated using the NORD2000 noise prediction method (Danish Road Directorate, 2011b). To calculate the total noise exposure for the study area, each dwelling is multiplied by the corresponding Noise Exposure Unit (NEU). For example, the NEU for an exposure at 76 dB is 1, and 0.2 for an exposure at 65 dB (see Figure 15). This for example means that 10 dwellings exposed to 76 dB will have a total Noise Exposure Score (NES) of 10 (10 dwellings * 1 NEU = 10 NES) which is equivalent to 50 dwellings with a noise level of 65 dB (50 dwellings * 0.2 NEU = 10 NES).
The monetary valuation of noise is made in terms of the unit price of noise exposure (Noise Exposure Unit, NEU), which is determined using the so-called hedonic method. It is assumed that the single individuals in the population are willing to pay to avoid noise nuisance and that this willingness to pay is reflected in property prices. All things being equal, properties in less noise-affected areas will therefore be more expensive than similar properties in more noise-affected areas. The difference is subsequently used as an estimate of the noise cost. In the calculation of costs, there is subsequently an extra charge for indirect economic losses in the form of illness, loss of earnings etc. The method determines the correlation between noise exposure and damage to health and health-related costs in the form of increased costs for hospitals etc. and costs associated with absence due to illness and deaths.
Figure 16 The costs of noise per Noise Exposure Unit per year in Denmark (2015 values). Costs per NEU per year
EUR per year
Nuisance costs 1,862
Health costs 1,907
Total costs 3,070
0.0
0.2
0.4
0.6
0.8
1.0
1.2
1.4
1.6
1.8
50 52 54 56 58 60 62 64 66 68 70 72 74 76 78 80
No
ise
Exp
osu
re U
nit
dB (Lden)
Page 26 / 56
CEDR Technical Report 2017-03- Noise cost-benefit analysis and cost-effectiveness analysis
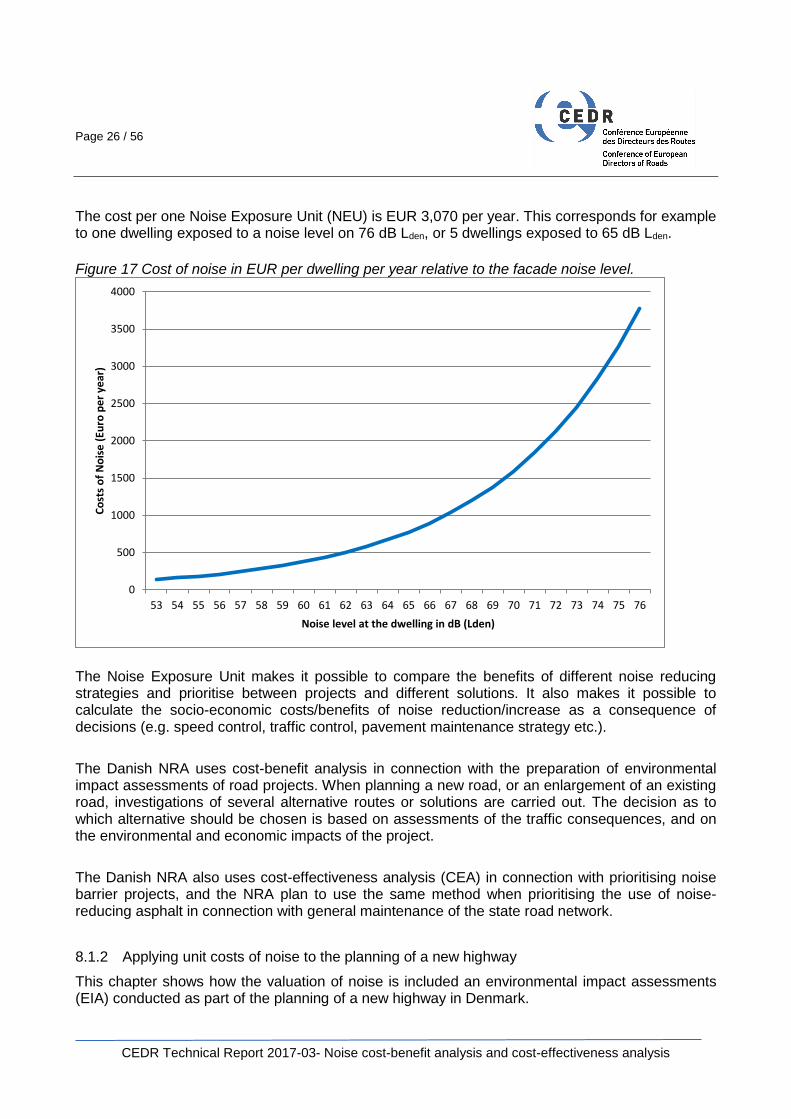
The cost per one Noise Exposure Unit (NEU) is EUR 3,070 per year. This corresponds for example to one dwelling exposed to a noise level on 76 dB Lden, or 5 dwellings exposed to 65 dB Lden.
Figure 17 Cost of noise in EUR per dwelling per year relative to the facade noise level.
The Noise Exposure Unit makes it possible to compare the benefits of different noise reducing strategies and prioritise between projects and different solutions. It also makes it possible to calculate the socio-economic costs/benefits of noise reduction/increase as a consequence of decisions (e.g. speed control, traffic control, pavement maintenance strategy etc.).
The Danish NRA uses cost-benefit analysis in connection with the preparation of environmental impact assessments of road projects. When planning a new road, or an enlargement of an existing road, investigations of several alternative routes or solutions are carried out. The decision as to which alternative should be chosen is based on assessments of the traffic consequences, and on the environmental and economic impacts of the project.
The Danish NRA also uses cost-effectiveness analysis (CEA) in connection with prioritising noise barrier projects, and the NRA plan to use the same method when prioritising the use of noise-reducing asphalt in connection with general maintenance of the state road network.
8.1.2 Applying unit costs of noise to the planning of a new highway
This chapter shows how the valuation of noise is included an environmental impact assessments (EIA) conducted as part of the planning of a new highway in Denmark.
0
500
1000
1500
2000
2500
3000
3500
4000
53 54 55 56 57 58 59 60 61 62 63 64 65 66 67 68 69 70 71 72 73 74 75 76
Co
sts
of
No
ise
(Eu
ro p
er
year
)
Noise level at the dwelling in dB (Lden)

Page 27 / 56
CEDR Technical Report 2017-03- Noise cost-benefit analysis and cost-effectiveness analysis
The first step is to predict the noise of the existing road network as it would be in the future, taking a traffic increase into consideration. Normally the future scenario represents the opening year of the coming road project. The existing road network includes the existing major road carrying the main traffic as well as other minor roads that might have an impact on the overall noise exposure in the area.
This predicted situation is called the “reference situation”. Different alternatives to this reference situation are investigated in the EIA (Danish Road Directorate, 2010). They suggest different routes for the road and therefore different noise impacts on the surroundings. They are referred to as the Main Solution (the solution which is suggested as the best solution), Alternative 1, 2, 3 etc. Noise mapping is conducted for these different alternatives. The dwellings exposed to different noise levels are counted based on the noise mapping, and the total Noise Exposure Score are calculated on the basis of the Noise Exposure Unit for each dwelling in the survey area.
An example of this kind is the EIA for a new road link over Roskilde Fiord. The purpose of the project is to improve the road connection across Roskilde Fiord. The existing road passes through the City of Frederikssund.
The EIA has studied several alternative solutions. The N solutions (N1 and N2) cover enlargement of the existing road through Frederikssund incl. noise barriers etc. The S solutions (S1, S2, S3 and S6) cover a new road link south of Frederikssund (se Figure 18). Figure 19 shows the grid noise maps for solutions N1 and S1 (Main Solution).

Page 28 / 56
CEDR Technical Report 2017-03- Noise cost-benefit analysis and cost-effectiveness analysis
Figure 18 Northern and southern solutions for a new road link across Roskilde Fiord.
Figure 19 Noise maps showing the noise impact (Lden) of two different solutions – Alternative N1 (left) and Main Solution (right)
The recommendation in the Danish EIA guidelines is to take into account noise levels exceeding 58 dB Lden at dwellings (Danish Road Directorate, 2013). These calculations form the basis for

Page 29 / 56
CEDR Technical Report 2017-03- Noise cost-benefit analysis and cost-effectiveness analysis
planning noise mitigation measures to achieve target level 58 dB Lden, and for estimating construction costs for noise mitigation measures.
Figure 20 Number of dwellings exposed to noise and the Noise Exposure Score (NES) for each solution. Situation
Number of noise exposed dwellings
Noise Exposure Score (NES)
Valuation of noise (EUR per year) Over 58 dB > 68 dB
Reference situation 1,817 93 281 7,891,604
N1, enlargement of existing road 1,780 79 271 7,610,764
N2, enlargement of existing road 1,785 76 267 7,498,428
S1, high bridge (main solution) 1,780 67 269 7,554,596
S2, short tunnel 1,766 67 268 7,526,512
S3, long tunnel 1,763 67 268 7,526,512
S6, very long drilled tunnel 1,762 67 268 7,526,512
In the reference situation, 1,817 dwellings in the area of investigation are exposed to more than 58 dB Lden. This represents a Noise Exposure Score (NES) value of 281 corresponding to costs as a result of noise exposure on EUR 7,891,604 per year. For the S1 solution (Main Solution) this is reduced to 1,780 dwellings with a NES reduction of 13 and a noise cost reduction of EUR 337,008 per year. The other alternatives represent almost the same reductions of NES. This shows that the alternative solutions are offering less noise exposure for the dwellings in the area of investigation, mainly because the noise exposed dwellings in town have obtained a reduction in noise.
The Noise Exposure Score is included in the economic analysis of the road project. The socio-economic costs/benefits of reduced/increased noise from a new road project will usually not have any impact in the overall impact estimates. What really counts in the socio-economic calculation is saved travel time for the road users. But anyway, the socio-economic impact of noise is highlighted by the noise mapping and the calculation of noise costs for the different alternatives. This information is used in the public consulting process and also in the final decision on which alternative to select.
8.2 Valuing noise cost/benefit from a road project in Norway
The Norwegian Planning and Building Act regulates land-use planning in Norway. This law states when an impact assessment become mandatory. The Norwegian Public Roads Administration’s (NPRA) procedure for impact assessment consists of a socioeconomic analysis. The analysis distinguishes between monetised and non-monetised impacts. A project is profitable to society when the total evaluation of the non-monetised impacts and the calculated net benefit is positive. Noise is a part of the impact assessment (IA) and is assessed in accordance with land-use guidelines in force. The IA affects decisions as to where new roads should run, and noise guidelines regulate the planning of noise abatement measures in road construction projects.
8.2.1 Noise guidelines in land-use planning in Norway
Norway has guidelines to control noise in land-use planning in Norway (Miljodirektoratet, 2014). The guidelines (see Figure 21) define a red zone (over 65 dB Lden, not suitable for noise-sensitive constructions) and a yellow zone (over 55 dB Lden requiring noise mitigation efforts). The target level of 55 dB Lden in the guidelines should be the basis for all road planning under the Norwegian

Page 30 / 56
CEDR Technical Report 2017-03- Noise cost-benefit analysis and cost-effectiveness analysis
Planning and Building Act. Calculations made in accordance with the noise guidelines provides the basis for the impact assessment, as well as the basis for planning noise abatement measures of meeting recommended noise limits. Figure 22 shows an example of noise zones in the early planning stages of a road project.
Figure 21 Noise zone definitions. (Guidelines for noise in land-use planning in Norway (Miljodirektoratet, 2014).
Source Yellow zone Red zone
24 hours Night-time 23-07 hours
24 hours Night-time 23-07 hours
Road 55 dB Lden 70 dB L5AF 65 dB Lden 85 dB L5AF
Figure 22 Red and yellow noise zones calculated in accordance with Norwegian guidelines in the early planning process. Project scheme without noise screens on the left, (2035), and project scheme with noise screens on the right (2035) (E18 Gulli Langåker, calculations by Sweco).
8.2.2 Cost-benefit analysis and noise annoyance
The monetised impacts of noise in the IA are included in the investment costs and socioeconomic costs. Costs of noise abatement measures are included in the investment costs. The number of people exposed to levels above limit values is the basis for calculating socioeconomic costs. Traffic noise in recreational areas, natural areas etc. is evaluated as a non-monetised impact. The non-monetised impacts of noise are evaluated as a part of the IA theme - community life and outdoor recreation.
The calculated number of people highly annoyed (over 65 dB Lden) is the basis for calculating socioeconomic costs in Norway. The Norwegian authorities use the value EUR 2,250 per highly annoyed person per year in 2013-values in calculations. The value is based on ECON 2001, a Norwegian study.
Here is a simplified description of the calculation method:
Future noise levels for the year the road will be opened are calculated.
The number of persons highly annoyed is calculated.
The number of highly annoyed persons is multiplied by the value used by Norwegian authorities.
Page 31 / 56
CEDR Technical Report 2017-03- Noise cost-benefit analysis and cost-effectiveness analysis
The number of highly annoyed persons is calculated with the Nordic prediction method for road traffic noise (version 1996), implemented in the calculation program VSTØY. When using other calculation tools the valuation basis is dB levels, and the value is EUR 43 per person per dB per year (2013-value). The appraisal period is 40 years. Only dwellings with noise levels over 55 dB are included in the calculations.
The Norwegian Noise Annoyance Index (NAI) is an alternative approach to calculating noise
annoyance, using mean annoyance score. This method is described in more detail in the WP2
report from the ON-AIR project (ON-AIR, 2015).
The NPRA is planning to update the current valuation method. The current valuation method,
based on the ECON 2001 study, only include noise annoyance costs and health costs are most
likely not included. A valuation method based on the HEATCO values has been considered. The
unit value, for road traffic noise based on HEATCO values is about EUR 35 per dB year (2010
value), and per person (exposed for noise over 55 dB) (see chapter 5.2.2 for explanation of the
HEATCO-project).
8.2.3 “Ambition level method” – Norway
The Norwegian Public Roads Administration (NPRA) uses cost-effectiveness analysis (CEA) in connection with assessment of noise measures.
The noise guidelines recommended limit value is 55 dB Lden outside dwellings, but project costs,
efficacy measures and other practical considerations may limit the scope of action within a project.
The NPRA has developed a tool, “Ambisjonsnivåmetoden” (Statens vegvesen, 2007), here
translated as “Ambition level method”. The method is useful for estimating costs for noise
abatement in an early project phase and considering scope of action within a project. The steps in
the method are described in short below:
1. Determine the number of dwellings taken into consideration for noise abatements in
this road project.
All dwellings within the project plan exposed for noise levels above 55 dB Lden outside windows
(noise sensitive rooms), or dwellings with noise levels above 55 dB Lden in outdoor areas, should
be taken into consideration.
2. Make an estimate of costs for noise abatements.
The method include a “precalculated average cost” (N0) for meeting recommended noise limits
based on calculated outdoor noise levels. The precalculated average cost (N0) is the basis for a
cost estimate in the early planning phase.
N0 = Lden-55 * 40 000 NOK (Norwegian currency, 2015 value). Lden is the noise level on the most
exposed façade, at a height of 4 metre (or at each floor at the building).
N0 values are calculated for all buildings in the project above 55 dB Lden, and are the basis for total
cost estimates N. The values should only be used as a basis for estimating total project costs, the
estimates are not applicable to one single dwelling. An example is given in the table below;

Page 32 / 56
CEDR Technical Report 2017-03- Noise cost-benefit analysis and cost-effectiveness analysis
Figure 23 N0 values are calculated for all buildings (A to I) above 55 dB Lden. In this example there are 10 dwellings exposed for noise levels from 54 to 67 dB. Estimated total costs (N) is 2,1 mill NOK, including noise abatements for reducing indoor and outdoor levels below recommended limit values.
3. Determine the “Ambition level” for noise abatements in the road project.
Project costs, efficacy measures and other practical considerations limit the scope of action within
a project. When noise abatement measures are planned in more detail, there are more accurate
cost estimates available. Updated cost estimates for noise abatement measures are then
compared to “precalculated average cost” in order to determine the ambition level for noise
abatement measures. If the cost estimates for the noise abatements needed are higher than the
“precalculated noise cost”, the method include recommendations for how to consider possibly
higher noise limits and alternative noise abatement measures. The method suggests accepting
higher noise limits if the average costs are considerably higher than N0. If the average costs for
noise abatement measures are higher than two times “the precalculated average costs” (N0), other
project scenarios should be considered.
8.3 Valuing cost-benefits for a road project in The Netherlands
In the Netherlands, infrastructural projects go through a CBA process. The Dutch way of doing CBAs is laid down in a guideline (CP & PBL, 2013). The process is briefly described in the table below.
Figure 24 Steps in CBA for infrastructural projects Step Issue Description
1 Problem analysis What is the problem (mostly traffic congestion)
2 Zero alternative Most likely future development if no project is carried out
3 Project alternatives Develop different solutions to solve the problem
4 Effects Describe effects on accessibility, environment and traffic safety
5 Monetising effects Value the effects in terms of benefits and costs
6 Risk analysis Deal with main risks and uncertainty
7 Overview costs and benefits Balance costs and benefits, including the Net Present Value
8 Report Present results in report
Page 33 / 56
CEDR Technical Report 2017-03- Noise cost-benefit analysis and cost-effectiveness analysis
Describing all effects, benefits and costs is at the heart of cost-benefit analysis. However, this report deals with the effects and costs/benefits for noise only.
Determining noise effects
As for noise, the common theme for the present situation, the zero alternative and the project alternatives is the noise levels at dwellings. Traffic forecasts and noise predictions for these situations reveal that the number of dwellings affected by noise and the noise levels at the dwellings are different. These represent the basic input data for noise: the numbers of dwellings having a specific noise level. Multiplied by the average household size, these figures give the numbers of people exposed to traffic noise with a specific noise level in dB Lden. There are CBAs, as in the example below, that only deal with noise annoyed people.
Valuing noise effects
There are different ways of valuing the total costs of noise. They all use the same principle: multiplying the change in the number of noise exposed people by the price of noise exposure. However, there are different ways of dealing with shadow prices, ranging from a basic way with just one figure for a wide range of noise levels to a more sophisticated approach with different costs for different noise levels.
The best way to explain the Dutch way of valuing noise in CBA, is to use a recent example: the CBA for the improvement of the road structure around the city of Eindhoven (DECISIO, 2014). Besides the zero alternative, four alternatives were investigated in this study.
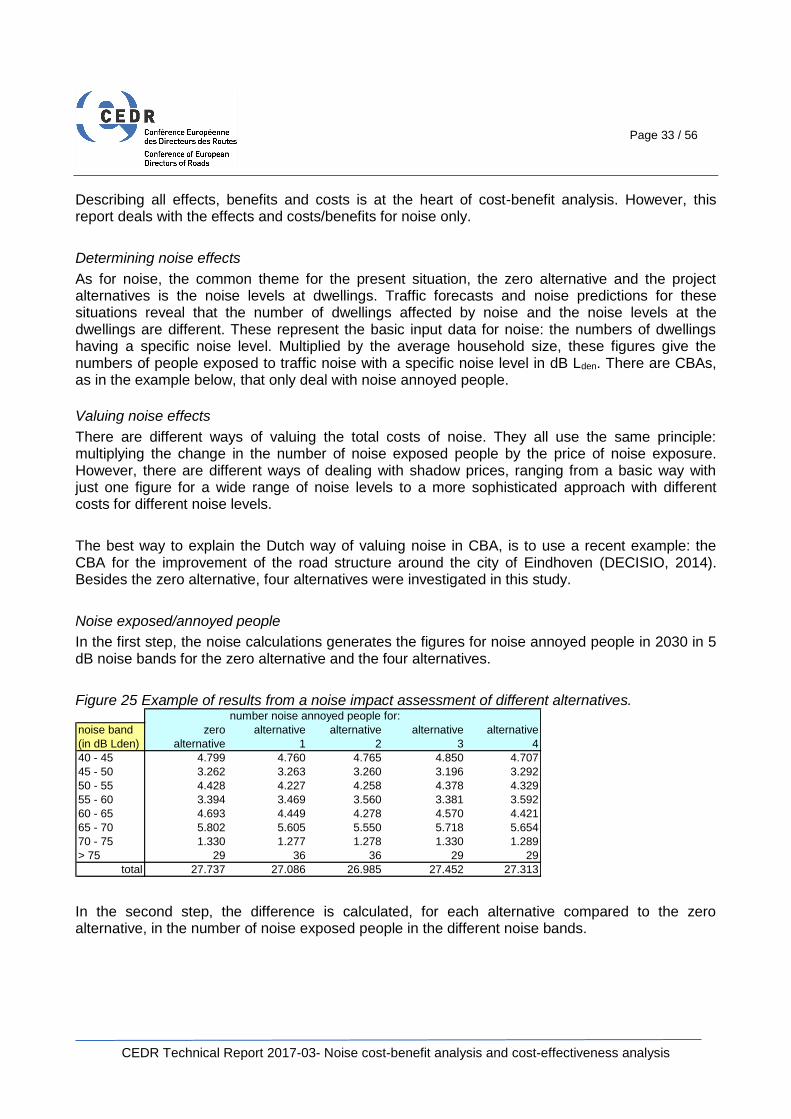
Noise exposed/annoyed people
In the first step, the noise calculations generates the figures for noise annoyed people in 2030 in 5 dB noise bands for the zero alternative and the four alternatives.
Figure 25 Example of results from a noise impact assessment of different alternatives.
In the second step, the difference is calculated, for each alternative compared to the zero alternative, in the number of noise exposed people in the different noise bands.
number noise annoyed people for:
noise band zero alternative alternative alternative alternative
(in dB Lden) alternative 1 2 3 4
40 - 45 4.799 4.760 4.765 4.850 4.707
45 - 50 3.262 3.263 3.260 3.196 3.292
50 - 55 4.428 4.227 4.258 4.378 4.329
55 - 60 3.394 3.469 3.560 3.381 3.592
60 - 65 4.693 4.449 4.278 4.570 4.421
65 - 70 5.802 5.605 5.550 5.718 5.654
70 - 75 1.330 1.277 1.278 1.330 1.289
> 75 29 36 36 29 29
total 27.737 27.086 26.985 27.452 27.313

Page 34 / 56
CEDR Technical Report 2017-03- Noise cost-benefit analysis and cost-effectiveness analysis
Figure 26 Difference in noise exposed/annoyed people.
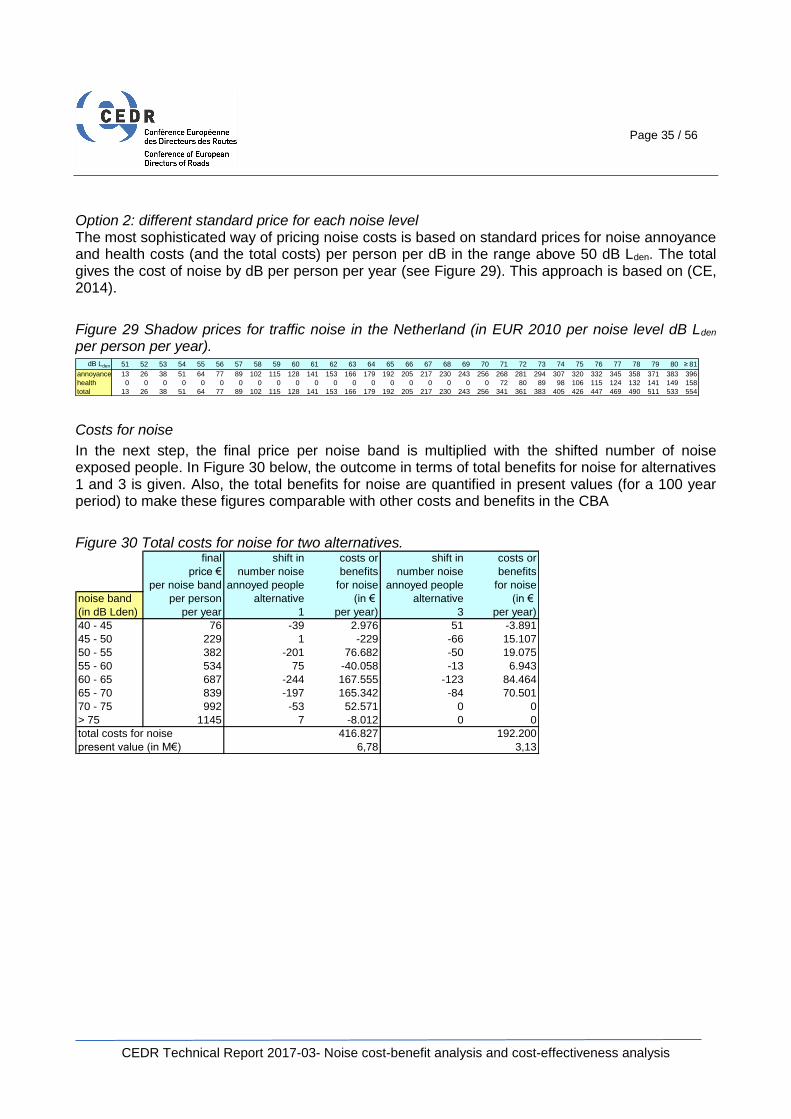
Standard prices
Each CBA has to deal with the issue of what standard prices to use. In this example a fixed standard price of EUR 30.523 per person per year (price level 2014) was used throughout the whole range of noise levels. This standard price is based on (CE, 2010). Multiplied by the average dBs above the threshold of 40 dB, this gives us the final prices in EUR per noise band per person per year.
Figure 27 Standard prices for costs of noise depending on noise exposure level.
However, nowadays the usual standard prices are not the same as the one used in the figure above. At this moment there are two options for standard prices.
Option 1: four noise bands with different standard prices The first option is based on (RIGO, 2012) and has fixed prices for four noise bands (price level 2011) (see Figure 28). Figure 28 Standard prices for four noise bands.
ROAD <55 55-65 66-75 >75
EUR per dwelling 0 29 43 49
3 Recently, it became clear the standard price in EUR per dB per person per year in Figure 27 is based on a misinterpretation of figures
in literature, esp. the incorrect use of the measurement unit ‘person’ versus ‘dwelling’. It should be EUR 12,72 per dB per person per year. The standard price of EUR 30,52 mentioned in Figure 27 is the standard price in EUR per dB per dwelling per year.
compared to zero alternative,
change in number noise annoyed people for:
noise band zero alternative alternative alternative alternative
(in dB Lden) alternative 1 2 3 4
40 - 45 0 -39 -34 51 -92
45 - 50 0 1 -2 -66 30
50 - 55 0 -201 -170 -50 -99
55 - 60 0 75 166 -13 198
60 - 65 0 -244 -415 -123 -272
65 - 70 0 -197 -252 -84 -148
70 - 75 0 -53 -52 0 -41
> 75 0 7 7 0 0
total 0 -651 -752 -285 -424
standard final
average dB price in € price in €
above per dB per noise band
noise band threshold per person per person
(in dB Lden) 40 dB per year per year
40 - 45 2,5 30,52 76
45 - 50 7,5 30,52 229
50 - 55 12,5 30,52 382
55 - 60 17,5 30,52 534
60 - 65 22,5 30,52 687
65 - 70 27,5 30,52 839
70 - 75 32,5 30,52 992
> 75 37,5 30,52 1.145
Page 35 / 56
CEDR Technical Report 2017-03- Noise cost-benefit analysis and cost-effectiveness analysis
Option 2: different standard price for each noise level The most sophisticated way of pricing noise costs is based on standard prices for noise annoyance and health costs (and the total costs) per person per dB in the range above 50 dB Lden. The total gives the cost of noise by dB per person per year (see Figure 29). This approach is based on (CE, 2014).
Figure 29 Shadow prices for traffic noise in the Netherland (in EUR 2010 per noise level dB Lden per person per year).
Costs for noise
In the next step, the final price per noise band is multiplied with the shifted number of noise exposed people. In Figure 30 below, the outcome in terms of total benefits for noise for alternatives 1 and 3 is given. Also, the total benefits for noise are quantified in present values (for a 100 year period) to make these figures comparable with other costs and benefits in the CBA
Figure 30 Total costs for noise for two alternatives.
dB Lden 51 52 53 54 55 56 57 58 59 60 61 62 63 64 65 66 67 68 69 70 71 72 73 74 75 76 77 78 79 80 ≥ 81
annoyance 13 26 38 51 64 77 89 102 115 128 141 153 166 179 192 205 217 230 243 256 268 281 294 307 320 332 345 358 371 383 396
health 0 0 0 0 0 0 0 0 0 0 0 0 0 0 0 0 0 0 0 0 72 80 89 98 106 115 124 132 141 149 158
total 13 26 38 51 64 77 89 102 115 128 141 153 166 179 192 205 217 230 243 256 341 361 383 405 426 447 469 490 511 533 554
final shift in costs or shift in costs or
price € number noise benefits number noise benefits
per noise band annoyed people for noise annoyed people for noise
noise band per person alternative (in € alternative (in €
(in dB Lden) per year 1 per year) 3 per year)
40 - 45 76 -39 2.976 51 -3.891
45 - 50 229 1 -229 -66 15.107
50 - 55 382 -201 76.682 -50 19.075
55 - 60 534 75 -40.058 -13 6.943
60 - 65 687 -244 167.555 -123 84.464
65 - 70 839 -197 165.342 -84 70.501
70 - 75 992 -53 52.571 0 0
> 75 1145 7 -8.012 0 0
total costs for noise 416.827 192.200
present value (in M€) 6,78 3,13
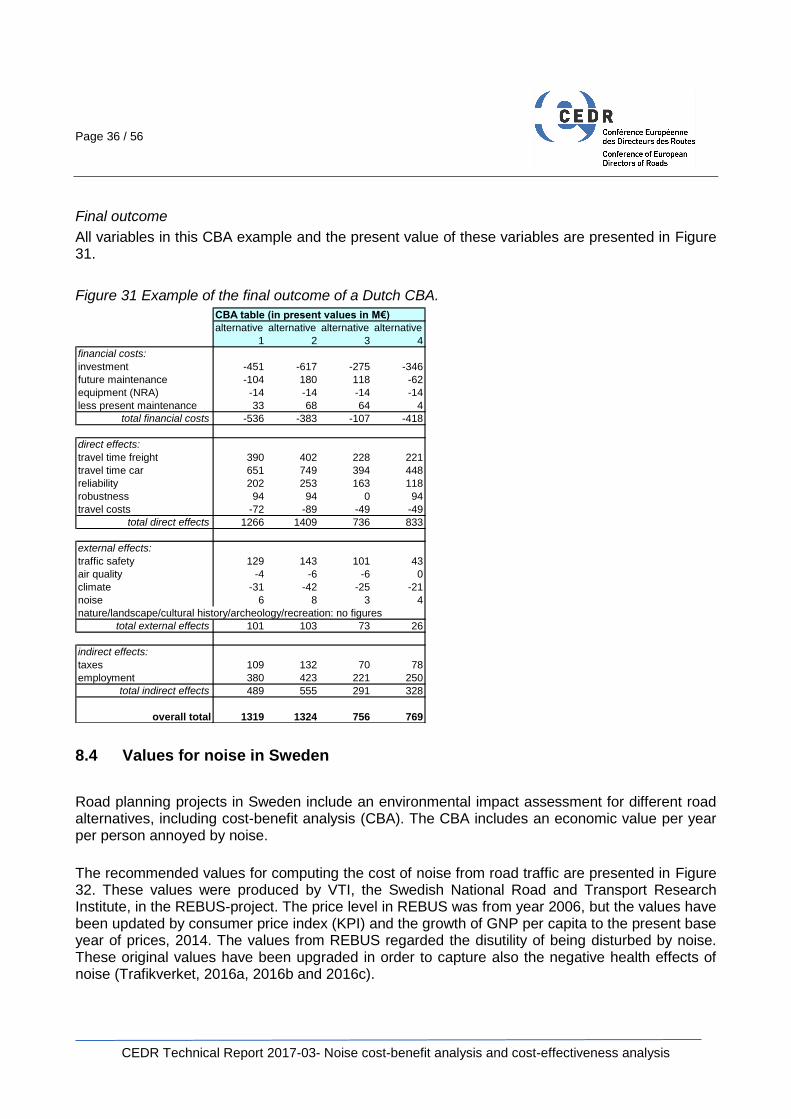
Page 36 / 56
CEDR Technical Report 2017-03- Noise cost-benefit analysis and cost-effectiveness analysis
Final outcome
All variables in this CBA example and the present value of these variables are presented in Figure 31.
Figure 31 Example of the final outcome of a Dutch CBA.
8.4 Values for noise in Sweden
Road planning projects in Sweden include an environmental impact assessment for different road alternatives, including cost-benefit analysis (CBA). The CBA includes an economic value per year per person annoyed by noise.
The recommended values for computing the cost of noise from road traffic are presented in Figure 32. These values were produced by VTI, the Swedish National Road and Transport Research Institute, in the REBUS-project. The price level in REBUS was from year 2006, but the values have been updated by consumer price index (KPI) and the growth of GNP per capita to the present base year of prices, 2014. The values from REBUS regarded the disutility of being disturbed by noise. These original values have been upgraded in order to capture also the negative health effects of noise (Trafikverket, 2016a, 2016b and 2016c).
CBA table (in present values in M€)
alternative alternative alternative alternative
1 2 3 4
financial costs:
investment -451 -617 -275 -346
future maintenance -104 180 118 -62
equipment (NRA) -14 -14 -14 -14
less present maintenance 33 68 64 4
total financial costs -536 -383 -107 -418
direct effects:
travel time freight 390 402 228 221
travel time car 651 749 394 448
reliability 202 253 163 118
robustness 94 94 0 94
travel costs -72 -89 -49 -49
total direct effects 1266 1409 736 833
external effects:
traffic safety 129 143 101 43
air quality -4 -6 -6 0
climate -31 -42 -25 -21
noise 6 8 3 4
nature/landscape/cultural history/archeology/recreation: no figures
total external effects 101 103 73 26
indirect effects:
taxes 109 132 70 78
employment 380 423 221 250
total indirect effects 489 555 291 328
overall total 1319 1324 756 769
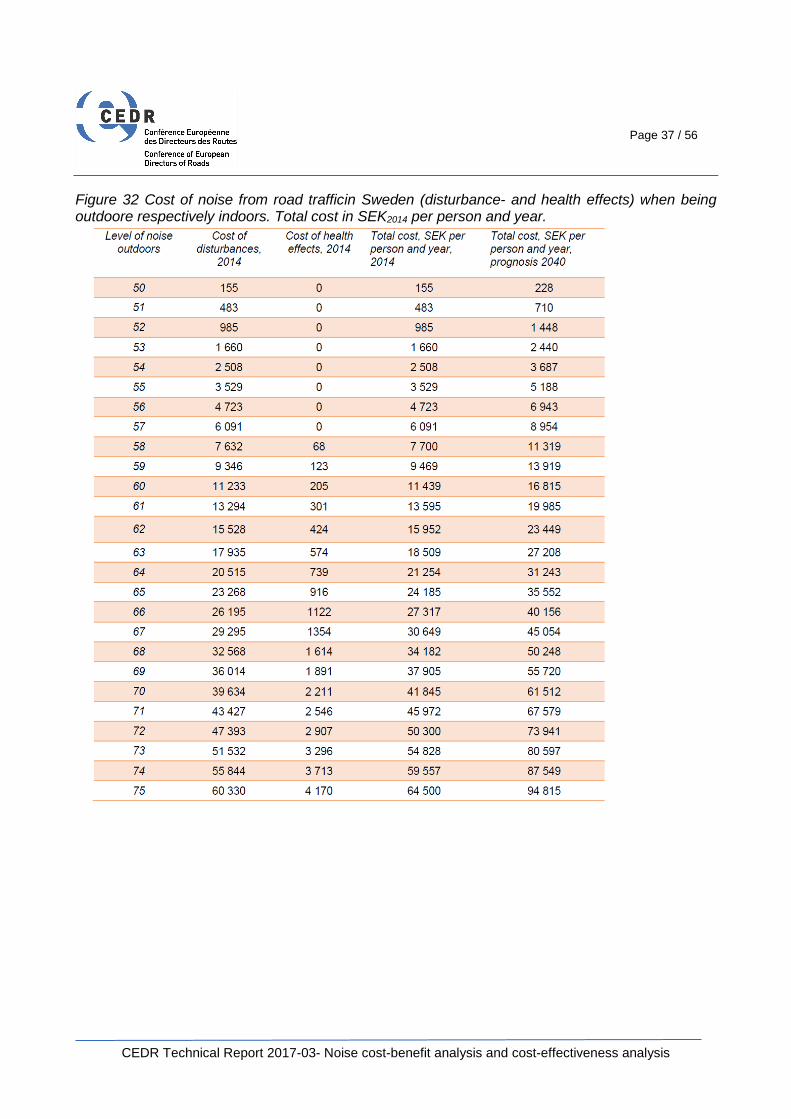
Page 37 / 56
CEDR Technical Report 2017-03- Noise cost-benefit analysis and cost-effectiveness analysis
Figure 32 Cost of noise from road trafficin Sweden (disturbance- and health effects) when being outdoore respectively indoors. Total cost in SEK2014 per person and year.
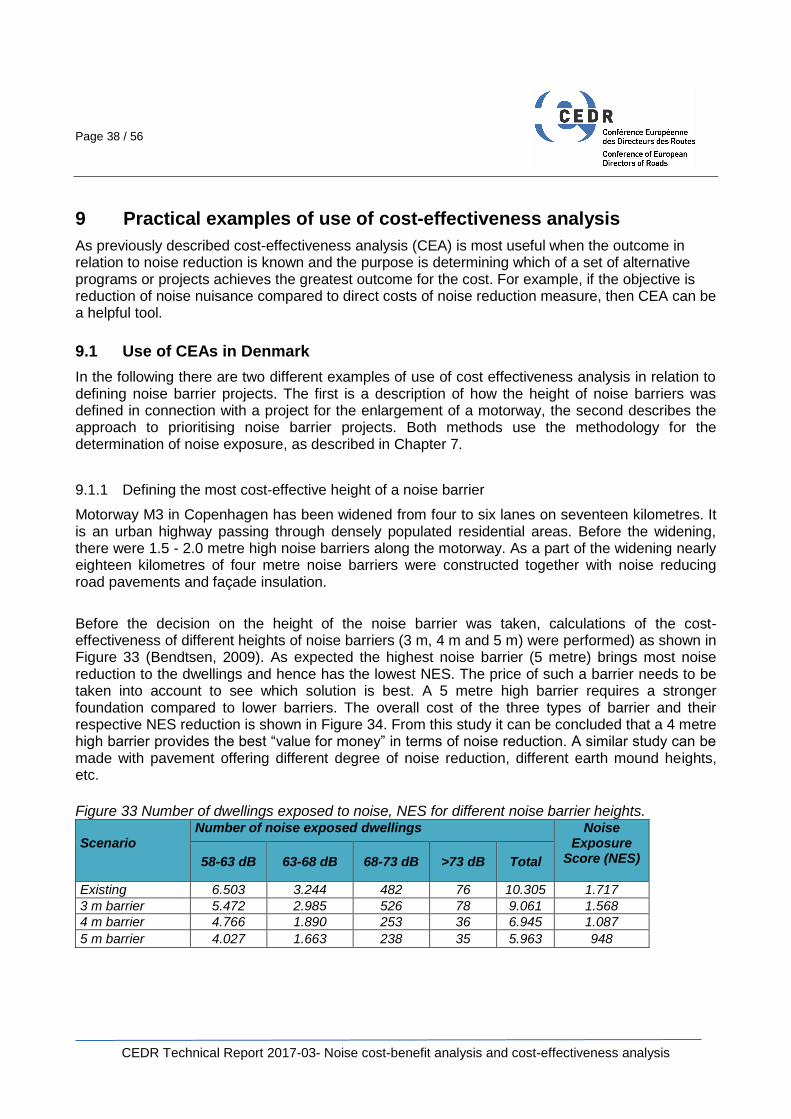
Page 38 / 56
CEDR Technical Report 2017-03- Noise cost-benefit analysis and cost-effectiveness analysis
9 Practical examples of use of cost-effectiveness analysis
As previously described cost-effectiveness analysis (CEA) is most useful when the outcome in relation to noise reduction is known and the purpose is determining which of a set of alternative programs or projects achieves the greatest outcome for the cost. For example, if the objective is reduction of noise nuisance compared to direct costs of noise reduction measure, then CEA can be a helpful tool.
9.1 Use of CEAs in Denmark
In the following there are two different examples of use of cost effectiveness analysis in relation to defining noise barrier projects. The first is a description of how the height of noise barriers was defined in connection with a project for the enlargement of a motorway, the second describes the approach to prioritising noise barrier projects. Both methods use the methodology for the determination of noise exposure, as described in Chapter 7.
9.1.1 Defining the most cost-effective height of a noise barrier
Motorway M3 in Copenhagen has been widened from four to six lanes on seventeen kilometres. It is an urban highway passing through densely populated residential areas. Before the widening, there were 1.5 - 2.0 metre high noise barriers along the motorway. As a part of the widening nearly eighteen kilometres of four metre noise barriers were constructed together with noise reducing road pavements and façade insulation.
Before the decision on the height of the noise barrier was taken, calculations of the cost-effectiveness of different heights of noise barriers (3 m, 4 m and 5 m) were performed) as shown in Figure 33 (Bendtsen, 2009). As expected the highest noise barrier (5 metre) brings most noise reduction to the dwellings and hence has the lowest NES. The price of such a barrier needs to be taken into account to see which solution is best. A 5 metre high barrier requires a stronger foundation compared to lower barriers. The overall cost of the three types of barrier and their respective NES reduction is shown in Figure 34. From this study it can be concluded that a 4 metre high barrier provides the best “value for money” in terms of noise reduction. A similar study can be made with pavement offering different degree of noise reduction, different earth mound heights, etc.
Figure 33 Number of dwellings exposed to noise, NES for different noise barrier heights. Scenario
Number of noise exposed dwellings Noise Exposure
Score (NES)
58-63 dB 63-68 dB 68-73 dB >73 dB Total
Existing 6.503 3.244 482 76 10.305 1.717
3 m barrier 5.472 2.985 526 78 9.061 1.568
4 m barrier 4.766 1.890 253 36 6.945 1.087
5 m barrier 4.027 1.663 238 35 5.963 948

Page 39 / 56
CEDR Technical Report 2017-03- Noise cost-benefit analysis and cost-effectiveness analysis
Figure 34 Evaluation of the price and cost effectiveness of the different barrier solutions.
Scenario Total price
(Mio €) Reduced
NES Reduced NES per 1
million. €
3 m barrier 19 149 7.8
4 m barrier 23 630 27.4
5 m barrier 28 769 27.4
9.1.2 Policy for prioritising noise barrier projects along existing motorways
The policy for prioritising noise barrier projects along the national road network in Denmark is described in the Noise Action Plan for National Roads 2013-2018 (Danish Road Directorate, 2013). The principle is to give priority to residential areas where noise exposure is highest and the invested funds give the most noise reduction for money. In short, the method for prioritisation of noise barriers is as follows:
1. The residential ´hot spot´ area must have at least one dwelling exposed to more than 65 dB
2. Determination of feasibility. Benefits of barriers are achieved only relatively close to the motorway and are generally calculated in terms of a reduction in noise level. In addition, noise barriers are not feasible in many areas for example, to protect homes on a hillside above a busy motorway. Feasible in this context equates to the requirement that the barrier achieve at least a 3 dB noise reduction (Lden). If not, the barrier is not feasible, and no abatement is implemented in the project.
3. The total noise annoyance (noise exposure score, NES) for each ´hot spot´ area is calculated using the method described Chapter 8.1;
a. in the present situation and in a situation (NESpresent)
b. in a situation with a future noise barrier (NESafter) For each ´hot spot´ area Within each area, the noise reduction is calculated as a total noise reduction score value (NESpresent - NESafter = ΔNES)
4. Estimation of construction costs for each noise barrier project is carried out
5. Cost effectiveness is then calculated for each hotspot area by dividing the formula;
𝛥 𝑁𝑜𝑖𝑠𝑒 𝑒𝑥𝑝𝑜𝑠𝑢𝑟𝑒 𝑠𝑐𝑜𝑟𝑒 (𝛥𝑁𝐸𝑆)
𝐶𝑜𝑛𝑠𝑡𝑟𝑢𝑐𝑡𝑖𝑜𝑛 𝑐𝑜𝑠𝑡𝑠 𝑓𝑜𝑟 𝑎 𝑛𝑜𝑖𝑠𝑒 𝑏𝑎𝑟𝑟𝑖𝑒𝑟 (𝐸𝑈𝑅 )
6. Noise barrier projects where cost efficiency is the highest is given the highest priority
9.1.3 Socio economic benefit of a noise barrier project
It is relevant to know the economic benefit / cost of a noise barrier project. For example, this knowledge can be used in policies for the use of noise barriers. In the figure below is shown the relation between million Euros invested for a noise barrier project (lifetime of 35 years) and

Page 40 / 56
CEDR Technical Report 2017-03- Noise cost-benefit analysis and cost-effectiveness analysis
reduced Noise Exposure Score (NES) - depending on the proportion between socio-economic benefit and direct cost of the project. For example, if you invest EUR 10 million, and you are obliged to have at least a break-even between the direct costs of a noise barrier and the socioeconomic benefit, it is necessary to achieve a reduction of the Noise Exposure Score at a least approx. 80 (see Figure 35).
Figure 35 Relation between invested millions (direct costs) into a noise barrier project and reduced Noise Exposure Score depended on the proportion between socio-economic benefits and direct cost of the project (the graph 2:1 represents a scenario where the direct costs are twice as high as the socio-economic benefit).
In Denmark experience shows that noise barrier projects rarely provide a socio-economic profit. Still, it seems reasonable to invest in noise barriers, since the noise impact from roads causes noise pollution and negative health impact as the society as a whole have enormous economic benefits of traffic on the roads.
9.2 The Dutch cost-effectiveness analysis for noise measures
It is a legal obligation to perform noise analysis in the case of:
building a new motorway;
changing an existing motorway;
noise remediation along a motorway;
exceedance of noise limits in reference points along motorways caused by annual growth of traffic (compliance)4.
4 The Environmental Law from 2012 introduced a system of “Noise Production Limits” (NPL). The aim of introducing NPL is to restrict the increase of traffic noise caused by the yearly growth of traffic volume. The NPL are reference points along all major roads in the
0
10
20
30
40
50
60
70
80
90
100
110
120
130
140
150
0 1 2 3 4 5 6 7 8 9 10 11 12 13 14 15
Red
uced
No
ise E
xp
osu
re S
co
re (
NE
S)
€ million invested
2:1 1:1 1:2 1:3 1:4

Page 41 / 56
CEDR Technical Report 2017-03- Noise cost-benefit analysis and cost-effectiveness analysis
The aim of the noise analysis is to comply with the preferable noise limits, laid out in the Dutch Environmental Management Act (Wet milieubeheer). As long as these limits are met with, to be demonstrated in the noise analysis, the Dutch NRA Rijkswaterstaat is free to deploy whatever measure is necessary to obtain this goal.
However, always complying with these preferable limits would require far greater costs for measures than the available budget allows for. For that reason, the Environmental Management Act allows for a limited increase of noise levels along motorways (up to a maximum of 65 dB) after a cost-effectiveness analysis, showing that complying with the preferable limits would be too expensive in that situation.
According to the Environmental Law in the Netherlands it is mandatory to perform cost-effectiveness analysis for noise measures. The method is legally regulated in detail by the Dutch publication “Kader Doelmatigheidscriterium Geluidsmaatregelen” (Rijkswaterstaat, 2014 and 2016). The method for the cost-effectiveness analysis for noise measures is about weighing the costs of noise mitigation measures against the noise reduction. The analysis requires balancing between so-called “noise measure points” (a unit of cost) and available “reduction points” (a unit of budget) for a “cluster” of noise sensitive objects (dwellings). The number of houses and their noise levels determine the number of reduction points that are available for a range of noise measures for each particular situation. The number of reduction points for a group of dwellings determine the total budget for the implementation of noise mitigation measures. In each situation noise mitigation like noise reducing asphalt and noise barriers can be “bought” up to the maximum level of budget. Cost-effective measures according to the cost-effectiveness analysis must always be implemented. However, measures necessary for complying with the preferable noise limits that are not cost-effective, need not be implemented. In such a case, the noise levels along the motorway may be raised up to the point that can be achieved with the cost-effective measure that accomplishes the greatest amount of noise reduction, or until the maximum level of 65 dB is reached.
The basic elements of cost-effectiveness analysis for noise measures is explained in the following:
Clusters
The CEA uses clusters: a group of noise sensitive objects which will benefit from the noise measure under study. Most of the noise sensitive objects are dwellings. For other noise sensitive objects like hospitals and schools, there is a rule to convert those into a specific amount of dwellings.
Measure points
Each noise measure ‘costs’ a certain amount of measure points. These measure points are based on the average investment and maintenance budget for a period of 30 years for real noise measures, but these are converted to dimensionless ‘points’ to avoid yearly price fluctuations. The tables in Figure 36 give the points for different kinds and dimensions of noise measures. The amount of measure points that has to be taken into account, is the sum of the measure points for both newly projected measures and already existing measures for that cluster.
Netherlands at 50 m distance on both sides of the road for every 100 m of the road. At each point the road noise was calculated based on the traffic volume in 2012. The NPL at each point represents the calculated noise level in 2012 + 1,5 dB. If the noise level in future exceed the NPL the road authority is legally obliged to implement noise reducing measures (Faber, 2016).

Page 42 / 56
CEDR Technical Report 2017-03- Noise cost-benefit analysis and cost-effectiveness analysis
Figure 36 Measure points for noise abatement measures.
Noise measure at source Points
Two layer porous asphalt 22 per 10 m2 compared to porous asphalt
Thin layers 9 per 10 m2 compared to porous asphalt
Noise measure in propagation Points
Noise barrier and noise wall
For every metre (m1) with a height of:
1 m: 53
2 m: 93
3 m: 133
4 m: 173
5 m: 212
6 m: 251
7 m: 289
8 m: 327
Every metre more: plus 44
Noise barrier between left and right carriageway
For every metre (m1) with a height of:
1 m: 64
2 m: 112
3 m: 160
4 m: 207
5 m: 254
6 m: 301
7 m: 347
8 m: 392
T-top For every metre (m1):
44
Reduction points
The reduction points per noise sensitive object in a cluster add up to, as it were, the ‘budget’ for the noise measures for that cluster. The future noise level without existing and future noise measures of every dwelling in the cluster determines its amount of available reduction points. Figure 37 gives the amount of reduction points at different noise levels. The more dwellings and the higher the future noise levels, the more reduction points are available for the cluster.

Page 43 / 56
CEDR Technical Report 2017-03- Noise cost-benefit analysis and cost-effectiveness analysis
Figure 37 Reduction points per dwelling relative to future noise levels.
Note: mind the increase in points going from 65 dB to 66 dB. This is specifically aimed at noise remediation along motorways, as most dwellings that qualify for noise remediation experience over 65 dB Lden,gpp.
Noise reduction
Noise reduction is the average reduction of noise levels at dwellings as a result of the measure under study. To determine the noise reduction, the preferable noise limit acts as a threshold. Reduction of noise levels below the preferable limit is not necessary, and therefore does not count as ‘legal’ reduction in the cost-effectiveness analysis. The preferable limit depends on the situation at hand (see below).
Standard acoustic quality
The total amount of reduction points is based on a fictive situation without any existing or future noise measure and with porous asphalt as standard pavement. This situation is known as the ‘standard acoustic quality’ of a motorway.
Preferable noise limits
The preferable noise limits at dwellings are different for the situation at hand:
- 50 dB Lden in case of building a new motorway;
- Lden,gpp5 in case of changing an existing motorway;
- 60 dB Lden in case of noise remediation
- Lden,gpp in case of exceedance of noise production limits in reference points.
Note that there are some exceptions and other details with regard to the preferable limits listed, that are not discussed here.
5 In the Netherlands the noise production limit in each reference point (50 metres from the road and 100 metres from each other) defines the maximum allowed noise levels close to the motorway. These noise production limits also determine the maximum allowed noise levels at dwellings along the motorways: Lden,gpp. Because exceeding the noise production limits in reference points is not allowed, this also limits noise levels at dwellings along motorways. In case the Lden,gpp exceeds 65 dB, the CEA no longer applies. In that case, not only cost-effective measures according to the CEA must be taken into account to prevent exceeding the Lden,gpp, but also more extensive measures, if necessary.
Page 44 / 56
CEDR Technical Report 2017-03- Noise cost-benefit analysis and cost-effectiveness analysis
Rules
The CEA for noise measures operates according to two main rules and two additional rules.
The first main rule is about complying with the preferable limits by using noise measures to reduce noise levels. In case there are sufficient reduction points to ‘pay for’ the measure points of the noise measures necessary to comply with these limits, no further noise measures are necessary, even when not all reduction points have been used. Enough is enough.
The second main rule deals with the situation where the available reduction points are not sufficient to ‘pay for’ a measure that accomplishes full compliance with the preferable limits. In such a situation, full compliance with the preferable limits can be waived. Less extensive measures that do fit the available ‘budget’ of reduction points, then are used to achieve as much noise reduction as possible. However, preferable noise limits at noise dwellings then will be exceeded. Since this cannot be prevented with cost-effective measures, this is allowed up to a maximum level of 65 dB.
The third rule (first additional rule) stipulates for specific situations in densely built-up areas (usually with a certain amount of high buildings) that a measure that fits the available reduction points nevertheless is not cost-effective when a much ‘cheaper’ measure accomplishes virtually the same amount of noise reduction. As a rule of thumb, no smaller noise reduction than 95% of the maximum reduction possible within the available reduction points, must be accomplished by such a ‘cheaper’ measure.
The fourth rule (second additional rule) deals with avoiding waste of financial resources in case of replacing an existing noise barrier by a slightly higher barrier, long before the end-of-life of the existing one. Especially when the existing noise barrier is not older than ten years and yields more or less the same noise reduction, this would be a waste of resources.
CEA process
Using the CEA for noise measures means a step-by-step process:
1. Analyse the problem.
2. Cluster the dwellings.
3. Add up the reduction points per cluster.
4. Determine measure points for a number of measures per cluster.
5. Divide measure points for pavements equally between clusters on both sides of the motorway.
6. Use the four rules to assess the cost-effectiveness of the measures per cluster.
General information about the Dutch CEA method is given by (Gruijter & Hageman, 2010) at Inter Noise 2010. The method looks fairly straightforward, but in practice things turn out to be not as simple as suggested. An example of the use of the method is presented by (Faber, 2016) at Inter Noise 2016.
Page 45 / 56
CEDR Technical Report 2017-03- Noise cost-benefit analysis and cost-effectiveness analysis
Using the Dutch CEA for noise measure in your own country
It is possible the use the Dutch CEA for noise measure in your own country. But first some adjustments are necessary. Some suggestions:
translate the Rijkswaterstaat reports from 2014 and 2016 (RWS, 2014 and 2016) into your language;
redefine the standard acoustic quality, because the Dutch system is based on porous asphalt as the standard pavement;
redefine the preferable noise limit(s) according to the situation in your country;
adjust the reduction points to the situation in your country (esp. regarding the Dutch way of avoiding noise levels at dwellings above 65 dB Lden);
recalculate the measure points, because the costs for noise measures differ throughout Europe;
adjust the use of the four rules according to the situation in your country.
9.3 Noise action planning: problems with prioritisation of actions
9.3.1 Cost-effectiveness analysis used in the noise action plan in Estonia
This chapter presents a brief overview of a simple cost-effectiveness analysis methodology used by the Estonian Road Administration in connection to a noise action plan. The objective of the noise action plan was to analyse all locations along the national road network where the noise limit values are exceeded, to identify appropriate mitigation measures, and to prioritise actions against using cost-effectiveness analysis.
The Estonian Road Administration's strategic noise map was drawn up in 2012, including 158 km of national roads with a traffic volume of more than 3 million vehicles per year. The noise mapping included a total number of 1,786 houses with a noise exposure of 55 dB Lden or more, with a total population of approximately 12,300 people.
The first step of the analysis was to analyse all locations where the night noise limit value of 55 dB Lnight was exceeded. First part of analysis assessed the potential noise mitigation measures (noise barriers or speed regulations) for each location. All locations where speed regulation was the only option to reduce noise were excluded from further analysis, which concentrated on noise barriers only. For each location the necessary length of noise barrier was estimated. A unit price per metre of noise barrier was used for calculating the cost of noise barrier for each location.
Cost-efficiency was determined by two criteria; the cost of the noise barrier and the number of people benefiting from the action. In order to determine cost-effectiveness and prioritise all situations, the cost of each mitigation measure (barrier) was divided by the number of people benefiting from the noise barrier. Data for the number of people exposed at each location were taken from the strategic noise maps (2.3 inhabitants per dwelling). The less cost per inhabitant the higher priority.
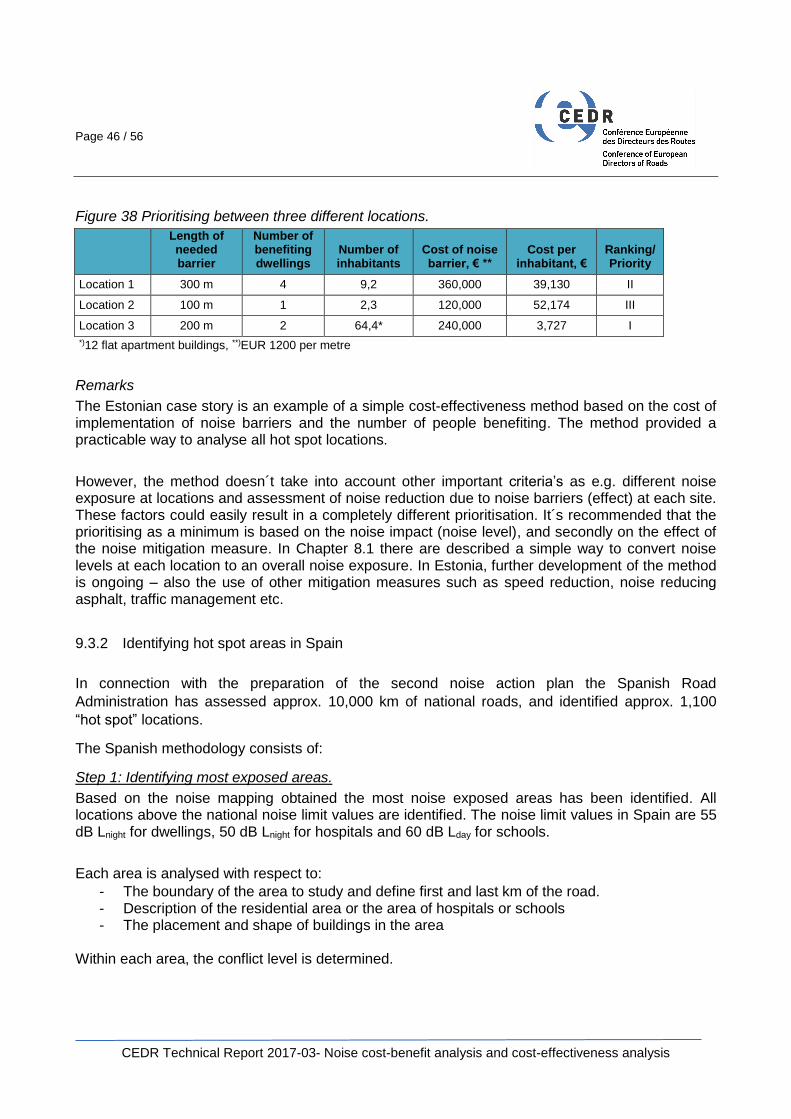
Page 46 / 56
CEDR Technical Report 2017-03- Noise cost-benefit analysis and cost-effectiveness analysis
Figure 38 Prioritising between three different locations.
Length of needed barrier
Number of benefiting dwellings
Number of inhabitants
Cost of noise barrier, € **
Cost per inhabitant, €
Ranking/ Priority
Location 1 300 m 4 9,2 360,000 39,130 II
Location 2 100 m 1 2,3 120,000 52,174 III
Location 3 200 m 2 64,4* 240,000 3,727 I
*)12 flat apartment buildings, **)EUR 1200 per metre
Remarks
The Estonian case story is an example of a simple cost-effectiveness method based on the cost of implementation of noise barriers and the number of people benefiting. The method provided a practicable way to analyse all hot spot locations.
However, the method doesn´t take into account other important criteria’s as e.g. different noise exposure at locations and assessment of noise reduction due to noise barriers (effect) at each site. These factors could easily result in a completely different prioritisation. It´s recommended that the prioritising as a minimum is based on the noise impact (noise level), and secondly on the effect of the noise mitigation measure. In Chapter 8.1 there are described a simple way to convert noise levels at each location to an overall noise exposure. In Estonia, further development of the method is ongoing – also the use of other mitigation measures such as speed reduction, noise reducing asphalt, traffic management etc.
9.3.2 Identifying hot spot areas in Spain
In connection with the preparation of the second noise action plan the Spanish Road
Administration has assessed approx. 10,000 km of national roads, and identified approx. 1,100
“hot spot” locations.
The Spanish methodology consists of:
Step 1: Identifying most exposed areas.
Based on the noise mapping obtained the most noise exposed areas has been identified. All locations above the national noise limit values are identified. The noise limit values in Spain are 55 dB Lnight for dwellings, 50 dB Lnight for hospitals and 60 dB Lday for schools.
Each area is analysed with respect to:
- The boundary of the area to study and define first and last km of the road. - Description of the residential area or the area of hospitals or schools - The placement and shape of buildings in the area
Within each area, the conflict level is determined.
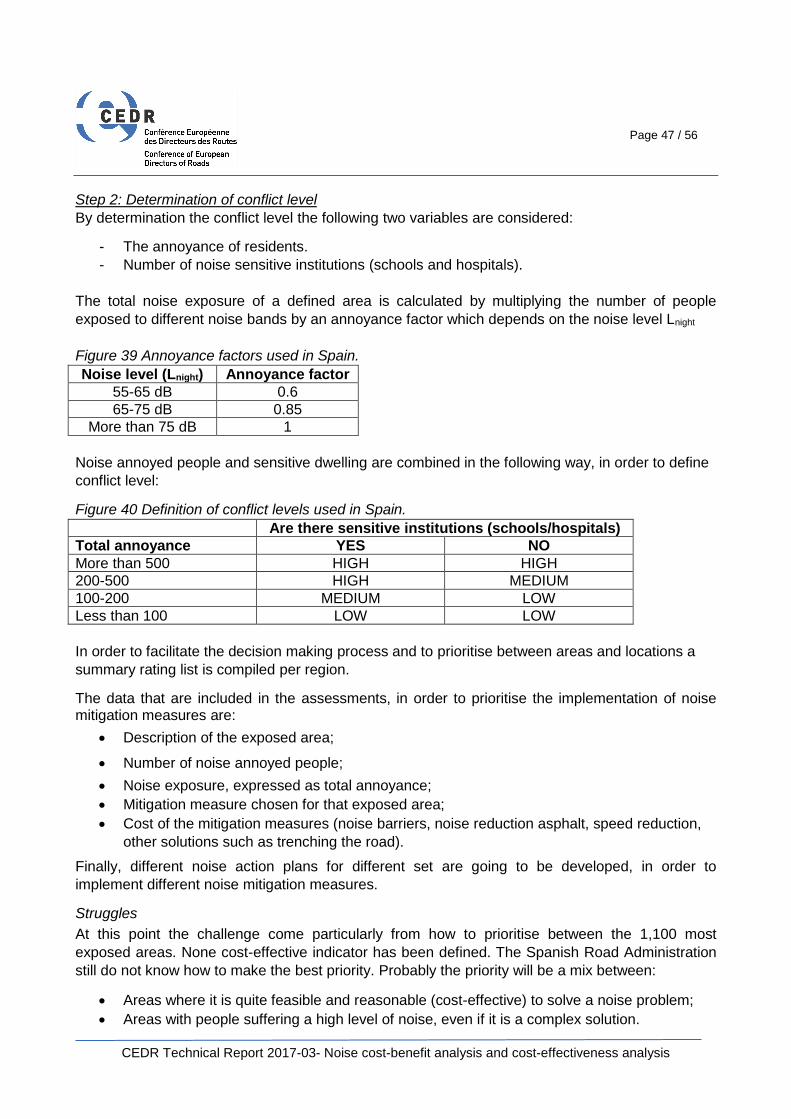
Page 47 / 56
CEDR Technical Report 2017-03- Noise cost-benefit analysis and cost-effectiveness analysis
Step 2: Determination of conflict level
By determination the conflict level the following two variables are considered:
- The annoyance of residents.
- Number of noise sensitive institutions (schools and hospitals).
The total noise exposure of a defined area is calculated by multiplying the number of people
exposed to different noise bands by an annoyance factor which depends on the noise level Lnight
Figure 39 Annoyance factors used in Spain.
Noise level (Lnight) Annoyance factor
55-65 dB 0.6
65-75 dB 0.85
More than 75 dB 1
Noise annoyed people and sensitive dwelling are combined in the following way, in order to define
conflict level:
Figure 40 Definition of conflict levels used in Spain.
Are there sensitive institutions (schools/hospitals)
Total annoyance YES NO
More than 500 HIGH HIGH
200-500 HIGH MEDIUM
100-200 MEDIUM LOW
Less than 100 LOW LOW
In order to facilitate the decision making process and to prioritise between areas and locations a
summary rating list is compiled per region.
The data that are included in the assessments, in order to prioritise the implementation of noise mitigation measures are:
Description of the exposed area;
Number of noise annoyed people;
Noise exposure, expressed as total annoyance;
Mitigation measure chosen for that exposed area;
Cost of the mitigation measures (noise barriers, noise reduction asphalt, speed reduction,
other solutions such as trenching the road).
Finally, different noise action plans for different set are going to be developed, in order to
implement different noise mitigation measures.
Struggles
At this point the challenge come particularly from how to prioritise between the 1,100 most
exposed areas. None cost-effective indicator has been defined. The Spanish Road Administration
still do not know how to make the best priority. Probably the priority will be a mix between:
Areas where it is quite feasible and reasonable (cost-effective) to solve a noise problem;
Areas with people suffering a high level of noise, even if it is a complex solution.
Page 48 / 56
CEDR Technical Report 2017-03- Noise cost-benefit analysis and cost-effectiveness analysis
9.4 Recommended CEA method
CEA can be extremely beneficial in comparing interventions, in particular when noise managers want to compare the effects and costs of a specific noise mitigation measure in different noise exposed areas (hot spots) and prioritise efforts where the most noise reduction for money is possible or to compare different interventions in order to reduce noise in a specific noise-exposed area. In case a CEDR member country has no CEA, it is recommended to use the following simple method based on comparing the total costs of noise reducing measures with shift in the total noise annoyance in an area before and after an intervention. The recommended calculation procedure is as follows:
Step 1: Calculate for each alternative the total costs of the noise reducing measure(s).
Step 2a: Calculate for each alternative the number of people exposed to noise levels of 45 dB Lden and more at their dwellings for the situation before the intervention (before the use of the noise reducing measure(s)).
Step 2b: Calculate for each alternative the number of people exposed to noise levels of 45 dB Lden and more at their dwellings for the situation after the intervention (after the use of the noise reducing measure(s)).
Step 3a: Calculate for each alternative for the situation before the intervention the total number of highly annoyed people by multiplying the percentage of highly annoyed people at all Lden levels of 45 dB Lden and more by the number of people exposed to the same noise levels in the situation before the intervention (step 2a).
The percentage of highly annoyed (% HA) people at a certain Lden noise level is given in this formula (EEA, 2010):
% HA = 9.868 * 10–4 * (Lden – 42)3 – 1.436 * 10–2 * (Lden – 42)2 + 0.5118 * (Lden – 42)
Step 3b: Calculate for each alternative for the situation after the intervention the total number of highly annoyed people by multiplying the percentage of highly annoyed people at all Lden levels of 45 dB Lden and more by the number of people exposed to the same noise levels in the situation after the intervention (step 2b).
Step 4: Calculate for each alternative the shift in the total number of highly annoyed people: the difference (Δ total highly annoyed people) between the situation before (3a) and after (3b) the intervention.
Step 5: Calculate for each alternative the cost-effectiveness ratio: total costs / Δ total highly annoyed people.
The alternative with the lowest ratio is the most cost-effective solution, given by the formula:
Cost-Effectiveness Ratio = Total cost of noise barrier
Δ Total noise annoyance (before minus after intervention)

Page 49 / 56
CEDR Technical Report 2017-03- Noise cost-benefit analysis and cost-effectiveness analysis
9.4.1 New knowledge about the noise annoyance from motorways
It must be emphasised that several studies show that noise from motorways may be more annoying than indicated in the EU-position paper (EC, 2012 ) on dose-effect relations. A socio-acoustic noise annoyance survey with approximately 7,000 respondents has been performed in 2014 along motorways and urban roads in major cities in Denmark (Fryd et al., 2016). The annoyance questions followed the ISO 15 666 standard and the answers were analysed together with the noise levels (Lden) at the most exposed façade. The results show that persons living near motorways on average are much more annoyed at the same noise exposure than persons living near urban roads. At 20 % Highly Annoyed the difference in Lden between the two types of roads is more than 10 dB. The dose-response curves found in this survey for the urban roads are more or less in line with the EU (Miedema) dose-response curves for road traffic noise. The results together with other minor studies indicate a need to consider noise from motorways separately from noise from other roads. The Danish dose-response curves shown below are compared to the curves for road traffic noise given in the EU-position (EC, 2012 ), the so-called Miedema-curves. Figure 41 shows the comparison for the Danish curves for motorways. It is found that all Danish curves (% Highly Annoyed ) are significantly higher along motorways than the Miedema curves. For the same percentage of Highly Annoyed the difference is 9 -14 dB depending on the level of annoyance. Figure 41: New Danish dose-response curves for motorways and the Miedema curves for Highly Annoyed people at different Lden levels (Fryd et al., 2016). The dotted curves are the 95 % confidence interval for the motorway curve.
It is possible to read more about the study in (Danish Road Directorate, 2016) and gain a tool to calculate an alternative dose-response curve for % Highly Annoyed people from motorways.
0%
20%
40%
60%
80%
100%
45 50 55 60 65 70 75
Per
cen
t
Lden, dB
Highly Annoyed (Motorways) Highly Annoyed (Miedema)
Page 50 / 56
CEDR Technical Report 2017-03- Noise cost-benefit analysis and cost-effectiveness analysis
10 Summary
Road traffic noise is a major environmental challenge for all national road administrations. This is causing pressure on using noise reducing measures along existing roads, but also on the integration of noise mitigation measures in the planning and construction of new roads and in the maintenance of existing roads. Generally, money for noise mitigation measures is limited. However, the use of noise barriers for instance is associated with high costs. A key challenge in managing the noise environment from an economic perspective is to balance the costs of road traffic noise effects with the costs of controlling road traffic noise exposure.
Evidence-based and successful policies for noise abatement require making investment decisions on objective and verifiable methods. Road noise is a major challenge for all national road administrations. This applies, for example, to demands for noise-reducing measures along existing roads, but also to the integration of appropriate noise mitigation measures in the planning and construction of new roads.
For decision-makers and for society as a whole, it is important to use available means the best possible way. Cost-benefit analysis (CBAs) and cost-effectiveness analysis (CEAs) may provide answers to such questions.
The main purpose of this technical report is to give an introduction to the background and concepts for evaluation noise impacts using cost-benefit analysis (CBA) or cost-effectiveness analysis (CEA) and to provide examples of how such methods are used in different CEDR member countries.
10.1 Conclusions
Cost-benefit analysis takes a more holistic approach than cost-effectiveness analysis in expanding the scope of analysis to all impacts of a measure or a project The objective of the CBA is to achieve the best overall performance in money terms, versus the cost of a measure or a project. The CBA approach is more demanding than is CEA, because all relevant effects need to be assigned a monetary value. When such cost factors are available, the cost-efficiency of a noise reduction method can be calculated. The CEA method is best suited to prioritise interventions in order to reduce noise. For instance, one can prioritise between different residential areas where there is a desire to reduce noise or assessing which noise-reducing measure is the most cost-effective in an area.
The CBA method gives an indication of the situations where one gets value (or the best value) for money, for society as a hole, but the method does not tell the whole story. The method does not capture whether the advantages and disadvantages of a project are socially desirable. For example, it is a political balancing to what extent it is desired to reduce noise for people. In CBA, the value judgement is based on economics only. A disadvantage like road noise affect relatively few people relatively strong, compared to society as a hole, and people are exposed to the noise levels every day. Therefore one must be careful in applying CBA results to decide whether to use noise-reducing measures or not in a given situation. Figure 42 below gives an overview of advantages and disadvantages when using CBAs and CEAs
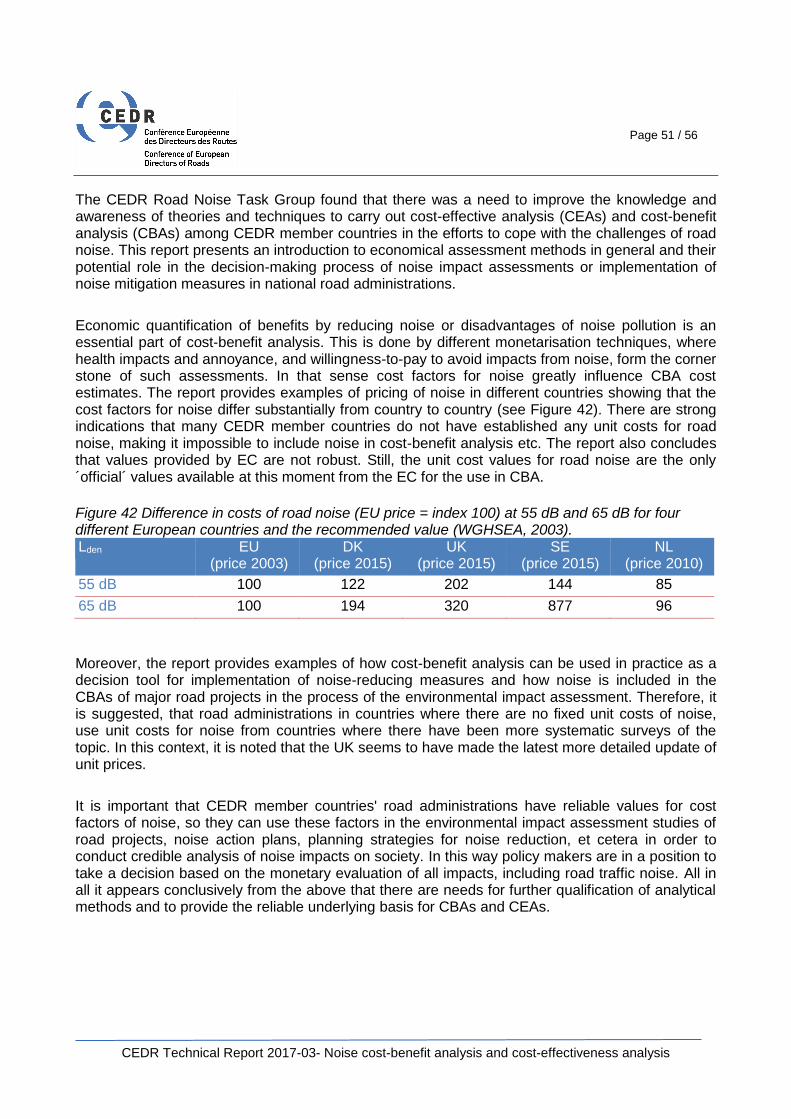
Page 51 / 56
CEDR Technical Report 2017-03- Noise cost-benefit analysis and cost-effectiveness analysis
The CEDR Road Noise Task Group found that there was a need to improve the knowledge and awareness of theories and techniques to carry out cost-effective analysis (CEAs) and cost-benefit analysis (CBAs) among CEDR member countries in the efforts to cope with the challenges of road noise. This report presents an introduction to economical assessment methods in general and their potential role in the decision-making process of noise impact assessments or implementation of noise mitigation measures in national road administrations.
Economic quantification of benefits by reducing noise or disadvantages of noise pollution is an essential part of cost-benefit analysis. This is done by different monetarisation techniques, where health impacts and annoyance, and willingness-to-pay to avoid impacts from noise, form the corner stone of such assessments. In that sense cost factors for noise greatly influence CBA cost estimates. The report provides examples of pricing of noise in different countries showing that the cost factors for noise differ substantially from country to country (see Figure 42). There are strong indications that many CEDR member countries do not have established any unit costs for road noise, making it impossible to include noise in cost-benefit analysis etc. The report also concludes that values provided by EC are not robust. Still, the unit cost values for road noise are the only ´official´ values available at this moment from the EC for the use in CBA.
Figure 42 Difference in costs of road noise (EU price = index 100) at 55 dB and 65 dB for four different European countries and the recommended value (WGHSEA, 2003). Lden EU
(price 2003) DK
(price 2015) UK
(price 2015) SE
(price 2015) NL
(price 2010)
55 dB 100 122 202 144 85
65 dB 100 194 320 877 96
Moreover, the report provides examples of how cost-benefit analysis can be used in practice as a decision tool for implementation of noise-reducing measures and how noise is included in the CBAs of major road projects in the process of the environmental impact assessment. Therefore, it is suggested, that road administrations in countries where there are no fixed unit costs of noise, use unit costs for noise from countries where there have been more systematic surveys of the topic. In this context, it is noted that the UK seems to have made the latest more detailed update of unit prices.
It is important that CEDR member countries' road administrations have reliable values for cost factors of noise, so they can use these factors in the environmental impact assessment studies of road projects, noise action plans, planning strategies for noise reduction, et cetera in order to conduct credible analysis of noise impacts on society. In this way policy makers are in a position to take a decision based on the monetary evaluation of all impacts, including road traffic noise. All in all it appears conclusively from the above that there are needs for further qualification of analytical methods and to provide the reliable underlying basis for CBAs and CEAs.

Page 52 / 56
CEDR Technical Report 2017-03- Noise cost-benefit analysis and cost-effectiveness analysis
Figure 43 Cost-benefit analysis and cost-effectiveness analysis.
Cost-benefit analysis Cost-effectiveness-analysis
When to use? CBA is most useful in analysing a programme, project or policy to determine whether the total benefits exceed the costs, or in comparing alternatives to see which one achieves the greatest monetary benefit.
CEA is most useful in determining which set of alternative programs or projects achieves the greatest outcome (e.g. noise reducing effect) for the costs.
Use CEAs when the need is to compare interventions and to ensure that valuable resources are being allocated in the best possible way.
Advantages The analysis can predict whether a given action gives a reasonable use of financial resources.
CEA can be beneficial in comparing interventions, in particular when policy makers e.g. want to:
- compare the effect and costs of a certain noise mitigation measure in different noise exposed areas (hot spots) and prioritise efforts where the most noise reduction for money is possible;
- compare different interventions in order to reduce noise in a specific noise exposed area
Disadvantages The major difficulty with CBA is that it is often difficult to place monetary values on all (or most) costs and benefits.
In particular, it must be emphasised that there appears to be considerable uncertainty on the unit costs used in the monetisation of noise from roads.
The major difficulty with CEA is that it provides no value for the output, leaving that to the subjective judgment of the policy maker
Simple examples Project: increase max. speed limit from 120 to 130 km/h:
cost/ CBA costs
benefit: component: (in mil €):
cost project cost 10
benefit travel time +200
benefit accidents -10
benefit air pollution -20
benefit noise -50
benefit climate change -10
benefit nature -5
Summarising the overall value for money in terms of benefit-cost ratio (BCR or B/C):
- total benefits: +105
- total costs: 10
- BCR: 105/10=10.5 Projects with a BCR greater than 1 are acceptable from an economic point of view.
The ratio between the cost of a noise barrier of 1 000 metre and the reduction of noise annoyed people:
height cost reduction
in m1 in m EUR annoyance ratio
2 m 1.5 1000 1541
3 m 1.9 2500 778
4 m 2.4 3500 696
5 m 2.9 4000 721
6 m 3.4 4250 809 In this case a noise barrier of 4 m is the most cost-effective solution.

Page 53 / 56
CEDR Technical Report 2017-03- Noise cost-benefit analysis and cost-effectiveness analysis
11 References
Andersson, H. et al. (2013) Benefit measures for noise abatement: calculations for road and rail traffic noise, European Transport Research Review, Volume 5, 135-148.
Bendtsen, H. (2009) Highway noise abatement – Planning tools and Danish examples, Danish Road Directorate, Danish Road Institute, Report 173, 2009.
CE (2010) Valuation and weighting of emissions and environmental impacts. Publication number 10.7788.25a ENG. Delft.
CE (2014) Externe en infrastructuurkosten van verkeer: een overzicht voor Nederland in 2010. Publicatienummer 14.4485.35. Delft.
CEDR (2015) ON-AIR Guidance Book on the Integration of Noise in Road Planning.
Celline, S.R. & J.E. Kee (2015) Cost-effectiveness and cost-benefit analysis. In: Handbook of practical program evaluation, 636-672. John Wiley & Sons Inc., San Francisco, USA.
CP & PBL (2013) Algemene leidraad voor maatschappelijke kosten-batenanalyse. Centraal Planbureau en Planbureau voor de Leefomgeving, Den Haag.
Danish EPA (2010) Nyt støjbelastningstal til vurdering af vejstøj. Memorandom.
Danish Ministry of Transport (2015) Manual for samfundsøkonomisk analyse på transportområdet.
Danish Road Directorate (2010) Ny fjordforbindelse ved Frederikssund, Environmental Impact Assessment, Rapport 351.
Danish Road Directorate (2011a) Udbygning af Fynske Motorvej syd om Odense, VVM-redegørelse, Rapport 377.
Danish Road Directorate (2011b) Traffic Noise prediction with Nord2000 - An update. Danish Road Directorate /Danish Road institute. Report 195-2011.
Danish Road Directorate (2013) Støjhandlingsplan for statens veje 2013-2018, Report 453.
Danish Road Directorate (2016) Noise annoyance from urban roads and motorways, Survey of the noise annoyance experienced from road traffic for residents along motorways and urban roads, Report 551.
Danish Transport Research Institute (2007) Appraisal methods in the Nordic Countries, Transport infrastructure assessment.
DECISIO (2014) MKBA Ruit Eindhoven. DECISIO, Amsterdam.
DEFRA (2014) Environmental Noise: Valuing impacts on: sleep disturbance, annoyance, hypertension, productivity and quiet.
Directive 2002/49/EC of the European Parliament and of the Council of 25 June 2002 relating to the assessment and management of environmental noise – Declaration by the Commission in the Conciliation Committee on the Directive relating to the assessment and management of environmental noise
EC (1996) Green Paper on Future Noise Policy.
EC (2011) Report to the European Parliament and the Council on the implementation of the Environmental Noise Directive in accordance with Article 11 of Directive 2002/49/EC (COM(2011) 321 final of 1 June 2011.
EC (2012) European Communities EU Position paper on Dose response relationships between transportation noise and annoyance. ISBN 92-894-3894-0, European Communities.

Page 54 / 56
CEDR Technical Report 2017-03- Noise cost-benefit analysis and cost-effectiveness analysis
EC (2014) Guide to Cost-Benefit Analysis of Investment Projects. Economic appraisal tool for Cohesion Policy 2014-2020, Directorate-General for Regional and Urban policy.
EEA (2010) Good practice guide on noise exposure and potential health effects, Technical report No 11/2010.
EEA (2014) Noise in Europe 2014, EEA Report No 10/2014.
Fryd, J. & T.H. Pederesen (2016) Noise Annoyance from Urban Roads and Motorways. Paper 547 Internoise 2016 pp. 5666-5677. Hamburg, Germany.
Faber, N. (2016) Environmental impact assessment and cost benefit analysis applied on motorway A27 (NL). Paper 863, pp. 1273-1283. Internoise 2016. Hamburg, Germany.
Fryd, J. (2015) Samfundsøkonomiske omkostninger ved at reducere hastigheden på Køge Bugt Motorvejen og inderste del af Holbækmotorvejen, Memo, Danish Road Directorate.
Gorlach, B. (undated) Cost-effectiveness analysis (CEA), Institute of Environmental Studies, Vrije Universiteit, The Netherlands. http://www.ivm.vu.nl/en/Images/CBA10_tcm234-161546.pdf
Gruijter, D. de & E. Hageman (2010) A new and easy method for cost-benefit analysis of noise measures along highways and railways. Paper Inter Noise 2010. Lisbon, Portugal.
HEATCO (2004a) Developing harmonized European approaches for transport costing and project assessment. Deliverable 5, proposal for harmonized guidelines. Institute of Energy Economics and the Rational Use of Energy (IER), Universität Stuttgart, Germany.
HEATCO (2004b) Derivation of fall-back values for impacts due to noise. Annex E to HEATCO Deliverable 5. Institut für Energiewirtschaft und Rationelle Energieanwendung, Universität Stuttgart, Germany.
Hume, K. (2010) Sleep disturbance due to noise: Current issues and future research, Noise and Health, Volume 12, 70-76.
Miljodirektoratet (2014) Veileder til retningslinje for behandling av støy i arealplanlegging i arealplanlegging (T-1442/2016).
Navrud, S. (2002) The State-Of-The-Art on Economic Valuation of Noise. Final report to European Commission DG Environment April 14th 2002, Department of Economics and Social Sciences, Agricultural University of Norway.
ON AIR (2015) Investigation of noise planning procedures and tools, Deliverable D2.1, 2015. http://www.on-air.no.
Klaeboe, R. et al. (2011) Selecting road-noise abatement measures: economic analysis of different policy objectives, The Open Transportation Journal, 2011, 5, 1-8.
Kuik, O. (undated), Cost-benefit analysis and cost effectiveness analysis tools, Institute of Environmental Studies, Vrije Universiteit, The Netherlands. http://www.ivm.vu.nl/en/Images/CBA0_tcm53-161536.pdf
RICARDO-AEA (2014) Update of the Handbook on External Costs of Transport, Final report.
RIGO (2012) Omgevingskwaliteiten bij MIRT-projecten: overzicht van methoden voor het meten en waarderen van welvaartseffecten in een MKBA. RIGO research en Advies, rapport P21000. Amsterdam.
RWS (2014) Kader Doelmatigheidscriterium Geluidsmaatregelen (in Dutch). Rapport CD1114ZCK0160, November 2014.
RWS (2016) Kader Doelmatigheidscriterium Geluidmaatregelen (in Dutch). Rapport RWS-WVL. Version 2.0, September 2016.
Statens vegvesen (2007) Ambisjonsnivåmetoden, Utbyggingsavdelingen, Rapport nr. 2007/12.
Page 55 / 56
CEDR Technical Report 2017-03- Noise cost-benefit analysis and cost-effectiveness analysis
Trafikverkat (2016a) Analysmetod och samhällsekonomiska kalkylvärden för transportsektorn: ASEK 6.0 Kapitel 20 English summary of ASEK Guidelines.
Trafikverkat (2016b) BEVA (Bullereffekter vid vägobjektanalyser) is an Excelbased tool which is used to calculate noise effects of new roads/reconstructed roads. Link: http://www.trafikverket.se/tjanster/system-och-verktyg/Prognos--och-analysverktyg/BEVA/
Trafikverkat (2016c) BUSE – Samhällsekonomisk utvärdering av bulleråtgärder – is an Excelbased tool which is used to calculate social-economic efficiency of noise protection measures along an existing roads or new roads/reconstructed roads. Link: http://www.trafikverket.se/tjanster/system-och-verktyg/Prognos--och-analysverktyg/BUSE/
UN (2013) Cost-benefit analysis versus cost-effectiveness analysis, United Nation Development Programme.
WGHSEA (2003) Valuation of noise. Position paper DG Environment Working Group on Socio-Economic Aspects and Health, Brussels.
WHO (2011) Burden of disease from environmental noise. quantification of healthy life years lost in Europe. World Health Organization, Regional Office for Europe. Copenhagen, Denmark.
WHO (2016) Health statistics and information systems. Link: http://www.who.int/healthinfo/global_burden_disease/metrics_daly/en/

CEDR Technical Report 2017-03 State of the art in managing road traffic noise: cost-benefit analysis and cost-effectiveness analysis ISBN: 979-10-93321-28-8
22-28 Avenue d’Auderghem 1040-Brussels
Tél. : + 32 (0) 27 71 2478 Email : [email protected]
www.cedr.eu