Technical Report 1169 May 1987 Flat Plate Drag Reduction ... · (00 OTC FILE cpa0 0%0 40 Technical...
23
(00 OTC FILE cpa0 0%0 40 Technical Report 1169 May 1987 Flat Plate Drag Reduction in a Water Tunnel Using Riblets - L. W. Reidy DTIC iELECTE <!: ,JUL 0 9 1987 u BESCT -"0PY • IN AVAILABLE COPY Approved for public release; distibution is unlimited, -~-1
Transcript of Technical Report 1169 May 1987 Flat Plate Drag Reduction ... · (00 OTC FILE cpa0 0%0 40 Technical...

(00OTC FILE cpa0
0%0
40
Technical Report 1169
May 1987
Flat Plate Drag Reductionin a Water Tunnel
Using Riblets
- L. W. ReidyDTICiELECTE
<!: ,JUL 0 9 1987u
BESCT -"0PY• IN AVAILABLE COPY
Approved for public release; distibution is unlimited,
-~-1
NAVAL OCEAN SYSTEMS CENTERSan Diego, California 92152-5000
E. G. SCHWEIZER, CAPT, USN R. M. HILLYERCommander Technical Director
ADMINISTRATIVE INFORMATION
The work described herein was performed as a portion of the research at NavalOcean Systems Center (NOSC) within the Independent Research Program.
Released by -\Under authority ofT.S. Mautner, Head / P.M. Reeves, HeadHydromechanics Branch/' -I - Systems Technology
I r~w~- ~ -'Division
ACLNEWLEdGM ENTs /I wish to thank Q'r ,T-S -',Mautner fdr pr/Oposing a s-tudyof riblets and for hishelpful comments throughouiit -thlie -'project and A.O Msffo bs help with running theexperiment. )

UNCLASSIFIEDSECURITY CLASSInECATIO(O FT 1 PAGE
REPORT DOCUMENTATION PAGEI. REPORT SECURITY CLASSIFICATION Ib. RESTRCflYE MAIIKIOS
UNCLASSIFIED2a SECURITY CLASSFICATiON AUTHORITY 3. 0ISTRIBUTON/AVAILABIUTY OF REPORT
2b. DECL ASSIFICAON/DOWNGRADING SCHEOULE Approved for public release; distribution is unlimited.
4 PERFORMING ORGANIZATION REPORT NUMBER(S) S. MONTORING ORGANIZATION REPOf NUMBER(S)
NOSC TR 1169
ft. NAME OF PERFORMING ORGANIZATION fb. OFFICE SYMBOL 7a. NAME OF MONITORING ORGANIZATION
Naval Ocean Systems Center
6,- ADDRESS (City Stage and ZIP Code) 7b. ADDRESS ICRIIy Stage "~ZIP Cc*e)
San Diego, CA 92152-5000
8a.NAME OF FUNDING/SPONSORING ORGANIZATION Sb OFFICE SYMBOL S PROCUREMENT INSTRUMENT IDENTIFICATION NUMBERDirector of Naval Laboratories "dFok"e
Space and Naval Warfare DNLSyntems Command SPWR8f. ADDRESS (CXy. State *M ZIP Cede) 10. SOURCE OF FUNDING NUMBERS
PROGRAM ELEMENT NO. PROJECT NO. TASK NO. AGENCYIndependent Research Programs (IR) IACCESSION NO.Washington, D.C. 20360 61152N ZT23 DN487 753
11. TITLE (,nc*,de Secwrgy CIflsuva,&V7
Flat Plate Drag Reduction in a Water Tunnel Using Riblets
12. PERSONAL AUTHOR(S)L. W. Reldy
~f~EOF REPORT 13b TIME COVERED 14. DATE OF REPORT (Ve.4Macl Dey J1 AE COUNTF Oct 85 TOSep 86 May 198724T FROM _ ,-_ T -= 24
16 SUPPLEMENTARY NOTATION
17. COSATI CODES 18 SUBJECT TERMS (Cononue onreee dnaessey end defyy blod numbr)
FIEL/
9 GROUP SUB.GROUP Drag reduction
/inTurbulent boundary layer//
Streamwie microgroove surface modiflcatioAs, known as ribleto, are known to alt r the structure of the turbulentboundary layer such that the skin friction drag' over the surface is reduced. Forihis investigation, velocity profilemeasurements were used to calculate the drag on a flat plate, both with and without riblets, in a high-speed watertuninel; The vinyl riblet surface, produ'ced a maximum drag reduction of 8.1% c( 2.5% at a nondimensional groovespacing(.L+Pof 13.1. If the results obtained In the laboratory can be realised for torpedoes and other submersibles,significant-Improvements in vehicle speed or fuel economy will be achieved.
20 OISTRBUTION/AVAILABIUITY OF ABSTRACT 21.ASSTRACT SECURITY CLASSIFICATION i -
fl UNCLASSIFIEO/UNUMITEO SAME AS WPT COT USERS UNCLASSIFIED22&. NAME OF RESPONSIBLE INDIVIDUAL 22b. TELEPHONE ,nAd Ar. Cod, 22 OFFICE SYMBOL
L.W. Reldy -(619) 225-6495 Code 634D3D FORM 84 JAN 3 A EDITION MAY BE USED UNL EXHAUSTED UNCLASSIFIEDDD FORM 147L8 JANC ED.I TIc~ ONS AREOSOLTE
4 PAGE

UNCLASSIFIEDSECURITY CLASSIFICATION Of THIS PACE (Won Date Eftforoi
DO FORM 147 , 84- JA
UNCLASSIFIED
SECURITY CLASSIFICATION OF THIS PAGE(Wen Dsea Jatte,.d,

CONTENTS
Page
Nomenclature ................................................................................. i
Introduction ..................................................................................... I
Experimental Apparatus ....................................................................... 2Test Facility ............................................................................ 2Riblet Geometry ......................................................................... 2Baseline Tests........................................................................... 5
Results ...................................................................................... 9Momentum Thickness................................................................... 9Drag Calculations....................................................................... 11Velocity and Turbulence Profiles ...................................................... 13
Conclusions..................................................................................... 13
References ...................................................................................... 16
Accesion For
NTIS CRA&MDTIC TABUnannounced 0Justification
By....... ...
Dist: ibution I
Availability Codes
Avail and IforDist Spe~cial

NOMENCLATURE
Cf = Local Skin Friction Coefficient = 2-r
D = Drag force = -bpU2
H = Shape factor = .*
Reo = Momentum thickness Reynolds number U U
Re. = x-distanca Reynolds number =
Us = Edge velocity = u(6)
U. = Free-stream velocity
b = Test plate width
h = Riblet groove height
h+ = Riblet groove height in wall units = h_v V2
s = Riblet groove spacing
s+ = Riblet groove spacing in wall units = UU
V4 2
u(y) = x-direction mean velocity
u'(y) = Fluctuating component of x-direction velocity (standard deviation)
.U+ - u
x = Distance from leading edge of plate in flow direction I
y -Distance above the plate
IYl4

y+ =
6 = Boundary layer thickness; equal to y where u = 0.999U.
5" = Boundary layer displacement thickness =f (1 - I )dy
0 = Boundary layer momentum thickness = 0u" -J -(1 )dyY =O U06 U0
p = Viscosity of water
ii = Kinematic viscosity of water = -
P
p = Density of water
du"W = Wail shear stress
Subscripts:
c = control surface (smooth vinyl)= leading edge of test surface
r = riblet surface
t = trailing edge of test surfacew = wall
iv

INTRODUCTION
One approach to achieving drag reduction is by altering the structure of theturbulent boundary layer such that the skin friction over the surface is reduced.Reference I is a review of many methods that use this approach. Modification of thebody surface using streamwise grooves, or riblets, is one of these methods. A fewpercentage points of net drag reduction will provide substantial cost savings orimproved speed and endurance capabilities for aerodynamic and hydrodynamicapplications.
In 1979, Michael Walsh of NASA Langley began a series of wind tunnel tests onstreamwise microgrooves [references 2.3.4]. After testing a wide range of groovegeometries on flat plates, he determined that sharply peaked- triangular v-grooves, withheight and spacing equal to 10 to 15 wall units, produced the optimum drag reductionof about 9 percent. Frank Marentic of the 3M Company recognized the opportunity formanufacturing riblets in small groove sizes for high Reynolds -number application.Currently. 3M has the capability of manufacturing adhesive-backed, vinyl riblet films ina variety of groove, sizes.
Based on Walsh's aerodynamic results, others have tested flat plates with v-groovesurfaces in water. These include a water channel test at a flow velocity ofapproximately- 0:3m/s (Reg up to 1350) using grooves machined in plexiglas. Thistest, performed at Lehigh University [reference 5]. showed drag reduction results verysimilar to Walsh's results. A separate but very similar study at Lockheed-Georgiareference- 7] was not able to measure drag accurately enough to confirm these results.n 1985. 3M riblets.were applied to rowing shells and tested in a towing tank at
David TaylorNaval Ship Research and Development Center. The results were widelyvariable and tended to indicate a degradation of the riblets from one day to the next.From a series of rowing tests, however, it was determined that the vinyl ribletsreduced the boat drag by 2 percent [reference 81.
The Lehigh University facility was also used for flow visualization of the boundarylayer, the results of which provide a basis for a discussion of how riblets cause dragreduction [references 5 and 6]. The increased surface area of a grooved surfacecompared- to a smooth surface may intuitively indicate an increase, rather thandecrease, in skin friction. It is believed, however, that the sharp peaks of the v-grooves serve to break up ,the streamwise vortices, inhibiting low-speed streakformation. In this way, the turbulent momentum exchange and skin friction would bereduced.
The present work applies 3M riblets in the turbulent boundary layer region of aflat p!ate -in a high-speed water tunnel. The skin friction drag is calculated fromvelocity profile data. Momentum thickness Reynolds numbeis ranged from 1260 to7040. Spanwise measurements both upstream and downstream of the riblet surface areperformed to ensure that the results are not biased by a spanwise nonuniformity. Theeffect of'-riblets on the boundary layer structure are exarmined through mean velocityand turbulence profiles.
1 ;S

EXPERIMENTAL APPARATUS
TEST FACILITY
The experiment was conducted in the 'Naval Ocean Systems Center (NOSC) high,speed, open jet. recirculating water tunnel. The test section--is Im long, with ao,31m/s -diameter jet. and a turbulence level; u'/U.. less than 0.25% for speeds. up to.12m/s. The flat plate model -was mounted on, longitudinal supports, outside -of, the jet.in a horizontal position along the centerline. The test plate and its leading edge wereseparately constructed from type 302 stainless steel. The flat plate is 19.0mm thickand -.0.58m wide. with an Overall length -of 0.86m. The leading edge piece has astr,eamwise length of 0.15m and a width of -0.30m- and was machined. to include around ededge With a 1.6mnm high forward&facing step. The step, was designed to actas:a tripping, device, and' the leading edge was placed in the -water tunnel's contractionsection, in order to obtain as long a test plate as possible. A diagram- of the *testplate is: shown in figure 1.
Velocity field measurements were made using a TSI Laser Doppler Velocimeter(LDV) mounted on a three-dimensional traverse with numerically controlled positioning.The LDV was operated in the backward scatter mode using a 1 W Argon-Ion laser.The transmitting andl receiving optics were positioned at an angle of approximately 1degree (pointing toward the plate) instead of the usual arrangement of the- systemparallel to the test plate. This. configuration reduces -the interference between- -the laserbeams ;and the flat Plate,. enabling velocities to be measured as close as -0.05mm fromthe plate. Velocities at 20 or more y-16cations were-measured for each boundary layerprofile.
RIBiLET GEOMETRY
The vinyl riblet film used in the tests was manufactured by the 3M Company. Asingle geometry of v-groove riblets was tested. The grooves have height (h) equal tospacing .(s) equal, to 0 :0762mm (0.003 inch). The total film thickness measured to thepeaks -of thegrooves is 0.1524mm. A plain Vinyl film. 0.0762mm thick, was used as acontrol surface. Since the vinyl riblets were originally developed for use -in air.photomicrographs were taken of the materials after soaking overnight- in- water-. The,photographs showed ho swelling or visible changes between the water-soaked and dryriblets. A, photomicrograph of the riblet cross-section looking -in the flow direction isshown in figure 2. When drag measurements -were made., -the- riblets had beensubmerged in water for up to a total of 22 hours. No degradation of drag reductionperformance was observed.
,A, sheet of riblbt fii-, -0305m wide by 0A481m in the streamWise direction, wasattached' to the flat plate with the leading- edge of the film at x=0.184m and,-thetrailing, edge: at, x=0.665m. For control- measurements, the -plain, vinyl of the samedimensions, was- attachbd'-.in the same-location. The adhesive film. either riblets orsmooth vinyl, Will be referred to as the -test surface in this report. Figure -1 showsthe location of the test surface on the test plate.
2 L----------

FORWARD-FACING
U 03mTEST SURFACE 0.30m 0.55m
-0.665m
4 0.86m
Figure 1. Test plate.

Figure 2. Photograph of riblet cross-section with hs0.003 inch.

BASELINE TESTS
Velocity measurements with the control test surface in place were performed toensure the presence of a zero pressure-gradient, fully turbulent boundary layer in themeasurement region. The velocity profile data shown in figure 3 were obtained atx=0.320m, 0.524m, 0.651m, and 0.778m, and are presented in .trms of u/U. vs. y/O.The collapse of the data on a single curve represents good similarity of the profilesover the measurement region. Figure 4 shows a profile of u'-/U., the fluctuatingstreamwise velocity component, obtained at x=0.216m, nondimensionalized by the edgevelocity, and compares it to the generally accepted flat plate data reported byKlebanoff [reference 9].
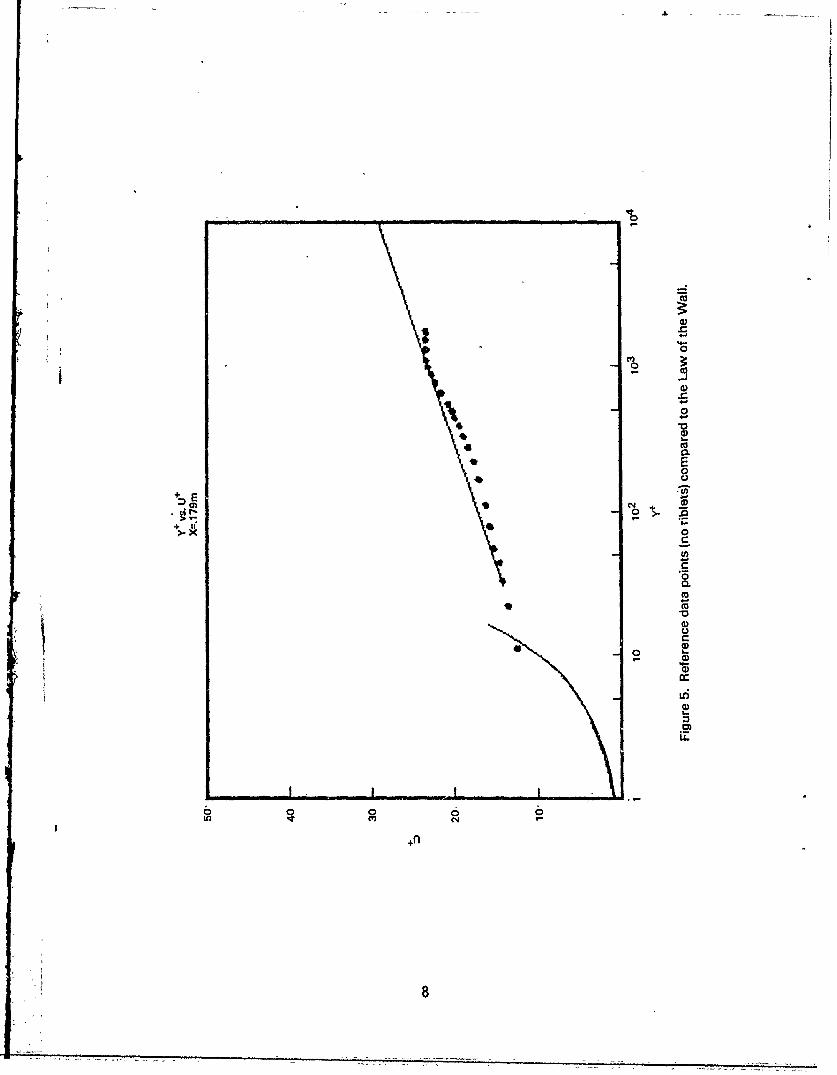
In addition to the (y/O, u/U.) profiles, plots of (u+, y+) were made using the skinfriction coefficient, Cf, calculated from empirical relationships. A typical (u+, y+) plotis shown in figure 5, where Cf was calculated using the Ludweig-Tillman relationship,
Cf = 0.246(10)'°'678HRe-0" 26S ,
where the values of 6*, 0, and H were obtained by integrating the experimentalvelocity profiles. The measured (u+, y+) profile compares favorably to the universallogarithmic profile, shown in figure 5, given by,
+ lny + + 5.0.0.4
The velocity point that is closest to the wall, at y = 0.05mm*.02mm, is the onlypoint in the viscous sublayer region (u+=y+ region).
The skin friction coefficient from the Ludweig-Tillman equation was also used tocalculate the riblet size in wall units, h+ and s+. Nte that for the riblets tested, h+= s+ since h = s. To calculate s+, velocity profiles were measured 4mm upstream ofthe leading edge of the test surface, at x=0.179m. The local skin-friction coefficientfrom the Ludweig-Tillman relationship, the free stream velocity, and the viscosity areused to calculate s+ from
s+ = sU
This technique for calculating s+ is not appropriate on or downstream of the ribletsurface, because the smooth flat plate empirical relation for Cf is not applicable to theboundary layer that has been affected by riblets.
j 5

0
n1L.
00
CDc;
0
L)
L
-J-0M
4)L
0 11 0
C5 C; 0
0/
XO6
Cd 6 C4:

0
u coZ 0 .0
W-Z C5
xx
x .Ir
xxx
x
- 0 0 0
On/I,
CLS 4E
0
cc4-
++

RESULTS
MOMENTUM THICKNESS
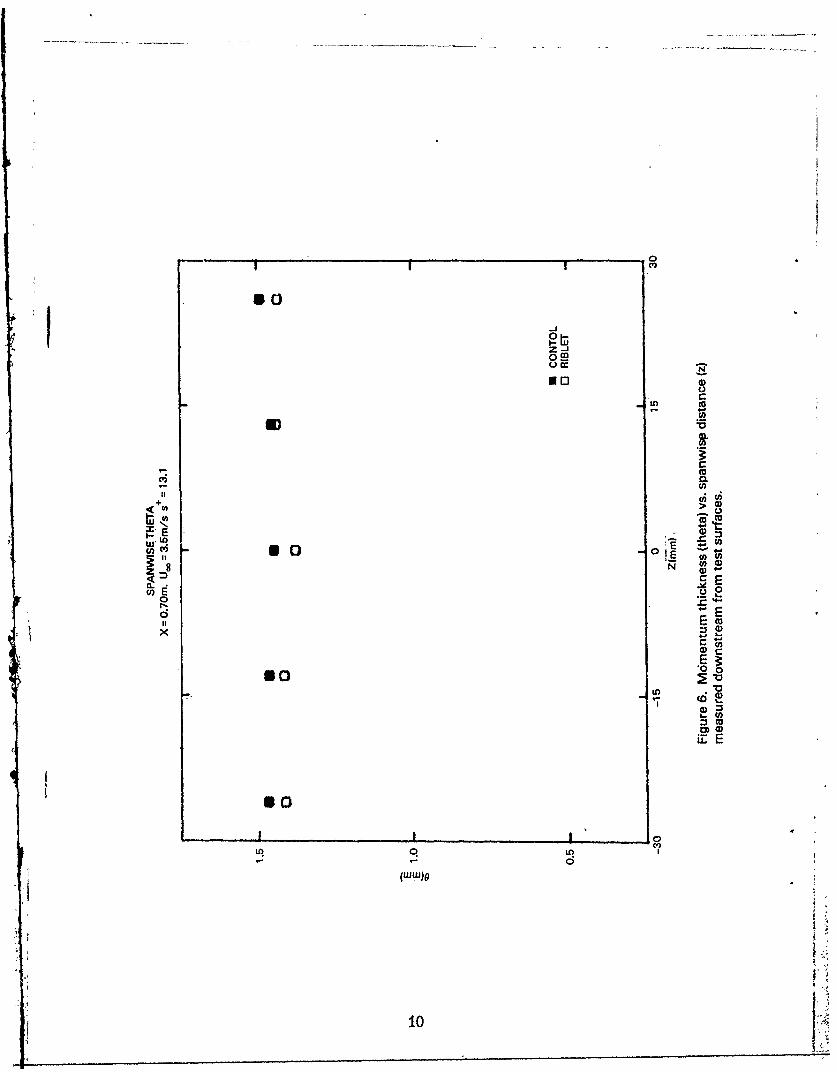
Each velocity profile was integrated to produce momentum thickness, 0. Acomparison of momentum thicknesses is the basis for the drag reduction measurementsof this study. In oider to 'compare a, momentum thickness downstream from the ribletsurface to ohe downstream from the plain vinyl surface, some adjustments must bemade because the water temperature and free stream velocity will not be exactly thesame for the two measurements made on different days. The power-law flat plateapproximation,
Reo = 0.03497 -Rex4/ 5
can be rearranged tox VI/5 x4/5
9 = 0.03497 ---e/5 = 0.03497
In order to compare two momentum thicknesses at the same x-location measured ondifferent days. all measured Os are adjusted to the same v and U.. Allmeasurements were adjusted to a viscosity of 1.05 x 10"6m 2/sec. which corresponds to18*C. The measurements are also adjusted to the exact free stream velocity that wasattempted, either 2.0. 3.0, 3.5. 4.0. 4.5. 5.0. or 6.0m/sec. The equation used toadjust momentum thicknesses, then, is
Oadlustad =/F measured 4 1 /5ured I/
0mauFigure 6 is a plot of adjusted momentum thickness for U. = 3.5m/sec. Five spanwisevalues at x = 0.70m (35mm downstream from the test surfaces) are shown forcomparing the riblet surface to the control surface. One can see the effect of theriblet film in reducing the momentum thickness. The increase in momentum thicknessat spanwise distances from the plate centerline (z=0.0) is due to the spreading of thejet in the open jet test section. At all of the spanwise measuring stations, the drag-reducing effect of the riblets can be seen.
9IA
C
II ~Ci
+c
SE-
2 80Lg '0
E
(D
so
(wwI)
10

DRAG CALCULATIONS
The drag on the flat plate was calculated using
D = bpU 20
The drag reduction over the test surface portion of the plate can be represented asIDR-DM-, - (Dr,-D),
e%DR = D-DI)
where the subscripts are t = to the trailing edge of the test surface, I = to the° leading edge of the test surface, c = control surface, r = riblet surface. Recognizing
that if adjusted momentum thicknesses, as described in the previous section, are usedso that bpU 2. is a constant, and that the drag upstream of the leading edge of thetest surface is the same for riblet and control surfaces (DI., = DI.,). the dragreduction equation reduces to
%DR = -0t,Ot~c -01
Trailing edge momentum thicknesses were measured at x = 0.700m. which is 35mmdownstream from the trailing edge of the test surface. Velocity profiles closer to thetrailing edge are not used because the small step down from the film to the plate mayaffect the profile shape. However, for the purpose of calculating drag reduction overthe length of the test surface film only, the momentum thickness is adjusted so that itcorresponds to 0 at x=0.665m. the actual trailing edge of the test surface, using theflat plate approximation relating Re. and Re given in the previous section. The same
method was used.to adjust momentum thic nesses measured 4 to 15mm upstream ofthe test surface to correspond to the leading edge. This flat plate approximaton maynot be perfectly accurate for the region downstream from the test surface that hasbeen affected by riblets, but it is more accurate than treating the area between thetrailing edge and the measuring station as if it were covered with riblets. In addition,these adjustments to 0 are very small compared to the change in 0 over the 481mmlength of the test surface.
The drag reduction results are shown in figure 7 as a function of riblet size inwall units. The values of s+ correspond to the leading edge of the test surface: s+will increase by about 9% from the leading edge to the trailing edge of the testsurface. The drag reduction percentages in figure 7 are calculated from the momentumthickness measurements on the plate centerline (z=0.0). The maximum measured dragreduction is 8.1%. which occurred for s+=13 .1. If a curve is drawn between datapoints, the region of positive drag reduction is seen to extend from approximately s+=7to s+=20. Outside of this ",ange, the riblets will be- likely to increase, rather thandecrease, the surface drag. These results are in good agreement with the bulk of datafor v-groove surfaces in aerodynamic and hydrodynamic experiments;
The uncertainties in the measured quantities, velocity, and y-position were used tocalculate an uncertainty in momentum thickness of *1.1% of the measured value.Based on this, the error bands on percent drag reduction (%DR). shown in figure 7.range from ,2.5% to #2.9%. depending on the- Reynolds number. The uncertaintyanalysis also points out that as the x-direction length of riblet material is decreased.the uncertainty in percent drag reduction increases. For this reason, the maximumpossible length of riblet material was used.
11 :

0I N
I I'
_____ to1 I I 4-.
I .0I.-
I C I I 2C A C,,
80
C
U4-
G)
0,w
p I.
0
0)1~
to
U-
00
to 0 to to- 'I
110%
'I
12
VELOCITY AND TURBULENCE PROFILES
Profiles of the mean and fluctuating components of the streamwise velocity weremeasured over the riblet film. as well as downstream from the film. However. becauseof the uncertainty in choosing a y=O position for the grooved surface, the profiles overthe riblets are not included here. Figures 8 and 9 show profiles measured at x=0.70m(35mm downstream from the trailing edge of the test surfaces). The mean velocityprofile (figure 8) shows a region of increased velocity downstream from the ribletscompared to the smooth test surface for y/6 from 0.04 to 0.6. For y/O greater than0.6, the velocities downstream from the riblets are approximately equal to the velocitiesdownstream from the smooth surface.
The corresponding turbulence profile (figure 9) does -rot present as clear a picture.but it does illustrate some observed trends. The scatter associated with the rmsmeasurements i3 particularly large in the near-wall region, and is probably due tointerference of the laser with the test plate. For y/O from 0.08 to 0.4. u'/U. issuppressed for the riblet case as compared to the smooth test surface. For y/O from0.4 to 1.0. u'/U. for thc riblet case tenids to be larger than or equal to that for thesmooth test surface case. For y/O greater than 1.0. u'/U. measurements for the twocases are coincident.
CONCLUSIONS
The results of this experiment are in agreement with the bulk of othermeasurements of drag reduction using v-groove riblets. The findings show that thevinyl- riblets manufactured by the 3M Company, which were originally developed foraerodynamic applications, will perform equally well in water. The measured dragreduction of 8% will correspond to a velocity increase of 2% for a vehicle underconstant power. The riblets were quite durable and showed no degradation inperformance over the time that the experiment was conducted. Since very long durationuse without inspection of the surface could be a potential problem. the most practicalNavy application at this time may be to torpedoes. Improvements in fuel economy aswell' as vehicle speed are possible using this simple, passive, drag reduction system.
13
:1

CD
0
0 x to0.
E 0
0
0 co
C14
O/A
II 14

C;
0tr-
0 to
ox C0
m 0
+ xx 00)C
- >
xxIf-
+X
x C
In
Z)L-
CI 0Ix CA
0 15

REFERENCES
1. Bandyopadhyay, P.R., "REVIEW-Mean Flow in Turbulent Boundary LayersDisturbed to Alter Skin Friction," Journal of Fluids Engineering, Volume 108, pp 127.June 1986.
2. Walsh, M.J. and A.M. Lindemann. "Optimization and Application of Riblets forTurbulent Drag Reduction." AIAA-84-0347, AIAA 22nd Aerospace Sciences Meeting,Reno, Nevada, January 1984.
3. Walsh. M.J.. "Riblets as a Viscous Drag Reduction Technique." AIAA Journal,Volume 21. No. 4. pp 485, April 1983.
4. Walsh. M.J., "Drag Characteristics of V-groove and Transverse Curvature Riblets."Viscous Flow Drag Reduction, G. R. Hough, editor, Volume 72, Progress inAstronautics and Aeronautics, from Symposium on Viscous Drag Reduction, Dallas.Texas. November 1979.
5. Bacher. E.V. and C.R. Smith, "A Combined Visualization- Anemometry Study ofthe Turbulent Drag Reducing Mechanisms of Triangular Micro-Groove SurfaceModifications." AIAA-85-0548. AIAA Shear Flow Control Conference, March 1985.
6. Bacher, E.V. and C.R. Smith, "Turbulent Boundary-Layer Modification by SurfaceRiblets," AIAA Journal. Volume 24, No. 8. pp 1382. August 1986.
7. Gallagher, J.A. and A.S.W. Thomas, "Turbulent Boundary Layer CharacteristicsOver Streamwise Grooves," AIAA-84-2185, AIAA 2nd Applied Aerodynamics Conference.* Igust 1984.
8. Eilers, R.E., Koper. C.A.. McLean. J.D.. and D.W. Coder. "An Application ofRiblets for Turbulent-Skin-Friction Reduction," presented at the Twelfth AnnualSymposium on Sailing by the American Institute of Aeronautics and Astronautics andthe University of Washington. Seattle, Sept. 20-21, 1985.
9. Hinze, J.O., Turbulence, 2nd edition, McGraw-Hill Book Company, New York, 1974.
16