
Technical proposal fyp
29
0 | Page TECHNICAL PROPOSAL UNIVERSITI KUALA LUMPUR BRITISH MALAYSIAN INSTITUTE DEVELOPMENT OF HEALTH MONITORING COMPANION STUDENT NAME : MUHAMAD FAIZUDIN BIN MD. LAZIM STUDENT ID : 51216113592 COURSE : BET IN MEDICAL ELECTRONIC HONS. SUPERVISOR : MADAM SITI AFIFAH BINTI MOHSHIM DATE : APRIL 13 TH 2016
-
Upload
faiz-lazim -
Category
Engineering
-
view
193 -
download
0
Transcript of Technical proposal fyp
0 | P a g e
TECHNICAL PROPOSAL
UNIVERSITI KUALA LUMPUR
BRITISH MALAYSIAN INSTITUTE
DEVELOPMENT OF HEALTH MONITORING
COMPANION
STUDENT NAME : MUHAMAD FAIZUDIN BIN MD. LAZIM
STUDENT ID : 51216113592
COURSE : BET IN MEDICAL ELECTRONIC HONS.
SUPERVISOR : MADAM SITI AFIFAH BINTI MOHSHIM
DATE : APRIL 13TH
2016

1 | P a g e
ABSTRACT
Health monitoring system are essential for the user or patient that having difficulty to
go to the clinics or hospitals to have their medical examinations especially the OKU.
Based on research conducted by AARP , American Association of Retired Persons , they
claimed that there are about 90% of the senior citizens are not capable to go the medical
facility to have their medical check-up due to their age condition or disabilities cause by
accident or major injuries. Lack on the information of their body condition also taken into
account as the one of the major problems that the health monitoring companion should be
develop to take care of their own health. For example, our elder parents did not have
knowledge on the medical condition of human body also for the methods to handle any of
the medical instruments. As for the OKU, they are not capable to go to the clinics or
hospitals due to their disabilities and must be stay at home entire period of rehabilitation.
A simple and compact system should be develop to take care of these citizens to
accompany them at home entire time. To achieve this project, four sensors will be used
which is ECG (Electrocardiogram) Sensor, Temperature Sensor , GSR(Galvanic Skin
Response) Sensor and SpO2 (Blood Oxygen Level) Sensor to monitor their daily routine
anytime at home. A microcontroller with SoC (System on Chip) ATMEGA328 and a e-
health Sensor Shield V2 will be used as the main board of the system connected by the
several sensors that have been mentioned .The result will be display on the Graphical
LCD display embedded to the microcontroller itself and also to the android application
running on the phone. The system will be able to measure and collects all the four
medical parameter includes the body temperature, skin conductance level,
electrocardiograph, and blood oxygen level. The user will be prompted to the simple user
interface that can help them to understand every output result from the system.
2 | P a g e
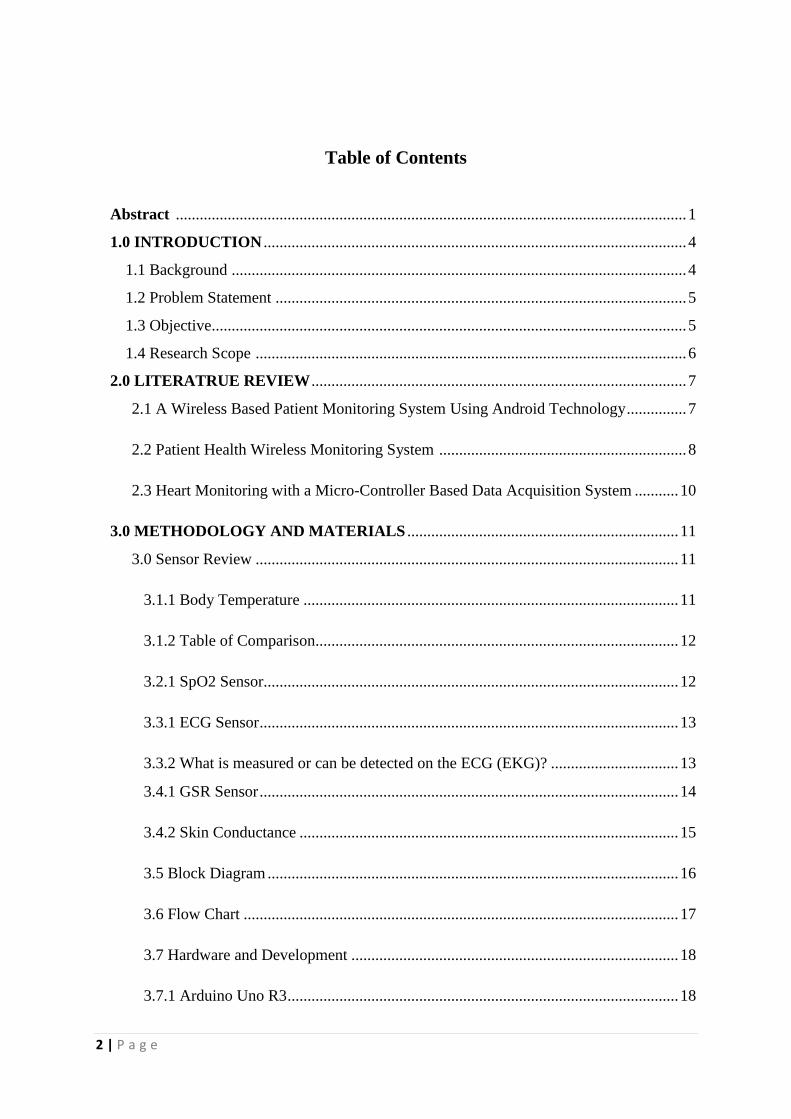
Table of Contents
Abstract ................................................................................................................................ 1
1.0 INTRODUCTION .......................................................................................................... 4
1.1 Background .................................................................................................................. 4
1.2 Problem Statement ....................................................................................................... 5
1.3 Objective....................................................................................................................... 5
1.4 Research Scope ............................................................................................................ 6
2.0 LITERATRUE REVIEW .............................................................................................. 7
2.1 A Wireless Based Patient Monitoring System Using Android Technology ............... 7
2.2 Patient Health Wireless Monitoring System .............................................................. 8
2.3 Heart Monitoring with a Micro-Controller Based Data Acquisition System ........... 10
3.0 METHODOLOGY AND MATERIALS .................................................................... 11
3.0 Sensor Review .......................................................................................................... 11
3.1.1 Body Temperature .............................................................................................. 11
3.1.2 Table of Comparison........................................................................................... 12
3.2.1 SpO2 Sensor........................................................................................................ 12
3.3.1 ECG Sensor ......................................................................................................... 13
3.3.2 What is measured or can be detected on the ECG (EKG)? ................................ 13
3.4.1 GSR Sensor ......................................................................................................... 14
3.4.2 Skin Conductance ............................................................................................... 15
3.5 Block Diagram ....................................................................................................... 16
3.6 Flow Chart ............................................................................................................. 17
3.7 Hardware and Development .................................................................................. 18
3.7.1 Arduino Uno R3 .................................................................................................. 18
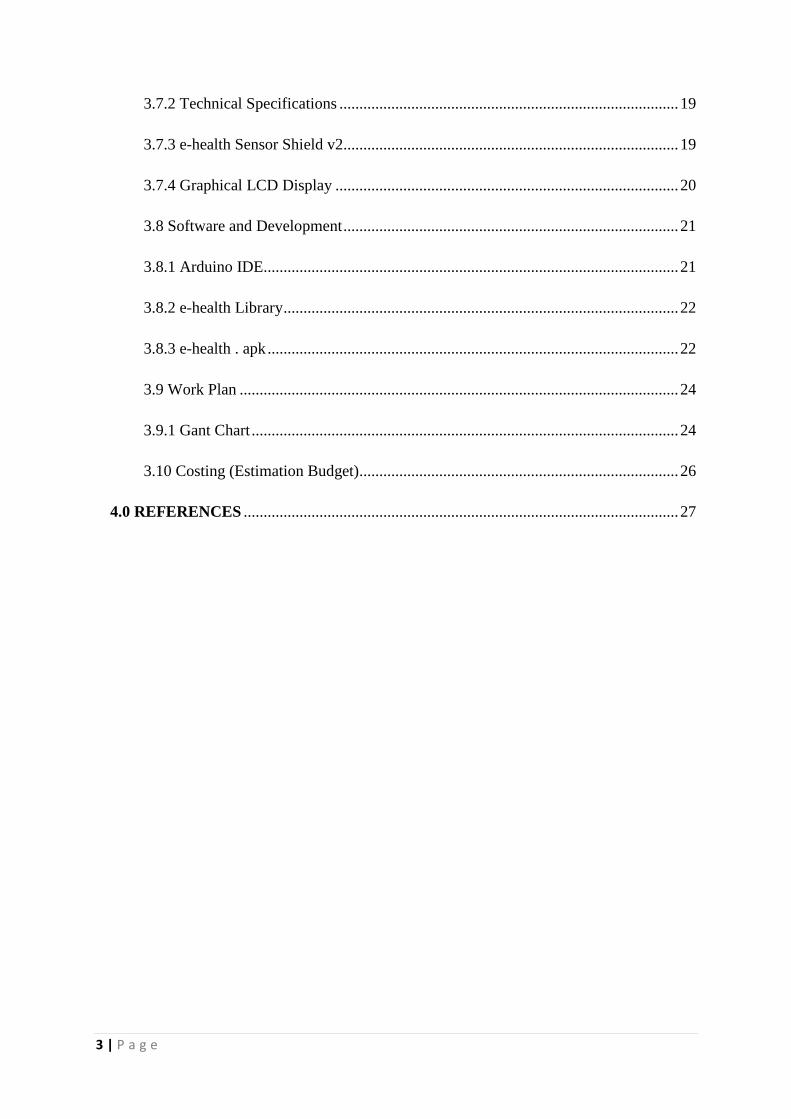
3 | P a g e
3.7.2 Technical Specifications ..................................................................................... 19
3.7.3 e-health Sensor Shield v2.................................................................................... 19
3.7.4 Graphical LCD Display ...................................................................................... 20
3.8 Software and Development .................................................................................... 21
3.8.1 Arduino IDE........................................................................................................ 21
3.8.2 e-health Library ................................................................................................... 22
3.8.3 e-health . apk ....................................................................................................... 22
3.9 Work Plan .............................................................................................................. 24
3.9.1 Gant Chart ........................................................................................................... 24
3.10 Costing (Estimation Budget)................................................................................ 26
4.0 REFERENCES ............................................................................................................. 27

4 | P a g e
1.0 INTRODUCTION
This project requires the hardware design of Adriano Uno R3 and software by
Arduino IDE .A medical shield will be used with the microcontroller which is e-health
Sensor Shield. These two mainboard will be connected with four different types of sensors of
ECG Sensor , GSR Sensor , Temperature Sensor and SpO2 Sensor. By the used of these four
sensor , the user will be able to identify their several health condition and monitor them by
time to time.
1.1 Background
Human nowadays need to take care of their own health and the one they love around
them. Instead of spending time going to clinics or hospital to have their medical checkup,
they chose to stay at home and continue doing their daily routines. Even if they did, they also
need an assistant or companion around them anytime and everywhere they go. They need to
understand how is their health condition (is it bad or good?).As an example, if one patient
were given a result of ECG graphs by the medical assistant, did he/she truly understand of
every waveform present in the result or know what does the PQRS stands for? So, they
should be able to understand every parameter readings by the help of the user interface that
will be design.
So there must be some device which would help patient to keep track on their health
by themselves. There are various instruments available in market to keep track on internal
body changes. But there are many limitations regarding their maintenance due their heavy
cost, size of instruments, and mobility of patients.
To overcome these limitations a device use to keep track on every parameter
involved should be easy to use, portable, light weighted, small size etc. so that it give
freedom of mobility for patient. The devices which can be carried everywhere to keep track
on patient’s health.. If any varied change takes place it is notified. This notification would
help to take an appropriate action at an instance of a time. This would save patients from the
future health problem which would arise. This would also help patient's concern doctor to
take an appropriate action at proper time.
The device contains several types of sensors includes ECG( Electrocardiogram)
sensor, GSR ( Galvanic Skin Response)sensor , Temperature sensor , and SpO2 (Blood
Oxygen Level) .The ECG sensor will measure the waveform of the heartbeat of the user.
While the GSR sensor will measure the level of skin conductance , Temperature sensor for
measuring the body temperature and SpO2 sensor measuring the blood oxygen level in
human blood of the user
5 | P a g e
All these sensor will be connected to main process board of the system which is e-
health sensor shield v2 socketed to the Arduino Uno R3. All measurement will be display on
the Graphical LCD display and on the e-health .apk android applications on the mobile
phones.
1.2 Problem Statement
Monitoring the health of the human body conditions are one of the serious issues in
our daily routines. Most important things that need to be taken into account are to understand
the physiological measurements involved in our body systems. Our elder citizen may not
know and understand every medical parameters that been measured by the patient monitoring
system.
Human body system consists of series of complex system that requires being monitor
from time to time. Bad physical condition could lead to several health problems includes
fever , cold , high blood pressure , lack of oxygen in haemoglobin and even heart failure.
Lots of product of patient monitoring system that have been developed before
focussing on the amount of sensors and quality of measurements without contrasting on the
method of using it .User often neglect to use the manual that comes with the product and use
it without any calibration of the sensors thus resulting the errors on the measurements taken.
Example like the single monitoring device, ECG monitor consist of series of
electrodes and monitor to display the output waveform of the heartbeat. User that did not
have the knowledge of handling those products unable to configure and calibrate for the first
time use of it.
1.3 Objective
The main objective of this project is to develop a user-interface/medical assistant to
help maintaining medical condition for home-used. The system can measures certain
parameters and explained to the user how to interact through the interface easily.
6 | P a g e
1.4 Research Scope
This project undergoes several research before the development of the system
following the scopes :
1. The project use the Arduino Uno R3 as the main processing unit
2. E-health Sensor Shield will be used as the main hub or shield to connect all the
sensors
3. Three physiological signal were used to measure the heart rate , skin conductance
level , blood oxygen level and body temperature
4. The heart rate was measured using the ECG electrodes
5. Body temperature was measured by using TMP36.
6. Skin conductance level was measured using GSR sensor
7. Blood oxygen level was measured using SpO2 sensor.
8. Graphical LCD display used to display the output of the system.
9. E-health .apk android application was used

7 | P a g e
2.0 LITERATURE REVIEW
2.1
A Wireless Based Patient Monitoring System
Using Android Technology
By B. Sneha
(29-31 Oct. 2015)
Overview of the study :
Treating patients in remote areas in emergency condition are critical task and hence a
continuous monitor system is essential for doctors to treat them when they are in need. This system
can be used for more than one patient at a time. A patient monitoring system can be developed with
the advantages of network technology and multiple sensor fusion technology along with the
combination of Smartphone and Bluetooth technologies. Development of smart phones has leaded
the world in technology usage from common people to professional to their needs. Sensor
technology and Android Smartphone can be used as a key component of this system to solve the
purpose of mobile medical care. Data collected by the sensors is processed by the microcontroller
device and sent to Android mobile phone through Bluetooth and it can also transmit this data on
time to the remote server. This method helps doctor to get data of patient and treat them well.
Along with this, it also provides connection to the medical center using cell phones to transfer all the
acquired data through internet.

8 | P a g e
2.2
Patient Health Wireless Monitoring System
By Ashish Ganesh Bajaj, Asst. Prof. Shaila P. Kharde
(April 2016)
Overview of the Study :
We propose a Simple Wireless transmission System using common approach Sensor
Platform called The wireless based Patient Sensor platform Monitoring system, in this paper
presents the development of a microcontroller based system for wireless heartbeat and
temperature monitoring using RF module. In India many patients are dying because of heart
attacks and reason behind that they are not getting timely and proper help. The proposed
platform architecture offers flexibility, easy customization for different vital parameter
collecting and sending. To give them timely and proper help first we want to continuous
monitoring of patient health. The fixed monitoring system can be used only when the patient
is on bed and this system are huge and only available in the hospitals in ICU. Care of
critically ill patients, requires spontaneous & accurate decisions so that life-protecting &
lifesaving therapy can be applied. This paper is based on monitoring of remote patients, after
he is discharged from hospital. I have designed and developed a reliable, energy efficient
remote patient monitoring system. It is able to send parameters of patient in real time. It
enables the doctors to monitor patient’s parameters (temp, heartbeat) in real time. Here the
parameters of patient are measured continuously (temp, heartbeat) and wirelessly transmitted
using RF module
9 | P a g e
Background of the Study
The proposed system is developed for home & ICU (and any other place) use by
patients that are in a critical condition & need to be constant or periodically monitored by
clinician or family. In any critical condition parameters are send to the doctor or any family
member. So that we can easily save many lives by providing them quick services. Normally it
is difficult to keep in track on abnormalities in heartbeat count for patient itself manually. The
average heartbeat per minute for 25-year old ranges between 140-170 BPM while for a 60-
year old it is typically between 115-140 BPM and body temperature is 37 C or 98.6 F.
Patients are not well versed with manual treatment which doctors normally use for tracking
the count of heartbeat. So there must be some device which would help patient to keep track
on their health by themselves. There are various instruments available in market to keep track
on internal body changes. But there are many limitations regarding their maintenance due
their heavy cost, size of instruments, and mobility of patients. To overcome these limitations
a device use to keep track on heartbeat count of patients should be easy to use, portable, light
weighted, small size etc so that it give freedom of mobility for patient. The devices which can
be carried everywhere to keep track on patient’s health for continuous monitoring. This
device that is a heartbeat sensor would help them to keep track on heartbeat counts of a
patient and check for any abnormalities (if any). If any varied change takes place it is
notified. This notification would help to take an appropriate action at an instance of a time
through doctors discussion. This would save patients from the future health problem which
would arise in future.. This would also help patient's concern doctor to take an appropriate
action at proper time with fast discussion. The analog to digital converter carries out the
process of the analog to digital conversion using IC. The microcontroller constantly monitors
the output of the A/D Converter, comparing current data samples against stored samples.
Once a heart attack is detected and confirmed, relevant data such as the time of occurrence
will be collected, and a signal is sent to LCD of doctor.

10 | P a g e
2.3
Heart Monitoring with a Micro-Controller Based Data
Acquisition System and Textrodes
By Dimitrios TSELES
(29 February 2016)
Overview of the Study :
Progress in personal monitoring health systems is presented is this paper. Acquisition
of biological signals can be realized through wearable embedded systems that are based on
microcontrollers and RF modems. The wireless sensors networks technology has been
adapted for implementation of Body Sensor Networks (BSN).A novel data acquisition system
has been designed and implemented in order to acquire body physiological parameters
measurements. Emergency call possibility is also considered. Development of an innovative
software leads to diagnosis schemes through detection of abnormal arrhythmia incidents. This
progress to the development of a standard model for monitoring patients remotely gives
results that push research to improve patient’s safety. The goal in this case is to integrate
innovative fibrous sensors textrodes in the clothes of patients, athletes and individuals who
are engaged in specific critical work (police, military, etc.).
Background of the Study :
Personal monitoring health systems are able to monitor older people or patients at risk
of life-threatening situations such as arrhythmias or cardiac failure and wearable health
monitoring systems seem to be the future trend in disease management. The term “disease
management" is nowadays one of the most commonly used words in the healthcare
environment, and seems to be the future expectation for medical applications with the
ambition not only to provide improved quality of care but also to achieve patient follow up,
disease surveillance and on the top of all, an intervention in an acute incidence. Some cardiac
patients need only routine follow up as their regular therapy while others require intensive
follow-up such as patients with advanced heart failure. In this category it is frequently
observed the tendency to monitor the clinical status of the patient in order to detect early
acute events and disease progression.
Health monitoring systems in cardiology are able to monitor vital signs such as heart
rate, electrocardiogram, temperature and pulse oximetry. The patient’s condition can be
monitored by sensors attached to the body. Body area Network technologies are used in such
situations. According to literature, the application of remote monitoring technology in patient

11 | P a g e
can be summarized in a) custom-made therapy) early diagnosis, c) schedule of next
appointment by letting the facts decide, d) monitoring in the home environment, e)
monitoring in everyday activities.
3.0 METHODOLOGY AND MATERIAL
3.1 Sensors Review
3.1.1 Body Temperature
Temperature Sensor that will be used in this project is LM35 . The sensor work by
reading the value of from Analog ADC input of Arduino Uno R3. The LM35 series are
precision integrated-circuit temperature devices with an output voltage linearly-proportional
to the Centigrade temperature. The LM35 device has an advantage over linear temperature
sensors calibrated in Kelvin, as the user is not required to subtract a large constant voltage
from the output to obtain convenient Centigrade scaling. The LM35 device does not require
any external calibration or trimming to provide typical accuracies of ±¼°C at room
temperature and ±¾°C over a full −55°C to 150°C temperature range. Lower cost is assured
by trimming and calibration at the wafer level. The low-output impedance, linear output, and
precise inherent calibration of the LM35 device makes interfacing to readout or control
circuitry especially easy. The device is used with single power supplies, or with plus and
minus supplies. As the LM35 device draws only 60 µA from the supply, it has very low self-
heating of less than 0.1°C in still air. The LM35 device is rated to operate over a −55°C to
150°C temperature range, while the LM35C device is rated for a −40°C to 110°C range (−10°
with improved accuracy). The LM35-series devices are available packaged in hermetic TO
transistor packages, while the LM35C, LM35CA, and LM35D devices are available in the
plastic TO-92 transistor package. The LM35D device is available in an 8-lead surface-mount
small-outline package and a plastic TO-220 package.
Arduino Uno R3 is working under 10-bit specification which is 2^10=1024.By
connecting the sensor to the 5V input , the formula used is : Voltage at pin in milliVolts =
(reading from ADC) * (5000/1024) .Then, to convert millivolts into temperature, use this
formula:Centigrade temperature = [(analog voltage in mV) - 500] / 10
12 | P a g e
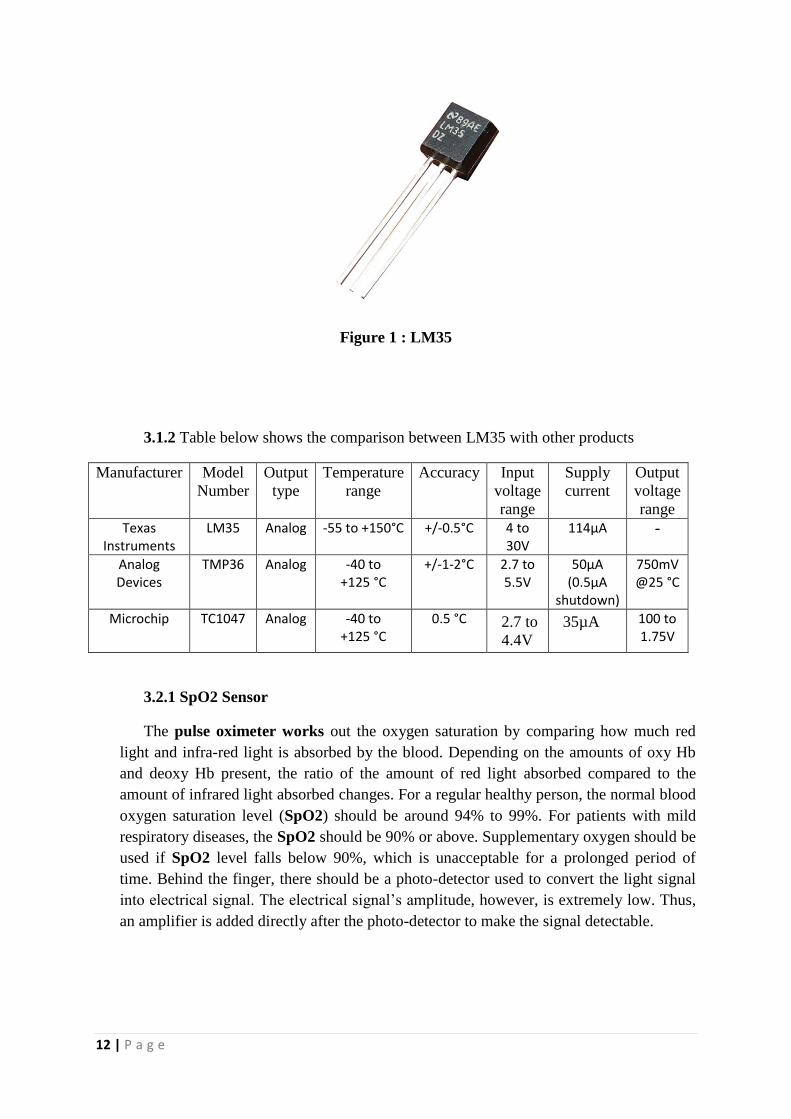
Figure 1 : LM35
3.1.2 Table below shows the comparison between LM35 with other products
Manufacturer Model
Number
Output
type
Temperature
range
Accuracy Input
voltage
range
Supply
current
Output
voltage
range
Texas Instruments
LM35 Analog -55 to +150°C +/-0.5°C 4 to 30V
114µA -
Analog Devices
TMP36 Analog -40 to +125 °C
+/-1-2°C 2.7 to 5.5V
50µA (0.5µA
shutdown)
750mV @25 °C
Microchip TC1047 Analog -40 to +125 °C
0.5 °C
2.7 to
4.4V
35µA
100 to 1.75V
3.2.1 SpO2 Sensor
The pulse oximeter works out the oxygen saturation by comparing how much red
light and infra-red light is absorbed by the blood. Depending on the amounts of oxy Hb
and deoxy Hb present, the ratio of the amount of red light absorbed compared to the
amount of infrared light absorbed changes. For a regular healthy person, the normal blood
oxygen saturation level (SpO2) should be around 94% to 99%. For patients with mild
respiratory diseases, the SpO2 should be 90% or above. Supplementary oxygen should be
used if SpO2 level falls below 90%, which is unacceptable for a prolonged period of
time. Behind the finger, there should be a photo-detector used to convert the light signal
into electrical signal. The electrical signal’s amplitude, however, is extremely low. Thus,
an amplifier is added directly after the photo-detector to make the signal detectable.

13 | P a g e
Figure 2 :SpO2 Sensor
3.3.1 ECG Sensor
ECG Electrodes - Electrocardiography (ECG or EKG*) is the process of recording the
electrical activity of the heart over a period of time using electrodes placed on a patient's
body. These electrodes detect the tiny electrical changes on the skin that arise from the heart
muscle depolarizing during each heartbeat.
The electrocardiogram (ECG or EKG) is a diagnostic tool that is routinely used to assess
the electrical and muscular functions of the heart.
Electrocardiogram Sensor (ECG) has grown to be one of the most commonly used
medical tests in modern medicine. Its utility in the diagnosis of a myriad of cardiac
pathologies ranging from myocardial ischemia and infarction to syncope and palpitations has
been invaluable to clinicians for decades.
The accuracy of the ECG depends on the condition being tested. A heart problem may not
always show up on the ECG. Some heart conditions never produce any specific ECG
changes. ECG leads are attached to the body while the patient lies flat on a bed or table.
3.3.2 What is measured or can be detected on the ECG (EKG)?
1 The orientation of the heart (how it is placed) in the chest cavity.
2 Evidence of increased thickness (hypertrophy) of the heart muscle.
3 Evidence of damage to the various parts of the heart muscle.
4 Evidence of acutely impaired blood flow to the heart muscle.
5 Patterns of abnormal electric activity that may predispose the patient to abnormal
cardiac rhythm disturbances.
6 The underlying rate and rhythm mechanism of the heart.
Schematic representation of normal ECG

14 | P a g e
Figure 3 : ECG waveform
Figure 4 : ECG electrodes with patches
3.4.1 GSR Sensor
Skin conductance, also known as galvanic skin response (GSR) is a method of
measuring the electrical conductance of the skin, which varies with its moisture level. This is
of interest because the sweat glands are controlled by the sympathetic nervous system, so
moments of strong emotion, change the electrical resistance of the skin.
Skin conductance is used as an indication of psychological or physiological arousal,
The Galvanic Skin Response Sensor (GSR - Sweating) measures the electrical conductance
between 2 points, and is essentially a type of ohmmeter. In skin conductance response
method, conductivity of skin is measured at fingers of the palm. The principle or theory
behind functioning of galvanic response sensor is to measure electrical skin resistance based

15 | P a g e
on sweat produced by the body. When high level of sweating takes place, the electrical skin
resistance drops down. A dryer skin records much higher resistance.
3.4.2 Skin Conductance
Figure below shows the skin conductance level between two points between two
fingers of the user.
Figure 5 : Skin conductance between two points
Figure 6 : GSR electrodes

16 | P a g e
3.5 Block Diagram
INPUT PROCESS OUTPUT
Power Supply
( 5V)
GSR Sensor
ECG Sensor
Temperature Sensor
SpO2
Sensor
e-health Sensor Shield
V2
Arduino Uno R3
e-health Sensor Shield
V2
Graphical LCD

17 | P a g e
3.6 Flow Chart

18 | P a g e
3.7 Hardware and Development
There are several hardware components that will be used in this project .Every
function and configuration of the components will be explained in the details followed.
3.7.1 Arduino Uno R3
Figure 7 : Arduino Uno R3
The Uno is a microcontroller board based on the ATmega328P. It has 14 digital
input/output pins (of which 6 can be used as PWM outputs), 6 analog inputs, a 16 MHz
quartz crystal, a USB connection, a power jack, an ICSP header and a reset button. It contains
everything needed to support the microcontroller; simply connect it to a computer with a
USB cable or power it with a AC-to-DC adapter or battery to get started.. You can tinker with
your UNO without worrying too much about doing something wrong, worst case scenario
you can replace the chip for a few dollars and start over again.

19 | P a g e
3.7.2 Technical Specifications
Microcontroller ATmega328P
Operating Voltage 5V
Input Voltage (recommended) 7-12V
Input Voltage (limit) 6-20V
Digital I/O Pins 14 (of which 6 provide PWM output)
PWM Digital I/O Pins 6
Analog Input Pins 6
DC Current per I/O Pin 20 mA
DC Current for 3.3V Pin 50 mA
Flash Memory 32 KB (ATmega328P)
of which 0.5 KB used by bootloader
SRAM 2 KB (ATmega328P)
EEPROM 1 KB (ATmega328P)
Clock Speed 16 MHz
Length 68.6 mm
Width 53.4 mm
Weight 25 g
Table 1 : Arduino Uno R3 Specifications
3.7.3 e-health Sensor Shield
Figure 8 : e-health Sensor Shield v2

20 | P a g e
The e-Health Sensor Shield V2.0 allows Arduino and Raspberry Pi users to perform
biometric and medical applications where body monitoring is needed by using 10 different
sensors: pulse, oxygen in blood (SPO2), airflow (breathing), body temperature,
electrocardiogram (ECG), glucometer, galvanic skin response (GSR - sweating), blood
pressure (sphygmomanometer), patient position (accelerometer) and muscle/eletromyography
sensor (EMG).
This information can be used to monitor in real time the state of a patient or to get
sensitive data in order to be subsequently analysed for medical diagnosis. Biometric
information gathered can be wirelessly sent using any of the 6 connectivity options available:
Wi-Fi, 3G, GPRS, Bluetooth, 802.15.4 and ZigBee depending on the application.
If real time image diagnosis is needed a camera can be attached to the 3G module in
order to send photos and videos of the patient to a medical diagnosis center.
Data can be sent to the Cloud in order to perform permanent storage or visualized in
real time by sending the data directly to a laptop or Smartphone. iPhone and Android
applications have been designed in order to easily see the patient's information.
3.7.4 Graphical LCD Display
A graphic LCD (liquid crystal display) is an electronic visual display technology used
in different gadgets and information-output sources, mostly in display screens of electronic
devices. This technology employs manipulating tiny crystals of a contained liquid crystal
solution through precise electronic signals to perform graphic display operations over a two-
dimensional physical screen. LCD technology is considered the successor of conventional
CRT (cathode ray tube) visual display technology, which uses electron-firing gun to produce
a pixel-based display over monitor screens.
21 | P a g e
Graphic LCDs offer multiple significant advantages over traditional CRT-based
visual display units. Some major advantages include compact and thin dimensions, more
detailed display of 3-D (three-dimensional) objects, lower power consumption, and lighter
weight. Furthermore, all these features have considerably contributed towards integration of
these visual display units into commercial portable electronic items.
3.8 Software and Development
3.8.1 Arduino IDE
Figure 9 : Arduino IDE Software
Arduino programs may be written in any programming language with a compiler that
produces binary machine code. Atmel provides a development environment for their
microcontrollers, AVR Studio and the newer Atmel Studio.
The Arduino project provides the Arduino integrated development environment
(IDE), which is a cross-platform application written in the programming language Java. It
originated from the IDE for the languages Processing and Wiring. It is designed to introduce
programming to artists and other newcomers unfamiliar with software development. It
includes a code editor with features such as syntax highlighting, brace matching, and
automatic indentation, and provides simple one-click mechanism to compile and load
programs to an Arduino board. A program written with the IDE for Arduino is called a
"sketch".

22 | P a g e
The Arduino IDE supports the languages C and C++ using special rules to organize code.
The Arduino IDE supplies a software library called Wiring from the Wiring project, which
provides many common input and output procedures. A typical Arduino C/C++ sketch
consist of two functions that are compiled and linked with a program stub main() into an
executable cyclic executive program:
setup(): a function that runs once at the start of a program and that can initialize
settings.
loop(): a function called repeatedly until the board powers off.
After compiling and linking with the GNU toolchain, also included with the IDE
distribution, the Arduino IDE employs the program avrdude to convert the executable code
into a text file in hexadecimal coding that is loaded into the Arduino board by a loader
program in the board's firmware.
3.8.2 e-health Library
The eHealth sensor platform includes a high level library functions for a easy manage
of the board. This zip includes all the files needed in two separated folders, “eHealth” and
“PinChangeInt”.
The library will be used and installed on the arduino library files to be called when the
parameters codes need to be used.
3.8.3 e-health . apk

23 | P a g e
An android application will be used in this project which requires to be connected
through Zigbee module that integrate the signal from the e-health sensor shield to the user
smartphone. The application can be download on the Play Store and Apple Store which is
free and open-source.
24 | P a g e
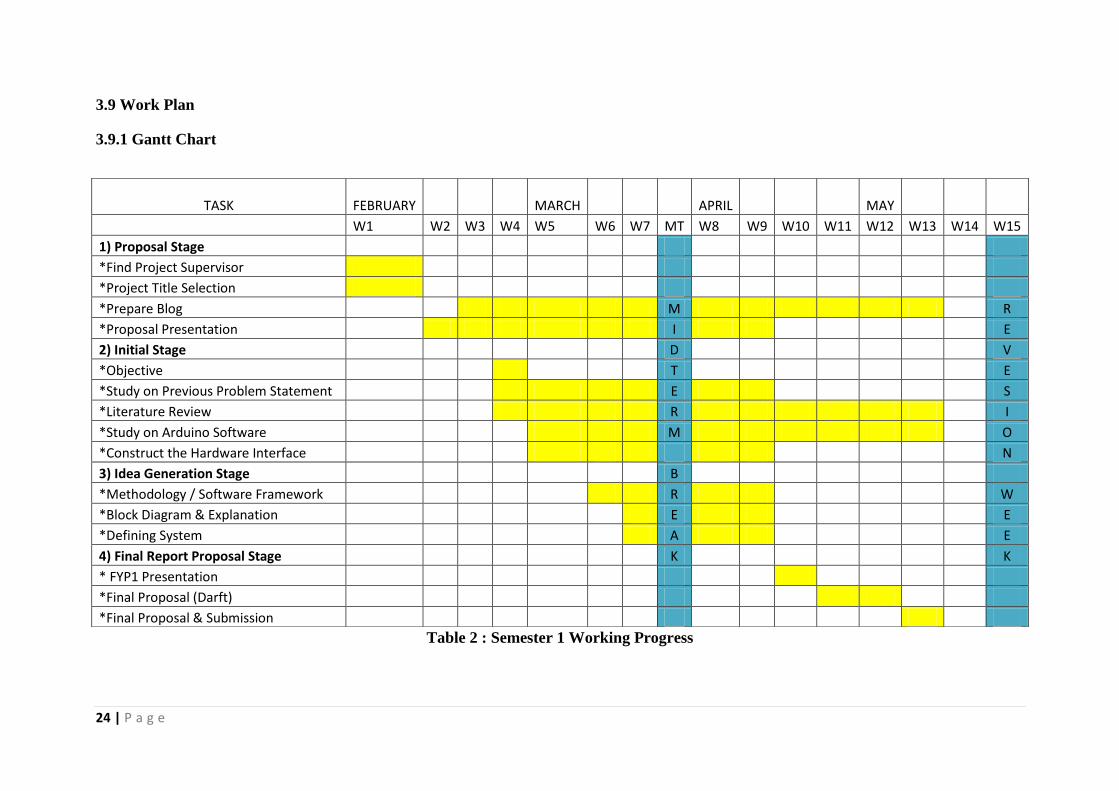
3.9 Work Plan
3.9.1 Gantt Chart
TASK
FEBRUARY
MARCH
APRIL
MAY
W1 W2 W3 W4 W5 W6 W7 MT W8 W9 W10 W11 W12 W13 W14 W15
1) Proposal Stage
*Find Project Supervisor
*Project Title Selection
*Prepare Blog M R
*Proposal Presentation I E
2) Initial Stage D V
*Objective T E
*Study on Previous Problem Statement E S
*Literature Review R I
*Study on Arduino Software M O
*Construct the Hardware Interface N
3) Idea Generation Stage B
*Methodology / Software Framework R W
*Block Diagram & Explanation E E
*Defining System A E
4) Final Report Proposal Stage K K
* FYP1 Presentation
*Final Proposal (Darft)
*Final Proposal & Submission
Table 2 : Semester 1 Working Progress

25 | P a g e
TASK
SEPTEMBER
OCTOBER
NOVEMBER
DISEMBER
W1 W2 W3 W4 W5 W6 W7 MT W8 W9 W10 W11 W12 W13 W14 W15
1) Briefing FYP 2 M R
2) Hardware Stage I E
*Acquiring Materials D V
*Design Circuits T E
*Make Prototype E S
*Troubleshoot R I
3) Software Stage M O
*Study on e-health Sensor Shield Library N
*Apply the Software to the Project B
*Troubleshoot R W
4) Final Report Stage E E
*FYP 2 Presentation A E
*Final Report (draft) K K
*Final Report Submission
Table 3 : Semester 2 Working Progress
26 | P a g e
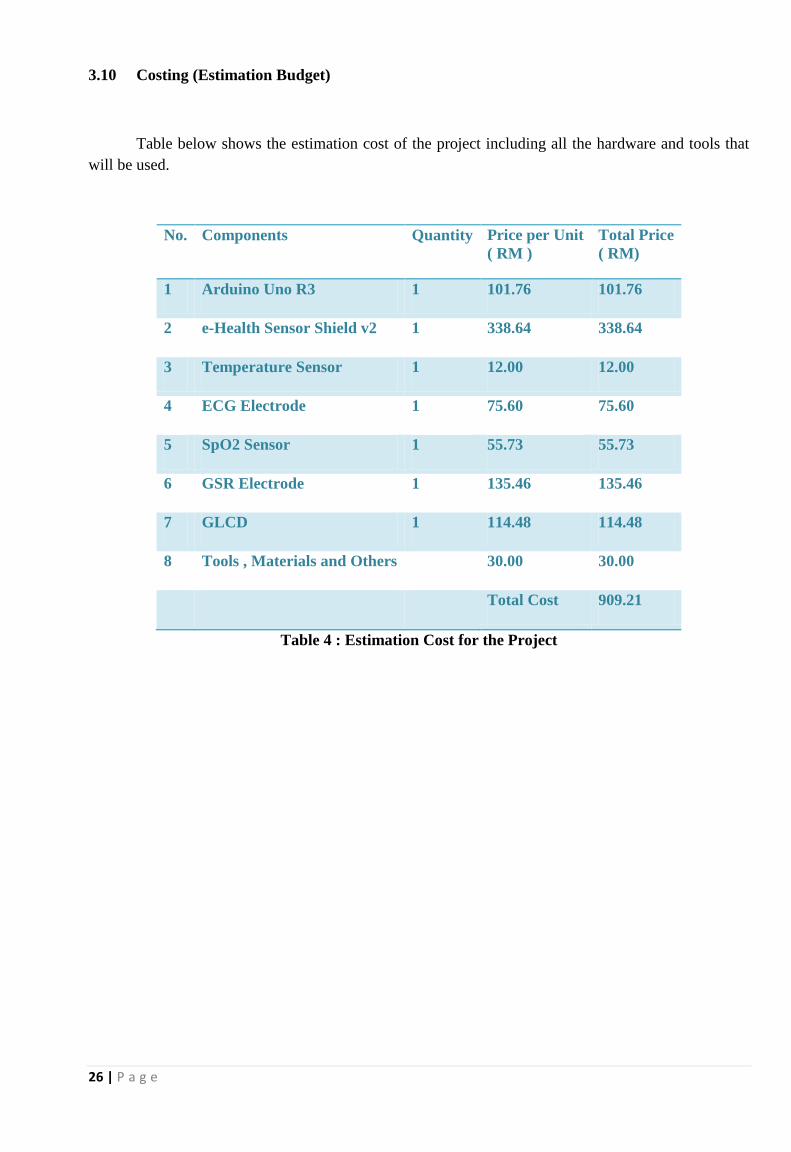
3.10 Costing (Estimation Budget)
Table below shows the estimation cost of the project including all the hardware and tools that
will be used.
No. Components Quantity Price per Unit
( RM )
Total Price
( RM)
1 Arduino Uno R3 1 101.76 101.76
2 e-Health Sensor Shield v2 1 338.64 338.64
3 Temperature Sensor 1 12.00 12.00
4 ECG Electrode 1 75.60 75.60
5 SpO2 Sensor 1 55.73 55.73
6 GSR Electrode 1 135.46 135.46
7 GLCD 1 114.48 114.48
8 Tools , Materials and Others 30.00 30.00
Total Cost 909.21
Table 4 : Estimation Cost for the Project
27 | P a g e
4.0 REFERENCES
1. Libelium Comunicaciones Distribuidas S.L. , 2013 https://www.cooking-
hacks.com/documentation/tutorials/ehealth-biometric-sensor-platform-arduino-raspberry-pi-
medical#step5_5
2. Arduino Team , (2010) https://blog.arduino.cc/
3. WikipediaTeam,28April2016 https://en.wikipedia.org/wiki/List_of_temperature_sensors
4. Sensors & Transducers 2016 by IFSA Publishing, S. L. http://www.sensorsportal.com
5. Lady Ada , 2015-11-19 https://learn.adafruit.com/tmp36-temperature-sensor/using-a-temp-
sensor
6. Manisha Shelar ,Jaykaran Singh ,Mukesh Tiwari Wireless Patient Health
MonitoringSystem,January2013http://research.ijcaonline.org/volume62/number6/pxc3884697.
7. Electrocardiogram explanation image“ Retrieved 28 February 2014.
8. PrasannaTilakaratna(2012) http://www.howequipmentworks.com/pulse_oximeter/
9. "ECG- simplified. Aswini Kumar M.D.". LifeHugger. Retrieved 11 February 2010.
10. Woodford, Chris. (2009) Accelerometers. Retrieved from
http://www.explainthatstuff.com/accelerometers.html.

28 | P a g e


