Technical Notes - Trade Competitiveness Map - ITC · PDF fileAround 100 countries have...
54
TECHNICAL NOTES TRADE COMPETITIVENESS MAP Benchmarking national and sectoral trade performance TRADE PERFORMANCE INDEX Market Analysis and Research Division of Market Development International Trade Centre
Transcript of Technical Notes - Trade Competitiveness Map - ITC · PDF fileAround 100 countries have...
TECHNICAL
NOTES
TECHNICAL NOTES
TRADE COMPETITIVENESS MAP
Benchmarking national and sectoral trade performance
TRADE PERFORMANCE INDEX
Market Analysis and Research
Division of Market Development
International Trade Centre

ITC‟s Market Analysis and Research – TPI Technical Notes
International Trade Centre (ITC)
Table of Contents
1. Summary ........................................................................................ 1
2. Introduction .................................................................................... 1
3. Motivation for developing the Trade Performance Index............ 3
4. Content of the TPI .......................................................................... 4
5. Data used ....................................................................................... 5
6. Description of indicators ............................................................... 8
G1. - VALUE OF EXPORTS (in thousand US$) ............................................................................... 9
G2. - EXPORT GROWTH IN VALUE, p.a. (%) ............................................................................... 11
G3. - SHARE IN NATIONAL EXPORTS (%) .................................................................................. 13
G4. - SHARE IN NATIONAL IMPORTS (%) ................................................................................... 15
G5. - RELATIVE TRADE BALANCE (%) ........................................................................................ 17
G6. - RELATIVE UNIT VALUE (world average = 1) ....................................................................... 19
P1. - VALUE OF NET EXPORTS .................................................................................................... 21
P2. - PER CAPITA EXPORT .......................................................................................................... 23
P3. - SHARE IN WORLD MARKET (% share of world exports) ..................................................... 25
P4.a - PRODUCT DIVERSIFICATION (N° of equivalent products - EN) ....................................... 27
P4.b - PRODUCT CONCENTRATION (Spread) ............................................................................ 29
P5.a - MARKET DIVERSIFICATION (N° of equivalent markets) ................................................... 31
P5.b - MARKET CONCENRATION (Spread) ................................................................................. 33
C1. - RELATIVE CHANGE OF WORLD MARKET SHARE ........................................................... 35
C1.a - COMPETITIVENESS EFFECT, p.a. (%) ............................................................................. 37
C1.b - INITIAL GEOGRAPHIC SPECIALISATION, p.a. (%) .......................................................... 39
C1.c - INITIAL PRODUCT SPECIALISATION, p.a. (%) ................................................................. 41
C1.d - ADAPTATION EFFECT, p.a. (%) ........................................................................................ 43
C2. - MATCHING WITH DYNAMICS OF WORLD DEMAND ........................................................ 45
7. Appendixes .................................................................................. 47
7.1. Appendix 1: More on the use of different dispersion indicators .......................................... 47
7.2. Appendix 2: Definition of sectors ........................................................................................ 48

ITC‟s Market Analysis and Research – TPI Technical Notes
International Trade Centre (ITC) 1
1. Summary
The International Trade Centre (ITC) developed the Trade Performance Index (TPI)
with the aim of assessing and monitoring the multi-faceted dimensions of export
performance and competitiveness by sector and by county.
At present, the TPI covers around 180 countries and 14 different export sectors.
The index calculates the level of competitiveness and diversification of a particular
export sector using comparisons with other countries. In particular, it brings out
gains and losses in world market shares and sheds light on the factors causing
these changes. Moreover, it monitors the evolution of export diversification for
products and markets. The TPI is limited by its purely quantitative approach,
although it does provide a systematic overview of sectoral export performance and
comparative and competitive advantages.
For each country and each sector, the TPI provides three types of indicators: a
general profile, a country position for the latest available year and changes in export
performance in recent years. Altogether, the TPI makes use of several quantitative
performance indicators. For ease of reference, these indicators are presented in
absolute terms and, in addition, ranked among the 180 countries covered by the
TPI.
Moreover, one composite ranking referring to the overall position of a country and
sector is calculated. This composite ranking is based on five criteria, namely the
value of net exports, per capita exports, the world market share, the diversification
of products, and the diversification of markets.
2. Introduction
The trade performance of individual countries tends to be a good indicator of
economic performance since well performing countries tend to record higher rates
of GDP growth. The majority of developing countries have joined the World Trade
Organization (WTO) and have taken initiatives aimed at opening their economies.
ITC‟s Market Analysis and Research – TPI Technical Notes
International Trade Centre (ITC) 2
Nevertheless, the outcome has not always been systematically positive with export
performance sometimes remaining disappointing. It is difficult to establish an all
embracing definition of successful trade performance.
Trade champions contrast with certain specialised exporters that suffer from
deterioration in their terms of trade. For example, some developing countries record
high growth rates by specialising in niche markets and concentrating their export
markets, while other developing countries record more moderate rates of growth
with a well diversified array of products and partner countries. In other cases,
successful performance is the result of a favourable product or market penetration
since the beginning. Successful performance can also be gauged in terms of a
country‟s ability to adapt its export profile to changing patterns of world demand.
The last approach is the most dynamic and demand-driven trade policy stance.
The Trade Performance Index (TPI thereafter) designed by ITC aims to tackle the
complex and multidimensional nature of trade patterns. This index is computed
using the world‟s largest trade database, COMTRADE (of the United Nations
Statistics Division), covering around 180 countries1, where more than 95% of world
trade in 5,000 products is reported at the 6-digit level of the Harmonized System
(HS). Since COMTRADE captures around 95 % of world trade, the TPI is calculated
not only for countries that report their own trade data, but also for over one hundred
primarily low-income countries that do not report national trade statistics.
Given that such an amount of information would be overwhelming to the final user,
products are grouped into 14 sectors (see appendix 2). Calculations are made at
the product level and results are presented at the sectoral level and for the
economy as a whole. For each country and each sector, the TPI provides a general
profile, indicators on a country‟s position and indicators on changes in export
performance in recent years.
The rest of the paper covers the objectives, methodology and results of the TPI
framework.
1 In the case of non-reporting countries, the trade is reconstituted on the basis of partner country
statistics (mirror statistics). This approach does not capture trade among non-reporting countries

ITC‟s Market Analysis and Research – TPI Technical Notes
International Trade Centre (ITC) 3
3. Motivation for developing the Trade Performance Index
Generally, trade performance is characterised by rough indicators, such as the level
of openness (total trade in goods and services divided by GDP) or growth of
exports over a given period (such as the World Bank‟s World Development
Indicators).
Recent research on the relationship between trade and growth suggests that
openness alone is not a sufficient criterion for determining high levels of growth.
Other factors, such as the type of product available, the level of market and
economic diversification, the positioning on quality ladders, are also significant in
explaining growth. In addition, it is important to determine the reasons for country
differences in export growth and to determine the redistributive process of market
shares among competitors.
Departing from the rough indicators referred to above, microeconomic and
generally qualitative indicators are used to characterise the competitiveness of
nations. In this light, the “Microeconomic index of competitiveness” (Porter and
Christensen, 1999), is based on the micro-foundations of a country‟s
competitiveness. Launched in 1998 as part of the Global Competitiveness Report,
this index is based on a survey of some 4,000 businessmen and government
officials in 58 countries, including OECD countries2. Regressing income per capita
on this index explains more than 80% of the variance of income in the sample. A
quantitative method was developed in order to complement the qualitative
approach, which may be criticised on the ground of being limited to a small number
of developing countries.
It appears that the relative position of a country or product on the international
market, and its development over time, is a good indicator of competitiveness.
Trade statistics capture these changes. Trade statistics have the advantage of
being available for a substantial number of countries. For those countries which do
not report trade statistics, their trade profile can be (partially) completed by using
2 Indicators range from the overall infrastructure quality to administrative infrastructure, information
infrastructure, capital availability, human resources etc.

ITC‟s Market Analysis and Research – TPI Technical Notes
International Trade Centre (ITC) 4
mirror statistics. Lastly, trade data is broken down at the industry and product
levels, which provides a disaggregated insight into trade performances.
On this basis, developing countries can be ranked according to their trade
performance, based on various criteria. A ranking can be provided by country,
sector, or a combination of different criteria.
It must be stressed that the performance of individual countries cannot be
determined on the basis of a restricted sample of countries or products. The
derivation of the relative export performance is achieved by including a significant
number of countries, together with a detailed product breakdown.
4. Content of the TPI
For each country and each sector, the TPI provides indicators on a country‟s
general profile, on a country‟s position and on the decomposition of the country‟s
change in world market share. Altogether, the TPI consists of 22 quantitative
indicators of trade performance. For ease of reference, these indicators are
presented in absolute terms and, in addition, combined to form a ranking among the
countries. All this information is grouped under three categories referring to “general
profile”, “current performance” and “decomposition of changes in trade
performance”, as illustrated in Table 1.

ITC‟s Market Analysis and Research – TPI Technical Notes
International Trade Centre (ITC) 5
Table 1. Groups of indicators used
Current performance
3
General profile
Decomposition of changes in world market share (last 5 years)
P1. Value of net exports
G1. Value of exports
C1. Relative change of world market share
P2. Per capita exports
G2. Trend growth of exports (last 5 years)
decomposed into:
P3. Share in world market
G3. Share in national exports
(C1a) Competitiveness effect
P4.a Product diversification P4.b Product concentration
G4. Share in national imports
(C1b) Initial geographic specialisation
P5.a Market diversification P5.b Market concentration
G5. Growth in per capita exports (last 5 years)
(C1c) Initial product specialisation
G6. Level in relative unit values
(C1d) Adaptation effect
C2. Matching with dynamics of world demand
5. Data used
The raw trade data used to calculate the indicators are defined at the 6-digit level of
the Harmonized System, 1996 edition, which includes more than 5'000 product
items. The data are extracted from COMTRADE (http://comtrade.un.org), the
United Nations Commodity Trade Statistics Database, maintained by the Statistics
Division of the U.N.
Around 100 countries have reported their trade data systematically over the last five
years in the 1996 edition of the HS. For the other countries (around 90), we are
using mirror estimates, which are derived from partner countries statistics. Since
COMTRADE captures around 95 % of world trade, mirror estimates usually give
fairly reliable results. See Box 1 for a description of problems encountered using
trade data.
3 Indicators used for the computation of the composite index.
ITC‟s Market Analysis and Research – TPI Technical Notes
International Trade Centre (ITC) 6
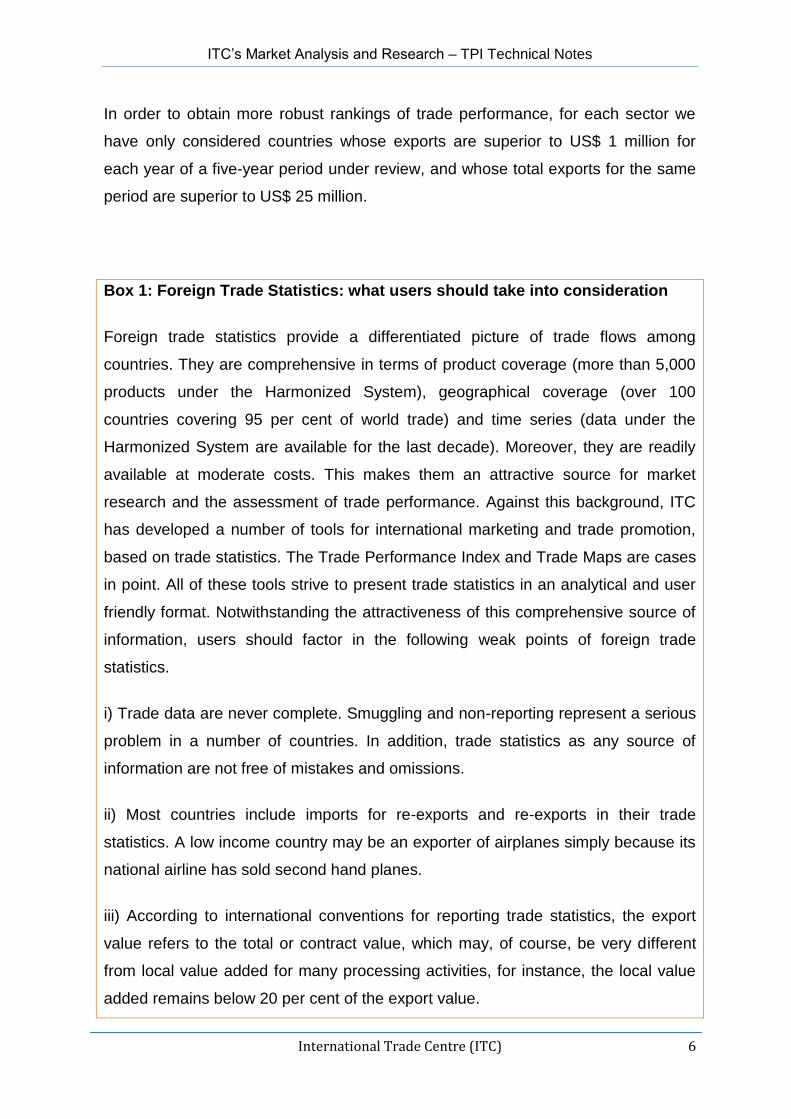
In order to obtain more robust rankings of trade performance, for each sector we
have only considered countries whose exports are superior to US$ 1 million for
each year of a five-year period under review, and whose total exports for the same
period are superior to US$ 25 million.
Box 1: Foreign Trade Statistics: what users should take into consideration
Foreign trade statistics provide a differentiated picture of trade flows among
countries. They are comprehensive in terms of product coverage (more than 5,000
products under the Harmonized System), geographical coverage (over 100
countries covering 95 per cent of world trade) and time series (data under the
Harmonized System are available for the last decade). Moreover, they are readily
available at moderate costs. This makes them an attractive source for market
research and the assessment of trade performance. Against this background, ITC
has developed a number of tools for international marketing and trade promotion,
based on trade statistics. The Trade Performance Index and Trade Maps are cases
in point. All of these tools strive to present trade statistics in an analytical and user
friendly format. Notwithstanding the attractiveness of this comprehensive source of
information, users should factor in the following weak points of foreign trade
statistics.
i) Trade data are never complete. Smuggling and non-reporting represent a serious
problem in a number of countries. In addition, trade statistics as any source of
information are not free of mistakes and omissions.
ii) Most countries include imports for re-exports and re-exports in their trade
statistics. A low income country may be an exporter of airplanes simply because its
national airline has sold second hand planes.
iii) According to international conventions for reporting trade statistics, the export
value refers to the total or contract value, which may, of course, be very different
from local value added for many processing activities, for instance, the local value
added remains below 20 per cent of the export value.

ITC‟s Market Analysis and Research – TPI Technical Notes
International Trade Centre (ITC) 7
iv) Detailed trade statistics are available only for merchandise trade and not for
services, although the latter may account for a sizeable share of national exports.
v) Even at the lowest level of disaggregation, product groups in the trade
nomenclatures do not necessarily reflect trade names and often contain a wide
spread of different products. Moreover, the product nomenclature is sometimes
misleading. The labels of aggregated product groups are often very general and
provide at times only limited guidance on the leading items within the group of
products concerned.
vi) Exchange rates fluctuations are not always properly recorded in international
trade statistics. Values are normally aggregated over the period of one year in local
currency and converted into US dollars.
vii) For countries that do not report trade data to the United Nations, ITC uses
partner country data, an approach referred to as mirror statistics. Mirror statistics
are a second best solution (better than having no data at all). At the same time,
they have a number of shortcomings when compared to the first best solution of
nationally reported data. First and foremost, they do not cover trade with other non
reporting countries. As a result, mirror statistics hardly cover South trade. For an
assessment of intra African trade, for instance, mirror statistics are not a suitable
source of information. Second, there is the problem of transhipments, which may
hide the actual source of supply. Third, mirror statistics invert the reporting
standards by valuing exports in if terms (i.e. including transport cost and insurance)
and imports in fob terms (excluding these items).
In view of the above shortcomings, trade statistics should never be the sole source
of insight but need to be complemented by other sources and in particular cross
checked by product specialists and industry insiders. Overall, ITC's experience
suggests that trade statistics represent a very useful source of information and a
valid point of departure for strategic market research, if analysed with a healthy mix
of scepticism and pragmatism vis-à-vis their strength and shortcomings.
ITC‟s Market Analysis and Research – TPI Technical Notes
International Trade Centre (ITC) 8
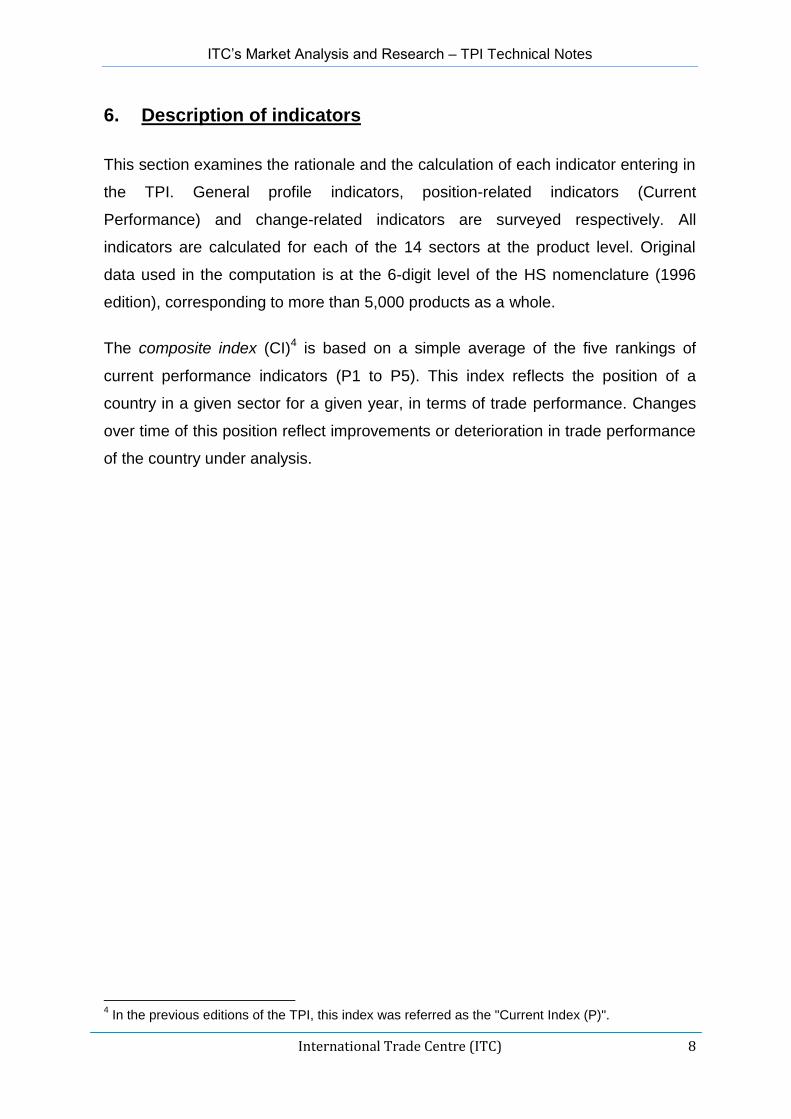
6. Description of indicators
This section examines the rationale and the calculation of each indicator entering in
the TPI. General profile indicators, position-related indicators (Current
Performance) and change-related indicators are surveyed respectively. All
indicators are calculated for each of the 14 sectors at the product level. Original
data used in the computation is at the 6-digit level of the HS nomenclature (1996
edition), corresponding to more than 5,000 products as a whole.
The composite index (CI)4 is based on a simple average of the five rankings of
current performance indicators (P1 to P5). This index reflects the position of a
country in a given sector for a given year, in terms of trade performance. Changes
over time of this position reflect improvements or deterioration in trade performance
of the country under analysis.
4 In the previous editions of the TPI, this index was referred as the "Current Index (P)".

ITC‟s Market Analysis and Research – TPI Technical Notes
International Trade Centre (ITC) 9
G1. - VALUE OF EXPORTS (in thousand US$)
• What does it tell us?
This index shows the value of country‟s sector‟s total exports for the chosen year (in thousands of US$), indicating the importance of the sector.
Exports are given in FOB terms (free on board) if the country is a direct reporter to the United Nations‟ COMTRADE database, otherwise in CIF terms (cost, insurance, freight), as mirror statistics (based on the partners‟ declarations of imports) are used.
• Definition:
Sum of selected sector‟s exports in the chosen year.
• Range of values:
Takes value between 0 and +∞, with higher values indicating greater importance of the sector under review.
Example: The above figure depicts the “Wood and articles of wood” sector‟s exports (value in thousand US$) for selected economies in the chosen year (t).
$16,793,596
$10,749,814
$9,992,899
$71,082 $21,133
$0
$3,000,000
$6,000,000
$9,000,000
$12,000,000
$15,000,000
$18,000,000
China RussianFed.
Italy Nigeria Venezuela
Exports (value in thousands US$)

ITC‟s Market Analysis and Research – TPI Technical Notes
International Trade Centre (ITC) 10
G1. – TECHNICAL NOTES
• Mathematical definition:
t
dsX
where d is the country under study, s refers to a specific sector and X are the export values.
• Data sources: Trade data can be obtained from the ITC Trade Map and the United Nations Commodity Trade database (COMTRADE).
Country Exports (value in thousands US$)
China $16,793,596
Russian Fed. $10,749,814
Italy $9,992,899
Nigeria $71,082
Venezuela $21,133
Sample calculation: The table above presents total exports data for selected economies for the sector under review. The trade data is from ITC Trade Map. All of the data is in compatible units (current US dollars).
ITC‟s Market Analysis and Research – TPI Technical Notes
International Trade Centre (ITC) 11
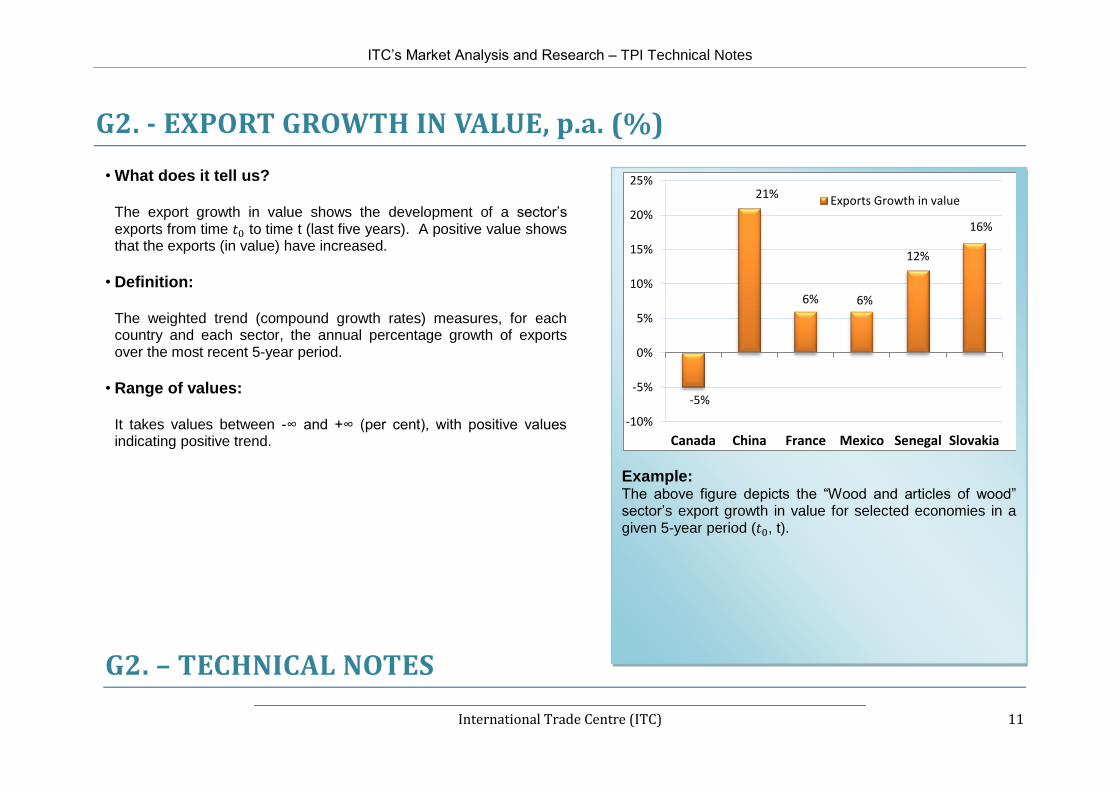
G2. - EXPORT GROWTH IN VALUE, p.a. (%)
• What does it tell us?
The export growth in value shows the development of a sector‟s exports from time to time t (last five years). A positive value shows that the exports (in value) have increased.
• Definition:
The weighted trend (compound growth rates) measures, for each country and each sector, the annual percentage growth of exports over the most recent 5-year period.
• Range of values:
It takes values between -∞ and +∞ (per cent), with positive values indicating positive trend.
G2. – TECHNICAL NOTES
Example: The above figure depicts the “Wood and articles of wood” sector‟s export growth in value for selected economies in a given 5-year period ( , t).
-5%
21%
6% 6%
12%
16%
-10%
-5%
0%
5%
10%
15%
20%
25%
Canada China France Mexico Senegal Slovakia
Exports Growth in value
ITC‟s Market Analysis and Research – TPI Technical Notes
International Trade Centre (ITC) 12
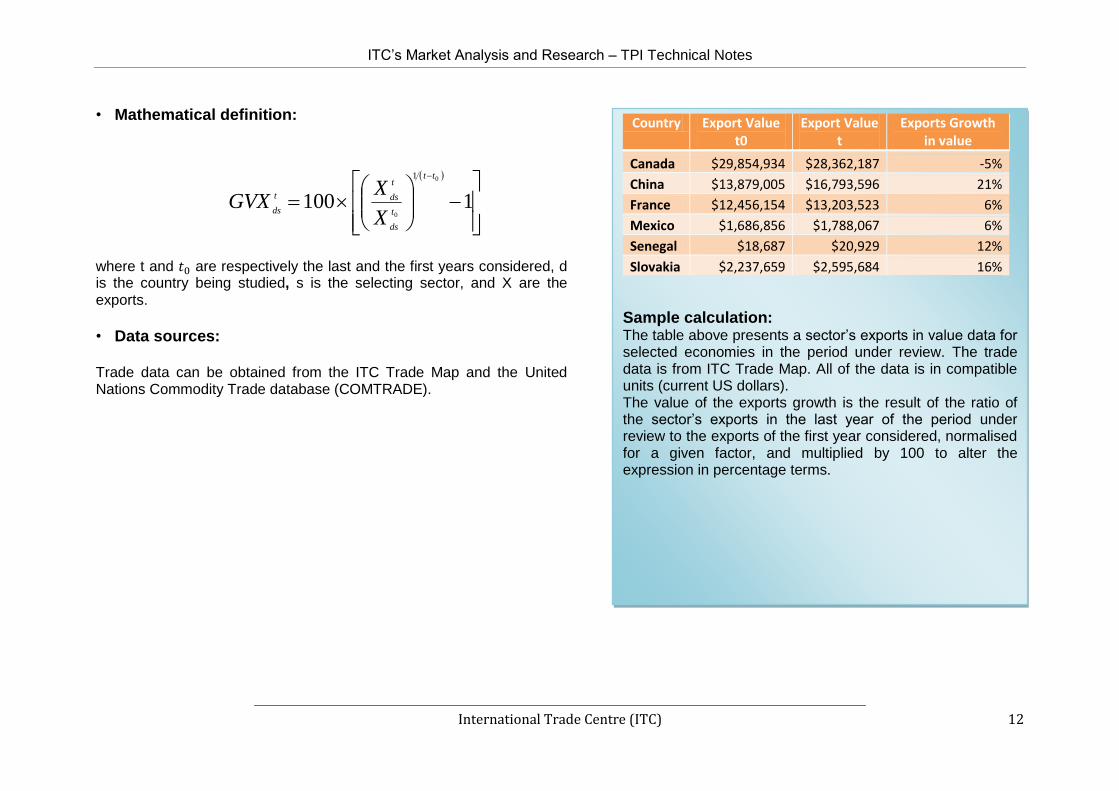
• Mathematical definition:
1100
0
0
1 tt
t
ds
t
dst
ds
X
XGVX
where t and are respectively the last and the first years considered, d is the country being studied, s is the selecting sector, and X are the exports.
• Data sources:
Trade data can be obtained from the ITC Trade Map and the United Nations Commodity Trade database (COMTRADE).
Country Export Value t0
Export Value t
Exports Growth in value
Canada $29,854,934 $28,362,187 -5%
China $13,879,005 $16,793,596 21%
France $12,456,154 $13,203,523 6%
Mexico $1,686,856 $1,788,067 6%
Senegal $18,687 $20,929 12%
Slovakia $2,237,659 $2,595,684 16%
Sample calculation: The table above presents a sector‟s exports in value data for selected economies in the period under review. The trade data is from ITC Trade Map. All of the data is in compatible units (current US dollars). The value of the exports growth is the result of the ratio of the sector‟s exports in the last year of the period under review to the exports of the first year considered, normalised for a given factor, and multiplied by 100 to alter the expression in percentage terms.

ITC‟s Market Analysis and Research – TPI Technical Notes
International Trade Centre (ITC) 13
G3. - SHARE IN NATIONAL EXPORTS (%)
• What does it tell us?
This indicator refers to the share of a sector‟s exports in relation to total country exports; hence it shows the importance of the sector under review in national exports.
• Definition:
The percentage ratio between total sector‟s exports to total country‟s exports.
• Range of values:
Takes value between 0 and 100 per cent, with higher values indicating greater importance of the sector under review in the selected country‟s export portfolio.
Example: The above figure depicts the “Wood and articles of wood” sector„s share in national exports for selected economies in the chosen year (t).
1.18%
2.50%
1.92%
0.09% 0.03% 0.00%
0.50%
1.00%
1.50%
2.00%
2.50%
3.00%
China RussianFed.
Italy Nigeria Venezuela
SHARE IN NATIONAL EXPORTS
ITC‟s Market Analysis and Research – TPI Technical Notes
International Trade Centre (ITC) 14
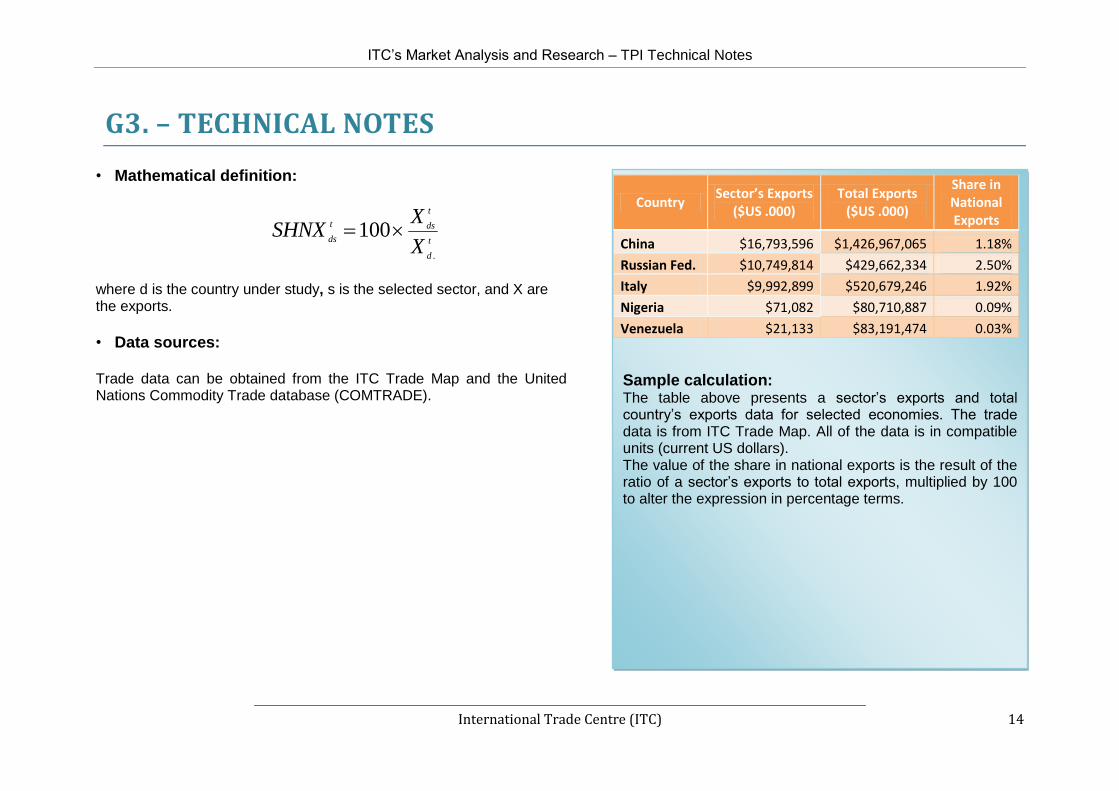
G3. – TECHNICAL NOTES
• Mathematical definition:
t
d
t
dst
ds
X
XSHNX
.
100
where d is the country under study, s is the selected sector, and X are the exports.
• Data sources:
Trade data can be obtained from the ITC Trade Map and the United Nations Commodity Trade database (COMTRADE).
Country Sector’s Exports
($US .000) Total Exports
($US .000)
Share in National Exports
China $16,793,596 $1,426,967,065 1.18%
Russian Fed. $10,749,814 $429,662,334 2.50%
Italy $9,992,899 $520,679,246 1.92%
Nigeria $71,082 $80,710,887 0.09%
Venezuela $21,133 $83,191,474 0.03%
Sample calculation: The table above presents a sector‟s exports and total country‟s exports data for selected economies. The trade data is from ITC Trade Map. All of the data is in compatible units (current US dollars). The value of the share in national exports is the result of the ratio of a sector‟s exports to total exports, multiplied by 100 to alter the expression in percentage terms.

ITC‟s Market Analysis and Research – TPI Technical Notes
International Trade Centre (ITC) 15
G4. - SHARE IN NATIONAL IMPORTS (%)
• What does it tell us?
This index indicates the share of a sector‟s imports in relation to total country imports; hence it shows the importance of this sector in national imports.
• Definition:
The percentage ratio between total sector‟s imports to total country‟s imports.
• Range of values:
Takes value between 0 and 100 per cent, with higher values indicating greater importance of the sector under review on the selected country‟s trade balance.
Example: The above figure depicts the “Wood and articles of wood”
sector„s share in national imports for selected economies in the chosen year (t).
0%
1%
2%
3%
4%
5%
Poland RussianFed.
Italy Nigeria Angola Estonia
Share in National Imports

ITC‟s Market Analysis and Research – TPI Technical Notes
International Trade Centre (ITC) 16
G4. – TECHNICAL NOTES
• Mathematical definition:
t
d
t
dst
ds
M
MSHNM
.
100
where d is the country under study, s is the selected sector, and M are the imports.
• Data sources:
Trade data can be obtained from the ITC Trade Map and the United Nations Commodity Trade database (COMTRADE).
Country Imports ($US .000)
Total Imports ($US .000)
Share in National Imports
Poland $6,314,355 $210,478,512 3%
Russian Fed. $5,341,025 $267,051,248 2%
Italy $16,618,865 $553,962,176 3%
Nigeria $563,872 $28,193,596 2%
Angola $202,969 $20,296,878 1%
Estonia $693,324 $17,333,096 4%
Sample calculation: The table above presents sector‟s imports and total country‟s imports data for selected economies. The trade data is from ITC Trade Map. All of the data is in compatible units (current US dollars). The value of the share in national imports is the result of the ratio of sector‟s imports to total imports, multiplied by 100 to alter the expression in percentage terms.

ITC‟s Market Analysis and Research – TPI Technical Notes
International Trade Centre (ITC) 17
G5. - RELATIVE TRADE BALANCE (%)
• What does it tell us?
A first advantage is that the indicator eliminates re-exports that can introduce
a strong bias for some countries. A second advantage is that the indicator
takes into account the globalisation of the production processes: since
exported goods incorporate to a large extent imported intermediate
products that are often from the same sector (e.g. electronic parts and
assembled computers), net exports introduce a simple corrective measure
for dealing with the specialisation of countries on various production stages.
It shows whether a country is a net exporter (where national production outweighs national consumption) or a net importer (where consumption outweighs production).
• Definition:
It is the ratio between the trade balance (exports minus imports) and
the total trade (exports plus imports). This reduces bias against large
industries, which tend to have either high deficits or surpluses.
• Range of values:
It takes values between -100 and +100 (per cent), with positive values indicating that the country is a net exporter, whereas negative values indicate that the country is a net importer.
Example: The above figure depicts the “Wood and articles of wood”
sector„s relative trade balance for selected economies in the current period .
-3%
16%
35% 13%
-23%
-32%
-40% -20% 0% 20% 40%
Poland
Russian Fed.
Italy
Estonia
Mexico
Kazakhstan
Relative trade balance (%)
Relative trade balance

ITC‟s Market Analysis and Research – TPI Technical Notes
International Trade Centre (ITC) 18
G5. – TECHNICAL NOTES
• Mathematical definition:
t
ds
t
di
t
ds
t
dst
ds
MX
MXRTB
100
where t is the current year, d is the country under study, s is the selected sector, X are the exports, and M are the imports.
• Data sources:
Trade data can be obtained from the ITC Trade Map and the United Nations Commodity Trade database (COMTRADE).
Country Export value
in period t
Import value
in period t
Relative trade balance
Poland $1,722,868 $1,843,469 -3%
Russian Fed. $6,794,671 $4,959,614 16%
Italy $2,827,102 $1,356,322 35%
Estonia $657,083 501,590$ 13%
Mexico $677,213 $1,083,541 -23%
Kazakhstan $228,561 $441,122 -32%
Sample calculation: The value of the relative trade balance is the result of the ratio of the difference of a sector‟s net exports between the years in exam, to the balance value of the first year considered, multiplying the whole by 100 to put the expression in percentage terms.
ITC‟s Market Analysis and Research – TPI Technical Notes
International Trade Centre (ITC) 19
G6. - RELATIVE UNIT VALUE (world average = 1)
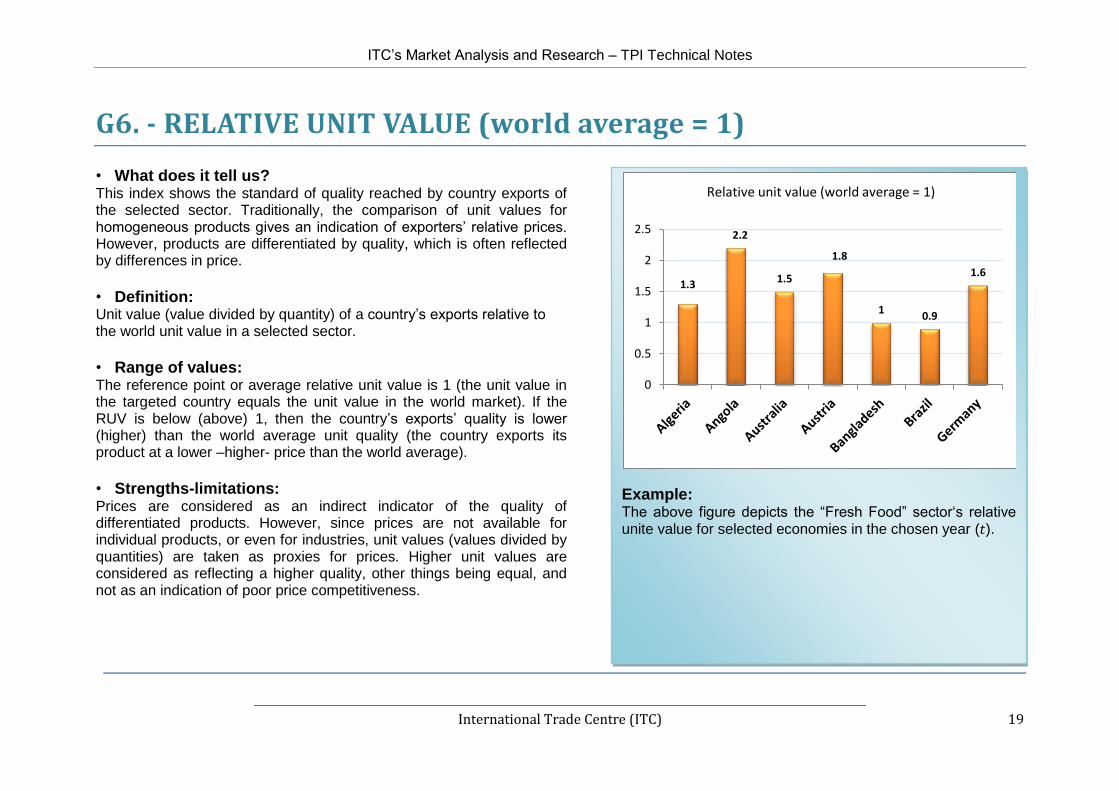
• What does it tell us? This index shows the standard of quality reached by country exports of the selected sector. Traditionally, the comparison of unit values for homogeneous products gives an indication of exporters‟ relative prices. However, products are differentiated by quality, which is often reflected by differences in price.
• Definition: Unit value (value divided by quantity) of a country‟s exports relative to the world unit value in a selected sector.
• Range of values: The reference point or average relative unit value is 1 (the unit value in the targeted country equals the unit value in the world market). If the RUV is below (above) 1, then the country‟s exports‟ quality is lower (higher) than the world average unit quality (the country exports its product at a lower –higher- price than the world average).
• Strengths-limitations: Prices are considered as an indirect indicator of the quality of differentiated products. However, since prices are not available for individual products, or even for industries, unit values (values divided by quantities) are taken as proxies for prices. Higher unit values are considered as reflecting a higher quality, other things being equal, and not as an indication of poor price competitiveness.
Example: The above figure depicts the “Fresh Food” sector„s relative unite value for selected economies in the chosen year ( ).
1.3
2.2
1.5
1.8
1 0.9
1.6
0
0.5
1
1.5
2
2.5
Relative unit value (world average = 1)

ITC‟s Market Analysis and Research – TPI Technical Notes
International Trade Centre (ITC) 20
G6. – TECHNICAL NOTES
• Mathematical definition:
∑
Where
⁄ and is a sample of HS-6 positions related to
the sector (s) after removing the outliers (HS-6 in terms of unit value, five-year trend).
• Data sources:
Trade data can be obtained from the ITC Trade Map and the United Nations Commodity Trade database (COMTRADE).
Country Relative unit value (world average = 1)
Algeria 1.3
Angola 2.2
Australia 1.5
Austria 1.8
Bangladesh 1
Brazil 0.9
Germany 1.6
Sample calculation: The table above presents relative unite value‟s data for selected economies in the chosen year (t).

ITC‟s Market Analysis and Research – TPI Technical Notes
International Trade Centre (ITC) 21
P1. - VALUE OF NET EXPORTS
• What does it tell us?
The value of net export is the balance of trade for a specific sector. A country's net export is a reliable indicator of its position on the world market. A positive value shows that the country exports more than it imports (it has a surplus). Instead, a deficit occurs when a country imports more than it exports.
• Definition:
The algebraic sum of exports less imports.
• Range of values:
Takes values between -∞ and +∞.
• Strengths-limitations
Net exports eliminate re-exports, which would otherwise introduce a bias into the raw data. Secondly, the index takes into account the international division of production processes, since a large part of imported intermediate products found within exports usually belong to the same sector (e.g. electronic parts and assembled computers). Hence, net exports provide a very simple but reliable correction for dealing with the globalisation of production processes and the induced vertical specialisation of countries at various stages of production.
Example: The above figure depicts the value of net exports in the textile sector for selected economies for the chosen year (t). Substantial surplus is observed in China.
$6,957
-$1,240
-$2,639
$49,078
-$1,459
-$20,000 $0 $20,000 $40,000 $60,000
Italy
Nigeria
Russian Fed.
China
Venezuela
Millions
ITC‟s Market Analysis and Research – TPI Technical Notes
International Trade Centre (ITC) 22
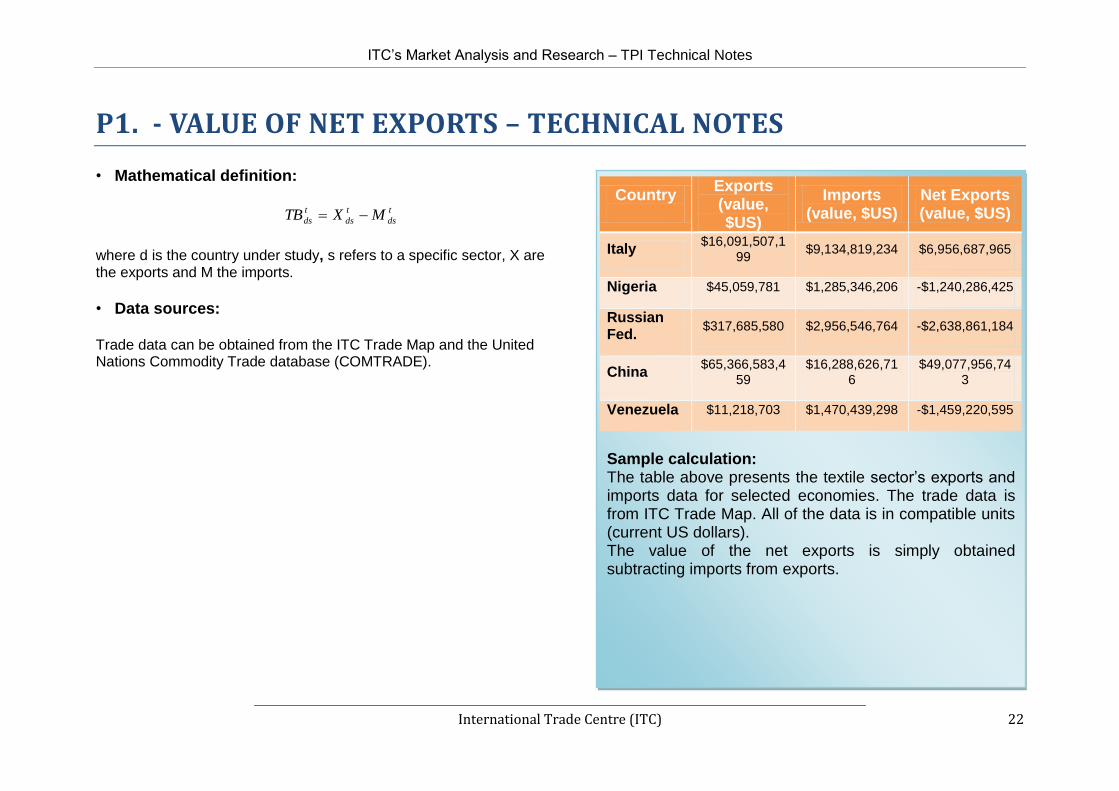
P1. - VALUE OF NET EXPORTS – TECHNICAL NOTES
• Mathematical definition:
t
ds
t
ds
t
ds MXTB
where d is the country under study, s refers to a specific sector, X are the exports and M the imports.
• Data sources:
Trade data can be obtained from the ITC Trade Map and the United Nations Commodity Trade database (COMTRADE).
Country
Exports (value, $US)
Imports (value, $US)
Net Exports (value, $US)
Italy $16,091,507,1
99 $9,134,819,234 $6,956,687,965
Nigeria $45,059,781 $1,285,346,206 -$1,240,286,425
Russian Fed.
$317,685,580 $2,956,546,764 -$2,638,861,184
China $65,366,583,4
59 $16,288,626,71
6 $49,077,956,74
3
Venezuela $11,218,703 $1,470,439,298 -$1,459,220,595
Sample calculation: The table above presents the textile sector‟s exports and imports data for selected economies. The trade data is from ITC Trade Map. All of the data is in compatible units (current US dollars). The value of the net exports is simply obtained subtracting imports from exports.

ITC‟s Market Analysis and Research – TPI Technical Notes
International Trade Centre (ITC) 23
P2. - PER CAPITA EXPORT
• What does it tell us?
The value of per capita exports indicates the level of outward looking of a country and the extent to which a country‟s population produces for the world market.
• Definition:
The ratio of exports to inhabitants.
• Range of values:
Takes values between 0 and +∞.
• Strengths-limitations:
This indicator, being an average, does not consider the distribution effect on population.
Example: The above figure depicts the value of per capita export in the textile sector for selected economies for the chosen year (t).
$12.70
$167.00
$0.50
$75.80
$0.80
$0.00
$40.00
$80.00
$120.00
$160.00
$200.00
China Italy Nigeria Russian Fed. Venezuela
Per Capita Exports
ITC‟s Market Analysis and Research – TPI Technical Notes
International Trade Centre (ITC) 24
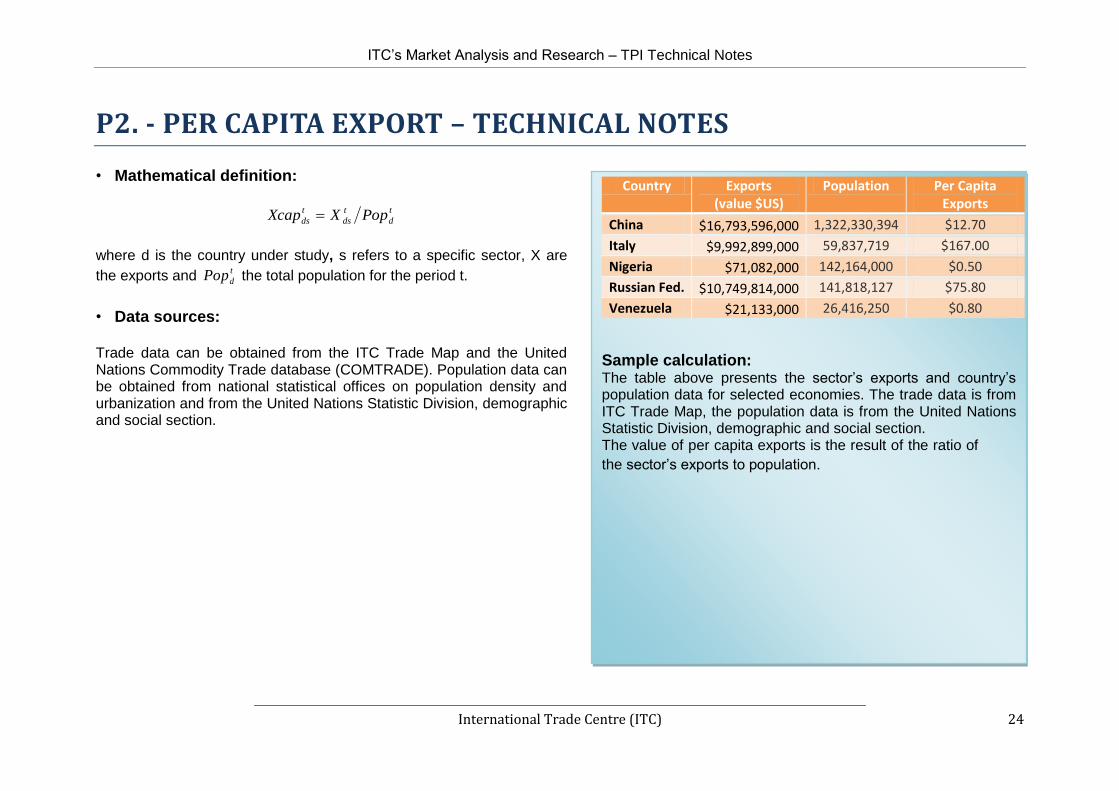
P2. - PER CAPITA EXPORT – TECHNICAL NOTES
• Mathematical definition:
t
d
t
ds
t
ds PopXXcap
where d is the country under study, s refers to a specific sector, X are
the exports and t
dPop the total population for the period t.
• Data sources:
Trade data can be obtained from the ITC Trade Map and the United Nations Commodity Trade database (COMTRADE). Population data can be obtained from national statistical offices on population density and urbanization and from the United Nations Statistic Division, demographic and social section.
Country Exports (value $US)
Population Per Capita Exports
China $16,793,596,000 1,322,330,394 $12.70
Italy $9,992,899,000 59,837,719 $167.00
Nigeria $71,082,000 142,164,000 $0.50
Russian Fed. $10,749,814,000 141,818,127 $75.80
Venezuela $21,133,000 26,416,250 $0.80
Sample calculation: The table above presents the sector‟s exports and country‟s population data for selected economies. The trade data is from ITC Trade Map, the population data is from the United Nations Statistic Division, demographic and social section. The value of per capita exports is the result of the ratio of
the sector‟s exports to population.
ITC‟s Market Analysis and Research – TPI Technical Notes
International Trade Centre (ITC) 25
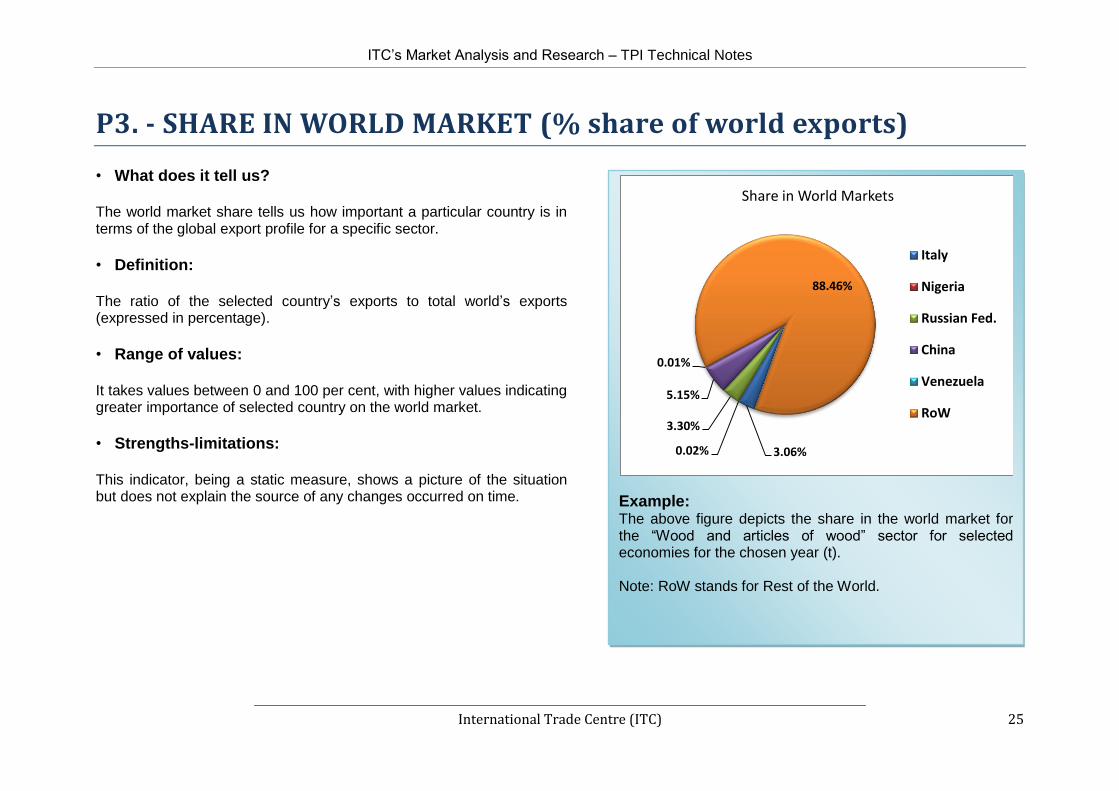
P3. - SHARE IN WORLD MARKET (% share of world exports)
• What does it tell us?
The world market share tells us how important a particular country is in terms of the global export profile for a specific sector.
• Definition:
The ratio of the selected country‟s exports to total world‟s exports (expressed in percentage).
• Range of values:
It takes values between 0 and 100 per cent, with higher values indicating greater importance of selected country on the world market.
• Strengths-limitations:
This indicator, being a static measure, shows a picture of the situation but does not explain the source of any changes occurred on time.
Example: The above figure depicts the share in the world market for the “Wood and articles of wood” sector for selected economies for the chosen year (t). Note: RoW stands for Rest of the World.
3.06% 0.02%
3.30%
5.15%
0.01%
88.46%
Share in World Markets
Italy
Nigeria
Russian Fed.
China
Venezuela
RoW
ITC‟s Market Analysis and Research – TPI Technical Notes
International Trade Centre (ITC) 26
P3. - SHARE IN WORLD MARKET - TECHNICAL NOTES
• Mathematical definition:
100t
ws
t
dst
dsX
XSHWX
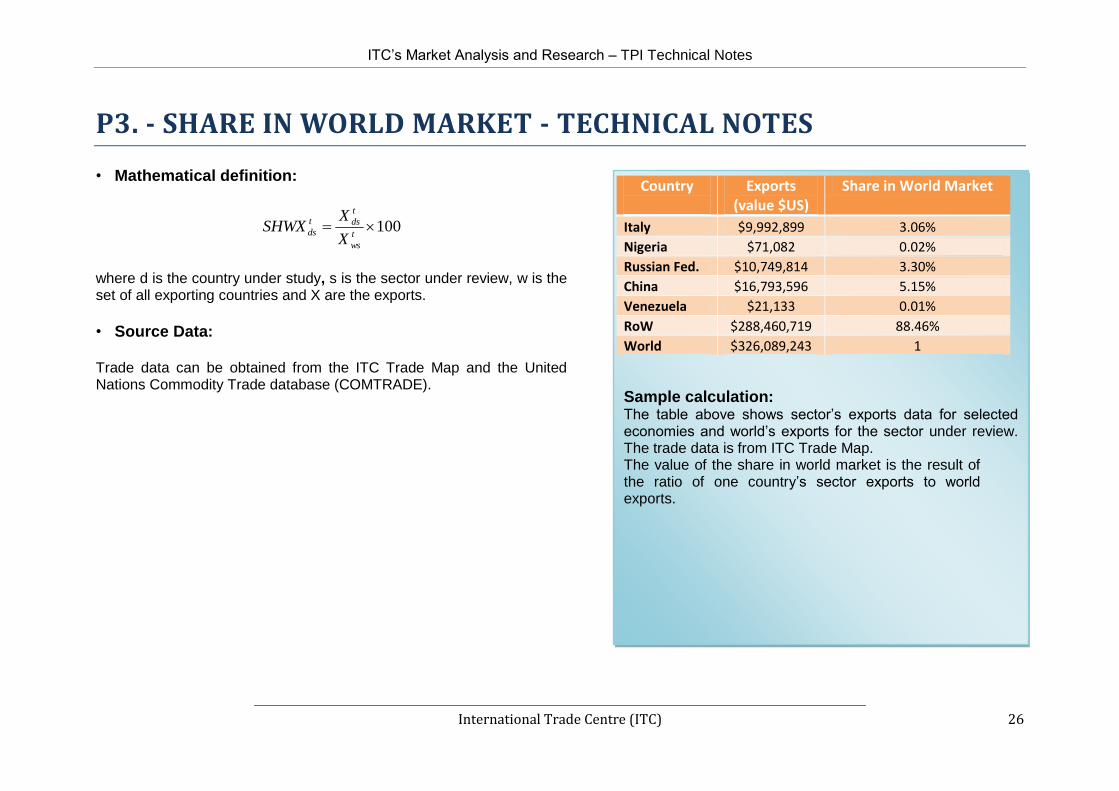
where d is the country under study, s is the sector under review, w is the set of all exporting countries and X are the exports.
• Source Data:
Trade data can be obtained from the ITC Trade Map and the United Nations Commodity Trade database (COMTRADE).
Country
Exports (value $US)
Share in World Market
Italy $9,992,899 3.06%
Nigeria $71,082 0.02%
Russian Fed. $10,749,814 3.30%
China $16,793,596 5.15%
Venezuela $21,133 0.01%
RoW $288,460,719 88.46%
World $326,089,243 1
Sample calculation: The table above shows sector‟s exports data for selected economies and world‟s exports for the sector under review. The trade data is from ITC Trade Map. The value of the share in world market is the result of the ratio of one country‟s sector exports to world exports.
ITC‟s Market Analysis and Research – TPI Technical Notes
International Trade Centre (ITC) 27
P4.a - PRODUCT DIVERSIFICATION (N° of equivalent products)
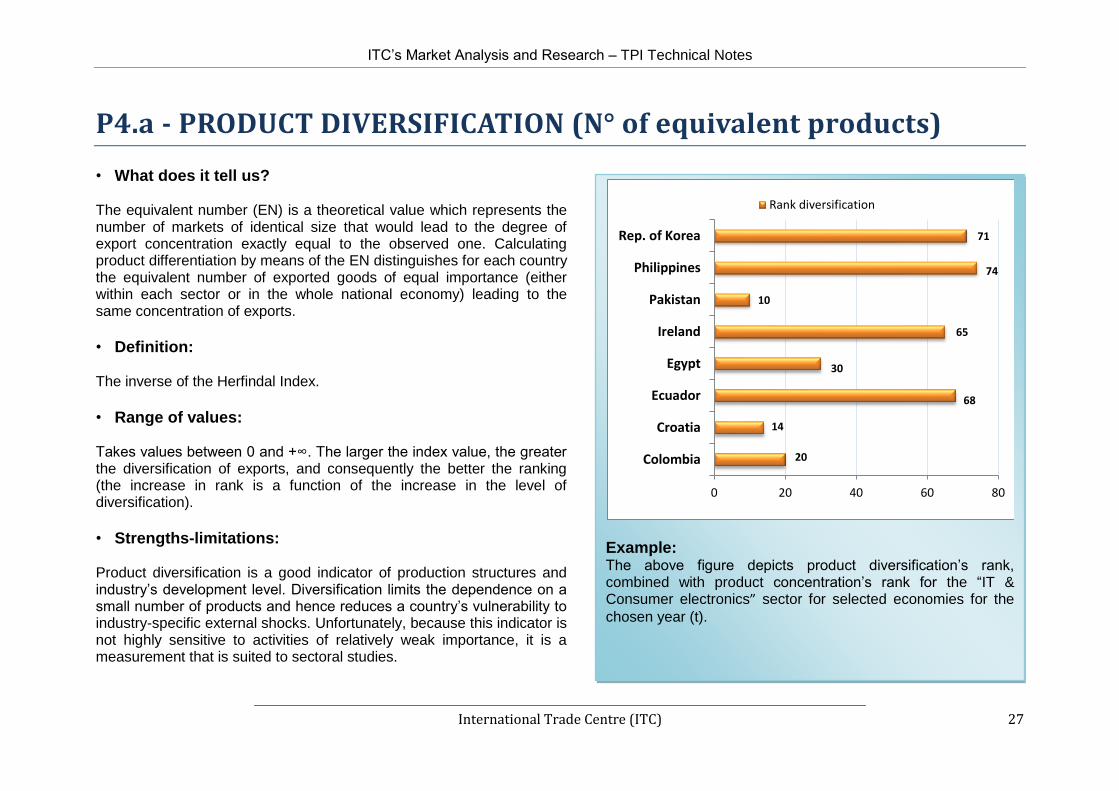
• What does it tell us? The equivalent number (EN) is a theoretical value which represents the number of markets of identical size that would lead to the degree of export concentration exactly equal to the observed one. Calculating product differentiation by means of the EN distinguishes for each country the equivalent number of exported goods of equal importance (either within each sector or in the whole national economy) leading to the same concentration of exports.
• Definition: The inverse of the Herfindal Index.
• Range of values: Takes values between 0 and +∞. The larger the index value, the greater the diversification of exports, and consequently the better the ranking (the increase in rank is a function of the increase in the level of diversification).
• Strengths-limitations: Product diversification is a good indicator of production structures and industry‟s development level. Diversification limits the dependence on a small number of products and hence reduces a country‟s vulnerability to industry-specific external shocks. Unfortunately, because this indicator is not highly sensitive to activities of relatively weak importance, it is a measurement that is suited to sectoral studies.
Example: The above figure depicts product diversification‟s rank, combined with product concentration‟s rank for the “IT & Consumer electronics” sector for selected economies for the
chosen year (t).
20
14
68
30
65
10
74
71
0 20 40 60 80
Colombia
Croatia
Ecuador
Egypt
Ireland
Pakistan
Philippines
Rep. of Korea
Rank diversification

ITC‟s Market Analysis and Research – TPI Technical Notes
International Trade Centre (ITC) 28
P4.a - PRODUCT DIVERSIFICATION – TECHNICAL NOTES
• Mathematical definition:
t
ds
t
ds HIPNDPX 1
where HIP is the Herfindal Index that it is calculated as follows:
snp
p t
ds
t
sdpt
dsX
XHIP
1
2
,
with
t
sdpX , the export of product p by country d for a given year t;
t
dsX country d exports of all products belonging to the sector s;
t
ds
t
dp
X
Xthe share of product p in total exports of country d in sector s.
• Data sources:
Trade data can be obtained from the ITC Trade Map and the United Nations Commodity Trade database (COMTRADE).
Country Product diversification (N.E.)
Rank diversification
Colombia 11 20
Croatia 11 14
Ecuador 5 68
Egypt 9 30
Ireland 5 65
Pakistan 2 10
Philippines 4 74
Rep. of Korea 5 71
Sample calculation: The table above shows product‟s diversification and concentration data/rank for selected economies in the chosen year.
ITC‟s Market Analysis and Research – TPI Technical Notes
International Trade Centre (ITC) 29
P4.b - PRODUCT CONCENTRATION (Spread)
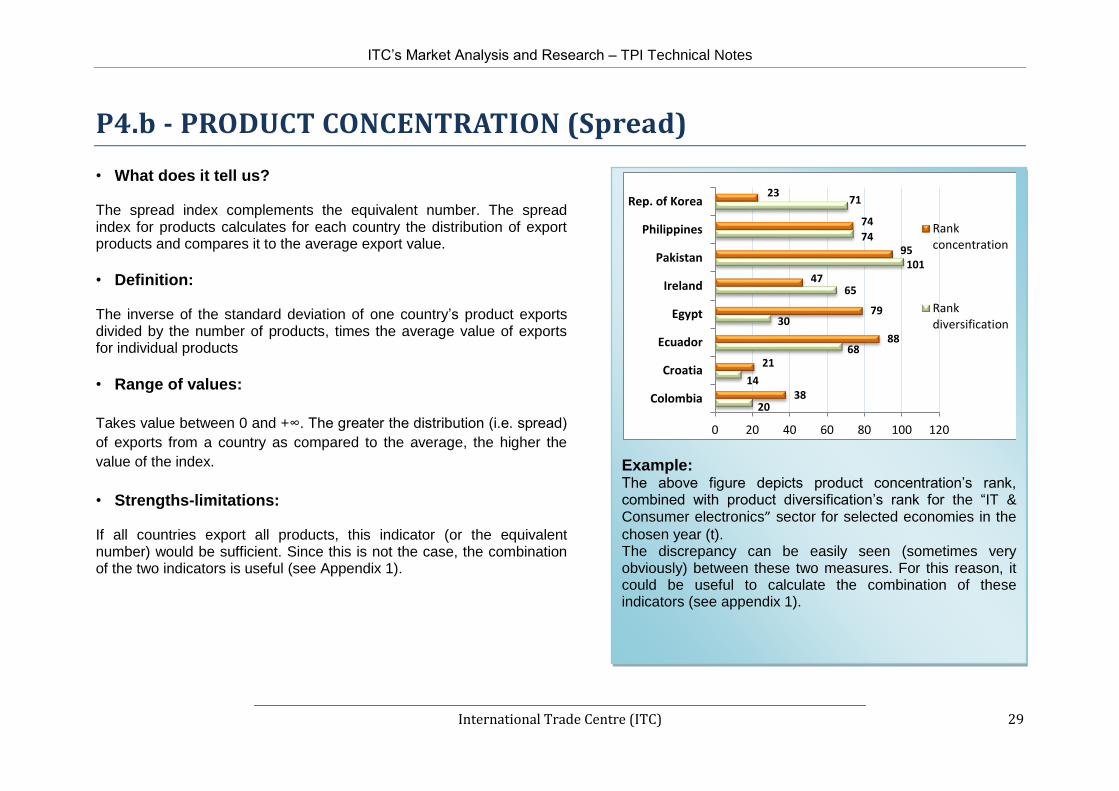
• What does it tell us? The spread index complements the equivalent number. The spread index for products calculates for each country the distribution of export products and compares it to the average export value.
• Definition: The inverse of the standard deviation of one country‟s product exports divided by the number of products, times the average value of exports for individual products
• Range of values:
Takes value between 0 and +∞. The greater the distribution (i.e. spread)
of exports from a country as compared to the average, the higher the
value of the index.
• Strengths-limitations: If all countries export all products, this indicator (or the equivalent number) would be sufficient. Since this is not the case, the combination of the two indicators is useful (see Appendix 1).
Example: The above figure depicts product concentration‟s rank, combined with product diversification‟s rank for the “IT & Consumer electronics” sector for selected economies in the
chosen year (t). The discrepancy can be easily seen (sometimes very obviously) between these two measures. For this reason, it could be useful to calculate the combination of these indicators (see appendix 1).
20
14
68
30
65
101
74
71
38
21
88
79
47
95
74
23
0 20 40 60 80 100 120
Colombia
Croatia
Ecuador
Egypt
Ireland
Pakistan
Philippines
Rep. of Korea
Rankconcentration
Rankdiversification

ITC‟s Market Analysis and Research – TPI Technical Notes
International Trade Centre (ITC) 30
P4.b PRODUCT CONCENTRATION – TECHNICAL NOTES
• Mathematical definition:
t
ds
Nps
p
t
dst
sdpt
ds
XNps
XXSDPX
1
2
,
1
With:
t
sdpX , country d exports of product p to the markets in a given
year;
t
dsX the average value of country d exports for the p products
belonging to the sector s;
t
dst
sdp XX , the deviation to the average of product p in the
sector s for country d;
nps
p
t
dst
sdp XX1
2
, the standard deviation;
t
dsSDPX the weighted spread and Nps the number of product
lines within the sector s.
• Data sources:
Trade data can be obtained from the ITC Trade Map and the United Nations Commodity Trade database (COMTRADE).
Country Rank concentration Rank diversification
Colombia 38
20
Croatia 21
14
Ecuador 88
68
Egypt 79
30
Ireland 47
65
Pakistan 95
10
Philippines 74
74
Rep. of Korea 23
71
Sample calculation: The table above shows market‟s concentration and diversification ranks for the “IT & Consumer electronics” sector for selected economies in the chosen year (t).

ITC‟s Market Analysis and Research – TPI Technical Notes
International Trade Centre (ITC) 31
P5.a - MARKET DIVERSIFICATION (N° of equivalent markets)
• What does it tell us?
The equivalent number shows the degree of market diversification: diversifying partner countries reduces a country‟s dependence on a small number of export markets and hence the vulnerability to shocks within destination countries.
• Definition:
The inverse of the Herfindal Index.
• Range of values:
Takes values between 0 and +∞. The bigger the index value, the greater the diversification of markets, and consequently, the better the ranking (the increase in rank is a function of the increase in the level of diversification of markets).
Example: The above figure depicts market diversification‟s rank for the “Processed food” sector for selected economies in the chosen
year (t).
0 25 50 75 100 125 150
Ethiopia
India
Latvia
Morocco
Singapore
Spain
Turkey
Rank diversification

ITC‟s Market Analysis and Research – TPI Technical Notes
International Trade Centre (ITC) 32
P5.a - MARKET DIVERSIFICATION – TECHNICAL NOTES
• Mathematical definition:
t
ds
t
ds HIMNDMX 1
where HIM is the Herfindal Index that it is calculated as follows:
snm
m t
ds
t
sdmt
dsX
XHIM
1
2
,
with
t
sdmX , the export of all products belonging to the sector s by country
d to the market m, for a given year t;
t
dsX country d exports of all products belonging to the sector s;
t
ds
t
sdm
X
X ,the share of market m in total exports of country d in sector s.
• Data sources:
Trade data can be obtained from the ITC Trade Map and the United Nations Commodity Trade database (COMTRADE).
Country Market diversification (N.E.) Rank diversification
Ethiopia 3 122
India 24 3
Latvia 6 90
Morocco 8 61
Singapore 15 15
Spain 10 40
Turkey 18 6
Sample calculation: The table above shows market‟s diversification data and rank for the “Processed food” sector for selected economies in the chosen year (t).

ITC‟s Market Analysis and Research – TPI Technical Notes
International Trade Centre (ITC) 33
P5.b - MARKET CONCENRATION (Spread)
• What does it tell us? The spread index for markets compares for each country, the share of its exports directed to different partner countries with the average export value.
• Definition: The inverse of the standard deviation of one country‟s market exports divided by the number of markets, times the average value of exports for individual markets.
• Range of values: Takes value between 0 and +∞ and the greater the dispersion of exports from a country (i.e. the greater the spread) as compared to the average, the higher the value of the index. Concerning positions, the ranking of the 180 countries is a function of the degree of diffusion of exported products (of a country‟s exports to partner countries). The smaller the index, the more exported products are evenly distributed (amongst partner countries) and the better the ranking.
Example: The above figure depicts market concentration‟s rank, combined with market diversification‟s rank for the “Processed Food” sector for selected economies in the
chosen year (t). The discrepancy can be easily seen (sometimes very obviously) between these two measures. For this reason, it could be useful to calculate the combination of these indicators (see appendix 1).
122
3
90
61
15
40
6
107
2
58
59
25
38
10
0 25 50 75 100 125
Ethiopia
India
Latvia
Morocco
Singapore
Spain
Turkey Rank concentration
Rank diversification

ITC‟s Market Analysis and Research – TPI Technical Notes
International Trade Centre (ITC) 34
P5.b - MARKET CONCENRATION – TECHNICAL NOTES
• Mathematical definition:
t
dss
nm
m
t
dst
sdmt
ds
Xnm
XXSDMX
s
1
2
,
1
With:
t
sdmX , country d exports of all products belonging to the sector s
to the market m in a given year;
t
dsX the average value of country d exports for the m markets
belonging to the sector s;
t
dst
smp XX , the deviation to the average of market m in the
sector s for country d;
snm
m
t
dst
sdm XX1
2
, the standard deviation;
t
dsSDMX the weighted spread and Nms the number of markets
destinations within the sector s.
• Data sources:
Trade data can be obtained from the ITC Trade Map and the United Nations Commodity Trade database (COMTRADE).
Country Rank concentration Rank diversification
Ethiopia 107 122
India 2 3
Latvia 58 90
Morocco 59 61
Singapore 25 15
Spain 38 40
Turkey 10 6
Sample calculation: The table above shows market‟s concentration and diversification ranks for the “Processed food” sector for selected economies in the chosen year (t).

ITC‟s Market Analysis and Research – TPI Technical Notes
International Trade Centre (ITC) 35
C1. - RELATIVE CHANGE OF WORLD MARKET SHARE
• What does it tell us?
This index shows the percentage change of a country‟s exports in the world market for the selected sector between time 0 and time t. It is a reliable indicator of change in global performance for the sector under review. If it is positive, country i has increased its world market share.
• Definition:
Percentage variation in the world market share for a specific sector‟s exports between time 0 and time t (in this case five years).
• Range of values:
It takes values between -∞ and +∞ (per cent), with positive values indicating increasing importance of the selected country sector on the world market.
• Strengths-limitations: The change in a country‟s world market share can be decomposed and expressed as the sum of the following effects: (a) competitiveness effect; structural effect, which in turn can be decomposed into (b) initial geographic specialisation and (c) initial product specialisation; and (d) adaptation effect.
Example: The above figure depicts relative change of world market share for the “Mineral” sector for selected economies in the
chosen year (t).
-0.01%
0.58%
0.15%
-0.04% -0.06%
0.06% 0.05%
-0.10%
0.00%
0.10%
0.20%
0.30%
0.40%
0.50%
0.60%
0.70%
Relative change of worldmarket share

ITC‟s Market Analysis and Research – TPI Technical Notes
International Trade Centre (ITC) 36
C1. - TECHNICAL NOTES
• Mathematical definition:
jt
ws
t
js
t
js
t
ds
t
ws
t
js
t
js
t
ds
t
ws
t
ds
t
ws
t
ds
X
X
X
X
X
X
X
X
X
X
X
X
0
0
0
0
0
0
where t is the current year, t0 is the first year considered, d is the country under study, s is the selected sector, j is the set of import
markets and X are the exports (t
wsX are world exports for sector s).
t
js
t
ds
X
Xis the country‟s market share on import markets for t;
t
ws
t
js
X
Xis the share of import markets in world imports in t;
0
0
t
js
t
ds
X
Xis the country‟s initial market share in import markets;
0
0
t
ws
t
js
X
Xis the initial share of import markets in world imports.
• Data sources:
Trade data can be obtained from the ITC Trade Map and the United Nations Commodity Trade database (COMTRADE).
Country Relative change of world market share
Greece -0.01%
Liberia 0.58%
Mongolia 0.15%
Netherlands -0.04%
Paraguay -0.06%
Qatar 0.06%
Sudan 0.05%
Sample calculation: The table above shows relative change of world market share‟s data for the “Mineral” sector for selected economies in the chosen year (t).
ITC‟s Market Analysis and Research – TPI Technical Notes
International Trade Centre (ITC) 37
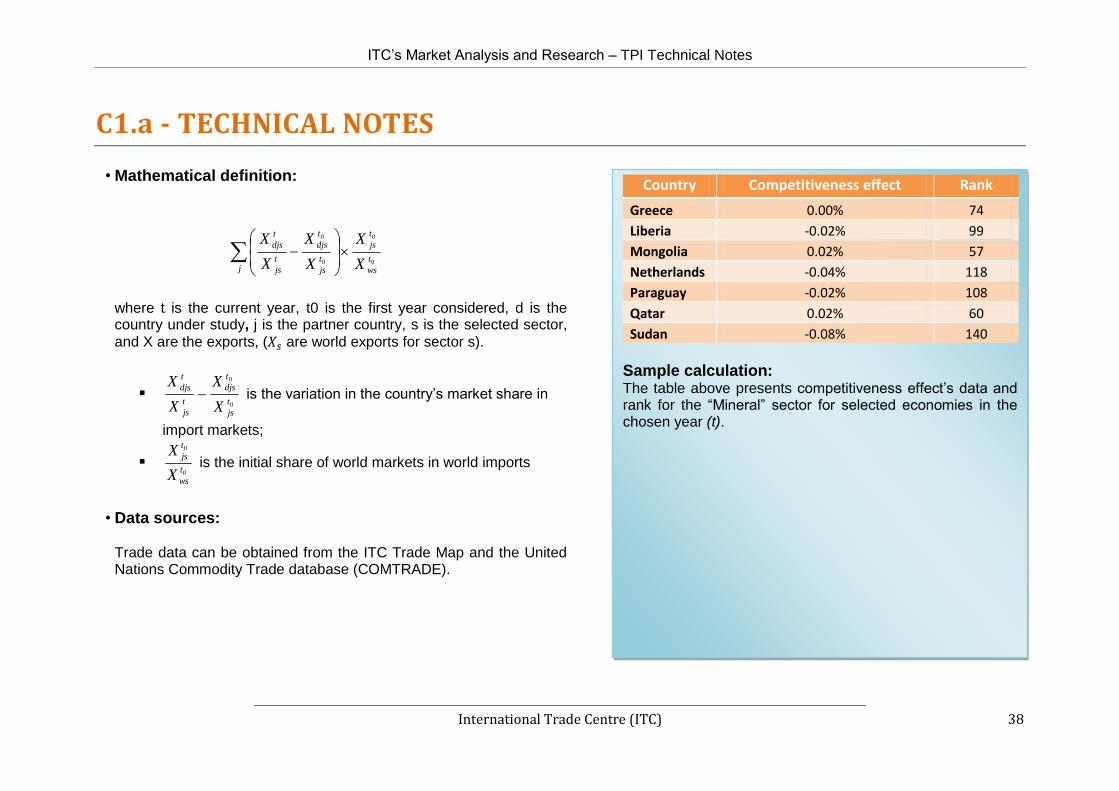
C1.a - COMPETITIVENESS EFFECT, p.a. (%)
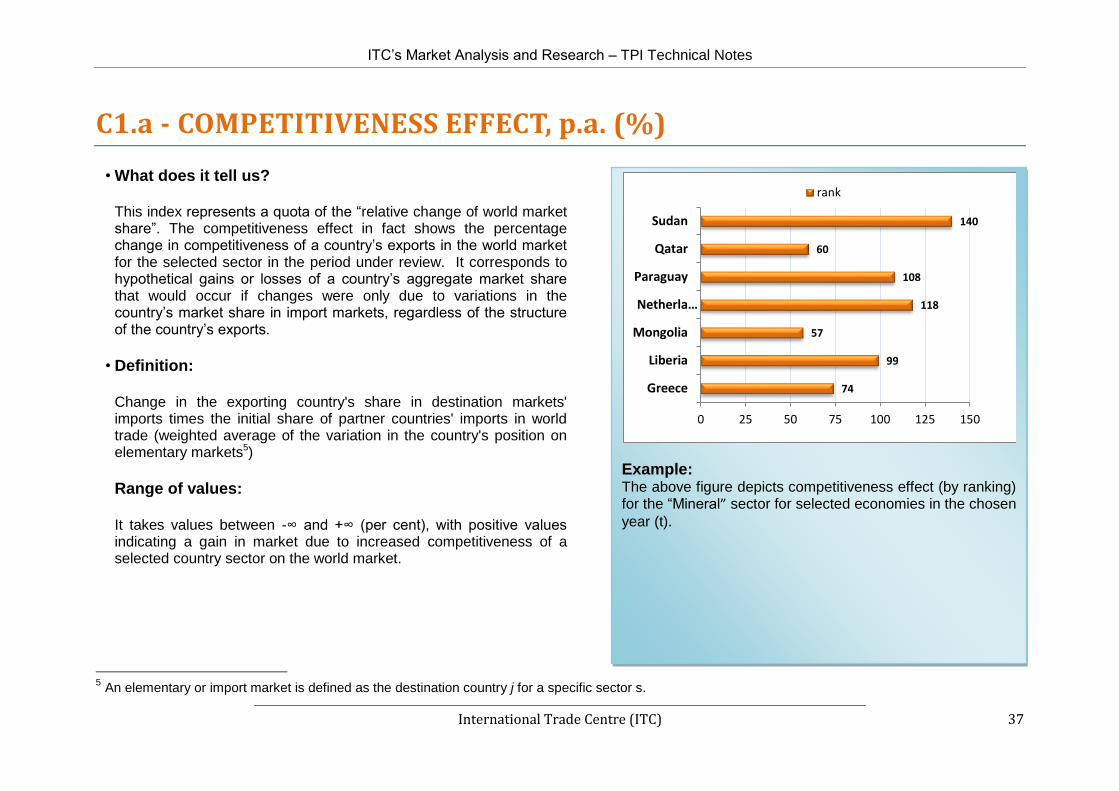
• What does it tell us? This index represents a quota of the “relative change of world market share”. The competitiveness effect in fact shows the percentage change in competitiveness of a country‟s exports in the world market for the selected sector in the period under review. It corresponds to hypothetical gains or losses of a country‟s aggregate market share that would occur if changes were only due to variations in the country‟s market share in import markets, regardless of the structure of the country‟s exports.
• Definition:
Change in the exporting country's share in destination markets' imports times the initial share of partner countries' imports in world trade (weighted average of the variation in the country's position on elementary markets5)
Range of values:
It takes values between -∞ and +∞ (per cent), with positive values indicating a gain in market due to increased competitiveness of a selected country sector on the world market.
5 An elementary or import market is defined as the destination country j for a specific sector s.
Example: The above figure depicts competitiveness effect (by ranking) for the “Mineral” sector for selected economies in the chosen
year (t).
74
99
57
118
108
60
140
0 25 50 75 100 125 150
Greece
Liberia
Mongolia
Netherla…
Paraguay
Qatar
Sudan
rank
ITC‟s Market Analysis and Research – TPI Technical Notes
International Trade Centre (ITC) 38
C1.a - TECHNICAL NOTES
• Mathematical definition:
jt
ws
t
js
t
js
t
djs
t
js
t
djs
X
X
X
X
X
X
0
0
0
0
where t is the current year, t0 is the first year considered, d is the country under study, j is the partner country, s is the selected sector,
and X are the exports, ( are world exports for sector s).
0
0
t
js
t
djs
t
js
t
djs
X
X
X
X is the variation in the country‟s market share in
import markets;
0
0
t
ws
t
js
X
X is the initial share of world markets in world imports
• Data sources:
Trade data can be obtained from the ITC Trade Map and the United Nations Commodity Trade database (COMTRADE).
Country Competitiveness effect Rank
Greece 0.00% 74
Liberia -0.02% 99
Mongolia 0.02% 57
Netherlands -0.04% 118
Paraguay -0.02% 108
Qatar 0.02% 60
Sudan -0.08% 140
Sample calculation: The table above presents competitiveness effect‟s data and rank for the “Mineral” sector for selected economies in the chosen year (t).
ITC‟s Market Analysis and Research – TPI Technical Notes
International Trade Centre (ITC) 39
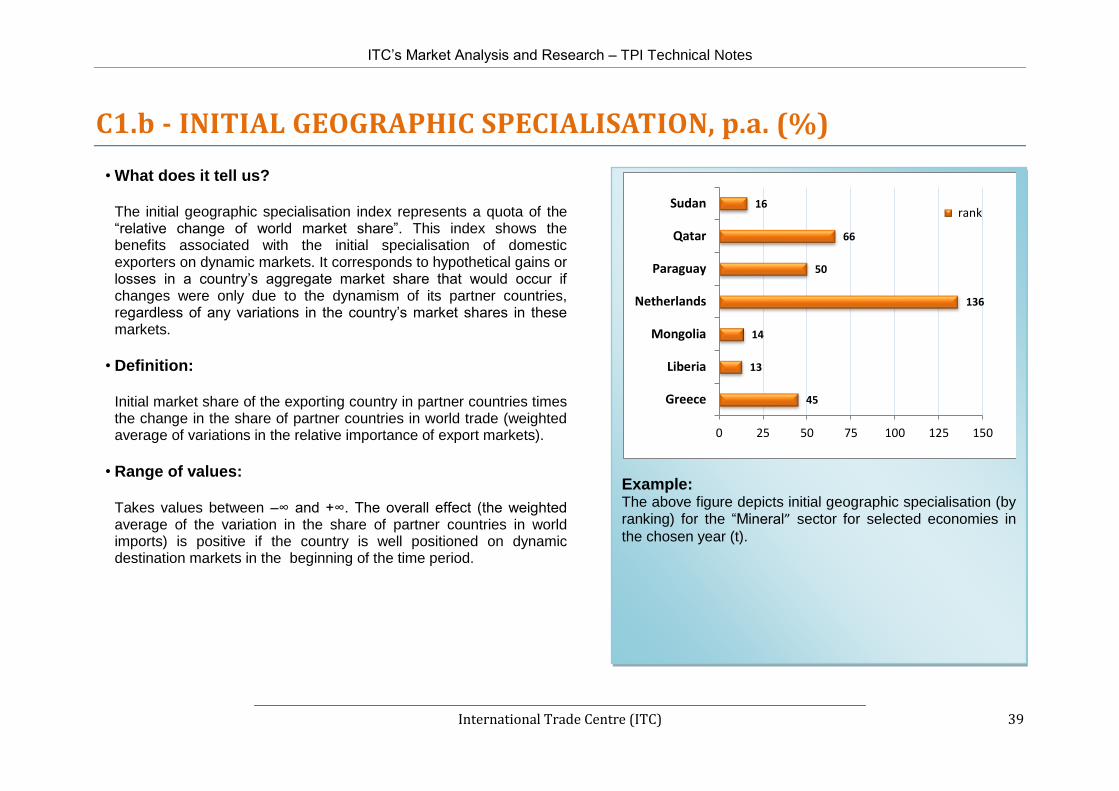
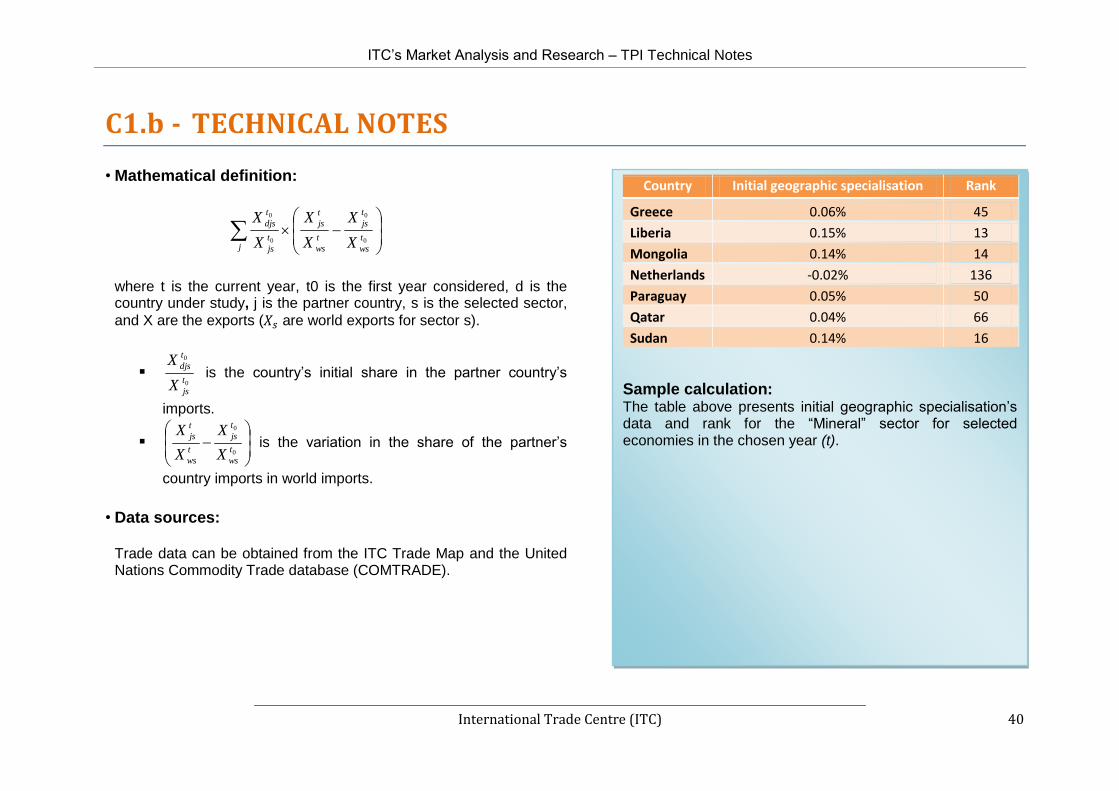
C1.b - INITIAL GEOGRAPHIC SPECIALISATION, p.a. (%)
• What does it tell us? The initial geographic specialisation index represents a quota of the “relative change of world market share”. This index shows the benefits associated with the initial specialisation of domestic exporters on dynamic markets. It corresponds to hypothetical gains or losses in a country‟s aggregate market share that would occur if changes were only due to the dynamism of its partner countries, regardless of any variations in the country‟s market shares in these markets.
• Definition: Initial market share of the exporting country in partner countries times the change in the share of partner countries in world trade (weighted average of variations in the relative importance of export markets).
• Range of values:
Takes values between –∞ and +∞. The overall effect (the weighted average of the variation in the share of partner countries in world imports) is positive if the country is well positioned on dynamic destination markets in the beginning of the time period.
Example: The above figure depicts initial geographic specialisation (by ranking) for the “Mineral” sector for selected economies in
the chosen year (t).
45
13
14
136
50
66
16
0 25 50 75 100 125 150
Greece
Liberia
Mongolia
Netherlands
Paraguay
Qatar
Sudan rank
ITC‟s Market Analysis and Research – TPI Technical Notes
International Trade Centre (ITC) 40
C1.b - TECHNICAL NOTES
• Mathematical definition:
jt
ws
t
js
t
ws
t
js
t
js
t
djs
X
X
X
X
X
X
0
0
0
0
where t is the current year, t0 is the first year considered, d is the country under study, j is the partner country, s is the selected sector,
and X are the exports ( are world exports for sector s).
0
0
t
js
t
djs
X
X is the country‟s initial share in the partner country‟s
imports.
0
0
t
ws
t
js
t
ws
t
js
X
X
X
X is the variation in the share of the partner‟s
country imports in world imports.
• Data sources:
Trade data can be obtained from the ITC Trade Map and the United Nations Commodity Trade database (COMTRADE).
Country Initial geographic specialisation Rank
Greece 0.06% 45
Liberia 0.15% 13
Mongolia 0.14% 14
Netherlands -0.02% 136
Paraguay 0.05% 50
Qatar 0.04% 66
Sudan 0.14% 16
Sample calculation: The table above presents initial geographic specialisation‟s data and rank for the “Mineral” sector for selected economies in the chosen year (t).
ITC‟s Market Analysis and Research – TPI Technical Notes
International Trade Centre (ITC) 41
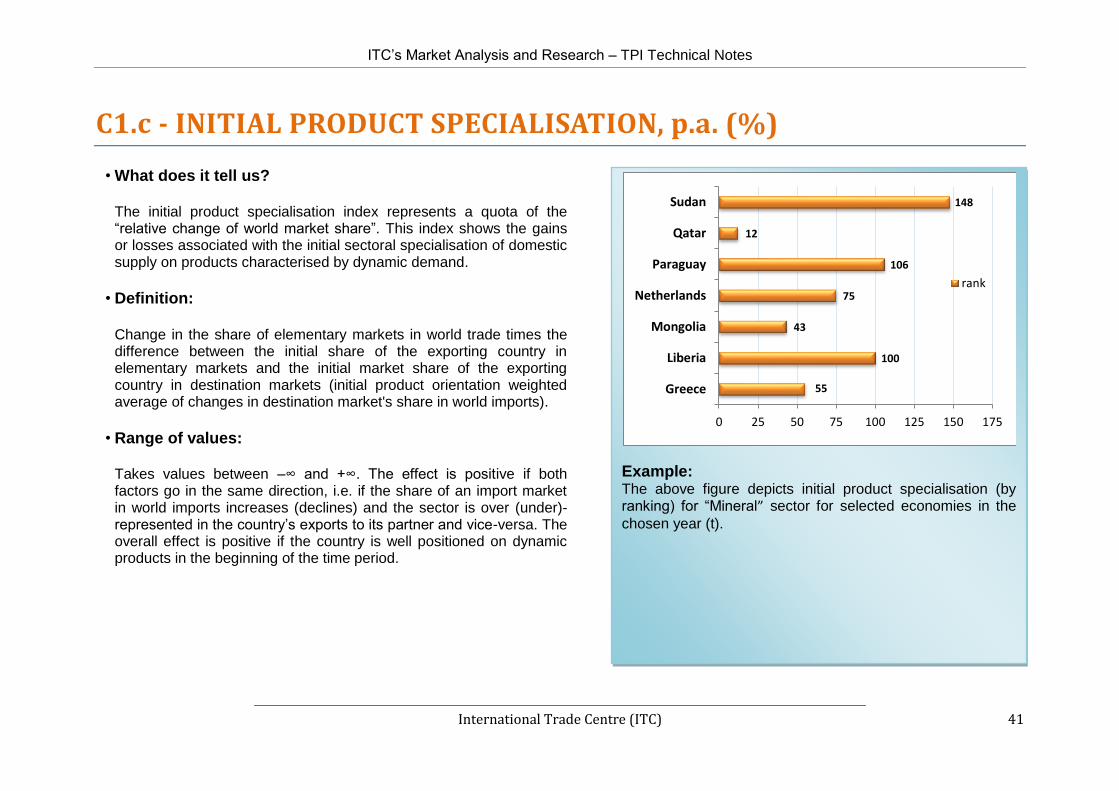
C1.c - INITIAL PRODUCT SPECIALISATION, p.a. (%)
• What does it tell us? The initial product specialisation index represents a quota of the “relative change of world market share”. This index shows the gains or losses associated with the initial sectoral specialisation of domestic supply on products characterised by dynamic demand.
• Definition:
Change in the share of elementary markets in world trade times the difference between the initial share of the exporting country in elementary markets and the initial market share of the exporting country in destination markets (initial product orientation weighted average of changes in destination market's share in world imports).
• Range of values: Takes values between –∞ and +∞. The effect is positive if both factors go in the same direction, i.e. if the share of an import market in world imports increases (declines) and the sector is over (under)-represented in the country‟s exports to its partner and vice-versa. The overall effect is positive if the country is well positioned on dynamic products in the beginning of the time period.
Example: The above figure depicts initial product specialisation (by ranking) for “Mineral” sector for selected economies in the
chosen year (t).
55
100
43
75
106
12
148
0 25 50 75 100 125 150 175
Greece
Liberia
Mongolia
Netherlands
Paraguay
Qatar
Sudan
rank

ITC‟s Market Analysis and Research – TPI Technical Notes
International Trade Centre (ITC) 42
C1.c - TECHNICAL NOTES
• Mathematical definition:
jt
w
t
js
t
w
t
js
t
j
t
dj
t
js
t
djs
X
X
X
X
X
X
X
X
0
0
0
0
0
0
where t is the current year, 0 is the first year considered, d is the country under study, j is the partner country, s is the selected sector,
and X are the exports ( are world exports for sector s).
0
0
0
0
t
j
t
dj
t
js
t
djs
X
X
X
X is the difference between the country‟s initial
market share in import markets and the country‟s initial market share in the partner country‟s total imports.
0
0
t
w
t
js
t
w
t
js
X
X
X
X is the variation in the share of import markets in
world imports.
• Data sources:
Trade data can be obtained from the ITC Trade Map and the United Nations Commodity Trade database (COMTRADE).
Country Initial product specialisation Rank
Greece 0.01% 55
Liberia -0.02% 100
Mongolia 0.02% 43
Netherlands 0.00% 75
Paraguay -0.03% 106
Qatar 0.08% 12
Sudan -0.11% 148
Sample calculation: The table above presents initial product specialisation‟s data and rank for the “Mineral” sector for selected economies in the chosen year (t).

ITC‟s Market Analysis and Research – TPI Technical Notes
International Trade Centre (ITC) 43
C1.d - ADAPTATION EFFECT, p.a. (%)
• What does it tell us?
The adaptation effect index represents a quota of the “relative change of world market share”. This index shows the ability to adjust export supply to changes in world demand of a specific country‟s sector.
• Definition:
Change in the share of the elementary markets in world trade times the change in the exporting country's market share in these elementary markets.
• Range of values: Takes values between –∞ and +∞. The effect is positive if the country‟s market share increases in a growing import market (+,+) or declines in a declining market (−,−). The effect is negative if the country‟s market share increases in a declining import market (+,−) or declines in a growing market (−,+).
Example: The above figure depicts adaptation effect (by ranking) for the “Mineral” sector for selected economies in the chosen
year (t).
140
2
123
49
128
134
21
0 25 50 75 100 125 150
Greece
Liberia
Mongolia
Netherlands
Paraguay
Qatar
Sudan Rank

ITC‟s Market Analysis and Research – TPI Technical Notes
International Trade Centre (ITC) 44
C1.d - TECHNICAL NOTES
• Mathematical definition:
jt
w
t
js
t
w
t
js
t
js
t
djs
t
js
t
djs
X
X
X
X
X
X
X
X
0
0
0
0
where t is the current year, 0 is the first year considered, d is the country under study, j is the partner country, s is the selected sector, w is the set of all exporting countries and X are the exports.
0
0
t
js
t
djs
t
js
t
djs
X
X
X
Xis the variation in the country‟s market share in
import markets.
0
0
t
w
t
js
t
w
t
js
X
X
X
X is the variation in the share of import market in
world imports.
• Data sources:
Trade data can be obtained from the ITC Trade Map and the United Nations Commodity Trade database (COMTRADE).
Country Adaptation effect Rank
Greece -0.08% 140
Liberia 0.48% 2
Mongolia -0.04% 123
Netherlands 0.02% 49
Paraguay -0.05% 128
Qatar -0.07% 134
Sudan 0.10% 21
Sample calculation: The table above presents adaptation effect‟s data and rank for the “Mineral” sector for selected economies in the chosen year (t).

ITC‟s Market Analysis and Research – TPI Technical Notes
International Trade Centre (ITC) 45
C2. - MATCHING WITH DYNAMICS OF WORLD DEMAND
• What does it tell us?
This index is calculated with a view to ranking countries according to their ability to adapt to the dynamics of world demand. It is a focus of the national export portfolio on the world‟s most dynamic products.
• Definition:
Spearman‟s rank correlation between the ranking share of the exporting countries‟ export products in its total exports, and the rank of growth trends in worldwide exports of those products.
• Range of values:
Each country is given a correlation index that takes a value between 1 and –1. A value of 1 (-1) indicates that the relative importance of a country‟s exported goods is in full accordance (discordance) with the ranking of world export growth rates for the same goods. The country ranking is dependent on the rank correlation index. The closer the index is to 1, the better the country ranking under analysis
Example: The above figure depicts the matching with dynamics of world demand index (by ranking) for the “Mineral” sector for
selected economies in the chosen year (t).
57
141
144
86
115
85
156
0 25 50 75 100 125 150 175
Greece
Liberia
Mongolia
Netherlands
Paraguay
Qatar
Sudan
Rank

ITC‟s Market Analysis and Research – TPI Technical Notes
International Trade Centre (ITC) 46
C2. - TECHNICAL NOTES
• Mathematical definition:
It is based on Spearman‟s rank correlation between the ranking in share of the exporting countries‟ export products in its total exports, and the rank of growth trends in worldwide exports of those products, belonging to the sector s.
• Data sources: Trade data can be obtained from the ITC Trade Map and the United Nations Commodity Trade database (COMTRADE).
Country Matching with dynamics of world demand (rank)
Greece 57
Liberia 141
Mongolia 144
Netherlands 86
Paraguay 115
Qatar 85
Sudan 156
Sample calculation: The table above presents ranking of the “matching with dynamics of world demand index” for selected economies for the “Mineral” sector in the chosen year (t).

ITC‟s Market Analysis and Research – TPI Technical Notes
International Trade Centre (ITC) 47
7. Appendixes
7.1. Appendix 1: More on the use of different dispersion indicators
This appendix illustrates the need of using two different measures of diversification
with an example. Let us consider the data on 4 countries and 10 industries
displayed in Table 2.
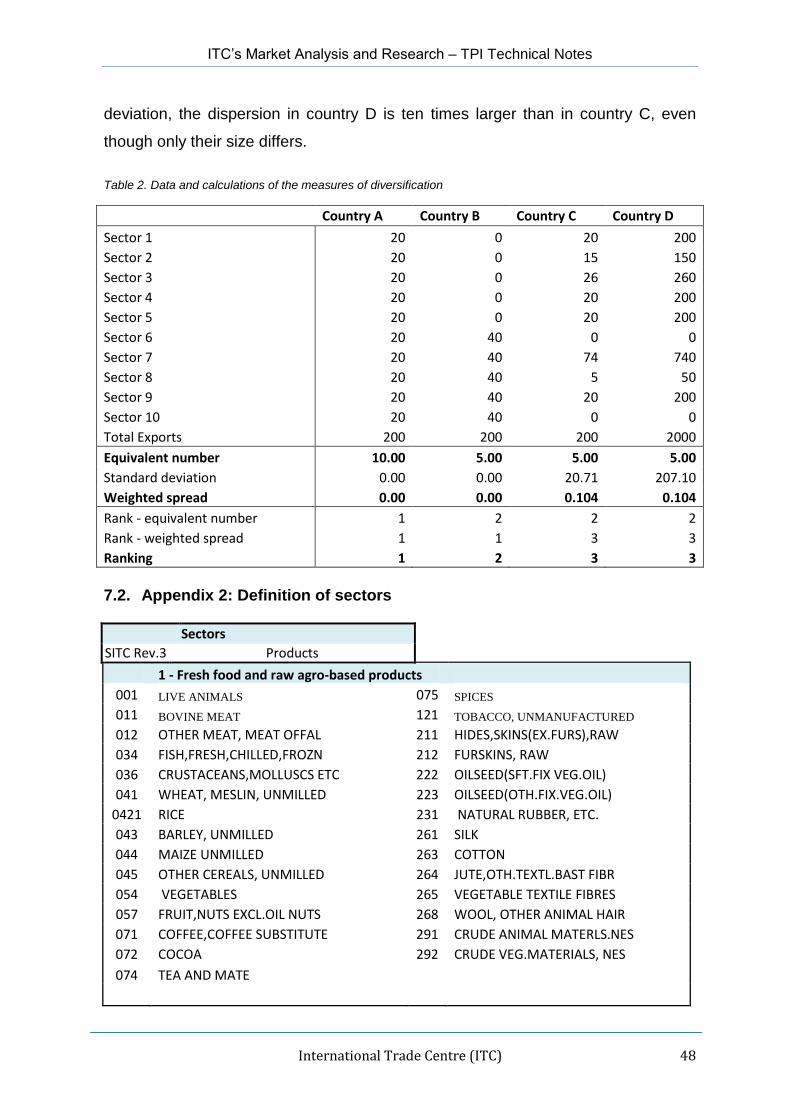
Country A exhibits uniformity in the level of specialisation in its sectors, thereby
achieving the highest level of diversification. Country B is specialised with equal
intensity in 5 out of the 10 sectors. Country C exports products in 8 sectors and is
highly specialised in sector 7, which accounts for 35% of its exports. Lastly, country
D exhibits the same specialisation patterns but tenfold. The choice between the two
indicators is not the same for country A and B on the one hand, and B and C on the
other hand. Neither indicator discriminates simultaneously between countries
belonging to each of these pairs.
Consider the country pair A and B: the spread is zero in both cases (indicating
uniformity in the specialisation in industries) whereas the equivalent number is twice
as large for country A (indicating that country A is diversified twice as much as B).
The spread does not take into account the number of sectors in which a country is
active, but only the share of each sector in total exports. The equivalent number, on
the other hand, ignores the differences in each sector‟s share to total exports and
only focuses on the number of sectors a country is active in. Hence, the spread
indicator does not distinguish any differences between country A and country B,
whereas the equivalent number finds differences between them.
In the case of countries B and C, the opposite result is obtained. The equivalent
number of markets of equal size is 5 in both cases. However, since the dispersion
is much larger in country C, the spread can rank these two countries. In sum,
country A is the most diversified country, followed by B. Countries C and D are the
least diversified.
Lastly, the comparison of results for countries C and D highlights the advantage of
using the weighted spread instead of the standard deviation. Using the standard
ITC‟s Market Analysis and Research – TPI Technical Notes
International Trade Centre (ITC) 48
deviation, the dispersion in country D is ten times larger than in country C, even
though only their size differs.
Table 2. Data and calculations of the measures of diversification
Country A Country B Country C Country D
Sector 1 20 0 20 200
Sector 2 20 0 15 150
Sector 3 20 0 26 260
Sector 4 20 0 20 200
Sector 5 20 0 20 200
Sector 6 20 40 0 0
Sector 7 20 40 74 740
Sector 8 20 40 5 50
Sector 9 20 40 20 200
Sector 10 20 40 0 0
Total Exports 200 200 200 2000
Equivalent number 10.00 5.00 5.00 5.00
Standard deviation 0.00 0.00 20.71 207.10
Weighted spread 0.00 0.00 0.104 0.104
Rank - equivalent number 1 2 2 2
Rank - weighted spread 1 1 3 3
Ranking 1 2 3 3
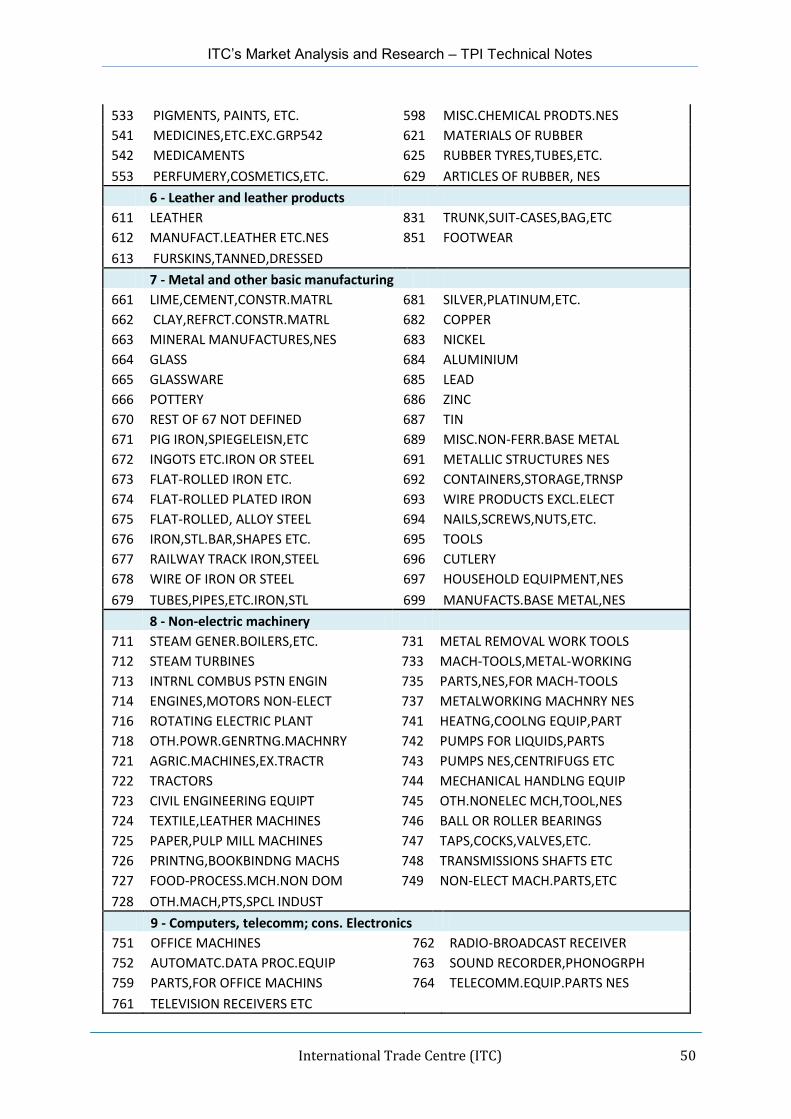
7.2. Appendix 2: Definition of sectors
Sectors
SITC Rev.3 Products
1 - Fresh food and raw agro-based products
001 LIVE ANIMALS 075 SPICES
011 BOVINE MEAT 121 TOBACCO, UNMANUFACTURED
012 OTHER MEAT, MEAT OFFAL 211 HIDES,SKINS(EX.FURS),RAW
034 FISH,FRESH,CHILLED,FROZN 212 FURSKINS, RAW
036 CRUSTACEANS,MOLLUSCS ETC 222 OILSEED(SFT.FIX VEG.OIL)
041 WHEAT, MESLIN, UNMILLED 223 OILSEED(OTH.FIX.VEG.OIL)
0421 RICE 231 NATURAL RUBBER, ETC.
043 BARLEY, UNMILLED 261 SILK
044 MAIZE UNMILLED 263 COTTON
045 OTHER CEREALS, UNMILLED 264 JUTE,OTH.TEXTL.BAST FIBR
054 VEGETABLES 265 VEGETABLE TEXTILE FIBRES
057 FRUIT,NUTS EXCL.OIL NUTS 268 WOOL, OTHER ANIMAL HAIR
071 COFFEE,COFFEE SUBSTITUTE 291 CRUDE ANIMAL MATERLS.NES
072 COCOA 292 CRUDE VEG.MATERIALS, NES
074 TEA AND MATE

ITC‟s Market Analysis and Research – TPI Technical Notes
International Trade Centre (ITC) 49
2 - Processed food and agro-based products
016 MEAT,ED.OFFL,DRY,SLT,SMK 059 FRUIT, VEGETABLE JUICES
017 MEAT,OFFL.PRPD,PRSVD,NES 061 SUGARS,MOLASSES,HONEY
022 MILK AND CREAM 062 SUGAR CONFECTIONERY
023 BUTTER,OTHER FAT OF MILK 073 CHOCOLATE,OTH.COCOA PREP
024 CHEESE AND CURD 081 ANIMAL FEED STUFF
025 EGGS,BIRDS,YOLKS,ALBUMIN 091 MARGARINE AND SHORTENING
035 FISH,DRIED,SALTED,SMOKED 098 EDIBLE PROD.PREPRTNS,NES
037 FISH ETC.PREPD,PRSVD.NES 111 NON-ALCOHOL.BEVERAGE,NES
0422 RICE 112 ALCOHOLIC BEVERAGES
0423 RICE 122 TOBACCO, MANUFACTURED
046 MEAL,FLOUR OF WHEAT,MSLN 411 ANIMAL OILS AND FATS
047 OTHER CEREAL MEAL,FLOURS 421 FIXED VEG.FAT,OILS, SOFT
048 CEREAL PREPARATIONS 422 FIXED VEG.FAT,OILS,OTHER
056 VEGTABLES,PRPD,PRSVD,NES 431 ANIMAL,VEG.FATS,OILS,NES
058 FRUIT,PRESERVED,PREPARED 551 ESSNTL.OIL,PERFUME,FLAVR
3 - Wood, wood products and paper
244 CORK,NATURAL,RAW;WASTE 633 CORK MANUFACTURES
245 FUEL WOOD, WOOD CHARCOAL 634 VENEERS, PLYWOOD, ETC.
246 WOOD IN CHIPS, PARTICLES 635 WOOD MANUFACTURES, NES
247 WOOD ROUGH,ROUGH SQUARED 641 PAPER AND PAPERBOARD
248 WOOD, SIMPLY WORKED 642 PAPER,PAPERBOARD,CUT ETC
251 PULP AND WASTE PAPER e 8215 Wooden furniture
4 - Yarn, fabrics and textiles
651 TEXTILE YARN 656 TULLE,LACE,EMBROIDRY.ETC
652 COTTON FABRICS, WOVEN 657 SPECIAL YARN,TXTL.FABRIC
653 FABRICS,MAN-MADE FIBRES 658 TEXTILE ARTICLES NES
654 OTH.TEXTILE FABRIC,WOVEN 659 FLOOR COVERINGS, ETC.
655 KNIT.CROCHET.FABRIC NES
5 - Chemicals
232 SYNTHETIC RUBBER, ETC. 554 SOAP,CLEANERS,POLISH,ETC
266 SYNTHETIC FIBRES 562 FERTILIZER,EXCEPT GRP272
267 OTHER MAN-MADE FIBRES 571 POLYMERS OF ETHYLENE
511 HYDROCARBONS,NES,DERIVTS 572 POLYMERS OF STYRENE
512 ALCOHOL,PHENOL,ETC.DERIV 573 POLYMERS,VINYL CHLORIDE
513 CARBOXYLIC ACIDS,DERIVTS 574 POLYACETAL,POLYCARBONATE
514 NITROGEN-FUNCT.COMPOUNDS 575 OTH.PLASTIC,PRIMARY FORM
515 ORGANO-INORGANIC COMPNDS 579 PLASTIC WASTE, SCRAP ETC
516 OTHER ORGANIC CHEMICALS 581 PLASTIC TUBE,PIPE,HOSE
522 INORGANIC CHEM.ELEMENTS 582 PLASTIC PLATE,SHEETS,ETC
523 METAL.SALTS,INORGAN.ACID 583 MONOFILAMENT OF PLASTICS
524 OTHER CHEMICAL COMPOUNDS 591 INSECTICIDES, ETC.
525 RADIO-ACTIVE MATERIALS 592 STARCHES,INULIN,ETC.
531 SYNTH.COLOURS,LAKES,ETC. 593 EXPLOSIVES,PYROTECHNICS
532 DYEING,TANNING MATERIALS 597 PREPRD ADDITIVES,LIQUIDS
ITC‟s Market Analysis and Research – TPI Technical Notes
International Trade Centre (ITC) 50
533 PIGMENTS, PAINTS, ETC. 598 MISC.CHEMICAL PRODTS.NES
541 MEDICINES,ETC.EXC.GRP542 621 MATERIALS OF RUBBER
542 MEDICAMENTS 625 RUBBER TYRES,TUBES,ETC.
553 PERFUMERY,COSMETICS,ETC. 629 ARTICLES OF RUBBER, NES
6 - Leather and leather products
611 LEATHER 831 TRUNK,SUIT-CASES,BAG,ETC
612 MANUFACT.LEATHER ETC.NES 851 FOOTWEAR
613 FURSKINS,TANNED,DRESSED
7 - Metal and other basic manufacturing
661 LIME,CEMENT,CONSTR.MATRL 681 SILVER,PLATINUM,ETC.
662 CLAY,REFRCT.CONSTR.MATRL 682 COPPER
663 MINERAL MANUFACTURES,NES 683 NICKEL
664 GLASS 684 ALUMINIUM
665 GLASSWARE 685 LEAD
666 POTTERY 686 ZINC
670 REST OF 67 NOT DEFINED 687 TIN
671 PIG IRON,SPIEGELEISN,ETC 689 MISC.NON-FERR.BASE METAL
672 INGOTS ETC.IRON OR STEEL 691 METALLIC STRUCTURES NES
673 FLAT-ROLLED IRON ETC. 692 CONTAINERS,STORAGE,TRNSP
674 FLAT-ROLLED PLATED IRON 693 WIRE PRODUCTS EXCL.ELECT
675 FLAT-ROLLED, ALLOY STEEL 694 NAILS,SCREWS,NUTS,ETC.
676 IRON,STL.BAR,SHAPES ETC. 695 TOOLS
677 RAILWAY TRACK IRON,STEEL 696 CUTLERY
678 WIRE OF IRON OR STEEL 697 HOUSEHOLD EQUIPMENT,NES
679 TUBES,PIPES,ETC.IRON,STL 699 MANUFACTS.BASE METAL,NES
8 - Non-electric machinery
711 STEAM GENER.BOILERS,ETC. 731 METAL REMOVAL WORK TOOLS
712 STEAM TURBINES 733 MACH-TOOLS,METAL-WORKING
713 INTRNL COMBUS PSTN ENGIN 735 PARTS,NES,FOR MACH-TOOLS
714 ENGINES,MOTORS NON-ELECT 737 METALWORKING MACHNRY NES
716 ROTATING ELECTRIC PLANT 741 HEATNG,COOLNG EQUIP,PART
718 OTH.POWR.GENRTNG.MACHNRY 742 PUMPS FOR LIQUIDS,PARTS
721 AGRIC.MACHINES,EX.TRACTR 743 PUMPS NES,CENTRIFUGS ETC
722 TRACTORS 744 MECHANICAL HANDLNG EQUIP
723 CIVIL ENGINEERING EQUIPT 745 OTH.NONELEC MCH,TOOL,NES
724 TEXTILE,LEATHER MACHINES 746 BALL OR ROLLER BEARINGS
725 PAPER,PULP MILL MACHINES 747 TAPS,COCKS,VALVES,ETC.
726 PRINTNG,BOOKBINDNG MACHS 748 TRANSMISSIONS SHAFTS ETC
727 FOOD-PROCESS.MCH.NON DOM 749 NON-ELECT MACH.PARTS,ETC
728 OTH.MACH,PTS,SPCL INDUST
9 - Computers, telecomm; cons. Electronics
751 OFFICE MACHINES 762 RADIO-BROADCAST RECEIVER
752 AUTOMATC.DATA PROC.EQUIP 763 SOUND RECORDER,PHONOGRPH
759 PARTS,FOR OFFICE MACHINS 764 TELECOMM.EQUIP.PARTS NES
761 TELEVISION RECEIVERS ETC

ITC‟s Market Analysis and Research – TPI Technical Notes
International Trade Centre (ITC) 51
10 - Electronic components
771 ELECT POWER MACHNY.PARTS 775 DOM.ELEC,NON-ELEC.EQUIPT
772 ELEC.SWITCH.RELAY.CIRCUT 776 TRANSISTORS,VALVES,ETC.
773 ELECTR DISTRIBT.EQPT NES 778 ELECTRIC.MACH.APPART.NES
774 ELECTRO-MEDCL,XRAY EQUIP 11 - Transport equipment
781 PASS.MOTOR VEHCLS.EX.BUS 786 TRAILERS,SEMI-TRAILR,ETC
782 GOODS,SPCL TRANSPORT VEH 791 RAILWAY VEHICLES.EQUIPNT
783 ROAD MOTOR VEHICLES NES 792 AIRCRAFT,ASSOCTD.EQUIPNT
784 PARTS,TRACTORS,MOTOR VEH 793 SHIP,BOAT,FLOAT.STRUCTRS
785 CYCLES,MOTORCYCLES ETC. 12 Clothing
841 MENS,BOYS CLOTHNG,X-KNIT
842 WOMEN,GIRL CLOTHNG,XKNIT 845 OTHR.TEXTILE APPAREL,NES
843 MENS,BOYS CLOTHING,KNIT 846 CLOTHING ACCESSRS,FABRIC
844 WOMEN,GIRLS CLOTHNG.KNIT 848 CLOTHNG,NONTXTL;HEADGEAR
13 Misc. manufacturing
811 PREFABRICATED BUILDINGS 885 WATCHES AND CLOCKS
812 PLUMBNG,SANITRY,EQPT.ETC 891 ARMS AND AMMUNITION
813 LIGHTNG FIXTURES ETC.NES 892 PRINTED MATTER
871 OPTICAL INSTRUMENTS,NES 893 ARTICLES,NES,OF PLASTICS
872 MEDICAL INSTRUMENTS NES 894 BABY CARRIAGE,TOYS,GAMES
873 METERS,COUNTERS,NES 895 OFFICE,STATIONERY SUPPLS
874 MEASURE,CONTROL INSTRMNT 896 WORKS OF ART,ANTIQUE ETC
881 PHOTOGRAPH APPAR.ETC.NES 897 GOLD,SILVERWARE,JEWL NES
882 PHOTO.CINEMATOGRPH.SUPPL 898 MUSICAL INSTRUMENTS,ETC.
883 CINE.FILM EXPOSD.DEVELPD 899 MISC MANUFCTRD GOODS NES
884 OPTICAL GOODS NES
14 - Minerals
272 FERTILIZERS, CRUDE 289 PREC.METAL ORES,CONCTRTS
273 STONE, SAND AND GRAVEL 321 COAL,NOT AGGLOMERATED
274 SULPHUR,UNRSTD.IRON PYRS 322 BRIQUETTES,LIGNITE,PEAT
277 NATURAL ABRASIVES, NES 325 COKE,SEMI-COKE,RET.CARBN
278 OTHER CRUDE MINERALS 333 PETROLEUM OILS, CRUDE
281 IRON ORE, CONCENTRATES 334 PETROLEUM PRODUCTS
282 FERROUS WASTE AND SCRAP 335 RESIDUAL PETROL.PRODUCTS
283 COPPER ORES,CONCENTRATES 342 LIQUEFIED PROPANE,BUTANE
284 NICKEL ORES,CONCTR,MATTE 343 NATURAL GAS
285 ALUMINIUM ORE,CONCTR.ETC 344 PETROLEUM GASES, NES
286 URANIUM,THORIUM ORES,ETC. 345 COAL GAS,WATER GAS, ETC.
287 ORE,CONCENTR.BASE METALS 351 ELECTRIC CURRENT
288 NON-FERROUS WASTE,SCRAP 667 PEARLS,PRECIOUS STONES

ITC‟s Market Analysis and Research – TPI Technical Notes
International Trade Centre (ITC) 52