Technical Metrics Aren’t Enough: 10 Strategic Security ... · PDF fileSESSION ID:...
60
SESSION ID: Technical Metrics Aren’t Enough: 10 Strategic Security Measures GRC-F01 Julia Allen CERT ® Program Carnegie Mellon Software Engineering Institute Pittsburgh, PA Lisa Young CERT ® Program Carnegie Mellon Software Engineering Institute Pittsburgh, PA
Transcript of Technical Metrics Aren’t Enough: 10 Strategic Security ... · PDF fileSESSION ID:...

SESSION ID:
Technical Metrics Aren’t Enough: 10 Strategic Security Measures
GRC-F01
Julia Allen CERT® Program Carnegie Mellon Software Engineering Institute Pittsburgh, PA
Lisa Young CERT® Program Carnegie Mellon Software Engineering Institute Pittsburgh, PA

#RSAC
2
#RSAC
Session Expectations
This session
does not cover specific technical security measures
does cover strategic security measures and their importance
Why you might want to stay for this session anyway - if you are interested in
determining the current state of security in support of business objectives
identifying risks and gaps in your current measurement processes
selecting and implementing practices and controls tied to business objectives
a description of candidate measures that will help you do these things
3

#RSAC
Key Takeaways
Determine which measures are most important: key questions to ask
Articulate 5 business objectives and 10 key measures that better illustrate your current state of security at a strategic/business level
inform the selection of improvements
Put measures in place that stick
Communicate with business leaders in their language
4

#RSAC
CERT | Software Engineering Institute | Carnegie Mellon Software Engineering Institute (SEI)
Federally funded research and development center
Basic and applied research in partnership with government and private organizations
Helps organizations improve development, operation, and management of software-intensive and networked systems
CERT – Anticipating and solving our nation’s cybersecurity challenges
Largest technical program at the SEI
Focused on internet security, digital investigation, secure systems, insider threat, operational resilience, vulnerability analysis, network situational awareness, and coordinated response
5
#RSAC
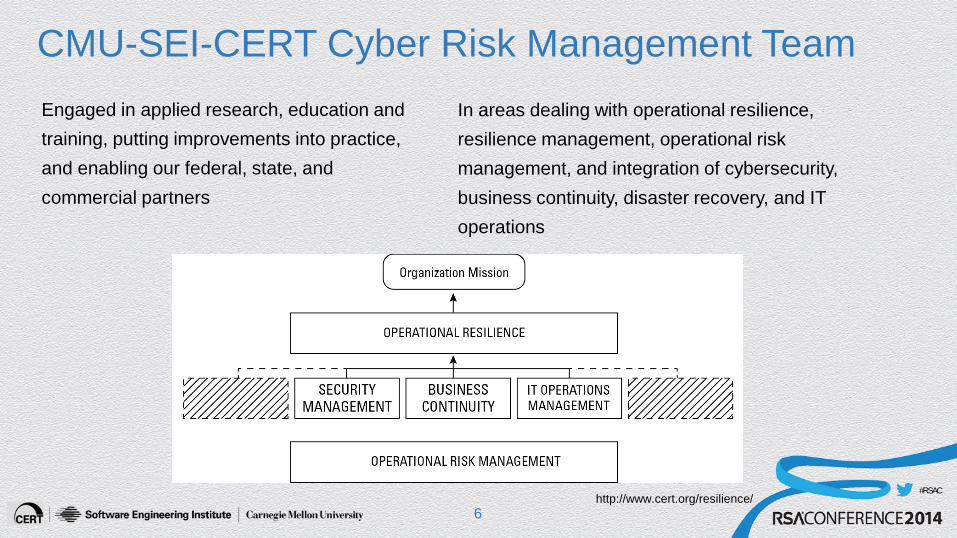
CMU-SEI-CERT Cyber Risk Management Team Engaged in applied research, education and training, putting improvements into practice, and enabling our federal, state, and commercial partners
http://www.cert.org/resilience/
In areas dealing with operational resilience, resilience management, operational risk management, and integration of cybersecurity, business continuity, disaster recovery, and IT operations
6
#RSAC
Topics
CERT Resilience Management Model (CERT-RMM) Overview
How Secure Am I?
Why Measure? What Should I Measure?
Measurement Defined
Key Measures
Getting Started
7

CERT-RMM Overview

#RSAC
Operational Re·sil·ience noun [ri-ˈzil-yəns]
physical property of a material that can return to its original shape or position after deformation that does not exceed its elastic limit
ability to provide and maintain an acceptable level of service in the face of faults and challenges to normal operation
power or ability to return to the original form, position, etc., after being bent, compressed, or stretched
capability of a strained body to recover its size and shape after deformation
ability to recover from or adjust easily to misfortune or change
ability of an ecosystem to return to its original state after being disturbed
ability to recover readily from illness, depression, adversity, or the like
9
#RSAC
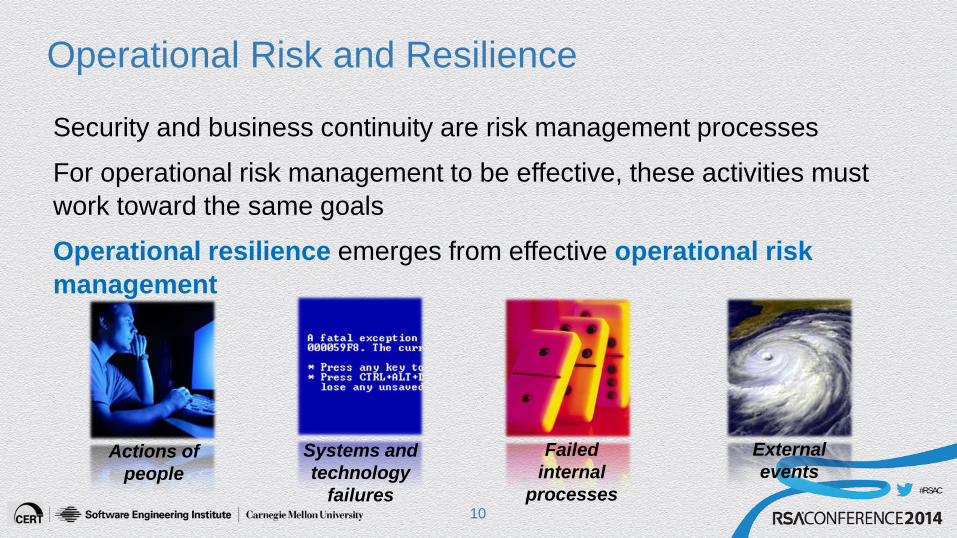
Operational Risk and Resilience
Security and business continuity are risk management processes
For operational risk management to be effective, these activities must work toward the same goals
Operational resilience emerges from effective operational risk management
Actions of people
Systems and technology
failures
Failed internal
processes
External events
10

#RSAC
CERT-RMM
“…an extensive superset of the things an organization could do to be more resilient.” - CERT-RMM adopter
Framework for managing and improving operational resilience
http://www.cert.org/resilience/
11

#RSAC
Service Service Mission
Organization Mission
People Information Facilities Technology protect sustain protect sustain protect sustain protect sustain
CERT-RMM applies here
Organizational Context

#RSAC
CERT-RMM: 26 process areas in 4 categories Engineering ADM Asset Definition and Management
CTRL Controls Management
RRD Resilience Requirements Development
RRM Resilience Requirements Management
RTSE Resilient Technical Solution Engineering
SC Service Continuity
Enterprise Management COMM Communications
COMP Compliance
EF Enterprise Focus
FRM Financial Resource Management
HRM Human Resource Management
OTA Organizational Training and Awareness
RISK Risk Management
Operations Management AM Access Management
EC Environmental Control
EXD External Dependencies Management
ID Identity Management
IMC Incident Management and Control
KIM Knowledge and Information Management
PM People Management
TM Technology Management
VAR Vulnerability Analysis and Resolution
Process Management MA Measurement and Analysis
MON Monitoring
OPD Organizational Process Definition
OPF Organizational Process Focus
13

How Secure Am I?

#RSAC
How Secure Am I? - 1 When asked:
How secure am I?
Am I secure enough?
How secure do I need to be?
What does this mean?
15
#RSAC
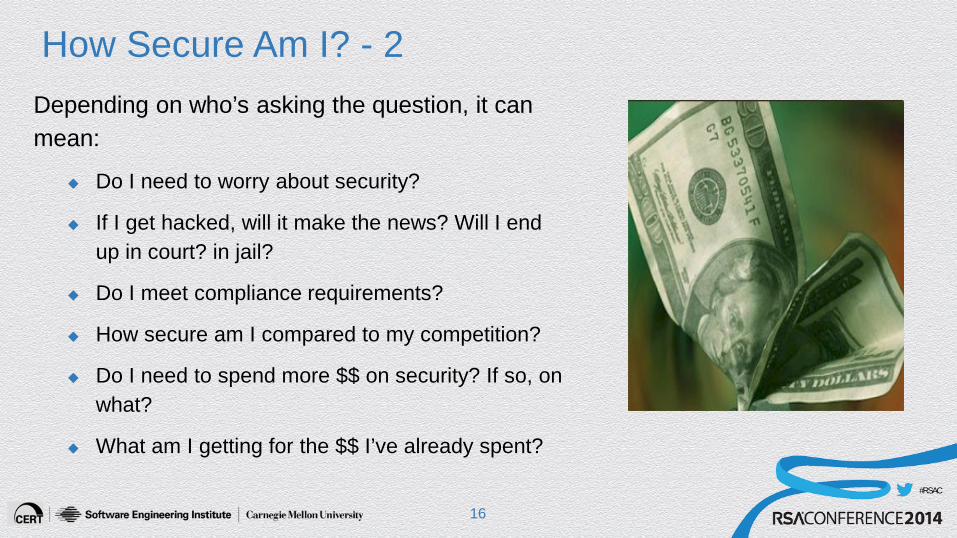
How Secure Am I? - 2 Depending on who’s asking the question, it can mean:
Do I need to worry about security?
If I get hacked, will it make the news? Will I end up in court? in jail?
Do I meet compliance requirements?
How secure am I compared to my competition?
Do I need to spend more $$ on security? If so, on what?
What am I getting for the $$ I’ve already spent?
16

#RSAC
Key Questions - 1 How secure is my IT infrastructure? My information? My facilities? My people? My supply chain?
How secure do I need to be? How do I express this?
What would change if I was more secure?
Have the investments I’ve made (controls, practices, technology, experts, etc.) made me more secure/secure enough? By how much? Compared to what? How do I know?
17

#RSAC
Key Questions - 2 What should I be measuring to determine if I am meeting my performance objectives for security?
Do I know what these are? Do they reflect today’s realities?
What is the business value of being more secure?
Of a specific security investment?
18

#RSAC
So What? Why Do You Care? This is the most important question.
If I had this measure: (*)
What decisions would it inform?
What actions would I take based on it?
What behaviors would it affect?
What would improvement look like?
What would its value be in comparison to other measures?
(*) informed by Douglas Hubbard, How to Measure Anything, John Wiley & Sons, 2010
19
Why Measure? What Should I Measure?

#RSAC
What Are You Measuring Today? - 1 Some typical technical measures % of assets (systems, devices) patched
min/mean/max time from patch release to patch implementation
% of scanned assets not found in the CMDB
Goal: 100% of assets are inventoried in CMDB and reflect standard configurations
% of devices/assets regularly scanned by antivirus software
number of incidents reported/closed
number of incidents with a known solution (patch) that was not applied
% of assets subject to ingress/egress filtering
21
#RSAC
What Are You Measuring Today? - 2 Some typical strategic/business measures % of senior executives who have documented security objectives that are reviewed as
part of the performance management review process
% of security policies that are met (no violations; all exceptions approved)
difference in planned vs. actual to perform security activities/actions/investments
schedule
resources
cost
% of staff who have been assessed to determine if training has been effective commensurate with their job responsibilities
22

#RSAC
Why Measure? Demonstrate that the security program has measurable business value
Speak to decision makers in their language
Answer key questions
Demonstrate that security objectives are (and continue to be) met
Justify new investments; improve
Help predict the future
23

#RSAC
What Should I Measure? Determine business objectives and key questions
Define the information that is needed to answer the question
What information do you currently have?
What additional information do you need to collect?
Qualify and quantify the information in the form of measures
Analyze the measures and report out
Quantify the value of each measure (cost/benefit)
Refine and retire measures as you go
24

#RSAC
Who, What, Where, When, Why, How Who is the measure for? Who are the stakeholders? Who collects the measurement data?
What is being measured?
Where is the data/information stored?
When/how frequently are the measures collected?
Why is the measure important (vs. others)? The most meaningful information is conveyed by reporting trends over time vs. point in time measures.
How is the data collected? How is the measure presented? How is the measure used?
25

Measurement Defined

#RSAC
Scope and Terminology
Measure vs. metric
Measure (noun): the extent, dimensions, quantity, etc., of something, ascertained especially by comparison with a standard; any standard of comparison, estimation, or judgment
Metric: pertaining to the meter or metric system; a non-negative real valued function; a system or standard of measurement; a criterion or set of criteria stated in quantifiable terms
For our efforts, metric = number; measure = number with analysis and meaning, in context. That said, our community often uses metric to mean both.
27
#RSAC
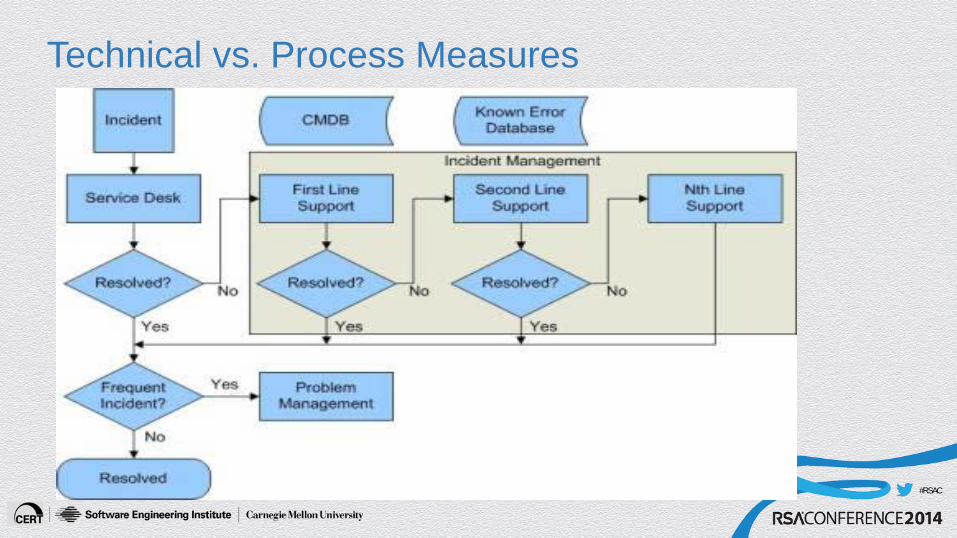
Technical vs. Process Measures
#RSAC
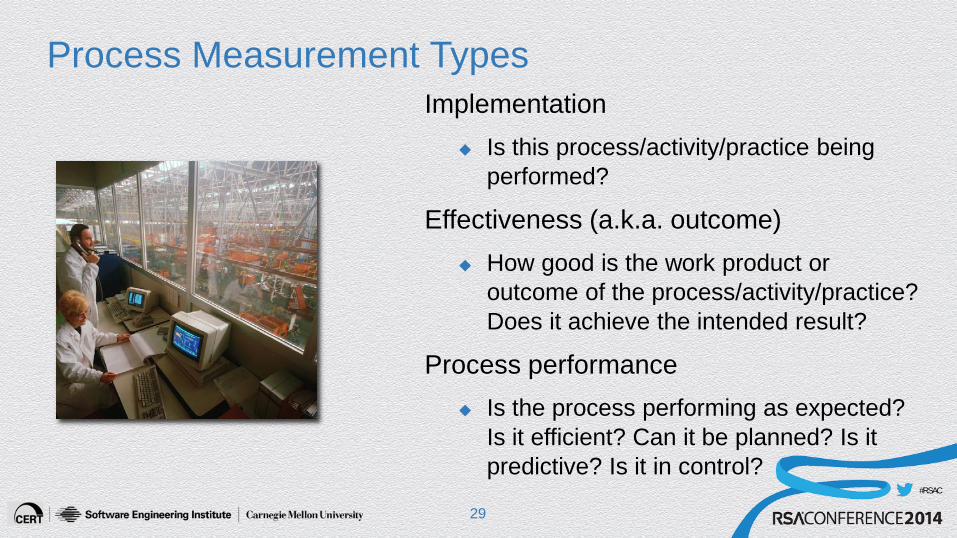
Process Measurement Types
Implementation Is this process/activity/practice being
performed?
Effectiveness (a.k.a. outcome) How good is the work product or
outcome of the process/activity/practice? Does it achieve the intended result?
Process performance Is the process performing as expected?
Is it efficient? Can it be planned? Is it predictive? Is it in control?
29

Key Measures

#RSAC
Structure of the 10 Strategic Measures Title: The context for the measure (a.k.a. business driver)
business objectives
high-value services and assets
controls
risks
disruptive events
Two measures to aid in determining if each business driver is being met
Scenario example: The organization has decided to outsource selected security services and contract for such services using an SLA
31

#RSAC
Given Business Objectives (1 of 10)
Measure 1 Percentage of security activities(*) that do not directly (or indirectly) support one or more business objectives
Example Outsource in-house security services Transition/retire in-house services Retrain/reassign staff
(*) An activity can be a project, task, performance objective, investment, etc. It represents some meaningful decomposition of the security program.
32

#RSAC
Given Business Objectives (2 of 10)
Example SLA relationship with external security services provider CIO/CSO objective
Measure 2
For each security activity, number of business objectives that require it to be satisfied (goal is = or > 1)
33

#RSAC
Measure 3
Percentage of high-value services that do not satisfy their security requirements(*) (should be zero)
or measure a specific service of interest
make sure criteria for selecting a specific service is defined
(*) confidentiality, availability, integrity
Example SLA specifies security requirements and thresholds
high-priority alerts from incident detection systems are resolved within xx minutes
Provider performance periodically reviewed to confirm compliance; corrective actions identified and addressed
Given High-Value Services and Assets (3 of 10)
34
#RSAC
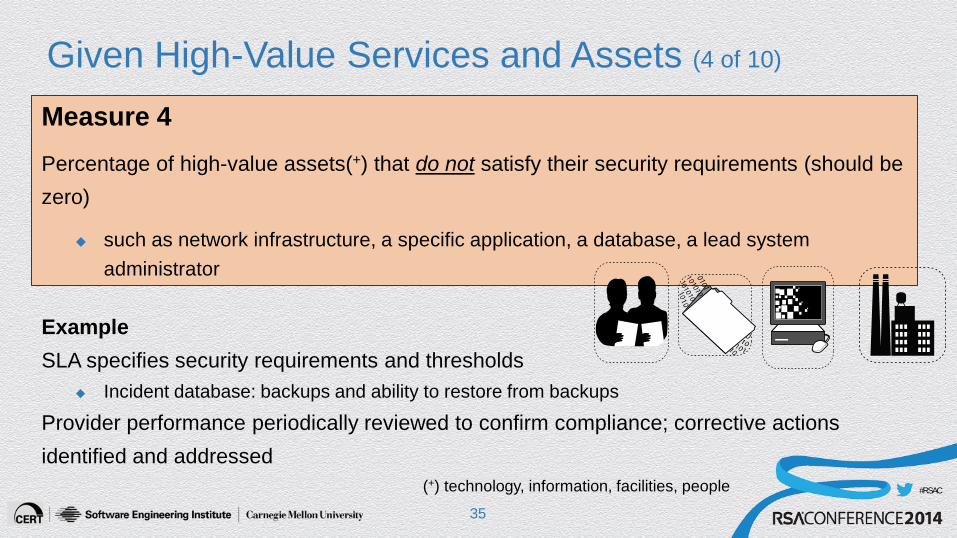
Measure 4 Percentage of high-value assets(+) that do not satisfy their security requirements (should be zero)
such as network infrastructure, a specific application, a database, a lead system administrator
(+) technology, information, facilities, people
Example SLA specifies security requirements and thresholds
Incident database: backups and ability to restore from backups
Provider performance periodically reviewed to confirm compliance; corrective actions identified and addressed
Given High-Value Services and Assets (4 of 10)
35

#RSAC
Given Controls (5 of 10)
Measure 5 Percentage of high-value services with controls that are ineffective or inadequate (should be zero)
unsatisfied control objectives
unmet security requirements
outstanding assessment/audit problems above threshold without remediation plans
Example SLA specifies controls (policies, procedures, standards, guidelines, tools, practices, measures) Provider performance periodically reviewed to confirm compliance; corrective actions taken and confirmed
36
#RSAC
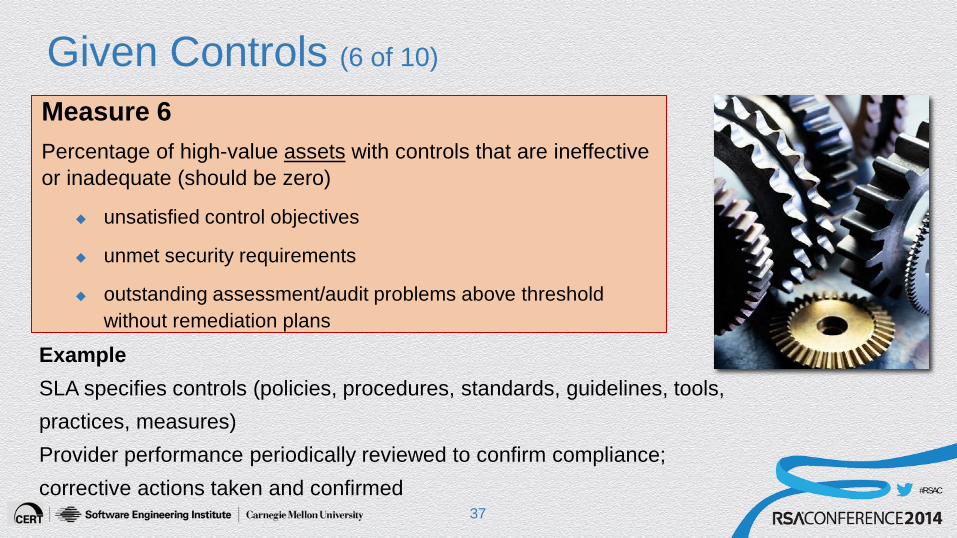
Given Controls (6 of 10)
Measure 6 Percentage of high-value assets with controls that are ineffective or inadequate (should be zero)
unsatisfied control objectives
unmet security requirements
outstanding assessment/audit problems above threshold without remediation plans
Example SLA specifies controls (policies, procedures, standards, guidelines, tools, practices, measures) Provider performance periodically reviewed to confirm compliance; corrective actions taken and confirmed
37

#RSAC
Given Risks (7 of 10)
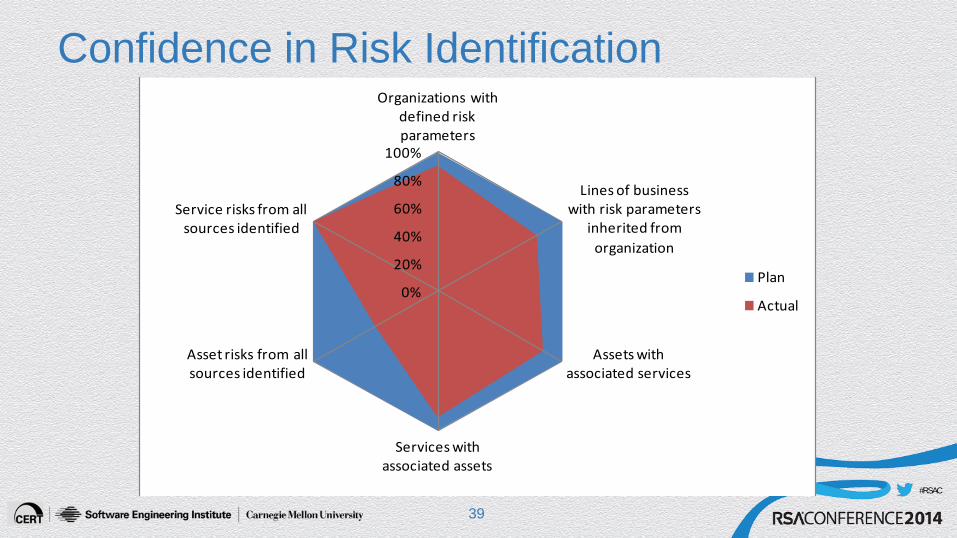
Measure 7
Confidence factor that all risks that need to be identified have been identified
Example Major sources of risk identified in SLA Risk thresholds by service identified Confidence factor expressed as plan vs. actual risks for all sources, displayed as a Kiviat diagram
38
#RSAC
0%
20%
40%
60%
80%
100%
Organizations with defined risk parameters
Lines of business with risk parameters
inherited from organization
Assets with associated services
Services with associated assets
Asset risks from all sources identified
Service risks from all sources identified
Plan
Actual
Confidence in Risk Identification
39

#RSAC
Given Risks (8 of 10)
Measure 8
Percentage of risks with impact above threshold (should be zero)
without mitigation plans (target = zero)
that are effectively mitigated by their mitigation plans (target = 100%)
that have been reviewed/actioned in the required timeframe (target = 100%)
Example Provider risk periodically assessed to ensure risk impact is
<= zero; corrective actions taken and confirmed
40

#RSAC
Given a Disruptive Event (9 of 10)
(An incident, a break in service continuity, a man-made or natural disaster or crisis)
Measure 9 Probability of delivered service throughout a disruptive event
Example SLA specifies service-specific availability and service levels during normal and disrupted operations Provider performance periodically reviewed to confirm service levels; corrective actions taken and confirmed
41
#RSAC
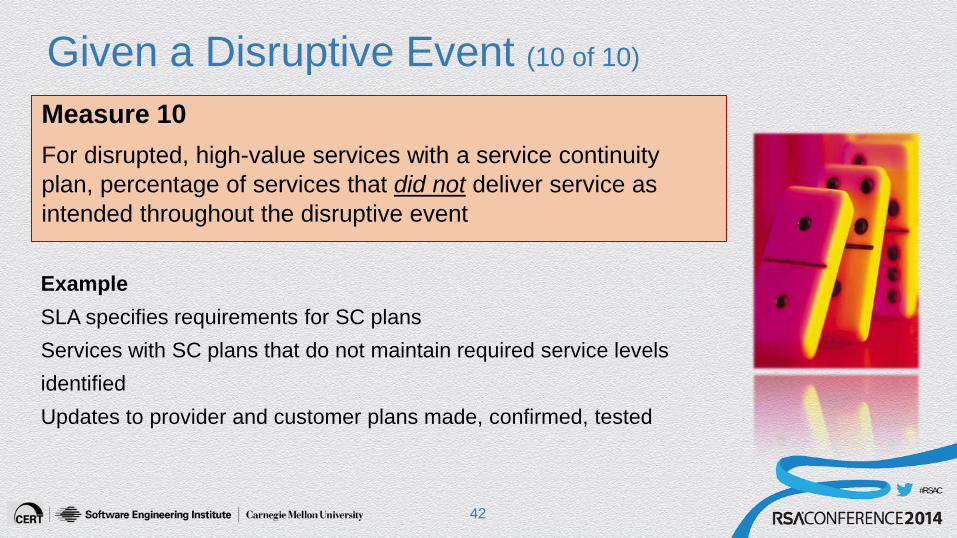
Given a Disruptive Event (10 of 10)
Measure 10 For disrupted, high-value services with a service continuity plan, percentage of services that did not deliver service as intended throughout the disruptive event
Example SLA specifies requirements for SC plans Services with SC plans that do not maintain required service levels identified Updates to provider and customer plans made, confirmed, tested
42

#RSAC
Top Ten Strategic Measures 1. Percentage of security “activities” that do
not directly (or indirectly) support one or more organizational objectives
2. For each security “activity,” number of organizational objectives that require it to be satisfied (goal is = or > 1)
3. Percentage of high-value services that do not satisfy their allocated security requirements
4. Percentage of high-value assets that do not satisfy their allocated security requirements
5. Percentage of high-value services with controls that are ineffective or inadequate
6. Percentage of high-value assets with controls that are ineffective or inadequate
7. Confidence factor that all risks that need to be identified have been identified
8. Percentage of risks with impact above threshold
9. Probability of delivered service throughout a disruptive event
10.For disrupted, high-value services with a service continuity plan, percentage of services that did not deliver service as intended throughout the disruptive event
43

#RSAC
If These Don’t Work For You . . . Identify the high-level objectives for your security program
Define measures that demonstrate the extent to which objectives are (or are not) being met
Make sure the measures you are currently reporting support one or more objectives
If they don’t, ask “why not?” and “so what?”
Measuring “security hygiene” is necessary but not sufficient
Measurement is expensive; collect and report measures that inform decisions and affect behavior
44
Getting Started

#RSAC
To Get Started Identify sponsors and key stakeholders
Define security objectives and key questions
Determine information that informs these
What information do you already have?
What information do you need to collect?
What is the value of collecting additional information?
Define and vet a small number of key measures
Collect, analyze, report, refine
Put a measurement program in place
46

#RSAC
Set Up a Measurement Program
Define measurement objectives including
audiences and key stakeholders measures (5-10 based on the
measurement template) key roles to collect, analyze, and
report these measures data collection and storage methods
and tools analysis methods and procedures
Collect measurement data
Analyze measurement data
Store data and results in a secure manner
Report results
Start small data collection analysis procedures number of measures number of participating business
units
47

#RSAC
Measurement Template [refer to handout]
Measure name/ID Goal Question(s) Related processes & procedures Visual display Data input(s) (data elements, data type) Data collection (how, when, how often, by whom)
Data reporting (by, to whom, when, how often) Data storage (where, how, access control) Stakeholders (information owner(s), collector(s), customer(s)) Algorithm or formula Interpretation or expected value(s)
48
#RSAC
Questions
49
#RSAC
CERT-RMM Contacts Rich Caralli [email protected]
Nader Mehravari [email protected]
Lisa Young [email protected]
Julia Allen [email protected]
Richard Lynch Public Relations — All Media Inquiries [email protected]
Pamela Curtis [email protected]
Joe McLeod For info on working with us [email protected]
SEI Customer Relations [email protected] 412-268-5800
50

#RSAC
Resources – 1 Resilience Measurement SEI blog: Measures for Managing Operational Resilience http://blog.sei.cmu.edu/post.cfm/measures-for-managing-operational-resilience
CERT Podcast: Measuring Operational Resilience http://www.cert.org/podcast/show/20111004allen.html
CERT-RMM Measurement & Analysis website: http://www.cert.org/resilience/rma.html
[Allen 2011b] Allen, Julia; Curtis, Pamela; Gates, Linda. Using Defined Processes as a Context for Resilience Measures (CMU/SEI-2011-TN-029). Software Engineering Institute, Carnegie Mellon University, October 2011. http://www.sei.cmu.edu/library/abstracts/reports/11tn029.cfm
Allen, Julia & Curtis, Pamela. Measures for Managing Operational Resilience (CMU/SEI-2011-TR-019). Software Engineering Institute, Carnegie Mellon University, June 2011. http://www.sei.cmu.edu/library/abstracts/reports/11tr019.cfm
[Allen 2010] Allen, Julia & Davis, Noopur. Measuring Operational Resilience Using the CERT Resilience Management Model (CMU/SEI-2010-TN-030). Software Engineering Institute, Carnegie Mellon University, September 2010. http://www.sei.cmu.edu/library/abstracts/reports/10tn030.cfm
Hubbard, Douglas. How to Measure Anything. John Wiley & Sons, 2007. 51
#RSAC
Resources – 2 CERT-RMM
Caralli, Richard A.; Allen, Julia H.; White, David W. CERT® Resilience Management Model: A Maturity Model for Managing Operational Resilience. Addison-Wesley, 2011.
CERT-RMM website: http://www.cert.org/resilience/rmm.html
CERT Podcast Series: Security for Business Leaders, specifically podcasts on risk management & resilience: http://www.cert.org/podcast/
Allen, Julia & Young, Lisa. Report from the First CERT-RMM Users Group Workshop Series (CMU/SEI-2012-TN-008). Carnegie Mellon University: Software Engineering Institute, April 2012. http://www.sei.cmu.edu/library/abstracts/reports/12tn008.cfm
52
#RSAC
53
Copyright 2014 Carnegie Mellon University This material is based upon work funded and supported by the Department of Defense under Contract No. FA8721-05-C-0003 with Carnegie Mellon University for the operation of the Software Engineering Institute, a federally funded research and development center. Any opinions, findings and conclusions or recommendations expressed in this material are those of the author(s) and do not necessarily reflect the views of the United States Department of Defense. NO WARRANTY. THIS CARNEGIE MELLON UNIVERSITY AND SOFTWARE ENGINEERING INSTITUTE MATERIAL IS FURNISHED ON AN “AS-IS” BASIS. CARNEGIE MELLON UNIVERSITY MAKES NO WARRANTIES OF ANY KIND, EITHER EXPRESSED OR IMPLIED, AS TO ANY MATTER INCLUDING, BUT NOT LIMITED TO, WARRANTY OF FITNESS FOR PURPOSE OR MERCHANTABILITY, EXCLUSIVITY, OR RESULTS OBTAINED FROM USE OF THE MATERIAL. CARNEGIE MELLON UNIVERSITY DOES NOT MAKE ANY WARRANTY OF ANY KIND WITH RESPECT TO FREEDOM FROM PATENT, TRADEMARK, OR COPYRIGHT INFRINGEMENT. This material has been approved for public release and unlimited distribution. This material may be reproduced in its entirety, without modification, and freely distributed in written or electronic form without requesting formal permission. Permission is required for any other use. Requests for permission should be directed to the Software Engineering Institute at [email protected]. Carnegie Mellon® and CERT® are registered marks of Carnegie Mellon University. DM-0000848

#RSAC
54

© 2013 Carnegie Mellon University 1
RSA 2014 GRC-F01: Technical Metrics Aren’t Enough: 10 Strategic Security Measures
Security Measurement Template
Measure Name/ID Unique name or identifier for the measure. For example: Number of Security Requirements
Goal Statement of security goal. Goal should be connected to overall organizational strategic goals and critical success factors, organizational security goals, service security goals, and/or asset security goals.
Question(s) What question(s) is the measure intending to answer? For example: How many incidents occurred last quarter? The question should relate to the Goal.
Visual Display Graphical depiction of the measure. For example: trend over time, percentages, cumulative results, Pareto analysis, frequency diagrams, etc.
Data Input(s) Data Elements Data Type
Measure Name/ID and type (base or derived) of all input data elements used for this measure.
Data Collection How When/How Often By Whom
How the data will be collected (process), when and how often the data will be collected (event driven, periodic), and who will collect the data (people, tool). Refer to forms or standards if needed.
Data Reporting By/To Whom When/How Often
Identify the role that is responsible for reporting the measure. Identify for whom (role) the report is intended. This may be an individual role or an organizational unit.
Data Storage Where How Access Control
Identify where the data is to be stored. Identify the storage media, procedures, and tools for configuration control. Specify how access to this data is controlled.
Stakeholders Information Owner(s) Information Collector(s) Information Customer(s)
Who will use this measure? How? What are the roles? Asset owner, service owner, line of business manager, someone who heads up business continuity, steering group responsible for all aspects of security including security measurement. Consider stakeholders external to the organization.
Algorithm or Formula Specify the algorithm or formula required to combine data elements to create input values for the measure. It may be very simple, such as input1/input2 or it may be much more complex. The relationship between the algorithm and the visual display should be explained as well.
Interpretation or Expected Value(s)
Describe what different values of the measure mean. Make it clear how the measure answers the Question(s) above. Provide any important cautions about how the measure could be misinterpreted and actions to take to avoid misinterpretation. Provide guidance on how to interpret the measure and also what not to do with the measure. If the measure has a target value or range for success (meeting the goal), include this here.

© 2013 Carnegie Mellon University 2
Measure Example – Cost of Recurring Incidents with Known Solutions
Measure Name/ID Cost of recurring incidents
Goal In the face of realized risk, the security program ensures the continuity of essential operations of high-value services and associated assets.
Question(s) How many incidents with impact greater than X and with known solutions have recurred during the last reporting period?
Visual display
Data Input(s) Data Elements Data Type
Start date of last reporting period Base measure of type “schedule”
End date of last reporting period Base measure of type “schedule”
Number of recurring incidents during the last reporting period
Base measure of type “count”
Impact of each recurring incident (cost or effort)
Base measure of type “cost”
Impact threshold Base measure of type “cost” Data Collection How When/How Often By Whom
Information about an incident is collected throughout the incident management process, on an event-driven basis, by the organization’s service desks.
Information is reviewed either when the incident is closed or when the post-incident review is performed).
Impact threshold is established by the Chief Information Security Officer (CISO) and is informed by risk management.
Data Reporting By/To Whom When/How Often
Data is reported to CISO by Computer Security Incident Response Team (CSIRT).
Data is reported once per reporting period.
Data Storage Where How Access Control
Data is stored in incident knowledgebase. All incident report records contain cost information. All incident report records contain recurrence information. Everyone has read access to the incident report database. Only CSIRT has write access to the incident report database.
Stakeholders Information Owner(s) Information Customer(s)
The CISO is the owner of the incident knowledgebase. The CISO establishes the impact threshold. The CISO and senior management are the customers for this
information.
0%
20%
40%
60%
80%
100%
0
1
2
3
4
Frequency
Cost
Cost of Recurring Incidents
Frequency
Cumulative %
© 2013 Carnegie Mellon University 3
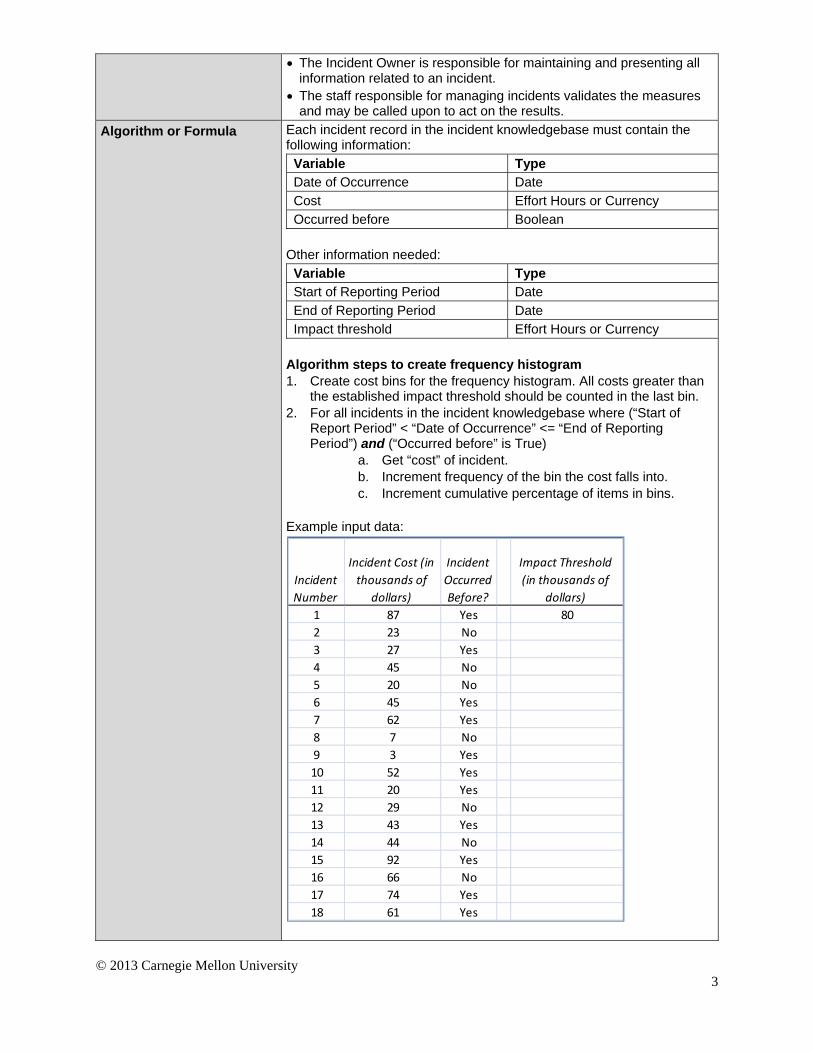
The Incident Owner is responsible for maintaining and presenting all information related to an incident.
The staff responsible for managing incidents validates the measures and may be called upon to act on the results.
Algorithm or Formula Each incident record in the incident knowledgebase must contain the following information:
Variable Type Date of Occurrence Date Cost Effort Hours or Currency Occurred before Boolean
Other information needed:
Variable Type Start of Reporting Period Date End of Reporting Period Date Impact threshold Effort Hours or Currency
Algorithm steps to create frequency histogram 1. Create cost bins for the frequency histogram. All costs greater than
the established impact threshold should be counted in the last bin. 2. For all incidents in the incident knowledgebase where (“Start of
Report Period” < “Date of Occurrence” <= “End of Reporting Period”) and (“Occurred before” is True)
a. Get “cost” of incident. b. Increment frequency of the bin the cost falls into. c. Increment cumulative percentage of items in bins.
Example input data:
Incident
Number
Incident Cost (in
thousands of
dollars)
Incident
Occurred
Before?
Impact Threshold
(in thousands of
dollars)
1 87 Yes 80
2 23 No
3 27 Yes
4 45 No
5 20 No
6 45 Yes
7 62 Yes
8 7 No
9 3 Yes
10 52 Yes
11 20 Yes
12 29 No
13 43 Yes
14 44 No
15 92 Yes
16 66 No
17 74 Yes
18 61 Yes

© 2013 Carnegie Mellon University 4
Example output data:
Plot Frequency and Cumulative % on the Y-axis, and Cost bins on the X-axis.
Interpretation or Expected Value(s)
All recurring incidents that cost more than the established organization threshold should be referred to the (business process that handles this). Any incident in the bin labeled above threshold is cause for concern. The heights of the bins represent the number of recurring incidents whose costs fall in that bin. Therefore, the higher the height of the last bin, the greater the concern.
Cost Frequency Cumulative %
<= 20 K 2 18.18%
<= 40 K 1 27.27%
<= 60 K 3 54.55%
<= 80 K 3 81.82%
More than threshold 2 100.00%

© 2013 Carnegie Mellon University 5
Measure Example – Confidence in Risk Identification
Measure Name/ID Confidence in risk identification
Goal The security program manages (identifies, analyzes, mitigates) operational risks to high-value assets that could adversely affect the operation and delivery of high-value services.
Question(s) Have risks from all sources been identified?
Visual display
Data Input(s) Data Elements Data Type
List of organizational units in enterprise
No data type: this is an attribute of the enterprise.
List of lines of business per organization
No data type: this is an attribute of the organization.
List of high-value assets N/A List of high-value services N/A List of risk sources N/A Start date of last reporting period
Base measure of type “schedule”
End date of last reporting period
Base measure of type “schedule”
Data Collection How When/How Often By Whom
List of organizations is collected from the enterprise organization chart.
List of lines of business per organization is collected from each organization’s organization chart.
List of high-value services is collected from the service repository. List of high-value assets is collected from the asset database. List of risk sources is predefined as failed internal processes,
inadvertent or deliberate actions of people, problems with systems and technology, and external events.
Data is collected by the security measurement group, once per reporting period.
Data Reporting By/To Whom When/How Often
Data is reported by the security measurement group to the CISO once per reporting period. The confidence factor report is generated by a report generation tool.
0%
20%
40%
60%
80%
100%
Organizations with defined risk parameters
Lines of business with risk parameters
inherited from
organization
Assets with associated services
Services with associated assets
Asset risks from all sources identified
Service risks from all sources identified
Plan
Actual

© 2013 Carnegie Mellon University 6
Data Storage Where How Access Control
The confidence factor reports are archived on the CISO SharePoint web site by the security measurement. Only this group has write access to the site. The CISO staff has read access.
Stakeholders Information Owner(s) Information Collector(s) Information Customer(s)
The information in the asset database is owned by the CISO. The information in the service repository is owned by the CISO. Organizational charts and lines of business charts are owned by HR. The CISO is the primary customer for this report.
Algorithm or Formula 3. Determine the percent of organizations with defined risk parameters (Percent_Orgs).
4. For each organization, identify lines of business. Determine the percent of lines of business with defined risk parameters inherited from parent organization (Percent_LOBs).
5. From the service repository, determine the percentage of services where risks have been identified from all four sources (Percent_Services).
6. From the asset database, determine the percentage of assets where risks have been identified from all four sources (Percent_Assets).
7. From the asset database and service repository, determine the percent of assets used by at least one service (Asset_Usage_By_Services), and the percent of services where all associated assets are in the asset database (Service_Usage_Of_Assets).
Confidence = Percent_Orgs * Percent_LOBs * Percent_Services * Percent_Assets * Asset_Usage_By_Services * Service_Usage_Of_Assets
Interpretation or Expected Value(s)
The goal is for the plan and actual axis on the radar plot to be as close as possible, to indicate the actual confidence level is close to the planned confidence level. Overall confidence factor can be determined by multiplying the actual percentage of each axis. A confidence factor of 100% means that all organizations in the enterprise have established risk parameters, that all lines of business in each organization have derived their own risk parameters from their parent organization, that risks from all sources have been identified for all services in the service repository, that risks from all sources have been identified for all assets in the asset database, that all services use assets defined in asset database, and that all assets in the asset database are used by at least one service. If there are other factors that should contribute to this measure, they can be easily added.
Allen, Julia & Davis, Noopur. Measuring Operational Resilience Using the CERT Resilience Management Model (CMU/SEI-2010-TN-030). Software Engineering Institute, Carnegie Mellon University, September 2010. http://www.sei.cmu.edu/library/abstracts/reports/10tn030.cfm