Technical Manual for Coastal Land Use Planning - NC Division of
163
Version 2.0 July 2002 Department of Environment and Natural Resources / William G. Ross Jr., Secretary State of North Carolina / Michael F. Easley, Governor William B. Farris, AICP Wilmington, N.C. Technical Manual for Coastal Land Use Planning A “How-To” Manual for Addressing the Coastal Resources Commission’s 2002 Land Use Planning Guidelines North Carolina Division of Coastal Management
Transcript of Technical Manual for Coastal Land Use Planning - NC Division of

Version 2.0 July 2002
Department of Environment and Natural Resources / William G. Ross Jr., Secretary State of North Carolina / Michael F. Easley, Governor
William B. Farris, AICP Wilmington, N.C.
Technical Manual for Coastal Land Use Planning
A “How-To” Manual for Addressing the Coastal Resources Commission’s 2002 Land Use Planning Guidelines
North Carolina Division of Coastal Management

FY02-03 i
TABLE OF CONTENTS Page OVERVIEW 1 PART ONE Planning process requirements 1.1 The Scoping Process – Pre-planning 3 1.2 Public Participation 5 1.2.1 What is required? 5 1.2.2 Designating the Lead Planning Group 6 1.2.3 Selecting Public Participation Tools and Techniques 8 1.2.4 Coordination with Management Topics 13 1.2.5 The Mandatory Public Hearing 13 1.3 Intergovernmental Coordination 14 PART TWO Introduction and plan organization 2.0 Community Concerns and Aspirations 15 2.1 Taking Stock – Description of Existing and Emerging Conditions 16 2.2 Key Planning Issues 17 2.3 The Vision Statement 19 3.0 Analysis of Existing and Emerging Conditions 21 3.1 Population, Housing, and Economy 21 3.1.1 Population, Housing, and Economic Base Data 22 3.1.2 Estimates and Projections 23 Permanent and Seasonal Population 23 Housing Stock 27 Local Economy 27 Population Projections and Forecasts 28 3.1.3 Description and Analysis of Data 29 3.2 Natural Systems Analysis 31 3.2.1 Mapping and Analysis of Natural Features 31
Analysis of Development Capabilities/Limitations 32 Natural Feature Mapping 35
3.2.2 The Composite Map 37 3.2.3 Assessment of Environmental Conditions 39

FY02-03 ii
3.3 Analysis of Land Use and Development 41 3.3.1 Existing land use 41 Required land use categories 41 Mapping requirements 42 Availability of GIS-based land records in Coastal Area 42
Issues with use of tax data 43 3.3.2 Coordination with Land Use Management Topics 43 3.3.3 Land Use and Development Analysis 44
Example of Existing Land Use Table 44 Land use and land use – water quality conflicts 45 3.3.4 Development Trends 45
3.3.5 Projections of Land Needs 47 3.4 Analysis of Community Facilities 49 3.4.1 Water Supply and Wastewater Treatment Facilities 49 3.4.2 Transportation Systems 51 3.4.3 Stormwater Systems 52 3.4.4 Management Topics and Future Land Use Map Requirements 53 3.4.5 Required Mapping 54 3.5 Land Suitability Analysis 55 3.5.1 Identifying Land Suitability Factors 56 3.5.2 Rating the Suitability Factors 57 3.5.3 Weighting the Factors 58 3.5.4 GIS-based Land Suitability Analysis Program 59 3.6 Review of Current CAMA Land Use Plan 61 4.0 Plan for the Future 62 4.1 Introduction 62 4.2 Management Topics – What are they and what do they require? 63 4.3 Guidelines for Developing the “Plan” 66 4.3.1 Setting Land Use and Development Goals 66 4.3.2 Formulating Land Use Policies 68 What is required? 69 4.3.3 Selecting the Land Classification Scheme 70 4.3.4 Designing the Future Land Use Map 72 4.3.5 Policy Checklist 73

FY02-03 iii
4.4 Conducting the Required Policy Analysis 76 4.4.1 Demonstrating Plan Consistency with Management Topics 76 4.4.2 Description of Analysis to Determine Impact on Management
Topics 77 5.0 Tools for Managing Development 80 5.1 Role of Land Use Policies and Future Land Use Map in Local Decision-making 80 5.2 Description of Existing Development Program 81 5.3 Description of Additional Implementation Tools 83 5.4 Content and Design of Action Plan/Schedule 84 Exhibit 1. Scoping Checklist 90 Exhibit 2. CAMA Land Use Plan Development Checklist 95 Appendix. Nonpoint Source Pollution Information for Coastal North Carolina Local Governments

FY02-03 1
Overview The N.C. Coastal Resources Commission (CRC) recently adopted revisions to the land use planning guidelines [15A NCAC 7B]. The new guidelines are less complicated than past planning guidelines, are better tailored to local governments’ needs, and are more in line with the goals of the Coastal Area Management Act, known as CAMA. The CRC sought to improve the quality of land use plans by establishing simple, clear elements, requiring more thorough analysis of land suitability and creating Management Topics to guide the development of local policies. The revised guidelines require more in-depth analysis of natural systems and land suitability, and they call for policies that address specific requirements of land use Management Topics. In addition, the Management Topics require more extensive policy analysis than has been general practice in the land use planning program. The North Carolina Division of Coastal Management (DCM) developed this Coastal Land Use Planning Technical Manual to aid local planners in addressing the requirements of the revised land use planning rules. The manual includes in-depth discussions of the various aspects of the new requirements and offers analytical approaches and suggested policy development processes for addressing the new planning requirements. The technical manual is not intended to be a substitute for understanding all of the planning requirements as they apply to the planner’s local government and its specific circumstances and planning needs. The manual does not create any planning requirements over and above those contained in 15A NCAC 7B. If there appear to be any inconsistencies between the manual and the planning guidelines, the guidelines take precedence. If there are questions, planners should seek guidance from the DCM District Planners. The manual is organized to address all of the elements of a local land use plan, as required in 15A NCAC 7B, and the relevant planning process requirements contained in 15A NCAC 7L. The major sections of the manual are shown below:
Part One - Planning Process Requirements (Focuses on the requirements for plans that receive financial assistance from the N.C. Department of Environment and Natural Resources)
Part Two - Elements of the Land Use Plan
Community Concerns and Aspirations Analysis of Existing and Emerging Conditions Plan for the Future Tools for Managing Development

FY02-03 2
The following diagram illustrates the various components of the manual and their relationship to the CAMA land use planning process.
Major Components of the "CAMA" Land Use Plan
Community Concerns and Aspirations
• Growth-related conditions
• Key issues
• Community vision
Plan for the Future
• Management topics
• Land use and development goals
• Policies • Future Land Use
Map
• Policy analysis
Analysis of Existing and Emerging
Conditions
• Population, housing, and economy
• Natural systems • Land use and
development
• Community facilities
• Land suitability
• Current plans
Pre-planning "Scoping" Process Public Participation
Process
Tools for Managing Development
• Existing development management program
• Additional implementation tools
• Action plan and schedule

FY02-03 3
1.0 Planning Process Requirements [7L .0505 and .0506]
1.1 The Scoping Process – Pre-planning The “7L” land use plan funding guidelines require local governments that intend to apply for funds from DENR for the development of their land use plan to conduct a “scoping process” prior to submitting the grant application [15A NCAC 7L.0506]. The purpose of scoping is to involve local staff and elected officials, stakeholders, and the Division of Coastal Management staff in tailoring the land use plan to address local growth and development issues.1 The entire process involves several steps:
1. Representative(s) of the local government and DCM staff hold a scoping meeting to review and decide on the extent of planning needs and the type of plan that is required to address these needs. This meeting is held before the grant application is submitted.
2. Local government staff, where possible, takes the lead role in presenting the results of the scoping meeting to the local governing board at a regular meeting. Standard meeting notifications are acceptable; however, the notice must specifically state that the “scoping recommendations (will) be discussed and acted upon.” In addition at this meeting, the local board must allow and consider public input on the scoping recommendations.
3. Local board may adopt or modify the recommendations at this meeting or a subsequent meeting.
The current DENR policy is to provide funds for development or update of land use plans every six years. The scoping process must be completed during the fourth year after the last certification. Under special circumstances, the policy does allow the local government to request scoping before the fourth year. These special circumstances – for example, a major industrial development or other development-generating activity – must be described in the Scoping Report. During the scoping meeting, at least seven community characteristics must be discussed and considered in determining the type of plan that the community will prepare:
1. Capacity of the local government to administer the planning process; 2. Population growth rate; 3. Development trends, such as number and type of building permits, number of lots
subdivided, number of CAMA permits issued, and so on; 1 Land Use Plan Review Team, Report to the Coastal Resources Commission, September 2000.
FY02-03 4
4. Extent of AECs; 5. Water quality considerations; 6. Natural and manmade hazard that may influence land use; and 7. Environmental constraints.
The local government has the latitude to address other issues in this process. The DCM uses a standard form to record the characteristics discussed and the recommendations of the scoping meeting. Exhibit 1 is a sample of this form. Not only is the scoping process useful in determining the type of plan that will be developed and the issues that it will address, it also provides excellent background on existing and emerging conditions and key issues that must be described in the land use plan [15A NCAC 07B .0702(b)].

FY02-03 5
1.2 Public Participation
The Coastal Resources Commission places major emphasis on supporting local efforts to involve citizens and property owners in the development and implementation of local land use plans. The overall goal is to involve as many citizens as possible in development of the plans, and thereby, to increase the likelihood that local land use plans will be implemented. Professional research underscores the important role that citizen participation plays in the development of quality plans and the success of their implementation. Citizen involvement in plan-making processes contributes to better plans and improves their prospects for implementation.2 Citizen participation has two essential and related components: information sharing between the local government, the state, and local residents; and the active engagement of citizens in the process of identifying land use issues, identifying and evaluating options, and formulating policies. 1.2.1 What is required? The public participation requirements for the state-funded CAMA Land Use Plan are contained in 15A NCAC Subchapter 7L, Local Planning and Management Grants. Only local governments that use “CAMA funds” to assist with preparation of the plan are required to develop a formal public participation program. The basic public participation requirement is for local governments to “employ a variety of educational efforts and participation techniques to assure that all socio-economic segments of the community and non-resident property owners have opportunities to participate during plan development” [15A NCAC 7L .0506 (a)]. Development and implementation of a Citizen Participation Plan (CP Plan) is the main tool to address the public participation requirement [15A NCAC 7L .0506(b)]. The CP Plan must include four major components: 1. Lead planning group. It must designate the local board or agency, local government
department, or specially appointed committee that is assigned, by the elected body, the lead role in preparing or updating the land use plan.
2. Initial public information meetings. An initial public information meeting is required. The CP Plan must set a specific date and time for the initial public
2 Raymond J. Burby, Making Plans that Matter: Citizen Involvement, Plan Quality, and Government Action, Department of City and Regional Planning, UNC-CH, Chapel Hill, NC, July 2001.

FY02-03 6
meeting(s) to inform citizens about the purpose of the CAMA land use plan and the steps that will be taken to prepare or update it. In addition, the plan must describe the tools that will be used to report planning progress to the public during plan preparation. Newspaper reports, newsletters, and public service announcements are three examples. More than one tool must be used.
• Public information meetings have special notice requirements – Two notices: − First not less than 30 days before the meeting; − Second not less than 10 days before the meeting. − Notices must be conveyed to the Coastal Resources Advisory Council
members and the appropriate DCM planner. The public must be given an opportunity to speak at these meetings.
3. Public participation tools. It must describe the methods and techniques that will be used to “solicit” public participation – examples are surveys, informational brochures, community outreach, and “town meetings.” The CP Plan must also describe the results that are expected from the methods and techniques that are used. In this instance, results may be interpreted to mean the citizen groups targeted and the major objectives, such as education, plan input and so on.
4. Meeting schedule. The plan must include a general outline of a meeting schedule of the lead planning group. This schedule may not initially include specific dates, but it should list the meetings and the major topics that are covered. For example, Meeting 1 – Organization and Overview of the Land Use Planning Process; Meeting 2 – Public Information Meeting; and so on.
Like any plan, you should monitor the CP plan to ensure that the tools and techniques are achieving the desired results. Are you achieving adequate participation and is the process meeting the objectives of the plan? If these questions indicate problems with the plan, you should take steps to make adjustments. These adjustments may include schedule changes, increasing emphasis on promotion, using new techniques, or incorporating entirely new CP tools. The major components of the CP Plan are discussed briefly below.
1.2.2 Designating the Lead Planning Group The guidelines do not specify either the type of agency that may be designated or the duties and responsibilities of the lead agency. The lead planning group may be any organization that best fits the local government’s needs and its planning process: an existing board or committee, such as the planning board, a governmental department, or a steering committee or task force appointed specifically to guide the CAMA land use planning process. Likewise, the local government is able to assign the group any duties
FY02-03 7
and responsibilities that are necessary to accomplish its goals for the land use planning process. You should consider several factors in deciding on a lead group. These factors include:
− capability and workloads of existing organizations; − degree to which an existing board's membership represents the most important
interests to be involved in the planning process; − difficulty that the local government may have in recruiting volunteers to serve
on boards; − role that the lead group will play in the citizen participation process; − resources that are available to support the organization; and − familiarity with local land use issues.
Planning boards may not have sufficient time to devote to overseeing the land use planning process. Their agendas may be crowded. Many planning boards have full agendas and have difficulty allocating the additional time required for the land use plan. Recruitment for advisory committees can be a major issue in smaller jurisdictions. And finally, resources may not be available to support an additional planning group in the community – separate meetings, agendas, minutes, advertisements, and so on. If the elected body appoints a separate committee to serve as the lead planning organization, the committee will be subject to the state Open Meetings Law just like the planning board or other standing committee. The city or county clerk can help make sure that the meeting notices comply with the law. Advisory committees. An advisory or steering committee appointed specifically to guide the land use planning process is a useful tool that may further your CP program and assist you in managing the land use planning process. Many communities have used steering committees in the development of their coastal land use plans. Steering committees can serve several planning functions:
− They can provide a gauge of the community’s feelings about planning issues and policies.
− They can provide valuable planning support through ideas and expertise on issues, concerns, and solutions.
− They may provide advice that is perceived as impartial on controversial issues.
If a steering committee is used as the lead planning group, then you should carefully define the role that the committee will play in the planning process. Definition of duties and responsibilities will help ensure that the committee stays on task, that members will

FY02-03 8
be fully aware of what is expected of them, and that the planning process will stay on schedule. An outline of duties and responsibilities from the Wilmington-New Hanover Land Use Plan is shown below.
1.2.3 Selecting Public Participation Methods and Techniques What are your objectives? Each community’s CP objectives are different in some respects. However, there are themes, either stated or implied, that are common to most CP programs. The four themes, which are presented below, can provide the initial base for defining more specific community objectives.
1. Education - improving stakeholders’ understanding of the impact that land use and development issues have on their quality of life and increasing the community’s understanding of CAMA and the land use planning process.
ROLE OF THE STEERING COMMITTEE
ù UNIQUE PERSPECTIVE You represent a unique local viewpoint from within the community; members know the area well, its people and its resources. You have a feeling for what may work and what may not.
ù PLAN DEVELOPMENT You should provide community perspective and insight on information gathered as well as feedback on policies and implementation actions as they are developed. In so doing, you will play a critical role in shaping the specific policies and actions that will lead our area into the 21st Century. At the same time, you are not being asked to be a planner, designer, or writer; you are to be a sounding board for citizens and property owners.
ù NETWORKING, RECRUITMENT, AND PUBLIC PARTICIPATION You know others who have a keen interest in the future of our city and county. These others may include friends, neighbors, business associates, or others in positions of interest and influence. By inviting these individuals to participate in the planning process, you can help make sure that all viewpoints within the community are embodied within the plan.
ù PUBLIC MEETING SUPPORT During the course of the project, you may be asked to help out during public meetings. Specific roles will be discussed and agreed upon before each meeting and may include: greeting/signing people in, facilitating small groups discussions, summarizing meeting results, and so on.
ù PLAN PRESENTATION AND RECOMMENDATION At the conclusion of the planning process, you will be asked to participate in the presentation of the plan to the City Council and County Commissioners for their preliminary approval and final adoption.
Adapted from Wilmington-New Hanover County Comprehensive Plan
1998

FY02-03 9
2. Listening - improving the local planning team’s understanding of the values of the community’s stakeholders, the issues that are important to them, and how stakeholders perceive that the land use plan will affect them.
3. Collaboration – creating opportunities for working with stakeholders to identify alternative plan solutions, to identify the impacts of favored solutions on stakeholders, and to work toward community consensus.
4. Support – creating a base of support in the community for implementation of the policies and programs embodied in the plan.
Some participation methods and techniques are better suited for these objectives than others Who needs to be involved? Identifying community interests, or stakeholders, to be involved is an essential part of selecting public participation methods and techniques. Geography is one important basis for identifying community stakeholders because people who live in the same area tend to share similar views on many land use and development issues. However, to meet the broad participation goal of the planning guidelines, your definition of community stakeholders should go beyond geography to include any individual, group, or entity that is potentially affected by the plan or that can have a significant impact on whether the plan is implemented. By spending a short time brainstorming, a long list of potential community stakeholders can be identified. Worksheet # 1 shows examples of stakeholders that can be identified. You will need to narrow the list of potential stakeholders to a group of the most important to keep the CP process manageable. Judgments that separate the “essential few” from the “important many” are useful in determining the most important interests. At the same time, no individual group should be excluded.
Matching CP methods and techniques. Determining the best tools to use in your planning program involves simple questions about meeting objectives, the special needs of any stakeholder groups, and the resources available to employ the tool(s) in your planning program. Common types of CP tools and their strengths and weaknesses are briefly described below. This list is not intended to be exhaustive. It also is not intended to provide detailed information on how to deploy these tools. You may want to modify or combine
Stakeholder Identification
• What individuals, groups, or organizations are affected either directly or indirectly by the land use plan?
• Are there individuals or organizations, such as state and federal agencies, that are not affected by the plan but that control resources that may be used to implement it?
• Are there individuals or groups that appear not to be affected but want to be involved, or for some other reason should be involved?

FY02-03 10
elements of these tools, or identify additional tools to meet your community’s goals and objectives.
1. Community forum
The community forum is most effective as a tool for listening to the community, even though it has some education benefits as well. Typically, forums are organized at the beginning of a planning process. Properly advertised and conducted, the forum can be a very effective tool that provides a wide range of individuals and groups with an opportunity to express their views on land use and development issues and the land use plan, and to learn about the views of others. Forums are not designed for debate, for negotiation, or for decision-making.
2. Open house
An open house is normally scheduled near the end of the planning process or after planning materials, such as maps and policies, are available for review by the public. It is designed to provide an opportunity for community interests to express their views and concerns on what is being proposed. It provides an informal setting where stakeholders can examine land use plan work products and interact with the lay and professional members of the planning team.
3. Facilitated town meeting
The facilitated town meeting is designed to help community interests identify a very broad range of the community’s land use and development issues and to generate a single list of priority issues about which there is a high level of agreement. It is a very effective tool that can generate enthusiasm and support for the land use plan. Town meetings generally have two parts. Part one introduces the participants to background information on land use and development trends and the land use planning process. Part two is a structured process that focuses on the generation of ideas about issues and concerns and on gaining agreement on a single list of priorities.
Assessment Questions • What are the strengths and weaknesses of
the tools? Which of the tools best meet our CP objectives?
• Will our resource constraints - time, money, staff, facilities, etc. - limit use of any of the tools?
• Are any special efforts required for a particular stakeholder?

FY02-03 11
4. Charrette
A charrette is a workshop in which the planning team, citizens, and public officials work together to identify land use and development concerns and to develop initial strategies to address them. Charrettes are very effective tools that encourage identification of a broad range of concerns and issues and collaboration on creative solutions. The sketch plan generated by the charrette is the foundation for a more formal land use plan. The charrette process includes some elements of a facilitated town meeting, but the charrette differs from the town meeting in that its output includes initial plan strategies to address the community's priority land use issues. Charrettes require the involvement of trained facilitators, a very high level of staff time, a significant commitment of time by participants, and a significant expenditure of funds for promotion and support. A guide to organizing and conducting charrettes, A Neighborhood Charrette Handbook, is available from the U.S. Department of Energy.
5. Focus groups
A focus group is “a planned, focused discussion involving a small group of people and facilitated by an interviewer.”3 It is a planning tool that is very effective for preliminary assessments of opinions and attitudes about land use and development issues. It also has a role in evaluating strategies that are being considered for the land use plan. Often, focus groups are coupled with other CP techniques. For example, focus groups may be used to identify preliminary issues to be addressed in a charrette.
Planners are cautioned that a focus group is not a quantitative research method and that it cannot be used as a substitute for a survey. The focus group is a qualitative research tool.
6. Surveys4
Surveys can be an effective tool for “listening” to the community and collecting data on community opinions on land use and development issues and concerns. Surveys also can be a useful way to involve the community in evaluating the
3 Judith S. Simon, Conducting Successful Focus Groups, Amherst H. Wilder Foundation, St. Paul, MN, 1999, pg. 5. 4 Priscilla Salant and Don A Dillman, How to Conduct Your Own Survey, John Wiley and Son, New York, 1994.

FY02-03 12
effectiveness of existing land use plans and development policies. They are not as effective as other tools in creating community support for the planning program. Mail surveys are a frequent component of coastal land use planning processes. Mail surveys offer several advantages: lower overall expense, easy techniques to reduce sampling error, and they offer respondents a sense of privacy. At the same time, they have some weaknesses: Mailing lists are typically incomplete; some people are less likely to respond than others – they may not be interested, some citizens have poor reading skills; slow response rates and low overall return rates. Overall, mail surveys may be a reasonable choice for land use plans. They fit the resources that are available, mailing lists are more reliable, and turn-around time is not crucial. However, the Institute for Participatory Management and Planning (IPMP) recommends that “if (the results) of the survey will affect people’s lives in a very major way, then people who are recognized experts in survey research should conduct the survey.”
7. Media releases and newsletters
The planning team has the responsibility to keep the community informed about the progress of the land use planning program and the issues and concerns that it addresses. Newspapers, radio, and TV can be effective partners in addressing this need. However, in all likelihood, planners will be required to prepare materials for release to these outlets.
Table 1.2.1
Summary of CP Tools and Techniques
C
P O
bjec
tive
s
E
duca
tion
L
iste
ning
C
olla
bora
tion
Su
ppor
t
CP Tools and Techniques
Support for Objectives
Community Forum ü ü+
Open House ü ü
Facilitated Town Meeting ü ü+ ü
Advisory or Steering Committee
ü ü ü ü
Media Releases and Newsletters
ü
Speakers Bureaus ü ü(-)

FY02-03 13
C
P O
bjec
tive
s
E
duca
tion
L
iste
ning
C
olla
bora
tion
Su
ppor
t
CP Tools and Techniques
Support for Objectives
Charrette ü ü+ ü
Surveys and Questionnaires ü(-)
Focus Groups ü
1.2.4 Coordination with Management Topics Section .0702(d)(3) [15A NCAC 7B] of the planning guidelines requires the local government to develop policies that address six land use plan Management Topics: (1) public access, (2) land use compatibility, (3) infrastructure carrying capacity, (4) natural hazard areas, (5) water quality, and (6) other topics that address specific local concerns. The public participation process is an opportunity to identify citizen issues and concerns in these policy areas. For example, input on the Management Topics can be part of a citizen survey or part of the agenda at a town meeting. Citizens views can help the planning team identify specific issues, local priorities, and appropriate local policies to address the topics. 1.2.5 The Mandatory Public Hearing The CAMA funding guidelines require the local government to hold an advertised public hearing prior to adoption of an initial or updated land use plan. You must place a notice in the newspaper at least twice during the 30-day period prior to the hearing (1st notice not less than 30 days prior and 2nd notice not less than 10 days). In addition, you must place a notice on the local government’s principal bulletin board at least 30 days prior to the hearing* (7L .0801). You should check 7L .0510 and G.S. 133A-110 for specific notice requirements. The public hearing generally is not seen as an effective CP tool. Howver, the hearing gives stakeholders who have been involved in the process an opportunity to make official comments for the public record. It also is a fail-safe measure that ensures stakeholders who have not been involved an opportunity to express their views on the plan.
* If the community does not receive a planning assistance grant, then only one public hearing notice is required.

FY02-03 14
There are some measures that can be taken to improve the effectiveness of the hearing:
• Make sure that all stakeholders who have been involved are invited to attend and make brief presentations.
• Let the stakeholders know what will be presented. • Recruit the chair and other lead organization members to make the
presentation. • Include a detailed description of the CP process in the presentation and
background information on CAMA and the land use plan. IPMP suggests a pre-public hearing to give the planning team an opportunity to identify any issues that need to be resolved before the final public hearing.5
1.3 Intergovernmental Coordination The 7L LUP funding rules require local governments to work not only with citizens, but also to consult with other jurisdictions in preparing and implementing their plans. At a minimum, intergovernmental coordination involves a formal exchange of draft plans with adjacent jurisdictions, allowing for at least a 45-day review period. In the planning process, there may be legitimate conflicts between local governments in your region related to different responsibilities, constituencies, and viewpoints. You are encouraged to develop planning mechanisms to address these issues.
5 Institute for Participatory Management and Planning, Citizen Participation Handbook, pg. V-1E-2.

FY02-03 15
2.0 Community Concerns and Aspirations [7B .0702 (b)]
The role of the Community Concerns and Aspirations element is to provide overall guidance and direction for the development of the land use plan. The creation of a vision statement is a major requirement of this element. The vision depicts in words and images what the local government is striving to become and serves as the starting point for the creation and implementation of the local land use plan. It is built on general technical information on trends and driving forces that will affect the planning area during the planning period and the concerns, opinions, and values identified by the stakeholders and citizens through the citizen participation process. “Good” vision statements blend priority issues, driving forces, citizen values, and the preferences of the local government. The vision provides what the American Planning Association calls a “big picture view” that guides the development of the planning information base, short-term and long-term policies, the land use plan map, and the plan’s implementation strategy. The “concerns and aspirations” element is also one of the points where the local government’s citizen participation process is directly linked to the land use planning process. The citizen participation plan, described in Section 1.2 [15A NCAC 7L .0506(b)], should clearly anticipate how stakeholders will be engaged in the “visioning process.”6 The specific requirements for addressing Community Concerns and Aspirations are outlined below:
(1) Existing and emerging conditions as identified by the local government. The plan shall include a description of dominant growth-related conditions that influence land use, development, water quality, and other environmental concerns in the planning area.
(2) Key issues. The plan shall include a description of the land use and development topics important to the future of the planning area. At a minimum, this description shall include public access, land use compatibility, infrastructure carrying capacity, natural hazard areas, water quality, and local areas of concern.
(3) Community vision. This shall consist of a description of the general physical appearance and form that represents the citizens’ plan for the future. The community vision shall include statements of general objectives to be achieved by the plan. These objectives will serve as the foundation for more specific
6 The Oregon Model defines visioning as a process that allows local government to gain a better understanding of the values of its citizens, identify trends and forces that will affect the community, articulate a big-picture view to guide decisions, and develop tools to achieve its vision. (A Guide to Community Visioning, Oregon Chapter, American Planning Association, 1993.)

FY02-03 16
objectives and policies stated elsewhere in the CAMA Land Use Plan. These objectives shall include changes that the citizens feel are needed to achieve the planning vision.
More details on these plan components are provided below.
2.1 Taking Stock – Description of Existing and Emerging Conditions
The description of existing and emerging conditions is meant only to provide background and context for identification of planning issues and development of a vision statement. It is not a substitute for the more thorough factual and analytical base as required in Analysis of Existing and Emerging Conditions [.0702(c)]. This component is meant to be similar to the “environmental scans” that are undertaken in strategic planning processes. It should address broad themes and trends related to growth and development, environmental quality, and economic health, and it may incorporate information and opinions from a variety of sources. Examples of sources of information and opinions include the pre-planning scoping session, existing reports and surveys, and input from the local government – elected officials and staff, planning board, and the lead planning group. The description also covers trends in the surrounding region, as well as the planning area. Often, a draft description of existing and emerging conditions is presented to stakeholders at the outset of the citizen participation process. Citizens may have comments on the accuracy and validity of some of the information. These comments are considered before the draft is finalized. Each community and planning area is different; however, the worksheet in Table 2.1 is a starting point for identifying existing and emerging conditions. Some of the trends shown in the worksheet may not apply; others may be added.
Table 2.1 Worksheet for Identifying
Existing and Emerging Conditions Driving Forces and
Trends Affecting the Planning Area
Planning Area Surrounding
Region
Population changes Housing trends (types, location, existing conditions)
Land Ddevelopment

FY02-03 17
Driving Forces and Trends Affecting the
Planning Area Planning Area
Surrounding Region
Water quality Economic conditions (macro trends for major business sectors)
Agriculture, forestry, and other natural resource-related industries
Business activities (new businesses, expansions, employer losses)
Transportation (new facilities, upgrades, new modes)
Water and sewer services (expansions, capacity issues, operation problems, etc.)
Public policies (zoning, buffers, Phase II Stormwater, etc.)
Safety (personal, property, etc.)
Other:
2.2 Key Planning Issues*
The guidelines require a description of issues in terms of the CRC’s major Management Topics: public access, land use compatibility, infrastructure carrying capacity, natural hazard areas, water quality, and other growth and development issues of local concern. Issues may include problems and assets. Problems are clear statements of undesirable situations or obstacles that may be addressed by the land use plan. Problem statements are not intended to state or imply solutions; that comes later in the planning process. Assets, on the other hand, are opportunities or resources that can be deployed by the plan to help create the community’s desired future. Some examples of possible assets are community facilities
* “SWOT” analysis – Strengths-Weaknesses-Opportunities-Threats – is a strategic planning tool often used to identify key issues.
Problem statements should focus on the effect – what is wrong not why; they should avoid “lack of” statements; they should be as specific as possible.

FY02-03 18
and services, public policies and programs, unique natural areas or resources, strategically located vacant or underutilized land, protected open space, and educational programs and partnerships. In most communities, the citizen participation process is the major tool for identifying problems and assets. However, other sources of information on problems and assets should not be overlooked. The following may provide additional perspectives on community problems and assets:
• The scoping process and resulting report; • Meetings with the elected board at the beginning of the planning process; • Discussions with the planning board and the lead planning group; and • Possible targeted interviews with appropriate individuals and stakeholder
groups, such as local government staff, real estate professionals, and environmental professionals
Table 2.2 is a worksheet that may assist the local planning team with identifying and describing land use and development issues.
Table 2.2 Worksheet for Identifying Assets and Problems
Management Topics
Planning Area Problems State problems or obstacles that will prevent the local government from addressing the goals in each topic.
Planning Area Assets Describe features, facilities, organizations and programs that may be available to assist the local government in addressing the goal(s) in each topic.
Public Access Maximize access to beach and public trust waters
Land Use Compatibility Ensure that development and use of land resources is consistent with capability of the land
Infrastructure Carrying Capacity
Ensure that public infrastructure systems (size, location, and management) protect or restore quality of AECs and other fragile

FY02-03 19
areas Natural Hazard Areas
Conserve protective functions of barrier dunes, beaches, flood plains, and other coastal features
Water Quality Maintain, protect, and restore quality of coastal waters
Areas of Local Concern (list topic and local management goal)
1. 2.
2.3 The Vision Statement7 The required vision statement has two main planning purposes. It provides a foundation for setting priorities, defining goals, and developing land use policies to achieve them. It also allows the community to build consensus among its various stakeholders on a unified approach to its land use and development issues. There is a good deal of flexibility in the structure and content of the vision statement. There are no accepted rules. However, there are some guidelines for writing effective vision statements:
• Don’t try to predict what the community will look like in the future. Use information on the community’s driving forces, priority issues, and citizen values and aspirations to describe what the community should look like in the future.
• The community vision should be written in positive terms and in the present tense as if it is a current description of the planning area.
• The vision should include clear descriptions of how the planning area will look in the future. The “pictures” should include key land use and planning elements but they can also include other elements that are important to the community. Think about priority issues. How will the community look when these issues are addressed?
7 The Oregon Model defines visioning as a process that allows local government to gain a better understanding of the values of its citizens, identify trends and forces that affect the community, articulate a big-picture view to guide decisions, and develop tools to achieve its vision. (A Guide to Community Visioning, Oregon Chapter, American Planning Association, 1993.)
FY02-03 20
• The vision statement should not be time-bound. It should extend beyond the horizon of the land use plan.
• Vision statements don’t need to be lengthy, but make sure that they contain enough detail to provide a foundation for goals and policies. Avoid slogans.
• Tailor the vision statement to the community. The overall objective is to develop a vision (1) that describes what the community wants to be and how it wants to look in the future and (2) that has a high level of community consensus. Because of the important role that the vision statement plays in development of the plan, it should be endorsed or adopted by the elected body at an early point in the planning process.

FY02-03 21
3.0 Analysis of Trends and Emerging Conditions [7B .0702(c)]
3.1 Population, Housing, and Economy Overview. Information on the planning area’s population, economy, and housing is one of four required components of the Analysis of Existing and Emerging Conditions plan element. Current population size, both permanent and seasonal, and the degree to which it will change during the planning period determines the amount of land that should be allocated for future uses and the related pressure that may be expected on coastal resources. Demands placed on community infrastructure are directly related to population changes. Population trend analysis can help identify growth areas. Population characteristics, such as age and income, help planners estimate requirements for different types of housing and related land uses and special needs of the community. Information on the planning area’s housing stock and key data related to households provide the foundation for determining future housing requirements. This information provides insight on household size, the types of housing units that will be required, and the number of owners and renters, which are all related to future development policies. Trends in the local economy are directly tied to changes in the planning area’s population. Most planners believe that changes in the local economy drive population changes. However, for purposes of the CAMA land use plan, the local economic analysis focuses on a description of major employment sectors and business activity trends and no employment projections are required. The planning guidelines require planners to analyze very basic data and trends. At the local government’s option, the land use plan may include more detailed information to address specific local land use and development situations. The guidelines are flexible in terms of the sources of information that may be used for the analysis. The best data available from federal, state, and local sources may be used. What is required? The planning guidelines require very basic analysis of the planning area’s population, its housing characteristics, and the local economy. In addition, they require short-term and long-term

FY02-03 22
projections of the planning area’s permanent and seasonal population. The specific planning requirements are outlined as follows: 1. Population analysis. The plan must include a description and analysis of the planning area
population that addresses three major components: changes in the total permanent population for the period covered by the two most recent decennial censuses; a current estimate of the population, broken down into permanent and seasonal; and an analysis of the permanent population age and income characteristics. The basic thrust of this analysis should be on factors that affect land use and development in the planning area.
2. Housing stock. This part of the analysis must include an estimate of the total number of existing housing units and a breakdown of seasonal and permanent units, rental and owner units, and the number of single-family, multifamily, and manufactured housing units. This is a very basic analysis, and the local government may wish to expand on it in order to address local concerns.
In addition, there is a requirement to analyze the number of residential building permits, by type of unit, issued since the last plan update. (If there has been a census since the last update, it should provide the best base information for the analysis.) This analysis addresses the number of permits and the types of units. (Please see [.0702(c)(3)(ii)(IV)] for requirement to analyze the location of development.)
3. Local economy. The requirement for this analysis addresses only employment by the major industrial sectors and a description of economic activity in the community.
4. Projections. The plan must include population projections for both short-term (10 years) and long-term (20 years) time frames. As discussed below, these population projections are an essential part of the analysis because they are used as the base to estimate future land needs.
The major focus of the discussion that follows is on readily available sources of information to address the requirements, consistent approaches to making population estimates, and acceptable methods for making projections and forecasts. 3.1.1 Population, Housing, and Economic Base Data LINC, State Data Center, and other state agencies. Table 3.1, located at the end of the section, summarizes the population, housing, and economic data that must be analyzed and described in the land use plan, and it suggests sources that planners may use to collect the required information. As shown in the table, the bulk of data is available online. LINC8, which is a database supported by the Data Center, and the N.C. State Data Center are two key sources. LINC contains reasonably up-to-date data, current and historical, primarily from the census
8 Log Into North Carolina

FY02-03 23
products and the Bureau of Economic Analysis. Depending on the source, LINC data may be available for several geographic areas: counties, townships, municipalities, and census tracts. The N.C. Department of Labor (DOL), the Employment Security Commission (ESC), and the N.C. Department of Revenue (DOR) also provide useful planning data online. The DOL provides annual building permit data for counties; the ESC provides annual and quarterly estimates of employment and wages by major industrial sector for counties; and the DOR provides data on gross retail sales for counties and for municipalities with populations greater than 5,000. ArcData Online. Census TIGER files, both geography and data, are available from Environmental Systems Research Institute Inc.’s (ESRI) ArcData Online web page. ArcView shapefiles provide geography on counties, municipalities, census tracts, and census blocks. Related database files contain 1990 and some 2000 census data on total population, population composition, housing, and household income. This service is free. These sources may be supplemented by reports from the U.S. Census and local sources, such as property tax records, water sales records, sales of privilege licenses, Powell Bill reports (municipalities) and data from public utilities. In addition, plans for municipal planning areas should carefully consider annexation plans for areas annexed since the last census.
3.1.2 Estimates and Projections Permanent and seasonal population The guidelines require estimates and projections of permanent and seasonal population. Persons
who usually reside in the planning area compose the permanent population; persons who are temporarily residing in the planning area, such as tourists and vacationers, but who normally reside in another location make up the seasonal population. Some communities find it useful to include estimates of the number of “day-trippers” who visit for recreational activities, such as
DEFINITIONS Permanent population. Persons who usually reside in the planning area. Seasonal population. Persons who are temporarily residing in the planning area, such as tourists and vacationers, but who normally reside in another location. Some estimates include “day-trippers.” Peak population. Permanent plus seasonal population and is an approximation of the planning area’s population on a “typical” day during the tourist season.

FY02-03 24
swimming, fishing, or golfing, in the calculation of seasonal population. Peak population includes permanent and seasonal population and is an approximation of the planning area’s population on a “typical” day during the tourist season. Seasonal population can also be converted to an equivalent permanent population to approximate the area’s population on a “typical” day throughout the year. Estimates of current population are provided by the State Data Center for counties and municipalities. Local governments will need to adjust these estimates to reflect the geographic area covered in their planning jurisdiction. For counties this may require adjusting the estimate downward to reflect municipal planning jurisdictions. On the other hand, it may be necessary for municipalities to increase the Data Center estimates to reflect an extra-territorial planning jurisdiction. Population statistics on census tracts are frequently used to make these adjustments. Estimating seasonal population. Two basic approaches are typically used to estimate and project seasonal population. The simplest approach is to apply a seasonal to permanent population ratio, which is often derived from the percentage of seasonal housing units, to estimate seasonal population. The Brunswick County Land Use Plan, for example, estimates that the seasonal to permanent population is 3:1. A second approach uses assumptions about the number of visitors that occupy different types of accommodations during the tourism season to develop estimates of seasonal population. The Long Beach Land Use Plan uses the following assumptions to estimate seasonal population: Type of accommodation Persons per unit Vacation cottage 6.5 Motel rooms 3.5 Campsites 3.0 Transient marina slips 3.0 This approach requires you to develop specific information from the land use survey or other local sources on the number of seasonal units in each category. The “persons per unit” information shown above should be verified for your community before it is used. For communities with water systems, comparison of “normal” water consumption with peak-season water use is a good way to check the reasonableness of the seasonal population estimates.

FY02-03 25
Table 3.1 Population, Housing, and Economy
Suggested Information Sources Geographic Area
Required Data and Analysis Description of Data and Information Sources County Municipality
Census Tract or Block
Group Total population (most recent two decennial censuses)
1990 2000 Percent change
1. LINC 2. N.C. State Demographics (State Demographics) web site
(www.demog.state.nc.us)
ü ü
ü ü
ü x
Current population estimate
Permanent
State Demographics web site (estimates generally for previous year) ü ü x
Seasonal No published estimates. Must be prepared by local government. x x x Population characteristics
Age LINC. Age cohort and median age ü ü x Income LINC.
Census – per capita income, median family income, and family income distribution Bureau of Economic Analysis (BEA) – annual estimates total and per capita income. May vary from census due to definitions.
ü ü
ü x
x x
Population projections and forecasts
Permanent population
State Demographics web site. 20 years at 10-year and 1-year intervals.
ü x x
Seasonal population No official projections published. x x x Housing stock
Estimate of current stock
Permanent Seasonal
Tenure Unit types Single-family
LINC. Census data on all factors except multifamily units. Multifamily may be obtained from Census of Housing.
ü ü ü

FY02-03 26
Multifamily Manufactured homes
Building permits 1. NC Department of Labor web site
(www.dol.state.nc.us/stats/const.htm) link to Annual Report on Residential Building Permits by county. Does not list manufactured home permits.
2. U.S. Census Bureau’s web site(www.census.gov/const/) link to permit data. Available counties, unincorporated areas, and most municipalities.
ü ü
x ü
x x
Local economy Employment by major
industrial sector
1. N.C. Employment Security Commission’s web site
(www.esc.state.nc.us/ ). Annual and quarterly employment and wage data by sector. Annual estimates 1994 to present. (Place of work)
2. LINC. BEA annual estimates of employment by major sector. Ten year trend. (Place of work)
3. COUNTY BUSINESS PATTERNS. Number of establishments, number of employees, and number of establishments by size to 2-digit SIC/NAICS. 1977-97 SIC; 1998 NAICS. (www.fisher.lib.virginia.edu/cbp/)
4. ECONOMIC CENSUS. Similar to County Business Patterns but provides data for municipalities with populations greater than 2,500. (www.census.gov)
ü ü ü ü
x x x ü
x x x x
Description of local business activity
1. LINC. Number of business establishments; total receipts by type of establishment; building costs.
2. N.C. Department of Revenue web site (www.dor.state.nc.us/publications/fiscalyearsales.html) link to “Sales and Use Tax Reports by Fiscal Year.” Gross retail sales by major business groups for counties and gross retail sales for municipalities greater than 5,000. Covers 1997-98 to present.
ü ü
ü (greater than
2500) ü
(greater than 5000)
x x

FY02-03 27
Housing stock Estimates of the existing housing stock and its characteristics – tenure and types of units – are generally derived from Census of Housing data adjusted for construction and demolition since the last census. Generally, information on the number of permits issued for different types of residential units can be obtained from the sources listed in Table 3.1 or from the local building inspectors. Records do not normally indicate whether new housing units are seasonal or whether they are built for owners or renters. However, building inspectors generally can provide reasonable estimates of the percentage of new units that are owner and renter and that are seasonal or permanent. Local economy The guidelines require local governments to analyze the planning area’s employment by major business category (industrial sector) and to describe local business activity. Developing statistics to meet this requirement for municipal planning areas may be a challenge. For the purposes of land use planning, “place of work” employment statistics are more useful than “place of residence” statistics. A variety of sources report “place of work” statistics at the county level. These reports include the number of business establishments by major category, employment, and wages. However, similar statistics are not as readily available for municipalities or census tracts, particularly for smaller municipalities with populations less than 2,500. To address the need for municipal statistics, it may be necessary to adjust county-level statistics to reflect municipal employment by major industry or business group. Retail sales data may be one way to make this adjustment. A municipality’s percentage of county retail sales may be a guide to allocating employment between the county and the
Comparison of Peak and Normal Water Usage
0.0
200.0
400.0
600.0
800.0
1000.0
1200.0
1400.0
1993 1994 1995 1996 1997
Year
Ave
rag
e g
allo
ns
per
day
(0
00)
Off-season
Peak season

FY02-03 28
municipality. Property tax records may be another source of information. The distribution of industrial and business land uses between the county and a municipality may be used to adjust employment data. In many areas, records of privilege license sales can provide a basis for adjusting county employment statistics. Local Chambers of Commerce, COGs, and the state economic development regions can provide reports and anecdotal information on local business activity. This information can include business losses, new businesses, and expansions, as well as major new investments in infrastructure or training that will impact business activity during the planning period. Population projections and forecasts The guidelines require local governments to base their plans on short-term (5- and 10- year) and long-term (20-year) population projections broken down into 5-year increments. The State Data Center (SDC) provides 10- and 20-year population projections using a cohort-component approach. These projections cover the state and the counties. Official projections are not available for municipalities or other sub-county geographic areas. Local governments will need to adjust the projections from the SDC to reflect the geographic extent of their planning area and any economic development trends that may not be incorporated into the SDC projections. All small-area population methods have limitations. However, a simple ratio approach is generally satisfactory for developing projections for “sub-county” planning areas. For this approach, the local government estimates its planning area’s share of the population of a larger area – the state or county – and applies this share to an independently developed projection. It involves three simple steps:
1. Calculate the planning area’s share (percent) of the population of a larger area for which independent projections are available (state, county, or region).
2. Project the planning area’s share to the required planning horizon (20 years in 5-year increments).
3. Apply the estimated share to the projections for the larger area.

FY02-03 29
Local governments should exercise care to ensure that estimates of the planning area’s population share do not result in unreasonable population growth or decline. The SDC projections and the techniques for adjusting these projections for the planning area may not adequately reflect local development factors. For example, the planning area may expect the location of a large employer that will result in a significant increase in jobs and population. Or, a municipality may have an aggressive annexation program that will result in higher population growth than indicated by the ratio projections. Planners should document any local factors that will impact the projections and make appropriate adjustments. These adjustments are particularly important in estimating future land needs in low growth planning areas as required in .0702(c)(3). The planning guidelines have a provision that allows low growth communities to consider their economic development strategies in making estimates of future land needs. This provision is important. Population projections based on trends in low growth communities probably will indicate little or no growth, and without an adjustment for economic development, the future residential land need will be marginal. The amount of land allocated to residential uses on the future land use map may not exceed the projected land need [.0702(d)(4)]. Thus, if the projected land need is marginal, then it will be difficult to design an appropriate future land use map. 3.1.3 Description and Analysis The land use plan should include tables, charts, graphs, and text to provide a clear picture of the characteristics, trends, projections, and forecasts related to the planning area’s population, housing stock, and the local economy. The analysis should provide a solid
Example of Forecast AdjustmentLand Use Plan
Population Forecasts
0
20000
40000
60000
80000
2000
2002
2004
2006
2008
2010
2012
Year
Po
pu
lati
on With Major Employer
Without MajorEmployer
Source: NC Data Center; WBFI

FY02-03 30
foundation for assessing land use and development issues and for developing land use plan policies. A sample of questions that the local government may consider in the analysis of the demographic and economic factors is provided in Figure 3.1.
Figure 3.1 Analysis of Population, Housing, and the Local Economy
• How does the change in the size of the planning area’s population compare to other coastal communities or to the state? What are the most significant factors that have produced total population changes? Will these factors continue to affect growth in the future?
• What is the geographic distribution of the population changes? Which townships or census tracts have experienced the greatest changes? Have the population changes occurred mostly in incorporated or unincorporated areas?
• Have there been significant changes in the characteristics of the community’s population characteristics? Are incomes rising faster than other coastal communities? Is the population getting older or younger compared to other areas? What are the implications of these changes for land use and development?
• Are there major changes in the characteristics of the housing stock? Changes in tenure or types of housing units that will have land use or development policy implications?
• What are the community’s major employers? What are the prospects for major changes in the structure of the local economy? Have there been recent announcements regarding expansions, new jobs, or loss of jobs in the community? What are the implications of economic changes for land use or development policies?
• Is the population projected to grow? What are the implications of projected growth for land resources or community facilities?

FY02-03 31
3.2 Natural Systems Analysis In the analysis of natural systems, you are required to “describe and analyze the natural features and environmental conditions of the planning jurisdiction and to assess their capabilities and limitations for development (emphasis added).” In the context of the land use plan, environmental conditions describe the physical state of the planning area’s environment and its fitness for development. Three specific dimensions must be addressed in the plan: water quality, natural hazards, and natural resources. Capabilities and limitations are similar terms that may represent opposite sides of the same coin. Environmental capability is the capacity of land with a particular natural feature to accommodate a specified type or intensity of development. Similarly, an environmental limitation is a natural feature or group of features that places restraints on a specified type or intensity of development.
DEFINITIONS Environmental conditions describe the physical state of the planning area’s environment and its fitness for development. Environmental capability is the capacity of land with a particular natural feature to accommodate a specified type or intensity of development. Environmental limitation is a natural feature or group of features that places restraints on a specified type or intensity of development.
You are required to conduct a three-part analysis of the planning area’s natural features in order to assess conditions, capabilities, and limitations. Part One involves inventory and mapping of ten categories of natural features and interpretation of the capabilities or limitations that these features have for development. Part Two requires you to prepare a composite map of natural features. This map is a combination or overlay of your interpretation of capabilities and limitations of each natural feature category. The map must include three classes of land, and each class is based on its capacity to support development. Part Three is an assessment of environmental conditions and trends in three important categories: water quality, natural hazards, and natural resources. Each part of the natural systems analysis is described in more detail below. 3.2.1 Mapping and Analysis of Natural Features As shown below, you are required to develop maps of at least 9 categories of natural features to use as base information for development of land use policies. Local governments are encouraged to include additional features as necessary to address local planning concerns. At the beginning of the planning process, the Division of Coastal Management will typically provide maps of the 9 categories of natural features in digital format.

FY02-03 32
Required Natural Feature Mapping
AECs Soil characteristics
Septic limitations Erodibility
Water quality classifications Natural hazard areas Storm surge areas
Non-coastal wetlands Water supply watersheds Primary nursery areas Environmentally fragile areas Additional features identified by local government
Within these 10 categories, there are actually 3 groups of maps:
(1) AECs, which include natural features and delineations that have special regulatory requirements for development. The AECs may already have minimum development restrictions, including permitted density and intensity.
(2) Water quality-related features that are intended to show (1) the EMC’s water quality classifications for surface waters and the most recent available use support designations and (2) shellfish growing areas and their water quality status.
(3) Natural features, such as soil characteristics, that may have limitations or risks for development.
Land cover maps. Maps of vegetative cover, cultivated land, and other land cover classifications, while not required, may be useful as a base for developing a range of policies, including water quality strategies. Digital Land Use/Land Cover maps are available from NCCGIA. These maps, based on satellite imagery, provide information on forested areas, cultivated areas, and high- and low-intensity urban development. You are not required to include any of the natural feature maps in the final version of the land use plan. This gives you a choice of approaches to present the results of the mapping to local officials and the public. You can produce “hard copy” maps, use a digital data projector to display the maps, or possibly use both approaches. In making a decision on the format for the maps, you should keep in mind that the maps will serve two major purposes: they are a guide for the development of the plan’s policies and the future land use map; and they are an educational tool for the public and local decision-makers. Analysis of development capabilities/limitations. Analysis of development capabilities and limitations involves construction of a profile of the planning area’s natural systems features. The profile shows the “fit” between natural features and the land uses and development activities associated with community development. The following questions may be helpful for constructing this profile:

FY02-03 33
• Does the natural feature perform a function that is vital for environmental health and the quality of life of the area’s residents? An example is wetlands that perform significant water quality and flood-mitigation functions and provide essential habitat and outdoor recreation experiences.
• Does the feature constitute a consequential threat to people or property if development is located there? Flood hazard and storm surge areas are familiar examples. Wildfires may be another coastal example.
• Does the feature provide a scenic amenity that is valued by the community and that should be considered in the development of land use policies? Maritime forests are an example.
• Does the area contain rare outstanding elements of natural diversity of the local area or the state that merit special consideration as land use and development decisions are made? Dedicated nature preserves and registered natural heritage areas throughout the coastal area are examples.
• Do the characteristics of the feature materially limit the type or intensity of development that can take place without unacceptable environmental costs or significant investment in public facilities? Examples are soils with severe septic limitations or that are highly erodible.
A table or chart is a good tool for summarizing the results of the analysis and is a helpful starting point for developing maps. Two examples are shown below. The first example is a table that lists the natural features and uses a fill pattern to indicate its degree of “development compatibility.” In this table, development includes all of the land use activities that are generally considered to be urban development: higher density residential, commercial and industrial uses, and availability of basic services. Using a more narrow definition of development, such as low-density residential, or a specific land use category, such as conservation and open space, would result in different interpretations.

FY02-03 34
Table 3.2 Example of Interpretation of Natural Features Development
Compatibility
Natural Features Dev
elop
men
t C
ompa
tibil
ity
AECs Coastal wetlands Estuarine waters Estuarine shoreline Public trust areas Unvegetated beach area Ocean erodible area High hazard flood area Inlet hazard area Historic/archaeological areas
Land located inside historic district Land located within 500 feet of historic site or archaeological area
Soils Slight septic limitations Moderate to severe septic limitations Slight erosion hazards Moderate to severe erosion hazards
Non-coastal wetlands (NC-CREWS) Beneficial, not high potential risk Beneficial, high potential risk Substantial significance, not high potential risk Substantial significance, high potential risk Exceptional significance, not high potential risk Exceptional significance, high potential risk
Hazards Within 100-year flood Within storm surge area
Water quality HQW/ORW watersheds Water supply protection watersheds
Generally Compatible
Less Compatible
Least Compatible

FY02-03 35
The second example is a matrix that interprets the suitability of environmental factors for a range of development intensities. This approach provides slightly more detailed information for the development of policies and design of the future land use map. However, with a large number of natural features, the matrix can be quite complicated.
Natural feature mapping. Figure 3.2 is an example of a typical natural feature map, which shows soil limitations for septic tanks. This example uses shaded patterns to depict patterns of land that have either slight or severe limitations for development. This is an acceptable format for mapping natural features that is workable for most maps. However, due to scale limitations, some map features must be labeled rather than shown with patterns or colors. For example, it is difficult to accurately depict the estuarine shoreline AEC that extends for a distance of 75 feet landward of mean high water on estuaries, bays, sounds, and brackish waters. Similarly, some components of the ocean hazard AEC cannot be accurately mapped and must be labeled.
EnvironmentalFactor
Group 1 SoilsGroup 2 SoilsGroup 3 SoilsHigh Quality
WaterPNA’s
PocosinsWet Pine Flats
Bottomlandhardwood
Fresh watermarsh
Estuarine marshFlood Plains
Lowintensityres. dev.
with septictanks
Lowintensityres. dev.
withsewer
Higherintensity
urban dev.with sewer
Openspace andrecreation
Localstreets
androads
Very limited compatibility
Limited compatibility
Generally compatible
Table 3.3 Example of Interpretation of Natural Features
Capability Natural Features Matrix

FY02-03 36
You are required to include a good deal of information on the water quality map(s). First, the map must show the EMC water quality classifications for surface waters in the planning area. These classifications include SA, SB, HQW, and ORW waters. In addition, you must also map the related use-support designations – fully supporting (FS), partially supporting (PS), and not supporting (NS). You are also required to map information on shellfish resources showing the location of growing areas in SA waters and their classifications: approved, conditionally approved, open or closed, restricted, and prohibited. Delineation of adjacent 14-digit watersheds when presenting water quality and shellfish data is an important consideration. Many of the required land use and development policies that address water quality must be tied to these watersheds.
slight
severe
Septic Tank Limitations - Soils
Figure 3.2. Example of Natural Feature Map

FY02-03 37
3.2.2 The Composite Map You are required to include a “composite map of environmental conditions” in the plan. This map is based on the natural features mapping, and it must show the location of at least three categories of land in the planning jurisdiction:
1. Class I is land that contains only minimal hazards and limitations that can be addressed by commonly accepted land planning and development practices. Class I land will generally support the more intensive types of land use and development.
2. Class II is land that has hazards and limitations for development that can be addressed by restrictions on land uses, special site planning, or the provision of public services, such as water and sewer. Land in this class will generally support only the less intensive uses, such as low-density residential, without significant investment in services.
3. Class III is land that has serious hazards and limitations. Land in this class will generally support very low-intensity uses such as conservation and open space.
The guidelines do not specify which land features are to be included in each class. That decision is left to the local planning team. However, you must clearly show in the plan the features that are included in each class. Tables are a simple way to meet this requirement. Table 3.4 is an example.
Table 3.4 Example of Composite Natural Feature Analysis
Natural Systems Mapping Unit Mapping symbol Natural System Opportunities and Constraints
Class I – land containing only minimal hazards and having only slight limitations that may be addressed by sound land planning and development practices
Soils with slight limitations for septic tanks Soils with slight erosion hazards Non-wetland area or wetland rated beneficial and not
high potential risk (NC-CREWS) Land located outside 100-year flood hazard area Land located outside storm surge area (slow moving
storm) Land located outside designated historic districts or more
than 500 feet from a historic or archaeological site
Class II – land containing development
hazards and limitations that may be addressed by methods such as restrictions on types of land uses, special site planning, or provision of public services
Estuarine shoreline Ocean erodible area High hazard flood area Inlet hazard area Land located outside designated historic districts or more
than 500 feet from a historic or archaeological site
Soils with moderate to severe limitations for septic tanks Soils with moderate to severe erosion hazards

FY02-03 38
Non-coastal wetlands rated as beneficial and high potential risk or substantial significance (NC-CREWS)
Land located within a 100-year flood hazard area Land located within a storm surge area (slow moving storm) HQW/ORW watersheds Water supply watersheds Wellhead protection areas
Class III – land containing serious hazards for development or lands where the impacts of development would cause serious damage to the values of natural systems
Coastal wetland Estuarine waters Public trust areas Unvegetated beach area Non-coastal wetlands rated as substantial significance with high potential risk or exceptional significance with or without high potential risk (NC-CREWS)
Generally, shaded or colored areas are used to illustrate the range of capabilities or limitations presented by the planning area’s natural features. These maps are often similar to the mapping and analysis approach developed by the McHarg group. Figure 3.3 is an example.
Class I Class II Class III
Composite Map of Natural Features
Figure 3.3. Example of Composite Natural Features Map

FY02-03 39
3.2.3 Assessment of Environmental Conditions In addition to the analysis and mapping of natural features, the guidelines require you to include a more detailed “assessment” of three categories of environmental conditions or features in the plan: water quality, natural hazards, and natural resources. This information will be the basis for developing goals and policies to maintain and restore water quality, reduce vulnerability to natural hazards, and protect valuable natural resources. Table 3.5 shows sources of data and information required for the assessments.
Table 3.5
Assessment of Environmental Conditions Sources of Information
Feature/condition Sources of Information Water quality
Surface water – impaired streams • Basinwide Plans provide comprehensive water quality information at the sub-basin level. Plans are updated about every five years. As updates become available, trends can be established.
• Section 303(d) list contains information on impaired streams, details streams added or deleted from the list, and lists streams targeted for improvement strategies (TMDLs). Updated on two-year cycle.
• Shellfish reports (Report of Sanitary Survey) contain useful detailed information on sources of water pollution, point and nonpoint.
Shellfish waters – permanent and temporary closures
• The DEH/SSS issues a Report of Sanitary Survey for each shellfish growing area annually. This report provides information on pollution sources, temporary closures, and prohibited areas.
Chronic wastewater treatment system malfunctions
• Basinwide plans list treatment plants with chronic problems. This information can be supplemented through contact with the regional DWQ offices.
Public health hazards • These areas are specifically discussed in the basin plans based on DEH recreational monitoring and DWQ ambient monitoring. When waters are degraded but not considered impaired, they are mentioned so readers can identify areas where conditions may be getting worse.
• DEH/SSS “Report of Sanitary Survey” may identify subdivisions that experience septic tank problems.
• Staff at the County or Regional Health Department that are involved in issuing septic tank permits are able to identify areas that experience chronic septic system problems.
Natural hazards • The N.C. Division of Emergency Management is designated as the state Flood Insurance Coordinating Office and can provide repetitive-loss data for participating jurisdictions. This data goes back to 1978 or to the date of construction, whichever is most recent.
• No database is available for structures and facilities threatened by shoreline erosion.
• DCM provides mapping that shows long-term shoreline erosion rates. This data should be supplemented by identification of localized erosion “hot spots.”
• Duke’s Program for the Study of Developed Shorelines provides maps that assess local risks.

FY02-03 40
Natural resources • Location and extent of natural heritage areas are identified on digital
maps provided by DCM. More detailed descriptions of the characteristics of these areas can be obtained from the Natural Heritage Program in the N.C. Department of Environment and Natural Resources.
• Mining permits can be a clue to beach-quality sand deposits and other mineral resource areas.
• County soil surveys include data on soil productivity for various crops, which can be used to identify excellent agricultural soils. Recommend participation by Cooperative Extension and NRCS in identifying agricultural soils.

FY02-03 41
3.3 Analysis of Land Use and Development The analysis of land use and development provides the local planning team with a “snap shot” of current land use patterns, an assessment of emerging development trends, and a forecast of the location of future development, given current trends. Existing land use is a major part of the foundation upon which land use policies and the future land use map are built. The land use information developed in the part of the plan serves several purposes. Some of these include helping develop policies that address land use conflicts; establishing relationships between land use and development and water quality; identifying areas where land use is in transition; and identifying areas where in-fill development or redevelopment are feasible. This section describes the components of the description and analysis of land use and development. 3.3.1 Existing Land Use Required land use categories. The guidelines require you to collect data on existing land uses and to provide a map of the land use categories and activities shown in Table 3.6. The guidelines do not provide a definition of these land use categories, so the table provides examples of uses and activities that may be included in each category. If needed, these categories may be further divided for more detail.
Table 3.6 Existing Land Use Categories
Existing Land Use Category Examples of Activities Included Residential Single-family
Duplexes Multifamily – apartments, townhouses, and condos
Commercial General and specialty retail, convenience stores, CBD, personal services, professional services and offices, and mixed uses, motels and hotels
Industrial Intensive and extensive manufacturing operations, warehousing and distribution establishments, research parks
Institutional Churches, hospitals, schools, and related establishments Public parks, golf courses, swimming pools, beach and estuarine access locations Dedicated open space Public or privately owned land with development restrictions

FY02-03 42
Existing Land Use Category Examples of Activities Included Agriculture Bona fide farms (definition can vary – confer with
Cooperative Extension) Forestry Confer with N.C. Division of Forestry Confined animal feeding operations
Agricultural businesses where animals are grown under confined conditions, with many animals (more than 250 hogs or 100 cows) concentrated in facilities on a few acres. DWQ regional offices can provide assistance with locating operations – GPS lat./long. and directions to farms. GPS locations can be unreliable.
Undeveloped Land in an idle state and not used for any open-space function.
In addition to these land use categories, you are required to map the location of historic, cultural, and scenic areas that are designated by a state or federal agency or the local government. These areas or sites may be shown on the existing land use map or on a separate map. Mapping requirements. There are no limits on the data sources or the methods that planners use to collect existing land use data. Generally, a combination of sources and methods is required. These may include county tax maps and records, aerial photography, interpretation of land cover from satellite images, and the traditional field inspection or “windshield survey.” Where GIS is available, using tax maps and records with limited “spot” field inspections where needed is an efficient method with acceptable accuracy for collecting existing land use information. The guidelines do not provide any specifications for base maps for analysis of existing land use. Existing maps should be used to collect and present land use information if possible. Availability of GIS in the coastal area. Table 3.7 shows the counties in the coastal area that have GIS-based land records. The table is based on a survey undertaken by the Center for Geographic Information and Analysis, updated by telephone contacts with county tax administrators.
Table 3.7
Coastal Counties with GIS Capability County GIS Status County GIS Status
Beaufort Yes Hertford No Bertie No Hyde No
Brunswick Yes New Hanover Yes Camden No Onslow Yes Carteret Yes Pamlico Yes

FY02-03 43
County GIS Status County GIS Status Chowan On the way Pasquotank Yes Craven Yes Pender Yes
Currituck Yes Perquimans No Dare Yes Tyrrell No Gates No Washington Yes
Sources: NCCGIA; Bill Farris
Issues with use of tax data. The parcel data collected by county tax offices is an excellent source of land use information, and its use can greatly simplify the land use analysis process. However, planners need to be aware that this data generally is maintained for ad valorem tax purposes, and it cannot be used for land use analysis without some “interpretation.” For example, some farm operations may be listed as a residential use due to the presence of a dwelling; manufactured housing parks may be listed as “commercial” rather than “residential” because they are income property. In addition, large tracts of land may be listed in a particular use category when only a small portion of the tract is used for that purpose. These issues can usually be addressed through discussions with tax administrators and “spot checks” in the field. 3.3.2 Coordination with Management Topics Public access information. The guidelines do not require collection of specific information on the location of public access points – beach and public trust – and the facilities that they offer. However, you are encouraged to include this information in the land use analysis. Public Access is one of the land use policy areas required by the Land Use Plan Management Topics in Section .0702(d)(3). This management topic requires policies that set local criteria for the frequency and type of access that is planned. Watershed development and water quality strategies. Likewise, you are not required to complete detailed studies on the level of development in the watersheds of the planning area. However, the Water Quality management topic [.0702(d)(3)(E)] requires the plan to include policies to “prevent or control” nonpoint source pollution and to establish policies to protect open shellfish waters and restore closed shellfish waters. To address these requirements, your land use analysis should include information on the development of the watersheds of the planning area. The level of development in the watershed is an essential consideration in developing these policies. Some organizations believe that water quality is “impacted” when watershed development reaches the 15% to 25% level and that when development exceeds 25% of the watershed the stream is not a candidate for restoration.9 Research by
9 Center for Watershed Protection, Rapid Watershed Planning Handbook, page 1.29.

FY02-03 44
other organizations suggests that water quality can be maintained with higher levels of development if forest and wetland cover is maintained at a high level.10 Clearly, the level of development is an important consideration in establishing water quality policies and in setting priorities. A manual on nonpoint source pollution management is available from the Division of Coastal Management (see Appendix). This manual provides information on the link between the type and intensity of land use and nonpoint source pollution. 3.3.3 Land Use and Development Analysis Existing land use table. Table 3.8 is an example of a summary of the amount and percentage of the planning area that is allocated to each of the land use categories. This table also shows an estimate of the total acres per person in each category. This estimate of acres per person is useful for making the required projections of future land needs.
Table 3.8 Example of Existing Land Use Table Category Acres % of
Total Acres per
person
Residential 12,822 6.4 0.33 Commercial 658 0.3 0.02 Industrial 1,175 0.6 0.03 Institutional 509 0.3 0.01 Public 336 0.2 0.01 Dedicated open space 2,038 1.0 0.05 Farm operations 71,353 35.9 1.84 Forestry 90,131 45.3 2.32 CAFOs N/A N/A N/A Undeveloped 20,000 10.0 0.51
Total planning area acres 199,022 100 5.12
10 Watershed Management Institute, Structural and Non-structural BMPs for Protecting Streams, page 10.

FY02-03 45
Land use conflicts. You are required to describe any existing land use conflicts and any existing land uses that have negative impacts on water quality. The following list of conflicts is based on a review of land use plans. Some of these categories may apply to the local planning, or they may suggest other areas that should be addressed by the plan.
• Location of intensive livestock and poultry operations in close proximity to existing residential areas
• Encroachment of residential and other urban-level land uses into traditional agricultural and forestry areas
• Extractive industrial operations encroaching on developed areas • Location of hazardous operations in close proximity to developed areas • Inappropriate land uses adjacent to airports • Manufacturing uses encroaching on residential uses • Residential development in flood hazard areas • Small lot development on soils with septic tank limitations • Residential development in and adjacent to land traditionally used for public
access • Auto salvage operations located in flood hazard areas • Blighted areas
3.3.4 Description of Development Trends The guidelines require you to describe the planning area’s development trends using appropriate indicators, such as building permits or subdivision lots, and to identify the location(s) of land expected to experience development during the five years following CRC certification of the land use plan. If local records are adequate, a map that shows the number or amount of building permits issued and their general location is a very effective way to track and describe development trends. For example, the New Hanover Planning Department produces an annual report on construction activity that shows location of permits and construction levels (values). Unfortunately, many local building departments do not maintain a database in this format. An alternative is to discuss building trends with the local inspectors and to develop a general map that shows the most active development areas in the jurisdiction based on the judgment of the local building officials. New Hanover County also produces a map that shows subdivision lots with preliminary plat approval. An example of this map is shown in Figure 3.4.

FY02-03 46
In many areas, tracking population growth by census tract or block group is also an effective method for describing development trends. As the length of time since the last census increases, this method becomes less effective. Identification of land expected to experience development during the 5-year planning period is based on the best judgment of the planner and the local planning team. In addition to the trends shown in the analysis described above, you should consider other factors that generate and shape land development. Examples of these factors include road building and improvements scheduled during the planning period; extension of water and sewer facilities; municipal annexations; and construction of major commercial or industrial developments. Once these areas are identified, they can be compared to the natural systems composite map to describe potential development conflicts with Class II and Class III lands [Section .0702 (c)(2)(B)].
Figure 3.4 Example of Development Trend Map
New Hanover County Planning Department

FY02-03 47
3.3.5 Projection of Land Needs The final step in the land use analysis is projecting future land needs. You are only required to project the amount of residential land that is needed to accommodate the anticipated population growth of the planning area. Both short-term (5- and 10-year) and long-term (20-year) projections are required. The projections must take into account permanent and seasonal population growth. Table 3.8 is an example of an approach to estimating land needs. This approach is linked to the planning area’s population forecasts [.0702(c)(1)(D)] and to the analysis of existing land use. Planners will also want to make assumptions regarding the future average ratios of residential land acreage to population. In this example, residential acres per person for the permanent population increases from 0.33 (established in the land use survey) to 0.5, and the estimated ratio for the seasonal population is 0.10. In an actual planning situation, these ratios may go up or down depending on development trends, the number of subdivided but un-built lots, amount of land suited for in-fill and redevelopment, availability of services and facilities, and other local factors.
Table 3.9
Example of Residential Land Need Projections 2000 – 2005 2005 – 2010 2010 – 2020 2000 – 2020
Permanent population growth
1,400 1,200 3,000 5,600
Estimated residential acres/person
0.5 0.5 0.5 N/A
Estimated residential acres needed
700 600 1,500 2,800
Adjusted residential acres needed (+50%)
1,050 900 2,250 4,200
Seasonal population growth
4,800 2,700 8,000 15,500
Estimated residential acres/person
0.10 0.10 0.10 N/A
Estimated residential acres needed
480 270 800 1,550
Adjusted residential acres needed
720 405 1,200 2,325
Total residential acres needed
1,770 1,305 3050 6,125

FY02-03 48
The estimate of residential land needed for population growth can be used as a rough indicator of the total land needs. For example, in Table 3.8, which shows existing land use in a hypothetical planning area, existing residential land use is approximately 73% of the total land in an urban use. If this percentage holds, the estimate of total residential land needed shown in Table 3.9 is 73% of the total land needed for urban uses. Therefore, total land needed in this hypothetical planning area is 8,390 acres (6,125÷0.73=8,390). This is a rough estimate only, and it should be used only with a large measure of professional judgment. The planning guidelines have a provision that allows low-growth communities to consider their economic development strategies in making estimates of future land needs. This provision is important. Population projections based on trends in low-growth communities probably will indicate little or no growth, and without an adjustment for economic development, the future residential land need will be marginal. The amount of land allocated to residential uses on the future land use map may not exceed the projected land need [.0702(d)(4)]. Thus, if the projected land need is marginal, then it will be difficult to design an appropriate future land use map. The easiest approach for making the economic development adjustment is to incorporate the anticipated growth into the population projections of the planning area. This approach is discussed in Section 3.1.2 of this manual.

FY02-03 49
3.4 Analysis of Community Facilities The analysis of community facilities provides the local planning team with basic information on four major types of community facilities – water, sewer, roads, and stormwater. These facilities have been termed “growth shapers” for the role that they play in local land development. This infrastructure, whether built by the local government or private entities, can have a major influence on local growth and development – location, costs, density, timing, and the amount of new development. In addition, the local government’s policies for the operation, maintenance, extension and development of these facilities can have a major impact on the community’s environmental values. The CRC’s Land Use Management Topics [.0702(d)(3)] recognize the importance of infrastructure in the location and timing of land development. The management goal of the Infrastructure Carrying Capacity management topic is to “ensure that public infrastructure systems are appropriately sized, located and managed so that the quality and productivity of AECs and other fragile areas are restored and protected. This section identifies sources of information and provides guidelines for the required analysis of community facilities. 3.4.1 Water Supply and Wastewater Treatment Facilities The guidelines require planners to map the planning area’s existing and planned water and sewer systems, to describe existing capacity and conditions of these systems, and to identify future needs based on population projections. In describing existing conditions, planners must consider any “overflows, by-passes, or other problems that may degrade water quality or constitute a threat to public health”[.0702(c)(4)(A)]. “Other problems” may relate to issues such as permit violations for wastewater treatment or water quality standards for water treatment systems. For communities with private systems, planners may not be able to obtain all of the information necessary to address the requirements of the guidelines. In this case, you are required to complete the analysis allowed by available information and to place a note in the plan that some information was not available from private sources. Water systems. There are three readily available sources of information on water systems in North Carolina. These include water distribution systems data from NCCGIA; the Local Water Supply Plan available online from the N.C. Division of Water Resources or from the local system operator; and the Annual Water Quality Report for the system, which is available from the local system operator.

FY02-03 50
• Water Distribution Systems. This data set includes comprehensive information
on water systems in all counties in the Coastal Area except New Hanover. This data set includes intake locations (surface and groundwater), treatment plants, storage tanks, pumping stations, master meter locations, pipe locations and sizes, and service areas. Service areas are classified as Type A, typical public systems; Type B, special private systems that have limited future development impact; and Type P, planned or proposed service areas.
• Water Supply Plan. This document, which is updated in 5-year cycles, provides information on population served by the system, current usage, water supply (source and amount), water demand projections, and future water supply needs.
• Annual Water Quality Report. This report contains information on the quality of the system’s water, detailing substances detected in the water and whether the level of the substance is within the limit established by the Federal Safe Drinking Water Act.
The Water Supply Plan contains a projection of future needs based on population. Planners are encouraged to incorporate these projections into the land use plan unless there are inconsistencies between the projections of the Water Supply Plan and the land use plan. If separate projections are required, a typical per capita consumption figure can be estimated from the water supply plan. Sewer systems.There are two sources of information for analysis of the planning area’s sewer systems. These are the Sanitary Sewer Systems data set from the NCCGIA and the Annual Wastewater Report from the local system operator or the Division of Water Quality. The Sewer System data set from NCCGIA contains information similar to the Water System data set. However, it contains additional information on bond rating, cash reserves, and outstanding indebtedness. The Annual Wastewater Report, beginning in 1999, details performance of the system and any permit violations that occurred during the reporting period. The Division of Water Quality maintains a list of penalties assessed for permit violations for public and private systems. Reports are available for the prior three years.

FY02-03 51
Coordination with local operators. The NCCGIA data is current to 1997. Water supply plans are updated on 5-year cycles. Coordinating with local operations staff and incorporating their knowledge and judgment into the analysis is essential to obtain an up-to-date picture of the capacity, condition, service area, and development or expansion plans for water and sewer systems. 3.4.2 Transportation Systems The required analysis of the transportation system includes preparing a map that shows the existing highway system, any system segments that NCDOT considers to have unacceptable service levels, highway facilities on the current thoroughfare plan, and the facilities on DOT’s current TIP. In addition, planners are required to “assess the impact of planned highway or other transportation facilities on growth levels and development patterns” [.0702(c)(4)(B)].
• Existing highway system. Digital up-to-date maps (shapefiles) that show state-maintained roads at the county level are available for download from the NCDOT’s GIS Unit at http://www.ncdot.org//planning/statewide/gis/. The department also provides paper county road maps that are available at the local division or district offices.
• Thoroughfare plans. Thoroughfare plans are not currently available in digital form. For information on thoroughfare plans that have been adopted in the Coastal Area and to request paper maps of these plans, contact the NCDOT Statewide Planning Branch, Eastern Group Manager.
• Traffic counts. The NCDOT Statewide Planning Branch conducts a traffic survey program. County and urban maps showing traffic counts may be downloaded at http://www.ncdot.org/planning/. These maps are in .tif format.
• TIP projects. The entire TIP document (pdf) or maps (jpeg) that show individual projects may be downloaded at http://www.ncdot.org/planning/development/TIP/.
Assessing the impact of planned facilities. Planners are required to assess the impact of planned highway or other transportation facilities in this analysis. A number of factors determine the impact of new or improved highway facilities. These new facilities generally increase the supply of developable land by creating access. They may also create sites for commercial and business uses that are able to take advantage of high traffic volumes. The assessment should consider the following factors:
• Amount and location of developable land that may be created by the facility. • Class II or Class III lands located in facility impact areas. • Major intersections created by the facility and the types of land uses that might be
attracted to the sites. • Impact of new land uses and development patterns at major intersections on
existing land uses.

FY02-03 52
• Location of commercial and business corridors. • Impact of the facility on existing land uses, particularly residential uses. • Development opportunities that may be created by the facility.
3.4.3 Stormwater Systems In the analysis of stormwater systems, the guidelines require planners to identify existing drainage problems in the planning area; to identify water quality issues related to point-source discharges of stormwater; and to provide an overview of the requirements of EPA’s Stormwater Phase II final rules. Each of these requirements is addressed briefly below. Existing drainage problems. There is no consistent database on existing stormwater systems that is similar to the data sets available for water and sewer. Planners will need to rely on whatever mapping is available from the local government. Many local governments have undertaken stormwater management plans, and useful maps may be available. If a stormwater plan or other engineering studies are available, these are the best starting points for identifying problems with the existing system. Local government staff that is required to deal with drainage issues can provide accurate information on the location and severity of drainage problems. Often citizens attending the citizen participation meetings can provide additional anecdotal information that is useful for developing a picture of present drainage problems. Water quality problems related to point sources. The local health department or the state Division of Public Health may be able to assist in identifying any existing point sources that contribute to water quality problems. In addition, the Shellfish Sanitation Surveys published annually by DEH/Shellfish Sanitation Section identify many of the piped outfalls that contribute to water quality problems. NPDES Phase II Stormwater Program
In 1972, the National Pollutant Discharge Elimination System (NPDES) program was established under the authority of the Clean Water Act. Phase I of the NPDES program was established in 1990. It required permits for large or medium municipalities (population greater than 100,000). Phase II was established in 1999 and it requires smaller communities to apply for stormwater permit coverage by March 2003.

FY02-03 53
A community may be regulated under this program in one of three ways: (1) automatic designation under the federal rules; (2) designation by the state; or (3) designation by petition of a third party. Only two communities in the Coastal Area are subject to automatic designation – Wilmington and Jacksonville. At this time, state designations have not been made. There is always the possibility that a community may be added by petition. If a community is designated and a stormwater permit is required, then a stormwater plan that is designed to reduce the discharge of pollutants must be implemented. This plan must include six elements:
1. A public education and outreach program that informs citizens how to reduce pollutants in stormwater.
2. A public involvement program that meets minimum requirements established by the state.
3. A program to detect and eliminate illicit discharges into the stormwater system.
4. A program to reduce pollutants in the stormwater system from construction. 5. A program to reduce pollutants in the stormwater system from new
development and redevelopment that disturbs one acre or more. 6. A pollution prevention/good housekeeping program for municipal operations
that addresses operation and maintenance, including a training component, to prevent or reduce pollutant runoff from those operations.
If the planning area is part of a designated community, the analysis of stormwater facilities should be coordinated with any of the required Phase II activities. 3.4.4 Management Topics and Future Land Use Map
Requirements We recommend that planners keep in mind the requirements of the Infrastructure Carrying Capacity management topic [.0702(d)(3)(C)] and the content requirements of the Future Land Use Map [.0702(d)(4)] when analyzing community facilities. The management topic requires the plan to identify or establish service area boundaries for existing and planned infrastructure. This requirement focuses on water, sewer, and roads. In addition, the future land use map categories must be correlated with existing and planned infrastructure. For example, land use classifications that depend on sewer service should be located only within the boundaries of an existing or planned sewer service area. The Future Land Use Map must show major existing and planned infrastructure, including roads, water, and sewer.

FY02-03 54
3.4.5 Required Mapping The guidelines require mapping of information for all major community facilities – water, sewer, roads, and drainage. You may chose to prepare a single map for each system or a composite map that shows more than one system.

FY02-03 55
3.5 Land Suitability Analysis The land suitability analysis required in Section .0702 (c)(5) is a process for determining the supply of land in the planning area that is suitable for development. The overall purpose of this analysis is to provide the local planning team with information on the best areas for development in order to guide the formulation of local policies and the design of the future land use map. To determine development suitability, the guidelines identify four sets of suitability factors that you are required to consider. These factors, described below, relate primarily to the planning area’s physical characteristics:
• Environmental characteristics that include the composite map required in Section .0702 (c)(2)(B) and the analysis and assessment of water quality conditions required in Section .0702 (c)(2)(C)
• Existing development and man-made features • Proximity to existing development • Compatibility with existing land uses • Potential impact of development on historically, culturally significant, or scenic
sites • Availability and capacity of community facilities • Regulatory restrictions on land development – local, state, and federal
The guidelines do not restrict the local government from including additional factors for consideration in the analysis. As part of the suitability analysis, you are required to produce a land suitability map. This map shows the degree to which land in the planning area is suitable for development. The general process for suitability analysis and the production of a suitability map 11 includes the following procedures:
1. Identify the factors that should be considered – the guidelines specify the first step of this process – natural features, existing land use patterns, proximity to public facilities, regulatory restrictions, and other factors relevant to suitability.
2. Determine the relative importance of these factors. 3. Determine the suitability rating of each factor – the relative development
suitability of land with a particular factor. 4. Prepare appropriate maps or overlays of each factor. 5. Combine the overlays to produce a land suitability map.
11 See Urban Land Use Planning by Kaiser, Godschalk, and Chapin and The Living Landscape by Steiner for a review and description of alternative approaches to land suitability analysis.

FY02-03 56
The overlays and the suitability map may be hand drawn, or they may be developed using GIS programs. A land suitability analysis program using GIS, developed jointly by the Division of Coastal Management and the N.C. Center for Geographic Information and Analysis, is described later in this section. 3.5.1 Identifying Development Suitability Factors Attributes of Suitable Land. Defining the characteristics that make land suitable for development is the starting point for the analysis. As described above, the guidelines specify the types of suitability factors that you must consider in the analysis. Now the task is to identify specific factors within these categories that you will use to analyze suitability. You should focus on data that is either available or can be readily obtained. To define these characteristics, you may want to look at the planning area through the eyes of a land developer. What are the best natural features for development? What natural amenities are desirable? What types of public facilities are needed; how far can facilities be extended to serve development? What types of existing land uses should be avoided; what types of development should be located nearby? You may want to engage the steering committee, planning board, and citizens in refining this list of questions and in developing responses. Table 3.10 lays out some examples of attributes that address these questions.
Table 3.10 Examples of Attributes That
Make Land Suitable for Development
1. Class I Natural Features (From the composite map, which is a summary of the capabilities and limitations of natural features.)
2. Use permitted by local, state, or federal regulations 3. Quality water nearby 4. Landscape interest (scenic areas) 5. Close proximity to existing developed areas where a range of
supporting land uses and services are available 6. Absence of incompatible uses 7. Easy access to major roads 8. Easy access (affordable) to water and sewer 9. Proximity to historic areas
These attributes are related to a single class of development that “lumps” together all of the land use activities generally considered to be urban development: higher density

FY02-03 57
residential, commercial and industrial uses, and availability of basic services. Depending on local concerns and needs, you may consider conducting a suitability analysis for more than one development classification. If an analysis is conducted for more than one use or development type, the list of suitability factors will be different in each study. 3.5.2 Rating the Suitability Factors Ratings for suitability factors are a way to approximate the development suitability of land that has a particular type of factor or characteristic. Ratings are typically the result of professional judgments and are expressed generally as either a number or a qualitative description – high, medium, or low. Take “special flood hazard area” for example. For this particular factor, land inside a flood hazard area may be shown as having low suitability; land outside a flood hazard area may be shown as having high suitability. Another example is the availability of public sewer. Land with sewer within ½ mile may have a high suitability rating; with sewer within ½ to 1.0 mile, a medium suitability; and with sewer more than 1.0 mile, a low rating. Similar ratings are developed for each of the suitability factors. Typically, suitability ratings are depicted as colors or patterns on overlay maps. Figure 3.5 is an example of a suitability overlay showing proximity to sewer. The classes shown on the composite map prepared in the natural systems analysis readily lend themselves to suitability ratings. An approach for rating other factors is shown in Table 3.11.
Table 3.11
Example of Suitability Factor Ratings
Suitability Factor Low 1
Medium 2
High 3
Proximity to developed land
> 1 mi 0.5 – 1.0 mi < 0.5 mi
Access to roads > 1 mi 0.5 – 1.0 mi < 0.5 mi Access to sewer > 0.5 mi 0.25 – 0.5 mi. < 0.25 mi Access to water > 0.5 mi 0.25 – 0.5 mi < 0.25 mi
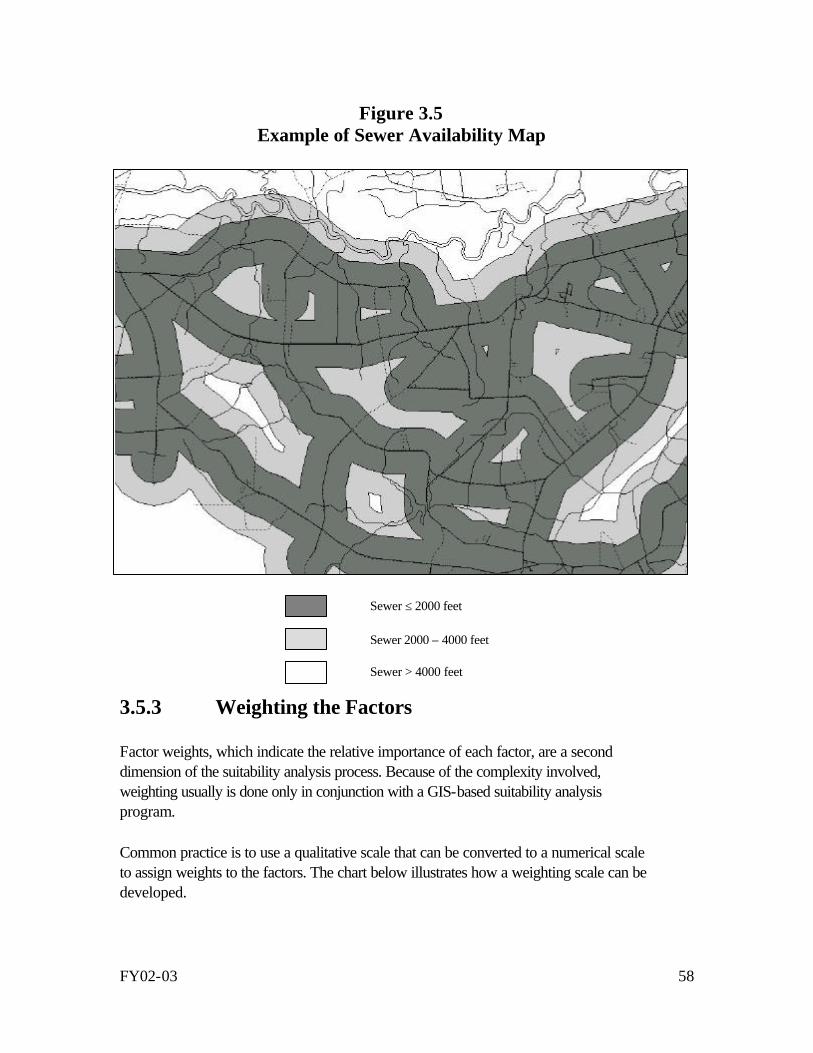
FY02-03 58
3.5.3 Weighting the Factors Factor weights, which indicate the relative importance of each factor, are a second dimension of the suitability analysis process. Because of the complexity involved, weighting usually is done only in conjunction with a GIS-based suitability analysis program. Common practice is to use a qualitative scale that can be converted to a numerical scale to assign weights to the factors. The chart below illustrates how a weighting scale can be developed.
Sewer ≤ 2000 feet
Sewer 2000 – 4000 feet
Sewer > 4000 feet
Figure 3.5 Example of Sewer Availability Map

FY02-03 59
Relative Importance Numerical weight Important 1
Very important 2 Extremely important 3
Using this scale, you may decide that the presence of a flood hazard is an important factor and that easy access to sewer, say within 2000 feet, is an extremely important factor. In the weighting process, the availability of sewer is 3 times as important as the presence of a flood hazard in determining the development suitability of a particular location.
3.5.4 GIS-based Land Suitability Analysis Program The Division of Coastal Management and the N.C. Center for Geographic Information and Analysis have jointly developed a GIS-based land suitability analysis program (LSA)12. The program utilizes the Spatial Analyst extension of ArcView GIS. It is designed to address the requirements of the land use planning guidelines for land suitability analysis and to provide a level of flexibility so that the analysis can be tailored to reflect local planning situations. Land suitability data. The data used in LSA conforms as closely as possible to the requirements of Section .0702 (c)(5) of the planning guidelines (please see discussion above), subject to availability in digital format from the NCCGIA corporate database. The data layers used in the analysis are shown in Table 3.12. LSA can accommodate additional data developed by local planners. LSA applies a numerical rating system to indicate the relative suitability of locations with a particular factor type or categories within a factor type. The rating scale is from “0” to “3”. A “0” is assigned to a factor or category that is not generally available for development or for which development may be hazardous or prohibitively expensive. A “3” is assigned to factors or categories that have no significant limitations. Table 3.12 shows the ratings assigned to each factor or category. LSA also incorporates factor weights to reflect the relative importance of each factor in determining suitability. These factor weights can be changed by local planners and decision-makers to reflect local goals and policies. Table 3.12 also shows the initial weights assigned to each factor.
12 DCM and CGIA will provide the program to local governments and will provide training to land use planners. The program and training will be available in early fall 2002.

FY02-03 60
The output of LSA is a land suitability map that classifies land in one of the following 4 classifications:
Least suitable Low suitability
Medium suitability High suitability
Table 3.12
DCM/NCCGIA Land Suitability Analysis Factor Ratings and Weights
Categories and Ratings
Initial Assigned Weight
Layer Name 0 1 2 3 Coastal wetlands Inside Outside 3 “404” wetlands Inside Outside 3 Estuarine waters Inside Outside 3 Protected lands Inside Outside 3 Storm surge areas Inside Outside 2 Soils (septic limitations) Severe Moderate Slight 2 Flood zones Inside Outside 2 HQW/ORW watersheds Inside Outside 1 Natural heritage areas < 500 feet > 500 feet 1 Hazardous waste disposal sites
< 500 feet > 500 feet 1
NPDES sites < 500 feet > 500 feet 1 Wastewater treatment plants
< 500 feet > 500 feet 1
Discharge points < 500 feet > 500 feet 1 Land application sites < 500 feet > 500 feet 1 Airports < 500 feet > 500 feet 1 Developed land > 1 mi 0.5 – 1.0 mi < 0.5 mi 1 Major roads > 1 mi 0.5 – 1.0 mi < 0.5 mi 2 Water pipes > 0.5 mi 0.25 – 0.5
mi. < 0.25 mi 3
Sewer pipes > 0.5 mi 0.25 – 0.5 mi < 0.25 mi 3

FY02-03 61
3.6 Review of Current CAMA Land Use Plan A review and evaluation of the current land use plan is required. The purpose of this step is to engage the local government in an evaluation of its success in implementing the land use plan and the effectiveness of its policies in achieving the goals of the plan. Planners are required to consider three factors in this review:
1. The consistency of the local government’s current land use and development ordinances with the land use plan policies – Have any needed amendments or adjustments been made? Have any inconsistencies been identified since the plan was adopted that have not been addressed? If yes, what is the plan to address them?
2. Adoption of the plan’s implementation measures by the elected board – Have the items listed in the Action Plan been implemented?
3. Efficacy of current policies – Have the current policies been effective in creating the desired land use patterns and protecting natural systems? If they are effective, are there opportunities to apply these concepts to other areas? If they are not effective, are there adjustments that will improve effectiveness?
For plans created under the current CAMA rules, the Management Topics provide an excellent structure for organizing the review of the current land use plan. Some communities are successful in involving citizens in the review of the current land use policies. A portion of a community meeting can be devoted to review and evaluation of policies.

FY02-03 62
4.0 Plan for the Future [7B .0702 (d)] 4.1 Introduction The “Plan for the Future” sets the community’s course of action to achieve its vision. This element has three required components: Land Use and Development Goals, Policies, and a Future Land Use Map. As a whole, the plan sets out the strategies, actions, and programs that the community will implement to achieve its goals, and it provides a roadmap for future land use and development in the planning area. The policies and the future land use map must address the CRC’s six Management Topics [.0702(d)(3)], which is a requirement that guides the policy development process. These Management Topics, which are summarized in Figure 4.1 and discussed in Section 4.2, are intended to ensure that local land use plans support the overall goals of CAMA and provide a “substantive basis” for the CRC’s review and certification of local plans. The plan’s goals, the types of policies and their content, and the spatial policies of the land use plan map must address the CRC Management Topics for land use plans. You are further required to analyze and evaluate the plan’s policies to demonstrate that they support the Management Topics. Two types of policy analysis are required. First, determine the plan’s impact on the management objectives. If your analysis identifies negative impacts, you must include mitigation strategies in the plan. Second, in a type of summary analysis, explain how the goals, policies, and land use map will guide development and land use in a way that is consistent with the Management Topics. This section is a guide to each of the policy components of the CAMA land use plan and to the required policy analysis: • Land Use Plan Management Topics –
What are they and what do they require?
• Setting Land Use and Development Goals
• Formulating land use and development policies
• Selecting a land use classification scheme
• Designing the future land use map • Handling the required policy analysis
“…the future is what we make it.”
Edmund N. Bacon Design of Cities
1967

FY02-03 63
4.2 Management Topics – What are they and what do they require?
You are required to develop goals, land use and development policies, and a future land use map that are consistent with the six Management Topics in Section .0702 (d)(3) of the guidelines. These Management Topics are categories of local land use and development policies determined by the Coastal Resources Commission to be essential for achieving the local land use planning mission. The purpose of the Management Topics is to support the important tie between the goals of CAMA and local land use plans by clearly describing the CRC’s planning goals and expectations for local land use plans and providing benchmarks for the development of local policies.
Figure 4.1 summarizes the management topic categories. The first five of the topics on the list address planning concerns associated with the goals of CAMA. The sixth management topic, Local Areas of Concern, is intended to incorporate specific issues,
DEFINITION Management topics are categories of local land use and development policies determined by the Coastal Resources Commission to be essential for proper use, development, and protection of natural and manmade resources in the coastal area.
Figure 4.1 Summary of Land Use Plan
Management Topics
Public Access – strategies for maximizing community access to beaches and public trust areas. Land Use Compatibility – management of land use and development in a way that minimizes its primary and secondary impacts on natural and man-made resources. Infrastructure Carrying Capacity – strategies to ensure that infrastructure is available to support anticipated and planned development and that it is managed to protect AECs and other fragile areas. Natural Hazard Areas – policies to reduce the community’s vulnerability to natural hazards. Water Quality – land use and development policies and strategies to protect quality waters and to restore quality in waters that are non-supporting. Local Areas of Concern – specific policies and strategies to address local planning and development goals.
FY02-03 64
concerns, and opportunities that are identified by the local government. These concerns may include areas such as desired growth patterns, transportation systems, and community facilities, or special planning areas such as historic areas, downtown, and neighborhood preservation. The guidelines require your plan to include policies in each of these six categories. Each management topic has three parts to consider as you develop local policies: management goals, planning objectives, and land use plan requirements. The management goals define the desired outcomes or results that the CRC seeks through its overall management of coastal resources. A second part is a planning objective, which defines the more immediate role that local land use plans play in achieving the management goal. And finally, planning requirements are specific minimum content requirements for policies that are included in land use plans to address the Management Topics.
If for some reason the local government cannot meet any land use plan requirement, then it may include an alternative strategy or plan of action to address the management topic. In this case, however, the plan must explain the analysis that was undertaken and the reason that the requirement could not be met [.0802 (c)(3)(D)]. The Management Topics require two levels of policy analysis. At a more general or summary level, you are required to demonstrate that the policy framework of the plan – goals, policies, and future land use map – will “guide land use and development in a manner that is consistent with the … management topics” [.0702(d)(2)(A)]. A second, more detailed analysis is required to determine the impact of the plan’s policies - including the future land use map - on the management topics. If any negative impacts are identified, you must develop a mitigation strategy. Approaches for meeting these policy analysis requirements are presented later in this section. The Management Topics establish parameters for local policies, and you are required to develop specific policies in each of these areas. The topics are also a tool for organizing
DEFINITIONS Management goals are the desired outcomes or results that the CRC seeks through its overall management of coastal resources. Planning objectives defines the immediate role that local land use plans play in achieving the management goal. Planning requirements are specific minimum content requirements for policies that are included in land use plans to address management topics.

FY02-03 65
your policy development process. However, you should tailor the local government’s specific goals and policies to local concerns, needs, and opportunities.
Management Topics Required Policy Analysis
• Impact of CAMA LUP policies on Management Topics
1. Describe type and extent of analysis completed to determine impact.
2. Describe both positive and negative impacts of policies, including the policies depicted by the Future Land Use Map.
3. Describe approach to mitigate any negative impacts identified.
• Consistency of plan with management topics – summary evaluation showing how local goals, policies, and future land use map will guide development in a manner that is consistent with the goals, objectives, and planning requirements.

FY02-03 66
4.3 Guidelines for Developing the “Plan” Guidelines for developing land use and development policies that comply with the CRC’s planning requirements are set out in this section. The guidelines indicate what is necessary to meet the specific plan requirements. In some cases, the guidelines suggest that the policies go beyond the minimum requirements so that they may more effectively address local planning needs. 4.3.1 Setting Land Use and Development Goals The first step in developing the plan is to set the community’s land use and development goals. Goals are the desired ends toward which the policies and programs of the land use plan are directed. Goals are often considered to be the values and general principles that guide the development of the community. They put in words the community’s preferred future. Goals also provide a benchmark for developing effective policies and programs to achieve the desired future. The desired ends in the goal statements may be fairly general, and they should be consistent with the desires expressed in the vision and address the community’s key issues and concerns. Goals usually are not time-bound. Examples of land use and development goals include high-quality estuarine waters, universal access to rivers, creeks and sounds, safety from natural hazards, and safe, decent and affordable housing.
There is no mandatory process for setting goals and no required format or content for goal statements. The guidelines require you to consider two initial plan elements in developing goals: the community concerns and aspirations [.0702(b)] and the needs and opportunities identified in the analysis of existing and emerging conditions [.0702(c)]. In addition, the land use goals must be consistent with the planning themes in the Land Use Plan Management Topics [.0702(d)(2)(A)]. The following checklist will help you write goal statements that address the plan
DEFINITIONS Goals are the desired ends toward which the policies and programs of the land use plan are directed. Objectives are intermediate, attainable steps toward goals; they are usually more specific than goals, and they are usually time-bound. Unlike goals, they frequently contain standards or criteria that make it possible to determine whether an objective is met or not.

FY02-03 67
requirements: c List the most important goal themes for your planning area. Table 4.1 contains
some common coastal land use planning issues that you may want to consider as a starting point for writing goal statements. You should add or delete from this list to address the specific needs and circumstances of your local government and the planning area.
c Management Topic goals and planning objectives. Keep in mind that land use goals must be consistent with the Management Topics. Each management topic has a goal and planning objective that should be considered in setting land use goals. This is not to suggest that these goals and objectives should not be modified or combined with other planning themes to accurately address local needs and concerns.
c Review existing programs and plans. Existing local plans, such as the current land use plan, transportation plan, and capital improvement plan, are a starting point for writing goal statements. In addition, goals from regulatory programs, such as CAMA and state and federal water quality programs, may be helpful.
c Focus on the most important issues, concerns, and opportunities. More is not necessarily better when writing goal statements. The number of goal statements should represent the “essential few” rather than the “important many.” Please consider defining a limited number of goals, say seven to nine, in order to reduce overlap, to make it easier to develop and organize policies, reduce duplication, and to make the overall plan more cohesive.
c Make the goal statements short and succinct.
Table 4.1 Categories to Consider When Developing Goal Statements
• Community growth patterns • Natural systems • Water quality • Natural and manmade hazards • Community character and design • Manmade resources, including
historic resources • Local economy
• Land use • Housing • Transportation systems • Community facilities and services • Local budget policy • Public access to beaches and public
trust waters • Cooperation with other agencies
Generally, planners prepare an initial draft of the goal statements. This initial draft is fine-tuned with input from the lead planning group, the citizen participation process, local government agencies, and possibly the elected board.

FY02-03 68
What about objectives? You are not required to include objectives in local land use plans; however, we recommend it. Objectives help identify the steps that will be taken to achieve the community’s goals and strengthen the link between the goals and the local government’s policies. Objectives also make it easier to complete the required analysis of your policies to demonstrate that they address the Management Topics. And finally, objectives make it easier for the local government to measure its progress toward attaining its goals and to assess the effectiveness of its plan. An example of a goal and related policy objectives are shown below.
Example Land Use Plan Goal
High-Quality Estuarine Waters Objectives
• To maintain the current miles and acres of SA waters rated as “fully supporting” for the period of the plan.
• To reduce the frequency of closures of shellfish harvesting areas in the County’s SA waters by 25% within 10 years.
4.3.2 Formulating Land Use Plan Policies The second step in developing the plan is to frame the land use policies. For the purposes of the CAMA land use plan, policies are a consistent set of principles and decision guidelines or courses of action, adopted by the elected board, that are intended to attain the local government’s land use and development goals and objectives. The policies will guide both day-to-day and long-range decisions and actions of the local government. They may assist with a zoning decision or they may guide long-range planning for a sewer system. They may also provide the foundation for the specific actions that the local government will take to implement the plan. As a result of the range of purposes that they serve, there may be a significant range in the content and specificity of the policies that you develop. Generally, the guidelines require you to include two types of policies in the land use plan. Basic policies deal with the central issues of land use planning, such as the following:

FY02-03 69
• Level of growth desired • Open space and conservation
of resources • Urban or community
development
• Rural development • Natural hazard mitigation • Economic development • Transportation systems • Community facilities
Land use and development policies, and the associated future land use map, are the second type. These policies are closely tied to basic policies, but are more detailed. And they relate primarily to the land classifications or generalized land use designations, the land use principles and guidelines included in the classification or designation, and their spatial distribution on the future land use map.
What is required? You have a good deal of flexibility in developing policies. However, the planning guidelines have three major requirements that affect policy content. These requirements are:
1. Policies must be consistent with the goals of the Coastal Area Management Act and other applicable state and federal rules;
2. Policies must effectively guide development and use of land in a manner that is consistent with goals, planning objectives, and land use plan requirements of each Management Topic; and
3. If a policy has a negative impact on any Management Topic, the plan must include additional policies, methods, programs, and/or processes to mitigate the negative impact.
Significant policy analysis must be completed to address the consistency requirement. You will need to develop policies to address the Management Topics, and you will need to consider the interrelationships among Management Topics and community goals. You should maintain a clear link between the policies and the goals that they are intended to achieve. The language of the policies should be as clear and concise as possible. Keep in mind that in addition to the role that they play in local government, policies are regulatory and are used by the Division of Coastal Management in making consistency
DEFINITION Policies are a consistent set of land use and development principles and decision guidelines or courses of action, adopted by the elected board, that are planned to attain the local government’s goals and objectives.

FY02-03 70
determinations for issuance of CAMA permits. And finally, the policies should be given a consistent and sequential numbering system so that there will be no confusion as to what is a policy and what is a goal or other text. The checklist in section 4.3.5 (Table 4.2) is provided to help you ensure that the policies are consistent with the intent and the requirements of the Management Topics.
Strategies that address nonpoint source pollution to improve water quality are an important component of CAMA land use and development policies. A manual on nonpoint source pollution management is available from the Division of Coastal Management (see Appendix). This manual provides information strategies to manage nonpoint source pollution. 4.3.3 Selecting the Land Use Classification Scheme Developing the Future Land Use Map is a two-part process. The first part is deciding on the land use classification scheme that is most appropriate for the goals and policies that have been developed. The second part of the process is to apply the land use classifications to the planning area, i.e. to create the Map. The guidelines give you flexibility to design a land use classification scheme that best addresses the needs of the planning area and the local government. You should consider the community’s goals, basic policies, the purposes for which the plan is used, and the local government’s capacity to implement the plan.
Guidelines for Basic Policies ü Maintain clear link between goals
and policies ü Be consistent with CAMA goals ü Guide land use in manner
consistent with Management Topics
ü Address negative impacts on Management Topics with mitigation strategy
ü Be clear and concise ü Use consistent numbering system ü Avoid “apple pie” statements

FY02-03 71
The familiar land classification and related growth management strategy approaches, the land use design approach, or combinations of these approaches are all acceptable. Generally, counties or more rural planning areas may opt for a land classification or growth-management approach; more highly developed areas and municipalities may choose the land use design approach. The chart below illustrates these three basic land use plan formats. While design of the details of the land use classification scheme is basically a planner responsibility, there are some requirements that the scheme must meet:
1. Conservation Areas or Open Space. A category for conservation or open space must be included. The policies related to this classification must detail the land uses and activities that are compatible with its purpose.
2. Growth and Development Areas. Classifications of land planned for future growth and development must describe the land uses that are encouraged or discouraged; the overall density and development intensity that is planned; and any infrastructure that is required to support planned development. These same requirements are found in the Management Topics. You should review basic policies to ensure consistency.
3. In-fill, Preservation, and Redevelopment Areas. If applicable, classifications for in-fill, preservation, and/or redevelopment should be included along with any standards that will apply in these areas.
Land Classification Approach – Typical Class Descriptions *
− Developed − Urban transition − Limited transition − Community − Rural − Conservation
* N.C. CAMA Planning Guidelines, 1995.
Growth Strategy Map – Typical Mapped Descriptions*
− Growth center − Village center − Growth corridor − Enterprise corridor − Conservation
corridor
* Lenoir County LUP; correspondence with Glenn Harbeck, AICP.
Land Use Design –Typical Functional Area Descriptions*
− Conservation areas − Living areas − Shopping areas − Work areas − Community facility
systems * Kaiser, Godschalk, and Chapin, Urban Land Use Planning, pg. 282.
In addition to these requirements, you will need to include land use and development

FY02-03 72
criteria within each classification or designation that address the appropriate land use plan requirements of the Management Topics. The checklist in section 4.3.5 (Table 4.2) is a guide to these requirements.
Land Classification/Designation Requirements 1. Conservation or open-space category required. Must describe
compatible land uses and activities. 2. Growth and development categories must detail densities and
development intensities that are planned. 3. Preservation or redevelopment categories included if appropriate. 4. Land use and development criteria within each category must address
relevant land use plan requirements. 4.3.4 Designing the Future Land Use Map While most of the details of creating the Future Land Use Map are left to the planner, the guidelines have minimal requirements for information to be included on the map and for analysis of the land use patterns shown on the map. These requirements are outlined below: 1. The map must include the boundaries of the 14-digit hydrological units encompassed
by the planning area. 2. The map must show existing and planned infrastructure – roads, sewer, and water.
You also are required to include an estimate of the cost of any major community facilities that the local government plans to extend or develop.
3. You must compare the mapped future land use patterns with the composite map of natural systems and the land suitability map. If there are material differences, then the local government’s policies must include a strategy or method to mitigate any negative impacts. To avoid issues with this requirement, you will need to follow carefully the natural systems mapping and the land suitability map in designing the future land use map.
4. You are required to calculate the amount of land allocated to various land use classifications on the map and to compare this to your earlier projection of land needs. The amount of land allocated may not exceed the projected need. You should keep this requirement in mind when the projections are done. The land-needs projection requirement is found in the guideline section that outlines requirements for existing land use analysis [.0702(c)(3)(iv)].
In addition to the explicit map requirements outlined above, the spatial patterns shown on the map must be consistent with the local government’s policies that address the

FY02-03 73
Management Topics. These Management Topic requirements related to the spatial patterns of the land use classifications are summarized below: 1. Must clearly depict the land use and community development patterns encouraged by
the local government. 2. Must be consistent with natural systems composite map and land suitability map. 3. Must be consistent with local government’s water quality policies – impaired and
fully supporting watersheds. In addition, you may want to include optional information, such as the location of planned public access points, on the map. 4.3.5 Policy Checklist Table 4.2 is a checklist to assist you in meeting the requirements of the Management Topics. It includes guidelines for both basic policy content and the land use classifications and spatial patterns of the future land use map. The land use plan requirements are shown in bold type in the checklist. Other statements are only suggestions to make the local policies more comprehensive or to address the overall management topic more thoroughly.
Table 4.2. Land Use Plan Management Topics Checksheet for Policy Development
and Land Classification System
1. Basic Policy Content Guidelines 2. Future Land Use Map
A. Public Access c Set local criteria for frequency and types of
access for all segments of the community, including “universal access.” Criteria should meet needs of current and anticipated population, permanent and seasonal.
c Establish specific policies to address access to proposed beach nourishment areas in planning areas where applicable.
c Establish clear approach or strategy for implementing criteria. May include general locations for access points and priority for development.
c Identify feasible funding options for access development.
c General location of planned access points. (optional)
B. Land Use Compatibility c Establish local mitigation strategies and
programs to manage the impacts of land development on natural resources and
c Description of each land classification (designation) shown on the Future Land Use Map must include residential density and

FY02-03 74
1. Basic Policy Content Guidelines 2. Future Land Use Map
fragile areas. Examples include flexible site planning, vegetative buffers, stormwater management, and impervious surface budgets.
development intensity criteria that address the constraints of natural systems and land suitability factors. Examples are development density and intensity criteria.
c Spatial patterns of land classifications and the overall purpose of each land classification must be consistent with the natural systems composite map and the land suitability map.
C. Infrastructure Carrying Capacity c Identify priority areas for public investment in
upgrade and extension of community facilities. Identification of priority areas includes consideration of the composite map of natural systems and the land suitability map.
c Description of each land use classification must include any community infrastructure required to support planned land uses and development in that classification.
c Spatial patterns of land classifications that depend on provision of roads, water, sewer, or other community facility must be consistent with the map of community facilities [.0702 (c)(4)].
D. Natural Hazard Areas c Establish land use and development principles
that conserve the storm-protection functions of beaches, barrier dunes, flood plains, wetlands, and other natural features.
c Land classifications planned for natural hazard areas must be consistent with the risks to life and property and with the overall objective of reducing vulnerability.
c Planned land uses and the intensity of development must be consistent with the capacity of planning area’s existing and planned evacuation infrastructure.
E. Water Quality c Establish effective land use and development
principles and strategies, and programs that, in combination with other measures, will restore impaired waters to full use. Local programs should be prioritized according to the water quality classification, including ORW and HQW, and tailored to the level of existing development in the watershed. Policies must specifically address restoration of shellfish waters if present in the planning area.
c Establish policies to protect fully supporting waters. Examples of protection measures include: minimizing number and width of streets; reducing size of paved parking areas; sidewalks installed on only one side of residential streets; stormwater BMPs; and vegetated street and stream buffers. Policies must specifically address protection of shellfish waters if present in the planning area.
c Establish measures that help prevent or control Nonpoint Discharges in the planning area are required.
c Spatial patterns of land classifications and their purpose and intent must be consistent with the local government’s water quality policies . ¨ Impaired watershed – land use
classifications consistent with restoration policies.
¨ Fully supporting watershed – land use classification consistent with protection policies.
(Watershed defined as 14-digit hydrological unit.)
F. Local Concerns

FY02-03 75
1. Basic Policy Content Guidelines 2. Future Land Use Map
c Policies must address any additional local land use and development goals other than those covered specifically by Management Topics. These policies may include the following: ¨ Community growth and development
patterns ¨ Environmental quality ¨ Natural and manmade resources ¨ Local economy ¨ Community facilities and services ¨ Housing ¨ Others: ¨ ___________________________ ¨ ___________________________
c Spatial pattern of land use classifications consistent with the local government’s policy on the community development pattern encouraged by the plan.
c Identify any areas or locations subject to individual policies. Examples include neighborhoods, commercial areas, and waterfront areas.
c Planned infrastructure consistent with local community facilities policies.

FY02-03 76
4.4 Conducting Required Policy Analysis 4.4.1 Demonstrating Plan Consistency with Management
Topics You are required to “demonstrate how the land use and development goals, policies and future land use map … will guide development in a manner that is consistent with the specific management goals(s), planning objective(s), and land use plan requirements of each Management Topic” [.0702 (d)(2)(A)]. The template outlined below is designed to provide you with a framework and guide for demonstrating that your plan’s goals, policies, and future land use map will guide development in a manner that is consistent with each component of the Management Topics. Ideally, you will complete the analysis in each section of the template as you develop the required components of the “Plan for the Future” element. For example, an analysis of the goal statement to determine their consistency with the Management Topics should be completed before moving on to formulate land use and development policies. This step-by-step evaluation will help to ensure consistency as the plan is developed and avoid complicated course corrections at the end of the process.
Policy Analysis Template Demonstrating Consistency of Plan with Management Objectives
1. Describe the consistency between the plan’s goals and the Management Topics.
What are the local government’s goals in the following areas? A. Public access B. Land use compatibility (reduction of impacts of land use and development on
natural systems) C. Infrastructure carrying capacity (upgrade and extension of facilities to
accommodate planned growth) D. Natural hazards areas (reducing vulnerability) E. Water quality F. Issues and concerns identified by the local government

FY02-03 77
2. Summarize the general direction of the policies.
A. What is the local government’s strategy for creating public access? B. How will the policies mitigate the impacts of land use and development on natural
resources and fragile areas? C. How will the policies phase development and extension of water and sewer with
community growth and development? D. How will the policies conserve the storm protection functions of the planning area’s
natural features? E. What is the local government’s strategy for protecting and restoring water quality? F. How do the policies address local concerns as identified by the local government?
3. Describe the consistency between the future land use map and the land use plan
requirements. A. Summarize the residential density and development intensity encouraged by each of the
land classifications or land use designations on the map. B. Identify any material differences between the development patterns shown on the map
and the development constraints shown on the natural systems composite map (must be included in plan) and the land suitability patterns shown on the land suitability map (not required in plan). If there are material differences, briefly describe the plan’s mitigation strategy.
C. Describe any material differences between the spatial patterns of land classifications that depend on water and sewer and the planned development or extension of water and sewer. How are these differences addressed by policies?
D. Natural hazards (1) Describe the types of land uses, the residential density, and the development
intensity planned for natural hazard areas and describe how these planned uses are consistent with the associated risks.
(2) Describe the capacity of the evacuation infrastructure and the strategy for managing development to conform to it.
E. Describe how the land classifications and the spatial patterns shown on the map will protect open shellfish waters and restore closed or conditionally closed shellfish waters.
4.4.2 Description of the Analysis to Determine the Impact of
Policies on Management Topics
The second policy analysis requirement is that the plan contain “a description of the type and extent of analysis completed to determine the impact of CAMA Land Use Plan policies on the

FY02-03 78
management topics. … ” You must describe “both positive and negative impacts of … policies on the management topics.” And finally, if the policies have any negative impacts on Management Topics, then you are required to describe “the policies, methods, programs and processes (either currently in place or included in the plan) to mitigate any negative impacts … ” [.0702 (d)(2)(B)]. A simple matrix is provided to give you a framework for describing your analysis of the impacts of policies on Management Topics. The intent of this matrix is to address the requirement for determining impacts in a manner that does not require lengthy and complicated written descriptions. To simplify the analysis, the goals, planning objectives, and land use plan requirements for each management topic have been summarized into one or two benchmarks. These benchmarks make it somewhat more efficient to determine policy impacts. To use the matrix, first list the policies in the column on the extreme left-hand side. To conserve space, you may want to list the policy number and a key word or phrase in this column rather than the entire policy. Next you will compare each policy to the management topic benchmarks and indicate whether it is beneficial, neutral, or detrimental to attainment of the policy benchmark. The benchmarks shown in the matrix are for guidance only. Local planners can develop their own benchmarks that reflect local planning circumstances. For policies that are judged to be either beneficial or detrimental to a management topic, you will need to provide a brief summary of the analysis that led you to that conclusion. And finally, if your analysis identifies policies that may have a negative impact on a management topic, then you should first examine ways to adjust that policy to eliminate the negative impact(s). If this is not feasible, then you will need to develop policies, methods, program and processes to mitigate these impacts. The local government may already have these tools in place and it will only be necessary to describe how they mitigate the negative impacts.

FY02-03 79
Table 4.3. Policy Analysis Matrix Land Use Plan Management Topics Policy Benchmarks – Indicate whether policy beneficial, neutral, or detrimental
Management Topics Public access
Land use compatibility Infrastructure Natural hazards Water quality Local concerns
Land Use and Deve lopment Policies
• more planned access locations
• upgrades to existing access locations
• reduction in habitat loss and fragmentation related to impacts of land use and development
• reduction of water resource and water quality degradation
• water, sewer, and other key community facilities and services being available in required locations at adequate capacities to support planned community growth and development patterns
• land uses and development patterns that reduce vulnerability to natural hazards
• land uses and development patterns that take into account the existing and planned capacity of evacuation infrastructure
• land use and development criteria and measures that abate impacts that degrade water quality
• Benchmarks to address management topics for local concerns
Public access: __________________________
Land use compat ibility: __________________________
Infrastructure: __________________________
Natural hazards: __________________________
Water quality: __________________________
Local concerns: __________________________

FY02-03 80
5.0 Tools for Managing Development
The final element of the CAMA Land Use Plan, “Tools for Managing Development,” is arguably the most important because it contains the local government’s strategy and action plan for implementing its policies. In this element, the guidelines require the planner to identify and describe the tools and the actions that the local government has selected to implement its land use plan. It includes four parts:
1. Role of the land use plan in local decisions. A description of the role of the plan and the status of its policies in the local government’s land use and development decisions.
2. Existing development management program. A description of the local government’s existing policies, ordinances, codes, and regulations and how they will be coordinated and employed to implement the land use and development policies.
3. Additional tools. Any additional tools, such as new or amended ordinances, capital improvements, purchase of property, or other specific projects, selected by the local government to implement the plan must be described.
4. Action plan and schedule. The local government must include a description of the priority actions that it will take to implement the plan and a general schedule for accomplishing these actions.
Guidelines for each of these requirements are discussed below.
5.1 Role and Status of the Plan In describing the “role and status” of the plan, planners need to consider how the plan will be used by the local government – elected and appointed officials – and the community in making decisions about or that affect land use and development. It is generally accepted that the policies and the future land use map are decision-making guides and that they do not have the force of law. However, in considering the roles and status of the plan, planners should keep in mind that the policies and the map are frequently used in a “regulatory” manner in the issuance of state and federal permits. For example, consistency with the local land use plan is a major consideration in the issuance of major and minor CAMA development permits. The plan and its policies serve a short-term purpose. In a plan developed by Glenn Harbeck, AICP, a specific example of “How to Use the Policies” for a rezoning request is included:

FY02-03 81
• By the petitioner – Consult the policies to formulate a request that is consistent with the policies, thereby increasing the chances of approval.
• By the planning staff – Review request in light of policies, pointing out those policies: (1) that support the petition; (2) that are in conflict; and (3) that carry the most weight, thereby shaping the overall staff response.
• By the Planning Board – Planning Board members can make individual determinations as to the consistency of the request with the policies. They may consider staff recommendations, but may choose to give different weights to the policies.
• By the general public – Residents can reference the policies when speaking in favor of or against a petition.
• By the Elected Board – The elected board can take into account and weigh the policy interpretations by the petitioner, the staff, the Planning Board, and residents, as well as its own interpretations and priorities in making its decision.
The plan also serves important long-term functions. It gives guidance to new development management tools and to major adjustments of existing tools. The plan may be used be used in the development of plans for major capital facilities, such as sewer systems or new highways. And finally, it may guide the development of plans for projects that support implementation of the plan.
5.2 Existing Development Program The guidelines require that the plan include the following related to development management: (1) a description of the local government’s existing development management program; (2) a description of the role that this program will play in implementing the plan; and (3) a description of the steps that the local government will take to coordinate the ordinances and codes to implement the plan. The local government’s existing development management program includes all of the ordinances, regulations, codes, policies, and directives that affect land use and development in the planning area. The extent of the program will vary considerably from community to community. Step 1. Inventory components of the existing development management
program and describe how the provisions of each will assist to implement the land use policies and the future land use map.
The following is a list of potential ordinances, codes, policies, and so on that may have been adopted or implemented by the local government. After it is determined which of these items apply, include a brief statement of how each will be used to implement the plan. These statements can be organized according to the six Management Topics [.0702(d)(3)]. For example, the stormwater ordinance may have a requirement for

FY02-03 82
maintaining a vegetative stream buffer that supports the policies developed to address the Water Quality management topic. Or the community’s subdivision regulations may require developers of property adjoining public trust waters to provide public access, which would address the Public Access management topic. This inventory is also an opportunity to identify major adjustments or amendments that are needed to make the existing development program components more effective tools for implementing the plan. For example, these items may include zoning ordinance amendments or new subdivision regulation provisions. When developing this inventory, it will also be helpful to identify the department or agency that is responsible for managing the program so that any needs for coordination can be addressed.
Possible Components of the Existing Development Management Program • Zoning ordinance • Flood plain ordinance • Stormwater management ordinance • Subdivision regulations • Vegetation preservation ordinance • Open-space preservation ordinance • Conservation design ordinance • Dune protection • Lighting ordinance • Airport zoning • Building inspection • Minimum housing code • Historic preservation • CAMA local permits • Farmland preservation • Official map ordinance for road r-o-w • Capital improvement program and budget • Sewer extension policy • On-site wastewater treatment policy • Others…
Step 2. Determine the local government’s approach to coordinating these
regulations and policies. Coordination of the various components of the development management program can be an important part of effective implementation of the plan. Coordination processes may be in place and the planner will only need to describe it. If improvements are needed, the

FY02-03 83
plan should identify those needs and outline the steps that will be taken. Sometimes coordination can be as simple as a regular meeting of all members of the “development management team” to review development proposals. In other cases coordination may be more complicated and may involve restructuring of the review process. For the most part, the individuals charged with the responsibility for administering these programs are the “experts” and they will be able to assist planners in designing a workable “coordination” process if one is required.
5.3 Additional Tools Local governments are permitted to choose any additional tools (in addition to those already included in the existing development management program) that will be used to implement the plan. These decisions will involve consideration of the effectiveness of the existing program, any implementation needs not addressed by the existing program, and the capacity of the local government. If additional tools will be used for implementation, the plan must include a description of each. Four categories of additional tools are listed in the guidelines. They are the following: 1. Ordinances
A. Describe any amendments or adjustments that will be made to existing development codes for consistency with the plan.
B. Describe any new ordinances or codes that will be developed and considered for adoption by the local government.
2. Capital improvements program A. Describe any new, upgraded, or expanded capital facilities that will be undertaken
for the purpose of implementing the plan, or that will be designed and located in a manner that supports the plan’s policies.
B. Describe any new facility extension or connection policies or amendments to existing policies that the elected board will consider to support the plan.
3. Acquisition program – Describe any planned acquisition of property, easements, or rights-of-way specifically designed to implement the plan. Examples include the purchase of a buffer or a public access point.
4. Specific projects – Examples may involve activities such as a comprehensive stormwater study, a watershed protection plan, or specific coordinated steps to improve water quality.
In developing this list of additional tools, please bear in mind that the guidelines, as described in the next section, require the development of an action plan and schedule.
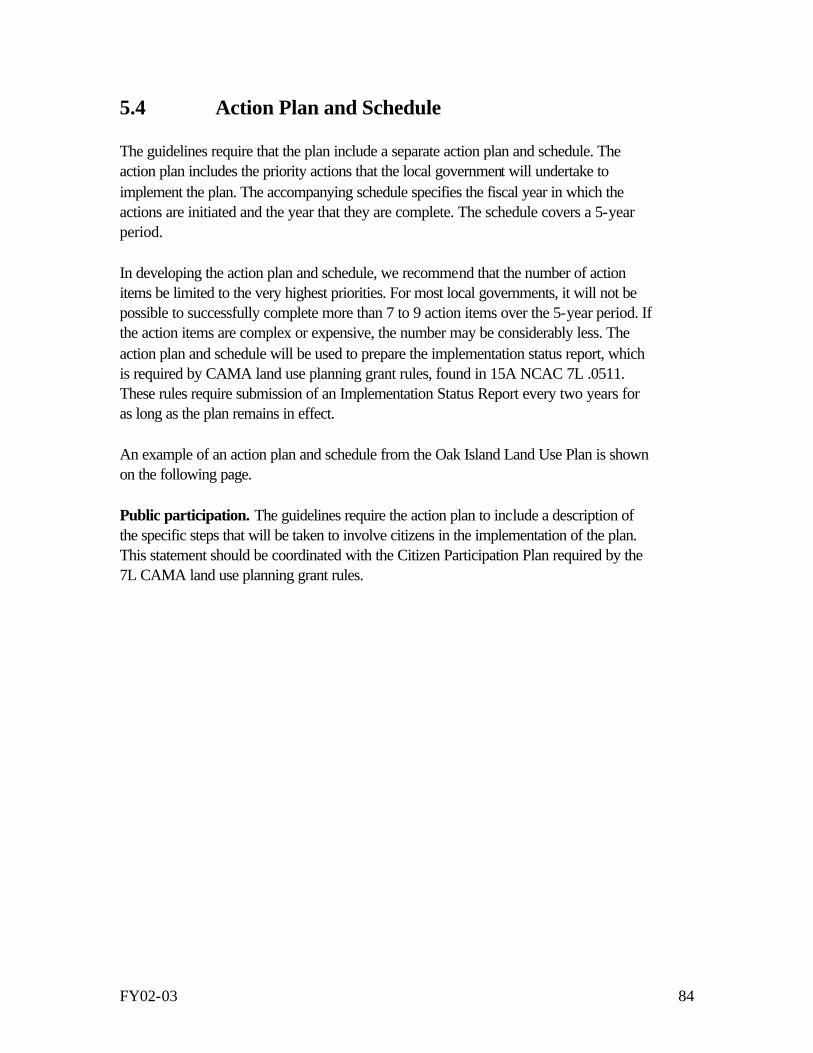
FY02-03 84
5.4 Action Plan and Schedule The guidelines require that the plan include a separate action plan and schedule. The action plan includes the priority actions that the local government will undertake to implement the plan. The accompanying schedule specifies the fiscal year in which the actions are initiated and the year that they are complete. The schedule covers a 5-year period. In developing the action plan and schedule, we recommend that the number of action items be limited to the very highest priorities. For most local governments, it will not be possible to successfully complete more than 7 to 9 action items over the 5-year period. If the action items are complex or expensive, the number may be considerably less. The action plan and schedule will be used to prepare the implementation status report, which is required by CAMA land use planning grant rules, found in 15A NCAC 7L .0511. These rules require submission of an Implementation Status Report every two years for as long as the plan remains in effect. An example of an action plan and schedule from the Oak Island Land Use Plan is shown on the following page. Public participation. The guidelines require the action plan to include a description of the specific steps that will be taken to involve citizens in the implementation of the plan. This statement should be coordinated with the Citizen Participation Plan required by the 7L CAMA land use planning grant rules.

FY02-03 85
SCHEDULE POLICY
REFERENCES
IMPLEMENTATION ACTION
BEGIN
END 1.1 Soil Suitability 1.2 Wetlands
Protection 1.3.3 Estuarine
Shoreline Protection
1.5 Ocean Hazards 1.6 Flood Plains 2.0 Land Use and
Development 6.1 Storm-Risk
Mitigation 6.2 Development in
Hazardous Areas
1. Continue to enforce local codes on building and developmentzoning, subdivision regulations, State Building Code, flood damage prevention, stormwater regulations, and dune protection regulations.
These codes are the Town’'s basic plan implementation tools. Their proper enforcement achieves several important land use goals:
• protection of sensitive natural areas; • maintenance and improvement of water quality; • elimination of unreasonable risk to life and property in hazard areas; • guiding community growth and development in a manner that preserves its “small-
town atmosphere”; and • creating land use patterns that recognize the values of the community’'s natural
resources. The planning and code -enforcement staff will review zoning proposals and subdivision plans with respect to the septic tank and foundation limitations of the soils found on the development sites.
On-going
1.2.1 Coastal Wetland Protection 1.3.3 Estuarine Shoreline Pro-tection 1.5 Ocean Hazards
2. Continue to work toward implementing a local CAMA development permit program using contracted services. A local permit officer will allow the Town to improve its services to property owners and developers. However, it will also offer the Town an opportunity to educate and inform property owners on alternative development practices and techniques that will improve the overall environmental
FY 98-99

FY02-03 86
SCHEDULE POLICY
REFERENCES
IMPLEMENTATION ACTION
BEGIN
END 6.1.3 Development Permitting for Wetlands
quality of development. Examples include the importance of preserving trees and vegetation and the use of alternative techniques such as breakwaters or riprap to stabilize shorelines.
1.1 Soil Suitability 1.2.1 Freshwater Wetlands 1.3.3 Estuarine Shoreline 1.4 Tree Preser-vation 1.5 Ocean Hazard Areas 2.0 Land Use and Development 3.3 Bikeways 3.4 Sidewalks
3. Planning Board review of current building and development codes to determine consistency with Land Use and Coastal Management policies. This review will focus on the codes adopted by the Town Council: zoning ordinance, subdivision regulations, flood damage prevention ordinance, and stormwater ordinance.
The Planning Board will make recommendations to the Town Council on any required code adjustments needed to maintain consistency with Land Use Plan policies. Encouraging and permitting flexible site planning to protect sensitive natural areas is a requirement for implementing key policies. The Planning Board will specifically address code changes required to permit this flexibility.
FY 99-00 FY 99-00
1.1 Soil Suitability 1.3 Water Quality 4.1 Regional Sewer 4.2 Package Treatment Plants
4. Initiate planning for central wastewater treatment system. The wastewater plan will involve multiple phases and will be coordinated with the county wastewater committee and other local governments in the region. Each phase will be reviewed and approved by the Town Council before proceeding to the next step.

FY02-03 87
SCHEDULE POLICY
REFERENCES
IMPLEMENTATION ACTION
BEGIN
END Phase One. Background Information. Compilation of existing information and
past studies on wastewater treatment needs, alternatives, costs, and financing options.
Phase Two. Wastewater Master Plan. Detailed existing and projected needs analysis, review and recommendation of most effective treatment alternative, plan for outfalls and collection system, environmental assessment, cost analysis, and financial plan.
Phase Three. System Design. Preparation of detailed plans and specifications and detailed cost estimates.
FY 99-00 FY 00-01 FY 01-02
FY 99-00 FY 01-02 FY 02-03
1.2 Wetland Protection 1.3 Water Quality 4.2 Regional Wastewater Treatment 4.3 Stormwater Management
5. Develop comprehensive stormwater program. Program will focus on both quality and quantity. It will address existing flooding problems, examine opportunities for significant reduction in the pollutants carried into surface waters by storm runoff, examine opportunities to retrofit “best management practices,” and continue to enforce the Town’s stormwater ordinance for new construction and development.
FY 00-01 FY 01-02
1.3 Water Quality 1.3.2 Estuarine Waters 4.3 Stormwater Management System
6. Develop water quality improvement plan and program for the Davis Creek Complex. Improving the water quality in the Davis Creek Complex will be the foundation project in the Town’s effort to improve the quality of estuarine waters. The program will use a range of appropriate techniques/technologies to improve the quality of existing discharges to the creek, to improve tidal flushing, and to enlist the support of property owners in the overall improvement efforts.
FY 99-00 FY 03-04

FY02-03 88
SCHEDULE POLICY
REFERENCES
IMPLEMENTATION ACTION
BEGIN
END The Town will consider purchase of property and easements to implement improvement plans. Multiple sources of funding assistance will be sought to support the improvement program.
2.3 Protection of Homes Along Middleton 3.0 Transportation 6.4.3 Timely Evacuation
7. Seek approval of the Second Bridge at Middleton and the new access road. The Town will advocate approval of the second bridge project by the N.C. Department of Transportation. It is the Town’s policy to seek a bridge location at Middleton Street and an access road alignment that runs generally north-south from Midway at N.C. 211 to Middleton.
• The Town, in cooperation with the NCDOT, will develop a plan to protect the
homes and residentially zoned property along Middleton. This plan will be included in Second Bridge Project Plan.
• The Town will cooperate with Brunswick County to develop a regional approach to implementation of the Second Bridge Corridor Plan to protect the corridor and the sensitive natural areas from inappropriate development.
FY 99-00 FY 99-00 FY 99-00
FY 99-00 FY 99-00 FY 99-00
1.5.6 Preserve “The Point” 6.3 Strategic Acquisition
8. Implement the management plan for “The Point.” The Town will continue to seek financial assistance to implement the acquisition and development plan for The Point, a fragile area located on the west end of Oak Island in an ocean and inlet hazard area. Acquisition and development will require assistance from multiple
FY 99-00 FY 03-04

FY02-03 89
SCHEDULE POLICY
REFERENCES
IMPLEMENTATION ACTION
BEGIN
END funding sources as well as the Town of Long Beach.
1.5 Ocean Hazard Areas 6.1 Storm Risk Mitigation
9. Implement beach preservation plan. Long Beach is a member of the Brunswick Beaches Consortium, which is preparing a beach preservation strategy that includes renourishment, annual maintenance, property acquisition, public education, and funding advocacy. Concurrent with development of the preservation strategy, the Corps of Engineers is conducting a feasibility study for a Federally funded beach renourishment project. This study will be complete in the year 2000 and will be the basis for seeking Congressional and State funding for a renourishment project.
• The Town will implement an on-going comprehensive beach preservation program. • The Town will develop a funding strategy for the non-federal cost share of the beach
renourishment project that includes securing State funding and identifying local matching funds.
FY 99-00 FY 03-04

EXHIBIT 1 CAMA LAND USE PLAN
LOCAL GOVERNMENT SCOPING CHECKLIST
FY02-03 90
Date of Scoping Visit: ______________________________________________ Local Government: ________________________________________________ CRC Certification Date of Current LUP: ________________________________ County Tier Designation as determined by the Division of Community Assistance: ____________________________________ Population (per 2000 Census): _______________ Growth Rate: High _____ (>18.4%) (Check one) Moderate _____(9.2 - 18.4%) Low _____(<9.2%) Type(s) of Plan for Which Local Government Qualifies (workbook, core, advanced core): ____________________________________ Identify CAMA Areas of Environmental Concern (AECs) within the planning jurisdiction: Public Trust Areas:______________________________________________ Estuarine Waters:_______________________________________________ Coastal Shoreline:_______________________________________________ Ocean Hazard Areas:____________________________________________ Natural & Cultural Resource Areas:_________________________________ Public Water Supplies:___________________________________________

FY02-03 91
Community Profile Yes No 1. Does the jurisdiction have any development regulations (Subdivision Ordinance, Zoning,
etc.)? Comment:
2. Have there been major rezoning or ordinance changes since the last CAMA Land Use Plan (LUP) update?
Comment:
3. Has the jurisdiction significantly grown since the last CAMA LUP update?
Comment:

FY02-03 92
Community Profile Yes No 4. Does the community have major conflicts with adjacent jurisdictions, including the county (if
applicable)? Comment:
5. What is the local attitude towards land use planning and land use planning tools such as
zoning, etc.? Comment:
6. Are any changes or new trends currently taking place within any segment of the local economy?
Comment:
7. Has major industry or a large employer either left or moved into or near the community since the last CAMA LUP update?
Comment:

FY02-03 93
Community Profile Yes No
8. Has the community experienced significant storm damage since your last CAMA LUP update and to what extent?
Comment:
9. Does the community have a hazard mitigation plan approved by the N.C. Division of Emergency Management?
Comment:
10. Is the community experiencing an increase in nuisance flooding from stormwater runoff? Comment:
11. Does the community have significant infrastructure deficiencies?
Comment:

FY02-03 94
Community Profile Yes No
12. Does the community have any sensitive environmental features unique to the area? Comment:
13. Are there transportation enhancements planned or under way in the area that will potentially affect land use in the jurisdiction?
Comment:
14. What capacity does the local government have to administer the planning process (Planning staff, Town Manager, Administrator)?
Comment: As a result of scoping, ________________ (workbook plan, core plan, advanced core plan or fall under the county plan) is recommended for the local government. If the local government wishes to apply for funding for a different type of CAMA land use plan, justification must be provided at the time of grant application. _____________________________ Date _________ _____________________________ Date___________ Local Government Representative Division of Coastal Management District Planner

EXHIBIT 2 CAMA Land Use Plan Development
Checklist
FY02-03 95
c Citizen participation plan in accordance with 7L planning-assistance grant requirements
Community Concerns and Aspirations c Description of existing and emerging conditions
c Statement of key planning issues
c Vision statement
Analysis of Existing and Emerging Conditions Population, Housing, and Economy
c Permanent population growth trends
c Current permanent and seasonal population estimates
c Description of key population characteristics
c Estimate of current housing stock
c Description of local economy
c Short-term and long-term population projections
Natural systems analysis
c Natural features mapping and analysis
c Composite environmental map
c Description of environmental conditions
Analysis of Land Use and Development
c Existing land use map
c Analysis of existing land use
c Historic, cultural, scenic areas map (may be combined with existing land use)
c Projections of future land needs
Mapping and Analysis of Community Facilities
c Public and private water systems
c Public and private sewer systems
c Transportation systems
c Stormwater systems

FY02-03 96
Land Suitability Analysis
c Analysis of Land Suitability Map
Review of Current CAMA Land Use Plan
c Consistency of existing ordinances with current plan
c Description of success in adopting implementation measures
c Efficacy of current policies in achieving community goals
Plan for the Future c Land use and development goals
c Land use and development policies
c Description of consistency between policies and Management Topics
c Description of impact of policies on Management Topics
Future Land Use Map
c Shows watersheds
c Areas designated for conservation/open space
c Areas planned for future growth and development
c Areas for in-fill/redevelopment
c Existing and planned water, sewer, and roads
Tools for Managing Development c Description of the role and status of the plan
c Description of the existing development program
c Description of any additional tools that will be used for implementation
c Action plan and schedule

1
APPENDIX
Nonpoint Source Pollution Information for Coastal North Carolina Local Governments
Jason Jolley, Watershed Education for Communities and Local Officials North Carolina State University, Raleigh, North Carolina
This document was produced with funds provided by the National Oceanic and Atmospheric Administration through
the North Carolina Department of Environment and Natural Resources, Division of Water Quality and Division of Coastal Management jointly administered Coastal Nonpoint Source Program (Award #NA070Z0171).

2
Nonpoint Source Pollution Information for Coastal North Carolina Local Governments
PURPOSE................................................................................................................................................................................4
BASICS OF HYDROLOGY AND HYDRAULIC PROCESSES....................................5
Infiltration and Runoff ...........................................................................................................................................................5 Watersheds, Streams, Rivers, and Estuaries......................................................................................................................6 Impact of Land Use on Stream Hydrology.........................................................................................................................6 Development/Urbaniza tion ...................................................................................................................................................6 Agricultural, Forestry, and Livestock Management Practices.......................................................................................8
NONPOINT SOURCE POLLUTION.......................................................................................................10
CATEGORIES OF NONPOINT SOURCE POLLUTION AND ASSOCIATED NONPOINT SOURCE POLLUTANTS...................... 10 Urban......................................................................................................................................................................................10 Marinas/Boating...................................................................................................................................................................12 Hydromodification/Habitat Alteration..............................................................................................................................12 Agriculture.............................................................................................................................................................................12 Forestry ..................................................................................................................................................................................12 How Relevant Is Nonpoint Source Pollution to North Carolina and Coastal Communities?.................................17
TOOL BOX FOR PREVENTING AND TREATING NONPOINT SOURCE POLLUTION.....................................................................................................................................................................18
WATERSHED MANAGEMENT UNITS........................................................................................................................................ 18 LAND USE POLICY APPROACHES AND TECHNIQUES............................................................................................................ 20 1. POLICY STATEMENTS............................................................................................................................................................ 20
Following are examples of additional policy statements that can help address one or more NPS pollution categories:..............................................................................................................................................................................20 Overlay Zoning......................................................................................................................................................................24 Incentive Zoning....................................................................................................................................................................24 Urban Growth Boundaries..................................................................................................................................................24 Large-Lot Zoning..................................................................................................................................................................25 Infill/Community Redevelopment.......................................................................................................................................25 Watershed-Based Zoning.....................................................................................................................................................25 Transfer of Development Rights.........................................................................................................................................26
3. LAND CONSERVATION .......................................................................................................................................................... 27 4. RIPARIAN BUFFERS................................................................................................................................................................ 27 5. IMPROVED SITE DESIGN........................................................................................................................................................ 28
Open Space or Cluster Residential Subdivisions............................................................................................................29 Green Parking Lots ..............................................................................................................................................................29 Rooftop Runoff Management..............................................................................................................................................30 Residential Streets ................................................................................................................................................................31
6. EROSION AND SEDIMENT CONTROL.................................................................................................................................... 31 7. STRUCTURAL STORMWATER BEST MANAGEMENT PRACTICES (BMPS) ...................................................................... 32
Wet Ponds...............................................................................................................................................................................33 Stormwater Wetlands...........................................................................................................................................................33 Infiltration (Trenches/Wells)...............................................................................................................................................34 Sand Filtering........................................................................................................................................................................34 Bio-Retention Areas/Rain Gardens...................................................................................................................................35 Permeable or Porous Pavement.........................................................................................................................................35 “Reinforced” Grassy Swales/Open Channels.................................................................................................................35 Wetland and Stream Restoration.......................................................................................................................................35

3
BMPs and Stormwater Quality Practices in the Neuse River Basin of North Carolina..........................................36 8. NON-STORMWATER DISCHARGES....................................................................................................................................... 38 9. WATERSHED STEWARDSHIP PROGRAMS............................................................................................................................ 40
Watershed Advocacy............................................................................................................................................................40 Watershed Education ...........................................................................................................................................................40 Pollution Prevention............................................................................................................................................................40 Watershed Maintenance......................................................................................................................................................40 Watershed Indicator Monitoring........................................................................................................................................40 Watershed Restoration.........................................................................................................................................................40
SOURCES OF WATER QUALITY INFORMATION AND DATA.........................41
STATE GOVERNMENT SOURCES.......................................................................................................................... 41 FEDERAL GOVERNMENT SOURCES................................................................................................................... 44 NONPROFIT SOURCES.................................................................................................................................................. 45 UNIVERSITIES.................................................................................................................................................................... 46 SOURCES OF INFORMATION FROM OTHER STATES............................................................................... 47 NORTH CAROLINA LAWS AND REGULATIONS......................................................................................... 49 FEDERAL ENVIRONMENTAL LAWS AND REGULATIONS....................................................................................................... 53
SOURCES OF ADDITIONAL ASSISTANCE AND FUNDING FOR IMPLEMENTING URBAN NONPOINT SOURCE POLLUTION PROGRAMS......................................................................................................................................................................55
GENERAL STATE FUNDING..................................................................................................................................... 55 GENERAL FEDERAL FUNDING............................................................................................................................... 56 GENERAL PRIVATE/NONPROFIT FUNDING.................................................................................................. 56 STATE PLANNING FUNDING ................................................................................................................................... 56 PRIVATE/NONPROFIT PLANNING FUNDING................................................................................................ 57 FEDERAL EDUCATION FUNDING......................................................................................................................... 57 STATE RESTORATION FUNDING.......................................................................................................................... 57 FEDERAL RESTORATION FUNDING.................................................................................................................... 58 STATE PROTECTION FUNDING.............................................................................................................................. 59 FEDERAL PROTECTION FUNDING....................................................................................................................... 59 FEDERAL/STATE MONITORING FUNDING.................................................................................................... 59 STATE CONSERVATION FUNDING...................................................................................................................... 59
REFERENCES.................................................................................................................................................................61

4
Purpose This document was created to assist local governments with addressing the nonpoint source (NPS) pollution components of the Coastal Area Management Act (CAMA) land use planning guidelines. The document assists in increasing the understanding of NPS pollution, identifying land use planning tools that can be used to address NPS pollution, and identifying additional sources of information and funding to address NPS pollution.

5
Figure A-1: The hydrologic cycle. The transfer of water from precipitation to surface water and ground water, to storage and runoff, and eventually back to the atmosphere is an ongoing cycle. In Stream Corridor Restoration: Principles, Processes, and Practices (10/98). Interagency Stream Restoration Working Group (15 federal agencies)(FISRWG).
Basics of Hydrology and Hydraulic Processes
A key to understanding nonpoint source pollution, its effects, and practices to address it, is having a basic understanding of hydrology. With this knowledge, land use activities can be more readily planned and analyzed with respect to NPS pollution. A basic understanding of hydrology should begin with the hydrologic cycle. The hydrologic cycle refers to the cyclical transfer of water from rainfall to surface water and ground water, to storage and runoff, and to the return of water back to the atmosphere through evaporation to begin the cycle anew. Figure A-1 from the Federal Interagency Stream Restoration Working Group demonstrates the hydrologic cycle.
During rainfall events or precipitation, water reaches the earth’s surface. Water that does not return to the atmosphere through evaporation is runoff into water bodies or infiltrated into the soil. Understanding how this water interacts with the built environment is important in addressing NPS pollution. Infiltration and Runoff Infiltration describes the movement of rainfall into soil pores, which is not intercepted or runoff into water bodies. The measurement of the amount of water that soaks into the soil over a given amount of time is referred to as the infiltration rate and is affected by several factors, including: storage capacity of the soil, transmission rate through the soil, and ease of entry through the soil surface.
If the rate of rainfall exceeds the infiltration capacity of soil, the excess water travels downslope as runoff. Runoff is common in urban and suburban areas where paved and impervious surfaces are prevalent and where soils have been compacted because of heavy equipment or vehicles. An impervious surface can be defined as any surface or material that prevents water from infiltrating the soil. The effects of urban runoff will be discussed more thoroughly in later sections.

6
Impacts of Channelization • Less habitat for fish and other
wildlife; • Increased erosion and deposition of
sediment downstream; • A lower groundwater table; • Less cool groundwater, which is
beneficial for fish; • Compacted soil that further reduces
the capacity of the soil to infiltrate and store water;
• Rising of the streambed due to sediment deposit or lowering of the streambed due to erosion, depending on location.
Impacts of Urbanization • Increased flow rates, • Habitat loss, • Stream-bank erosion, • Channel widening, and • Streambed alteration.
Watersheds, Streams, Rivers, and Estuaries A watershed is defined as a land area that catches rainfall and drains the water to specific marshes, streams, rivers, lakes, or to ground water. When water from rainfall moves downslope it forms small stream channels that feed larger streams and water bodies. Groundwater rising to the surface as stream base flow also supplies water to streams. Topography, soil types, land use, and watershed area all affect a stream’s channel size and flow and surrounding stream corridor. While stream channels vary greatly, they represent a delicate balance between stream discharge, sediment particle size, stream flow, and stream slope; changes to any of these factors can affect the equilibrium of the stream and lead to destabilization. In coastal areas, tidal creeks and sounds are also present. Tidal creeks are water bodies connected to an intracoastal water body, and they are affected by the tides. Impact of Land Use on Stream Hydrology Human-induced disturbances, such as land use changes, and natural disturbances, such as hurricanes, can upset stream equilibrium and lead to changes in stream hydrology. Most streams are naturally sinuous and meandering with access to their floodplain, but destabilization can result in channelization of a stream. Channelization of a stream refers to the human engineering of a channel to enlarge, straighten, embank, or protect/create a channel. Channelization may result in the reduction of the length of the stream by straightening the mainstem, reducing meanders, reducing access to floodplain, and increasing the slope of the stream banks. Historically the channelization of rivers and streams has allowed for more efficient irrigation, helped control floods, and made rivers and streams more navigable. Along North Carolina’s coast, the creation of ditches to improve drainage and lower the groundwater table has also impacted hydrology by contributing to the loss of wetland function, including water storage, sediment trapping, and habitat. While channelization of a stream may provide rapid movement of floodwaters and other benefits, it can result in reduced habitat diversity. Also, during storm events, channelization can result in flooding and increased erosion and deposition of increased sediment downstream as stream velocity slows. Channelization can also increase the volume of freshwater runoff and impact salinity in coastal areas. Development/Urbanization Development – in particular, urbanization – can have a tremendous hydrologic impact on streams. Streams in urban watersheds possess a much different character than streams located in forest, rural, and agricultural watersheds. Much of the hydrologic impact that results from urbanization occurs as a result of the increase in impervious surfaces.

7
Impervious surfaces and lack of adequate riparian cover can lead to an increase in summer stream temperatures. Because impervious surfaces limit the infiltration of rainfall, less water is available to recharge groundwater resulting in reduced base-flow levels in streams. Impervious surfaces can lead to an increase in annual stormwater runoff by 2 to 16 times the predevelopment runoff rate, leading to stream bank erosion from high water-volume velocity.
Relationship Between Impervious Cover and Surface Runoff
Urbanization has a tremendous impact on hydrology and serves as a major cause of nonpoint source pollution. Impervious surfaces associated with urbanization replace vegetation and soil and prevent rainfall from infiltrating the ground, resulting in a “stormwater superhighway.” As Figure A-2 from the Federal Interagency Stream Restoration Working Group indicates, the level of impervious cover is directly related to the amount of surface runoff. As impervious cover increases, the amount of stormwater runoff increases and the level of infiltration in the soil
Figure A-2: Relationship between impervious cover and surface runoff. Impervious cover in a watershed results in increased surface runoff. As little as 10 percent impervious cover in a watershed can result in stream degradation. In Stream Corridor Restoration: Principles, Processes, and Practices (10/98). By Federal Interagency Stream Restoration Working Group (15 Federal agencies) (FISRWG).

8
Impacts of Stream Modification and Straightening for Agriculture • impaired floodplain surface and
subsurface flow • increased water temperature,
turbidity, and pH • unnaturally deepened channels • lower groundwater levels • stream-bank failure, and • loss of habitat for aquatic species.
decreases. As Figure A-3 demonstrates, impervious cover results in stormwater rapidly moving out of large areas and into streams, increasing “peak flow” or the maximum stream flow during storm events when compared to pre-development levels. Impervious cover also prevents infiltration of stormwater into the ground, resulting in lower groundwater table, decreased base flow in streams and less recharge of groundwater to streams during dry conditions. The location of impervious cover is also important and attempts should be made to influence the size and location of impervious cover in environmentally sensitive areas. Agricultural, Forestry, and Livestock Management Practices
In addition to water quality problems such as sediment and contaminants associated with agriculture (to be discussed in subsequent sections), hydrological problems can arise as a result of agricultural practices. Vegetation clearing along stream banks to acquire more land for farming can result in stream-bank erosion, unstable stream channels, and impaired habitat because the vegetated buffer is removed. Tillage and soil exposure and compaction can
affect hydrology by increasing the runoff rate, and decreasing the holding capacity of the soil. Tillage can result in the development of a hard pan, which is a dense layer of soil that decreases water infiltration. Irrigation and drainage are also common agricultural practices that can affect hydrology. Forestry can also affect stream hydrology from development of roads, skid-trails, and site preparation. Log skidding and forest roads can result in topsoil removal and soil compaction,
Figure A-3: A hydrograph demonstrating the impact of impervious cover on stream flow rate. Source: Schueler, Thomas. 1987. Controlling Urban Runoff: A Practical Manual for Planning and Designing Urban BMPs. Metropolitan Washington Council of Governments, Washington, DC. Found in United States Environmental Protection Agency. December 1997. Urbanization and Streams: Studies of Hydrologic Impacts. EPA 841-R-97-009. Office of Water, Washington, DC. http://www.epa.gov/owow/nps/urbanize/report.html#01.

9
leading to increased runoff. Soil disturbances can impact wildlife habitat and sediment from runoff can be detrimental to fish habitat, leading to or resulting in stream widening and stream-bank erosion. Grazing systems for livestock near stream corridors can lead to a loss of vegetative cover, leading to similar hydrological impacts that occur with loss of vegetation along stream banks common with agricultural practices. Loss of vegetative cover and livestock trampling soils can result in increased soil compaction, increased water temperature, increased runoff, and erosion.

10
Categories of NPS Pollution
Ø Urban Ø Marinas/Boating Ø Hydromodification/Habitat
Alteration Ø Agriculture Ø Forestry
Nonpoint source pollution refers to pollution that comes from many diffuse sources. NPS pollution is caused by rainfall or snowfall melting and picking up natural and manmade pollutants as it moves over ground, eventually depositing these pollutants in water bodies.
Impacts of Urbanization
♦ More stormwater reaching the stream because there is less opportunity to infiltrate the ground
♦ Peak flow increases because runoff water is rapidly transported from large areas
♦ Increased stream velocities, resulting in increased erosion of stream banks
♦ Lower stream base flow during dry weather because of less infiltration
Nonpoint Source Pollution NPS pollution differs from point source pollution, such as industrial and sewage treatment plants, in that it does not result from one specific traceable source (for example, piped discharge from an industrial or wastewater treatment plant would be considered point source pollution). NPS pollution includes nutrients, sediment, bacteria, freshwater, and toxic substrates (such as, heavy metals, petroleum products, and pesticides). Hydrologic modification is also considered a form of nonpoint source pollution because it adversely affects the biological and physical integrity of surface waters. It is estimated that 90% of the various types of pollutants that accumulate on the land during dry weather (in particular impervious surfaces) are carried away during the first one inch of runoff. This “cleaning” is often referred to as the “first flush,” and controlling or treating this first flush is very important to stormwater management and water quality protection.
Categories of Nonpoint Source Pollution and Associated Nonpoint Source Pollutants NPS pollution affecting water quality comes from a variety of sources. The EPA identifies seven categories of NPS pollution. For the purpose of this document, the category of “roads, highways, and bridges” has been combined with the “urban” category. Urban In addition to hydrological impacts of urbanization, sediments, nutrients, oxygen-demanding substances, pathogens, road salts, petroleum products, and heavy metals are all NPS pollutants found in urban runoff. These are detrimental to shellfishing, fishing and recreational water activities. In addition, as urban development occurs, roads, sewers, and pipelines can cross stream channels and result in partial or total barriers to upstream fish migration.
Impervious surfaces can concentrate pollutants during dry periods and rapidly transport these pollutants to water bodies in the form of stormwater runoff during rain. Urbanization and impervious cover in coastal areas are leading factors in shellfish bed closures in North Carolina. Impervious surface cover has been identified as an environmental indicator for water quality.

11
The Center for Watershed Protection has developed an impervious cover model, demonstrated in Table A-1, noting that there is a relationship between stream quality and impervious cover in a watershed. According to the model, streams can generally be classified into three categories: sensitive, impacted, and non-supporting. The model is only a predictor of potential and not actual stream quality, and should generally be applied only to smaller urban streams.
Table A-1: The Impervious Cover Model Stream Quality Category
Stream Characteristics % of Existing Impervious Cover in the Watershed
Non-impacted Streams
• Stable Channels • Excellent Habitat Structures • Good-Excellent Water Quality • Diverse Communities of Fish and Insects • Do Not Experience Frequent Flooding or
Hydrologic Changes from Urbanization
Zero to 10%
Impacted
• Alterations to Stream Hydrology • Erosion • Channel Widening • Unstable Stream Banks • Fair-Good Water Quality • Disappearance of Most Sensitive Fish and Insects
11% to 25%
Degraded
• A Conduit for Stormwater Flows • No Longer Support a Habitat for Fish Spawning or
Aquatic Insects • Highly Unstable Stream Banks, Channel Widening,
and Erosion • Fair-Poor Water Quality • Recreational Water Use May Be Prohibited
Because of Bacteria and Pollution Levels
Greater than 25%
Source: Adapted from Center for Watershed Protection, Inc. October 1998. Rapid Watershed Planning Handbook: A Comprehensive Guide for Managing Urbanizing Watersheds.
As the model limitations indicate, it is important to note that levels of impervious cover are not always effective indicators of water quality. Studies have also shown that stormwater flows can lead to poor water quality and bacteria loading in areas with less than 5 percent impervious cover. Water quality can be poor in rural areas with limited impervious surface because of pollutants from agriculture, forestry, and livestock management practices. Even in urban areas, the presence of best management practices (BMPs) and riparian cover and regional differences can influence the relationship between impervious cover and water quality. Location of impervious cover is also an important factor in
determining its influence on water quality. Natural and human-made wetlands and riparian areas serve an important function in the removal of NPS pollutants from urban stormwater runoff and can be helpful in mitigating the impacts of impervious cover. BMPs will be explored more thoroughly in the “Tool Box for Improving Water Quality” section of this document.
Did You Know? Studies have shown impervious cover has a direct impact on nitrogen entering coastal and estuarine areas, and increases of bacteria levels from urban runoff can have adverse economic impact on shellfishing, fishing, and tourist industries.

12
Marinas/Boating Marinas are often located adjacent to the water’s edge, leaving no buffer to filter pollutants from marina activities. Pollutants and chemicals are also generated from boat maintenance and operation. Construction of marinas can result in alteration and destruction of wetlands and shellfish areas. Sewage discharge from recreational boats can reduce dissolved oxygen in the water and harm fish populations. Shellfish located near marinas have been shown to have higher concentrations of pollutants and metals than shellfish harvested at sites where marinas are not present. Boat propellers can disrupt sediments, increasing turbidity and destroying water plants. High concentrations of boats in areas with little flushing can result in high levels of fecal coliform. Hydromodification/Habitat Alteration Hydromodification occurs when streams are channelized, dams are constructed, and stream banks and shorelines erode. Channelization can result in diminished in-stream and streamside habitat for fish and wildlife. It can also lead to sediment erosion, transport, and deposition and increased movement of water and NPS pollutants downstream. Construction and operation of dams can result in erosion and sedimentation, covering shellfish beds and contributing to increased nutrients and turbidity. Stream-bank/shoreline erosion also impacts riparian/vegetative habitat. Agriculture The primary agricultural nonpoint source pollutants are nutrients, sediment, animal wastes, salts, and pesticides. Agricultural activities can also have potential impacts on the habitat of aquatic species. Industrial animal production and use of manure on fields can provide a source of fecal coliform pollution and lead to shellfish-harvesting closures in coastal areas. Livestock can also disturb soil and vegetation, leading to sedimentation and turbidity, a cloudy condition in water due to suspended silt or organic matter. Destruction of vegetation near streams can increase water temperature. Runoff of pesticides and nutrients from fertilizers can also negatively impact water quality. Forestry Forestry practices can also impact water quality and serve as sources for nonpoint source pollution. Removal of trees in close proximity to a stream can increase stream flows and result in stream-bank erosion. Forest roads and skid trails created by mechanically loading logs can result in sedimentation, erosion, soil compaction, and petroleum spills from mechanical equipment. Table A-2 highlights nonpoint source pollutant categories, NPS pollutants and conveyance methods, and impacts. For the purposes of this table, the NPS category “roads, highways, and bridges” and associated pollutants is discussed under the urban NPS category.

13
Table A-2: Summary Table for NPS Categories, Pollutants, and Associated Impacts Category Pollutants Conveyance
Sources Impacts
Urban Nutrients (Nitrogen/ Phosphorus)
• Lawn fertilizers
• Urban stormwater runoff
• Pet waste
§ Stormwater runoff transports nutrients to surface water bodies
§ Nutrients lead to algae blooms that die and lower oxygen levels, harming fish habitat
§ Algae blooms become noxious, discolor water, and limit boating and swimming.
§ Nitrates in groundwater used for drinking are dangerous for newborn infants
Urban Sediment • Increased stormwater flows due to impervious cover
• Construction sites
§ Sediment fills wetlands, can destroy fish and shellfish habitat, and cover fish spawning areas and food supplies. Fis h gills can also be clogged with sediments.
§ Water clarity is reduced, impacting recreation and plant growth
§ Eroding sediments can contain high concentrations of nutrients
Urban Bacteria/ Pathogens/ Fecal Coliform
• Pet Waste • Failing
septic/sewer systems
§ Stormwater runoff can deposit pet waste and sewage from failing septic and sewer systems into water bodies.
§ Bacteria from animal waste, including fecal coliform, can result in fish kills and closures for harvesting of shellfish
§ Beaches can also be closed for recreational use § Drinking water can be contaminated § People eating contaminated shellfish/fish can
develop intestinal/ stomach problems Urban Salts/Salinity • Runoff of road
salts § High salt concentrations can harm freshwater
streams. § High salinity can stunt fish reproduction and kill
fish. Urban Pesticides/
Herbicides • Direct
application and runoff of these substances
§ Pesticides can kill aquatic insects and reduce fish food supply
§ Can cause reproductive and bone development problems in fish.
§ Food source for higher organisms in food chain can be destroyed.

14
Table A-2: Summary Table for NPS Categories, Pollutants, and Associated Impacts Category Pollutants Conveyance
Sources Impacts
Urban Car Pollutants and Heavy Metals
• Roads, Highways, and Bridges
§ Heavy metals affect fish and shellfish reproduction and can impact food chain
§ People consuming contaminated fish/shellfish can develop fetal defects and brain damage
§ Petroleum products accumulate in sediment, resist breakdown, and are toxic to fish in low amounts
§ Potential carcinogen to people § Oil and grease accumulate on and runoff of
impervious surfaces such as roads, parking lots, and bridges.
§ Urban runoff may contain heavy metals § Improper disposal practices for oil and other
chemicals from “do-it-yourself” auto mechanics Urban High Water
Temperature • Stormwater
runoff § Water temperature can increase as shade
vegetation is removed and increased flows result from impervious surfaces
§ High water temperature can harm fish because oxygen is reduced.
Urban Low Dissolved Oxygen
• Stormwater runoff with high concentrations of decaying organic matter, such as grass and shrub clippings
§ Decomposing organic matter, such as logs, create biochemical oxygen demand, thereby decreasing the amount of dissolved oxygen. This can affect fish reproduction and lead to fish kills.
Marinas/Boating Sediment • Stormwater runoff
• Boating
§ Sediment fills wetlands, can destroy fish habitat and cover fish spawning areas, and food supplies. Fish gills can also be clogged with sediments.
§ Boat propellers uproot water plants and disrupt sediments, creating turbidity
§ Water clarity is reduced, impacting recreation and plant growth
§ Eroding sediments can contain high concentrations of nutrients
§ Waves generated by boats can increase erosion of shoreline and result in increased sedimentation
Marinas/Boating Bacteria/ Pathogens/ Fecal Coliform
• Marina stormwater runoff
• Sewage discharge from recreational boats
§ Stormwater runoff containing pet or animal waste can result in closures for harvesting of shellfish and for recreational use
§ People eating contaminated shellfish/fish can develop intestinal/ stomach problems

15
Table A-2: Summary Table for NPS Categories, Pollutants, and Associated Impacts Category Pollutants Conveyance
Sources Impacts
Marinas/Boating Car/Boat Pollutants and Heavy Metals
• Spills and leaks from boat operation, maintenance, and repair
• Petroleum leaks and spills from boats
§ Heavy metals affect fish and shellfish reproduction and can impact aquatic food chain
§ People consuming contaminated fish/shellfish can develop fetal defects and brain damage
§ Petroleum products accumulate in sediment, resist breakdown, and are toxic to fish in low amounts
§ Potential carcinogen to people Marinas/Boating Low
Dissolved Oxygen
• Sewage discharge from recreational boats
§ Sewage discharge from recreational boats requires dissolved oxygen to decompose. This leads to biochemical oxygen demand and results in low levels of dissolved oxygen.
Hydromodification/ Habitat Alteration
Sediment • Dams and associated maintenance and construction
§ Sediment fills wetlands, can destroy fish and shellfish habitat and cover fish spawning areas, and food supplies. Fish gills can also be clogged with sediments.
§ Water clarity is reduced, impacting recreation and plant growth
§ Eroding sediments can contain high concentrations of nutrients
Hydromodification/ Habitat Alteration
Salts/Salinity • Excavation projects
§ High salt concentrations can harm freshwater streams.
§ High salinity can stunt fish reproduction and kill fish.
§ Excavation projects can reduce flushing of rivers/streams and lead to saltwater intrusion.
Hydromodification/ Habitat Alteration
High Water Temperature
• Dams § High water temperature can harm fish because oxygen is reduced.
Hydromodification/ Habitat Alteration
Low Dissolved Oxygen
• Dams § Decomposing organic matter, such as logs, create biochemical oxygen demand, thereby decreasing the amount of dissolved oxygen. This can affect fish reproduction and lead to fish kills.
Agriculture/ Forestry
Nutrients (Nitrogen/ Phosphorus)
• Fertilizers • Livestock
manure • Irrigation
water • Sudden
removal of large quantities of trees
§ Stormwater runoff transports nutrients to surface water bodies
§ Nutrients lead to algae blooms that die and lower oxygen levels, harming fish habitat
§ Algae blooms become noxious, discolor water, and limit boating and swimming.
§ Nitrates in groundwater used for drinking are dangerous for newborn infants

16
Table A-2: Summary Table for NPS Categories, Pollutants, and Associated Impacts Category Pollutants Conveyance
Sources Impacts
Agriculture/ Forestry
Sediment • Erosion from agricultural and grazing practices
• Removal of
trees • Erosion caused
by forest roads and “skid trails” from movement of trees
§ Sediment fills wetlands, can destroy fish habitat and cover fish spawning areas, and food supplies. Fish gills can also be clogged with sediments.
§ Water clarity is reduced, impacting recreation and plant growth
§ Eroding sediments can contain high concentrations of nutrients
§ Forestry and agriculture practices can lead to loss of riparian vegetative cover, which increases water temperature, wildlife habitat loss, and negative impacts to streams, such as erosion and stream-bank widening.
Agriculture Bacteria/ Pathogens/ Fecal Coliform
• Livestock waste/ excrement
• Manure
§ Stormwater runoff and livestock having direct access to streams can deposit animal waste into water bodies.
§ Bacteria from animal waste, including fecal coliform, can result in closures for harvesting of shellfish
§ Beaches can be closed for recreational use § Drinking water can be contaminated § People eating contaminated shellfish/fish can
develop intestinal/ stomach problems Agriculture Salts/salinity • Irrigation
leaching § High salt concentrations can harm freshwater
streams. § Irrigated water has a natural base load of mineral
salts that can be left behind after water is consumed by plants or evaporated.
§ High salinity can stunt fish reproduction and kill fish.
Agriculture Pesticides/ Herbicides/
• Direct application and runoff of these substances
• Leakage from storage tanks
§ Pesticides can kill aquatic insects and reduce fish food supply
§ Can cause reproductive and bone development problems in fish.
§ Food source for higher organisms in food chain can be destroyed.
Agriculture/ Forestry
High Water Temperature
• Grazing practices and agricultural practices and herbicides can remove shade vegetation and trees
§ High water temperature can harm fish because oxygen concentration is reduced.

17
Table A-2: Summary Table for NPS Categories, Pollutants, and Associated Impacts Category Pollutants Conveyance
Sources Impacts
Forestry Automobile/Machinery Pollutants and Heavy Metals
• Fuel, oil, and coolants that may leak or spill from forestry equipment
§ Heavy metals affect fish and shellfish reproduction and can impact food chain
§ People consuming contaminated fish/shellfish can develop fetal defects and brain damage
§ Petroleum products accumulate in sediment, resist breakdown, and are toxic to fish in low amounts
§ Potential carcinogen to people. Forestry Low
Dissolved Oxygen
• Organic debris such as residual logs, slash, litter, and soil organic matter fall or are dumped into streams
§ Logs in streams can alter flows and form dams § Decomposing organic matter, such as logs,
create biochemical oxygen demand, thereby decreasing the amount of dissolved oxygen. This can affect fish reproduction and lead to fish kills.
Sources: Adapted from United States Environmental Protection Agency. Guidance Specifying Measures for Sources of Nonpoint Pollution in Coastal Waters. EPA 850-B-92-002. Office of Water, Washington, DC; United States Environmental Protection Agency. Controlling Nonpoint Source Runoff Pollution from Roads, Highways, and Bridges. August 1995 EPA 841-F-95-008a. Office of Water, Washington, D.C.; Center for Watershed Protection, Inc. October 1998. Rapid Watershed Planning Handbook: A Comprehensive Guide for Managing Urbanizing Watersheds. How Relevant Is Nonpoint Source Pollution to North Carolina and Coastal Communities? In North Carolina’s 1998 Water Quality Assessment Report to the U.S. Environmental Protection Agency, 34% of the state’s wetlands were rated as impaired. According to the report, 14% of North Carolina’s freshwater rivers and streams were impaired and 6% of the estuaries were impaired. Impaired waters do not meet water quality standards or they meet water quality standards, but occasionally exhibit exceedances of state standards. In updates to basin plans since 2000, estuarine water quality has been assessed more rigorously by the N.C. Division of Water Quality (DWQ). This new assessment approach has enabled DWQ to better identify water quality problems related to algal blooms, shellfish harvesting, swimming and fish consumption. In the White Oak River Basin, 28,058 acres or 24 percent of the shellfish harvesting waters were impaired because of bacteria associated with nonpoint source runoff. There are also 4,238 acres impaired for shellfish harvesting in the Neuse River basin. In the Neuse River basin, over 30,000 acres of estuarine waters are impaired because of algal blooms. A large percentage of the nutrients driving algal blooms are attributed to nonpoint source pollution associated with urban and agricultural land use. Nonpoint source runoff in estuarine waters adjacent to urban areas also threatens the use of the waters for swimming. Many areas of the coast are posted with swimming advisories because the waters receive stormwater runoff that has the potential to carry large amounts of bacteria.

18
Tool Box for Preventing and Treating Nonpoint Source Pollution A variety of land use planning techniques and policy options are available for a community to consider in addressing its nonpoint source pollution management and general water quality problems. This section will provide a brief overview of land use tools, such as zoning, development and design standards, ordinances, and best management practices (BMPs), and include success stories highlighting what North Carolina communities have done to address their water quality problems. Given a limited amount of economic resources, each community will have to decide how to best allocate those resources to protect water quality and prevent NPS pollution. Communities may have to make difficult decisions about protecting healthy waters within areas that have limited development or concentrating on improving degraded water quality in highly developed or urban areas.
Watershed Management Units
It is important for a planner to understand the different watershed management units and the way they relate to one another. Watersheds may range in size from one acre or less for a small pond to thousands of acres for a river basin such as the Cape Fear. Presented below are three different watershed hierarchies that are used by different organizations. 1. Federal Watershed Hierarchy Most federal government agencies, including the U.S. Geological Survey (USGS) and the Natural Resources Conservation Service (NRCS) use a national uniform hydrologic unit system that is sponsored by the Water Resources Council. This system defines watershed areas as hydrologic units (HU) and divides the country into 21 regions, 222 subregions, 352 accounting units and 2,149 cataloging units. A hierarchical code consisting of two digits for each of the above four levels combines to form an 8-digit HU (referred to as a cataloging unit). An 8-digit HU generally covers an average of 975 square miles. In North Carolina there are 54 of these HUs or cataloging units. River basins, the largest drainage areas, are usually composed of several 8-digit HUs. These 8-digit units have been further subdivided into 11- and 14-digit units in the national scale. The 14-digit unit is the smallest scale used.
Quantity in N.C.
Typical Area (sq. miles)
Range (sq. miles)
Name
8-digit HU 54 975 625 to 3,125 Cataloging Unit 11-digit HU 438 120 15.6 to 391 Sub Unit 14-digit HU 1,602 31.8 1.58 to 238.8 Recording Unit 2. State Basinwide Planning Watersheds In North Carolina, the Division of Water Quality also has a system for identifying watershed management units that adds a layer to the national system. This “subbasin” level was established for a variety of reasons that took into account the number of permitted discharges, regional

19
office/state boundaries, and the larger 8-digit hydrologic unit boundaries within a particular basin. The DWQ system identifies basins as the largest drainage areas, subbasins as a secondary level and watersheds (14-digit HUs) as the smallest level. Subbasins are assigned unique 6-digit codes and typically contain several 14-digit HUs. There are 133 subbasins in the state. Water quality data, use support ratings and permit information are reported by DWQ at the subbasin level. Although subbasins are uniquely numbered, the boundaries generally mesh with the national system in that one or more subbasins fit entirely within the 8-digit HUs. Each basinwide water quality plan contains a table explaining how the DWQ system fits into the national system for that particular basin. 3. Watersheds for Local Planning Table A-3 shows how the Center for Watershed Protection and the Metropolitan Washington Council of Governments outline some basic characteristics of the five watershed management units they recognize. The table also shows how the national hydrologic system relates to these units. Like North Carolina, this hierarchy includes basins and subbasins. It also adds three smaller units (from largest to smallest): watershed, subwatershed, and catchment. The table also identifies the influence of impervious cover within a management unit. The most important thing to note is that the greatest impacts of impervious surface occur in the smaller watershed management units, such as the catchment and subwatershed. Table A-3 also indicates that the management focus for addressing water quality varies depending on the size of the watershed management unit. BMPs and site-design standards are generally effective in catchment areas as tools for addressing water quality. Land use planning generally occurs most often at the subwatershed, watershed, and subbasin levels.
Table A-3:Characteristics of Five Watershed Management Units
Watershed Management Unit
Typical Area (in Sq. miles)
Influence of Impervious Cover
Primary Planning Authority
Management Focus
National Hydrologic Unit System
Catchment 0.05 to 0.50 Very strong Property owner Local government
Site-Specific Designs
___
Subwatershed 1 to 10 Strong Local government
Stream Management, Land Use Plans and Policies
Watershed 10 to 100 Moderate Local or Multi-local governments
Watershed-Based Zoning, Land Use Plans and Policies
14-digit Hydrologic Unit
Subbasin 100 to 1,000 Weak Local, Regional, and State governments
Basin/Regional Planning
Closer to 11-digit HU but not exactly aligned
Basin 1,000 to 10,000
Very weak State, Multi-State, and Federal government
Regional Planning Several 8-digit Hydrologic Units
Source: Adapted from Schueler, Tom. Environmental Land Planning Series: Site Planning for Urban Stream Protection. December 1995. Center for Watershed Protection and Metropolitan Washington Council of Governments.

20
The Center for Watershed Protection’s Rapid Watershed Planning Handbook: A Comprehensive Guide for Managing Urban Watersheds identifies eight watershed protection tools that can be used to improve water quality. For the purpose of this manual, policy statements have also been added as a watershed protection tool. These techniques are: 1. Policy Statements 2. Land Use/Watershed Planning 3. Land Conservation 4. Aquatic Buffers 5. Better Site Design 6. Erosion and Sediment Control 7. Stormwater BMPs (Best Management
Practices) 8. Non-Stormwater Discharges 9. Watershed Stewardship Programs
Land Use Policy Approaches and Techniques Using the tools as outlined in the sidebar, this section will draw upon a variety of sources to identify land use policy approaches that can address nonpoint source pollution.
1. Policy Statements Local governments can develop their land use plans in a manner that reflects the communities’ environmental concerns, including nonpoint source pollution. Local governments may wish to make policy statements reflecting the communities’ goals for environmental protection or future development. In turn, the various tools at the local governments’ disposal can be used to implement these policies. For example, a local government may develop a policy on limiting infrastructure extensions into areas that are environmentally sensitive. For example a policy statement may read: “The extension of infrastructure (e.g. sewer, water, etc.) into environmentally sensitive areas shall be limited, except in those areas which are already substantially developed and experiencing groundwater and nonpoint source runoff problems.” This can be used to discourage development in undeveloped sensitive resource areas by steering it to areas appropriate for such growth and development – with the intent of protecting water quality. A local government could also issue a policy statement designed to limit impervious surface coverage in environmentally sensitive watersheds. The example statement may read: “The county will limit the percentage of impervious cover to X% in John Doe Creek Subwatershed in an effort to address urban stormwater runoff and associated nonpoint source pollution.” Following are examples of additional policy statements that can help address one or more NPS pollution categories: • Natural drainage systems, including riparian and shoreline habitats, shall be maintained and
enhanced to protect water quality, reduce public costs, protect fish and wildlife habitat, and prevent environmental degradation. In county areas where a basin is shared with an adjacent county, the county will coordinate regulations to manage basins and natural drainage systems which include provisions to: a. Protect the natural hydraulic and ecological functions . . . ; b. Control peak runoff rate and quantity of discharges from new development to approximate pre-development rates;

21
c. Preserve and protect resources and beneficial functions and values through maintenance of stable channels, adequate low flows, and reduction of future storm flows, erosion, and sedimentation.
• The county will work with state and federal agencies to ensure water quality is maintained or enhanced through control of runoff and best management practices to maintain natural aquatic communities and beneficial uses.
• The county will work with state and federal agencies to develop local standards that will be designed to protect the natural environment. The tools to achieve this include: seasonal and maximum clearing limits; impervious limits; surface-water management standards that emphasize preservation of natural drainage systems and water quality; and groundwater recharge and best management practices for resource-based activities.
• New development shall be sited and designed to protect water quality and minimize impacts to coastal waters by incorporating measures designed to ensure the following: • Protecting areas that provide important water quality benefits, areas necessary to maintain
riparian and aquatic biota and/or that are susceptible to erosion and sedimentation loss. • Limiting increases of imperious surfaces. • Limiting land disturbance activities such as clearing and grading, and cut-and-fill to
reduce erosion and sedimentation loss. • Limiting disturbance of natural drainage features and vegetation.
• New development shall not result in the degradation of the water quality of groundwater
basins or coastal surface waters, including ocean, coastal streams, sounds, or wetlands. Runoff pollutants shall not be discharged or deposited such that they adversely impact groundwater, oceans, sounds, coastal streams, or wetlands, to the maximum extent feasible.
• A water quality checklist shall be developed and used in the permit-review process to assess potential water quality impacts.
• New roads, bridges, culverts, and outfalls shall not cause or contribute to stream or riverside erosion or creek or wetland siltation and shall include BMPs to minimize impacts to water quality, including construction and post-construction erosion control plans and soil-stabilization practices. Wherever space is available, dispersal of sheet flow from roads into vegetated areas or other onsite infiltration practices shall be incorporated into bridge and road design.
• Commercial development shall incorporate BMPs designed to minimize runoff of oil, grease, solvents, phosphates, and suspended solids to any stormwater system or ditches.
• New development that requires a grading/erosion control plan shall include provisions for applying temporary ground cover of graded or disturbed areas. Permanent landscaping and re-vegetation of graded or disturbed areas is also required at these sites. An integrated vegetation management plan shall also be required and implemented. Use of native or drought-tolerant, non-invasive plants shall be required to minimize the need for fertilizer,

22
pesticides, herbicides, and excessive watering.
• New septic systems shall be sited and designed to ensure that impacts to sensitive environmental resources are minimized, including those impacts from grading and site disturbance and the introduction of increased amounts of water.
• Development within and adjacent to sensitive resource areas shall be limited to low-density residential of less than one unit per acre. However, higher densities may be conditionally permitted provided development is: • Clustered to reduce the impact to adjacent riparian and coastal wetlands areas; and, • Does not increase the overall gross density of the project area; and, • That adequate buffer area exists between the disturbed areas and adjacent shoreline and
wetland areas.
• The county will not approve new divisions of land within or adjacent sensitive resource areas that require the extension of county water or sewer lines of greater than 400 ft. until a preliminary analysis of the project area has been undertaken that determines the following: • That the size and shape of the proposed lots will not require the filling of wetlands to
provide adequate building sites on each property. • That the extension of water and or sewer infrastructure will not bisect wetland areas in
such a manner to allow for additional connections for existing lots.
• New development within or adjacent to locations of environmentally sensitive habitats (within 100 feet unless sites further removed would significantly disrupt the habitat) shall not significantly disrupt the resource. Within an existing resource, only those uses dependent on such resources shall be allowed within the area.
Environmentally sensitive habitat areas are settings in which plant or animal life (or their habitats) is rare or especially valuable due to their special role in an ecosystem. These areas include: wetlands and marshes; coastal streams and adjacent riparian areas; habitats containing or supporting rare and endangered or threatened species; marine habitats and coastal areas used by migratory and permanent birds for resting and feeding.
• In new development, a buffer strip shall be required and maintained in natural condition along the periphery of all wetlands. If a project involves substantial improvements or increased human impacts, necessitating a narrower buffer area, it shall be limited to utility lines, pipelines, drainage and flood facilities, bridges and road approaches to bridges, and roads when it can be demonstrated: • Alternative routes are infeasible or more environmentally damaging; and • The adverse environmental effects are mitigated to the maximum extent feasible.

23
Collaborative Watershed Planning Watershed Education for Communities and Local Officials (WECO), a North Carolina Cooperative Extension Service program based out of the Department of Agricultural and Resource Economics at N.C. State University, has been working with stakeholders to develop and implement watershed plans since 1996. WECO’s main objective is to improve water quality through education of citizens and government officials who live and work in the watershed. This involves three main objectives: • Delivering technical information and educational material on
water quality; • Empowering local citizens by facilitating collaborative
partnerships at the watershed level between communities, local officials and state agencies; and
• Facilitating local stakeholder development of recommendations to improve water quality in their watershed.
Currently, WECO works with five watershed-planning groups throughout the North Carolina, including Carteret, New Hanover, and Onslow counties. WECO has identified several important steps in developing a collaborative watershed plan. These steps include: • Partnering with interested agencies/organizations • Speaking with local stakeholders to determine the best way
to proceed with watershed planning based upon local factors • Convening a local watershed planning group consisting of
watershed stakeholders • Establishing links between the group and local governments • Training the group in collaborative problem-solving and team
building • Gathering and sharing information related to issues of
concern • Collaboratively identifying and developing recommendations
for addressing water quality issues • Identifying and involving appropriate organizations for
funding and implementing recommendations. More information in WECO can be obtained by contacting Christy Perrin at (919) 515-4542 or [email protected]. WECO’s website can be accessed at http://www.ces.ncsu.edu/depts/agecon/WECO.
2. Land Use/ Watershed Planning Watersheds flow along hydrologic, rather than political boundaries, often making it necessary to involve multiple jurisdictions in developing watershed plans. Hence it is easier to develop solutions along county (political) lines, but it is more difficult to solve water quality problems. Conversely, the watershed-planning approach helps solve the communication problem by bringing together multiple governments to focus on a common solution. One effective method for developing watershed plans is to use a collaborative watershed planning process. This involves bringing together stakeholders who live and work in the watershed for the purpose of developing a watershed management plan. Stakeholders are individuals who are affected by or could affect water resources and could include farmers, non-farmer landowners, developers, commercial fishermen, recreationists, representatives from environmental and conservation organizations, local government officials, and state and federal agencies. Involving stakeholders can help in developing workable solutions to water quality problems. The support of local watershed stakeholders representing a variety of interests makes it easier for local governments to pursue water quality initiatives and watershed planning. One possible manner for local governments to implement land use planning related to water quality issues is through zoning changes. Following are several zoning techniques recommended for addressing water quality problems. All of them have been used in North Carolina.

24
Overlay Zoning Overlay zoning refers to superimposing an additional set of regulatory standards onto existing zoning provisions. An overlay zone can be used to address certain development uses or densities and to protect certain resources. Overlay zones can be used to protect wetlands, forests, or historic sites. One example of overlay zoning that restricts and limits future impervious area is impervious overlay zoning. Under this zoning, an imperviousness cap is set for a certain area based on estimates of the future environmental impacts of imperviousness and all developments must conform to the total imperviousness limit for the planning area.
Incentive Zoning This refers to a planning technique where developers are given a bonus (such as allowing more units to a parcel) in exchange for certain amenities or land use designs, such as compact development, trails, or open space. Urban Growth Boundaries This technique provides a boundary line between areas appropriate for urban and suburban growth and those areas appropriate for rural, agriculture, and resource protection. Boundaries are typically set for 10 to 20 years, but are revisited to determine if conditions have changed since they were established. Urban growth boundaries are sometime called development service districts and include areas
Watershed Protection Overlay Districts in North Carolina: Orange County
The State of North Carolina (G.S. 143-214.5) has developed a cooperative program, which is administered by local governments, for water supply watershed management and protection for existing or potential drinking-water rivers and reservoirs. Pursuant to this requirement, Orange County developed watershed protection overlay districts. In addition to applicable zoning requirements, areas covered by these watershed protection overlay districts also face additional land use restrictions, residential density restrictions, and other restrictions to protection water quality. Recognizing the impacts of development on water quality, the overlay districts also place limits on impervious surface coverage and require stormwater management and runoff control in the form of detention ponds and nonstructural stormwater control. More information can be obtained in the Orange County Code of Ordinances. The website http://fws.municode.com/CGI-BIN/om_isapi.dll?&softpage=NC_Group_List provides a list of searchable codes of ordinances for the State of North Carolina.
Examples of Flexible Development: Orange County
Orange County uses flexible development to assist in the preservation of certain cultural, environmental, rural, and agricultural features that may be lost through conventional development. One requirement of flexible development is that a developer seeking application for flexible development must set aside at least 33 percent of the total land area as protected open space. One option available under flexible development in Orange County is a conservation-cluster development. This type of development allows for density transfers and lots smaller than the minimum lot size traditionally permitted under the zoning ordinance in exchange for open space and other environmentally friendly requirements. Detailed information on Orange County’s flexible development requirements and regulations can be obtained in sections 46-82 of the Orange County Code of Ordinances. The website http://fws.municode.com/CGI-BIN/om_isapi.dll?&softpage=NC_Group_List provides a list of searchable codes of ordinances for the State of North Carolina, including Orange County.

25
where public services such as sewer, water, roads, etc. are already provided. Large-Lot Zoning Using this technique, jurisdictions utilize large lots with low densities and limited impervious cover over a large area to minimize impacts to surface waters. Densities can be as low as one lot per 2, 5, or 10 acres to minimize impacts. A negative associated with large-lot zoning is that it spreads development over a large area and contributes to sprawl. The road network required to connect these vast areas of low-density development can actually lead to more impervious cover in the watershed. Therefore, large-lot development must be limited in scope to the rural edges of a jurisdiction. If municipal services are directed away from these edges, then large-lot zoning can act as a boundary that would defer urban expansion outward and encourage infill development. Infill/Community Redevelopment This technique encourages new development to occur in unused or underused land parcels in urban areas, rather than building on new or green land sites. Special zoning and building-code changes and financial incentives can encourage infill development. Brownfield development is one form of infill development. The U.S. EPA defines a brownfield as abandoned, idled, or under-used industrial and commercial facilities where expansion or redevelopment is complicated by real or perceived environmental contamination. The North Carolina Brownfields Program encourages the safe reuse of abandoned properties that have some measure of environmental impairment. Under a “brownfield agreement” with a prospective developer, the N.C. Department of Environmental and Natural Resources defines the necessary cleanup and land-management actions, and the prospective developer receives liability protection that allows him/her to obtain previously unobtainable loans for the project. In doing so, the program serves as a tool to turn these abandoned properties into productive use rather than building in a greenspace area that may contribute to urban sprawl. Infill may also reduce impervious cover and NPS pollution because it encourages development in areas where impervious cover and infrastructure are already present. More information can be obtained at http://www.ncbrownfields.org/welcome.htm. Watershed-Based Zoning Most zoning in North Carolina is done by individual jurisdictions and is generally removed from impact on water quality. Watershed-based zoning better addresses water quality issues by evaluating the intensity of use/land coverage relative to a position within a watershed, but may require new legislation in North Carolina. This type of zoning differs from conventional zoning in that it relies on separating uses by type and density. Dwelling units per acre, which fails to account for transportation-related impervious cover such as roads, sidewalks, parking lots, etc, defines most residential zones. Watershed-based zoning uses the boundaries of the watershed and subwatershed as the foundation for land use planning and as a basis for future land use decisions. This is a helpful tool for relocating development out of certain subwatersheds. This type of zoning requires a comprehensive stream inventory to determine the overall health of streams and projections for future growth and impervious surface cover.

26
Example Ordinances The Stormwater Center offers several draft ordinances and examples of ordinances adopted by other communities that can be used to protect water quality by preventing nonpoint source pollution. Draft ordinances can be found on their website at http://www.stormwatercenter.net/. Example ordinances are available for • Post-Construction Stormwater Management • Stream Buffer Ordinances • Illicit Detection and Elimination Measures • Erosion and Sediment Control Requirements • Open-Space Design Zoning Controls • Operation and Maintenance Criteria for Stormwater
Practices • Groundwater-Protection Ordinances • Miscellaneous (Golf Course Management, Forest
Conservation, etc.)
One paradox associated with watershed-based zoning is that it assumes the best way to minimize impervious cover in a watershed at a regional scale is to concentrate as much high-density clusters as possible in subwatersheds with high impervious surface levels (normally 25% to 100%) in order to steer development away from and protect subwatersheds with a 10% or less level of impervious cover. Schueler notes in Environmental Land Planning Series: Site Planning for Urban Stream Protection that it may be necessary to further develop in a subwatershed with high levels of impervious cover, in order to preserve and protect a high quality subwatershed with 10% or less impervious cover. This could lead to more degradation in the highly impervious subwatershed; however, you cannot “degrade” water quality below standards. Under watershed-based zoning, subwatersheds with an impervious cover level of 25% to 100% are designed for future growth and redevelopment and possess no impervious level caps. Other water quality protection in these highly impervious subwatersheds would be necessary, such as structural best management practices (BMPs). Healthy subwatersheds with an impervious level of 10% or less and sensitive subwatersheds with an impervious cover level of 11% to 25% do possess development caps to protect water quality. Limits on impervious cover can be enforced through zoning controls or encouraged through incentives at the catchment scale. Communities interested in watershed-based zoning can obtain more information at the Center for Watershed Protection (www.cwp.org) and in Tom Schueler’s Environmental Land Planning Series: Site Planning for Urban Stream Protection, December 1995. Center for Watershed Protection and Metropolitan Washington Council of Governments. A Tool Used in Other States It is important to note that North Carolina may require enabling legislation to enact certain zoning techniques. Communities considering enacting an unconventional or innovative zoning technique are encouraged to determine the legality of these techniques in North Carolina. One such technique is Transfer of Development Rights (TDRs). Transfer of Development Rights TDRs occur when a community identifies an area within its boundaries it would like to protect from development (sending zone) and an area where it would like to see more urban development (receiving zone). Landowners in the sending zone sell their development rights or credits to developers, speculators, or the community. In return for selling the credits, the landowners in the sending zone agree to place permanent conservation easements on their land. The purchaser of

27
Types of Land That Need Protection from Development for
NPS Pollution Control • Stream corridors and shorelines; • Critical water habitats, such as
tidal wetlands; and • Hydrologic reserve areas that
sustain a stream’s hydrologic regime.
the development credits can apply them toward development in the higher-density receiving zone. Some benefits of TDRs include: permanent protection of land from development pressures, landowner is paid to protect land, and landowners may receive estate and property tax benefits. TDRs typically require a strong real estate market, and the “receiving area” must be willing to accept higher-density development. TDRs may also be difficult and costly to establish. It should be noted that TDRs would require enabling legislation in North Carolina and can often be expensive to establish. TDRs may be complicated by highway right-of-way issues.
3. Land Conservation Land conservation involves protecting land from development and other pressures that could be ecologically damaging to water quality and sensitive environments. Leaving land in its natural state prevents it from becoming a source of nonpoint source pollution. Unfortunately, landowners often have a misconception that all land conservation options mean their property will become publicly accessible land. A number of conservation techniques, such as conservation easements, provide tax incentives. Conservation easements limit development, but do not provide public access to property unless the landowners desire public access. The Conservation Trust for North Carolina provides more information on land trusts and conservation easement benefits at www.ctnc.org. The Land Preservation Notebook is another source of information and a tool for local governments interested in land conservation. More information can be found at www.cals.ncsu.edu/wq/LandPreservationNotebook/. A number of techniques can be used for land conservation, including
§ Land Acquisition § Conservation Easements § Regulate Land Alteration § Exclusion or Setback of Water Pollution
Hazards § Protection within Green Space or Open-
Space Designs § Landowner Stewardship § Public Sector Stewardship
The preferred conservation technique depends on the land area being conserved and the measure of protection desired.
4. Riparian Buffers Riparian buffers located along streams, rivers, shorelines, or wetlands can protect a waterbody from erosion and serve as a pollutant filter. Buffers have been found to effectively remove

28
Source: Palone, R.S. and A.H. Todd (editors). 1997. Chesapeake Bay Riparian Handbook: A Guide for Establishing and Maintaining Riparian Forest Buffers. USDA Forest Service. NA-TP-02-97. Radnor, PA. http://www.chesapeakebay.net/pubs/subcommittee/nsc/forest/handbook.htm.
sediment and nutrients from stormwater runoff in rural and agricultural areas. Buffers can also provide habitat for wildlife and recreation. Unfortunately, buffers in urban areas can often be short-circuited because stormwater runoff concentrates on impervious surfaces and crosses the buffer in a channel flow, thereby reducing the buffer’s ability to remove pollutants. For buffers or vegetative strips to be highly effective, water must pass over the buffer in a uniform manner (sheet flow). A device called a level spreader can be installed to spread the runoff flow into a uniform sheet. As Table A-4 indicates, buffers can be composed of grass, shrubs, or trees. Each type of buffer provides different levels of benefits. Table A-4: Relative Effectiveness of Different Buffer Types BENEFIT GRASS SHRUB TREE Bank Stabilization Low High High Filter Sediment High Low Low Filter other NPS High Low Low Aquatic Habitat Low Medium High Wildlife Habitat High Medium High Source: Presentation by Deana L. Osmond, Soil Science Department, North Carolina State University, Raleigh, N.C., 2002. The width of a buffer is a crucial variable in determining the effectiveness of a buffer for removing pollutants and protecting a stream’s water quality and aquatic life. Figure A-4 provides basic guidelines for buffer width. Actual buffer width needed for protection will vary depending on a variety of factors, including slope of land and soils and type of adjacent development. Decisions about buffers will often be compromised between ideal widths and environmental goals and social and economic conditions.
5. Improved Site Design
One component of NPS pollution management and stream protection is developing better site-design requirements to address water quality issues. The Center for Watershed Protection notes four design strategies for protecting water quality:
Figure A-4: Range of Minimum Widths For Meeting Specific Buffer Objectives

29
City of Wilmington, N.C. Watershed Protection Roundtable
The City of Wilmington formed a Watershed Protection Roundtable Committee to improve water quality. Committee representation consisted of diverse stakeholders for public and private organizations. Using the Better Site Design Handbook from the Center for Watershed Protection, the committee examined current development ordinances to determine the city’s current level of watershed protection. Answering 22 categories of yes-no questions, the City of Wilmington scored 67 out of a possible 100 points. The test results demonstrated that “development rules are likely inadequate to protect local aquatic resources. A site planning roundtable would be very useful.” The roundtable focused on three habitats where improvements could be made: people, cars, and nature. By recommending changes to current regulations and ordinances – such as allowing use of curb openings and grassy swales, alternative types of header curbing, requirements for minimum percentage of open space when cluster and density bonuses are provided, and buffer maintenance requirements – the city was able to raise its score. In total, 78 recommendations were developed and an implementation strategy was developed for each principle, with demonstrated costs savings calculated where applicable. Because of the recommended changes, the City of Wilmington was able to raise its score from 67 out of 100 to 91 out of 100.
• Open Space or Cluster Residential Subdivisions • Green Parking Lots • Rooftop Runoff Management • Residential Streets
Open Space or Cluster Residential Subdivisions This type of development minimizes lot sizes and condenses development into a portion of the property, permanently leaving the remaining portions of the property in open space. Typically, 30 to 80 percent of a community is kept in open space. Depending upon the location and type of open space, the environmental benefits may be numerous, including: Ø Reducing the amount of impervious
cover by 10 to 50 percent; Ø Eliminating the need to clear and
grade 35 to 60 percent of a total site area; and
Ø Reserving up to 15 percent of a site for recreation.
Studies have confirmed that housing near greenways or open space sells for a higher amount than houses not in close proximity to open space. Green Parking Lots Green parking lots involve reducing the
Guidebook for Better Site Design The manual Better Site Design: A Handbook for Changing Development Rules in Your Community (Center for Watershed Protection, August 1998, Elliot City, Md.) is one important source for information on site design related to watershed management. The guide provides 22 in-depth development principles for street, parking, sidewalk, and open space design that, when applied together, minimize impervious cover, protect environmentally sensitive areas, develop pedestrian-friendly neighborhoods, and lower development costs. The document also includes a code and ordinance worksheet for communities to use in comparing their current development and zoning regulations against model development principles to determine where improvements can be made to ordinances for protection of the environment. The sidebar below highlights how the City of Wilmington used these guidelines to improve its development guidelines relevant to water quality.

30
The Village of Woodsong in Brunswick County, N.C.
This is a mixed-use development by the Milliken Company that covers 22 acres in Brunswick County. This development is environmentally designed to keep natural systems functioning within a healthy range and conserve natural site features to the greatest extent possible. The village has pedestrian-oriented streets, manmade and natural common space and is designed to contain a market plaza, a children's park, civic spaces, a neighborhood green, and small parks. The strategies used to manage stormwater runoff include: v Preservation of on-site natural wetlands to filter runoff and
help in maintaining wildlife habitat. Gabions will be constructed to block old ditches and recreate the original wetland hydrology and function.
v A constructed wetland is an integral part of the stormwater
treatment system and consists of two small ponds. A series of wetland marsh planted cells is designed to include an elevated pedestrian walkway.
v Woodsong landscape standards encourage the use of
native plants or plants adapted to local conditions in order to minimize the need for irrigation and fertilizer.
v Cisterns, courtyard ponds and grading are encouraged to
slow down stormwater leaving individual house lots. Cluster development benefits include: v Potential to reduce future construction of impervious
highway infrastructure. v Preserves open space and consumes far less land than
low-density patterns. This type of development provides many benefits to the developer, homeowner, and community, such as: v Social and community spaces increase community
cohesiveness and reduce stormwater runoff. v Constructed wetlands provide an aesthetic focal point for
residents, while also providing effective treatment of stormwater.
v The site design significantly reduces the negative effects of
stormwater runoff downstream. v Increased confidence by the builder that money invested in
the alternative design will increase the income potential for development.
amount of impervious cover by downsizing parking areas for residential and commercial development. Many developers believe “plenty of free parking” is a means of attracting customers, so they build excess parking spaces. Most local parking codes focus on the minimum number of parking spaces required and fail to address a maximum limit. Green parking involves revising parking codes to reduce impervious cover and allow for construction of smaller parking lots. It also encourages alternative parking solutions, such as parking garages, shared parking, and credits for mass transit. Incorporating structural urban stormwater best management practices into parking lots can also reduce the impact of impervious surfaces on water quality. Some BMPs that can be successfully incorporated into parking lots include pervious pavement and bio-retention areas (rain gardens). These BMPs are discussed under the topic of Best Management Practices later in this section. Rooftop Runoff Management Annual runoff volume for a medium to low density residential site can be reduced by as much as 50 percent by redirecting rooftop runoff over a pervious surface rather than impervious surfaces. This can

31
Town of Ocean Isle Beach, N.C.
The Town of Ocean Isle Beach is one local government that developed its own erosion and sediment control plan. Basic control objectives of the plan include: • Identification of critical areas; • Limit time of exposure; • Limit exposed areas; • Control surface water runoff originating
upgrade of exposed areas to reduce erosion and sediment loss during the period of exposure;
• Control sedimentation; and • Manage stormwater runoff velocity. The plan also requires a buffer zone for construction along lakes or natural watercourses. For more information on the Town of Ocean Isle Beach’s ordinances, visit the website at http://www.oibgov.com.
reduce pollutant loading and runoff volume in streams. Cisterns (rain barrels) can also be used to collect and store rooftop runoff. Residential Streets Roads, sidewalks, parking lots, and driveways account for the largest share of impervious cover in most areas. Communities may wish to consider strategies to reduce impervious cover resulting from residential streets. Residential streets constitute a majority of a road network and are different from wider and more heavily traveled roads and highways. Traditionally, streets are classified according to the traffic volume they are expected to carry. Under a revised classification system where the design of residential streets was based on traffic and parking demand for the individual homes in an area, impervious cover could be reduced. For example, a residential street serving an area of 10 to 15 single-family homes may not need to be as wide as a residential street serving an area of 50 single-family homes and 25 multi-family units. This classification system reduces impervious cover by allowing for the minimum street width achievable without compromising traffic flow or safety. Minimum widths required for driveways may also be reduced to further lower the amount of impervious cover. Narrower streets also allow for the use of grassy swales, open channels, or other BMPs to assist in reducing NPS pollution from residential street runoff. One example of a design modification that can be made to reduce impervious cover is a dead-end residential street can use a T-shaped or hammerhead turnaround rather than a traditional cul-de-sac design. This design reduces the amount of impervious cover while serving the same function. Narrower residential streets can also have other associated benefits; for instance, cars typically travel at slow speeds on narrower streets.
6. Erosion and Sediment Control Community erosion and sediment control programs can greatly reduce the severe impacts of the grading and clearing that occurs with the construction process. Care should be taken during construction to ensure that conservation areas, buffers, and forests are not unnecessarily impacted during construction. The State of North Carolina has a Sediment Pollution Control Act. The act requires that any land-disturbing activities that uncover one or more contiguous acres of land have an approved erosion and sedimentation control plan. Offsite damage is also prohibited. The act’s purpose is to protect streams and lands from degradation associated with erosion and sedimentation caused by land-disturbing acts. Agriculture and mining are exempt and forestry has a special provisional exemption based on

32
Forestry Practice Guidelines. Care should still be taken to prevent erosion to the maximum extent possible from these land uses. This regulation is administered through the Division of Land Resources. Local governments may also develop their own programs. More information is available at http://www.dlr.enr.state.nc.us/eros.html.
7. Structural Stormwater Best Management Practices (BMPs)
Stormwater BMPs are used to control, slow down, store, or treat stormwater runoff. BMPs can be voluntary or required as part of a development ordinance or zoning regulation. More information on BMPs and training can be obtained from North Carolina State University’s Department of Biological and Agricultural Engineering at http://courses.ncsu.edu:8020/classes-a/bae/cont_ed/. Table A-5 summarizes the BMPs used in North Carolina and notes the advantages and disadvantages of each. A description of each BMP follows Table A-5.
Table A-5: Summary of Best Management Practices Used in North Carolina Practice Advantages Disadvantages Pollutant Removal
Wet Ponds Traditional BMP. Can double as recreational facility
Relatively land-intensive. Safety issues.
Suspended particles (TSS)- very high (70%) Nitrate-Nitrogen-moderate (20%)
Stormwater Wetlands
Highest pollutant-removal option. Good educational site.
Most land-intensive. Public opinion can be negative.
Suspended particles (TSS)-very high (80%) Nitrate-Nitrogen-high (40-45%)
Infiltration Trenches/Wells
Relatively low design and construction cost. Introduces surface water to groundwater.
Limited application (sandy soils). High potential for clogging.
Limited data suggests that removal of suspended particles is initially high, but this causes infiltration practices to fail. Very little Nitrate-Nitrogen is removed by this practice.
Sand Filters Can fit in high land-cost situations. Removes pollutants found in parking areas.
Most expensive per square foot of device. Maintenance can be cumbersome.
Suspended particles (TSS)-very high (75-80%), but operators must maintain to keep high efficiency. Nitrate-Nitrogen leaker (negative removal). High metal removal.
Bio-retention/ Rain Gardens
Aesthetically pleasing. Can double to meet landscape and water quality objectives.
Very new practice with little data to prove effectiveness. Plants must be removed if soil clogs or becomes polluted. Cannot handle large amounts of stormwater.
Suspended particles (TSS)-initially very high, but will result in clogging. Total nitrogen appears high, but Nitrate-Nitrogen may be negative.
Level Spreaders/ Riparian Buffers
Construction cost very low. Effective pollutant removal. Aesthetically pleasing.
Land-intensive. Effectiveness of level spreader relatively untested.
Note: data from agricultural research Suspended particles (TSS)-very high (80%); Nitrate-Nitrogen-moderate. (20%)
“Reinforced” Can carry higher flow Construction and Highly variable removal

33
Table A-5: Summary of Best Management Practices Used in North Carolina Practice Advantages Disadvantages Pollutant Removal
Grassy Swales than traditional grassy swales. More aesthetic and cheaper to construct than rip-rap alternative.
maintenance costs higher than for traditional grassy swales. Relatively new device with limited long-term testing.
efficiencies. Suspended particles (TSS)-moderate (median of 40%) Nitrate-Nitrogen low (10-15%).
Porous Pavement Diversion of large volumes of surface water to ground water recharge. Beneficial in highly impervious watersheds.
Porous pavement requires a deep water table and permeable soils. Can be used only in areas without high traffic volume. Cannot be exposed to heavy equipment. Sediment can clog pores, and annual street sweeping is required.
Porous pavement acts less like a treatment BMP and more as a conveyance BMP. The underlying chamber can act as a filtration device. Operating systems have been shown to have high removal rates for sediment, nutrients, organic matter, and trace metal.
Source: Adapted from North Carolina Cooperative Extension Service. Urban Waterways: Urban Stormwater Structural Best Management Practices (BMPs); “Urban Stormwater” North Carolina State University Water Quality Group http://h2osparc.wq.ncsu.edu/wetland/aqlife/urbstorm.html.; and Preliminary Data Summary of Urban Stormwater Best Management Practices. EPA-821-R-99-012. August 1999. Environmental Protection Agency Office of Water, Washington, D.C. Wet Ponds Wet ponds are a traditional BMP, which were originally used to control water quantity and downstream flooding. Many reservoirs, such as Lake Norman and Kerr Lake, are very large wet ponds that (unlike typical wet ponds) also provide water for communities. Wet ponds are used as a BMP to enhance the quality of stormwater runoff and reduce peak flows. Wet ponds maintain a permanent pool of water about 4 to 8 feet deep and also capture a volume of stormwater runoff during rain events. The temporarily detained stormwater is slowly released over a period of a few days until the wet pond returns to its normal depth. The permanent pool of water enhances the removal of pollutants. Wet ponds should be designed with a fore bay to allow for sediment deposition and later excavation. Wet ponds are used in most locations where there is enough space to locate the pond. Because wet ponds are large, construction costs may be expensive relative to other BMPs. Stormwater Wetlands Stormwater wetlands, a popular BMP in urban areas, have a similar design to wet ponds, but they are much shallower, normally 1 to 1½ feet. Stormwater wetlands slow down and temporarily store stormwater runoff, minimizing the amount of point and nonpoint source pollution prior to it entering a stream or other receiving water body. Stormwater wetlands are constructed on land that was not previously a wetland and are designed specifically for water treatment. Different design considerations can be explored if a community also desires that a stormwater wetland serve other uses in addition to water quality, such as habitat, water quantity, and aesthetics. Stormwater wetlands allow for easy removal of debris and sediment. Wetlands are land-intensive and often suffer a “swamp” perception problem with the public. A wetland can attract mosquitoes and snakes, but will also attract mosquito predators such as dragonflies and frogs. Stormwater wetlands are appropriate in areas where land is available and where

34
groundwater levels are close to the surface and can supply the water necessary to sustain the wetland system. Infiltration (Trenches/Wells) Infiltration BMPs are designed to capture a volume of stormwater runoff, retain it, and infiltrate that volume into the ground. Trenches and wells can capture only a small amount of runoff and are designed to capture the “first flush” or the first inch of rainfall, which normally contains the majority of runoff pollutants. The infiltration of stormwater into the ground is important in areas where impervious surfaces may prevent infiltration and groundwater recharge. Infiltration can control water quantity (flooding) by infiltrating water into the soil. This assists in water quality protection by reducing the amount of runoff discharged into streams, reducing stream-bank erosion and pollutant delivery to streams. Infiltration trenches are long and narrow while infiltration wells are designed like a pit for a more concentrated flow. Infiltration trenches and wells are filled with large porous stones and are designed to hold water and gradually allow it to seep into the ground. The success of this BMP rests on the soils being as sandy and pervious as possible. This BMP is applicable to the sandhills and coastal plain of North Carolina. Infiltration trenches and wells can be constructed under parking lots or roads and require little land; however, the water table must be at least 2 feet under the device. Few studies have been conducted to determine how well this BMP removes pollutants, but care must be taken to prevent debris from entering the system and clogging the device. If not properly maintained, infiltration BMPs have a high failure rate. Infiltration systems can also provide secondary benefits by increasing the recharge of underlying aquifers and increasing the base-flow levels of nearby streams. Infiltration also has potential drawbacks and may not be appropriate in areas where groundwater is the primary source of drinking water. If stormwater runoff from commercial or industrial areas with potential metal or organic contamination is infiltrated into the ground, it could possibly migrate into groundwater that is used for drinking water. Sand Filtering Sand filters are a BMP system primarily used to treat runoff from large buildings, access roads, and parking lots in highly impervious areas. Sand filters work by filtering stormwater through a bed of sand. One advantage of sand filters is that they do not require as much land as wetlands and ponds and are good alternatives in highly urban areas with expensive land costs. Sand filters can be installed underground in urban areas, such as under parking lots or building basements. Sand filters can also be installed above ground for large drainage areas. While maintenance for sand filters is normally simple and inexpensive, sand filters require frequent service, can clog easily, and are expensive to build. Above-ground sand filters can be considered unattractive by residents, and sand filters may need to be combined with other BMPs because sand filters alone provide little to no stormwater detention, yet they do provide treatment of runoff.

35
Town of Swansboro, N.C. In 2002, The Town of Swansboro passed a resolution to support the creation of educational BMPs on Town-owned property. Rain gardens will be constructed at Swansboro Town Hall and at Ward Shore Park. Pervious pavement will be used to protect the White Oak River from stormwater runoff of a vacant lot adjacent to the White Oak River.
Bio-Retention Areas/Rain Gardens Bio-retention areas (rain gardens) are infiltration devices that combine stormwater treatment with landscaping. Rain gardens are slightly depressed areas where stormwater runoff is channeled by pipes, curb openings, or gravity, and they treat stormwater through temporary collection before infiltration. They are usually designed to manage the first flush or first 1 inch of rainfall. Because water usually stands for less than 48 hours, certain plants, trees, and shrubs, such as dogwoods, can be grown that would not survive in a wetland or pond. The size of a rain garden varies depending on the drainage area. Drainage areas may include parking lots, roads, or driveways. Rain gardens are aesthetically pleasing ways to treat stormwater. Their effectiveness is relatively unknown, but early indicators suggest they remove most pollutants. Studies to determine their effectiveness are ongoing. Permeable or Porous Pavement Porous pavement is an infiltration system that serves as an alternative to traditional pavement and is intended to reduce imperviousness and stormwater runoff. Porous pavement allows stormwater to infiltrate the ground and thereby reduces stormwater runoff. Porous pavement is suitable for highly permeable soils and a deep water table. Typically, porous pavement can be used for parking lots/stalls, overflow parking areas, roads, residential driveways and streets, and as a substitute for other paved surfaces. It cannot be used in areas with high volumes of traffic or heavy equipment. Oil and grease-trap catch basins can often be installed along with porous pavement and can capture oil and grease in stormwater runoff. One drawback to porous pavement is maintenance requirements, including jet washing or vacuuming to remove sediment from pores. Also, research has not yet determined the NPS pollution removal rates, and porous pavement is more expensive than traditional pavement. To reduce costs, communities may wish to consider a mixture of traditional and porous pavement. “Reinforced” Grassy Swales/Open Channels Reinforced grassy swales are minor channels that can transport runoff in less developed areas. Grassy swales are reinforced with concrete, rip-rap, or turf reinforcement mats for additional support during heavy storms. Small (4- to 10-inch high) dams can be built across the bottom to increase detention time. Grassy swales assist in sediment deposition, small amounts of pollutant removal, and infiltration of stormwater. Grassy swales are generally inexpensive, but they do little to control peak storm flows and stormwater volume. Wetland and Stream Restoration The U.S. EPA defines restoration as “the manipulation of the physical, chemical, or biological characteristics of a site with the goal of returning natural/historic functions to former or degraded wetland.” For the purpose of tracking net gains in wetland acres, restoration is divided into:

36
Re-establishment: the manipulation of the physical, chemical, or biological characteristics of a site with the goal of returning natural/historic functions to a former wetland. Re-establishment results in rebuilding a former wetland and results in a gain in wetland acres. Rehabilitation: the manipulation of the physical, chemical, or biological characteristics of a site with the goal of repairing natural/historic functions of degraded wetland. Rehabilitation results in a gain in wetland function, but does not result in a gain in wetland acres.” Wetlands provide water quality benefits by managing and removing many pollutants before they reach lakes, rivers, and streams. Properly functioning wetlands provide food, protection from predators, and other vital habitat factors for many of the nation’s fish and wildlife species. Wetlands also have economic value associated with recreational, commercial, and subsistence use of fish and wildlife resources. Stream restoration is another alternative for addressing water quality problems. Stream restoration refers to the return of a stream ecosystem to a close approximation of its condition prior to disturbance. The ecological damage of a stream is repaired and the structure and functions of the stream ecosystem are recreated. Stream restoration can involve changing the stream channel, for example, restoring a channelized stream to a meandering stream. It can also consist of re-vegetating the riparian zone and managing the upland zone of a stream. More information on restoration can be found at the EPA’s River Corridor and Wetland Restoration website, http://www.epa.gov/owow/wetlands/restore/, and more information can be found about wetland and stream restoration in North Carolina from the N.C. Wetlands Restoration Program at http://h2o.enr.state.nc.us/wrp/. BMPs and Stormwater Quality Practices in the Neuse River Basin of North Carolina Table A-6 from the North Carolina Cooperative Extension Service (NCCES) highlights BMPs and other stormwater quality practices that have been installed in the Neuse River Basin of North Carolina. Table A-6: NCCES Urban Stormwater Quality Demonstration Sites in Neuse River Basin Practice Location Contact Description Stormwater Wetland
Durham – Hillandale Golf Course
Durham County Cooperative Extension Service Tel: (919) 560-0525
70-acre school watershed feeding .75-acre wetland
Stormwater Wetland
Craven County, Town of River Bend
Craven County Cooperative Extension Service Tel: (252) 633-1477
76-acre residential watershed feeding ½-acre wetland
Stormwater Wetland
Smithfield – Johnston County Community College
Franklin County Cooperative Extension Service Tel: (919) 496-3344
Small wetland treating runoff from ~4-acre arboretum site
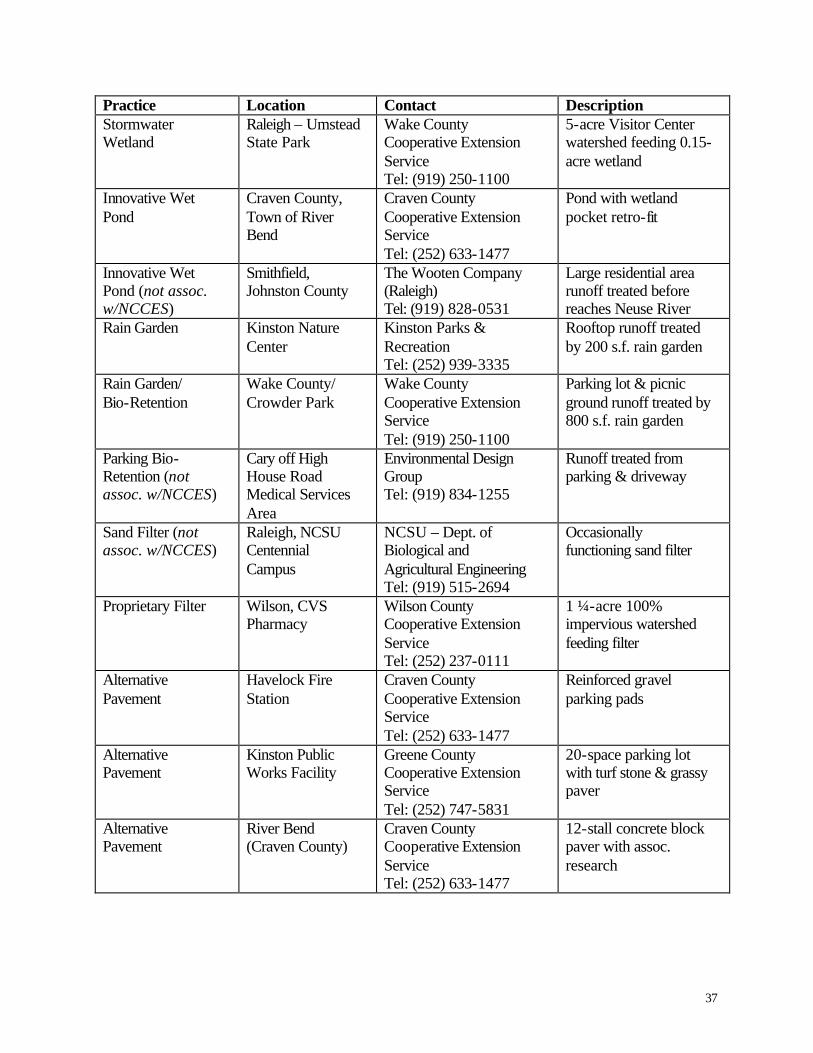
37
Practice Location Contact Description Stormwater Wetland
Raleigh – Umstead State Park
Wake County Cooperative Extension Service Tel: (919) 250-1100
5-acre Visitor Center watershed feeding 0.15-acre wetland
Innovative Wet Pond
Craven County, Town of River Bend
Craven County Cooperative Extension Service Tel: (252) 633-1477
Pond with wetland pocket retro-fit
Innovative Wet Pond (not assoc. w/NCCES)
Smithfield, Johnston County
The Wooten Company (Raleigh) Tel: (919) 828-0531
Large residential area runoff treated before reaches Neuse River
Rain Garden Kinston Nature Center
Kinston Parks & Recreation Tel: (252) 939-3335
Rooftop runoff treated by 200 s.f. rain garden
Rain Garden/ Bio-Retention
Wake County/ Crowder Park
Wake County Cooperative Extension Service Tel: (919) 250-1100
Parking lot & picnic ground runoff treated by 800 s.f. rain garden
Parking Bio-Retention (not assoc. w/NCCES)
Cary off High House Road Medical Services Area
Environmental Design Group Tel: (919) 834-1255
Runoff treated from parking & driveway
Sand Filter (not assoc. w/NCCES)
Raleigh, NCSU Centennial Campus
NCSU – Dept. of Biological and Agricultural Engineering Tel: (919) 515-2694
Occasionally functioning sand filter
Proprietary Filter Wilson, CVS Pharmacy
Wilson County Cooperative Extension Service Tel: (252) 237-0111
1 ¼-acre 100% impervious watershed feeding filter
Alternative Pavement
Havelock Fire Station
Craven County Cooperative Extension Service Tel: (252) 633-1477
Reinforced gravel parking pads
Alternative Pavement
Kinston Public Works Facility
Greene County Cooperative Extension Service Tel: (252) 747-5831
20-space parking lot with turf stone & grassy paver
Alternative Pavement
River Bend (Craven County)
Craven County Cooperative Extension Service Tel: (252) 633-1477
12-stall concrete block paver with assoc. research

38
Practice Location Contact Description Alternative Pavement
Johnston County CC Arboretum
Johnston County Cooperative Extension Service Tel: (919) 989-5380
Turf stone portion of parking lot (7-10 stalls)
Turf Reinforcement Mats
Durham, Hillandale Elementary
Person County Cooperative Extension Service Tel: (336) 599-1195
300-liner-feet swale
Turf Reinforcement Mats
Raleigh, Umstead State Park
Wake County Cooperative Extension Service Tel: (919) 250-1100
1000-linear-feet swale
Turf Reinforcement Mats (not assoc. w/NCCES)
Throughout Neuse Basin & State
NC DOT Tel: 919-250-4200
Contact local DOT staff
Level Spreader Raleigh – off Glenwood Ave
Wake County Cooperative Extension Service Tel: (919) 250-1100
Flow diverted into 80-linear-feet level spreader
Stream-bank Stabilization
Durham – Treyburn Country Club
Person County Cooperative Extension Service Tel: (336) 599-1195
300 linear feet of stream bank repaired along Little River
Stream Restoration (not assoc. w/NCCES)
Raleigh – Oakwood Cemetery
KCI consultants (Raleigh) Tel: (919) 783-9214
2,000 linear feet of stream restored through cemetery
Source: N.C. Cooperative Extension Service. http://www.neuse.ncsu.edu/demonstration.html
8. Non-Stormwater Discharges
Non-stormwater discharges, such as septic systems and sanitary sewers, can also serve as a source of pollution in a watershed. Most non-stormwater discharges are regulated by the National Pollutant Discharge Elimination System (NPDES). NPDES and associated Phase I and Phase II regulations are explained later in this document under “federal rules and regulations.” More information on NPDES can be found at http://cfpub.epa.gov/npdes/stormwater/swphase2.cfm?program_id=6). Improperly located or failing septic systems can contribute significant pollution to receiving waters. Septic systems are approved by local and state health agencies. According to the 1990 census, approximately 60% of the homes in the 20 Coastal Area Management Act (CAMA) counties in North Carolina rely upon septic systems. This is higher than the state average of 50% and indicates that the communities with the most direct link to estuarine waters have the potential of negatively impacting water quality if these septic systems fail.

39
Sanitary sewers can also pose a problem for water quality. While sanitary sewers can offer high levels of pollution reduction, sewer connections can leak or rupture, allowing sewage to flow into water bodies. Common causes of sewer failures and overflows are tree roots finding their way into sewer lines and excessive rainfall leading to an overload of sewer lines and pump stations. Grease, a by-product of cooking, gets into the sewer through household and/or restaurant drains. Grease sticks to the inside of sewer pipes and can build up over time. If the entire sewer pipe becomes blocked, sewage can overflow into yards, streets, and water bodies.
Also, not all sanitary sewer systems offer high levels of pollution reduction. Package treatment plants, combined sewer overflows, and sanitary sewer overflows have a higher failure rate. Communities may also want to consider where sewer lines should be located in relationship to the stream corridor. It should also be noted that the extension of sewer lines can also encourage more development. Communities should be aware of this when extending water and sewer service. Other non-stormwater discharges can also be a factor in a watershed. Illicit or illegal connections to the storm drain network can discharge pollutants directly into water bodies.
Illegal connections to the storm drain network could include car washes, washing machines or other water sources traditionally connected to a sanitary sewer. Runoff from confined animal feed lots and industrial discharges permitted under NPDES could also be contributors to water quality problems.
Urban Wet Weather Flows (WWFs) The urban WWF problem refers to untreated discharge from sewage systems during storm events. The WWF comprises point source and diffuse nonpoint source discharges. There are three types of urban WWF discharges: Combined-Sewer Overflow: A mixture of storm drainage and municipal industrial wastewater discharged from combined sewers or dry-weather flow (DWF) discharged from combined sewers; Stormwater: Stormwater from separate stormwater drainage systems in areas that are either sewered or unsewered; Sanitary-Sewer Overflow: Overflow and bypasses from sanitary-sewer systems resulting from stormwater and groundwater infiltration and/or flow.
Siting Septic Tanks and Sewer Lines to Reduce NPS Pollution
Local governments can work to ensure septic and sewer systems are functioning properly and assist in preventing NPS pollution by: ü Encouraging or mandating the use of more
advanced on-site septic controls. ü Routinely inspecting private septic systems,
and encouraging repair and replacement of septic controls.
ü Modifying land use plans to steer sewer lines and septic tanks away from environmentally sensitive areas.

40
Six Basic Steps to Promote Watershed Stewardship
1. Watershed Advocacy 2. Watershed Education 3. Pollution Prevention 4. Watershed Maintenance 5. Indicator Monitoring 6. Restoration
9. Watershed Stewardship Programs Even if a community establishes mechanisms for improving water quality, they should still invest in watershed stewardship. Watershed stewardship encourages an increase in public understanding and awareness of watersheds, promotes better management and stewardship of private lands, and can assist in securing funding to sustain watershed management and planning efforts. Watershed stewardship can assist in educating and building support for land use planning designed to reduce NPS pollution. The Center for Watershed Protection outlines six basic programs for watershed stewardship, which are briefly highlighted below. Watershed Advocacy Promoting watershed advocacy can lay the foundation for public support and watershed stewardship. A grass roots organization can develop broad based support for watershed management. Often, local governments can create or direct these watershed management structures and grass roots organizations. Watershed Education Watershed education can raise public awareness, encourage personal stewardship, offer professional training, and provide opportunities for public engagement to discuss watershed problems and solutions. Pollution Prevention Watershed businesses and industries may need information on ways to better manage and prevent pollution from their businesses. Some local governments may have a regulatory responsibility to develop pollution prevention programs. One example might involve a local government encouraging or requiring restaurants to install grease traps to prevent grease build-up in sewer lines. Watershed Maintenance Watershed BMPs will require regular maintenance to continue functioning at an optimal level. Septic and sewer systems also need to be periodically examined for malfunctions. Continual maintenance of BMPs and sewers is an important part of watershed management. Watershed Indicator Monitoring Citizen monitoring of waters could be an important component of a watershed stewardship program. Public agencies could be provided high quality data at a low cost by using citizen monitoring as an option. Watershed Restoration The last phase of watershed stewardship is restoration and rehabilitation of degraded water bodies. Communities can work to restore degraded streams and wetlands and implement BMPs to control and prevent pollution.

41
Sources of Water Quality Information and Data
An abundance of resources related to water quality are available from numerous state and federal agencies, private organizations, nonprofits, and citizen monitoring groups. The purpose of this section is to highlight these information sources and briefly summarize the information and data available from each source. While each source provides general information relevant to coastal areas, sources denoted with an asterisk (*) indicate the document or source specifically addresses coastal issues. State Government Sources North Carolina Department of Environment and Natural Resources The N.C. Department of Environment and Natural Resources is the state government’s environmental management agency. Information on a variety of water quality and other environmental issues and links to divisions are available on the DENR website, www.enr.state.nc.us. North Carolina Division of Water Quality The N.C. Division of Water Quality is a general source on water quality and provides a variety of raw and analyzed data pertaining to water quality. Information is available on the DWQ website, http://h2o.enr.state.nc.us/.
Basinwide Planning Unit
The latest basinwide plans for all of the North Carolina river basins are available at http://h2o.enr.state.nc.us/basinwide/index.html. These plans provide analyzed water quality data and state summaries of overall health of watersheds. While viewing the website, users should search for the most recent basinwide plan.
303(d) list
A list of impaired surface waters in North Carolina that is reported to the U.S. Environmental Protection Agency. This list is available at http://h2o.enr.state.nc.us/mtu/download.html.
Environmental Sciences Branch The N.C. Division of Water Quality’s Environmental Sciences Branch is responsible for a suite of ongoing monitoring programs statewide, which serve as primary data source for DWQ’s Basinwide Planning Program. Data from the Environmental Sciences Branch provides DWQ with scientific and technical support necessary to support regulation and management of water quality in the state. The branch’s website can be accessed at www.esb.enr.state.nc.us/default.htm.
Assessment reports of basinwide water quality for each river basin are also available on the Environmental Sciences Branch website at www.esb.enr.state.nc.us/bar.html. These reports are used to develop basinwide water quality management plans.

42
Research in progress in the Environmental Sciences Branch is also located at www.esb.enr.state.nc.us/Catalog/cataloghome.htm.
Fish kill reports are also available from the Environmental Sciences Branch. These can be accessed at www.esb.enr.state.nc.us/Fishlike/fishkillmain.htm.
North Carolina Wetlands Restoration Program The N.C. Wetlands Restoration Program (NCWRP) is an innovative, non-regulatory program established by the General Assembly in 1996 to restore wetlands, streams and streamside (riparian) areas throughout the state. The goals of the NCWRP are: ü To protect and improve water quality through restoration of wetland, stream and
riparian area functions and values lost through historic, current and future impacts. ü To achieve a net increase in wetland acreage, functions and values in all of North
Carolina’s major river basins. ü To promote a comprehensive approach for the protection of natural resources. ü To provide a consistent approach to address compensatory mitigation requirements
associated with wetland, stream, and buffer regulations, and to increase the ecological effectiveness of compensatory mitigation projects.
In its local watershed planning processes, the NCWRP conducts technical assessments, which include the compilation of water quality information. The program can also provide basin wetland and stream restoration plans. The NCWRP website can be accessed at http://h2o.enr.state.nc.us/wrp/.
*North Carolina Division of Coastal Management The Division of Coastal Management carries out the state’s Coastal Area Management Act, the Dredge and Fill Law and the federal Coastal Zone Management Act of 1972 in the 20 coastal counties, using rules and policies of the N.C. Coastal Resources Commission, known as the CRC. The division serves as staff to the CRC. Further information is available on the DCM website at http://www.nccoastalmanagement.net.
*North Carolina Coastal Nonpoint Source Pollution Program Section 6217 of the federal 1990 Coastal Zone Act Reauthorization Amendments (CZARA) requires every state participating in the Coastal Zone Management Act program to develop a Coastal Nonpoint Pollution Control Program (CNPCP). North Carolina’s program is administered by the Division of Water Quality and the Division of Coastal Management. The state program currently has one full-time staff person located in the Nonpoint Source Planning Unit of DWQ. Information on the program and federal mandate from the CZARA is available at http://h2o.enr.state.nc.us/nps/czara.htm.
Division of Environmental Health The Division of Environmental Health is made up of five sections: Environmental Health Services, Public Water Supply, On-Site Wastewater, Public Health, Pest Management, and

43
Shellfish Sanitation. More information can be obtained from the division’s website at http://www.deh.enr.state.nc.us/.
*Shellfish and Recreational Coastal Water Quality Data and Information The Shellfish Sanitation Section protects the consuming public from shellfish and crustaceans that could cause illness. Information on testing and problem areas can be found at www.deh.enr.state.nc.us/shellfish/Water_Monitoring/water_monitoring.html.
Division of Parks and Recreation The mission of the state parks system is to conserve and protect representative examples of the natural beauty, ecological features and recreational resources of statewide significance; to provide outdoor recreational opportunities in a safe and healthy environment; and to provide environmental education opportunities that promote stewardship of the state’s natural heritage. More information can be obtained at http://ils.unc.edu/parkproject/ncparks.html.
North Carolina Natural Heritage Program The North Carolina Natural Heritage Program is a part of the Division of Parks and Recreation. The program inventories, catalogs, and facilitates protection of the rarest and the most outstanding elements of the natural diversity of North Carolina. These elements of natural diversity include those plants and animals that are so rare, or the natural communities that are so significant, that they merit special consideration as land-use decisions are made. More information can be obtained at http://ils.unc.edu/parkproject/nhp/.
North Carolina DENR Geographic Information System Information DENR will maintain up-to-date statewide geographic information system (GIS) layers and integrated data as a strategic resource for the state’s citizens, industry, federal, state, and local governments. Information on water quality-related information and some shellfish closures in GIS format are available for access and viewing at http://gis.enr.state.nc.us North Carolina Wildlife Resources Commission The North Carolina Wildlife Resources Commission sponsors many programs that promote conservation and wise use of the state’s abundant natural resources, and provides assistance for landowners wishing to manage wildlife on their lands. More information can be obtained at http://216.27.49.98/index.htm. Neuse River MODMON The MODMON (MODeling & MONitoring) project includes modeling and monitoring of water quality in North Carolina’s Neuse River Estuary. The Neuse Estuary Eutrophication Model is being developed as part of the modeling portion of the project . The model simulates the processes depicted above to predict water quality in the Neuse River for various nutrient loading and hydrologic scenarios. Results of the project are available at www.marine.unc.edu/neuse/modmon/results/results.htm.

44
Federal Government Sources United States Environmental Protection Agency General information related to national water quality is available on the U.S. EPA website www.epa.gov under water quality.
Nonpoint Source Pollution Page This website www.epa.gov/owow/nps provides information on nonpoint source pollution, including information on categories of nonpoint source pollution, management measures, and links to various information sources.
Surf Your Watershed An EPA link where users can search for data in their watershed at www.epa.gov/surf.
River Corridor and Wetlands Restoration Website This website provides information on the principles and benefits of stream and wetland restoration. It also links to restoration examples, EPA publications, and other resources. The website can be accessed at http://www.epa.gov/owow/wetlands/restore/.
STORET STORET is short for STOrage and RETrieval. This EPA website contains a database of raw biological, chemical, and physical data on surface and groundwater for all 50 states. www.epa.gov/storet.
National Environmental Publications Internet Site This website is accessible at http://www.epa.gov/cincl/. The site provides a searchable database for online EPA document and information for ordering EPA documents.
Databases A variety of searchable databases from the U.S. EPA are available at http://www.epa.gov/water/soft.html.
United States Geological Survey – National Water Information System Access provided to water-resource data collected by the USGS at approximately 1.5 million sites in all 50 states, the District of Columbia, and Puerto Rico is available at http://water.usgs.gov/nwis/
USGS Water Resources of North Carolina
Water quality and stream flow data and reports, including some real-time data, are available at www.nc.usgs.gov.

45
Federal Documents *United States Environmental Protection Agency. Guidance Specifying Measures for Sources of Nonpoint Source Pollution in Coastal Waters. EPA 850-B-92-002. Office of Water, Washington, D.C. This document is available electronically at www.epa.gov/owow/nps/MMGI. This document provides information on categories of nonpoint source pollution, associated pollutants, and management strategies for each pollution category. United States Environmental Protection Agency. December 1997. Urbanization of Streams: Studies of Hydrologic Impacts. EPA 625-R-98-001. Office of Research and Development, Washington, D.C. *United States Environmental Protection Agency. October 1992. Protecting Coastal and Wetlands Resources: A Guide for Local Governments. EPA 842-R-92-002. Office of Water; Office of Wetlands, Oceans, and Watersheds; and Office of Policy, Planning, and Evaluation, Washington, D.C. Federal Interagency Stream Restoration Working Group. October 1998. Stream Corridor Restoration: Principles, Processes, and Practices. GPO Item No. 0120-A; SuDOcs No. A 57.6/2:EN 3/PT.653. ISBN-0-934213-59-3. This document describes hydrologic processes and land use changes and pollution affecting streams and rivers. Restoration techniques are also discussed. This document is accessible online at http://www.usda.gov/stream_restoration/. Nonprofit Sources Center for Watershed Protection The Center for Watershed Protection’s website can be accessed at www.cwp.org. The website provides model ordinances for nonpoint source pollution management. Other documents pertaining to water quality can be accessed from the site. Stormwater Manager’s Resource Center (http://www.stormwatercenter.net/)
A website designed by the Center for Watershed Protection under a grant from the EPA. It provides information on stormwater management options, including draft ordinances.
Publications
Center for Watershed Protection. October 1998. Rapid Watershed Planning Handbook: A Comprehensive Guide for Managing Urban Watersheds. This document provides hands-on information regarding watershed protection techniques, development of a watershed plan, mapping and monitoring a watershed, and several real-world examples.
Center for Watershed Protection. August 1998. Better Site Design: A Handbook for Changing Development Rules in Your Community. This document provides model development principles regarding street and parking design and technical support information.

46
Center of Excellence for Sustainable Development This organization provides information and services on how a community can adopt sustainable development as a strategy. Their website is accessible at http://www.sustainable.doe.gov/. Natural Resources Defense Council Natural Resources Defense Council. May 1999. Stormwater Strategies: Community Responses to Runoff Pollution. This document provides a variety of strategies for addressing urban stormwater runoff. Neuse River Foundation (NRF) A nonprofit, grass roots environmental organization dedicated to protecting the Neuse River. The NRF engages in many activities regarding the Neuse River, including water quality monitoring. Its website can be accessed at http://www.neuseriver.org/. Universities North Carolina Cooperative Extension Service This cooperative extension service offers a variety of fact sheets related to water quality. Water quality fact sheets can be accessed online at http://www.ces.ncsu.edu/resources/water/. Some examples include:
*North Carolina Cooperative Extension Service. Soil Facts: Agriculture and Coastal Water Quality.
North Carolina Cooperative Extension Service. Soil Facts: North Carolina Erosion and Sedimentation Pollution Control Program.
North Carolina Cooperative Extension Service. Urban Waterways: Urban Stormwater Structural Best Management Practices (BMPs).
North Carolina State University
North Carolina Water Resources Research Institute The University of North Carolina Water Resources Research Institute (WRRI) was established in 1964 to meet North Carolina’s water-research needs. It is one of 54 state water institutes that were authorized by the Water Resources Research Act of 1964 to administer and promote federal/state partnerships in research and information transfer on water-related issues. Their website can be accessed at http://www2.ncsu.edu/ncsu/wrri/inst.html.
North Carolina State University Water Quality Group The North Carolina State University Water Quality Group is a multidisciplinary team that analyzes and conducts natural resource management programs with an emphasis on nonpoint source pollution policy, assessment, and control technologies. The group has

47
22 years of experience in water quality project evaluation, watershed assessment, and education in cooperation with USDA, EPA, state and local agencies. The mission of the NCSU Water Quality Group is to enhance the university’s water quality programs by acting as a center for water quality information and technical assistance on natural resources and waste management, with an emphasis on NPS pollution issues from agriculture, forestry, urban land uses, construction, and on-site wastewater systems. The website can be accessed at http://www.bae.ncsu.edu/bae/programs/extension/wqg/.
Watershed Education for Communities and Local Officials WECO is a N.C. Cooperative Extension Service Program housed at N.C. State University in the Agricultural and Resources Economics Department, and is a member of the National NEMO Network. The overall objective of the WECO program is to improve water quality through education of citizens and government officials who live and work in the watershed. This involves three objectives: q Delivery of technical information and educational material on water quality; q Empowerment of local citizens by facilitating collaborative, policy-making
partnerships at the watershed level between communities, local officials and state agencies; and
q Facilitation of local stakeholder development of policy recommendations for the entire watershed to improve water quality.
WECO’s website can be accessed at www.ces.ncsu.edu/WECO. Nonpoint Education for Municipal Officials (NEMO), University of Connecticut. NEMO is an educational program for local land use officials that addresses the relationship of land use to natural resource protection. NEMO has worked with almost two-thirds of the 169 municipalities in Connecticut, and the National NEMO Network has funded projects in 17 states. NEMO’s staff conducts about 150 educational workshops a year. A full description of the NEMO program can be found online at http://nemo.uconn.edu/about.htm.
Albemarle-Pamlico National Estuary Program Citizens Water Quality Monitoring Program Information on the Albemarle-Pamlico National Estuary Program can be found at http://www.epa.gov/region4/programs/cbep/albemarl.html. Specific information on water quality monitoring can be found by contacting Joan Giordano at (252) 946-6481 or Allen Clark at [email protected]. Sources of Information from Other States
City of Fort Worth, Texas, Municipal and County Stormwater Programs The City of Fort Worth, Texas, has a website that contains links to municipal and county government stormwater programs around the United States. There is also a description of

48
Fort Worth’s NPDES Stormwater Phase I permit requirements, including construction and new development. http://ci.fort-worth.tx.us/dem/stormcontacts.htm . Tennessee Online BMP Manual, City of Knoxville This draft online erosion and sediment control manual provides information on the design, inspection, and maintenance of structural and nonstructural BMPs that are used in the City of Knoxville, Tenn. The manual is similar to stormwater guidance prepared for the California Stormwater Quality Task Force. http://www.ci.knoxville.tn.us/engineering/bmp_manual/ . Texas Nonpoint Source Book This document is available at www.txnpsbook.org. This site is designed to provide stormwater pollution management information to public works professionals and other interested parties in the State of Texas. It also provides generic background and stormwater BMP information relevant to other sections of the country.

49
State and Federal Regulations Affecting Land Use and Water Quality A host of federal and state regulations affect land use as it relates to water quality in coastal North Carolina. This section will provide a brief summary of the most prominent and applicable regulations and provide contact information to receive further information. It should be noted that the local government is responsible for complying with all laws and regulations, but that all of the applicable laws and regulations may not be listed in the document. Website links are provided for some rules and regulations as a means to gain further information.
North Carolina Laws and Regulations North Carolina Surface Water Classifications When addressing nonpoint source pollution problems, local officials may discover that different water bodies in their community have varying classifications for their uses. This section provides a brief overview of surface water classifications in North Carolina to assist local officials in understanding water quality standards and designated uses. All surface waters in North Carolina are assigned a primary classification by the North Carolina Division of Water Quality. At a minimum all waters must meet the standards for Class C (fishable/swimmable) waters. Class B is a classification for primary water recreation, and several classes exist for drinking water and other specified uses. Table A-7 outlines major classifications and provides an overview of each. More information is available via the Internet link http://h2o.enr.state.nc.us/csu/swc.html.
Table A-7: North Carolina Surface Water Classifications
Class C
Waters protected for secondary recreation, fishing, wildlife, fish and aquatic life propagation and survival, agriculture and other suitable uses. Secondary recreation includes wading, boating, and other uses involving human body contact with water where such activities take place in an infrequent, unorganized, or incidental manner. There are no restrictions on watershed development or types of discharges.
Class B
Waters used for primary recreation and other uses suitable for Class C. Primary recreational activities include swimming, skin diving, water skiing, and similar uses involving human body contact with water where such activities take place in an organized manner or on a frequent basis. There are no restrictions on watershed development or types of discharges.
Water Supply I (WS-I)
Waters used as sources of water supply for drinking, culinary, or food-processing purposes for those users desiring maximum protection for their water supplies. These waters are also protected for Class C uses. WS-I waters are those within natural and undeveloped watersheds in public ownership with no permitted point source (wastewater) discharges. All WS-I waters are HQW (High Quality Waters) by definition.

50
Water Supply II (WS-II)
Waters used as sources of potable water where a WS-I classification is not feasible. These waters are also protected for Class C uses. WS-II waters are generally in predominantly undeveloped watersheds, and only general permits for discharges are allowed. All WS-II waters are HQW by definition.
Water Supply III (WS-III)
Waters used as sources of potable water where a more protective WS-I or II classification is not feasible. These waters are also protected for Class C uses. WS-III waters are generally in low to moderately developed watersheds. General discharge permits only are allowed near the water supply intake whereas domestic and nonprocess industrial discharges are allowed in the rest of the water supply watershed.
Water Supply IV (WS-IV)
Waters used as sources of potable water where a WS-I, II or III classification is not feasible. These waters are also protected for Class C uses. WS-IV waters are generally in moderately to highly developed watersheds or Protected Areas, and involve no categorical restrictions on discharges.
Water Supply V (WS-V)
Waters protected as water supplies which are generally upstream and draining to Class WS-IV waters or waters used by industry to supply their employees with drinking water or as waters formerly used as water supply. These waters are also protected for Class C uses. WS-V has no categorical restrictions on watershed development or wastewater discharges, unlike other WS classifications, and local governments are not required to adopt watershed protection ordinances.
Class WL
Freshwater Wetlands are a subset of all wetlands, which in turn are waters that support vegetation that is adapted to life in saturated soil conditions. Wetlands generally include swamps, marshes, bogs, and similar areas. These waters are protected for storm and floodwater storage, aquatic life, wildlife, hydrologic functions, filtration and shoreline protection. Although there are no restrictions on watershed development or types of wastewater discharge in wetlands, impacts from these actions must be justified, minimized, and often mitigated. No water bodies in the state currently carry the Class WL designation.
Class SC
All tidal salt waters protected for secondary recreation such as fishing, boating and other activities involving minimal skin contact; aquatic life propagation and survival; and wildlife. Stormwater controls are required under CAMA, and there are no categorical restrictions on discharges.
Class SB Surface waters that are used for primary recreation, including frequent or organized swimming and all SC uses. Stormwater controls are required under CAMA, and there are no categorical restrictions on discharges.
Class SA
Surface waters that are used for shellfishing or marketing purposes and all SC and SB uses. All SA waters are also HQW by definition. Stormwater controls are required under CAMA. No domestic discharges are permitted in these waters.

51
High Quality Waters (HQWs)
High quality waters are designated if the water quality is higher than the baseline standard. HQWs may be assigned a supplemental classification and protected through advanced treatment of wastewater, density limitations, and stormwater controls. This program is administered through the Division of Water Quality.
Outstanding Resource Water (ORW)
This program protects a small percentage of N.C. waters with excellent water quality that are associated with an outstanding resource, such as a National Wildlife Refuge. This program affects waters in designated ORW watersheds and is administered by the Division of Water Quality.
Source: N.C. Division of Water Quality, http://h2o.enr.state.nc.us/csu/swc.html. North Carolina State Environmental Policy Act
This law requires state agencies to review and report the environmental effects of all activities that: 1) involve a state action (usually a permitted or certified action), 2) involve an expenditure of public money or private use of public lands, and 3) have a potential environmental effect through Environmental Assessments (EAs) or more complex Environmental Impact Statements (EISs). More information can be obtained at the website http://www.envhelp.com/html/sepa.html and http://h2o.enr.state.nc.us/sepa/index.htm.
Coastal Area Management Act (http://www.nccoastalmanagement.net/Rules/cama.htm)
This act is aimed at controlling development pressures in North Carolina’s 20 coastal counties. It seeks to preserve the region’s economic, aesthetic, and ecological values. Under the Coastal Area Management Act, permits are required for projects proposed in Areas of Environmental Concern (AECs). AECs have four categories: the estuarine system, the ocean system, public water supplies, and natural and cultural resources.
North Carolina Dredge and Fill Law (http://dcm2.enr.state.nc.us/Rules/dredgefill.htm)
A permit must be provided through the Division of Coastal Management before any excavation or filling project is begun in any estuarine waters, tidelands, marshlands, or state-owned lakes. A permit is also required from the U.S. Army Corps of Engineers before any work can take place in navigable waters. Among the items required for completion of the permit are plat of area where proposed work will take place, location, depth, and width of any proposed channel, and a copy of the property deed. More information on this law can be obtained from the website link listed above.
North Carolina State Stormwater Program
This program applies to North Carolina’s 20 coastal counties covered by CAMA and is designed to protect sensitive waters from the impacts of stormwater activities associated with development. The regulations require development density limitations or stormwater treatment systems. This program is administered by the Division of Water Quality. More information can be obtained at the website http://h2o.enr.state.nc.us/su/State_SW_Mngt_Program.htm.

52
Sedimentation Pollution Control Act Any land-disturbing activities that uncover one or more contiguous acres of land requires an approved erosion and sedimentation control plan. Offsite damage is also prohibited. The act’s purpose is to protect streams and lands from degradation associated with erosion and sedimentation caused by land disturbing acts. Agricultural and mining are exempt and forestry has a special provisional exemption based on Forestry Practice Guidelines. This regulation is administered through the Division of Land Resources. Local governments may also develop their own programs. More information is available at http://www.dlr.enr.state.nc.us/eros.html.
Forest Practice Guidelines for Water Quality
This program protects water quality from site-disturbing actions associated with forestry activities that are exempt from the Sediment Pollution Control Act. It is administered by the Division of Forest Resources. More information can be obtained at http://www.dfr.state.nc.us/managing/water_qual.htm.
Water Supply Watershed Protection Programs
This program is applicable to local governments with water supply watersheds in their jurisdiction and it protects surface public water supplies by restricting development densities, limiting land uses and requiring the use of stream buffers to reduce the impacts of NPS. Local governments with water supply watersheds are required to develop and implement land use guidelines that meet or exceed these state standards. This program is administered by the Division of Water Quality. More information can be obtained at the website http://h2o.enr.state.nc.us/wswp/index.html.
Animal Waste Systems Management Act
This is a permitting program applied to feeding operations of more that 250 swine, 100 confined cattle, 75 horses, 1,000 sheep, or 30,000 confined poultry with a liquid waste management system and requires an animal waste management system. Feeding operations of the magnitude described must be under the supervision of a certified operator. Administration of this certificate falls under the Water Pollution Control Systems Operators Certification Commission. More information can be obtained at http://www.soil.ncsu.edu/certification/Manual/a/appendA-A.htm. Animal waste operations permits and applications can be found at http://h20.enr.state.nc.us/ndpu/ndpuapps.html#Animals.
County Planning and Regulation of Development
G.S. 153A, Art. 18 provides the authority from the State of North Carolina for county government to regulate development. More information can be obtained from http://www.ncga.state.nc.us/Statutes/GeneralStatutes/HTML/ByArticle/Chapter_153A/Article_18.html.
Local Development Act
This legislation (G.S. Ch. 158) provides local governments with the power to provide appropriations for encouraging economic development. More information can be obtained at

53
http://www.ncga.state.nc.us/Statutes/GeneralStatutes/HTML/BySection/Chapter_158/GS_158-7.1.html.
Cities and Towns Planning and Regulation of Development
This legislation (G.S. 160A) provides cities in North Carolina with the power to regulate development. More information can be obtained at http://www.ncga.state.nc.us/Statutes/GeneralStatutes/HTML/BySection/Chapter_160A/GS_160A-361.html.
Additional State Environmental Laws and Regulations
Additional information related to state (and federal) environmental laws and regulations can be obtained from the rules section of N.C. Department of Environmental and Natural Resources website at http://www.enr.state.nc.us/html/rules.html.
Federal Environmental Laws and Regulations National Environmental Policy Act
This rule requires Environmental Assessments or Environmental Impact Statements when airports, military complexes, highways, parkland purchases, and other federal activities are proposed.
National Pollutant Discharge Elimination System (NPDES) Phase I Phase I of this regulation focused on permit coverage to address stormwater runoff from:
• “Medium” and “large” municipal separate storm sewers (MS4s) generally serving populations of 100,000 or more;
• Construction activity disturbing 5 acres of land or more; • Ten categories of industrial activity.
Phase II (http://cfpub.epa.gov/npdes/stormwater/swphase2.cfm?program_id=6) Phase II Final Rule is the next step taken to protect water quality by expanding Phase I to cover smaller operators of MS4s in urban areas and operators of smaller construction sites. Phase II covers: • Operators of small MS4s located in “urbanized areas” as delineated by the Bureau of
Census. A “small” MS4 is any MS4 not already covered by Phase I of the NPDES storm water program.
• Operators of small construction activities that disturb equal to or greater than 1 acre and less than 5 acres of land.
Permit coverage for all MS4s and small construction activity is scheduled to be phased in by December 2002. Operators of small MS4s are required to design programs which: • Reduce the discharge of pollutants to the “maximum extent possible” (MEP); • Protect water quality;

54
• Satisfy the appropriate water quality requirements of the Clean Water Act.
The Phase II rule defines a small MS4 stormwater management program as being comprised of six elements:
♦ Public Outreach and Education ♦ Public Participation/Involvement ♦ Illicit Discharge Detection and Elimination ♦ Construction Site Runoff Control ♦ Post-Construction Runoff Control ♦ Pollution Prevention/Good Housekeeping
More specific information from the federal government regarding these requirements and small-construction program requirements can be accessed using the Internet address http://cfpub.epa.gov/npdes/stormwater/swphase2.cfm?program_id=6. More specific information on how the program is being implemented in North Carolina can be found at http://h2o.enr.state.nc.us/su/stormwater.html.
Clean Water Act Permits, Section 404
This section requires permits from the U.S. Army Corps of Engineers before undertaking any activity that will result in discharge of dredge or fill materials into waters of the United States. Waters of the United States refers to navigable waters, their tributaries, and adjacent wetlands. Permit applications and information can be obtained at http://www.saw.usace.army.mil/wetlands/Perm_app.htm.
1985-1996 Farm Bills USDA Swampbuster Programs
This program promotes wetland conservation by penalizing farmers who drain wetlands to increase tillable acreage. The penalties for violations are fines and ineligibility for United States Department of Agriculture (USDA) benefits on all lands owned.
USDA Sodbuster Programs
This program denies benefits to producers on all lands owned if they are not in compliance with conservation provisions for highly erodible land.
National Forest Management Act This act is administered by the National Forest Service and governs the management of national forests. The National Forest Management Act requires the Secretary of Agriculture to assess forest lands, develop a management program based on multiple use, sustained-yield principles, and implement a resource management plan for each unit of the National Forest System. It is the primary statute governing the administration of national forests. http://www.fs.fed.us/forum/nepa/nfmalaw.html

55
Sources of Additional Assistance and Funding for Implementing Urban Nonpoint Source Pollution Programs
This section of the manual will highlight potential federal, state, and private funding sources. A website link is provided as a means of acquiring further information on funding requirements and programs. An appropriate source for coastal counties to initially concentrate their funding efforts includes U.S. EPA 319 grant funding, N.C. Clean Water Management Trust Fund, and funding through the N.C. Wetlands Restoration Program. These funding sources are denoted with an asterisk (*). General State Funding *U.S. Environmental Protection Agency 319(h) Grant Program (http://www.epa.gov/owow/nps/319hfunds.html)
Federal grant funds administered by the N.C. Division of Water Quality within the Department of Environment and Natural Resources. A 40% match is required and it is a competitive grant application process. Applications are usually solicited between February and April of each year. Eligible applicants include state and local government agencies and nonprofit organizations.
*Clean Water Management Trust Fund (http://www.cwmtf.net/)
State grant funds administered by the Clean Water Management Trust Fund (CWMTF) in the Department of Environment and Natural Resources. The CWMTF will fund projects that (1) enhance or restore degraded waters, (2) protect unpolluted waters, and/or (3) contribute toward a network of riparian buffers and greenways for environmental, educational, and recreational benefits. Application process is competitive and usually conducted twice a year. No match is required but is preferred.
North Carolina Community Resource Information System (http://www.cris.state.nc.us/)
The N.C. Community Resource Information System is an interagency collaboration designed to facilitate the efforts of citizens and resource providers in looking for information about state programs, including grants and loans administered by North Carolina state agencies.
Publications
A Guide for North Carolina Landowners: Financial Incentives and Technical Assistance Programs Which Apply to Wetlands, Streams and Streamside (Riparian) Areas. North Carolina Department of Environment and Natural Resources. September 1999. North Carolina Division of Water Quality and North Carolina Wetlands Restoration Program.

56
General Federal Funding Federal One-Stop Shop Website (www.cfda.gov/federalcommons/)
The Federal Commons is a website for the entire federal grant application process, and users can search the General Services Administration catalog of federal grant programs from the website. Although your search will depend on your needs, you can try searching under Environmental Quality, Agriculture, Natural Resources, and Science and Technology.
U.S. Environmental Protection Agency Office of Water, Funding Sources Website (http://www.epa.gov/owow/nps/funding.html)
This website provides links to public and private funding sources to address NPS. It also provides a link to the Catalog of Federal Funding Sources for Watershed Protection.
Publications
Catalog of Federal Funding Sources for Watershed Protection, 2nd edition. United States Environmental Protection Agency. December 1999. EPA 841-B-99-003. Office of Water, Washington, D.C. http://www.epa.gov/owow/watershed/wacademy/fund.html
General Private/Nonprofit Funding National Sea Grant (www.epa.gov/owow/watershed/wacademy/fund/seagrant.html or www.nsgo.seagrant.org)
The National Sea Grant College Program encourages the wise use and stewardship of our marine resources and coastal environment through research, education, outreach and technology transfer. Sea Grant is a partnership between the nation’s universities and the National Oceanic and Atmospheric Administration. Sea Grant serves as a bridge between government, academia, industry, scientists, and private citizens to help Americans understand and sustainably use ocean waters for long-term economic growth.
Turner Foundation Inc. (http://www.turnerfoundation.org/turner/water.html)
General objective of the fund is to protect rivers, lakes, wetlands, aquifers, oceans and other water systems from contamination, degradation, and other abuses. Applications accepted throughout the year.
State Planning Funding 205(j) Water Quality Planning
Federal grant funds administered by the N.C. Division of Water Quality in the Department of Environment and Natural Resources. Limited competitive funding available to regional Councils of Governments (only) for water quality planning efforts. It is a competitive grant application process usually occurring in or around May of each

57
year. No match is required but is preferred. Information currently not available on website. For information contact Division of Water Quality, Steve Zoufaly, 919-733-5083, ext. 566.
Private/Nonprofit Planning Funding Stormwater Management Planning (http://stormwaterfinance.urbancenter.iupui.edu)
The Center for Urban Policy and the Environment at Indiana University-Purdue University Indianapolis, in cooperation with the Watershed Management Institute Inc., has used EPA grant money to develop a website designed to help communities find ways to pay for stormwater management projects.
Federal Education Funding National Environmental Education Grant Program (http://www.epa.gov/enviroed)
This EPA grant program supports environmental education projects that enhance the public’s awareness, knowledge, and skills to make informed decisions that affect environmental quality. Most grants are made at the $5,000 level by regional EPA offices. The upper grant amount of $250,000 is awarded by EPA Headquarters in Washington, D.C. Application process is in the fall of the year. Visit the “Grants Program” at EPA’s website.
State Restoration Funding *North Carolina Wetland Restoration Program (http://h2o.enr.state.nc.us/wrp/index.htm)
NCWRP pays up to 100% of the restoration costs. Property in the program is protected in perpetuity, and no options for contracts for a fixed number of years are available. Land can be enrolled in fee-simple, donation for tax credit purposes, or through permanent conservation easements. All land uses are eligible, and applications are evaluated based on restoration plan priorities.
North Carolina Conservation Reserve Enhancement Program (http://www.enr.state.nc.us/DSWC/files/crepmain.htm)
The Conservation Reserve Enhancement Program is a joint effort of the N.C. Division of Soil and Water Conservation, the N.C. Clean Water Management Trust Fund, the N.C. Wetlands Restoration Program, and the U.S. Department of Agriculture to address water quality problems of the Neuse, Tar-Pamlico and Chowan river basins as well as the Jordan Lake watershed area.
Environmental Quality Incentive Program (http://www.nc.nrcs.usda.gov/Programs/eqip.htm )
A program of the USDA that shares cost to install best management practices on agricultural land. The program provides incentive payments and cost share at the rate of 75%.

58
North Carolina Agriculture Cost Share Program (http://www.enr.state.nc.us/DSWC/files/acs.htm)
Administered locally by a Soil and Water Conservation District, this program shares cost for installation or use of BMPs on agricultural land that improves water quality. Funding is provided at a 75% cost share (based on average cost of the BMP). To learn more about the program visit the website or contact your local Soil and Water Conservation District (http://www.enr.state.nc.us/DSWC/files/dos.htm).
Federal Restoration Funding Wetlands Program Development Grants http://www.epa.gov/owow/watershed/wacademy/fund/wetlandsp.html
The Wetlands Program Development Grants provide financial assistance to states, federally recognized American Indian tribes, and local governments to support development of new, or augmentation and enhancement of existing wetland programs. Projects must clearly demonstrate a direct link to an increase in the state’s, tribe’s, or local government’s ability to protect its wetland resources.
USDA Wetlands Reserve Program (WRP)
WRP is restricted to converted wetlands, farmed wetlands, and riparian areas. WRP approves offers that assure the greatest wetlands benefits for dollars expended. Three options are available:
1. WRP permanent conservation easement – USDA pays 75% to %100 of the cost of restoring a
wetland plus the agricultural value of the land up to an established payment cap. 2. 30-year WRP conservation easement – USDA pays 50% to 75% of the restoration costs plus
75% of the easement for the land. 3. 10-year WRP agreement – USDA pays 50% to 75% of the restoration costs. No land-use
payments are made. National Coastal Wetlands Conservation – U.S. Fish and Wildlife Service (http://www.fws.gov/cep/cwgcover.html)
Provides grant funding for the conservation, restoration, and protect of coastal wetlands. Five Star Restoration Challenge Grants (http://www.epa.gov/owow/wetlands/restore/5star/)
This National Fish and Wildlife Foundation and the U.S. Environmental Protection Agency grant provides modest financial assistance on a competitive basis to support community-based wetland and riparian restoration projects that build diverse partnerships and foster local natural resource stewardship. In 2000, the second year of the program, 59 projects were awarded grants of $10,000 on average, out of approximately 200 applications received.

59
State Protection Funding N.C. Clean Water Management Trust (Link: http://www.cwmtf.net/) See General Category.
Federal Protection Funding National Coastal Wetlands Conservation – U.S. Fish and Wildlife Service See Restoration Category.
Federal/State Monitoring Funding U.S. EPA 319(h) Grant Program See General Category. State Conservation Funding Conservation Tax Credit Program (http://www.enr.state.nc.us/conservationtaxcredit/)
This incentive program offered by the State of North Carolina provides income tax credit for interests in property donated for conservation purposes. An income tax credit of 25% of the fair market value of the donated property interest up to $250,000 for an individual and $500,000 for a corporation may be granted. The donor can carry forward any unused portion of the credit for five years. The N.C. Department of Environment and Natural Resources must certify the property as meeting a public benefit. More information and eligibility requirements are available from DENR.
Urban and Community Forest Grant Program (http://www.dfr.state.nc.us/managing/urban/grant_urban.htm)
This program is made possible through a cooperative partnership between the N.C. Division of Forest Resources and the U.S. Department of Agriculture Forest Service. The goal of this initiative is to develop, enhance and support sustainable urban and community forestry programs throughout North Carolina.
Private/Nonprofit Geographic Information System (Conservation) Funding ESRI ( http://www.conservationgis.org/)
Source of grant information for GIS components for conservation projects.

60
Federal Environmental Justice Funding Environmental Justice Through Pollution Prevention Grants Program www.epa.gov/owow/watershed/wacademy/fund/justice.html
This program provides financial assistance to low-income and people-of-color communities to implement pollution prevention activities. EPA strongly encourages cooperative efforts among communities, business, industry, and government to address common pollution prevention goals. Projects funded under this grant program may involve public education, training, demonstration projects, and public or private partnerships, as well as approaches to develop, evaluate, and demonstrate non-regulatory strategies and technologies.

61
References Arnold Jr., Chester L., C. James Gibbons. “Impervious Surface Coverage.” Journal of the American Planning Association, Spring 1996, Vol. 62 Issue 2, pp. 243-259 Center of Excellence for Sustainable Development. www.sustainable.doe.gov Center for Watershed Protection website http://www.cwp.org/ Center for Watershed Protection. August 1998. Better Site Design: A Handbook for Changing Development Rules in Your Community. Center for Watershed Protection. October 1998. Rapid Watershed Planning Handbook: A Comprehensive Guide for Managing Urbanizing Watersheds. Center for Watershed Protection and Lath Ethics, Inc. Blueprint to Protect Coastal Water Quality: A Guide to Successful Growth Management in the Coastal Region of North Carolina. Federal Interagency Stream Corridor Restoration Working Group. October 1998. Stream Corridor Restoration: Principles, Processes, and Practices. GPO Item No. 0120-A; SuDocs No. A 57.6/2:EN 3/PT.653. ISBN-0-934213-59-3 Feitshans, Theodore A., Leon Danielson, Michele Marra, and Vernon Cox. 1997. Regulations Affecting Water Quality, Agriculture, and the Environment: A Primer. AG 564 http://www.cals.ncsu.edu/wq/Water/INDEX.HTM Galli, J. 1991. Thermal Impacts Associated with Urbanization and Stormwater Management Best Management Practices. Metropolitan Washington Council of Governments. Maryland Department of Environment. Washington, D.C. 188 pp. Gilliam, J.W., D.L. Osmond, and R.O. Evans. 1997. Selected Agricultural Best Management Practices to Control Nitrogen in the Neuse River Basin. North Carolina Agricultural Research Service Technical Bulletin 311, North Carolina State University, Raleigh, N.C. Mallin, Michael A., Joann M. Burkholder, Lawrence B. Cahoon, and Martin H. Posey. 2000. “North and South Carolina Coasts.” Marine Pollution Bulletin. Vol. 41, Nos. 1-6: 56-75. Mallin, Michael A., Scott H. Ensign, Matthew R. McIver, G. Christopher Hank, and Patricia K. Fowler. 2001. “Demographic , landscape, and Meteorological Factors Controlling the Microbial Pollution of Coastal Waters.” Hydrobiologia. 460: 185-193. May, C., R. Horner, J. Karr, B. Mar, and E. Welch. 1997. “Effects of Urbanization on Small Streams in the Puget Sound Lowland Ecoregion.” Watershed Protection Techniques, 2 (4): 483-494. Natural Resources Conservation Service. www.nrcs.usda.gov

62
Natural Resources Defense Council. May 1999. Stormwater Strategies: Community Responses to Runoff Pollution. North Carolina Cooperative Extension Service. Soil Facts: Agriculture and Coastal Water Quality. North Carolina Cooperative Extension Service. Soil Facts: North Carolina Erosion and Sedimentation Pollution Control Program. North Carolina Cooperative Extension Service. Urban Waterways: Urban Stormwater Structural Best Management Practices (BMPs). North Carolina Department of Environment and Natural Resources. Basinwide Water Quality Plans. North Carolina Division of Water Quality. North Carolina Department of Environment and Natural Resources. September 1999. A Guide for North Carolina Landowners: Financial Incentives and Technical Assistance Programs Which Apply to Wetlands, Streams and Streamside (Riparian) Areas. North Carolina Division of Water Quality and North Carolina Wetlands Restoration Program. North Carolina National Estuarine Research Reserve Technical Paper Series: “Septic Systems in Coastal North Carolina: Basics for a Healthy Environment.” No. 4. http://www.ncnerr.org/ccs/publications/septic_tpaper.pdf. North Carolina Progress Board. December 2001. North Carolina 20/20 Report. North Carolina Stream Restoration Institute. River Course: Natural Stream Processes. Fact Sheet Number 1. North Carolina Cooperative Extension Service. Palone, R.S. and A.H. Todd (editors). 1997. Chesapeake Bay Riparian Handbook: A Guide for Establishing and Maintaining Riparian Forest Buffers. USDA Forest Service. NA-TP-02-97. Radnor, PA. http://www.chesapeakebay.net/pubs/subcommittee/nsc/forest/handbook.htm Schueler, Tom. Environmental Land Planning Series: Site Planning for Urban Stream Protection. December 1995. Center for Watershed Protection and Metropolitan Washington Council of Governments. Texas Non-point Source Book. www.txnpsbook.org United States Environmental Protection Agency website on non-point source pollution. http://www.epa.gov/owow/nps/ United States Environmental Protection Agency. December 1999. Catalog of Federal Funding Sources for Watershed Protection, 2nd edition. EPA 841-B-99-003. Office of Water, Washington, D.C.

63
United States Environmental Protection Agency. July 1998. Estuaries and Your Coastal Watershed. EPA 842-F-98-009. Office of Water, Washington, D.C. United States Environmental Protection Agency. Guidance Specifying Measures for Sources of Nonpoint Pollution in Coastal Waters. EPA 850-B-92-002. Office of Water, Washington, D.C. United States Environmental Protection Agency. August 1999. Preliminary Data Summary of Urban Stormwater Best Management Practices. EPA 821-R-99-012. Office of Water, Washington, D.C. United State Environmental Protection Agency. November 1996. Risk Management Research Plan for Wet Weather Flows. EPA 600-R-96-140. Office of Research and Development, Washington, D.C. United State Environmental Protection Agency. December 1997. Urbanization of Streams: Studies of Hydrologic Impacts. EPA 841-R-97-009. Office of Water, Washington, D.C. White, Kim. May 1996. “Restoration of Channelized Streams to Enhance Fish Habitat: A Case Study of the Middle Fork John Day River, Oregon.” University of Wisconsin-Madison Institute for Environmental Studies. http://www.ies.wisc.edu/research/ies900/kimchannelization.htm#introduction White, Nancy M. and Leon E. Danielson. 1999. “WECO-Watershed Education for Communities and Officials.” Proc. Science into Policy: Am. Water Res. Conf., June 28 – Jul 1, Bozeman, MT. White, Nancy M., Daniel E. Line, JD Potts, William Kirby-Smith, Barbara Doll and W.F. Hunt. 1999. “Jump Run Creek Shellfish Restoration Project.” Journal of Shellfish Research, Vol. 19, No.1., 473-476, 2000. White, Nancy, Michael Holmes, and Leon Danielson. 1999. “Development of Land Use Change Indicators to Support Watershed Based Restoration of Shellfish Resources Impacted by Fecal Coliform Contamination.” In: Proc., International Conference on Shellfish Restoration, Cork, Ireland, October 1999.