Technical description of WtE (waste to energy) …1152720/FULLTEXT01.pdfRapporten beskriver den...
86
Master of Science Thesis KTH School of Industrial Engineering and Management Energy Technology EGI_2017-0052-MSC EKV1193 Division of Heat & Power SE-100 44 STOCKHOLM Technical description of WtE (waste to energy) facility in Donetsk, Ukraine Oleg Kukharchuk
Transcript of Technical description of WtE (waste to energy) …1152720/FULLTEXT01.pdfRapporten beskriver den...

Master of Science Thesis KTH School of Industrial Engineering and Management
Energy Technology EGI_2017-0052-MSC EKV1193 Division of Heat & Power SE-100 44 STOCKHOLM
Technical description of WtE (waste to energy) facility in
Donetsk, Ukraine
Oleg Kukharchuk

Master of Science Thesis EGI_2017-0052-MSC EKV1193
Technical description of WtE (waste to energy) facility in Donetsk, Ukraine
Oleg Kukharchuk
Approved
2017-06-15
Examiner
Miroslav Petrov - KTH/ITM/EGI
Supervisor
Miroslav Petrov Commissioner
Contact person
Affil.Prof. Ivan Kazachkov
Abstract
The main objective of this thesis project is to analyze some selected aspects of the feasibility study done in connection with the planning of a new WtE (waste-to-energy) facility in the city of Donetsk, Ukraine.
The report pictures the present situation in Donetsk, existing infrastructure and national regulations, selected location of the facility and suitable waste fuels for incineration, focusing on some important items such as: land allocation and logistics; waste management strategy (collection and sorting, garbage trucks, roads); fuel characteristics and incineration plant operational strategy; existing infrastructure and limitations (city water system, natural gas system, electricity system, district heating system).
The study describes the technical solutions chosen for the WtE facility, the civil works and building service systems, the operation and maintenance concept of the facility. The focus lies particularly on the general technical design criteria - operational functions, availability and redundancy; the fuel handling process- weighing, quality check, waste bunker, fuel treatment; the waste incinerator and steam boiler technology, slag extracting system, hydraulic piping, auxiliary systems, boiler performance and steam data; the flue gas cleaning system; the steam turbine and electrical generator drivetrain; and auxiliary systems.
Major attention is laid upon the operational strategy and functionality of the WtE complex involving the waste incinerator and combined heat and power (CHP) plant, in order to be best adapted to the fuel resource availability, environmental regulations, and the district heating network load profile.

SAMMANFATTNING Huvudsyftet med detta examensarbete är att analysera några utvalda aspekter av genomförbarhetsstudien som gjorts i samband med planeringen av en ny anläggning för avfallsförbränning med energiutvinning (WtE) i Donetsk, Ukraina.
Rapporten beskriver den nuvarande situationen i Donetsk med befintlig infrastruktur och nationella bestämmelser, utvald placering för anläggningen och lämpliga avfallsbränslen för förbränning med inriktning på några viktiga föremål såsom markallokering och logistik. Också andra detaljer är viktiga att diskuteras såsom avfallshanteringsstrategi (insamling och sortering, sopbilar, vägar); bränsleegenskaper och förbränningsanläggningens operativa strategi; befintlig infrastruktur och begränsningar (stadsvattensystem, naturgassystem, elsystem, fjärrvärmesystem).
Studien beskriver de tekniska lösningarna som valts för WtE-anläggningen, civilarbeten och byggnadssystemen, anläggningens drift och underhållskoncept. Fokus ligger särskilt på de allmänna tekniska designkriterierna - operativa funktioner, tillgänglighet och redundans; bränslehanteringsprocessen - vägning, kvalitetskontroll, avfallsbunker, bränslebehandling; avfallsförbränningsanläggning och ångpannteknik, slaggutdragningssystem, hydraulisk rörledning, hjälpsystem, pannans prestanda och ångdata; rökgasreningssystemet; ångturbin och elgenerator; och olika hjälpsystemen.
Stor uppmärksamhet läggs på WtE-komplexets operativa strategi och funktionalitet, som inbegriper avfallsförbränningsanläggningen och kraftvärmeprocessen, för att bäst anpassas till tillgången till bränsleresurser, miljöriktlinjer och fjärrvärmesystemets belastning.

1
Acknowledgment
I would like to express my gratitude to Doctor Ivan
Kazachkov, who has helped and provided guidance
with this thesis. Without his help on some particular
topics, this thesis would never have been
completed.

2
TABLEOFCONTENTS
TABLE OF CONTENTS ..................................................................................................................................... 2
Table of Figures ............................................................................................................................................. 5
Table of Tables .............................................................................................................................................. 7
List of Acronyms & abbreviations ................................................................................................................. 8
1 Introduction .......................................................................................................................................... 9
1.1 Object of this work ........................................................................................................................ 9
1.2 Background .................................................................................................................................... 9
1.3 Description of conditions ............................................................................................................ 10
1.3.1 General condition ................................................................................................................ 10
1.3.2 Land allocation .................................................................................................................... 10
1.4 Waste management .................................................................................................................... 13
1.4.1 Introduction ......................................................................................................................... 13
1.4.2 Collection and sorting ......................................................................................................... 13
1.4.3 Garbage trucks .................................................................................................................... 13
1.4.4 Summary ............................................................................................................................. 14
1.4.5 Roads ................................................................................................................................... 14
1.5 Fuels ............................................................................................................................................ 14
1.5.1 Characteristics of solid fuels ................................................................................................ 14
1.5.2 Characteristics of natural gas .............................................................................................. 15
1.6 Existing infrastructure ................................................................................................................. 15
1.6.1 City water ............................................................................................................................ 15
1.6.2 Natural gas .......................................................................................................................... 15
1.6.3 Electricity ............................................................................................................................. 15
1.6.4 District heating system ........................................................................................................ 15
2 Technical description of WtE facility ................................................................................................... 20
2.1 General technical design criteria ................................................................................................. 20
2.1.1 Operational functions.......................................................................................................... 20
2.1.2 Availability and redundancy ................................................................................................ 20
2.2 General technical outline of the WtE facility .............................................................................. 21
2.3 Fuel handling ............................................................................................................................... 23
2.3.1 General ................................................................................................................................ 23

3
2.3.2 Weighing ............................................................................................................................. 24
2.3.3 Quality check ....................................................................................................................... 24
2.3.4 Waste bunker ...................................................................................................................... 25
2.3.5 Travelling crane ................................................................................................................... 25
2.3.6 Fuel treatment .................................................................................................................... 26
2.4 Boiler ........................................................................................................................................... 26
2.4.1 General ................................................................................................................................ 26
2.4.2 Grate boiler technology ...................................................................................................... 27
2.4.3 Slag extracting system ......................................................................................................... 30
2.4.4 Hydraulic station ................................................................................................................. 30
2.4.5 Performance and steam data .............................................................................................. 30
2.4.6 Design of furnace and convection part ............................................................................... 30
2.4.7 Heat absorbing surfaces and pressurized vessels ............................................................... 31
2.4.8 Evaporator surfaces............................................................................................................. 31
2.4.9 Vertical pass ........................................................................................................................ 32
2.4.10 Horizontal pass .................................................................................................................... 32
2.4.11 Auxiliary systems ................................................................................................................. 34
2.5 Flue gas cleaning system ............................................................................................................. 37
2.5.1 General ................................................................................................................................ 37
2.5.2 Description of technology ................................................................................................... 38
2.5.3 Reduction of nitrogen oxides (deNOx) ................................................................................ 40
2.5.4 Flue gas fan .......................................................................................................................... 41
2.5.5 Stack pipe ............................................................................................................................ 41
2.5.6 Equipment for measurement of emissions ......................................................................... 42
2.6 Steam turbine .............................................................................................................................. 43
2.6.1 General ................................................................................................................................ 43
2.6.2 Working principle ................................................................................................................ 43
2.6.3 Design parameters .............................................................................................................. 45
2.6.4 Turbine type ........................................................................................................................ 46
2.6.5 Auxiliary and bleed steam ................................................................................................... 47
2.6.6 Electric generator ................................................................................................................ 47
2.6.7 Turbine gear ........................................................................................................................ 48
2.6.8 Auxiliary systems ................................................................................................................. 48
2.7 Auxiliary systems ......................................................................................................................... 51
2.7.1 Internal district heating ....................................................................................................... 51
4
2.7.2 Process cooling system........................................................................................................ 52
2.7.3 Make up water production ................................................................................................. 52
2.7.4 Ammonia system ................................................................................................................. 53
2.7.5 Compressed air system ....................................................................................................... 53
2.7.6 Water system ...................................................................................................................... 53
2.7.7 Water sampling station ....................................................................................................... 55
2.8 Electrification of the facility ........................................................................................................ 55
2.9 Instrumentation and automation ............................................................................................... 57
2.9.1 Boiler control system .......................................................................................................... 58
2.9.2 Flue gas cleaning control system ........................................................................................ 58
2.9.3 Turbine control system ....................................................................................................... 58
2.10 Residue management.................................................................................................................. 58
2.10.1 Slag ...................................................................................................................................... 58
2.10.2 Scrap iron ............................................................................................................................ 58
2.10.3 Fly ash .................................................................................................................................. 59
2.11 Interconnection points ................................................................................................................ 62
2.11.1 Roads ................................................................................................................................... 62
2.11.2 District heating .................................................................................................................... 63
2.11.3 Electricity ............................................................................................................................. 65
2.11.4 Natural gas .......................................................................................................................... 67
2.11.5 City water ............................................................................................................................ 67
2.11.6 Sewage ................................................................................................................................ 68
3 Conclusion ........................................................................................................................................... 70
References ................................................................................................................................................... 79
5
TableofFigures Figure 1 Map of Ukraine with the city of Donetsk marked
Figure 2 The Proletarskij district Figure 3 Closest housing accommodation to the WtE facility Figure 4 The site of the WtE facility Figure 5 View of the Larinsky landfill, Donetsk Figure 6 Garbage truck from GreenCo Figure 7 The district heating system in Donetsk Figure 8 General process design of the WtE Figure 9 Fuel reception in the WtE facility Figure 10 Example of weigh‐bridge Figure 11 Example of waste bunker Figure 12 Example of travelling crane with grab Figure 13 Grate boiler with furnace, empty passes and convection part Figure 14 Example of a fuel feeding system Figure 15 Example of a moving grate for a waste boiler Figure 16 Waste incineration on a mechanical grate Figure 17 Example of boiler tubes (boiler wall) Figure 18 Example of possible SH arrangement Figure 19 Example of feed water tank Figure 20 Example of a combustion air system Figure 21 Example of gas burner Figure 22 Example of pneumatic hammer Figure 23 Schematic outline of the flue gas cleaning process Figure 24 Example of a bag house filter construction Figure 25 Filter bag with filter supporting basket Figure 26 Example of flue gas fans Figure 27 3D view of a Siemens steam turbine Figure 28 Cross section of a reaction steam turbine Figure 29 Principal design of Donetsk WtE steam turbine Figure 30 Working principle of impulse and reaction turbines Figure 31 Synchronous generator from Alstom. The stator windings (orange) surround the rotor
magnet (metallic blue) Figure 32 Principal design of a shell and tube heat exchanger Figure 33 Principal diagram of the air cooled condenser Figure 34 Example of dry air cooler battery Figure 35 Example of compressed air tanks Figure 36 Example of water sampling station Figure 37 Examples of transformer, MV and LV switchgear Figure 38 Example of large and small FC drives respectively Figure 39 Example of mixing station for fly ash treatment Figure 40 Landfill structure with mineral sealing layers and coverage layers Figure 41 Layout of the new roads and the connection points to the existing road network
Figure 42 Layout of the new district heating interconnection pipe Figure 43 Principal diagram of the interconnection Figure 44 Principal of connection of the interconnecting pipe to the existing boiler house Figure 45 Layout of the electricity cable and the connection point to the electricity grid Figure 46 Layout of the new natural gas pipe and the connection point to the existing natural gas
system

6
Figure 47 Layout of the new city water pipe and the connection to the city water system Figure 48 Layout of the sewage pipe and the connection point to the existing sewage system Figure 49 Schematic future load Figure 50 Annual fuel flow

7
TableofTables
Table 1 Heating value, water content and ash content Table 2 Properties of natural gas Table 3 Specification of the different districts Table 4 Efficiency of the boilers and heat loss in the district heating systems Table 5 Supplied heat and gas consumption Table 6 Water consumption Table 7 Not allowed fuels Table 8 Data of live steam to the turbine Table 9 Data for internal district heating system Table 10 City water quality Table 11 Chemical composition of fly ash Table 12 Data for the new roads Table 13 Data for the heat production in the new WtE facility
Table 14 Electricity production of the WtE facility Table 15 Data for the electricity connection cable Table 16 Data for the natural gas Table 17 Data for the city waste Table 18 Data for the sewage water Table 19 Daily average values and half hour average values, emission limits set by law in
the Waste Incineration Directive compared to expected actual emission values after flue gas cleaning
Table 20 Average values measured over the sample period of a minimum of 30 minutes and a maximum of 8 hours, emission limits set by law in the Waste Incineration Directive compared to expected actual emission values after flue gas cleaning
Table 21 Average values which shall be measured over a sample period of a minimum of 6 hours and a maximum of 8 hours, emission limits set by law in the Waste Incineration Directive compared to expected actual emission values after flue gas cleaning
Table 22 Maximum permitted sound levels for work areas Table 23 Production figures (2x50 MW steam power) [MWh] Table 24 Estimated annual natural gas consumption for two waste‐fired boilers Table 25 Approximate mass balance for a 100 MW WtE facility Table 26 Estimated annual emissions

8
ListofAcronyms&abbreviations
BAT best available technology
EU Euro Union
Gcal/h giga calories per
HCl hydrogen chloride
HF hydrogen fluoride
HV/MV high voltage/ medium voltage
ID fan induced draft fan
kg kilograms
kg/m3 kilogram per cubic meter
kg/s kilogram per second
km kilometers
kV kilo volts
m meters
m3 cubic meters
MJ/kg Mega Joule per kilogram
mm millimeters
MSW municipal solid waste
MV/LV medium voltage/ low voltage
MW mega watts
NOx nitrogen oxides
O2 oxygen
PI polyimide
PTFE polytetrafluoroethylene
RO reverse osmosis
SH superheater
SNCR Selective Non Catalytic Reduction
SO2 sulphur dioxide
TOC total organic carbon
UPS uninterruptible power supply
WtE waste to energy

9
1 Introduction
1.1 ObjectofthisworkThe object of this work is to find feasibility of erection of WtE facility in Donetsk, Ukraine, regarding
present situation in Donetsk:
existing infrastructure and national regulations;
possible location of the facility;
suitable fuels for incineration. Also determine the technical solutions for the WtE facility, civil works and building service systems,
operation and maintenance concept of the facility.
1.2 BackgroundToday in Ukraine, almost all municipal waste is put on landfills, no energy is recycled and the
environmental impacts are severe. To satisfy the energy demand, large amounts of natural gas are
imported from Russia. The government of Ukraine is now aiming to improve the environment in a
rational way and to provide the nation with renewable energy
The city of Donetsk is the fourth biggest city in Ukraine, located in the south east of the country, see Figure 1. The area of the territory of Donetsk is 26 500 km2 and has approximately 1.1 million inhabitants, in total 1.6 million if the metropolitan area is included.
Figure 1 Map of Ukraine with the city of Donetsk marked [1]
In 2015 approximately 470 000 tons of municipal waste was collected in Donetsk [2]. Today, the largest part of the waste is deposited in landfills. The city of Donetsk has five landfill areas situated between 5 and 40 km from the city. Larinsky, Petrovsky, Chulkovsky and SVD+ receive solid municipal waste. Close to the Larinsky landfill there is also another landfill for industrial waste. The Larinsky landfill does not fulfill the environmental regulations and will be closed in the future, the Petrovsky landfill fulfills the environmental regulations but will be full in 2‐4 years and the Chulkovsky landfill has already been closed since it did not fulfill the regulations [3].
The capacity of the landfills is limited and a substantial part of the municipal waste is deposited in
unapproved landfills. Altogether this means that the waste situation in the country is rather harsh.
Erecting a number of WtE facilities in Ukraine contributes to improving the problem with growing

10
waste volumes in the country and it also meets the demand for a stable and efficient, clean energy
supply
1.3 Descriptionofconditions
1.3.1 Generalcondition
Due to increased gas prices and old district heating facilities, among others, there is a strong demand for new ways of producing energy in Donetsk.
The new WtE facility is a so called green field project, i.e. there is no activity on the location today. Therefore, there will be needed a thorough geological survey of the area carried out to find out important conditions. The geological survey consists of two parts: a technical environmental study and a geotechnical study. The former comprise sampling of soil and groundwater to determine level of pollution, the latter comprise mapping of nature and determining thickness of the various soil layers. This information is then used to determine which measures that need to be taken before the building work begins, e.g. whether there is a need for excavation and/or reinforcement measures. The green field status of the project means that everything belonging to or needed for the WtE facility will be made or built from scratch: ground works, buildings, roads etc. There will also be new connections made to the existing infrastructure in terms of roads, district heating pipes, natural gas pipes, electricity etc.
1.3.2 Landallocation
The selected location is within the Proletarskij district in southern Donetsk. Proletarskij has an area of
about 57 km2 and a total population number of 100 000 inhabitants, which satisfies the desired district heating demand to ensure a stable operation of the WtE facility. Infrastructure, i.e. district heating system, electrical grid, water and sewage systems etc. are also located in proximity to the intended site which facilitates both erection and operation of the facility as well as reduces the costs. A map of the Proletarskij district is shown in Figure 2.

11
Figure 2 The Proletarskij district [1]
The distance from the site to the closest existing boiler house is around 3.5 km and the SVD+ landfill is
also located in proximity to the suggested site.
In Figure 3 a map of the closest housing accommodations is shown.

12
Figure 3 Closest housing accommodation to the WtE facility [1]
The projected site has an area of 30 hectares and has in the past served as a supply area for high
explosives which implies that a soil remediation may be required. In former times, the mining
industry was prospering in the Proletarskij district and due to this the site is covered with underground
passages which may aggravate the civil works. Figure 4 shows a view of the selected site in the Proletarskij
district
Figure 4 The site of the WtE facility [4]

13
1.4 Wastemanagement
1.4.1 Introduction
According to the municipal waste transportation company and the city waste authority in Donetsk there are both municipal and private waste companies in the city today. About 60% of the waste is handled by private waste companies and 40% by municipal waste companies. Donetsk is divided into nine districts and the contracts on waste transportation from each district are renewed on an annual basis. Today, three districts are contracted by municipal companies while six districts are contracted by private companies.
Figure 5 View of the Larinsky landfill, Donetsk [4]
1.4.2 Collectionandsorting
According to BiogasProm, about 72% of the waste generated by the population and enterprises of Donetsk was collected during 2015. The remaining amount was disposed in unapproved landfills [2]. The citizens of Donetsk throw their waste in a container or in a similar portable collector placed inside or outside the building. Oversized waste, like furniture and refrigerators, is collected in other containers placed in the residential areas, when these are full the waste is transported to a special landfill. Hazardous waste is not separated from the municipal waste [3].
According to the waste authority in Donetsk there is a separate collection of electronic waste (batteries, TVs, computers etc.), aluminum, metals and in some places also of glass. The separation is poorly organized and due to lack of money only smaller amounts are collected today.
1.4.3 Garbagetrucks
The waste transportation in Donetsk is handled by garbage trucks. All waste transportation companies transport the waste directly to the landfills except for one company which in 2012 built a reloading station used for two districts located relatively far from the city. Larger trucks are used for transporting waste from the reloading station to the landfills [3]. The garbage trucks are in a relatively bad condition and about 50% of the trucks are older than ten years. Totally in Donetsk, there are about 140 garbage trucks and the mean value for each truck is a
collection of about 80‐100 m3 municipal waste per day. The capacity of the waste trucks is in the range
of 10‐18 m3 and they have a compression rate of about two, except for one company, GreenCo, which uses trucks with a compression rate of four. All trucks are unloaded from the rear end. Large

14
trucks have a pushing mechanism while smaller trucks have a tilting mechanism [3]. Figure 6 shows a garbage truck from GreenCo
Figure 6 Garbage truck from GreenCo [5]
1.4.4 Summary
The waste management in Donetsk is poorly organized. The garbage trucks are not weighed when entering the landfill facility and the amount of collected waste is therefore not recorded. Payment of the waste collecting service is controlled by the waste collecting companies and not all citizens connected to the service pay their fee. According to a poll made in 2014 in the Donetsk region, 64% of the persons interviewed were not satisfied with the quality of the waste management [2]. Furthermore, the containers in the residential areas, as well as the garbage trucks, are in a bad condition and replacement or service of the device is required.
1.4.5 Roads
The roads will connect to the existing roads in the city. The new roads will be built to endure the heavy transports made during erection of the new WtE facility. The transports to and from the facility will mainly be waste transports, transports of chemicals needed for the process and transports of ash from the WtE facility.
1.5 Fuels
1.5.1 CharacteristicsofsolidfuelsThe new WtE facility will incinerate solid municipal waste. Data concerning water and ash content and effective heating value of the solid fuel mixture expected to be incinerated in the WtE facility, as an hourly average value, are shown in Table 1 below.
Table 1 Heating value, water content and ash content
Parameter Unit Value
Effective heating value, average MJ/kg 7.0
Ash average weight‐% DM* 20
Water content average weight‐% 40
* Percentage by weight, dry matters
Data regarding the effective heating value of 7 MJ/kg shown in Table 1 is taken from a Tacis project that took place in 2013‐2014. During the project 72 containers of solid municipal waste from the Donetsk area were examined considering the composition of waste. Based on this study an effective heating value of 6.78 MJ/kg was calculated. The estimated effective heating value of the municipal waste in Donetsk also corresponds well to information given by the director and head engineer at the MSW incineration facility owned and operated by Kiev Energo, Ukraine. The municipal waste incinerated in this facility today has an effective heating value of 6.7‐7.1 MJ/kg.

15
The heating value of the municipal waste in Ukraine has increased during the years. According to information from Kiev Energo, when the MSW incineration facility in Kiev was taken into operation in 1987 the waste had an effective heating value of 3.3‐4.2 MJ/kg. Today the heating value has increased distinctly and is around 7 MJ/kg. The density of the municipal waste in Donetsk is, according to the municipal waste transportation
company and the city waste authority, normally around 250 kg/m3.
1.5.2 Characteristicsofnaturalgas
During start‐up and shut‐down of the WtE facility, natural gas will be used as fuel. To be able to ensure sufficiently high combustion temperature in case of fluctuations of the heating value of the waste, the WtE facility will be designed to automatically combust natural gas.
The properties of the natural gas are according to Table 2 below. The values are average values based on data from three different measurement dates during November 2015 of the natural gas in the gas pipeline Novoleskov – Loskutovka.
Table 2 Properties of natural gas [3]
Parameter Unit Average value
Methane % 92.7
Ethane % 2.9
Propane % 0.9
Pentanes % 0.03
Hexanes and similar % 0.02
Nitrogen % 3.0
Oxygen % 0.005
1.6 Existinginfrastructure
1.6.1 Citywater
The city water is distributed from a point located about 3.5 km from the WtE facility and the distance to the closest distribution pipeline is about 900 meters. The distribution pipeline has a dimension of 350 mm.
1.6.2 Naturalgas
A main gas distribution station is situated about 3 km from the site of the WtE facility. From the distribution station, natural gas is distributed in the Proletarskij area with pipelines of medium pressure (category “B”) and high pressure (category “C”). A distribution pipeline of medium pressure is located at a distance of 1.4 km from the site of the WtE facility.
1.6.3 ElectricityThe closest electrical substation is located at a distance of 2.8 km from the WtE facility and is owned by
the private company DTEC. In the Proletarskij area, there are distribution lines of 35 and 330 kV
which are located within one kilometer.
1.6.4 Districtheatingsystem
The existing district heating system in Donetsk consists of small local nets connected to boiler houses with gas fired boilers. There are 166 boiler houses containing 657 boiler units with a total capacity of

16
2600 MW in the Donetsk area. The district heating nets supply the connected consumers with both hot tap water and heat.
The Proletarskij area has five existing district heating nets. Each district heating net consists of one boiler house with a number of gas fired boilers and a number of thermal stations where the heat is transferred to the consumer’s heating system and tap water system. The nets are called:
District 11‐18 – one thermal station
District 11‐38 – thermal station integrated in boiler house
District Tsvetochniy – two thermal stations
District 2 – nine thermal stations
District 22‐30 – no thermal station
The different districts are shown in Figure 7 below.
Figure 7 The district heating system in Donetsk [3]
The boilers and the production of the different systems are specified in Table 3 below. The table also
shows the total length of the different nets. The efficiency of the boilers in each boiler house and the heat
losses for year 2013‐2015 in the different systems are shown in Table 4.
The heat transfer in the thermal station is performed by heat exchangers. The first step is the production of tap water. The district heating water is led through a heat exchanger and heat is transferred to the consumer’s net of tap water. The tap water should have a temperature of at least

17
60°C after heat exchange to avoid growth of bacteria in the system. The consumption of tap water is compensated by refilling of fresh water. After production of tap water the system for heat is connected in series. Heat from the district heating net is transferred to the heating system in the premises by heat exchangers. The leakage from the district heating net is compensated by refilling of district heating water in the boiler houses. Production of heat in the boilers and consumption of natural gas in the different districts for year 2013‐2015 is shown in Table 5. The water replenishment in the district heating net and the consumption of tap water in the thermal stations is shown in Table 6 below. The figures shown in Table 6 are the sum of the consumption at the different thermal stations in every district.

18
Table 3 Specification of the different districts [3]
Connected capacity
District 11‐18 District 11‐38 District Tsvetochniy District 2 District 22‐30
District heating (Gcal/h) 16.3 14.6 30.1 57.0 13.0
Hot water supply (Gcal/h) 6.5 9.7 28.2 48.5 5.5
Steam supply (Gcal/h) 0.6 ‐ ‐ ‐
Designed capacity of the boiler house 23.3 24.9 133.5 125.3 18.5 (Gcal/h) Type of boilers 3 x PVG‐8m 3 x PVG‐8m ‐ 3 x PTVM 30 m 2 x PVG‐8m
2 x DKVR 4/13 2 x DKVR 4/13 1 x TVG‐4r
Total length of district heating net (m) 25 240 12 620 ‐ 53 702 18 840 Total length of hot water supply net (m) 6 643 5 212 ‐ 26 958 5 012
Table 4 Efficiency of the boilers and heat loss in the district heating systems [3]
District Boiler efficiency Heat loss (%)
2013 2014 2015
District 11‐18 85‐92% 13.1 12.5 12.5
District 11‐38 92% 12.1 11.8 14.2
District Tsvetochniy 90% summer, 92% winter 13.1 14.3 11.7
District 2 92% 14.3 15.5 13.4
District 22‐30 92% 12.6 14.1 14.3

19
Table 5 Supplied heat and gas consumption [3]
2012 2013 2014 2015
District Supplied heat (Gcal)
Gas consumption (m3)
Supplied heat (Gcal)
Gas consumption (m3)
Supplied heat (Gcal)
Gas consumption (m3)
Supplied heat (Gcal)
Gas consumption (m3)
District 11‐18 35478 6212839 29 625 5 236 107 29 910 5 209 342 28 490 4 774 848
District 11‐38 46505 7794776 39 832 6 622 015 36 321 6 047 813 30 857 5 232 396
District Tsvetochiny 84245 13727250 73 479 12 144 604 73 480 12 313 373 69 560 11 100 314
District 2 158293 26116565 143 729 23 772 464 134 775 22 950 165 129 307 21 259 119
District 22‐30 31017 5 282 177 26 989 4 508 955 25 176 4 224 056 22 898 3 259 638
Table 6 Water consumption [3]
District Unit 2012 2013 2014 2015
District 11‐18 m3 45 064 41 564 34 300 34 947
Thermal stations m3 93 742 111 148 103 236 71 950
District 11‐38 m3 350 570 327 946 352 493 263 642
Thermal stations m3 ‐ ‐ ‐ ‐
District Tsvetochiny m3 60 607 75 591 60 925 85 973
Thermal stations m3 620 211 576 526 563 855 496 686
District 2 m3 153 819 132 154 115 840 96 084
Thermal stations m3 1 079 605 968 331 945 635 852 314
District 22‐30 m3 197 132 148 113 132 515 116 000
Thermal stations m3 ‐

20
2 TechnicaldescriptionofWtEfacility
2.1 GeneraltechnicaldesigncriteriaThe WtE facility shall be designed for an operational lifetime of at least 200 000 hours. This applies to all major parts of the facility except for the boiler furnace, protective evaporator and superheaters due to corrosion caused by the flue gas.
The main criteria for selection of technologies for the WtE facility are investment, operation and maintenance costs, energy production, incineration capacity, annual gross operation time, availability, proven technology, flexibility with regards to capacity and usage, steam data, minimization of landfill products, inner and outer environment etc. The weight of each criterion differs between different types of facilities and also to some degree between different projects. The specific valuation basis of the purchaser will also affect the weighting process.
When constructing WtE facilities, there are a few criteria which always outweigh the others. These are:
Annual gross operation time
Availability
A good outer environment through low emission levels
Proven technology
2.1.1 Operationalfunctions
Normally, the WtE facility is always operated at full load and produces as much electricity as possible. When there is a need of heat in the city, for example during the winter season, the thermal energy is used for producing district heating. Otherwise the thermal energy is cooled in an air cooled condenser. However, it is possible to operate the facility at loads between about 70% and 100% for each unit.
During normal operation, the boiler is operated at full load. The flow through the boiler is controlled to be able to deliver the desired steam temperature. The total live steam pressure is controlled by the turbine. In case the steam turbine trips, it is possible to continue to operate the facility’s boiler at full power with heat production via the direct condenser.
A number of parameters are continuously controlled in order to achieve a safe and optimal operation with regards to production and minimized environmental impact. These controlled parameters include:
Turbine generator electrical power production
District heating discharge temperature
Flue gas pressure
O2‐ and CO‐level in flue gas
Furnace temperature
Steam pressure and temperature control
Turbine back pressure limitation
Environmental limit controllers for NOx, SO2 etc.
2.1.2 Availabilityandredundancy
The facility shall have a high degree of availability. This requirement is fundamental and one of the most important requirements of the WtE facility and will therefore be the base for all design measures of the facility. All parts of the facility will therefore have well proven solutions in reference facilities. Each unit will shut down for annual overhaul during about four weeks each summer. Apart from these planned service occasions, the facility is expected to be in operation at all times.
In order to fulfill the requirements of availability the design will be based on a high degree of redundancy when such solutions are technically possible. Redundancy normally means that there are two
21
units with 100% capacity each. It will be possible to perform service during operation for redundant equipment. Examples of equipment that may be redundant are for example pumps, fans and control valves. A redundant component will automatically switch to the stand‐by component whenever necessary, for example, if it malfunctions. A redundant pump or other component or function will always be possible to shut down for maintenance without causing disturbance to other components of the facility.
2.2 GeneraltechnicaloutlineoftheWtEfacility
The WtE facility consists of the following main parts, also illustrated in the general design picture in Figure 8 below:
Fuel bunker – this is the fuel storage, garbage trucks tip the waste fuel directly into the bunker
Boiler – incineration takes place on the grate of the boiler and heat is produced and transferred to steam
Flue gas cleaning – the incineration process gives rise to flue gases, unwanted substances are removed in the flue gas cleaning process
Steam turbine – produces electricity from high pressure steam

22
receiving hall for waste
Air cooled
Activated Hydrated
Power
Combustion
High
pressure G
District
Condensate Mixer
Ammonia Low
pressure
Baghouse
ID fan
Fuel bunker
Steam
boiler
Fuel
Feed water
City Water
Natural Bottom Ash
Water
Figure 8 General process design of the WtE
23
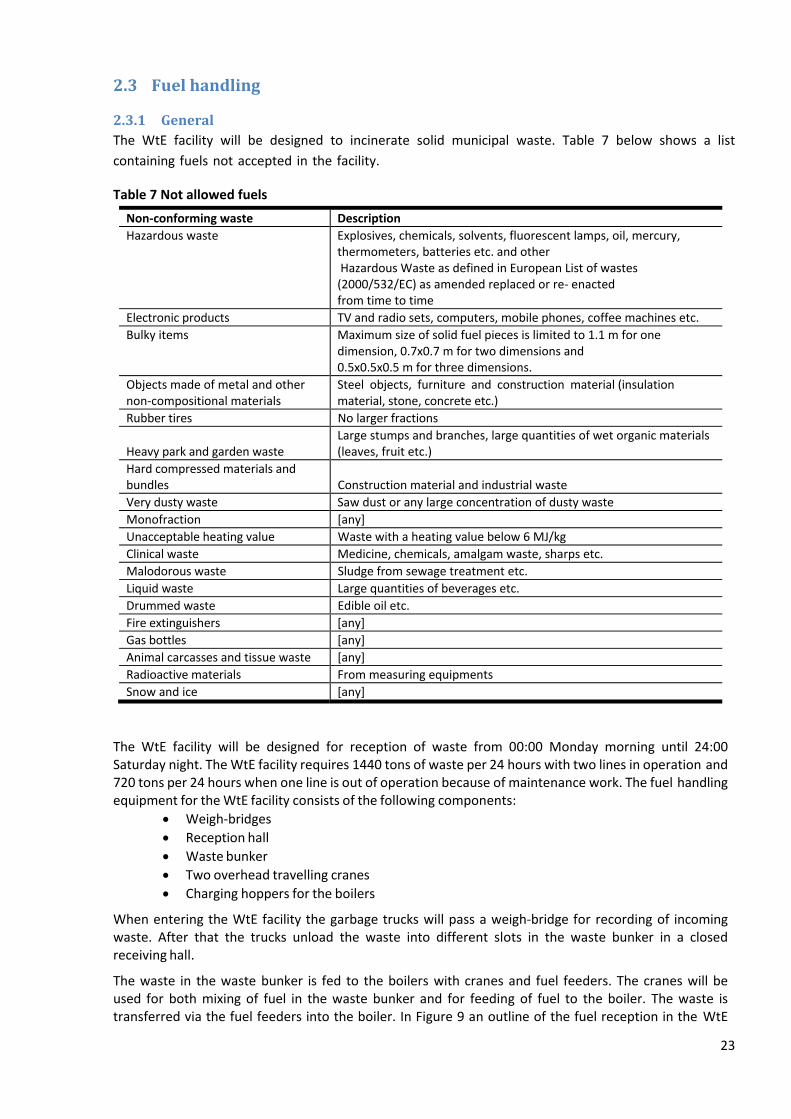
2.3 Fuelhandling
2.3.1 GeneralThe WtE facility will be designed to incinerate solid municipal waste. Table 7 below shows a list
containing fuels not accepted in the facility.
Table 7 Not allowed fuels
Non‐conforming waste Description
Hazardous waste Explosives, chemicals, solvents, fluorescent lamps, oil, mercury, thermometers, batteries etc. and other Hazardous Waste as defined in European List of wastes (2000/532/EC) as amended replaced or re‐ enacted from time to time
Electronic products TV and radio sets, computers, mobile phones, coffee machines etc.
Bulky items Maximum size of solid fuel pieces is limited to 1.1 m for one dimension, 0.7x0.7 m for two dimensions and 0.5x0.5x0.5 m for three dimensions.
Objects made of metal and other non‐compositional materials
Steel objects, furniture and construction material (insulation material, stone, concrete etc.)
Rubber tires No larger fractions
Heavy park and garden waste Large stumps and branches, large quantities of wet organic materials (leaves, fruit etc.)
Hard compressed materials and bundles Construction material and industrial waste
Very dusty waste Saw dust or any large concentration of dusty waste
Monofraction [any]
Unacceptable heating value Waste with a heating value below 6 MJ/kg
Clinical waste Medicine, chemicals, amalgam waste, sharps etc.
Malodorous waste Sludge from sewage treatment etc.
Liquid waste Large quantities of beverages etc.
Drummed waste Edible oil etc.
Fire extinguishers [any]
Gas bottles [any]
Animal carcasses and tissue waste [any]
Radioactive materials From measuring equipments
Snow and ice [any]
The WtE facility will be designed for reception of waste from 00:00 Monday morning until 24:00 Saturday night. The WtE facility requires 1440 tons of waste per 24 hours with two lines in operation and 720 tons per 24 hours when one line is out of operation because of maintenance work. The fuel handling equipment for the WtE facility consists of the following components:
Weigh‐bridges
Reception hall
Waste bunker
Two overhead travelling cranes
Charging hoppers for the boilers
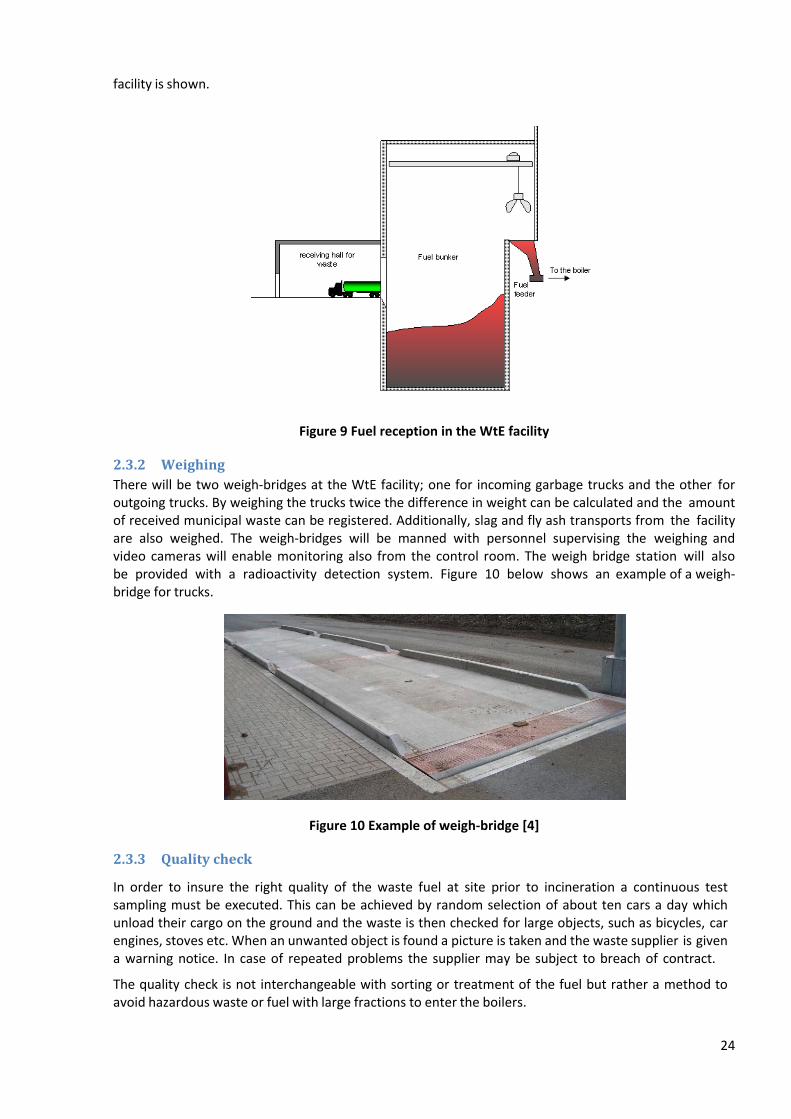
When entering the WtE facility the garbage trucks will pass a weigh‐bridge for recording of incoming waste. After that the trucks unload the waste into different slots in the waste bunker in a closed receiving hall.
The waste in the waste bunker is fed to the boilers with cranes and fuel feeders. The cranes will be used for both mixing of fuel in the waste bunker and for feeding of fuel to the boiler. The waste is transferred via the fuel feeders into the boiler. In Figure 9 an outline of the fuel reception in the WtE
24
facility is shown.
Figure 9 Fuel reception in the WtE facility
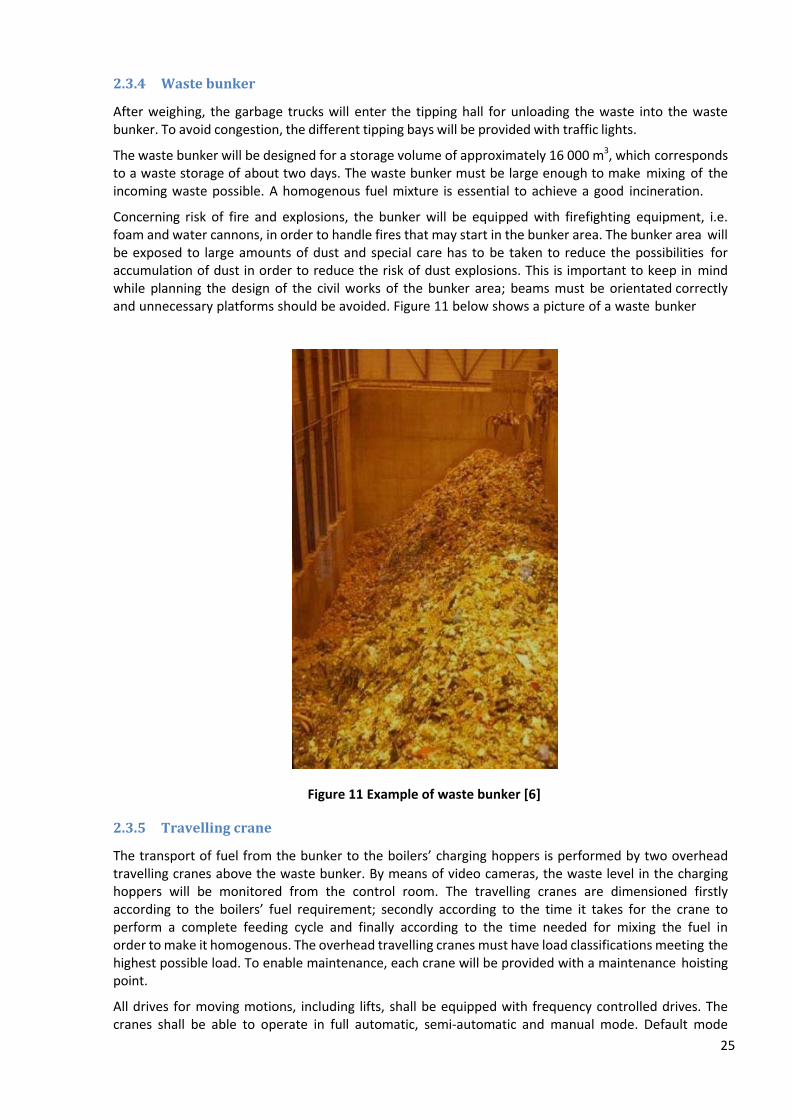
2.3.2 WeighingThere will be two weigh‐bridges at the WtE facility; one for incoming garbage trucks and the other for outgoing trucks. By weighing the trucks twice the difference in weight can be calculated and the amount of received municipal waste can be registered. Additionally, slag and fly ash transports from the facility are also weighed. The weigh‐bridges will be manned with personnel supervising the weighing and video cameras will enable monitoring also from the control room. The weigh bridge station will also be provided with a radioactivity detection system. Figure 10 below shows an example of a weigh‐bridge for trucks.
Figure 10 Example of weigh‐bridge [4]
2.3.3 Qualitycheck
In order to insure the right quality of the waste fuel at site prior to incineration a continuous test sampling must be executed. This can be achieved by random selection of about ten cars a day which unload their cargo on the ground and the waste is then checked for large objects, such as bicycles, car engines, stoves etc. When an unwanted object is found a picture is taken and the waste supplier is given a warning notice. In case of repeated problems the supplier may be subject to breach of contract.
The quality check is not interchangeable with sorting or treatment of the fuel but rather a method to avoid hazardous waste or fuel with large fractions to enter the boilers.
25
2.3.4 Wastebunker
After weighing, the garbage trucks will enter the tipping hall for unloading the waste into the waste bunker. To avoid congestion, the different tipping bays will be provided with traffic lights.
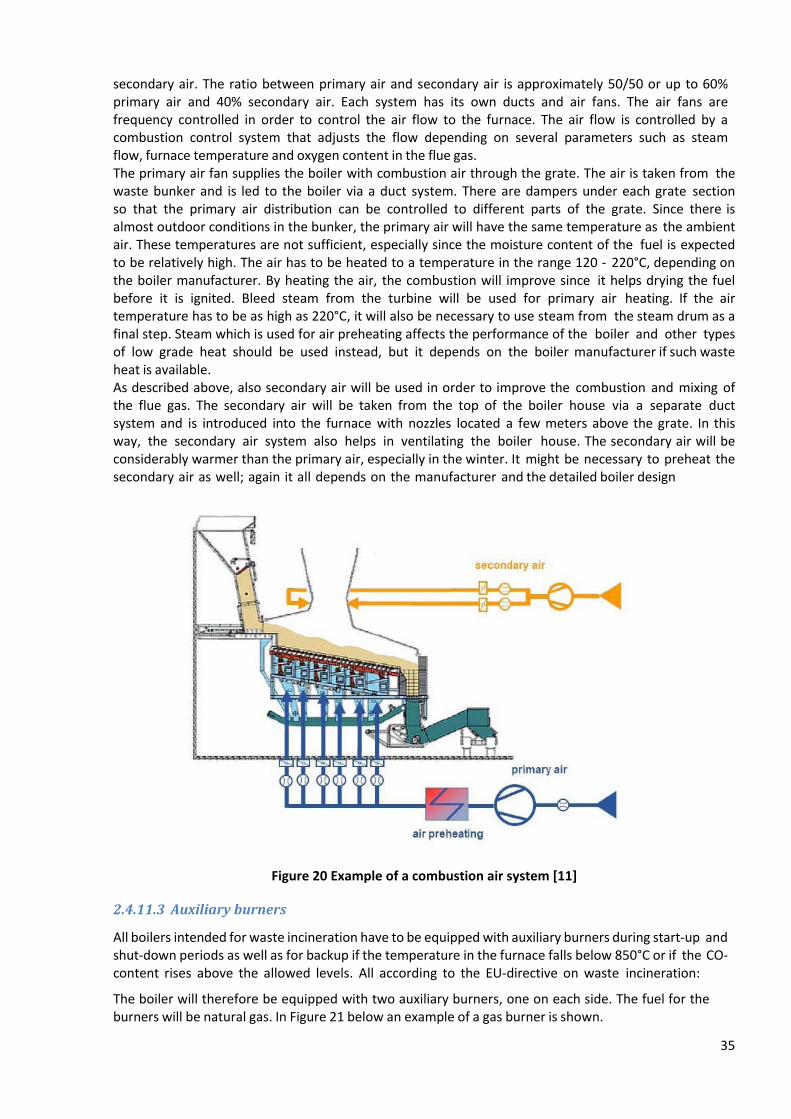
The waste bunker will be designed for a storage volume of approximately 16 000 m3, which corresponds to a waste storage of about two days. The waste bunker must be large enough to make mixing of the incoming waste possible. A homogenous fuel mixture is essential to achieve a good incineration.
Concerning risk of fire and explosions, the bunker will be equipped with firefighting equipment, i.e. foam and water cannons, in order to handle fires that may start in the bunker area. The bunker area will be exposed to large amounts of dust and special care has to be taken to reduce the possibilities for accumulation of dust in order to reduce the risk of dust explosions. This is important to keep in mind while planning the design of the civil works of the bunker area; beams must be orientated correctly and unnecessary platforms should be avoided. Figure 11 below shows a picture of a waste bunker
Figure 11 Example of waste bunker [6]
2.3.5 Travellingcrane
The transport of fuel from the bunker to the boilers’ charging hoppers is performed by two overhead travelling cranes above the waste bunker. By means of video cameras, the waste level in the charging hoppers will be monitored from the control room. The travelling cranes are dimensioned firstly according to the boilers’ fuel requirement; secondly according to the time it takes for the crane to perform a complete feeding cycle and finally according to the time needed for mixing the fuel in order to make it homogenous. The overhead travelling cranes must have load classifications meeting the highest possible load. To enable maintenance, each crane will be provided with a maintenance hoisting point.
All drives for moving motions, including lifts, shall be equipped with frequency controlled drives. The cranes shall be able to operate in full automatic, semi‐automatic and manual mode. Default mode

26
shall be full automatic. Manual operation can, for example, be suitable in cases when large amounts of waste is delivered in the morning or if waste for some reason has to be stored all in one part of the bunker. In order to obtain redundancy during maintenance work on the grab, one additional grab is needed for standby. Both grabs shall be dimensioned to handle the full flow of fuel. Figure 12 below shows a picture of a travelling crane with a grab
Figure 12 Example of travelling crane with grab [6]
2.3.6 Fueltreatment
Incineration of pre‐separated municipal waste does not require any treatment of the fuel. The maximum size of solid fuel pieces is limited to 1.1 m, for one dimension, 0.7x0.7 m for two dimensions and to 0.5x0.5x0.5 m for three dimensions.
Incombustible materials, for example metals, go through the boilers and come out with the slag. The amount of incombustible fractions will depend on the citizens’ sorting of the waste. Industrial waste requires sorting and treatment before combustion, this to reduce the amount of incombustible and oversized material. Oversized fuel pieces must be crushed. Industrial waste should be considered as additional fuel and should always be co‐fired with municipal waste. The same grab can be used for both mixing and treatment of fuel.
2.4 Boiler
2.4.1 General
The boiler consists of furnace, empty passes and a convection part. The fuel is combusted on a grate in the furnace and the hot flue gases are led to the convection part. After the furnace, there are two vertical and empty passes before the flue gases enter the horizontal or vertical convection part. In the convection part, the energy in the flue gases is transferred to the water/steam cycle and the flue gases are cooled to a temperature which is appropriate for the flue gas cleaning process.

27
Figure 13 Grate boiler with furnace, empty passes and convection part
2.4.2 Grateboilertechnology
Grate boilers are the most common type of boiler for municipal solid waste incineration and especially in larger facilities. The reason for this is that grate boilers can handle big variations in parameters connected to the fuel: fuel composition, heating value, ash and moisture content etc. The fuel handling system is also relatively simple for a grate boiler.
There are a number of different kinds of grates, such as moving tilting grates, vibration grates and rolling grates. Tilting grates dominate the market and will also be used for WtE facility in Donetsk. There are several suppliers of these types of boilers in Europe and elsewhere.
The waste is fed (via the charging hopper) from the shaft to the grate by a pusher and thereafter combustion takes place on the grate. The fuel shaft has a bigger area in the bottom than in the upper part, thereby preventing fuel from getting stuck on the way into the furnace. The shaft shall always be filled with fuel so that air is prevented from being sucked into the furnace the wrong way. There is also a damper in the shaft. The damper shall be open during normal operation, but is normally closed during start up before waste has been fed into the furnace and only the auxiliary gas burners are in operation. The damper is also closed during shut down when the fuel level has fallen below the damper. The shaft is also provided with water cooling, but this is only used in case of fire in the shaft. In the unlikely event of a back fire in the fuel shaft, there are also fire extinguishing nozzles in the lower part of the shaft which will be activated. To be able to supervise the fuel amount in the fuel shaft, a level measurement equipment is also installed.

28
Figure 14 Example of a fuel feeding system [7]
Each grate lane has its own fuel feeder that feeds fuel on the grate. The feeder rams are located in a common housing, but can be controlled individually in order to distribute the fuel uniformly over the grate. The fronts of the feeders are protected by wear plats that can be exchanged during overhaul.
The grate is movable and inclined to secure mixing and thereby complete incineration of the waste. Less than 3% (mass) of the bottom ash will be unburned. Every second row of grate bars is fixed and the waste is pushed forward by a reciprocating movement of the other grate rows, attached to each other via a grate truck or grate carriage. In this way, the fuel is mixed and moved forward to the slag shaft, see Figure 15 below. The movement of the grate bars is achieved by hydraulic oil powered pistons. The grate is divided into two or more lanes and between three and five sections. Each lane and section should have its own driving equipment.

29
Figure 15 Example of a moving grate for a waste boiler [8]
In the beginning of each grate lane, the fuel is not supposed to burn – instead this zone is intended for drying of the fuel. Then the ignition zone where fuel starts burning follows. The middle of the grate consists of the combustion zone which is followed by the final zone; the burnout zone where most of the fuel has already been incinerated and mostly slag will be left. The primary air can be controlled individually between the various zones in order to adjust the combustion. A grate in operation is shown in Figure 16 below.
The grate is made of high‐temperature alloyed and durable cast steel. Primary air for the combustion is introduced into the furnace via a duct system through the grate, i.e. between the grate bars. In this way, the air also cools the grate to an appropriate temperature. Sometimes the grate has to be cooled by water as well, but air cooling will be sufficient for WtE Donetsk because of the relatively low heating value of the fuel.
Figure 16 Waste incineration on a mechanical grate [9]

30
2.4.3 Slagextractingsystem
The slag extraction will be performed by a ram type slag extractor. The grate is connected to the extractor via a slag shaft, through which the combustion residues will fall down after burn out of the waste at the end of the grate. Together with small pieces of bottom ash, so called siftings, which will fall between the grate bars, the slag is collected in the water bath of the wet ram type slag extractor. The water level in the wet ram type slag extractor is kept constant by means of a level indicator and is adjusted in such a way that the gas seal in the discharge chute is ensured. To avoid pollution by vapors from the discharged warm slag, the outlet area of the slag extractor is encapsulated. The vaporish air will be sucked off via vapor hoods and mixed to the secondary air system.
The slag is pushed from the water bath by means of a pusher and is transferred to a conveyor that transports the slag that will be tipped directly on the concrete floor. The conveyor is followed by a second conveyor moving perpendicular to the first conveyor. The second conveyor can be run in two directions. Due to this the slag will be tipped along the whole conveyor instead of in just one large heap. A metal separator will be installed at the second conveyor. The slag will be collected by a front loader and transported from the WtE facility by a truck.
2.4.4 Hydraulicstation
There will be a central hydraulic oil station in the WtE facility. The hydraulic system consists of an oil tank, redundant pressure pumps and valves. The pressure pumps operate at an oil pressure of approximately 100 bar. The hydraulic system is normally cooled by the central process cooling system or by air. The hydraulic oil is used for powering the fuel feeders, the movable grate, the shut off damper in the fuel shaft and the ram of the slag extractor.
2.4.5 Performanceandsteamdata
High steam data is important in order to achieve high electricity output. The limitation of the steam temperature is determined by how high temperatures the superheaters can manage and the demands on availability and maintenance costs. The steam temperatures for a waste fired boiler cannot be as high as for boilers using cleaner fuels, such as gas or bio fuels. The high chloride content in the fuel causes high temperature corrosion on the superheaters if the temperatures are too high. Steam data for a waste boiler is normally around 40 bar/400°C. In order to increase the electrical output, steam data for the WtE facility in Donetsk has been chosen at 60 bar/425°C. These data are still fairly conservative and the risk for corrosion will be held at an acceptable level.
2.4.6 Designoffurnaceandconvectionpart
The furnace design is important to the burning of CO and other combustible gases. In the furnace the gases should be mixed well in order to attain complete combustion. This is achieved by adding secondary air. The secondary air is added at a high velocity and the nozzles are located and directed in such a way as to achieve maximum mixing. This gives good combustion – i.e. low contents of CO, TOC (Total Organic Carbon) etc., an even temperature distribution in the furnace and lower NOx content. This also lowers the risk for corrosion in the furnace as well as on the superheaters. Typically,
the CO content in the flue gas after a waste fired grate boiler is in the range 10‐30 mg/Nm3 at 11% O2. Thanks to the mixing of air, the O2 content in the flue gas can be held at approximately 6%.
The refractory in the furnace of a grate boiler has three main tasks: insulating the furnace walls to stop the flue gases to cool down too quickly, protect the carbon steel tubing in the lower parts of the furnace walls against mechanical wear, and protect the tubes from corrosion.
Refractory often demands extensive maintenance, both time‐ and moneywise, and in order to reduce the maintenance of the boiler it is possible to replace parts of the protective refractory with a coating of the carbon steel tubes with Inconel, a high alloy compound. It is also possible to use compound tubes – e.g. Sanicro – or homogenous high‐alloy tubes to avoid corrosion in the furnace. However, to use refractory is the most common method and represent the lowest investment.

31
The furnace volume of the first pass will be around 840‐1500 m3 depending on the future elected boiler manufacturer. Design pressure from the flue gas side is 33 mbar (calculated with 1.5 x safety margin).
2.4.7 Heatabsorbingsurfacesandpressurizedvessels
The heat absorbing surfaces and pressurized vessels in a steam boiler are divided into the following:
Economizer, heating the feed water almost to the boiling point and sending it to the steam drum.
Steam drum, acting as a separator of steam and water and also as an expansion vessel by absorbing volume changes in the boiler. To some extent the drum also acts as a backup volume in case of tube leaks. The steam drum is not a heat absorbing surface.
Evaporators, which heat the water to the boiling point. The evaporators are normally only constituted by the furnace walls, vertical and horizontal passes as well as a small protective evaporator before the superheaters. Sometimes – although it is unusual – there is also an evaporator after the superheaters in the horizontal pass. It all depends on the heat balance of the boiler.
Superheaters, heating the water vapor above its boiling point. Steam coolers are used to control the steam temperature between each superheater
Figure 17 Example of boiler tubes (boiler wall) [10]
2.4.8 Evaporatorsurfaces
The tubes in the walls of the furnace, vertical and horizontal passes are called evaporator surface, water from the steam drum flows downward to the bottom of the boiler in special falling tubes through self‐circulation and is gathered in bottom boxes. These are connected to the evaporator tubes in the boiler, in which the water is heated to the boiling point by the flue gases. Water emulsions in liquid

32
phase as well as water vapor are led back up to the steam drum, where water and steam are separated from each other. The water is led back down through the falling tubes to the evaporators and the steam is led to the superheaters. It is important that the fin width between the tubes in the furnace, drags and superheaters is not too big
– maximum 25 mm – in order to avoid corrosion on the fins. The tube diameter of the furnace tubes
should not be too big either – an outer diameter of 60.3 mm at the most but more preferably 48 mm.
Evaporator surfaces further back in the horizontal drag can have bigger fin width and tubes with a
diameter of 60.3 mm
2.4.9 Verticalpass
After the furnace – which is often referred to as the first pass – there shall always be two additional passes. The first of these additional passes shall be completely empty. The second one can contain one, two or three partition walls parallel to the flue gas stream in order to help lower the flue gas temperature before the superheaters. All three passes – including the furnace – are vertical. The purposes of the passes are:
To give a long residence time at high temperatures so that CO is oxidized into CO2
To make sure that as many unburned particles as possible have enough time to combust
To make sure that there is enough time for as much melted ash as possible to solidify
To lower the flue gas temperature below 650°C
According to EU legislation, the vertical passes have to be designed in such a way that the temperature of the combustion gas does not fall below 850°C until at least two seconds after the last introduction of combustion air (i.e. secondary air). If this requirement is met, the combustion is good enough to ensure that the emissions of dioxins, for example, are held at a low level.
The above mentioned criteria also grant good conditions for a long life time of the superheaters. The tubes in the pass following the furnace are also often coated with e.g. Inconel as protection from corrosion. This coating is often applied as far down as two to four meters down in the second pass. The alternative again is compound tubes – e.g. Sanicro – or homogenous high‐alloy tubes. In the third pass the tubes are made out of carbon steel and are without coating.
2.4.10 Horizontalpass
After the vertical passes is the convective pass. The convective pass may be vertical or horizontal, but in this case the pass will be horizontal. The tubes are in a hanging position in the horizontal pass. They should always be hanging in line as opposed to a zigzag pattern, since this increases the risk of clogging and makes cleaning as well as maintenance harder. All tubes have to be smooth, i.e. they shall not have flanges improving heat absorption, since these will cause clogging.
2.4.10.1 Protectiveevaporator
It is advisable that the horizontal pass begins with a protective evaporator, consisting of two or possibly four tube rows. The protective evaporator can consist of tubes made out of alloy‐treated steel or carbon steel tubes coated with Inconel or compound tubes. The task of the protective evaporator is to take the “first blow” of particles in the flue gas and capturing them on a relatively cold surface – the temperature of the medium in a protective evaporator is 270 – 280°C.
2.4.10.2 Superheaters
After the protective evaporator the superheaters – SH – follow. The flue gas temperature should not be more than 650°C before the first superheater in order to minimize the risk of corrosion. There are normally three superheaters and between each pair there is a steam cooler, i.e. two steam coolers in total for three superheaters: one between SH1 and SH2 and one between SH2 and SH3. The steam temperature after SH1 and SH2 must always be lower than after SH3, which is the final superheater, in

33
order to minimize the risk of corrosion. In principle it is always best to put the coldest superheater SH1 – first in the flue gas stream and the hottest – SH3 – last in the flue gas stream. Additionally, it is best to have all superheaters connected concurrent with the flue gas stream. It is impossible however to achieve a heat balance with these demands. An example of a possible SH arrangement after the protective evaporator may be (the surfaces are listed in flue gas stream direction):
SH3 concurrent
SH1 counter‐current
SH2 counter‐current
Figure 18 Example of possible SH arrangement
The most important requirement is that SH3 is not first in the flue gas stream and counter‐current connected at the same time. This leads to too high material temperatures and corrosion. The supplier must present a temperature diagram for the flue gas and steam so the risk for corrosion can be determined. The corrosion properties of the superheaters can be improved by choosing high‐alloy materials but the result is not as great as with the evaporators. No part of the superheaters is allowed to be hotter than the exit of SH3. SH1 and SH2 as well as the protective evaporator must be dimensioned in this way.
Waste boilers have traditionally been fitted with drains on the superheaters which – at least in most cases – other boilers have not. This could be because older waste boilers were mostly used for waste destruction (with no power generation) and thus had bad water quality. This is no longer the case. Waste fired boilers have just as high water quality as other boilers. It is therefore recommended that drains on superheaters are excluded. Drains underneath superheaters have rather big problems with corrosion, since these tubes are normally without cooling and therefore suffer from higher material temperatures than other tubes.
2.4.10.3 Economizer
An economizer is a heat exchanger that heats the feed water almost to the boiling point before the feed water enters the steam drum. The economizer is located last in the flue gas stream. There is no risk of high temperature corrosion in the economizer, which is the case in the passes and superheaters. It will be expensive if the economizer is located in the horizontal pass since the heat transfer coefficient in such a boiler is rather low, making the economizer large. It also takes up a lot of space. Therefore, the last part of the economizer will be made vertical, which is however less favorable from the point of view of cleaning.
The economizer is made out of carbon steel and has a normal tube outer diameter of 33.7 mm. Inlet water temperature should be approximately 130°C to prevent low temperature corrosion.

34
In the first part of the economizer the tube walls can have a bigger fin width – approximately 50 mm – without problems. In the last part of the economizer, where the flue gas temperature is below 300°C, the walls may be non‐cooled and made of sheet steel.
2.4.11 Auxiliarysystems
2.4.11.1 Feedwatersystem
The feed water tank is the main component of the feed water system. Condensate from the turbine or the direct condenser is led to the feed water tank and feed water to the boiler is taken from the tank. Make up water (new water to the water/steam cycle) is also led to the feed water tank. The temperature of the water in the tank is heated to approximately 130°C. The temperature is controlled at this level using bleed steam from the turbine. The steam is introduced to the tank via a pipe with several holes in the bottom of the tank.
There is a deaerator on top of the tank. All water, condensate and make up water, which is led to the tank has to pass through the deaerator. In the deaerator, the water is heated so that oxygen dissolved in the water evaporates and is ventilated out of the tank.
The tank also serves as a backup volume of water for the boiler. If there is a tube leak in the boiler, there has to be a quite big volume of water available for cooling the heat absorbing surfaces. The
volume of the feed water tank for this kind of boiler should be at least 60 m3. Make up water shall
also be available and stored in its own tank containing about 100 m3. In Figure 19 a feed water tank with deaerator is shown.
Figure 19 Example of feed water tank [4]
The feed water pumps take water from the feed water tank and supplies the boiler. The pumps must always be available for supplying the boiler with water and thus replacing the steam which leaves the boiler. It is extremely important that the pumps are always running when the boiler is in operation. If this fails, the boiler will run out of water and the tubes will be destroyed. In order to secure the feed water supply, the pumps have to be redundant, either with two 100% pumps or using three 50% pumps. In the first case, one pump will always be in operation and the other one serves as back up. In the latter case, two pumps are always in operation, using one pump as back up. The feed water supply has to be secured also in the case of electrical power failure. This is obtained by using a diesel powered backup generator or an emergency feed water pump powered by steam – as long as there is a need for feed water, high pressure steam will be available.
2.4.11.2 Combustionair
Combustion air for the WtE process is dived into one system for primary air and one system for
35
secondary air. The ratio between primary air and secondary air is approximately 50/50 or up to 60% primary air and 40% secondary air. Each system has its own ducts and air fans. The air fans are frequency controlled in order to control the air flow to the furnace. The air flow is controlled by a combustion control system that adjusts the flow depending on several parameters such as steam flow, furnace temperature and oxygen content in the flue gas. The primary air fan supplies the boiler with combustion air through the grate. The air is taken from the waste bunker and is led to the boiler via a duct system. There are dampers under each grate section so that the primary air distribution can be controlled to different parts of the grate. Since there is almost outdoor conditions in the bunker, the primary air will have the same temperature as the ambient air. These temperatures are not sufficient, especially since the moisture content of the fuel is expected to be relatively high. The air has to be heated to a temperature in the range 120 ‐ 220°C, depending on the boiler manufacturer. By heating the air, the combustion will improve since it helps drying the fuel before it is ignited. Bleed steam from the turbine will be used for primary air heating. If the air temperature has to be as high as 220°C, it will also be necessary to use steam from the steam drum as a final step. Steam which is used for air preheating affects the performance of the boiler and other types of low grade heat should be used instead, but it depends on the boiler manufacturer if such waste heat is available. As described above, also secondary air will be used in order to improve the combustion and mixing of the flue gas. The secondary air will be taken from the top of the boiler house via a separate duct system and is introduced into the furnace with nozzles located a few meters above the grate. In this way, the secondary air system also helps in ventilating the boiler house. The secondary air will be considerably warmer than the primary air, especially in the winter. It might be necessary to preheat the secondary air as well; again it all depends on the manufacturer and the detailed boiler design
Figure 20 Example of a combustion air system [11]
2.4.11.3 Auxiliaryburners
All boilers intended for waste incineration have to be equipped with auxiliary burners during start‐up and shut‐down periods as well as for backup if the temperature in the furnace falls below 850°C or if the CO‐content rises above the allowed levels. All according to the EU‐directive on waste incineration:
The boiler will therefore be equipped with two auxiliary burners, one on each side. The fuel for the burners will be natural gas. In Figure 21 below an example of a gas burner is shown.

36
Figure 21 Example of gas burner [4]
2.4.11.4 Cleaning
During operation of the boiler, fly ash will form a layer on the walls and tubes and it will continuously grow thicker making the heat transfer less efficient. It is therefore important to clean the bundles during operation. There are several cleaning technologies available, all with their own advantages and disadvantages and more or less suitable depending on the type of boiler.
There will be a great need for cleaning of the tube bundles, but it may also be necessary to clean the walls of the empty passes during operation. The boiler will therefore be prepared for installation of a soot cleaning system in the empty passes. If this cleaning system is installed, it will use high pressure water for cleaning the walls in the boiler.
Since the superheaters are located in a horizontal pass, there are several advantages when cleaning them. The tubes are in a hanging position and particles which fall off the tubes can be collected in hoppers underneath and the fly ash be transported off in a separate mechanical system. In a vertical pass, the tubes are arranged horizontally and there is a risk that falling dust will cause clogging on the tubes underneath. In a horizontal pass, the most suitable cleaning method is rapping, which means that the steam headers are struck with a hammer. This causes the tubes to vibrate and the ash to fall off. The mechanical blow can be applied either with hammers attached to a rotating shaft alongside the boiler or by a pneumatic hammer that travels on a rail along the boiler and can hit headers at several positions. In Figure 22 a picture of a pneumatic hammer is shown.

37
Figure 22 Example of pneumatic hammer [4]
A rapping system cannot be used if the tubes are arranged horizontally since the headers are not available from the outside. The advantages when it comes to cleaning are the most important reasons for not locating the superheaters in a vertical drag.
The economizer will be located in a vertical pass after the superheaters. For the above mentioned reasons, rapping is not possible in this case. Cleaning of the economizer will be made by ball shot cleaning or by vibrating pneumatic cleaning. Vibrating cleaning is based on pistons that operate on compressed air. The vibrations are transferred via the pistons to the tubes, which make the ash come off.
Ball shot cleaning may be used for cleaning the economizer. In this case, small metal balls are circulated in the vertical pass. The balls are typically made of aluminum and are dropped from the top of the vertical pass and collected again in a hopper in the bottom of the pass together with the ash. After the balls and ash have been separated, the balls are sent back to the top of the boiler. A condition for using this technology is that the economizer tubes are arranged in a zigzag pattern in order to expose all the tubes to the metal balls.
2.4.11.5 Materials
The choice of tube materials on superheaters, evaporator tubes and economizers in the furnace and flue gas channel are critical for a good and stable boiler operation. Materials should be selected on the basis of their durability, corrosion/erosion resistance, heat resistance, heat conductivity and strength. In a waste incineration steam boiler with a grate furnace, steam data of 40 bar/400°C are normal. In such conditions, the risk of high temperature corrosion‐related damages are relatively small if the boiler is properly designed, with flue gas temperatures lower than 650°C before the superheaters. With a superheated (steam) temperature below 400°C, no special materials are needed in the superheater tubes. Regular carbon pressure vessel steel tubes are sufficient for all tubes except for the final superheater where alloy‐treated steel is adequate. These materials are relatively cheap and easy to replace.
2.5 Fluegascleaningsystem
2.5.1 General
The selection of flue gas cleaning system is based on the requirements in the EU directive (2000/76/EC) on incineration of waste. The directive requires that emission limits are fulfilled, both as 24 hours average values and half hour average values. The half hour averages are required to ensure that the flue gas cleaning system is able to react quickly on fluctuations in incoming emission levels.
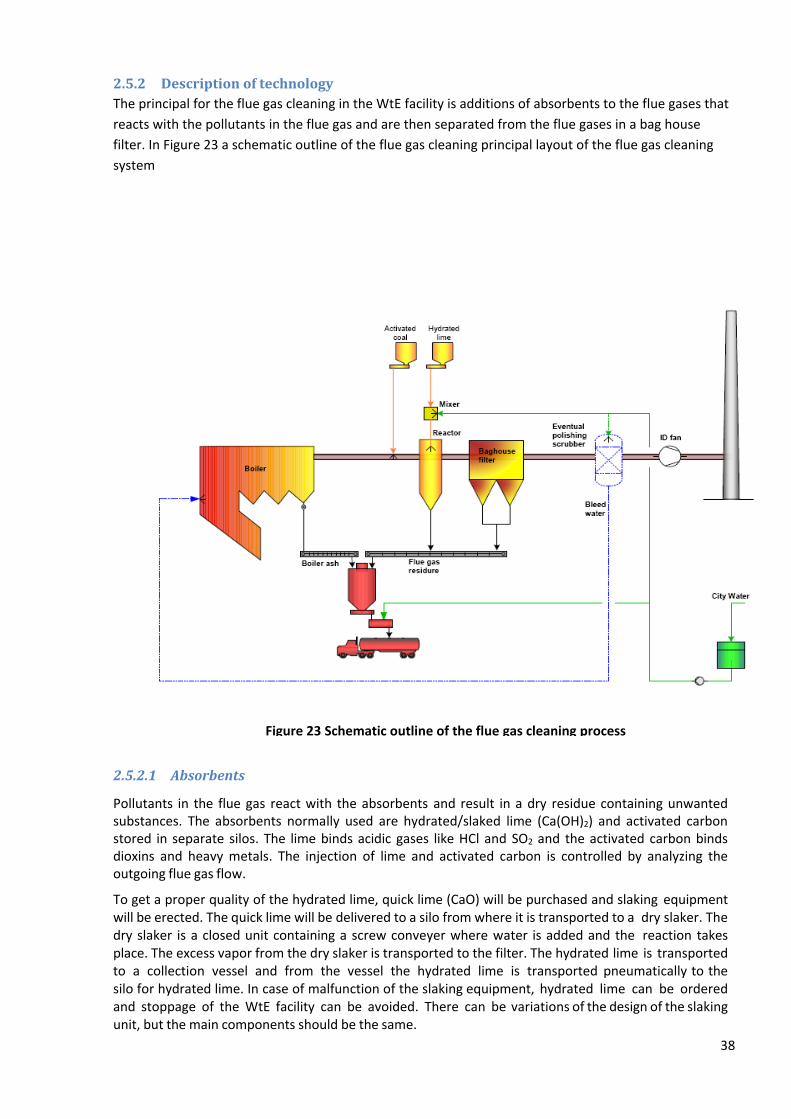
38
2.5.2 DescriptionoftechnologyThe principal for the flue gas cleaning in the WtE facility is additions of absorbents to the flue gases that
reacts with the pollutants in the flue gas and are then separated from the flue gases in a bag house
filter. In Figure 23 a schematic outline of the flue gas cleaning principal layout of the flue gas cleaning
system
2.5.2.1 Absorbents
Pollutants in the flue gas react with the absorbents and result in a dry residue containing unwanted substances. The absorbents normally used are hydrated/slaked lime (Ca(OH)2) and activated carbon stored in separate silos. The lime binds acidic gases like HCl and SO2 and the activated carbon binds dioxins and heavy metals. The injection of lime and activated carbon is controlled by analyzing the outgoing flue gas flow.
To get a proper quality of the hydrated lime, quick lime (CaO) will be purchased and slaking equipment will be erected. The quick lime will be delivered to a silo from where it is transported to a dry slaker. The dry slaker is a closed unit containing a screw conveyer where water is added and the reaction takes place. The excess vapor from the dry slaker is transported to the filter. The hydrated lime is transported to a collection vessel and from the vessel the hydrated lime is transported pneumatically to the silo for hydrated lime. In case of malfunction of the slaking equipment, hydrated lime can be ordered and stoppage of the WtE facility can be avoided. There can be variations of the design of the slaking unit, but the main components should be the same.
Figure 23 Schematic outline of the flue gas cleaning process

39
The absorbents are added in the flue gas duct before a reactor unit or direct into the reactor, prior to the bag house filter. The absorption and reaction is initiated directly. The absorbents are added in a dry state but water can be added in the reactor. An amount of the used absorbents are recirculated to the reactor or to the flue gas duct before the reactor to increase the utilization of the absorbents. The recirculated absorbents can be moisturized with water before it is added to the reactor. The water added either to the reactor or to the recirculated absorbents is used to increase the activity of the absorbents and the amount of water is adapted in order for the flue gases to dry the absorbents before they reach the filter; the residual product is therefore dry. After the reactor, the flue gases are led to the bag house filter.
2.5.2.2 Baghousefilter
In the bag house filter the final absorption and dust removal takes place. In Figure 24 an example of a bag house filter construction is shown. A bag house filter consists of one or more modules and each module consists of a number of filter bags. The number of filter bags in each module varies depending on the size of the module, but will be approximately 300. The filter bags are supported by filter supporting baskets.
In Figure 25 a filter bag with filter supporting basket is shown. The flue gas is led into the filter and through the filter bags and out through the filter outlet. The dust and absorbents will be captured on the filter walls and form a cake where the final separation of pollutants will take place. The formation of the filter cake is important to achieve effective reduction of pollutants in the flue gas. The filter bags are usually made of PI/PTFE on PTFE supporting fabrics and the filter supporting baskets are made of stainless steel. A high level of dust removal is essential in order to achieve low emissions of heavy metals.
Figure 24 Example of a bag house filter construction [12]

40
Figure 25 Filter bag with filter supporting basket [13]
The bag house filter is cleaned using compressed air; residuals are collected in filter hoppers and transported to the fly ash silo. The residues can, to a certain extent, be recirculated to increase the utilization of the absorbents.
When SNCR is used for removal of nitrogen (deNOx), the dust removed in the bag house filters contains large quantities of ammonia.
The used bag house filters will be recycled within the plant and incinerated in the boiler. The incineration of the bag house filters will not lead to increased emissions to air. There is no by‐pass possibility of the flue gas cleaning system. There are emission measuring instruments installed that continuously monitors the emissions. If the flue gas cleaning would be out of operation, the WtE facility will not and cannot from a technical perspective be operated
2.5.3 Reductionofnitrogenoxides(deNOx)
To reduce the amount of nitrogen oxides (NOx) in the flue gases there are two main techniques in question for Donetsk: primary measures and SNCR – Selective Non Catalytic Reduction. These techniques are described below. Ammonia (NH3) is used as the reduction component. If no deNOx
methods where installed, the content of nitrogen oxides in the flue gas is approximately 400 mg/Nm3
at 11% O2 dry gas (EU requirement is 200 mg/Nm3).
2.5.3.1 Primarymeasures
The nitrogen oxides are formed in the incineration zone in the boiler, part of it is formed from nitrogen in the fuel and part of it from nitrogen in the combustion air. Favorable conditions for NOx
formation are high oxygen concentration, high temperature and a long residence time. In a first step, various primary measures can be taken to make sure that incineration conditions do not favor NOx
formation. In practice, this is done through:
Progressive air administration
Operation optimization, such as process control and reduced excess air
Optimization of furnace design and design of air administration
With proper primary measures or combustion‐technical measures, the NOx contents can be reduced to approximately 300 mg/Nm3 at 11% O2. Even if the NOx emissions can be reduced further by pushing the limits of the primary measures, this can result in increased levels of CO.
2.5.3.2 SNCR
Reduction of nitrogen oxides implies transformation into nitrogen gas and water. When reducing NOx in the flue gases with SNCR, Selective Non Catalytic Reduction, the reduction is achieved thermally by injection of a reducing agent, usually ammonia in water, into the furnace where the flue gases have a temperature between 850 and 1000°C. At this temperature, the reaction is spontaneous and the nitrogen oxides are transformed into nitrogen and water.
The reduction of NOx takes place by the following reactions:

41
4 NO + 4 NH3 + O2 4 N2 + 6 H2O
2 NO2 + 4 NH3 + O2 3 N2 + 6 H2O
In order to achieve adequate NOx reduction, ammonia is added in an excess. The larger part of this excess is decomposed in the boiler but some of the ammonia passes through the system and exits the boiler with the flue gas. This ammonia, called slip, has to be limited for environmental as well as technical reasons. A part of the slip will end up in the dust in the bag house filters. This ammonia will evaporate if the dust is moistened which can lead to work environment problems meaning that respiratory protective equipment can be needed for the nearby personnel. Very high amounts of ammonia in the flue gases may cause clogging of the bag house filter.
An SNCR system is relatively simple and has rather low investment costs. On the other hand, it requires a large surplus of ammonia for an effective reduction, which increases the operating costs. An SNCR system integrates combustion and NOx reduction, which means if the combustion conditions changes, the SNCR system has to adjust in a proper way to keep up the NOx reduction and prevent the slip from increasing.
Using SNCR, the NOx emissions can be reduced to less than 100 mg/Nm3.
2.5.4 Fluegasfan
A flue gas fan will be installed after the flue gas cleaning process. The flue gas fan transports the flue gases from the boiler, trough the flue gas cleaning system and out through the stack and also keeps an underpressure in the furnace. The flue gas fan is driven by a frequency controlled motor. The flue gas fan shall be equipped with a silencer to reduce the noise emissions. Figure 26 below shows a picture of two flue gas fans.
Figure 26 Example of flue gas fans [4]
2.5.5 Stackpipe
The flue gases are led to the atmosphere trough a stack pipe. The material in the stack can be carbon steel with a protective coating. The stack pipe is equipped with necessary pipe sockets and connection for a gauging station is erected nearby the stack. The stack will have a height of 70 meters and an inner diameter of 2.0 meters. At the outlet of the stack, the flue gas will have a temperature of
130°C, the flue gas flow will be around 51.3 m3/h and the flue gas velocity will be approximately 16.3 m/s.
If a polishing step is installed after the bag house filter, the stack pipe has to be made of FRP. This is because the flue gas temperature will decrease in the polishing step, and this will increase the risk for the water in the flue gas to condensate in the stack and this can cause corrosion in a carbon steel stack

42
pipe.
2.5.6 Equipmentformeasurementofemissions
2.5.6.1 GeneralThe WtE facility will only cause emissions to air since no waste water is produced in the flue gas
cleaning process. Emissions to air from waste incineration facilities are regulated in the Waste
Incineration Directive 2000/76/EC. The directive also requires installation of measurement systems to
monitor the parameters and relevant emission limits. The sampling and measurement procedures to be
used are listed in the environmental permit issued by the authorities
Sampling and analysis of all pollutants are carried out as given by CEN‐standards. Likewise, calibration of the continuous measurement system will be performed with reference methods according to CEN‐standards at least every three years.
2.5.6.2 Measurementofemissions
The WtE facility will be designed according to the Waste Incineration Directive. The following measurements of air pollutants shall be performed:
Continuous measurements of the following substances: Nitrogen oxides (NOx), carbon monoxide (CO), total dust content, total organic carbon (TOC), hydrogen chloride (HCl), hydrogen fluoride (HF), sulphur dioxide (SO2)
Continuous measurements of the following operating parameters: Temperature near the incineration chamber’s inner wall or other representative point in the incineration chamber after approval by competent authority, and oxygen content, pressure, temperature and water vapor content of the flue gases
At least two annual measurements of heavy metals, dioxins and furans, although during the first twelve months of operation, these measurements have to be performed at least once every third months
The residence time, minimum temperature and oxygen level of the flue gases shall be controlled adequately at least once in connection to when the incineration facility is taken into service as well as under the least favorable operating conditions predictable.
Continuous measurement of hydrogen fluoride (HF) is not necessary if a treatment step for HF is used which guarantees that the emission limit for the substance is not exceeded.
There may be additional regulations or stricter limits in the permit issued by the local authorities.
2.5.6.3 Equipment
Measurement of emissions to air is fully automatic. The measurements are best done in the stack or in connection with the stack by means of a multipurpose instrument measuring several different substances one at a time; hence the measurement is not completely continuous. There is also a supplementary instrument for measurement of carbon monoxide and oxygen. The measurement equipment should be placed in a well‐protected space.
To enable control of the flue gas cleaning system and of the fuel, measurement of some components in the raw flue gas, before entering the flue gas cleaning process, is usually made. It is common to measure e.g. oxygen content (O2), carbon monoxide (CO), nitrogen oxides (NOx), hydrochloric acid (HCl), sulfur dioxide (SO2) and moisture content.
An instrument for measuring dust and moisture content in the flue gas is often placed directly after the bag house filter to enable immediate detection of ruptures in the filter. Measured data is registered and transferred to the central control room
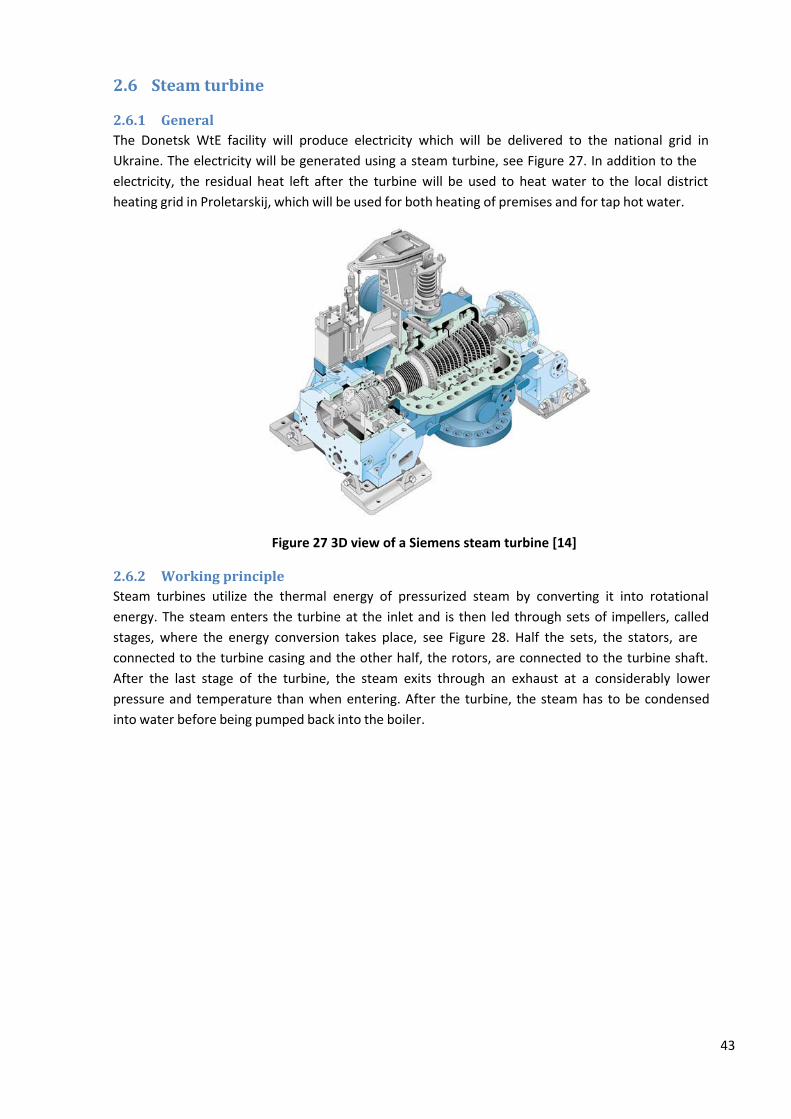
43
2.6 Steamturbine
2.6.1 GeneralThe Donetsk WtE facility will produce electricity which will be delivered to the national grid in
Ukraine. The electricity will be generated using a steam turbine, see Figure 27. In addition to the
electricity, the residual heat left after the turbine will be used to heat water to the local district
heating grid in Proletarskij, which will be used for both heating of premises and for tap hot water.
Figure 27 3D view of a Siemens steam turbine [14]
2.6.2 WorkingprincipleSteam turbines utilize the thermal energy of pressurized steam by converting it into rotational
energy. The steam enters the turbine at the inlet and is then led through sets of impellers, called
stages, where the energy conversion takes place, see Figure 28. Half the sets, the stators, are
connected to the turbine casing and the other half, the rotors, are connected to the turbine shaft.
After the last stage of the turbine, the steam exits through an exhaust at a considerably lower
pressure and temperature than when entering. After the turbine, the steam has to be condensed
into water before being pumped back into the boiler.

44
Figure 28 Cross section of a reaction steam turbine [15]
2.6.2.1 Turbinecasing
The turbine outer casing encloses the internal parts of the turbine and consists of three basic modules; an inlet, transition and exhaust module. The casing is horizontally split and each module comprises an upper and a lower half. When all the modules are together the entire casing has a common horizontal joint. The upper and the lower halves are flanged together vertically.
2.6.2.2 Inletarrangement
The high pressure steam is transferred to the turbine via an inlet pipe. In the inlet, a stop valve is installed which is opened hydraulically and closed by spring force when necessary, for example in case of a boiler trip. During normal operation the stop valve is fully opened. After the stop valve, the steam will pass one or more control valves which regulate the inlet flow of steam. The control valves may be fully or partially closed during operation depending on the number and size of the valves.
2.6.2.3 TurbinerotorThe moving part of the turbine is called a rotor and consists of a shaft with blades attached. The
blades react to the flow of high pressure steam, begin to move and impart rotational energy to the
shaft, which is made of forged alloy steel. The cylindrical moving blades have T‐roots and integral
shrouds. A locking blade installed in each blade ring sustains the symmetry of the blade spacing. The
locking blade is secured in the shaft.
2.6.2.4 Turbinebearings
The turbine is mounted with both front and rear bearings. The bearing casing is nailed to the baseframe. At the inlet of the turbine there are both journal and thrust bearings. The journal bearing is connected to the bearing housing while the thrust bearing is mounted to a carrier that can move axially. At the exhaust of the turbine there is only a journal bearing.
2.6.2.5 Turbineexhaust
The steam exits at the low pressure end of the turbine through an exhaust pipe and is condensed in a

45
cold condenser. Most turbines have radial exhausts, but axial exhausts exist as well.
2.6.2.6 Baseframe
The turbine is fixed to a steel baseframe, aligned on the concrete foundation at the facility. The gearbox and most of the auxiliary equipment is normally mounted to the baseframe as well, although some equipment is normally installed below or to the side of the baseframe, such as the oil system.
2.6.3 Designparameters
The Donetsk WtE facility steam turbine will have the principal design as described in the text below. Also, see Figure 29.
Figure 29 Principal design of Donetsk WtE steam turbine
2.6.3.1 Steamtemperatureandpressure
The Donetsk WtE facility will be optimized for maximum electricity and heat production. Therefore, the steam pressure and temperature will be maximized as far as possible in the waste incineration facility without the need for external superheating in hybrid processes or the need for recurring replacements of superheater bundles at short intervals.
This means that the boiler will produce steam that enters the turbine at 425°C and 60 bars with a margin for normal variations in pressure and temperature. Data for inlet (live) steam is shown in Table 8.
Table 8 Data of live steam to the turbine
Parameter Unit Min value Rated value Normal variation Design
Steam inlet pressure bar 50 60 3 72
Steam temperature C 360 425 8 453
Steam flow kg/s ‐ 39.5 2 43.9
2.6.3.2 Turbinesize
The size of the Donetsk WtE facility is based on the available amount of waste fuels in the Donetsk region. With an available amount of 470 000 annual tons, this gives a boiler size of 100 MWth which will
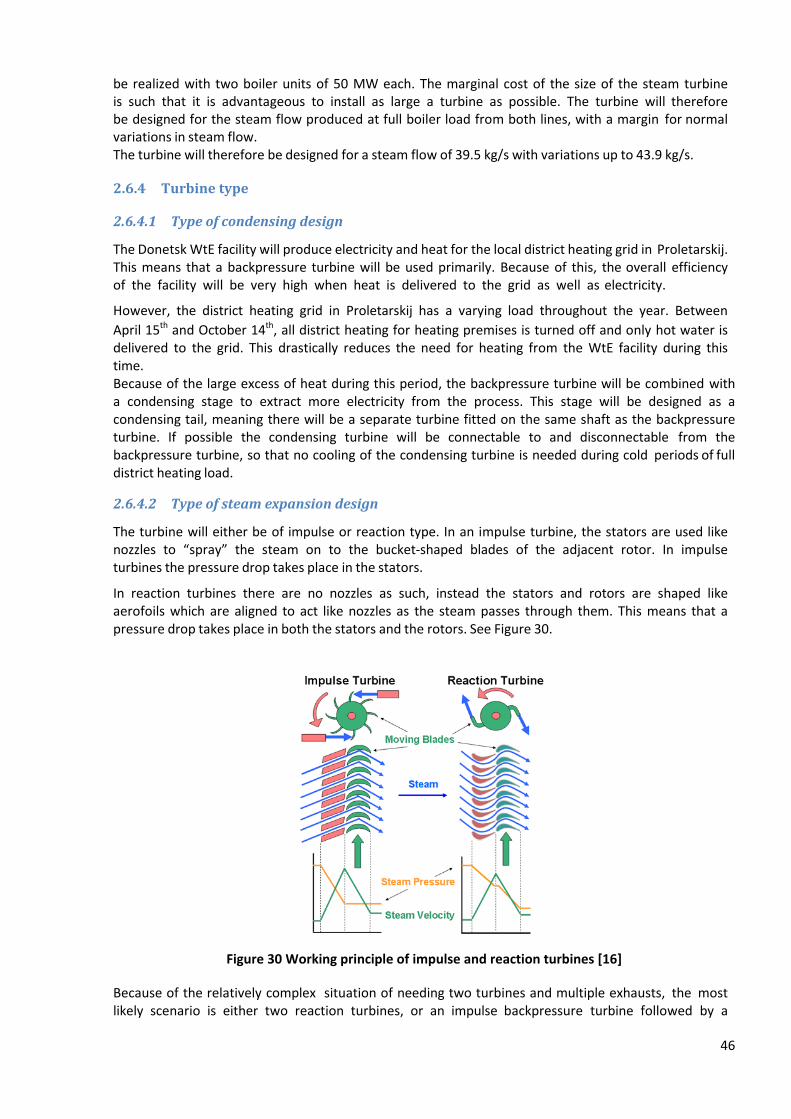
46
be realized with two boiler units of 50 MW each. The marginal cost of the size of the steam turbine is such that it is advantageous to install as large a turbine as possible. The turbine will therefore be designed for the steam flow produced at full boiler load from both lines, with a margin for normal variations in steam flow. The turbine will therefore be designed for a steam flow of 39.5 kg/s with variations up to 43.9 kg/s.
2.6.4 Turbinetype
2.6.4.1 Typeofcondensingdesign
The Donetsk WtE facility will produce electricity and heat for the local district heating grid in Proletarskij. This means that a backpressure turbine will be used primarily. Because of this, the overall efficiency of the facility will be very high when heat is delivered to the grid as well as electricity.
However, the district heating grid in Proletarskij has a varying load throughout the year. Between
April 15th and October 14th, all district heating for heating premises is turned off and only hot water is delivered to the grid. This drastically reduces the need for heating from the WtE facility during this time. Because of the large excess of heat during this period, the backpressure turbine will be combined with a condensing stage to extract more electricity from the process. This stage will be designed as a condensing tail, meaning there will be a separate turbine fitted on the same shaft as the backpressure turbine. If possible the condensing turbine will be connectable to and disconnectable from the backpressure turbine, so that no cooling of the condensing turbine is needed during cold periods of full district heating load.
2.6.4.2 Typeofsteamexpansiondesign
The turbine will either be of impulse or reaction type. In an impulse turbine, the stators are used like nozzles to “spray” the steam on to the bucket‐shaped blades of the adjacent rotor. In impulse turbines the pressure drop takes place in the stators.
In reaction turbines there are no nozzles as such, instead the stators and rotors are shaped like aerofoils which are aligned to act like nozzles as the steam passes through them. This means that a pressure drop takes place in both the stators and the rotors. See Figure 30.
Figure 30 Working principle of impulse and reaction turbines [16]
Because of the relatively complex situation of needing two turbines and multiple exhausts, the most likely scenario is either two reaction turbines, or an impulse backpressure turbine followed by a
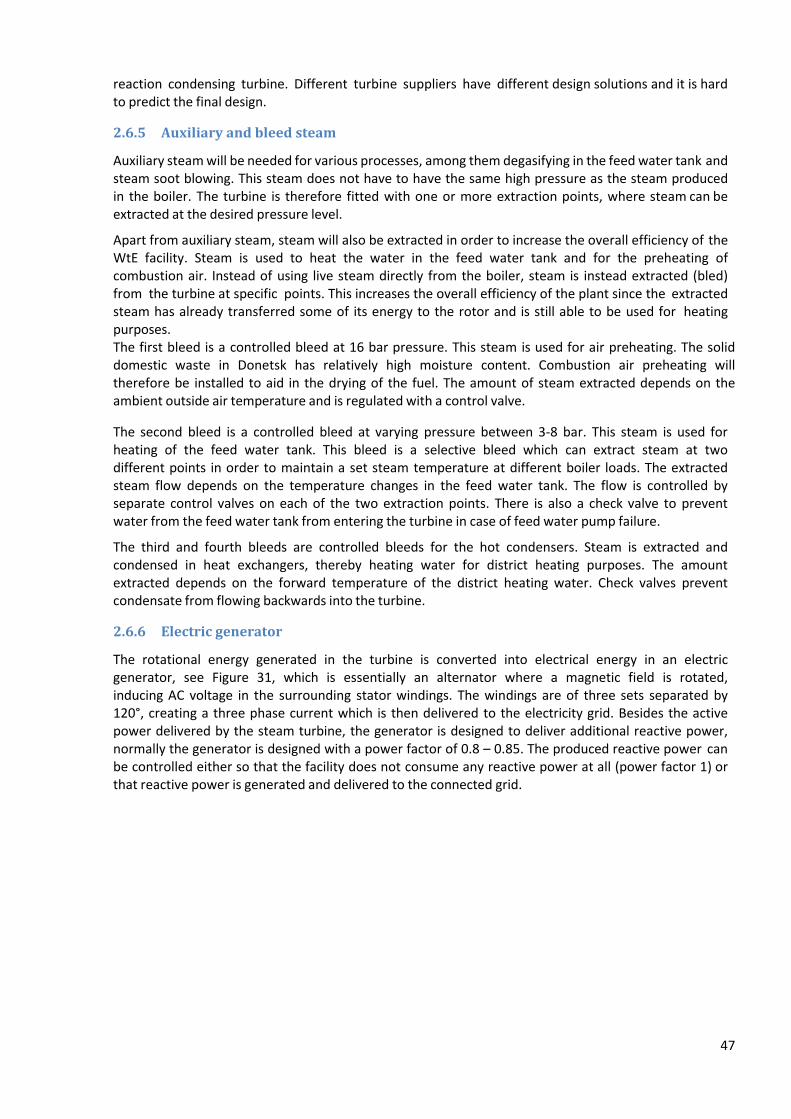
47
reaction condensing turbine. Different turbine suppliers have different design solutions and it is hard to predict the final design.
2.6.5 Auxiliaryandbleedsteam
Auxiliary steam will be needed for various processes, among them degasifying in the feed water tank and steam soot blowing. This steam does not have to have the same high pressure as the steam produced in the boiler. The turbine is therefore fitted with one or more extraction points, where steam can be extracted at the desired pressure level.
Apart from auxiliary steam, steam will also be extracted in order to increase the overall efficiency of the WtE facility. Steam is used to heat the water in the feed water tank and for the preheating of combustion air. Instead of using live steam directly from the boiler, steam is instead extracted (bled) from the turbine at specific points. This increases the overall efficiency of the plant since the extracted steam has already transferred some of its energy to the rotor and is still able to be used for heating purposes. The first bleed is a controlled bleed at 16 bar pressure. This steam is used for air preheating. The solid domestic waste in Donetsk has relatively high moisture content. Combustion air preheating will therefore be installed to aid in the drying of the fuel. The amount of steam extracted depends on the ambient outside air temperature and is regulated with a control valve.
The second bleed is a controlled bleed at varying pressure between 3‐8 bar. This steam is used for heating of the feed water tank. This bleed is a selective bleed which can extract steam at two different points in order to maintain a set steam temperature at different boiler loads. The extracted steam flow depends on the temperature changes in the feed water tank. The flow is controlled by separate control valves on each of the two extraction points. There is also a check valve to prevent water from the feed water tank from entering the turbine in case of feed water pump failure.
The third and fourth bleeds are controlled bleeds for the hot condensers. Steam is extracted and condensed in heat exchangers, thereby heating water for district heating purposes. The amount extracted depends on the forward temperature of the district heating water. Check valves prevent condensate from flowing backwards into the turbine.
2.6.6 Electricgenerator
The rotational energy generated in the turbine is converted into electrical energy in an electric generator, see Figure 31, which is essentially an alternator where a magnetic field is rotated, inducing AC voltage in the surrounding stator windings. The windings are of three sets separated by 120°, creating a three phase current which is then delivered to the electricity grid. Besides the active power delivered by the steam turbine, the generator is designed to deliver additional reactive power, normally the generator is designed with a power factor of 0.8 – 0.85. The produced reactive power can be controlled either so that the facility does not consume any reactive power at all (power factor 1) or that reactive power is generated and delivered to the connected grid.

48
Figure 31 Synchronous generator from Alstom. The stator windings (orange) surround the rotor
magnet (metallic blue) [17]
Some of the rotational energy is converted into heat in the generator, which means that the generator has to be equipped with an air‐water cooling system.
2.6.7 Turbinegear
The rotational speed of the generator has to be adjusted to generate electricity at the same frequency as that of the power grid. Often, but not always, the turbine rotates at a much higher speed than the generator. To be able to transmit power from the turbine to the generator, a speed‐ reducing gearbox is then required.
2.6.8 Auxiliarysystems
Apart from the turbine, gear and generator, normally referred to as the T/G set, there are a number of auxiliary systems needed for proper operation of the turbine.
2.6.8.1 Oilsystem
A lubrication and control oil system will be installed next to the turbine. Lubrication must be present at all times to prevent serious damage to the turbine or to the generator. Therefore, all components in the oil system, oil pumps, oil filters, oil coolers etc., will have 100% redundancy to ensure operation even if one component breaks down. The main oil pump is mechanically driven by the turbine shaft, while auxiliary and emergency pumps have electrical motors for operation. The emergency pump is normally driven by a DC motor which is powered by a backup diesel engine or the UPS, to minimize the risk of damage in case of a power surge.
An oil cooler is used to control the temperature of the oil. After cooling, the oil is transferred to a filter unit. There is also an oil pressure control valve that controls the oil pressure in the supply pipe.
2.6.8.2 Turbinecondensers
The backpressure turbine will be fitted with turbine condensers. The exhaust steam from the turbine will enter the condensers where the heat is transferred from the steam to the district heating water; the condensers are essentially shell and tube heat exchangers (see Figure 32). The backpressure in the turbine will be controlled by the discharge temperature that the condensers shall deliver to the district heating grid. The higher the discharge temperature, the higher the temperature (and thus backpressure) is after the turbine.

49
Figure 32 Principal design of a shell and tube heat exchanger [18]
The turbine will possibly be fitted with two turbine condensers in series (on the district heating side) in order to increase heat and electricity output of the facility. However, during winter periods the district heating load will be so large that the existing gas boilers in Donetsk will be needed for peak loading. Since the WtE facility will be connected to the return side of the district heating grid, the WtE facility can maintain a rather low discharge temperature even during winter periods, because the gas boilers will always supply additional heating and ensuring that the temperatures at the consumer side will be sufficient. Therefore, the temperature difference over the turbine condensers in the WtE facility will be relatively low. This means that two turbine condensers might not be economically and technologically feasible. With the added need of a cold condenser, the need for two turbine condensers for district heating is even more doubtful. It will depend on the final investment costs for the extra turbine and how much extra heat it will deliver.
In backpressure turbines with district heating the condenser is a heat exchanger, normally of shell and tube type, which transfers heat from the steam to the district heating grid, while at the same time condensing the steam from the turbine using the returning water from the district heating grid. The backpressure is normally controlled by setting a specific discharge temperature that the heat exchanger shall deliver to the district heating grid. The higher the discharge temperature, the higher the temperature (and thus backpressure) after the turbine, which means lower electricity generation. Installing two turbine condensers in series increases the heating and electricity output of the turbine, but the temperature difference over the district heating side of the condenser has to be large or the added cost of the second condenser will normally not pay off.
2.6.8.3 Aircooledsteamcondensing
The heat supply to external users in the district heating net is varying throughout the year. During summer season all district heating for heating premises is turned off and only hot water is delivered to the grid. This drastically reduces the need for heating from the WtE facility and the excess heat is instead cooled off in a cold condenser.
The cold steam is cooled to condensate with an air cooled condenser which is based on direct cooling with ambient air and without any intermediate cooling water circuit. The air cooled condenser performs condensation of exhaust steam from the turbine and bypass valves as well as releasing incondensable gases, such as air. The steam is condensed inside of the condenser tubes which are
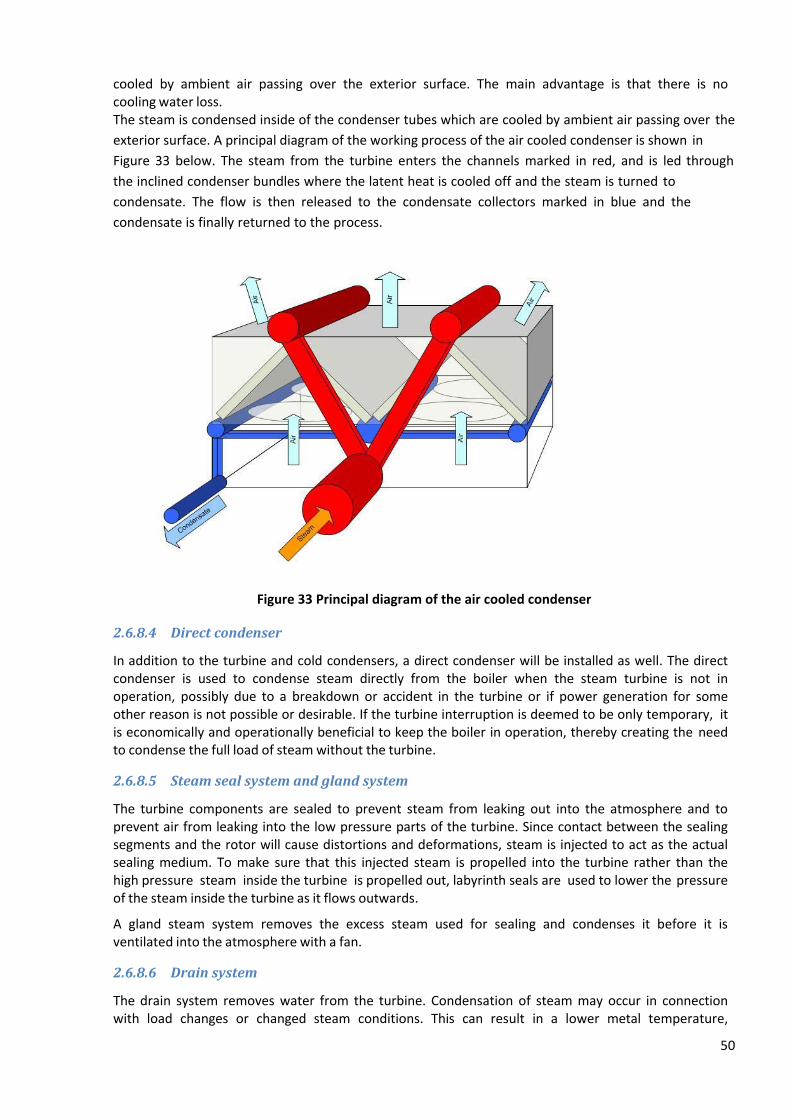
50
cooled by ambient air passing over the exterior surface. The main advantage is that there is no cooling water loss. The steam is condensed inside of the condenser tubes which are cooled by ambient air passing over the
exterior surface. A principal diagram of the working process of the air cooled condenser is shown in
Figure 33 below. The steam from the turbine enters the channels marked in red, and is led through
the inclined condenser bundles where the latent heat is cooled off and the steam is turned to
condensate. The flow is then released to the condensate collectors marked in blue and the
condensate is finally returned to the process.
Figure 33 Principal diagram of the air cooled condenser
2.6.8.4 Directcondenser
In addition to the turbine and cold condensers, a direct condenser will be installed as well. The direct condenser is used to condense steam directly from the boiler when the steam turbine is not in operation, possibly due to a breakdown or accident in the turbine or if power generation for some other reason is not possible or desirable. If the turbine interruption is deemed to be only temporary, it is economically and operationally beneficial to keep the boiler in operation, thereby creating the need to condense the full load of steam without the turbine.
2.6.8.5 Steamsealsystemandglandsystem
The turbine components are sealed to prevent steam from leaking out into the atmosphere and to prevent air from leaking into the low pressure parts of the turbine. Since contact between the sealing segments and the rotor will cause distortions and deformations, steam is injected to act as the actual sealing medium. To make sure that this injected steam is propelled into the turbine rather than the high pressure steam inside the turbine is propelled out, labyrinth seals are used to lower the pressure of the steam inside the turbine as it flows outwards.
A gland steam system removes the excess steam used for sealing and condenses it before it is ventilated into the atmosphere with a fan.
2.6.8.6 Drainsystem
The drain system removes water from the turbine. Condensation of steam may occur in connection with load changes or changed steam conditions. This can result in a lower metal temperature,

51
compared to the steam temperature, resulting in condensation of the steam. Formation of condensate occurs, for example, during start‐up of the turbine, when the hot steam comes into contact with the colder metals. This is most common during cold starts but may also take place during warm starts, hot starts or during shutdowns.
2.7 Auxiliarysystems
2.7.1 Internaldistrictheating
The internal district heating system transfers produced heat from the WtE facility to the interconnection pipe and the external users. The grate boiler delivers high pressure steam to a steam turbine producing electricity and expanding steam to a pressure determined by the temperature of the district heating return pipe. The turbine exhaust steam is condensed in the two turbine condensers heating the district heating water. The condensate is returned to the feed water tank.
The district heating water return pipe is pressurized by the static pressure of the expansion tank. The pressure holding is achieved by auxiliary steam. Make up water from the process water distribution system is added with a pressurizing pump parallel to the expansion tank. Before entering the turbine condensers, the district heating water is pressurized by the return pumps creating a flow through the whole system.
The district heating water collects heat from the two turbine condensers. If the steam turbine for some reason has a stand still, the turbine can by bypassed and instead heat in the live steam is transferred in the direct condenser to the district heating system. The high pressure live steam is reduced by a pressure and temperature reducing valve. Even when the direct condenser is not in operation, the district heating water is constantly running through. The condensate is returned to the feed water tank.
After the direct condenser a side stream is taken out for cooling of common dump lines, such as blow down water from the boiler and gland steam from the turbine glands and also for cooling of the conveying system for ash. The side stream is mixed back into the main district heating water flow upstream of the steam condensers. Furthermore, a side stream is taken out to transfer heat to buildings and this stream is mixed back to the district heating return pipe downstream of the expansion tank.
During summer season, steam excess heat is cooled off in the air cooled condenser.
The temperature of the district heating feed water is controlled by varying the district heating flow with the frequency controlled district heating pumps. During operation of the district heating system only one district heating pump is running, the other is in standby mode and is started automatically when the operating pump is not available anymore (100% redundancy).
The dimension of the internal district heating system main pipe is DN600. The design pressure is 16 bar at 130°C. The district heating water flow is normally 2 200 m3/h at a heat load of 70 MW. Data for district heating system is presented in Table 9.
The expansion and movements of the pipes are designed for earthquake risks at scale 5 in accordance with MSK‐64 scale (DBN.B.1.1‐12:2006 “Construction in seismic regions of Ukraine” seismic activity in Donetsk). This means an average peak velocity of 2‐5 cm/s and an average peak acceleration of 0.03 g ‐ 0.04 g m/s2.
Table 9 Data for internal district heating system.
Parameter Unit Min Normal Max Design
District heating temperature before the Works C 35 45 – 55 70 130
District heating pressure before the Works bar(g) 4 13 15 16
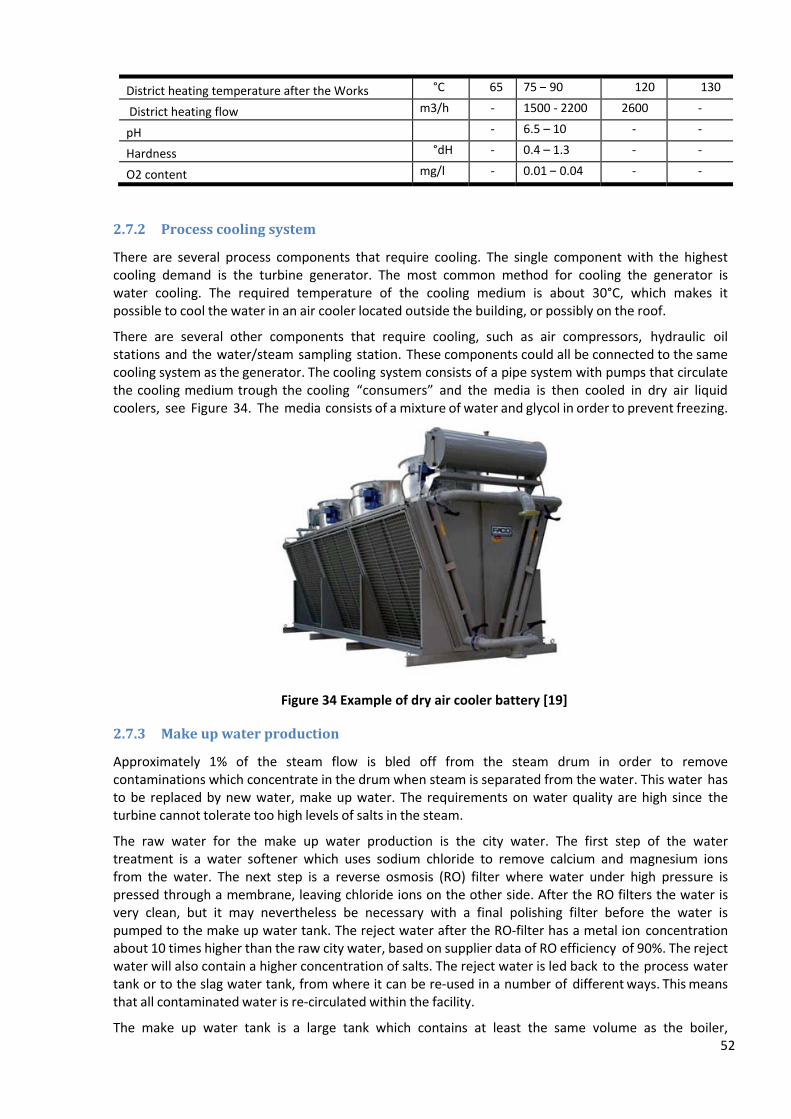
52
District heating temperature after the Works °C 65 75 – 90 120 130
District heating flow m3/h ‐ 1500 ‐ 2200 2600 ‐
pH ‐ 6.5 – 10 ‐ ‐
Hardness °dH ‐ 0.4 – 1.3 ‐ ‐
O2 content mg/l ‐ 0.01 – 0.04 ‐ ‐
2.7.2 Processcoolingsystem
There are several process components that require cooling. The single component with the highest cooling demand is the turbine generator. The most common method for cooling the generator is water cooling. The required temperature of the cooling medium is about 30°C, which makes it possible to cool the water in an air cooler located outside the building, or possibly on the roof.
There are several other components that require cooling, such as air compressors, hydraulic oil stations and the water/steam sampling station. These components could all be connected to the same cooling system as the generator. The cooling system consists of a pipe system with pumps that circulate the cooling medium trough the cooling “consumers” and the media is then cooled in dry air liquid coolers, see Figure 34. The media consists of a mixture of water and glycol in order to prevent freezing.
Figure 34 Example of dry air cooler battery [19]
2.7.3 Makeupwaterproduction
Approximately 1% of the steam flow is bled off from the steam drum in order to remove contaminations which concentrate in the drum when steam is separated from the water. This water has to be replaced by new water, make up water. The requirements on water quality are high since the turbine cannot tolerate too high levels of salts in the steam.
The raw water for the make up water production is the city water. The first step of the water treatment is a water softener which uses sodium chloride to remove calcium and magnesium ions from the water. The next step is a reverse osmosis (RO) filter where water under high pressure is pressed through a membrane, leaving chloride ions on the other side. After the RO filters the water is very clean, but it may nevertheless be necessary with a final polishing filter before the water is pumped to the make up water tank. The reject water after the RO‐filter has a metal ion concentration about 10 times higher than the raw city water, based on supplier data of RO efficiency of 90%. The reject water will also contain a higher concentration of salts. The reject water is led back to the process water tank or to the slag water tank, from where it can be re‐used in a number of different ways. This means that all contaminated water is re‐circulated within the facility.
The make up water tank is a large tank which contains at least the same volume as the boiler,

53
approximately 100 m3. All parts of the make up water production are redundant so that water production can be maintained at all times, also when some of the equipment is maintained. However, this type of equipment is generally not especially maintenance demanding. The need for chemicals will also be quite low; there is only a need for salt (sodium chloride) for the softening filters.
2.7.4 Ammoniasystem
Since the SNCR system uses ammonia, there will be an ammonia system with tank, pumps, etc. All parts of the ammonia system, including the tank, pump, pipes and valves, have to be made of stainless steel in order to prevent corrosion. The ammonia is preferably bought as a 25% ammonium solution. The volume of the ammonia storage tank will be approximately 70 m3.
Since ammonia could be a working environment hazard, all major components, i.e. the tank and the pumps, shall be located on the outside of the building. The tank shall be located in a retaining dike in case of a leak. As an alternative, the tank may be double jacketed.
The pumps will be located in a small shed next to the tank in order to protect them from rain, snow, etc. From these pumps, the ammonium solution will be pumped directly to the SNCR nozzles. There will also be a small tank for make up water connected to the ammonia system. A separate pump will fill the ammonia system with water before maintenance is performed on components in the ammonia system.
2.7.5 Compressedairsystem
The Donetsk WtE facility will have a system for distributing compressed air throughout the facility. The compressed air system is divided into instrument air and service air. Instrument air is primarily used for pneumatically operated valves. Larger air consumers, such as bag house filter cleaners or pneumatically operated hammers for soot cleaning use service air instead. Service air is also used for pneumatically operated hand tools such as drills, saws, air guns, grinders etc. The compressed air system consists of a central compressor station delivering compressed air in pipelines to different parts of the facility, see Figure 35. On each floor, there will be connection points for service and instrument air. The system may also include buffer tanks of compressed air to be used during periods of extra high demand for compressed air.
Figure 35 Example of compressed air tanks [4]
2.7.6 Watersystem
The city water is connected to the make‐up water production process, the process water tank and the offices in the facility. The city water can also be used in the flue gas cleaning process for flue gas temperature reduction. The idea is to only use city water when the water level in the different water systems is too low.
The normal consumption of city water is about 5 m3/h, with a maximum consumption 35 m3/h. The

54
normal process consumption is made up by the following:
make up water production of 1 m3/h (recycled within the WtE facility)
flue gas cleaning temperature reduction of 2 m3/h
slag slaking of 3 m3/h The slag slaking consumption is calculated from the hot slag heat release by water cooling. The water will be evaporated and the ash will be saturated to a water content of 2 weight‐%.
Spray water is used in the ash cleaning process of the boiler. Approximately spray water consumption will be 2 l/sec per unit (total for the facility 4 l/sec) and 2 m3/day per unit (total for the facility 4 m3/day).
The water system in the WtE facility is based on the principle that as much water as possible shall be recycled and re‐used in the internal processes. All internal reject water is led back to the process water tank or to the slag water tank, from where it can be re‐used in a number of different ways. This means that all contaminated water, for example, water from the RO filters, is re‐circulated within the facility.
The principal idea of the slag water tank is to make use of the contaminated water from the different processes in the facility; this to make sure that no contaminated water is sent to the sewage system. The slag water is used for slag slaking and the slag water tank mainly receives water from the facility’s floor drainage system. If the water level in the tank is too low, water from the process water tank can be used to fill it up. If the level is too high, it has to be emptied with a tank truck and the water has to be sent to an adequate facility, for example, a mixing station for stabilization of fly ash. About 20‐25% of the water used for slag slaking will bind to the slag and be transported out of the facility via the slag.
A tank below the waste bunker collects water that may enter the bunker with the waste. This water is transported to the slag water tank and re‐used for slag slaking.
The water led to the sewage is a mixture of blow down water and reject from the RO and softening filters. Cations are removed in the softening filter and anions in the RO filter. This means that the mixture of reject water and blow down water that goes to the sewage system has the same concentration of different elements as the city water itself, except for sodium chloride which is added in the softening filters. The chloride levels in the water led to the sewage system will normally be around 500 mg/l with single peaks in smaller volumes with a maximum concentration of about 2500 mg/l.
Smaller amounts of iron is added from the boilers to the blow down water. The maximum amount of iron will therefore be about 100 mg/l.
Table 10 below shows the quality of the city water in Donetsk. According to the reasoning in the text above, the water led to the sewage system will have the same quality as the city water led in to the WtE facility.
Table 10 City water quality
Parameter Unit Value
General data pH 7.69
Solids content mg/l
Total dissolved solids (TDS)
mg/l 602
Total organic carbon (TOC)
mg/l
Cation NH4 mg/l 0.11
K mg/l 6.64
Ca mg/l 92.99

55
Mg mg/l 28.53
Fe mg/l 0.11
Mn mg/l 0.0142
Na mg/l
Anions Cl mg/l 56.29
SO4 mg/l 164.33
NO3 mg/l 5.66
F mg/l 0.274
SiO2 mg/l
Other HCO3 mg/l
NaCl mg/l
2.7.7 Watersamplingstation
A system for sampling and analyzing the quality of water, condensate and steam shall be installed in the WtE facility, see Figure 36. The system takes samples at different locations in the facility, e.g. make up water, live steam, saturated steam, feed water etc. All samples shall be led to a sampling station where the different samples can be analyzed. Measurements shall be taken to determine conductivity, oxygen content, silica acid, sodium and pH‐value, among other parameters. Samples are taken and measurements are performed continuously and on‐line while the facility is in operation. All extractions of steam and hot water shall be cooled and pressure lowered so that the samples are safe for personnel to handle without risk of personal injury. All analyses are registered electronically and logged in a database for reference.
Figure 36 Example of water sampling station [4]
2.8 Electrificationofthefacility
The facility will be provided with equipment for distribution of low voltage 400 V and 690 V TN‐S direct earth systems. Electric motors and other loads bigger than approximately 11 kW will be fed with 690 V. Other smaller objects are fed with 400 V. The facility is connected to the external electrical power grid via a new 10.5/110 kV transformer and overhead power transmission line to an existing 110 kV switchgear and transformer station. The facility is supplied with 10.5 kV medium voltage switchgear. Feeding of the facility’s low voltage power is done with a number of transformers 10.5/0.69 kV and 10.5/0.4 kV. The objects fed from either switchgear are chosen to achieve best

56
possible redundancy in the facility.
All of the following equipment will be included in the facility in sufficient numbers for efficient operation:
HV/MV transformer
Switchgear MV/LV and transformers
Cubicles and MCC for the electrical consumers in the facility
Figure 37 Examples of transformer, MV and LV switchgear [4]
The equipment will be installed with at least one spare cassette, which can handle the highest power, for every physical size. For future possible expansion in the facility, there will also be sufficient (25%) unused space ready to be used without taking any part of the switchgear out of operation. Electric motors not intended to run at constant speed are speed regulated with the help of frequency
converters. High frequency currencies generated by these are eliminated with insulated bearings or with
the help of electrical filters. For the control and supervising of D.O.L. drives intelligent motor control
units are used. These units and the frequency converters communicate with the control system via
field bus
Figure 38 Example of large and small FC drives respectively [4]
The facility is provided with equipment for emergency power generation, in the form of an emergency diesel engine and a battery‐fed UPS system. Emergency power from the diesel engine will automatically power necessary process and civil equipment needed to safely stop the facility and other essential functions in case of power supply failure. The fuel tank is large enough for 36 hours of full load operation of the diesel engine.
The UPS system is used for power supply to the facility’s computer equipment, instruments and any other equipment which must not be disturbed by loss of power. All control and supervision equipment

57
which generates system alarms in case of power loss are power‐fed from the UPS system. The UPS system is dimensioned to feed all UPS‐connected equipment for 1‐2 hours without external power‐feed. The UPS itself is power‐fed by the emergency diesel.
2.9 Instrumentationandautomation
The facility is instrumented for full automatic operation with instruments adapted for the process requirements in the facility. Fieldbus communication is used for instrument connections. In cases where this is not applicable, the instruments can be connected with 4‐20 mA current loops (analog signals). For digital signals and controls, bus communication is also used for signal communication.
The facility is instrumented according to harmonized EN standards. The facility is instrumented to ensure that all operation of the complete facility including both boiler units can be remotely operated by personnel from a central control room. Although the control room should be manned continuously, a high degree of automation lets the control room personnel focus on other tasks such as crane operation, making rounds in the facility etc.
A flue gas analyzer is installed on outgoing flue gas duct, to the extent required in the waste incineration directive. Flue gas analysis is performed on flue gas taken just before the flue gas cleaning equipment for those parameters which are important for controlling the flue gas cleaning. Flue gas analysis before the flue gas cleaning system is also often the only means of acquiring information about the contents of chlorine and sulfur in the fuel.
The facility has a modern control system enabling fully automated operation of all equipment during operation, including as far as possible, start‐up and shut‐down sequences for the facility. The automation system is designed to warn for and handle any abnormal operation situation that may occur in the facility, without any risk of damaging equipment or personnel. In case of faults or other abnormal conditions in the facility that requires some action to put the facility back into a safe state, the control system is programmed to bring the facility back into a safe state without interventions from operators. The facility is equipped with a safety system according to the required extent in EN and IEC standards for water‐tube boilers and auxiliary installations. The safety system is designed according to SIL2. The heart of the computerized control system is centrally placed redundant computers and the signal collector in the facility is built with distributed I/O equipment and with one or more field buses. The buses and other critical equipment have redundancy to minimize the risk for downtime.
Locally placed control systems and controls are avoided as far as possible, in order to achieve a unified facility with easy troubleshooting, less maintenance and unified documentation. The control system is connected to a control network, to which also the operator stations are connected. The operator stations are windows‐based standard computers with two or more monitors. Equipment for registering alarms and events is included. Analogue values are logged and displayed with trend curves. Alarms, events and logged values are continuously and safely stored with back‐up. The operator stations include a report generator which can generate reports describing the operation in the facility with a time perspective ranging from an hour to at least a year. Connection and logging to the main computer network is possible.
All process equipment related to the facility is possible to control from the operator stations in the central control room. The facility is equipped with at least three operator stations. Equipment from different contractors and subcontractors are implemented in the control system with standardized presentation principles, making the look and feel the same independent of the equipment supplier. There is also at least one engineering station placed in the central control room.
The control system includes equipment for making backups of the entire software on persistent media, including set points and original set points.
Computer equipment for the reporting of collected environmental data is installed separately from the rest of the computer system.
The facility is also equipped with an ITV system with all necessary equipment from the TV cameras to the

58
TV monitors in the control room. The ITV‐system is based on a separate TCP/IP network.
2.9.1 Boilercontrolsystem
Normally, the WtE facility will be controlled by the district heating and electricity demand and it shall be possible to prioritize between district heating and electricity production. The boiler will be provided with the following limit controllers:
O2 control CO control Furnace temperature Steam pressure control (when turbine is not in operation) Super‐heater temperature control Live steam temperature control
2.9.2 Fluegascleaningcontrolsystem
Normally, the ID fan will be controlled by the furnace pressure. Each unit of the flue gas cleaning shall function together with the corresponding boiler and shall always keep an under pressure in the furnace of the boiler.
2.9.3 Turbinecontrolsystem
Normally, the turbine control will be governed by the boiler load and the following limit controllers are included:
Boiler pressure control Back pressure limitation Limitation of produced electrical power Control of steam flow extracted to turbine condensers to maintain required minimum
flow through the condensing tail. Manual and automatic electrical load control as a part of the total load control for
the combined power and heating plant with generator connected to the grid Manual and automatic rotation speed control without generator connected to the grid
2.10 Residuemanagement
The residues from the WtE facility consist of incombustibles such as slag, scrap iron and fly ash. Incombustibles of larger dimensions may occur in the fuel. These can be removed with the crane grab or be weeded out with a picking crane from the charging hopper. The in‐combustibles are then transported to recycling or deposition in a landfill.
2.10.1 Slag
Slag is what will be left on the grate after incineration, i.e. mainly incombustibles. The slag will be transported by the moving grate through the slag shaft to the slag bunker where it is slaked with water. According to EU regulations, the slag is normally classed as non‐hazardous waste and can be used as construction material e.g. as road constructions at landfill sites or similar, but if a user cannot be found the slag will be stored in landfill.
Based on figures provided by boiler manufacturers the guaranteed maximal value of the total amount of organic carbon in the slag, including grate siftings, will be lower then 3 weight‐% DM. The guaranteed maximal value of dioxins and furans will be 15 ng/kg TE.
2.10.2 Scrapiron
The scrap iron will be separated from the slag at the WtE facility with a magnetic separator. The scrap iron is stored separately and will be sent for recycling.

59
2.10.3 Flyash
The fly ash consists of particles going with the flue gases out from the furnace and further on through the boiler. Some of the fly ash will deposit in the boiler’s empty passes or in the horizontal pass, or it will pass the boiler into the flue gas cleaning. In the flue gas cleaning it will be separated from the flue gas in the bag house filter. The fly ash will, together with the residues from the bag house filter, be stored in a fly ash silo. The fly ash is classed as hazardous waste and has to be stored in a landfill in a secure way.
The following components in the WtE facility are estimated to contain fly ash (amount of fly ash in each component is stated for normal operation conditions):
Scraper conveyor below boiler super heater sections (one for each line), 5 kg of fly ash
Scraper conveyor below boiler economizer pass (one for each line), 5 kg of fly ash
Dust sender for boiler ash to residue silo (one for each line), 200 kg of fly ash
Dust sending pipes from boiler to residue silo (one for each line), normally 0 kg of fly ash
Bag house filter (one for each line), 10 tones of fly ash
Screw conveyor below bag house filter (one for each line), 5 kg of fly ash
Screw conveyor to mixer (one for each line), 5 kg of fly ash
Mixer unit (one for each line), 30 kg of fly ash
Dust sender below bag house filter (one for each line), 200 kg of fly ash
Dust sending pipes from bag house filter to residue silo (one for each line), normally 0 kg of fly ash
Reactor (one for each line), 100 kg of fly ash
Residue silo (common for both lines), up to 200 tons of fly ash
The residue silo is designed to be able to store fly ash at site for a couple of days. When the fly ash shall be transported from the site it is fed from the residue silo to bulk trucks in a dry state.
The fly ash is fed from the silo to bulk trucks in a dry state. The fly ash is then transported in closed trucks to the landfill where the fly ash is received in a mixing station. The fly ash is unloaded into a silo using pressurized air. In the mixing station the fly ash is mixed with cement or ash from coal facilities and water to produce stable concrete‐like material with stable and good leaching characteristics. The strength of the stabilized fly ash can reach up to the concrete strength class C32. Figure 39 below shows an example of a mixing station for fly ash treatment.
Figure 39 Example of mixing station for fly ash treatment [20]
In principal, the mixing station consists of the following parts:
Receiving station. Where the fly ash, cement and coal ash is received and sent to the storage silos. The transportation is made by using pressurized air.

60
Storage silos. The will be three silos of each around 250 m3. The three silos provides a possibility to store several ash fractions and cement separately.
Water tank or reservoir. Since rather large amount of water will be needed for the
stabilization process, a tank or reservoir of at least 100 m3 is needed to secure the supply of water. For the stabilization process, various quality of water can be used, i.e. rain water, city water, leachable water from the landfill or surplus waste water from the WtE Facility.
Mixer unit. In the mixer the fly ash is mixed with coal ash and water. The mixing is performed in batches, normally one batch could be made in less then one minute.
Discharge system. After mixing, the stabilized fly ash is discharged to ground level to a discharge area. The transport to the landfill is then made using a front loader.
Control and operation room. From the control room, the operation is controlled and monitored. In order to receive a good stable mixture, trained and experienced personnel is needed at the mixing station.
The mixing properties for a stable concrete are about 25% fly ash, 25% coal ash and 50% water depending on the quality and properties of the fly ash and the coal ash. The coal ash could also be replaced with cement.
At the mixing station there is continuous measuring and logging of hydrogen gas and ammonia gas. The ammonia in the fly ash is a result of the SNCR flue gas treatment where ammonia is added in to the boiler furnace in order to reduce the formation of NOx, some of the ammonia will be bound to particles and separated in the bag house filter. When combustion of waste containing aluminium takes place, oxides are formed which, in contact with water, form hydrogen gas. In order to reduce the concentrations of the ammonia and hydrogen a good ventilation of the mixing station and its components are important, also when the mixing station is out of operation. The fly ash deposit area should be surrounded by a geological barrier and a leachate water dam to collect the small amount of leachate water.
The deposit area should be prepared with a mineral sealing bottom layer with a thickness of more than 0.5 meter, consisting of i.e. clay. On top of the sealing layer a geo‐textile and a geo‐membrane are placed and further a gravel layer with drainage for leachate water. The stabilized ash is then deposited. A covering mineral sealing layer of 0.5 meter is then placed, followed by a geo‐membrane and a gravel layer. Finally the landfill is covered by a vegetation and cover layer with a thickness of 1 meter. In Figure 40 below the landfill structure with mineral sealing layers and coverage layers is shown.

61
Figure 40 Landfill structure with mineral sealing layers and coverage layers [20]
2.10.3.1 Chemicalcontent
In the database “Allaska” [21] information regarding chemical and technological characteristics of ashes from Swedish WtE facilities is gathered. The statistics are based on research conducted by “Värmeforsk”, a governmental founded research organization working in the energy production area.
In the database you can find the following information:
The fly ash from Swedish WtE facilities consists mainly, up to around 70% DS, of Al2O3, CaO, Cl and SiO2. The remaining part of the fly ash is to larger part composed of Fe2O3, K2O, MgO, Na2O, P2O5. Hg and heavy metals are to a small extent also found in the fly ash.
In Table 11 Chemical composition of fly ash below intervals for typical Swedish WtE facilities are given for the different components (however, the values are dependent on the chemical composition of the waste and very difficult to predict before the facility is taken into operation):
Table 11 Chemical composition of fly ash
Component Unit Interval
Al2O3 % DS 5‐15
CaO % DS 20‐30
Cl % DS 5‐20
Fe2O3 % DS 3‐8
K2O % DS 2‐8
MgO % DS 2‐4
Na2O % DS 2‐9
P2O5 % DS 1‐3

62
SiO2 % DS 15‐25
Hg mg/kg DS 3‐12
Heavy metals (Sb+As+Pb+Cr+Co+Cu+Ni) mg/kg DS 6000‐15000
2.11 Interconnectionpoints
The WtE facility will be connected to the following infrastructure systems:
Roads
District heating
Electricity
Natural gas
City water
Sewage
Telecom
2.11.1 Roads
New roads have to be built and connected to the existing road network. A connecting road to the existing main road, H‐20, will be built with four separate connections. In Table 12 below data for the new roads is shown.
Table 12 Data for the new roads
Parameter Unit Value
Two‐lane sections m 7.0
Width m 0.5
Hard shoulders on each side Total width m 8.0
One‐lane entry‐ and exit ramps
Width m 4.0
Hard shoulders on each side Total width m 1.0
Total width m 6.0
Figure 41 below shows a layout of the new roads with connection points to the existing road network.
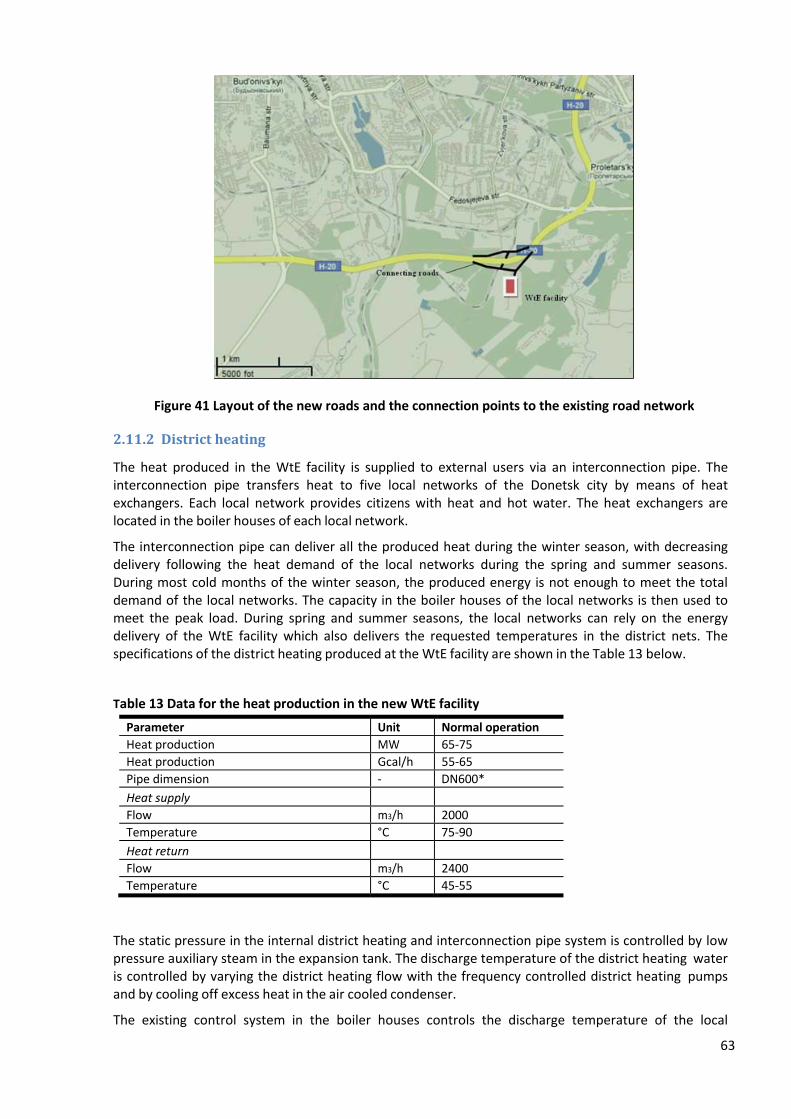
63
Figure 41 Layout of the new roads and the connection points to the existing road network
2.11.2 Districtheating
The heat produced in the WtE facility is supplied to external users via an interconnection pipe. The interconnection pipe transfers heat to five local networks of the Donetsk city by means of heat exchangers. Each local network provides citizens with heat and hot water. The heat exchangers are located in the boiler houses of each local network.
The interconnection pipe can deliver all the produced heat during the winter season, with decreasing delivery following the heat demand of the local networks during the spring and summer seasons. During most cold months of the winter season, the produced energy is not enough to meet the total demand of the local networks. The capacity in the boiler houses of the local networks is then used to meet the peak load. During spring and summer seasons, the local networks can rely on the energy delivery of the WtE facility which also delivers the requested temperatures in the district nets. The specifications of the district heating produced at the WtE facility are shown in the Table 13 below.
Table 13 Data for the heat production in the new WtE facility
Parameter Unit Normal operation
Heat production MW 65‐75
Heat production Gcal/h 55‐65
Pipe dimension ‐ DN600*
Heat supply Flow m3/h 2000
Temperature °C 75‐90
Heat return Flow m3/h 2400
Temperature °C 45‐55
The static pressure in the internal district heating and interconnection pipe system is controlled by low pressure auxiliary steam in the expansion tank. The discharge temperature of the district heating water is controlled by varying the district heating flow with the frequency controlled district heating pumps and by cooling off excess heat in the air cooled condenser.
The existing control system in the boiler houses controls the discharge temperature of the local
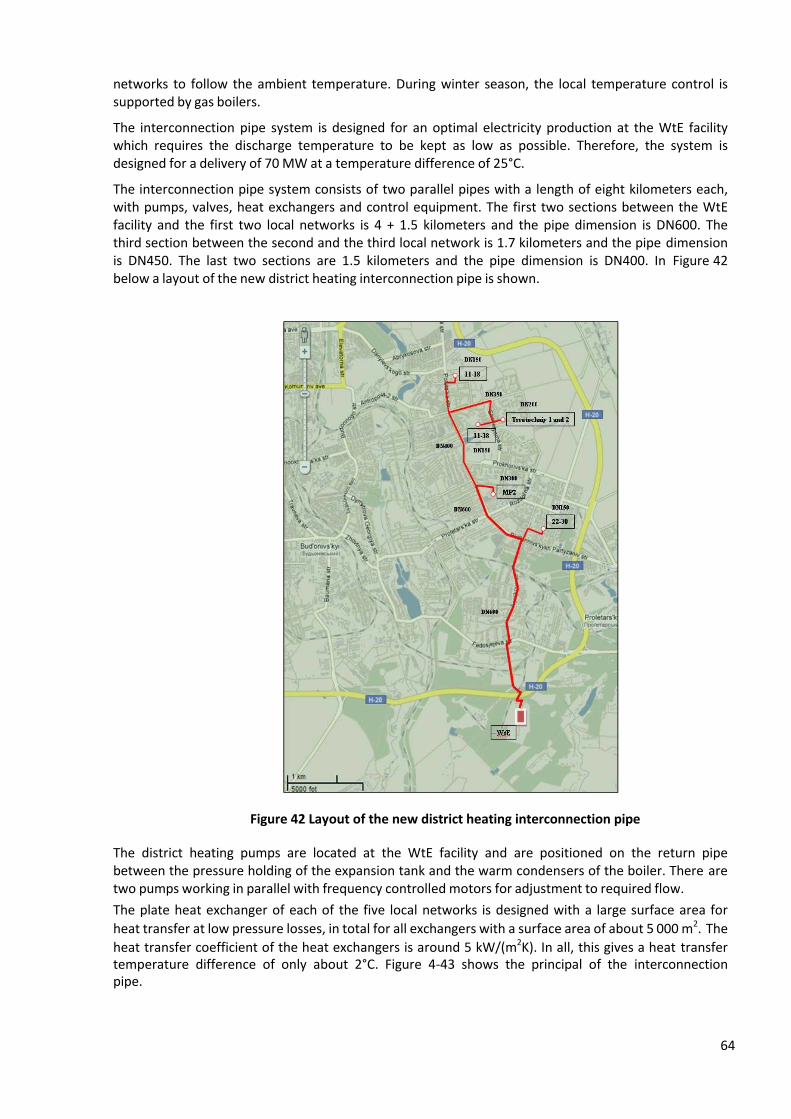
64
networks to follow the ambient temperature. During winter season, the local temperature control is supported by gas boilers.
The interconnection pipe system is designed for an optimal electricity production at the WtE facility which requires the discharge temperature to be kept as low as possible. Therefore, the system is designed for a delivery of 70 MW at a temperature difference of 25°C.
The interconnection pipe system consists of two parallel pipes with a length of eight kilometers each, with pumps, valves, heat exchangers and control equipment. The first two sections between the WtE facility and the first two local networks is 4 + 1.5 kilometers and the pipe dimension is DN600. The third section between the second and the third local network is 1.7 kilometers and the pipe dimension is DN450. The last two sections are 1.5 kilometers and the pipe dimension is DN400. In Figure 42 below a layout of the new district heating interconnection pipe is shown.
Figure 42 Layout of the new district heating interconnection pipe
The district heating pumps are located at the WtE facility and are positioned on the return pipe between the pressure holding of the expansion tank and the warm condensers of the boiler. There are two pumps working in parallel with frequency controlled motors for adjustment to required flow.
The plate heat exchanger of each of the five local networks is designed with a large surface area for
heat transfer at low pressure losses, in total for all exchangers with a surface area of about 5 000 m2. The
heat transfer coefficient of the heat exchangers is around 5 kW/(m2K). In all, this gives a heat transfer temperature difference of only about 2°C. Figure 4‐43 shows the principal of the interconnection pipe.

65
Figure 44 Principal of connection of the interconnecting pipe to the existing boiler house
The district heat in the WtE facility is produced either in the turbine condensers and/or the direct
condenser. Large pumps will circulate the district heating water through the WtE facility as well as the
new closed district heating circuit. A small pump will maintain the pressure in the system by adding
water on the suction side of the circulation pumps when necessary
2.11.3 Electricity
The electricity produced in the WtE facility will be transferred to the electric grid preferably through an existing electrical substation. The connection to the electrical substation will be done at 110 kV. Since the electricity produced at the WtE facility will have a voltage of 10.5 kV, a step‐up transformer from 10.5 kV to 110 kV will need to be installed.
WtE facility
Figure 43 Principal diagram of the interconnection
In Figure 44, the principal of connection of the interconnection pipe to the existing boiler house is
h
To WtE
TC
New heat exchanger From WtE
Existing boilerhouse
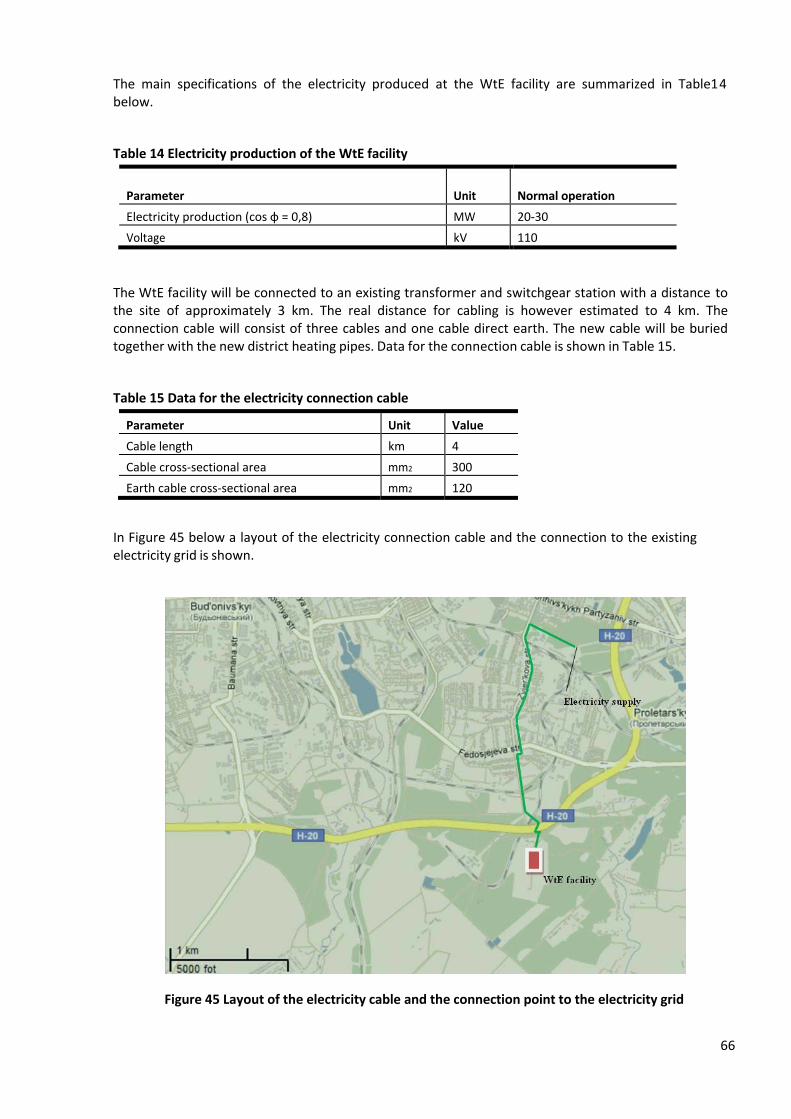
66
The main specifications of the electricity produced at the WtE facility are summarized in Table14 below.
Table 14 Electricity production of the WtE facility
Parameter Unit Normal operation
Electricity production (cos φ = 0,8) MW 20‐30
Voltage kV 110
The WtE facility will be connected to an existing transformer and switchgear station with a distance to the site of approximately 3 km. The real distance for cabling is however estimated to 4 km. The connection cable will consist of three cables and one cable direct earth. The new cable will be buried together with the new district heating pipes. Data for the connection cable is shown in Table 15.
Table 15 Data for the electricity connection cable
Parameter Unit Value
Cable length km 4
Cable cross‐sectional area mm2 300
Earth cable cross‐sectional area mm2 120
In Figure 45 below a layout of the electricity connection cable and the connection to the existing electricity grid is shown.
Figure 45 Layout of the electricity cable and the connection point to the electricity grid
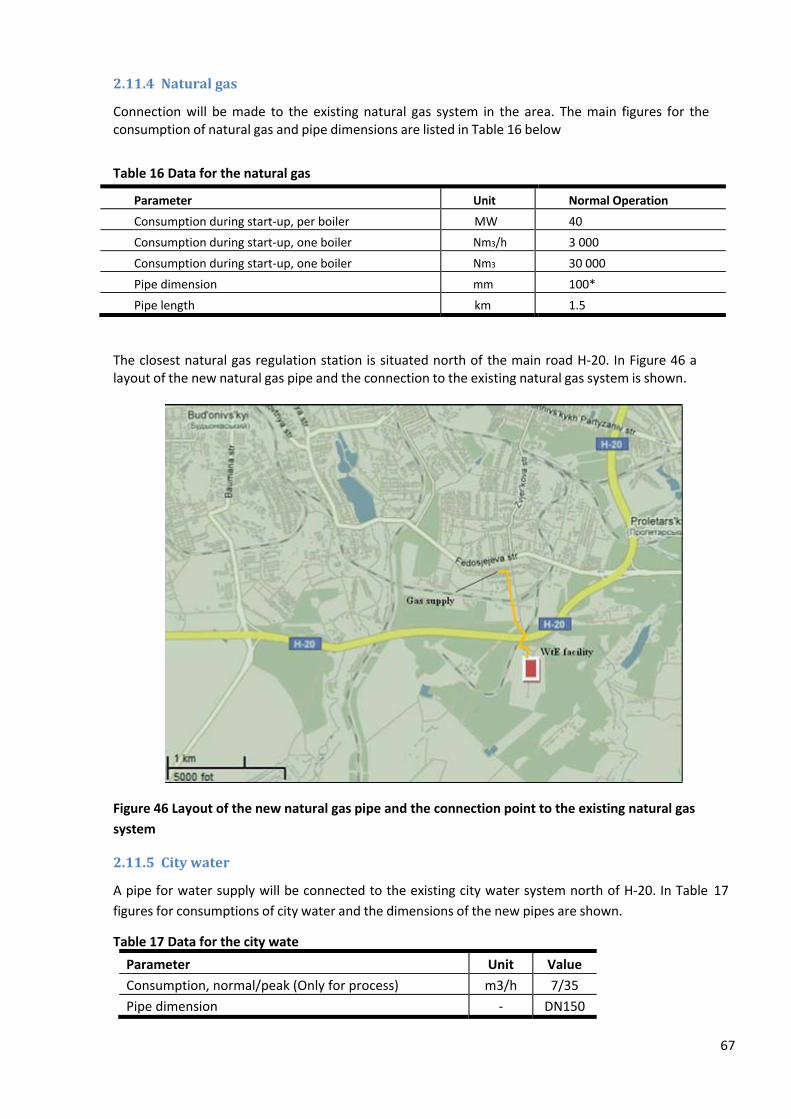
67
2.11.4 Naturalgas
Connection will be made to the existing natural gas system in the area. The main figures for the consumption of natural gas and pipe dimensions are listed in Table 16 below
Table 16 Data for the natural gas
Parameter Unit Normal Operation
Consumption during start‐up, per boiler MW 40
Consumption during start‐up, one boiler Nm3/h 3 000
Consumption during start‐up, one boiler Nm3 30 000
Pipe dimension mm 100*
Pipe length km 1.5
The closest natural gas regulation station is situated north of the main road H‐20. In Figure 46 a layout of the new natural gas pipe and the connection to the existing natural gas system is shown.
Figure 46 Layout of the new natural gas pipe and the connection point to the existing natural gas
system
2.11.5 Citywater
A pipe for water supply will be connected to the existing city water system north of H‐20. In Table 17
figures for consumptions of city water and the dimensions of the new pipes are shown.
Table 17 Data for the city wate
Parameter Unit Value
Consumption, normal/peak (Only for process) m3/h 7/35
Pipe dimension ‐ DN150

68
Pipe length km 1,2
Figure 47 below shows a layout of the new city water pipe and the connection point to the existing city water system.
Figure 47 Layout of the new city water pipe and the connection to the city water system
2.11.6 Sewage
A new sewage pipe will be constructed and connected to the existing sewage system. Table 18 shows the production of sewage water as well as the dimensions of the sewage pipe.
Table 18 Data for the sewage water
Parameter Unit Value
Production m3/h 35
Temperature °C 40
Pipe diameter ‐ DN100
Pipe length km 1.5
Figure 48 below shows a layout of the new pipe and the connection point to the existing sewage
system

69
Figure 48 Layout of the sewage pipe and the connection point to the existing sewage system

70
3 ConclusionThe WtE facility introduces a completely new energy producing technology in Ukraine. The overall concept of the plant is to take care of the municipal waste in Donetsk and by means of modern and efficient technology convert it into clean energy available for the citizens.
The idea behind the facility is to build a plant as environmentally friendly as possible. The design of the WtE facility is based on best available technology, BAT, and the production answers to all relevant EU‐standards connected to the specific area.
While designing the WtE facility has a time perspective of 25 years in mind. This means that the plant also should fulfill legislative requirements regarding efficiency and emissions that could be standard in the future. To build such a facility is expensive.
Consumptions and emissions
In Table 24 the estimated annual consumption of natural gas in the WtE facility is shown. The gas is used during start‐ups, shut‐downs and in case the temperature of the flue gas falls beneath 850°C, this to fulfill the EU‐directive on waste incineration
Table 20 Estimated annual natural gas consumption for two waste‐fired boilers
Parameter Unit Value
Annual consumption Nm 200 000
Maximum momentary consumption Nm3/h 10 000
The facility will produce bottom ash (slag) and fly ash according to Table 21 below. The annual consumption of fuel and consumables are also estimated in the table.
Table 21 Approximate mass balance for a 100 MW WtE facility
Production
Bottom ash tons/year (DM) 90 000
Fly ash tons/year 15 000
Consumption of consumables
Fuel tons/year 480 000
Activated carbon tons/year 150
Lime tons/year 4 500
Ammonium solution (25%) m3/year 1 500
Water m3/year 15 000
In the following text below comments and calculations behind the data in Table 21 can be read.
Activated carbon
The activated carbon consumption is estimated based on guaranteed values of activated carbon consumption from flue gas cleaning suppliers of delivered equipment in facilities of similar size and type as the proposed facility in the plant description.
Estimated activated carbon consumption: 19 kg/h. Based on 8000 h of operation 19*8000/1000 = 152 tons/year

71
Lime
The figure is based on reaction formulas between hydrated lime Ca(OH)2 and HCl and SO2. The amount of HCl and SO2 removed in the flue gas cleaning process is the difference between raw gas contents and emission levels after the flue gas cleaning. Reaction formulas between hydrated lime and HCl and SO2 are then used to calculate how much reactant is needed to remove the HCl and SO2.
Reaction formula for HCl: Ca(OH)2 + 2 HCl CaCl2 + 2 H2O Reaction formula for SO2: Ca(OH)2 + SO2 CaSO3 + H2O Using the flue gas flow, molar weights of hydrated lime, HCl and SO2 and the difference in HCl and SO2
content before and after the flue gas cleaning process, the required flow of hydrated lime can be calculated. This is the stoichiometrical flow of lime, but since the reactions are never complete, excess lime is needed to be able to reach as close to complete reaction as possible. Depending on the ratio of HCl and SOx in the flue gases, the lime consumption will vary. With the foreseen flue gas composition
(HCl: 800 mg/Nm3; SOx: 300 mg/Nm3) the consumption of lime will be around 2.2 times the stoichiometric value according to operational experience.
Calculations:
“Flue Gas Flow” * (“Concentration In” ‐ “Concentration Out”) * “Molar Weight Lime” / “Molar Weight Acid Component” / “kg/mg”
HCl reduction: 250000*(800‐40)*74.09/(2*36.46)/1000000 = 193 kg/h
SOX reduction: 250000*(300‐100)*74.09/64.06/1000000 = 58 kg/h
Total: 241*2.2 = 552 kg/h
Annual consumption based on 8000 h of operation: 552*8000 = 4418 tons/year
Ammonia
Reaction formula for NH3 and NO2 has been used, with an excess ammonia consumption of 20% estimated, based on guarantee values from WtE boiler suppliers.
Reaction formula NO2: 8 NH3 + 6 NO2 7 N2 + 12 H2O
The result is for pure NH3, so the amount of 25% ammonia solution is 4 times as large.
Calculation:
“Flue Gas Flow” * (“Concentration In” ‐ “Concentration Out”) * 8 * “Molar Weight Ammonia” / (6 * “Molar Weight Nitrogen Dioxide”) / “kg/mg”
250000*(400‐100)*8*17.03/(6*46.01)/1000000 = 37 kg/h
Total: 1.2*4*37 = 163 kg/h
Annual consumption of 25% ammonia/water solution (density 900 kg/m3) based on 8000 h of operation: 163*8000/900 = 1450 m3/year
Bottom ash
Calculated based on estimated value of ash in waste fuel, which is 32% (of weight of dry mass) based on experience from typical Swedish household waste. The moisture content of the fuel is estimated similarly to 45% of weight.
Calculation:
Fuel flow to boilers: 60 tons/h = 33 ton/h dry mass Ash

72
flow from boiler: 33*0.32 = 10.6 tons/h dry mass
Annual ash flow based on 8000 h of operation: 10.6*8000 = 84800 tons/year dry mass
Fly ash
Fly ash flow is estimated based on experience from levels of inert material in the fuel and flue gas cleaning processes similar to the WtE facility. Of the initial fly ash content, some is collected in and removed from the boiler, while the rest of the fly ash is collected in the bag house filters of the flue gas cleaning along with the reaction products from the reactor. According to experience from similar plants
there will not be more than 5000 mg/Nm3 of ash leaving the furnace and that half of this is collected within the boiler while the other half follows the flue gases to the bag house filter where the rest is collected along with reaction products. Estimations of annual emissions to air from the WtE facility are presented in Table 22.
Table 22 Estimated annual emissions
Emissions to air
SO2 tons year 55
NOX tons/year 218
HCl tons/year 11
Dust tons/year 11
Hg kg/year 55
Dioxins g/year 0.11
The actual emission values provided in the plant description are derived from suppliers of flue gas
cleaning equipment corresponding to the one in question and experience from facilities using this
technology
Emissions to air
Emissions from the facility are regulated in the Waste Incineration Directive (2000/76/EC) as mention earlier. In the directive there is a differentiation between incineration facilities and co‐incineration facilities, the latter where the main purpose is generation of energy. However, for co‐incineration facilities incinerating untreated mixed municipal waste, the same emission limit values as for incineration facilities apply. Thus, these limit values apply for the WtE facility in Donetsk.
Requirements on emissions from WtE facilities are higher than on facilities using other types of fuels e.g. wood fuel or oil. During procurement of process equipment, it is important to ensure that contractual requirements put on the supplier of flue gas cleaning equipment are even higher than those required by law. This is to obtain a margin to ensure that set emission limits are not exceeded during periods with operational disturbances.
Air emission limit values will most likely be set according to the Waste Incineration Directive. These limits values are severe but manageable when using modern technology. In Tables Table 23, Table 24 and Table 25 below, limits by law for emissions in the exhaust gas from WtE facilities are listed together with approximate expected actual emissions from the WtE facility when using the flue gas cleaning technology in question. The actual emission values are derived from suppliers of flue gas cleaning equipment corresponding to the one in question and experience from facilities using this technology. Values are divided in three different tables due to different requirements on sampling periods for the different pollutants, all according to the Waste Incineration Directive. Values are standardized for the following conditions: temperature 273 K, pressure 101.3 bar, 11%
oxygen, dry gas.

73
The comparison shows that expected actual values fall below expected limit values, thus showing that the chosen flue gas cleaning technology manages to meet requirements concerning all pollutants expected to be regulated in the permit.
Table 23 Daily average values and half hour average values, emission limits set by law in the Waste
Incineration Directive compared to expected actual emission values after flue gas cleaning
Parameter Unit
Legislative requirement Expected actual value
Daily average ½ hour averag
e
½ hour averae
97%
Daily average ½ hour averag
e
Dust mg/Nm3 10 30 10 5 15
HCl mg/Nm3 10 60 10 8 40
HF mg/Nm3 1 4 2 0.5 1.0
SO2 mg/Nm3 50 200 50 30 100
NOx mg/Nm3 200 400 200 100 200
TOC mg/Nm3 10 20 10 3 6
Table 24 Average values measured over the sample period of a minimum of 30 minutes and a maximum of 8 hours, emission limits set by law in the Waste Incineration Directive compared to expected actual emission values after flue gas cleaning
Parameter Unit Average value (30 min to 8 hours)
Legislative requirement Expected actual value
Hg mg/Nm3 0.05 0.03
Cd+Tl mg/Nm3 0.05 0.03
Sb+As+Pb+Cr+Co+Cu+Mn+Ni+V mg/Nm3 0.5 0.1
Table 25 Average values which shall be measured over a sample period of a minimum of 6 hours and a maximum of 8 hours, emission limits set by law in the Waste Incineration Directive compared to expected actual emission values after flue gas cleaning
Parameter Unit Average value (30 min to 8 hours)
Legislative requirement Expected actual value
Dioxins and furans mg/Nm3 0.1 0.05
Limit values for carbon monoxide, CO, are as follows:
50 mg/m3 as a daily average
150 mg/m3 of at least 95% of all measurements determined as 10‐minute average values or 100 mg/m3 of combustion gas of all measurements determined as half‐hourly average values taken in any 24‐hour period.
Odour
Apart from the regulated emissions above, there may be a bad odour from the waste fuel at the

74
facility during certain circumstances. Normally, the waste bunker keeping the waste is designed to minimize the odour by using bunker air as combustion air, thus creating an underpressure in the bunker. This is an efficient way to avoid the waste from spreading a bad odour. Nevertheless, this may arise during periods of longer planned stops. During these periods no combustion air is needed, taking away the underpressure in the bunker. Consequently, the bunker air is able to spread to the surroundings.
However, measures are normally taken to minimize this effect; the level of waste in the bunker is kept at the lowest possible, one of the two boiler lines is always in operation if possible thus minimizing the periods of planned stops when both lines will be out of operation simultaneously. There is also a diluting effect from the surrounding air, reducing the odour significantly. Owing to this, the possible bad odour is present most locally and during short periods of time.
Noise emissions
Noise is regulated in the EU noise directive 2003/10/EC. The directive states the exposure limit values for workers.
Additionally, there will be a number of other requirements to fulfill for the suppliers of process equipment. Among others, the following maximum sound levels in different premises apply for process equipment:
Table 26 Maximum permitted sound levels for work areas
Work area
Max equivalent sound level LpAeq dBA
Noise dose operator and
others
1 m distance from the machine surface1
1 m distance from the
installation2
Production premises for example machine hall, turbine hall, reception hall
80 75 65
Repair workshop, electric operations room3 etc 75 70 60
Driver’s cabins 75 ‐
Changing rooms ‐ ‐ 55 Laboratories, measurement and control rooms 50 45 40
Cafeteria ‐ ‐ 50
Workshop office, staff room ‐ ‐ 45
Office, conference room ‐ 35 30
Fan rooms, compressor rooms etc. (normally unmanned) ‐ 80 75
Operation concept
The WtE facility will be operated approximately 8000 hours per year. During the summer time the demand of district heating will be low; therefore some of the produced heat has to be cooled in a cold condenser. Since a condensing turbine will be used, some steam has to pass through the condensing stage also during winter. This means that some low grade steam has to be cooled in the cold condenser also at this time of year.
In Figure 49 a schematic future load curve for the WtE facility is shown.

75
In Table 27 the annual production figures for the WtE facility are shown
Table 27 Production figures (2x50 MW steam power) [MWh]
Air cooling District heating Electricity, gross Electricity, cons. Electricity, net
Jan 3 123 47 768 22 226 2 522 19 704
Feb 2 821 43 145 19 263 2 278 16 985
Mar 3 758 47 448 22 172 2 500 19 673
Apr 24 408 23 604 23 251 2 647 20 604
May 38 218 10 416 25 125 2 619 22 506
Jun 36 985 10 080 24 315 2 534 21 780
Jul 14 449 10 416 12 196 1 391 10 805
Aug 19 049 10 416 14 698 1 391 13 307
Sep 36 985 10 080 24 315 2 534 21 780
Oct 22 621 27 163 23 834 2 735 21 098
Nov 3 218 46 332 21 383 2 437 18 946
Dec 3 123 47 768 21 414 2 522 18 892
Sum 208 820 334 636 254 192 28 112 226 080
Figure 49 Schematic future load

76
Operation organization
Since the WtE facility will represent a new type of energy production plant in Ukraine, it will require training of the personnel before starting the production. Expertise from other countries will have to work in parallel with the local employees for a certain period after the plant has been taken over.
The following departments are proposed to be established at the facility:
Management
Administration
Planning
Operation and maintenance
Environmental assurance
Quality assurance
General facility support
The operation staff will make inspection rounds of the WtE facility and can be either shift working staff or daytime staff. Three to four shift working staff should always be working at the facility, accompanied by at least three daytime operation staff during weekdays. The maintenance staff will be working from Monday to Friday, excluding holidays, 08.00 until 16.00. On all other times, maintenance staff will be on‐call duty. Categories for maintenance staff are: mechanical, electrical, instrumentation and automation.
Follow‐up
A close follow‐up of the operation can be performed by the operators of the facility or by an operating engineer. Different data need to be controlled on a regular basis, e.g. temperatures and pressures in the boiler. These data will show if something is not well‐functioning and if the facility may need to be stopped in the near future. By following the operation the possible unplanned stop can be more or less planned and the time for the stop can be as suitable and short as possible, which will minimize the loss of income.
Optimization
If the operation of the facility is optimized the lifetime of the equipment will increase. Optimization means that the different conditions for the incineration are trimmed, e.g. that the right amount of oxygen, waste and chemicals are used and that the temperatures are correct in the boiler and flue gas cleaning. It is also important to adjust the operation to different conditions, e.g. wet fuel.
Operating manuals
The operator’s manual is a living document and will be updated when changes are made in the facility. It is important that the manuals are used and that all of the operators run the facility according to the instructions.
The operating manuals are delivered by the suppliers of the facility.
Roundation
A roundation of the facility is carried out at least once a shift. The suppliers of the facility will hand over a list of roundation and this list must be followed to uphold the guarantees. During the roundation all the critical parts for the operation are checked, the operator looks for changes in the operation, for example vibrations, noise, leakage etc. Each round and all the deviations are documented.

77
Annual variations in fuel supply
The required supply of waste will vary depending on the availability of the WtE facility. In Figure 50 the annual fuel flow is shown. The green curve in Figure 50 shows the daily amount of waste delivered to the WtE facility over the course of a year, while the orange curve shows the daily incineration of waste fuel in the WtE facility over the same time. The grey curve shows the accumulated discrepancy between waste fuel received and incinerated at the WtE facility (using the value axis on the right). Assuming no discrepancy at the beginning of the year, the accumulated discrepancy over a year results in a waste fuel surplus of about 40 000 tons, assuming a four‐week long revision period on each boiler during the summer.
Figure 50 Annual fuel flow
Maintenance concept
The WtE facility will be designed for one maintenance stop during one summer month for each line. The maintenance will normally be performed on one line at a time while the other line will be in operation. The ratio between preventative maintenance and immediate maintenance at a new facility shall be at least 80% preventative maintenance and at maximum 20% immediate maintenance. To achieve these numbers it is necessary to carry out preventative measures during operation and during the stops
Preventive work during annual stops
During the summer stop the facility is cleaned and inspected. Controls of the status of the facility by for example x‐rays, thickness measurement and hydrostatic tests are made. All preventative works that are required are carried out, for example, changing of bearings in a pump. Parts need to be changed
‐5000
0
5000
10000
15000
20000
25000
30000
35000
40000
‐100
0
100
200
300
400
500
600
700
800
1‐Jan 1‐Feb 1‐Mar 1‐Apr 1‐May 1‐Jun 1‐Jul 1‐Aug 1‐Sep 1‐Oct 1‐Nov 1‐Dec
Accumulated tons
Tons/day
Delivered tons to WtE Incinerated tons at WtE Accumulated fuel surplus/shortage

78
after a certain life time, before they are completely worn out. The requirements from the suppliers must be followed.
Preventive work during operation
During operation is it important to have a close follow‐up of the facility and the equipment. Lubrication must be done according to the suppliers’ instructions. Measurement of vibration will show the status of the component, if the alignment is accurate and if any component needs to be replaced in the near future. The preventive works during operation will reduce the amount of unplanned stops, the works can be planned and performed before the equipment breaks and causes an unplanned stop.
Redundant equipment
Redundant equipment is to prefer for critical systems and components. Double components will increase the availability for the facility and will reduce the immediate maintenance works, the works will be easier to plan and the facility can still be in operation during the time they are performed.
Electrical energy and insulation
The text above shows that wants to build a facility as energy efficient as possible. Therefore, the plant is designed to consume as little electricity as possible. During operation the heat needed to warm the facility building is covered by losses from the production process. The key behind the technical design is to keep as much energy as possible in the internal buildings and to prevent external losses. Some examples of different energy saving solutions in the WtE facility follow in the sections below.
The use of electrical energy is minimized within the facility by using frequency converters for variable drive equipment. The use of electrical energy will thereby not be more than needed to fulfill the required work at any given moment. Furthermore, electric motors are chosen according to energy effectiveness class IE3, the highest efficiency class, for motors between 1 kW and 375 kW. Motors that are not classified have an efficiency of at least 96%.
All hot parts in the WtE facility shall be well insulated by mineral wool in order to save energy. This concerns, for example, the boiler itself, flue gas ducts and pipes for steam and district heating. Also tanks like the feed water tank and steam drum shall be insulated. Insulation is also a question of working environment since it gives a more comfortable air temperature and reduces the risk of burns. No accessible parts in the facility shall have a surface temperature of more than 55°C.
Air preheating and heat recovery
One of the most important objectives of the WtE facility is to achieve a high electricity output. This is achieved by using relatively high steam data, 60 bar/425°C, which increases the performance of the turbine. Air preheating also serves as a means of increasing the electrical efficiency if bleed steam from the turbine is used for heating the air. The reasoning behind this is based on the fact that the steam leaves some of its energy in the turbine as an increased electrical output. The rest of the heat energy is then returned to the water/steam cycle via heating of the combustion air instead of being “wasted” in the condenser.
Waste heat is also recovered to the district heating system whenever possible. This might for example apply to cooling of the blow down water since temperatures are high enough for being utilized as district heat.

79
References
1. Google maps as per 2016‐08‐29
2. Tacis report as per 2016‐08‐29
3. Donetsk municipality, meetings in Ukraine 2013‐2014
4. Photo Ragn‐Sells Miljökonsult AB as per 2016‐08‐29
5. GreenCO‐Kiev, MSW removal, available at http://greenco.com.ua/en/kiev/tbo, as per 2016‐08‐29
6. Sysav CHP, Malmö Sweden, photo Sysav Andreas Offesson
7. Fisia Babcock Environment GmbH. Tender Donetsk WTE, YFBEB 10‐1129, EcoEnergy Proletarskij ‐ Boiler
8. VonRoll Inova. Tender Borlänge Energi – Waste‐to‐Energy Plant KVV P7 – Boiler. Inquiry 2005.3084
9. Backman, S. (2009) “Donetsk Waste to Energy Project – Feasibility Study” p. 27, S.E.P. Scandinavian Energy Project AB
10. Hiltunen, M. Presentation 2007‐02‐22 “Korrosion och erosion på eldstadsväggar” p. 17, Foster Wheeler Energia Oy
11. Baumgarte Boiler Systems GmbH. Tender WtE Donetsk B1 Ukraine. Proj. no. 09‐043‐MT4E
12. Encyclopædia Britannica, Inc. “Fabric‐filter baghouse”, available at http://media‐ 2.web.britannica.com/eb‐media/99/27099‐004‐1D079347.gif, as per 2016‐08‐29
13. Midwesco Filter Resources, Inc. “Filter Bags”, available at http://www.midwescofilter.com/Products.aspx?ID=27, as per 2016‐08‐29
14. Siemens AG, Brochure: “SST‐600 Industrial Steam Turbines” (E50001‐W410‐A106‐V1‐4A00), available at http://www.energy.siemens.com/hq/en/power‐generation/steam‐turbines/sst‐600.htm, as per 2016‐08‐29
15. Siemens AG, Brochure: “SST‐300 Industrial Steam Turbines” (E50001‐W410‐A102‐V2‐4A00), available at http://www.energy.siemens.com/hq/en/power‐generation/steam‐turbines/sst‐300.htm, as per 2016‐08‐29
16. Woodbank Communications Ltd, Article: “Steam Turbine Electricity Generation Plants”, available at http://www.mpoweruk.com/steam_turbines.htm, as per 2016‐08‐29
17. Alstom Power Turbogenerators, Brochure: “TOPACK air‐cooled turbogenerator” (PT‐ PE/BPROB/TPKRCG08/eng/TMG/10.08/CH/6708), available at http://www.power.alstom.com/_eLibrary/presentation/upload_61631.pdf, as per 2016‐08‐29
18. Chakravarty D., Padleckas H., Engineering Wikia, available at http://en.wikipedia.org/wiki/File:Dores‐ Cond‐diag1.png, as per 2016‐08‐29; permission under GNU free documentation licence (available at http://commons.wikimedia.org/wiki/Commons:GNU_Free_Documentation_License) and under the Creative Commons Attribution and ShareAlike license (available at http://creativecommons.org/licenses/by‐ sa/3.0/legalcode)

80
19. Faco Heat Exchangers, Brochure: “FACO Dry coolers and condensers”, available at http://www.faco.it/download/FACO_BrochureDryCoolers.pdf, as per 2016‐08‐29
20. Ragn‐Sells AB, presentation “Askhantering på Högbytorp”
21. ALLASKA, Environmentally correct utilisation of ashes, available at http://www.askprogrammet.com/allaska3/allaska.aspx?lang=UK&hit=844, as per 2016‐08‐29
22. O. Eriksson, M. Carlsson Reich, B. Frostell, A. Bjo.rklund, G. Assefa, J.‐O. Sundqvist, J. Granath, A. Baky, L. Thyselius. Municipal solid waste management from a systems perspective. Journal of Cleaner Production 13 (2005) 241–252
23. S. Toller, E. Karrman , J. P. Gustafsson, Y.Magnusson. Environmental assessment of incinerator residue utilization. Waste Management 29, 2071‐2077, 2009.
24. Brounen, D., Kok, N., & Quigley, J. M. (2012). Residential energy use and conservation: Economics and demographics. European Economic Review, 56(5), 931–945. doi:10.1016/j.euroecorev
25. Bruckner, T., & Chum, H. (2011). Recent Renewable Energy Cost and Performance Parameters.
26. Arena, Umberto (2012) Process and technological aspects of municipal solid waste gasification. A review. Waste Management, Volume 32, Issue 4, April 2012, Pages 625‐639.
27. Kathirvale, Sivapalan; Yunus, Muhd Noor Muhd; Sopian, Kamaruzzaman; Samsuddin, Abdul Halim (2003) Energy potential from municipal solid waste in Malaysia. Renewable Energy, Volume 29, Issue 4, April 2004, Pages 559‐567.
28. Kumar, Er Sunil (2010) Waste Management. KTH (2002) Kemisk Matteknik (3B1770) Kurskompendium HT 2002. Division of Analytical Chemistry. School of Chemical Engineering and Science. The Royal Institute of Technology, Stockholm, Sweden. Kumar, Er Sunil (2010) Waste Management.
29. Murphy, J.D., McKeogh, E. (2004) Technical, economic and environmental analysis of energy production from municipal solid waste. Renewable Energy, Volume 29, Issue 7, June 2004, Pages 1043‐1057.
30. Baeten, D., Verstraete, W., 1988. Manure and Municipal Solid Waste Fermentation in Flanders: An Appraisal. Biological Wastes 26 (1988) 297‐314
31. Bergqvist, H., Dutko, I., Marinelli, M., 2006. Comparison of the MSW Composition and Collection in Lviv, Perugia and Stockholm. Available at www.ima.kth.se/im/3c1351/Text/Grp1rep_1.doc, accessed at 2016‐08‐29
32. Bill, 2001. DAIL EIREANN. Waste management (amendment) No.2, Vol. 540, No. 4 6 July 2001
33. Brizio, E., Genon, G., et al., 2004. Comparison of locations for a MSW incineration plant. Waste Management and the Environment II
34. Klisch, O., Prochazka, J., Rinaldi, S., 2006. Biological Treatment of Municipal Solid Waste in Ukraine, Sweden and Italy.
35. Mantia, F.L., 2002. Stoker‐type technology. Handbook of Plastics Recyling, Pages 389‐390
36. Papadimitriou, E., Barton, J., Stentiford, E., 2005. Treatment of the Residual MSW of Leeds City Council‐Overview of Potential Health and Environmental Impacts of Energy‐from‐waste Incineration. CalRecovery Europe Limited, Final Report (Part 2)
81
37. Schleiss, K., 2003. Composting and Anaerobic Digestion. Municipal Solid Waste Managemen: Strategies and Technologies for Sustainable Solutions, 2003, Page 138‐143
38. Tsotsos, D., et al., 2002. Biodegradable municipal waste management in Europe: Part 3: Technology and market issues. European Environment Agency (EEA) Topic Report.
39. Zabaniotou, A., Giannoulidis, N., 2002. Incineration of Municipal Solid Waste with Electricity Production and Environmental Safety: The Case of a Small Capacity Unit in Greece, Energy Sources, 24:115–126, 2002
40. Finnveden, G., Nielsen, P. (1999) Long‐Term Emissions from Landfills Should Not be Disregarded. Int. J. LCA 4 (3), 125‐126.
41. Bonk, F., Bastidas‐Oyanede, J.‐R. & J. E. S., 2015. Converting the organic fraction of solid waste from the city of Abu Dhabi. Waste Management, Volume 40, pp. 82‐91.
42. Akii, T.; 2003 “Bioenergy, energy engineering and environmental protection”. Department of Mechanical Engineering, Helsinki University of Technology.
43. Boyle, G.; 2004 “Renewable energy”. Second edition, oxford University press in association with the Open University.
44. Stephens, R.T.; 2000 “An introduction to combustion, concepts and applications”. Propulsion engineering research centre and department of mechanical and nuclear engineering, the Pennsylvania state university, McGraw Hill, United States.
45. Hasheela, R., 2009. Municipal Waste Management in Namibia: The Windhoek Case Study. Mexico: s.n.
46. Hoornweg, D. & Bhada‐Tata, P., 2012. What a waste ‐ A Global Review of Solid Waste Management. Washington: The World Bank.
47. Magen, Y., 2010. Waste Management and Recycling Study in Namiba ‐ Case Study of Keetmanshoop and Ondangwa, Tempere: s.n.
48. McDougall, F. R., White, P. R., Franke, M. & Hindle, P., 2001. Landfilling. In: S. Edition, ed. Integrated Solid Waste Management: A Life Cycle Inventory. s.l.:Blackwell Publishing Ltd, p. 297.
49. Medina, S., 2005. The Solid waste context of developing countries. s.l., Worldbank.
50. Wilson, D. C., Velis, C. & Cheeseman, C., 2006. Role of informal sector recycling in waste management in developing countries. Habitat International, Volume 30, p. 797–808
51. Abeygunawardena, P., 1999 Chapter 2 Environment and Economics in Project Preparation,
52. European Commission, 2000 A Study on the Economic Valuation of Environmental Externalities from Landfill Disposal and Incineration of Waste
53. World Bank I, 1998 West Bank and Gaza Solid Waste Management Project – Environmental Analysis of the Zaharat Finjan Landfill Site
54. Granath, J. (1998) Increased Waste Combustion in Sweden – Potential and Environmental Effects, Department for Chemical Environmental Science, CHALMERS, Goteborg, Sverige
55. Agll et al., 2014. "Study of energy recovery and power generation from alternative energy source." Case Studies in Thermal Engineering, 2014: 92‐98

82
56. Caneghem et al., 2012. "Fluidized bed waste incinerators: Design, operational and environmental issues." Progress in Energy and Combustion Science, 2012: 551‐582
57. Chigier, N.A. "Progress in Energy and Combustion Science." http://www.journals.elsevier.com/progress‐in‐energy‐and‐combustion‐science, 2008: 726‐743
58. Freya et al., 2003. "Characterization of municipal solid waste combustion in a grate furnace." Waste Management, Elsevier Science Ltd., 2003: 689‐701
59. Ionescu et al., 2013. "Integrated municipal solid waste scenario model using advanced pretreatment and waste to energy processes." www.elsevier.com/locate/enconman (Elsevier LTD) Energy Conversion and Management 76 (2013) 1083‐1092 (2013)
60. Mastro et al., 2003. "Cogeneration from thermal treatment of selected municipal solid wastes. A stoichiometric model building for the case study on Palermo." Waste Management, no. 24 (2003): 309‐317
61. Morselli et al., 2005. "Tools for evaluation of impact associated with MSW incineration: LCA and integrated environmental monitoring system." Waste Management, Elsevier Science Ltd., 2005: 191‐196
62. Papagiannakis et al., 2003. Generating Electricity from a 10 MW MSW combustion plant in the area of Athens, Greece: A Feasibility Study. Glasgow: University of Strathclyde in Glasgow Department of Mechanical Engineering, 2003
63. Spliethoff. Power Gneration from Solid Fuels, Power Systems, Chapter 5. Verlag Berlin Heidelberg, 2010
64. The World Bank et al., 1999. Municipal Solid Waste Incineration. World Bank Technical Guidance Report, Washington: The World Bank/The International Bank for Reconstruction and Development
65. Vandecasteele et al., 2007. "Integrated municipal solid waste treatment using a grate furnace incinerator:The Indaver case." Waste Management, Elsevier Science Ltd., 2007: 1366‐1375
66. S. Olssona, E.Karrmanb, J. P. Gustafssona. Environmental systems analysis of the use of bottom ash from incineration of municipal waste for road construction. Resources Conservation and Recycling 48, 26‐40, 2006
67. Bjorklund A., Johansson J., Nilsson M., Eldh P., Finnveden G., 2003. Environmental Assessment of a Waste Incineration Tax ‐ Case Study and Evaluation of a Framework for Strategic Environmental Assessment. Division of Defence Analysis, FOI‐ Swedish Defence Research Agency, Stockholm. Fms‐report 184.
68. Gomez, Guadalupe; Meneses, Montserrat; Ballinas, Lourdes; Castells, Francesc (2009) Seasonal characterization of municipal solid waste (MSW) in the city of Chihuahua, Mexico. Waste Management, Volume 29, Issue 7, July 2009, Pages 2018‐2024.
69. Medina, Martin (2002) Globalization, Development, and Municipal Solid Waste Management in Third World Cities. El Colegio de la Fronera Norte, Tijuana, Mexico.
70. Barth, J., 2006. Biological Waste Treatment in Europe ‐ Technical and Market Developments. European Compost Network, available at: www.compostnetwork.info, accessed at Nov.21 2006
71. Chaya, W., Gheewala, S.H., 2006. Life cycle assessment of MSW‐to‐energy schemes in Thailand. Journal of Cleaner Production (2006) 1‐6

83
72. Meneses, M., Schuhmacher, M., 2004. Health risk assessment of emissions of dioxins and furans from a municipal waste incinerator: comparison with other emission sources. Environment International 30 (2004) 481–489
73. Takuma, M., Kaihara, Y., 2004. Contribution of Waste to Energy Technology to Global Warming. Technical Review Vol. 41 No. 4
74. Wang, K.S., Chiang, K.Y., et al., 2003. The recycling of MSW incinerator bottom ash by sintering. Waste Manage Res 2003(21): 318–329
75. Environment Agency, The Center of Waste Management, 2013. Towards Integrated Waste Management in Abu Dhabi, Abu Dhabi: Environment Agency, The Center of Waste Management.
76. McDougall, F. R., White, P. R., Franke, M. & Hindle, P., 2001. Integrated Waste Management. In: S. Edition, ed. Integrated Solid Waste Management: A Life Cycle Inventory. s.l.:Blackwell Publishing Ltd.
77. Medina, M., 2010. Solid Wastes, poverty and the environment in developing coutry cities ‐ Challenges and opportunities, s.l.: UNU‐WIDER.
78. U.S. Environmental Protection Agency (EPA), 2000 Compilation of Air Pollutant Emission Factors, AP‐42, Fifth Edition, Volume II: Mobile Sources
79. Alam et al., 2001. "ENERGY RECOVERY FROM MUNICIPAL SOLID WASTE IN DHAKA CITY." 4th International Conference on Mechanical Engineering. Dhaka, Bangladesh: Dept. of SESAM, University of Flensburg, Germany, 2001. 125‐130
80. Fitzgerald et al., 2009. Technical and Economic Analysis of Pre‐Shredding Municipal Solid Wastes Prior to Disposal. Columbia: Earth Engineering Center, Columbia University, 2009
81. Ning et al., 2012. "Comparative streamlined life cycle assessment for two types of municipal solid waste incinerator." Journal of Clear Production, www.elsevier.com/locate/jclepro, 2012: 56‐66
82. Valkenburg et al., 2008. Municipal Solid Waste (MSW) to Liquid Fuels Synthesis, Volume 1: Availability of Feedstock and Technology. Richland, Washington: The U.S. Department of Energy, 2008.