Technical Assistance Report to Bureau of TennCare on the ...€¦ · Technical Assistance Report to...
70
Technical Assistance Report to Bureau of TennCare on the Quality Improvement In Long Term Services and Supports (QuILTSS) Initiative This report was prepared with support provided through a grant from the Robert Wood Johnson Foundation’s State Quality and Value Strategies Program.
Transcript of Technical Assistance Report to Bureau of TennCare on the ...€¦ · Technical Assistance Report to...
Technical Assistance Report toBureau of TennCare on the
Quality Improvement In Long TermServices and Supports (QuILTSS) Initiative
This report was prepared with support provided through a grant from theRobert Wood Johnson Foundation’s State Quality and Value Strategies Program.

Contents
1 Introduction
4 Background
11 Literature Review
18 Key Informant Interviews from Other States
37 Stakeholder Input
47 Process Recommendations
50 Recommendations Regarding Quality Domains
53 References
56 Acknowledgements
57 Appendix

This report1 summarizes the technical assistance provided to date by the LipscombUniversity School of TransformAging to TennCare regarding the QuILTSS initiative.QuILTSS stands for Quality Improvement in Long Term Services and Supports.
The State of Tennessee’s Medicaid program is known as TennCare. TennCare provides physicaland behavioral health services, and since 2010, long term services and supports (LTSS) througha managed care delivery system. Tennessee is one of 18 states that have a Medicaid ManagedLTSS (MMLTSS) program.2 QuILTSS is a TennCare value- - based purchasing initiative to promotethe delivery of high quality LTSS for TennCare members enrolled in the CHOICES program.
TennCare’s LTSS Division administers LTSS programs and services that include:
� CHOICES – a MMLTSS program including nursing facility (NF) services as well as
home and community based services (HCBS) for seniors (age 65 and older) andadults (age 21 and older) with physical disabilities.
� Money Follows the Person (MFP) program – a program that assists seniors and
individuals with physical or intellectual disabilities served in institutions in transitioningto the community with HCBS and which supports the state’s rebalancing efforts.
1Technical Assistance Report to TennCare
Introduction
1
This report was prepared with support provided through a grant from the Robert Wood Johnson Foundation’s State Quality and Value Strategies Program.2
Friday Morning Collaborative Webinar, http://www.ancor.org/newsroom/news/fmc-hold-webinar-state-oversight-and-quality-managed-ltss-december-6.

� Program for All-Inclusive Care for the Elderly (PACE) – a managed care program
providing frail elderly (age 55 and older) Medicare and Medicaid members withcomprehensive medical and social services at an adult day health center, at home,and/or inpatient facilities, using an interdisciplinary team and integrated careplanning approach. For most participants, the comprehensive service packagepermits them to continue living at home while receiving services, rather than aninstitution. PACE is currently available in Tennessee only in Hamilton County. Theseservices are not included in the QuILTSS initiative.
� Services for individuals with intellectual disabilities – three Section
1915(c) HCBS waiver programs serving individuals with intellectualdisabilities in the community as well as in an ICF/IID (Intermediate CareFacility for Individuals with Intellectual Disabilities) benefit. These servicesare not included in the QuILTSS initiative.
For Nursing Facility (NF) rates, Tennessee currently utilizes a cost- -based reimbursementsystem, whereby each nursing home has its own unique cost- -based reimbursement ratethat is inclusive of the covered costs of NF care. NFs submit cost reports to the Office of theComptroller. The Comptroller establishes a per diem rate based on those cost reports. Allof the NF rates are then ranked, and facilities up to the 65th percentile are costreimbursed.Those in excess of the 65th percentile are capped at the 65th percentile. HCBS rates werecarried forward from the Section 1915(c) waiver that existed prior to CHOICES, with onlytargeted adjustments since implementation.
As part of the QuILTSS initiative, TennCare intends to develop a new payment approachbased in part on a quality framework, including a core set of quality domains and qualityperformance measures that will be collected to measure the quality of services provided byNF providers. The data will be used in the calculation of payments in order to properly alignincentives, enhance the customer experience of care, support better health and improvedhealth outcomes for persons receiving LTSS, and improve quality performance over time.
TennCare also intends to develop a modified core set of quality domains and qualityperformance measures for the provision of core HCBS, including personal care visits andattendant care – those services which include hands- -on assistance with activities of daily living.This will include measures that are applicable across service delivery settings (NF and HCBS)as well as additional measures that are specific to the provision of LTSS in home and community- -based settings. A modified reimbursement structure is expected to align payment rates withperformance on the specified quality measures, driving toward the same objectives across the“Triple Aim” of better health, better care, and increased cost- -effectiveness, the same frameworkoriginally developed by the Institute for Healthcare Improvement and later adopted as goalsby the Centers for Medicare and Medicaid Services (CMS).
TennCare intends to use the following parameters to guide the development of QuILTSS:� Quality measures will be developed based on input from individuals receiving LTSS
and their families, advocacy groups representing seniors and adults with disabilities,NF and HCBS providers, and other LTSS stakeholders.
2Technical Assistance Report to TennCare

� Quality measures must include those aspects of service delivery perceived by
individuals receiving LTSS and their families to have the greatest impact on qualityof care and quality of life.
� Changes in reimbursement based on quality performance must be sufficient to
incent improvement – i.e., must represent a significant difference in payment.
� Overall, QuILTSS must be budget neutral (based on the amount of funding that
would have been spent under the current reimbursement methodology for the samenumber of bed days in a NF or the same amount of HCBS), unless additionalfunding is identified.
� QuILTSS is expected to be phased in over time to establish data collection processes
and benchmarks, and to ensure the stability of the LTSS system.
As part of the Robert Wood Johnson Foundation’s State Quality and Value Strategies (SQVS)program, Tennessee was awarded a grant for technical assistance to TennCare in theQuILTSS Initiative.
The funding award to Lipscomb University via a contract with Princeton University providestechnical assistance which includes facilitation of opportunities for broad stakeholderreview and input regarding proposed quality improvements, the engagement of keystakeholders in the program design process, assistance in gathering input/information,review of the literature, interviews regarding best practices, program design andeffectiveness of pay for performance (P4P) programs, and recommendations to TennCareregarding the quality framework and implementation process. The technical assistancecontract period is August 1, 2013 through March 31, 2014.
3Technical Assistance Report to TennCare

The quality of care provided in nursing facilities (NFs)1 is a concern of long standing, dating atleast as far back as an investigation by the Public Health Service in the early 1960s, which ledto the publication of a guide for minimum standards in nursing homes (Castle & Ferguson,2010). A subsequent inquiry in 1984 led to the passage of the 1987 Nursing Home Reform Act,which mandated the creation of the Minimum Data Set (MDS2) and other structures andprocesses designed specifically to measure and encourage quality care in NFs (Mor, 2005).
Initial efforts to improve the quality of care consisted primarily of punitive measurestriggered by the failure of a facility to meet federal and state standards. However, over thepast two decades, a new approach has emerged, one that utilizes quality indicators andpayment systems to incentivize improved performance. These new Pay for Performance(P4P)3 systems employ a variety of rate structures which include differential rates, add-ons,or payments based at least in part on how the provider performs on measures of carequality or other identified areas of performance (Arling, Job, & Cooke, 2009).
Federal Quality Initiatives in Long Term Services and Supports (LTSS)
As Arling and colleagues (2013) have observed, Federal efforts have produced a considerableinfrastructure to support and promote quality in NFs. A number of efforts aimed at qualityimprovements in long term services and supports (LTSS) in both the NF and home andcommunity based (HCBS) settings are underway nationally, including in Tennessee. Theseinclude the Centers for Medicare and Medicaid Services (CMS) 5-Star Quality Rating System, theAdvancing Excellence in America’s Nursing Home Campaign, the Partnership to Improve
4Technical Assistance Report to TennCare
Background
1As it is used in this document, “Nursing Facility” or “NF” encompasses both Skilled Nursing Facilities or SNFs, certified for participation in the Medicareprogram, and “Nursing Facilities” or “NFs”, certified for participation in the Medicaid program to offer skilled nursing and related care, rehabilitative services,and only in the case of Medicaid NFs, long-term health-related care and assistance (beyond room and board) that is needed on an ongoing basis because of aphysical or mental condition, and can only be provided in an institution.
2 The Long-Term Care Minimum Data Set (MDS) is a standardized, primary screening and assessment tool of health status that forms the foundation of thecomprehensive assessment for all residents in a Medicare and/or Medicaid-certified long-term care facility. The MDS contains items that measure physical,psychological, and psychosocial functioning. The items in the MDS give a multidimensional view of the patient’s functional capacities and helps staff toidentify health problems (CMS.gov). MDS data form the basis of many of the measures on the CMS Nursing Home Compare website(www.medicare.gov/nursinghomecompare).
3 State P4P initiatives to incentivize improved quality of care are discussed in the Literature Review section of this report.

Dementia Care in Nursing Facilities, and Quality Assurance Performance Improvement (QAPI).Key initiatives focused specifically on improving home health services, as well as the quality ofHCBS provided pursuant to section 1915 (c) waivers4 include the Outcome-Based QualityImprovement (OBQI) program and HHQI, the Home Health Quality Initiative (Murtaugh, Peng,Aykan & Maduro, 2007).
The 5-Star Quality Rating System was developed by CMS to help consumers, families,and caregivers have a basis from which to compare NF quality. NFs receive both an overallrating of one to five stars, as well as a separate one to five star rating for each of the threecomponent areas: health inspections, staffing, and quality measures. Rankings are postedon a CMS Nursing Home Compare website (www.medicare.gov/nursinghomecompare). Afive star rating reflects quality which is “much above average,” while a one star rating isindicative of quality that is “much below average.” A three-year analysis of performancesince implementation of the 5-Star system (2008-2011) shows a general improvement inhealth inspection scores, except in one-star facilities; higher overall performance on self-reported quality measures; modest improvement with respect to self-reportedstaffing—in particular reported levels of RN staffing; and improvements in overall qualityrankings. The proportion of 5-star facilities has increased slightly (from 7.2% to 10.3%);4-star homes have increased more (from 31% to 41%), and 1-star facilities have declined(from 23% to 12%) (www.cms.gov/Medicare/Provider-Enrollment-and-Certification/CertificationandComplianc/Downloads/FSQRS-Report.pdf). The overallaverage rating for Tennessee NFs is 2.9 stars, which ranks 48th nationally(www.cms.gov/Medicare/Provider-Enrollment-and-Certification/CertificationandComplianc/FSQRS.html).
Advancing Excellence in America’s Nursing Homes is a voluntary nationwide program, inwhich approximately 50% of Tennessee NFs participate. Each participating NF chooses threegoals related to quality on which to focus each year. Training and technical assistance isprovided, and improvement is tracked across nine measures. These measures are grouped asProcess Goals and Clinical Goals. Process Goals include staff stability, consistent assignment,person-centered care planning and decision-making, and safe reduction in hospitalizations.Clinical Goals consist of appropriate use of medications, increased resident mobility, anddecreased rates of infections, pressure ulcers, and pain symptoms(www.nhqualitycampaign.org).
The Partnership to Improve Dementia Care in Nursing Facilities (Partnership) is anational initiative to improve person-centered care and behavioral health and reduce theuse of antipsychotic drugs in NFs. More than half of all NF residents have some form ofdementia. For residents with dementia, challenging behaviors are often an indication ofunmet needs, because they have no other effective means of communication. Unfortunately,antipsychotic medications are often prescribed in an attempt to control the behavior, ratherthan identifying and addressing the underlying need. Such drugs increase the risk of stroke,heart attack, falls with fractures, hospitalizations, and other complications that result inhigher cost and poorer quality of care and quality of life for these residents.
5Technical Assistance Report to TennCare
4 Section 1915 (c) has been the primary federal authority for HCBS. The 1915(c) waivers are one of many options available to states to allow the provision oflong term care services in home and community based settings under the Medicaid Program. States can offer a variety of services under an HCBS Waiverprogram (www.medicaid.gov/Medicaid-CHIP-Program-Information/By-Topics/Waivers/Home-and-Community-Based-1915-c-Waivers.html).
The Partnership tracks the percent of long-term NF residents who are receiving anantipsychotic medication, excluding those who are diagnosed with schizophrenia,Tourette’s Syndrome, or Huntington’s disease. In the fourth quarter of 2011, 23.9% of long-stay NF residents were receiving antipsychotic medication nationally; the most recentfigures for the third quarter of 2013 reveal a 13.1% improvement to 20.8%. During thissame period, Tennessee also improved on this measure; in the third quarter of 2013,23.98% of Tennessee NF residents received antipsychotic medication, compared with29.27% in the first quarter of 2011. Tennessee is ranked 47th in the nation on this measure(http://www.amda.com/advocacy/AP_package_070513.pdf).
Quality Assurance Performance Improvement (QAPI) combines two complementaryapproaches to quality management. The first is quality assurance—a process of ensuringthat minimum quality standards are met. It is typically a reactive and retrospective reviewto determine why a facility failed to achieve minimum quality standards, with efforts tocorrect identified deficiencies. Once the standards are achieved, the process typically ends.Performance improvement is proactive and seeks to review processes on an ongoing basisin order to prevent or decrease the likelihood of problems and to achieve higher qualityperformance even after minimum standards are met. QAPI engages individuals at all levelsof the organization to:
� identify opportunities for improvement; address gaps in systems or processes;
� develop and implement an improvement or corrective plan; and
� continuously monitor effectiveness of interventions.
The Outcome-Based Quality Improvement (OBQI) program furnishes reports on patientoutcomes5 collected through the Outcome and Assessment Information Set (OASIS) tohome health providers in every state. These reports can be used for improving the qualityof services, as providers identify potential problems and corresponding strategies for
6Technical Assistance Report to TennCare
5Not long after NFs became obligated to submit MDS data, Medicare-certified home health agencies were also required to begin collecting and providingstandardized data sets regarding the status of patients receiving home health services. The Outcome and Assessment Information Set (OASIS) data seeks tomeasure outcomes of care for home health patients, and since 2010, includes process measures regarding the delivery of care.
solutions. OBQI measures include clinical outcomes in areas of functioning (such asphysical, emotional/behavioral, and cognitive functioning) as well as measures of healthcare utilization (Murtaugh et al., 2007).
The Home Health Quality Initiative (HHQI) utilizes a subset of the OBQI data and makes itpublicly available in order to provide potential consumers of the service with a basis fordecision making regarding home health services. It also serves as an incentive for home healthproviders to improve the quality of care. This is a similar approach to the one used in the Five-Star Quality Rating System for NFs. Data are reported on a CMS Home Health Compare website(www.medicare.gov/homehealthcompare) across two domains: process measures andoutcome of care measures. Process measures include timely initiation of care, immunizations,heart failure, diabetic foot care, pain assessment and intervention, depression assessment,drug education on medications, and pressure ulcer risk and prevention. Outcome of caremeasures are comprised of improvements in ambulation, bed transfer (getting in and out ofbed), pain interfering with activity, bathing, management of oral medications, dyspnea, statusof surgical wounds, acute care hospitalizations, and use of emergent care(http://www.medicare.gov/HomeHealthCompare/Data/Quality-Measures-List.htm).
There is also a voluntary national campaign to improve the quality of home health services,similar to Advancing Excellence in America’s Nursing Homes. Initiated in 2007, the Home
Health Quality Improvement Campaign (www.homehealthquality.org) includes 10,771participants from 5,661 agencies, and offers participating home health providers resources,training, and technical assistance in improving care delivery and patient outcomes.
CMS is also focused on measuring and improving quality across HCBS provided pursuant toSection 1915 (c) of the Social Security Act. Following a report by the General AccountingOffice in 2004, CMS initiated a new evidentiary approach to its quality oversight of section1915 (c) waiver programs, focused on ensuring states’ compliance with waiver assurancesset forth in federal regulation. Revisions to the new quality requirements were released in2007, along with an online version of the 1915 (c) waiver application. Three critical steps ofthe quality review cycle are embedded throughout the application: 1) discovery – activitiesto measure and identify instances of non-compliance; 2) remediation – 100% remediationof all instances of non-compliance; and 3) system improvement - efforts to examine andaddress underlying quality concerns and promote quality improvement across the HCBSdeliver system on an ongoing basis.
Measurement is a challenge in HCBS due to the spectrum of services, the large number ofproviders, the home setting, and the lack of standard measures. To address this, CMS is fundingthe demonstration grant TEFT (Testing Experience and Functional Assessment Tools inCommunity Based Long Term Services and Supports). This project is designed to test qualitymeasurement tools and demonstrate e-health in Medicaid LTSS (www.medicaid.gov/Medicaid-CHIP-Program-Information/By-Topics/Long-Term-Services-and-Support/Long-Term-Services-and-Support.html). While Tennessee did not apply for a demonstration grant, it was selected as apilot site for testing the new HCBS Consumer Assessment of Healthcare Providers tool.
7Technical Assistance Report to TennCare

8Technical Assistance
Federal Pay for Performance (P4P) Initiatives
In addition to the preceding initiatives to develop infrastructure to support quality in LTSS,CMS has also tested the effect of financial incentives in improving care in both the NFsetting and in home health.
One such initiative, the three-year Nursing Home Value-Based Purchasing (NHVBP)
Demonstration, was initiated to explore how P4P affects both NF performance and costwithin Medicare. 182 NFs in the states of Arizona (41), New York (79) and Wisconsin (62)voluntarily participated in the project, which began July 1, 2009, and concluded in July of 2012.All facilities submitted data on four domains: nurse staffing, resident outcomes, appropriatehospitalizations, and state survey inspection deficiencies. Data on nurse staffing includedagency staff data along with payroll and resident census information. MDS data was used forresident outcomes, inpatient hospital claims were tracked to monitor hospitalizations, andstate health inspection reports were used to evaluate survey deficiencies. CMS risk-adjustedcertain measures to control for differences in resident populations or individual NFcharacteristics. NFs were eligible for financial incentives based on either attainment orimprovement of quality indicators. The program was designed to be budget neutral and reliedon funding resulting from state-specific Medicare savings related to lower hospitalization ratesin the test group compared to a control group (“Plan to implement,” n.d.).
Although the full evaluation has not yet been completed, preliminary findings have beenpublished and are reported to be mixed. According to a report to Congress, several NFs haveexperienced improvements in quality measures related to pressure ulcers, restraints, andhospital admission rates for heart failure. However, while savings in Wisconsin nursinghomes were sufficient for significant incentives, there were fewer savings in Arizona, andnone in New York (Graham, 2012).
Lessons learned from the NHVBP Demonstration are reported to include: new processeswhich were developed to address the lag time between data collection and performanceupdates; the calculation of measures related to hospitalizations and episodes of care; highsustained levels of participation (which may be attributable to the flexibility extended to NFs inimplementing initiatives and support from CMS for sharing lessons learned); and the learningcurve experienced by some NFs in reporting payroll data (“Plan to implement,” n.d.).
CMS also funded a Medicare Home Health Pay-for-Performance Demonstration fromJanuary 2008 through December 2009. Similar to the NHVBP Demonstration, home healthagencies (HHAs) qualified for incentives based on either attainment or improvement ofquality indicators. As reported by CMS, 567 HHAs participated in the demonstration, with280 in the treatment group and 287 in a control group (p. 20). Participating HHAsrepresented more than 30 percent of all Medicare certified HHAs in their respective statesand were located in Illinois (66), Connecticut and Massachusetts (48), Alabama, Georgia,and Tennessee (99), and California (67). OASIS measures were used and included:incidence of acute care hospitalization; incidence of any emergent care; improvement inbathing; improvement in ambulation/locomotion; improvement in transferring;improvement in management of oral medications; and improvement in status of surgicalwounds (“Plan to implement,” n.d.).
Report to TennCare

9Technical Assistance
Incentives were calculated from differences between the experimental versus control groupsbeneficiaries’ Medicare costs, including home health care, inpatient hospital care, nursinghome and rehabilitation facility care, outpatient care, physical care, durable medicalequipment, and hospice care. Successful HHAs were described as patient and communitycentered, quality focused, used technology to enhance care, and implemented specific, targetedstrategies to succeed in improving poor performance areas (“Plan to implement,” n.d.).
LTSS in Tennessee
As with the rest of the country, the quality of LTSS in Tennessee, particularly in NFs, has been alongstanding source of concern. As noted above, in spite of improvements in recent years,Tennessee ranks 47th in the percentage of NF residents who are treated with antipsychoticmedication, and 48th nationally in the average NF star ratings under the 5-Star Quality RatingSystem. A 2009 report commissioned by the American Association of Retired Persons (“Qualityof care,” 2009) reviewed litigation in Tennessee NFs, in which it found “distinguishing qualityand structural characteristics—below average staffing levels, large average facility size, and ahigh percentage of for-profit and chain-owned facilities—associated with increased risk ofquality problems and litigation.” These problems are further compounded by the finding that“Tennessee surveyors have performed far below the national average in accurately detectingserious violations of quality standards” (p. ii). The report makes several recommendations forimproving this situation, among which is to “provide incentives for good quality care, pairedwith oversight and citations of deficiencies” (p. 32).
In order to address long-term care quality concerns, the Tennessee legislature mandated, aspart of the comprehensive reform of the long-term care delivery system, the developmentof a quality approach that promotes continuous quality improvement and focuses on theexperience of the consumer. Tennessee’s Long-Term Care Community Choices Act of
2008 embraced quality as a key objective of the LTSS delivery system and included aspecific section dedicated to assuring and improving quality, with a key focus on quality asit is perceived by those receiving services.
TCA 71-5-1402(i) provides that:
“The long-term care system shall include a comprehensive quality approach across the
entire continuum of long-term care services and settings that promotes continuous quality
improvement and that focuses on customer perceptions of quality, with mechanisms to
ensure ongoing feedback from persons receiving care and their families in order to
immediately identify and resolve issues, and to improve the overall quality of services and
the system.”
TCA 71-5-1415 continues:
“The commissioner shall develop and implement quality assurance and quality improvement
strategies to ensure the quality of long-term care services provided pursuant to this act and
shall specify in contractor risk agreements with contractors responsible for coordination of
Medicaid primary, acute and long-term care services requirements related to the quality of
long- term care services provided. Such strategies may include the use of electronic visit
verification for data collection and reporting, HEDIS measures pertaining to long-term care
services, and shall include mechanisms to ensure direct feedback from members and family
or other caregivers regarding the quality of services received. “
Report to TennCare

The quality strategy for CHOICES is part of an integrated quality management strategy forthe entire TennCare program, and includes:
� Uniform measures of system performance;
� Detailed reporting requirements;
� Ongoing audit and monitoring processes;
� Measures to immediately detect and resolve problems, including gaps in care
(e.g., Electronic Visit Verification);
� Independent review by an External Quality Review Organization, the National
Committee on Quality Assurance (NCQA, an accrediting body for Managed CareOrganizations), and the Tennessee Department of Commerce and Insurance;
� A key focus on member perceptions of quality, including a modified Quality of Life
survey for LTSS members; and
� Advocacy for members across the managed long term services and supports
(MLTSS) system.
With QuILTSS6, TennCare intends to build on the lessons learned and infrastructure ofquality efforts already underway, both for NF and HCBS, while also incorporating thosemeasures of quality that are most important to people receiving LTSS and their families.Moreover, as the largest payer of LTSS in Tennessee, TennCare intends to utilize itspurchasing procedures and payment system to incentivize quality care, improve howTennesseans experience LTSS, and improve both the performance of LTSS providers andthe healthcare outcomes and quality of life of consumers over time.
10Technical Assistance Report to TennCare
6QuILTSS is described in the Introduction section of this report.


11Technical Assistance
Literature Review
The purpose of this section is to review relevant literature on the empirical study of theimpact of Pay for Performance (P4P) in nursing facilities (NFs) and home and communitybased services (HCBS), along with closely related articles from the public policy arena, toidentify and discuss salient issues and best practices which may inform the design ofTennessee’s program through QuILTSS.
As discussed in the Background section of this report, the quality of care provided in thenursing home setting is a concern of long standing, dating at least as far back as aninvestigation by the Public Health Service in the early 1960s (Castle & Ferguson, 2010).More than fifty years of review and increasing oversight and regulation have failed toeffectively remedy the situation (Arling et al., 2013). While these efforts have produced aconsiderable infrastructure to support and promote quality, the payment system itself forlong term services and supports (LTSS) in general, and particularly for NF care, hastypically been based on cost and lacks incentives for the provision of quality care.Therefore, state Medicaid payment systems, as the single largest payer of LTSS care, may bein a position to utilize their regulatory and purchasing power to leverage improvements inthis sector (“Plan to implement,” n.d.; Arling et al., 2013).
Report to TennCare
12Technical Assistance
State Pay for Performance (P4P) Programs
As regulatory and punitive measures failed to improve nursing home care quality, stateMedicaid agencies have sought to stimulate change through market forces with P4Pincentive programs (Briesacher, Field, Baril & Gurwitz, 2009; Werner, Kontetzka, & Polsky,2013). Rather than basing reimbursement on fee schedules or historical costs, in P4Pprograms, payments to nursing homes depend at least in part on level of performance ondefined measures of quality (Briesacher et al., 2009; Werner et al., 2013), thus creatingmotivation for NFs to shift focus from the amount and types of services provided to thelevel of quality of care. While this strategy has gained popularity, efforts to evaluate itseffectiveness have been limited, and results from extant studies are mixed (Werner et al.,2013; Arling, Job, & Cooke, 2009; Briesacher et al., 2009).
Defining and Measuring Quality
A foundational issue for P4P has been determining how to define and measure quality. TheDonabedian approach, often used in long-term care, divides quality measures into structure,process, and outcome measures (Castle & Ferguson, 2010, p. 427). Many studies on long-termcare quality measures divide measures into these three categories. Structural measurespertain to organizational characteristics, such as ownership or for-profit or non-profit status;process measures are concerned with things done to and for the resident in the provision ofcare, such as immunizations or risk assessment tools; and outcome measures are the end stateof care, such as pressure sores or improved functioning in activities of daily living (ADL). Thetheory behind this paradigm is that good structure facilitates good processes, and goodprocesses produce good outcomes (Castle & Ferguson, 2010; Mor, 2005). However, Castle &Ferguson point out that this theory was not developed specifically for nursing homes, has notalways been validated in the literature, and is sometimes modified, for instance, by being usedin combination with contingency theory.
Vincent Mor (2005) explores the issues of the “conceptual and empirical validity underlyingthe quality measures now in use in long-term care” (p. 335). He points out that the issue ofhow to actually measure quality is a subject of a great deal of debate and emphasizes thedifference between the process of caregiving and the outcome of that care, though both areused as measures. Given the lack of standardization in medical care and the heterogeneity ofpatient populations, comparisons can be difficult to make and require the use of riskadjustments. Many facilities specialize in a particular area (such as pressure ulcers) and thusbias is introduced into the system. He concludes that though the long-term care field nowutilizes consistent clinical measures, “substantial gaps remain in our knowledge about thequality of existing measures, how they are reported, how to get the designated audiences touse the information, and whether and how providers can institute quality improvementprograms” (p. 350). These issues may play a part in the inconsistencies of research findingson the effectiveness of P4P and other incentives discussed later in this review to improve thequality of care, since those efforts rely heavily on quality measures to assess performance.
Report to TennCare
13Technical Assistance
Additional Strategies to P4P
P4P is not the only strategy in use to motivate improvements in the quality of care in LTSS.Examples such as market competition, publishing quality “report cards”, and facilitatingincreased pressure from consumers and consumer groups are also found in the literature.Starkey, Weech-Maldonado, & Mor (2005) examined the relationships between the leveland type of competition in the market and nursing home quality. The researchers used theMinimum Data Set (MDS), Online Survey Certification of Automated Records (OSCAR), andHealthCare Financing Administration’s Multi-State Case-Mix and Quality Demonstrationfrom 1996 (states of New York, Maine, Vermont, Kansas, and South Dakota). Evidence wasfound that competition is associated with higher levels of quality in nursing homes. Thestudy found support for an association between active certificate of need laws (whichreduce competition by discouraging new entrants into the service area) with lower qualityNF care, and higher quality of NF care where there are a large number of home healthagencies (alternatives to nursing homes), a larger supply of hospital-based sub-acute carebeds, and higher levels of excess demand, all conditions which create competition for NFs.However, the researchers failed to find support for the hypothesis that nursing homes inmarkets where the ratio of hospitals to nursing homes is low would demonstrate higherquality of care, and found mixed results for the hypothesis that nursing homes with higherMedicare managed care rates would be associated with higher quality.
Another study examined the relationship between published quality report cards andtrends in quality measures (Mukamel, Weimer, Spector, Ladd, & Zinn, 2008). The ideabehind report cards is that increased access by consumers to information creates greaterawareness of and demand for quality care, thus creating a motivation for providers toinvest in quality improvement. The researchers specifically examined the effect of theFederal Nursing Home Compare (NHC) report card published by the Centers for Medicareand Medicaid (CMS) since 2002 relative to actions taken in response to the report card andsubsequent performance on quality measures, using MDS data for comparisons. Theiranalysis reveals that the NHC quality report card did lead to improved quality, but only insome areas. Importantly, a stronger link was found between the number of specific qualityimprovement actions taken by nursing homes in response to the report card andperformance on quality measures, with the best results related to relatively fewer, focusedcorrections. They suggest that pairing report cards with educational programs regardingeffective quality improvement methods for nursing homes may be the most effective use ofreport cards.
Consumer Involvement and Satisfaction
Along with access to information, an active and involved consumer constituency is thought tocreate an environment in the market that leads to motivation for improvements in nursinghome care. Miller and Rudder (2012) examined efforts to promote consumer engagement inthe development of Medicaid nursing home reimbursement policy in New York andMinnesota. The authors believe that “the effectiveness of elder advocacy has languished inrecent years” (p. 628), having fallen victim to an increased focus on individual responsibilityand an image of aging adults as a “flourishing population cohort” (p. 628). Through structuredinterviews, the study found that active consumer representatives were able to help to develop
Report to TennCare
14Technical Assistance
acuity-adjusted payments and support rate equalization and wage encumbrance, which are allfactors important to access to and quality of care. The ombudsmen program was found to focuson individual versus system concerns, lacked policy expertise, and was hindered by the need topreserve relationships with government funders. Strategies for increased and successfulconsumer engagement are discussed, including targeting key legislators, testifying atlegislative proceedings, interacting with state administrators, serving as a convener for stateagencies, interacting with taskforces and workgroups, and utilizing grassroots approachessuch as stimulating media coverage, letter writing, and e-mails.
A measure of growing interest in quality performance is consumer satisfaction. The SCANFoundation supported research that resulted in two publications on satisfaction levels inolder adult recipients of LTSS (Miller, Cohen & Shi, 2013; Cohen, Miller, & Shi, 2013). Thisresearch was conducted using data from private long-term care insurance policy-holders,which allowed the study to avoid the confounding variable of the cost or affordability of thecare. Data were collected between 2004 and 2008. The study found that satisfaction ishighest among those receiving services in home, followed by satisfaction levels withresidents of assisted living facilities, and lowest for nursing home residents. Satisfactionwas found to be highest at the inception of service and to decline over time across all threesettings. Miller et al. (2013) found that the following were most important to residents:having someone available to assist when needed (53%); feeling safe (28%); having controlover schedule and daily routine (8%); personal privacy (7%); and being around peers (4%)(p. 5). The authors suggest that declining satisfaction may be prevented by periodically re-assessing the patient’s needs to ensure the care is commensurate with currentrequirements, and to ensure that caregivers’ relationships skills are commensurate withtechnical caregiving skills (Miller et al., 2013). Cohen et al. (2013) additionally found thatthose who are not very satisfied with their care tend to be found in a different care settingwithin eight to twelve months, a finding that might not be replicated among Medicaidrecipients. The study also found that upon transfer to home care from a facility, satisfactionrates rose from 31% to 63% (p. 9). They found that provider characteristics (able tounderstand the caregiver, provides quality care, good at what they do, trustworthy, reliable,gets along with consumer, spends enough time with consumer) are highly related to levelsof satisfaction (p. 11). Interestingly, the presence of a care manager was found to beunrelated to later satisfaction with care. Building trust and communication with theconsumer was found to be of paramount importance (p. 21).
State P4P Strategies and Effectiveness
While measurement science continues to evolve, and the reliability and validity of qualitymeasures is debated, states have increasingly turned to various forms of P4P to incentivizeimprovements in care in LTSS. The efforts of eight states with P4P programs are discussedelsewhere in this report. Briesacher et al. (2009) evaluated thirteen P4P programs, seven ofwhich were still active at the time of the study. The objective of the review was to describeand compare these programs and examine any evaluations of their impact. Included forstudy were functional payment systems located in nursing homes, focused on quality(versus efficiency), based on financial (versus recognition) incentives, and located in theUnited States. According to this review, the only study to date to provide conclusive resultsoccurred in San Diego, California in the early 1980s. 32 nursing homes were randomlyassigned to an experimental or a control group, and incentive payments were given for
Report to TennCare
15Technical Assistance
admitting patients with the highest need for functional assistance, improved patientfunctioning within 90 days of admission, rapid discharge of patients, and patientsremaining out of the facility for at least 90 days. More than 11,000 nursing home residentswere tracked for 2 ½ years. The incentive payments were clearly shown to produce greateradmissions of individuals with severe disabilities, and less likelihood of death orhospitalization occurred in the experimental group. However, costs to Medicaid rose byabout 5 percent (Briesacher et al., 2009). Overall, this study found “little empirical evidencethat pay-for-performance programs increase the quality of care of residents or theefficiency of the care in nursing homes” (p. 10).
A more recent review of P4P programs was conducted in 2013 by Werner and colleagues(Werner et al., 2013). These researchers sought to test the effect of P4P for nursing homesby state Medicaid agencies. 2001-2009 MDS and OSCAR data were used to compare eightstates with P4P programs with 42 states and the District of Colombia without P4P. Stateswith P4P included Colorado, Georgia, Iowa, Kansas, Minnesota, Ohio, Oklahoma, and Utah.The review encompassed 17,579 nursing homes, of which 3,513 were in a state with P4P.P4P was found to be associated with decreased physical restraints, pain, and pressuresores. Unexplained weight loss and incidence of residents with a catheter reflected a smallincrease (0.2 percentage points). The results were the same two years after P4Pimplementation. Staffing measures (total staff and skilled staff hours per day) wereunchanged. Georgia’s program saw a consistent effect of P4P, with results in other statesinconsistent. These authors find “little evidence” to support the use of P4P (p. 1406). Indiscussing possible reasons for these findings, the researchers consider whether the choiceof targeting high-Medicaid facilities (which they speculate may be less able to improve dueto financial performance); the small incentive size; the payment of bonuses to facilitiesrather than individual staff or managers; and limitations of the research design werefactors. The authors conclude with stressing the need for careful design of P4P programsand considering combining P4P with other incentives (such as more frequent feedback andpayments), and larger financial incentives in future P4P programs.
One challenge to effective P4P program implementation is the potential for unintendedconsequences of the system. Arling et al. (2009) points out that a few of these consequencesinclude neglecting quality measures that are not incentivized through the system andfalsifying data and documents in order to receive financial incentives. These authorsrecommend involving key stakeholders in P4P system design and implementation, using aprocess to “strike a balance between diverse interests with everyone having a positive stakein the P4P system” (p. 591). They also endorse the use of credible, evidence-basedmeasures, a system that encompasses a range of quality issues, and ensuring wide access toperformance information for consumers and providers. The researchers suggest that statesshould assist providers to access the necessary tools and methods for improvement,provide sufficient financial incentives to offset the necessary financial investment, anddesign a system that stimulates improvement among providers at all levels of quality ofcare, from low to high performance. Further recommendations include that the P4P systembe placed in the context of an overall comprehensive approach to quality improvement, bevery transparent, be rigorously evaluated on an ongoing basis, and be continuouslymonitored so that negative or unintended consequences can be minimized.
Report to TennCare
16Technical Assistance
1 Minnesota is one of the states interviewed for this technical assistance project, and PIPP is described in more detail in that section.
Increasing Motivation for Improved Quality
While early large scale reviews of P4P programs have reported mixed results, three studiesshow more promising results when reviewing quality improvement efforts on a smallerscale. Rantz, Flesner, & Zwygart-Stauffacher (2010) used complexity science in a case studydesign to see if and how quality improvements could actually take place in a nursing home.This study showed that employing a process improvement team (PIT) with representationfrom all staffing levels, meeting regularly to brainstorm solutions to a quality improvementissue, training and mentoring the staff, and rewarding improvements in quality measuresled to a dramatic improvement in a clinical outcome related to bladder and bowelincontinence (Rantz et al., 2010). This study demonstrates some effective strategies forquality improvement and may be applicable in future quality improvement programs.
Similarly, Baier, Butterfield, Harris, & Gravenstein (2008) set out to evaluate relativeimprovement among nursing homes that set targets using the Nursing Home SettingTargets – Achieving Results (STAR) site for two quality measures. Quality measuresincluded physical restraints and pressure ulcers. Nursing homes that set a target had astatistically significant relative improvement on the targeted measure compared to nursinghomes that did not set targets. The authors point out that although the absoluteimprovement (less than 1% for each measure) is relatively small, if achieved in all nursinghomes nationwide, these improvements would benefit 45,000 residents who wouldexperience fewer pressure ulcers and restraints over the course of one year.
Evaluation of Minnesota’s Performance-Based Incentive Payment Program
A newly published article by Arling and colleagues (Arling et al., 2013) reviews Minnesota’sprovider initiated Performance-Based Incentive Payment Program (PIPP)1. The PIPP is analternative P4P approach that provides funding as providers select, design, and implement aquality improvement project. Minnesota allocates substantial funding to this prong of its P4Pprogram, about $18 million a year. Projects are funded through a competitive proposal process,in which facilities must provide evidence demonstrating the importance of the problem, thequality of the design, the potential for success of the initiative, and sustainability after fundingends. Projects range from one to three years. Quality of care was measured using MDS data andcompared 373 Minnesota nursing homes with PIPP projects (PIPP facilities) to 199 facilitieswithout projects (that either did not apply or were not funded). Baseline data was computedfrom 2007 data and evaluated through four rounds of funding ending in 2010. A compositequality score was calculated for all facilities using quality measurements from the dataset. Thetwo groups did not differ in their quality score, staff retention, or survey deficiencies beforePIPP, though PIPP facilities were more likely to be larger, non-profit, affiliated with a chain, andhad a higher case-mix acuity. PIPP facilities not only demonstrated a significantly higher qualityscore than the comparison group, they also had no decline in individual quality indicators,saw improvements in areas unrelated to the PIPP (had a generalized beneficial effect onquality), and sustained improved scores during 2010-13.
Report to TennCare
17Technical Assistance
These three studies suggest that, as Arling and colleagues (2013) point out, “local solutionscan foster innovation and increase motivation because providers initiate and control thequality improvement process” (p. 1632). As part of the Arling et al. (2013) study, interviewswere conducted with PIPP facilities, with the following result:
Project leaders and nursing home staff reported that PIPP project participation resultedin more attention to evidence-based practices; collection and analysis of data; focus onsystem-level change; improved teamwork and communication; and better relationshipsamong nursing home management, staff, residents and family members (p. 1636).
Similarly, Rantz et al. (2010) report that “improved working relationships between themembers” of the performance improvement team were noted by the onsite study staff (p. 5).Baier et al. (2008) note that “STAR appears to foster self-management, where staff follow theirnursing home’s performance longitudinally and derive reinforcement from watching theirquality measure performance improve relative to their peer’s performance” (p. 597).
The Future
The future of long-term care quality improvement and P4P system implementation is bothcomplicated and full of opportunities. There is a growing emphasis, particularly frompatients and family members, on culture change and resident-centered care (Miller et al.,2013). As this practice becomes more important and widespread, there will be a need toimprove upon current measures of consumer and family satisfaction. Currently, responserates to quality of life and satisfaction surveys are low. An exception to this is Minnesota,which employs an in-person survey with an 87% response rate (Arling et al., 2009). Otherconcerns for the future include involving all stakeholders in the entire P4P design,implementation, and monitoring process, equipping providers and managerial staff to makenecessary changes to improve quality, and designing a system that is accessible, honest, andopen to change (Arling et al., 2009).
Report to TennCare

18Technical Assistance Report to TennCare
Key Informant Interviews from Other States
States Interviewed
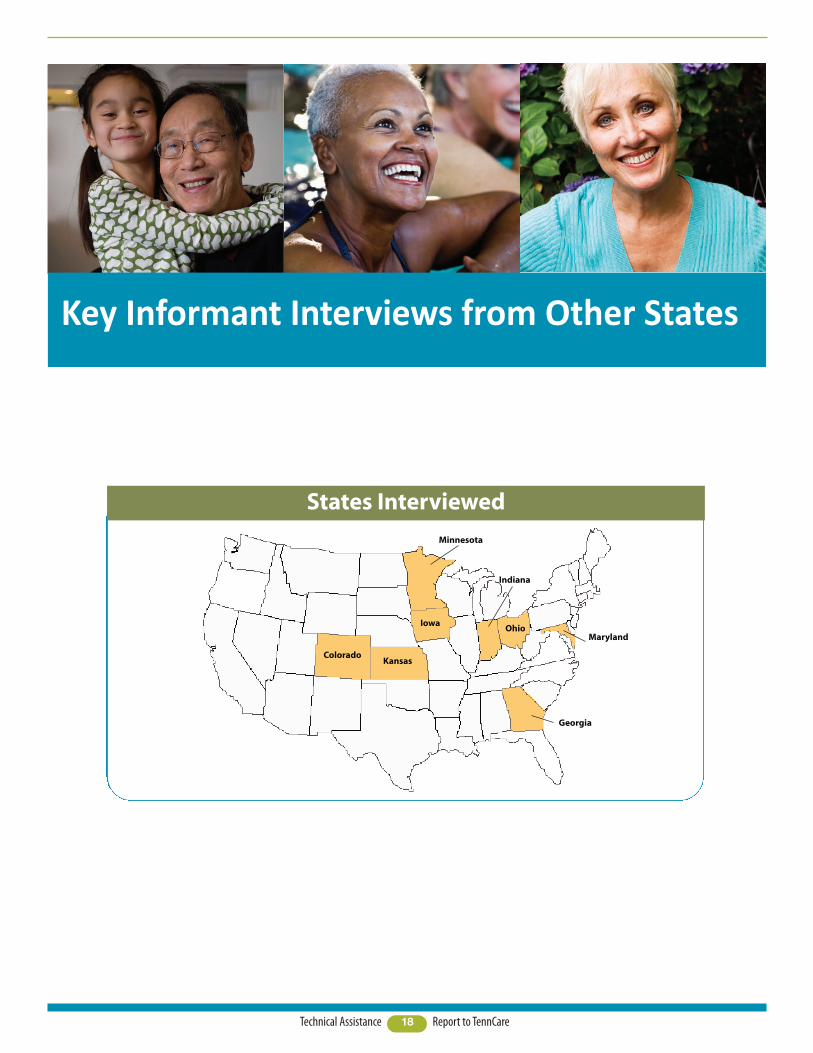
ColoradoKansas
Minnesota
Iowa
Georgia
MarylandOhio
Indiana
19Technical Assistance
Overview
Technical assistance to the QuILTSS initiative provided by Lipscomb University includedinterviewing key informants to discover best practices and lessons learned from qualityimprovement and Pay for Performance (P4P) programs in other states.
Eight of fifteen states identified in a 2011 review of nursing home value-based purchasingreview by National Research Corporation were interviewed. Generally, states with longerexperience in value-based purchasing were included for interviews. Key informants wereidentified as staff in the state Medicaid agency (or its equivalent) who were working withvalue-based purchasing or P4P in their state. These informants were contacted andinformed of the QuILTSS initiative, the RWJ award, Princeton University’s contract, andLipscomb’s role in providing technical assistance. Each informant was provided with a listof questions and was asked to identify materials for review in advance of the interview.
Each state was asked to provide both high level policy information and details on quality andvalue purchasing initiatives, measurement tools, data collection methods, size and structure ofincentives, funding mechanisms, stakeholder involvement, lessons learned, and whether anyformal evaluation was in place. It should be noted that while the interviews were structured interms of starting with the same set of questions, informants were free to respond to or expandon individual items and to include other information relevant to the topic.
States varied considerably in the amount of information and access to staff provided prior toand during the interviews; several states provided access for up to three participants on aconference call, while others included one responder. A number of interviewees were clearlypassionate about their state’s effort to improve the quality of Long Term Services and Supports(LTSS). In other states, informants were either less familiar or less engaged with the initiative.In one state, the initiative had been inactive for several years, and the informants had limitedinformation on details of how it operated and its results. This response variation may reflect thewide variety of staff roles represented in the respondent pool – from high-level policymakers toprogram administrators with direct operational responsibilities. This report is a compilation ofinterview responses and ancillary materials and is not intended to represent an exhaustivereport on each state’s value-based purchasing efforts.
We wish to thank all of the participants for their time, service to their respective states,generosity, knowledge, and willingness to share their learning with Tennessee. Allinformants expressed interest in and a desire for follow-up and access to the final report onthe technical assistance project for Tennessee.
As the interviews progressed, a number of themes repeated themselves beyond the contentof the questions. These themes relate to vision for the initiative, stakeholder input, time tomaturity of the effort, dynamic nature of the process, and measurement issues. Each ofthese themes will be explored briefly before proceeding to summaries of the interviews foreach state. These themes are consistent with other reviews of value-based purchasing andrepresent best practices and lessons learned from other states.
Report to TennCare
20Technical Assistance
Vision
Several states stressed that it is essential for the initiative to have a broad but clear visionof what the initiative seeks to achieve. In at least two states, this vision came from theGovernor’s office, as in one case, their Governor “announced we are going to have a reportcard. It wasn’t optional.” As an informant in another state put it, “…it’s about values, youhave to know what you care about.” Another summarized their vision search as, “Can wefigure out what we want [nursing home care] to look like, define what expectations do wewant our providers to fulfill, then create benchmarks and outcomes as a map, and pay forthose outcomes? It has to include a business model that will work for providers.”
Stakeholder Input
Whether the vision came from the Executive Branch, or as in other states, from advocacygroups or coalitions, each state interviewed stressed the importance of strategic, broad-based, inclusive, meaningful, and ongoing stakeholder input. Even in states where the chiefexecutive clearly initiated change, the advantages of a widely shared vision and plan wererepeatedly underscored. One interviewee praised the skill of the administration in her statein engaging and working with stakeholders, and the necessity of developing action stepsthat lead to a program which is “politically achievable.” In some states, this processincluded encoding the P4P or value-based reimbursement approach into statute, withcommittees composed of various stakeholders working alongside legislators to craft andrefine the legislation, and report on its implementation and progress.
Broad-based sources for input typically include associations representing both for-profit andnot-for-profit nursing facilities, ombudsmen, state agencies conducting Skilled Nursing Facility(SNF) and Nursing Facility (NF) surveys, advocates, and consumers. One respondent wishedthere had been even more consumer involvement, citing the impact of a particular consumer,who was wheelchair bound, on the discussion of pressure ulcers. The impact of her directexperience in dreading and avoiding this potentially life-threatening condition for her lent alevel of reality and authenticity to the debate about clinical measures.
Among the states interviewed, a common presence in stakeholder meetings anddiscussions is that of a respected university partner. As one state put it, the neutralexpertise of the academic institution “is a comfort to consumers” and “having ‘experts’helped lower resistance.” In these states, universities and other types of public and privatesector contractors also conduct family and consumer satisfaction surveys, prepare anddeliver provider training and technical assistance for culture change, review and scoreprovider quality incentive applications, and report on the overall initiative to the public andlegislature.
Report to TennCare
21Technical Assistance
Time to Maturity of Initiative
All states interviewed had invested considerable preparation before launching theirinitiative. Some states also noted that the system continues to evolve after implementation.Several states built upon longstanding data collection or initial quality improvement effortsthat dated back decades. Other states were in their second or third iteration of their qualityimprovement program. Stakeholder engagement involved taking up to a year or more tobring together everyone who needed to be engaged and working together to come tocommon definitions of the basic and key elements of the plan: defining quality, choosingmeasures, and building and funding the system of rewards.
As one high-level policy maker reflected, “It’s hard to rush this stuff.” His advice: put forth aproposal or concept, gather lots of input and give lots of room for discussion anddisagreement, and develop a good strong work plan. But, at some point, he noted, “you haveto do it.”
Dynamic Nature of Defining, Measuring, and Rewarding Quality
One of the questions in the interview concerned whether measures had changed over time.Every state reported some modifications and adjustments to the original effort, but beyondthat, most described a dynamic process of establishing benchmarks, testing how thebenchmarks themselves performed in improving quality and achieving desired changes, andthen improving the quality of the quality improvement system itself in an ongoing, iterativeprocess. One state meets every other year to review the status of the program and recommendchanges to the legislature for the program’s following two years (since the program is codifiedin statute). It is felt that this ongoing review contributes significantly to the success andacceptance of program by stakeholders. As two interviewees observed, “it [qualityimprovement] is definitely an evolving process” and it “takes constant attention” to keep itmoving forward.
Measurement Issues
A key issue for all states to resolve and refine in these efforts is the definition and measurement ofquality. States report that a clear vision for the goals of the quality initiative and substantial andsubstantive stakeholder input provides support for a successful quality measurement framework.
A prime consideration in choosing measures is the utilization of data which is alreadyavailable and which does not impose an additional burden on providers. At least two stateshad statutory directives to minimize the impact of data collection on NFs in their qualityinitiatives. States achieved this goal through thoughtful and strategic use of the Minimum DataSet (MDS), (including the section called Quality Measures (QM)), existing provider reports oncosts and staffing, survey results, and in some cases especially with early initiatives, indicatorsof efficiency and fiscal management. As some states moved into measures of culture change,satisfaction surveys and other measures were developed, but with careful planning to avoidplacing an additional burden on providers. At least two states utilized an outside contractor toconduct independent consumer and client satisfaction surveys. While this raised concernswith providers, it also minimized additional work. Other new measures, when needed, havebeen structured so that data collection is “super easy” for providers.
Report to TennCare
22Technical Assistance Report to TennCare
Measurement issues also seemed to be at least partly behind the exclusive focus on NFs forvalue-based purchasing in the states interviewed. One state had plans to begin formulatingmeasures for Home and Community Based Services (HCBS), but had not yet begun. As oneinformant from that state pointed out, the pool of entities covered expands from the hundredsfor NFs to the thousands for HCBS providers, and in addition “Nursing Facilities have a hugehead start [in data collection] with the Minimum Data Set.” Differences in how HCBS providersare regulated is also a complication, as is the lack of readily available reviews of the servicesthemselves.
One other issue common across states on measurement is the need to coordinate thequality improvement process with the independent facility survey process. Many statesincluded the survey agency in their stakeholder groups, and others meet frequently toensure that the directives from the survey agency do not inadvertently conflict with thoseof the quality improvement program. This was particularly true in states where culturechange is a primary focus. One state highlighted their challenge to work with surveyors tounderstand how a person (consumer) centered culture is consistent with currentregulations, though these are primarily based on a medical model. This kind of support iskey to a successful effort by providers to change the culture of their facilities.
The following is a brief summary of each state’s initiatives and highlights of their lessonslearned.

23Technical Assistance Report to TennCare
The Quality of Life Domain is primarily targetedto culture, and measures include:
� Resident-Centered Care and Activities
o Enhanced diningo Flexible and enhanced bathingo Daily scheduleso End of Life Program
� Home Environment
o Resident roomso Public and outdoor spaceo Overhead pagingo Communities
� Relationships with staff, family, resident,
and communityo 50% consistent assignmentso 80% consistent assignmentso Internal communityo External communityo Daily living environmento Volunteer program
� Staff Empowerment
o Care planningo Career ladders/career pathso Person-directed careo New staff program
The Quality of Care Domain is distributedacross measures of:
� Direct caregiver continuing education
o 12 hours continuing educationo 14 hours continuing educationo 16 hours continuing education
� Participation in Advancing Excellence in
America’s Nursing Homes or equivalent
� MDS measures
o Falls with major injuryo Moderate/severe paino High risk resident with pressure
ulcerso UTIo Reducing rehospitalizationso Antipsychotic medication
� Facility management
o 5 or 10% Medicaid above stateaverage
� Staff stability
o Staff retention rateo Staff retention improvemento Director of Nursing retentiono Nursing Home Administrator
retentiono Employee satisfaction survey
response rate
Colorado
Colorado’s P4P program dates from 2009. A 100-point scale is used which covers two domains:Quality of Life and Quality of Care. Thirty measures are used to score these two domains, which areworth up to 50 points each. According to how many points are scored, providers receive anincentive in addition to the base rate. Incentives range from $1-$4 per resident per day dependingon total number of points earned. The program is voluntary, and over half of the 219 nursingfacilities in the state participate.
To participate in the program and qualify for the additional funding, each NF completes anapplication. In this application, the NF chooses the measures upon which it bases its request. NFsmust score a minimum of 21 points to receive P4P funding. Colorado contracts with Public ConsultingGroup (PCG) to review, evaluate, and validate the nursing homes’ applications to the P4P program.PCG is also responsible for developing and implementing the evaluation tool used in the program’sscoring system, and for providing an annual written report on the program.
Colorado reports that culture change in that state is stimulated by a large culture changemovement, spearheaded by the Colorado Culture Change Coalition. In addition, Colorado alsobelieves a focus on aggregate data at a state level – rather than facility by facility – might promotemore system change. Colorado also observes that its program may provide an advantage to facilitiesthat are doing well, with less effect on those which are already behind.

24Technical Assistance Report to TennCare
Georgia’s Quality Improvement Initiative Program was first initiated in 2003, and fully in place by2005. It began with a 1% incentive, with a second 1% incentive added beginning in fiscal year 2009.The program is voluntary and requires enrollment by the NF. NFs which are designated as a SpecialFocus Facility by the Centers for Medicare & Medicaid Services (CMS) are not eligible for theincentive payment until certain conditions have been met.
Georgia’s NF per diem has the following components:Case mix index – computed on average Resource Utilization Group (RUG) scoresAllowed per diem – usually calculated from the facility’s cost reportAdd-ons – which include a staffing incentive, cognitive impairment compensation, and the quality
improvement program incentive. This includes both clinical measures and non-clinical measures.
The staffing incentive computes nursing hours per patient day and rewards 2.5 nursing hours per dayor greater with a 1% increase in the Routine Services rate component. Participation in the QualityImprovement Program is required.
The Cognitive Impairment Compensation is based on the Brief Interview for Mental Status scores ofresidents, with qualifying scores receiving a 1-4.5% increase to the routine services rate component(participation in the Quality Improvement Program required).
The Quality Improvement Program Incentive awards one point for each quality measure in excess ofthe Georgia state average. Three points earned (minimum of one point from the clinical domain, andone point from the non-clinical domain with the remaining point from either area) qualifies thefacility for a 1% increase to the Routine Services rate component. A second 1% is available tofacilities which earn a minimum of three points in the clinical domain and one point in the non-clinical domain, with the remaining two points from either area.
Georgia

25Technical Assistance Report to TennCare
Georgia’s program is credited with having established expectations and a good foundation forquality improvement efforts. Its program is longstanding and has been widely recognized. Ensuringthe incentives are based on objective data is considered a challenge in this state.
Georgia continued
Georgia’s clinical measures are as follows (eachmeasure is worth 1 point):
� Percent of high-risk long-stay residents
who have pressure sores
� Percent of long-stay residents who were
physically restrained
� Percent of long-stay residents who have
moderate to severe pain
� Percent of short-stay residents who had
moderate to severe pain
� Percent of residents who received
influenza vaccine
� Percent of low-risk long-stay residents
who have pressure sores
NFs that do not generate sufficient data toreport through CMS use the following measuresfrom the Quality Value Profile generated by thecontractor My InnerView:
� Chronic care pain – residents without
unplanned weight loss/gain
� PAC pain – residents without acquired
pressure ulcers
� High-risk pressure ulcer – residents
without acquired pressure ulcers
� Physical restraints – residents without
acquired restraints
� Vaccination – flu – residents without
falls
� Low-risk pressure ulcer – residents
without acquired catheters
Non-clinical measures are as follows (eachmeasure is worth 1 point):
� Participation in Employee Satisfaction
Survey
� Most current Family Satisfaction Survey
score for “Would you recommend thisfacility?” is 85% or greater responseseither “excellent” or “good” combined
� Quarterly average for nursing staff
stability (retention) meets or exceedsstate average
� Quarterly average for CNAs/NA stability
(retention) meets or exceeds stateaverage
26Technical Assistance Report to TennCare
Nursing Facilities (NFs) can receive up to $14.30 per day as a quality add-on to the their per diemrate (the average is 4.9%). While NFs submit annual cost reports, the NF rate changes quarterly toincorporate updated Minimum Data Set (MDS) information. Initially, the quality add-on wascalculated exclusively from Nursing Home Report Card Scores received from the Indiana StateDepartment of Health (ISDH). Indiana is now transitioning to a Nursing Facility Total Quality Score.The following components comprise the total NF quality score:
1. Nursing Home Report Card Score2. Normalized weighted average nursing hours per resident day3. RN/LPN retention rate (Registered Nurse/Licensed Practical Nurse)4. CNA retention rate (Certified Nurse’s Aid)5. RN/LPN turnover rate6. CNA turnover rate7. Administrator turnover8. Director of Nursing turnover
In 2013, Indiana implemented a resident, family/friend, and employee satisfaction survey. Thesurvey was administered to all NFs enrolled in the Medicaid program and surveyed all residentswho passed a cognitive screening tool regardless of payer source (Medicare, Medicaid, or privatepay).
Press Ganey was selected as the satisfaction survey contractor (www.pressganey.com). Results fromthe three surveys had been disseminated to the NF industry at the time of this interview. Whilemany states may be unsure if their efforts produce substantive changes in NF quality indicators,Indiana has seen a dramatic improvement in NF Report Card Scores. The ISDH’s report reflects thatscores have improved on surveys. In addition, extensive collaboration between ISDH and the Officeof Medicaid Policy and Planning (OMPP) and the Division of Aging (DA) has resulted in NF surveysthat are more focused on quality.
Indiana also emphasizes the importance of avoiding a government-down approach, stressing theneed for stakeholder engagement and the necessity of involving university partners and otherstakeholders to ensure the formation of a group of constituents that is as diverse as possible.Indiana believes in this approach, along with maintaining the longstanding and professionalrelationships the DA and the OMPP have with the NF industry and NF associations.
Indiana
27Technical Assistance Report to TennCare
Quality of life:Subcategory: Person-directed care
� Enhanced dining
� Resident activities
� Resident choice
� Consistent staffing
� National accreditation
Subcategory: resident satisfaction
� Resident/family satisfaction survey
� Long-term care ombudsman (complaint
rate)
Quality of care:Subcategory: survey
� Deficiency-free survey
� Regulatory compliance with survey (no
on-site visit required for recertificationor complaint)
Subcategory: staffing
� Nursing hours provided
� Employee turnover
� Staff education, training, and
development
� Staff satisfaction survey
Subcategory: nationally reported quality
measures
� High-risk pressure ulcer
� Physical restraints
� Chronic care pain
� High achievement of nationally reported
quality measures
Access:
� Special licensure classification (licensed
for care of residents with chronicconfusion)
� High Medicaid utilization (at or above
state median plus 10%)
Efficiency:
� High occupancy rate
� Low administrative costs
Iowa
While Iowa’s staff was most responsive and cooperative, the interview revealed that Iowa’s initiativewas defunded several years ago. Iowa is currently focused on the creation of an Accountable CareOrganization through a System Improvement Grant the state is seeking from CMS. Through this neweffort they seek to establish care coordination at a systemic level, which takes the whole person intoaccount. In addition, Iowa is working on its expansion of Medicaid. Even though the quality program isin statute, there are no plans to revive it at this time. Since Iowa’s program was the initial basis forOhio’s effort, a summary of its P4P program as codified in statute is included.
The benchmarks in Iowa’s program include characteristics in four domains: quality of life, quality ofcare, access, and efficiency, as follows:
28Technical Assistance Report to TennCare
Kansas described their culture change efforts as multi-pronged and multi-faceted – and not allunder one umbrella. This presents both advantages and challenges. The Kansas initiative is namedPEAK – Promoting Excellent Alternatives in Kansas Nursing Homes.
PEAK has been in existence in Kansas for about 15 years. The program evolved from a voluntary andcompetitive recognition program into a P4P/incentive program in 2012. Kansas is in the process ofmaking programmatic changes that are scheduled to be implemented July 1, 2014.
Initially there was resistance to PEAK, as NFs feared it would prove to be too costly. The departmentreported spending a great deal of time in dialogue with the facilities, and subsequently de-emphasizedthe necessity of physical plant changes and large capital investments. Staff also located anddisseminated research and information from Advancing Excellence in America’s Nursing Homes, whichdemonstrated how improved quality could lower NF costs and address the rising expectations ofMillennials and Generation Xers, who are making decisions about care for their parents. Kansas has lotsof small caregivers that still find PEAK to be a challenge, but the program is gaining acceptance.
Another support for PEAK is that Kansas has transitioned to managed care, and the managed careorganizations (MCOs) are responsible and accountable through their performance measures toincrease the number of NFs participating in PEAK. The MCOs are expected to work with theleadership of the NFs to encourage change and to provide additional incentives through their rates.The Kansas State University Center on Aging has also been a very important resource for PEAK 2.0.
Under the PEAK program, facilities must submit a detailed application indicating which level of theprogram they are applying for, and include documentation of their achievement. There are 5 levelsof performance:
1. Pursuit of Culture Change 2. Culture Change Achievement3. Person-Centered Care Home4. Sustained Person-Centered Care Home 5. Person Centered Care Mentor Home
Site visits are conducted by state staff, along with the ombudsman’s office, Kansas State University,and the University of Kansas Medical Center, in 3 person teams.
Incentives range from $0.50 per day to $4.00 per day and are added on to the base rate. There is alsoan incentive factor for efficiency, from 0-$7.50 per day. In spite of the relatively small incentiveamount, Kansas advised that even $0.50 per day is “huge” for some facilities. Facilities must reapplyand re-qualify to advance along the continuum of levels and to maintain their add-on. This leads to achallenge, as once earned, the add-on becomes expected, and there is disappointment when it is lostif performance is not maintained.
Kansas was surprised at the level of response to the initial round of applications for P4P. The goalduring year one was to engage one-third of NFs. The response, however, was much higher than thetarget, as 172 facilities applied. At the time of the interview, 142 NFs are participating and 37 morewill soon be added.
A challenge PEAK faces is the coordination of Person Centered Care (PCC) within the medical model,which dominates nursing home regulations. The Kansas Department of Aging and DisabilityServices (KDADS) works closely with surveyors to ensure that PCC is consistent with regulations, inorder to avoid inadvertently penalizing a facility in their survey for taking initiatives KDADSencourages as part of PCC.
Kansas
29Technical Assistance Report to TennCare
Maryland’s P4P program is two-pronged, and rewards both absolute quality and quality improvement. EligibleNFs are those with more than 45 beds that score within acceptable quality parameters on surveys.The following reflects the scoring items and weights:
� Maryland Health Care Commission Family Satisfaction Survey (40%)� Staffing levels and Staff stability in Nursing Facilities (40%)� MDS Quality Indicators (16%)� Employment of Infection Control Professional (2%)� Staff Immunizations (2%)
The highest scoring facilities representing the top 35% of eligible days of care receive a quality incentivepayment. Selecting the top 35% for incentive payment targets the highest performers. Payments range from$2.57- $5.14 per Medicaid patient day. In addition, facilities that do not receive a P4P incentive but whose scoreshave improved from the previous year are eligible for $0.46 - $0.92 per Medicaid patient day.
Data are also scored for facilities that are not eligible for P4P in order to provide performance feedback.
Although elements of the Maryland initiative have been in place for many years and predate the current P4Pprogram, the current initiative began in 2007. The legislature created a “Quality Assessment” (QA) as amechanism to restore funding to NFs which had previously been reduced, with part of the new revenuegenerated earmarked for rewarding quality. The funding pool for P4P still derives from the QA and is capped atone-half of one percent of the budget for nursing home care.
Maryland reported that measurable results have been challenging to demonstrate due to the P4P scoringsystem. However, with two years of payment data and about four years of overall data, Maryland believes thereis sufficient material for an analysis of the effects of P4P. Data analysis in Maryland is performed by the HilltopInstitute (http://www.hilltopinstitute.org).
Maryland
30Technical Assistance Report to TennCare
Maryland reports satisfaction with the design of their P4P program. For example, their model includes a goodbalance and mix of indicators and includes satisfaction levels, staffing, MDS, and survey results, along with aunique incentive for employing an Infection Control professional. Maryland believes these are the indicatorswhich are most relevant to ensuring quality, and anecdotal results support this belief. Maryland also cited theimportance of selecting objective and reliable measures to support the credibility of the program. Culturechange measures were considered for the scoring system but ultimately were not included due to the lack ofreliable measures in that area.
An anecdotal example of the program’s success concerns data quality. Over time, providers have come tounderstand that failing to submit accurate data to the Department has financial consequences, as this data isused to calculate scores and resulting payments. This realization has produced improved quality of data, asproviders take more care, for instance, with staff assigned to complete the wage survey.
Another strength of Maryland’s program design is that it is built on existing data collection systems. Wage data,for example, had been collected for many years because it was used to calculate differential rates for the nursingservice portion of the rate. This meant that staffing levels could be measured against acuity of services. Underthe new P4P system, length of service became a factor, which represented a new data set. Building on theexisting data collection system allowed for a simple solution of adding a field for date of employment so lengthof services could be incorporated into the data collection system.
Similar to Colorado, Maryland believes that the newly created Maryland Culture Change Coalition will bringstakeholders together to promote culture change in NFs and to urge the inclusion of culture change measures inthe P4P program. Maryland is considering the CMS Artifacts of Change tool(http://www.pioneernetwork.net/Providers/Artifacts/) as a potential part of the measurement system.
Maryland expressed satisfaction with their consensus building process and did not recommend changes to theirapproach to encouraging stakeholder buy-in. A workgroup was formed, which met for a year or more, with a crosssection of NF providers/representatives, plus Voices for Quality Care (an advocacy organization), Office ofHealthCare Quality (the survey organization), the HealthCare Commission, (a unique resource in Maryland,described below), budget staff and others. After achieving a working consensus on the standards, the groupcontinued to meet with the contractor as the statistical analysis for scoring was being designed and modeled. Apart of this involved numerous presentations to the broader stakeholder group on how the scoring system wouldwork and a great deal of discussion as it was being developed.
The Maryland HealthCare Commission is a merged entity, under the Maryland Department of Health andMental Hygiene (DHMH) for administrative purposes, but is independent from both DHMH and theMaryland Department of Human Resources. The Commission is appointed by the Governor, and is both aregulatory and an advisory Commission. It formed from the merger of the healthcare planning entity(which for example, issued Certificate of Need for NFs) and another group formed to deal with Maryland’shealthcare reform efforts of 20 years ago, and is a real resource in Maryland on health issues, as it is acredible, and longstanding entity in the state.
Maryland continued
31Technical Assistance Report to TennCare
Minnesota stands out from other states in their approach to LTSS, which is administered by the MinnesotaDepartment of Human Services. Ranked first in the nation by AARP’s State Scorecard on Long-TermServices and Supports, its performance outdistanced all other states, with 15 of 25 indicators in the topquartile and 11 among the top five. The AARP Case Study on Minnesota points out several features uniqueto this state, such as:
� A mature LTSS system with the majority of the spending balanced toward home and community
based services (HCBS)
� A statewide managed care system which incentivizes the use of HCBS, and ensures those seeking
admission to a nursing home receive an assessment and information about all available options
� Collaboration between state officials and consumers and other stakeholders
� Public disclosure of quality measures through the Nursing Home Report Card and performance-
based incentive payment program
� Emphasis on advance planning for the demographic shifts of the aging population, which began as
early as 1988
� A “rate equalization” policy (unique in the country) which prevents nursing homes from charging
private-pay residents more than Medicaid rates for those sharing a room
� Public policy support, through public education and tax incentives, of long-term care insurance
and planning for its residents regarding their long-term care needs
� Widespread and population level provision of extensive information on LTSS to Minnesotans,
accomplished through its long-term care consultation service, the Minnesota Help Network, andconsistent screening of all older adults enrolled in a managed LTSS plan
There are at least two programs in Minnesota to incentivize improvements to the quality of care in nursinghomes. One is directly tied to payment, while the other is indirectly tied. These two approaches weredescribed as related, and they are a part of an overall strategy.
The first step was to establish an overall measurement system and share the results with NFs, so theycould benchmark against themselves and each other. With this effort, the state was attempting toinstantiate a process improvement culture in care centers, in a positive way.
The first program is the Minnesota Nursing Home Report Card (MNHRC). Participation in this program ismandatory and the program began in 2004 with Governor Pawlenty’s announcement of the new initiative.The website for the Report Card was launched in 2006. It provides a searchable database of information onquality measures in every nursing home across the state. Users can choose which measures are of greatestinterest and have their results sorted by those domains and geographic location of facility. Or, they cansearch by location and receive information on quality measures for the facilities in their target location.The information is very current; based on reports from 2012 and (at the time of the interview) as recent asJuly 8, 2013. Minnesota reports the site boasts fairly robust traffic (about 2500 visits a month) but is awarethat much of that traffic may reflect Department staff and provider use.
The measures were designed to minimize additional data collection burdens on providers. All measuresare already collected for other purposes, with the exception of the Resident Quality of Life Ratings. Theseratings are developed from on-site interviews with residents, which are conducted by a third partycontractor (Vital Research in Los Angeles – www.vitalresearch.com). Minnesota’s reliance on measuresthat are currently available also contributes to a very low cost of administration for the program.
Minnesota
32Technical Assistance Report to TennCare
Minnesota continued
The quality measures tracked by the MNHRC are as follows:
� Resident Quality of Life Ratings
� Minnesota (Risk-Adjusted MDS) Quality Indicators
� Hours of Direct Care
� Staff Retention
� Temporary Staff Use
� Proportion of Single Rooms
� State Inspection Results
Each nursing home can receive from one to five stars on each measure.
As opportunities arise, the department seeks legislative appropriations for increased rates in NFs. Mostrecently, the rate increase was 5%, with 3.75% allocated for across the board increases to all facilities andthe remaining 1.25% accessible as a quality add-on. Facilities receive the quality add-on when fundsare available according to their performance on the MNHRC, based on three of the seven report cardmeasures, Resident Quality of Life Ratings, Minnesota (Risk-Adjusted MDS) Quality Indicators, andState Inspection Results. This increase then becomes an ongoing addition to the facility’s base rate.
The second P4P mechanism is the Performance-Based Incentive Payment Program, or PIPP. This initiativelaunched in 2005. In contrast to the MNHRC, which covers all facilities, participation in PIPP is voluntaryand competitive. PIPP is funded by an annual appropriation of the legislature, with approximately $18-20million in total spending per year. Individual facilities submit a competitive and detailed application forPIPP, in which they must describe the area targeted for improvement. An improvement target is set whichthe NF is accountable to attain during the funding period. This approach allows even lower performing NFsto benefit from participation, as improvements can be narrowly targeted and still qualify.
Facilities must agree to share their learning and frequently make presentations at state and nationalworkshops and conferences related to their initiative. Facilities may collaborate in their applications, butrate increases are awarded individually. Facilities receive a rate increase of up to five percent for theduration of the project, which can be for one, two, or three years. Through this program, the Departmentseeks to leverage change with both participating and nonparticipating providers.
The Department described one initiative funded by PIPP, which was a fairly large collaborative of facilitiesworking to reduce falls. The approach included the use of root cause analysis to determine the causes offalls, and the results led to changes in several different areas of NF operations. For example, it wasdiscovered that nursing staff entering rooms at night disrupted sleep – which was not a surprise. This lackof sleep led to residents who were drowsy throughout the day and prone to falling asleep and falling fromtheir chairs. More surprising was the discovery that even entering the resident’s room with a flashlight stilldisturbed sleep – unless the flashlight had a yellow or red light, which did not have the same disruptiveeffect on the brain or sleep.
Although PIPP allows for narrowly targeted performance improvement targets, the program still posessignificant barriers to entry for a number of providers. One fourth of Minnesota’s nursing homes havenever participated in a PIPP during the eight years of the program. This is due to the fact that thecompetitive application process requires a great deal of resources for the necessary root cause analysis andstudy required to accurately identify the area in need of improvement. Accuracy in problem identificationand target setting is important; if a facility is awarded a PIPP project and fails to achieve the targetedimprovement, it incurs financial penalties.
33Technical Assistance Report to TennCare
Minnesota continuedFor this reason, the Department is developing a new program that will make it easier for lowerperforming facilities to qualify for quality incentives. Under this program, which is targeted for launchon October 1, 2015, each NF will elect one area for improvement in one of the Quality of Life domainsor Minnesota Quality Indicator measures. The goal will be to increase performance over baseline byone standard deviation from the baseline or to the level of the 25th percentile, whichever is greater.Based on achievement of the targeted improvements, facilities will receive payments commensuratewith their progress on the targeted measure.
This new policy highlights a key choice in P4P program design: whether to incentivize NFs with the highestquality performance, sometimes called absolute quality, or whether to target and reward NFs with thegreatest improvements in quality (as scored by the program). While compatible, the two approaches dodiffer, and each offers advantages.
In Minnesota, the Report Card incentivizes high quality performance, and the highest performers arerewarded when quality add-on funding is available. The PIPP incentivizes quality improvement, but thecompetitive and resource intense nature of the application process may exclude lower performingfacilities. The new program is intended to make rewards for improvements in quality more accessible forall facilities.
While the P4P system in Minnesota is well developed for NFs, the state is just beginning its efforts toreward quality in HCBS. A program patterned on the MNHRC and PIPP is under development incollaboration with stakeholders. Last year the department proposed legislation to replicate the MNHRCand PIPP with HCBS.
The Department pointed out several considerations with HCBS which pose challenges to theimplementation of quality reporting for these services. First, HCBS encompass both older adults and adultswith disabilities, which brings a new set of factors and dynamics to the services and measuring theirsuccess. Next, the scale of the effort is multiplied by the number of HCBS providers. In any state, there aretypically hundreds of NFs versus thousands of providers of HCBS. And finally, NFs have a long head start onmeasuring quality due to years of collection of data through the MDS. Clinical indicators are therefore notas readily available for HCBS and do not necessarily encompass indicators related to quality of life that arehighly valued. In addition, regulation of HCBS providers in Minnesota is not as process oriented or astimely as it is for NFs. The Department of Human Services is working with the Department of Health aswell as with legislated advisory committees and task forces that are assigned the role of assisting thedepartment with improving quality to develop more resources and strategies to address underperformingHCBS providers and to replicate quality measures with appropriate adjustments for HCBS services.
In identifying what is working well, Minnesota described the PIPP and the MNHRC as successful. Also citedwas broad collaboration across a diverse array of stakeholders, which allows for the development offunctional consensus among those with divergent viewpoints, who are united in their commitment toimprove quality. Minnesota pointed out that in these forums, it is important to identify both areas ofagreement and disagreement – and to allow for discussion of both. Minnesota believes quality is a topicthat has brought people together in their state. These informants stressed that supporting improvementsin quality is an ongoing and continuous process of negotiations, that there are always differing opinionsabout new money and new measures, and that the program requires constant attention to continue tomove forward.
There was considerable initial resistance to the notion of the state measuring and publicizing quality innursing facilities. Some NF providers resisted what was seen as state intervention, believing instead thatconsumers should consult the provider directly if there were questions or concerns about quality. At one

34Technical Assistance Report to TennCare
Minnesota continued
point, consumer advocates formed a coalition with labor in order to advocate for increased funding to godirectly to improve staffing in facilities. However, through a collaborative and inclusive process thatencompassed academia, providers, advocates, and others, a great deal of progress has been made. Therehas been such a dramatic shift in this perspective that some providers now express surprise when hearingwhat the initial resistance was like. This shift may be due to the role that the Department defined for itselfas a support and a resource for NFs as they sought to improve quality. Though at first it was difficult toestablish a level of trust and confidence, the state targeted its interaction with NFs in a way thatcommunicated the message “identify how you want to improve – and we will help you do that.”
Key lessons learned in Minnesota include the importance of having a good work plan, being inclusive, andallowing enough time for the process to develop. One informant observed that “It’s hard to rush this stuff.You have to put it out there and give people time to react and work through it. It’s hard to bring everybodyalong.” It is necessary to involve experts, consultants, and stakeholders, and to take time for everyone todefine together essential program elements, such as how quality will be measured and how adjustmentswill be made for different levels of care and risk. While Minnesota believes it is possible to launch aprogram in less than the six or seven years it took for them to develop their first report card, it alsocautions against unrealistic expectations that can lead to rushing the process.
On the other hand, Minnesota also pointed out that after discussion and planning, it is also important toact: “At a certain point in time you have to do it. Realize the world doesn’t end. The Report Card did not putanyone out of business. But it did foster healthy competition and accountability, as Boards of Directors andCounty Commissioners wanted to know why their facility’s scoring wasn’t as high as others.”
One final challenge Minnesota highlighted is the challenge of marketing the MNHRC and its website topotential users. While a general marketing approach would require considerable resources and may yieldlimited results (since the general public is not interested in nursing home quality), a targeted approachcould put the information in the hands of consumers when it is most needed: at the time of makingdecisions about care for a loved one.

35Technical Assistance Report to TennCare
Ohio
The roots of Ohio’s P4P program trace to the passage of the 2006-07 budget by the Ohio GeneralAssembly, which provided for Ohio’s initial transition to price-based reimbursement and includedprovisions for a P4P program. The transition to price-based reimbursement was not without controversy.
Ohio’s early P4P efforts were loosely based on Iowa’s program, which focused more on efficiencyand fiscal indicators than on measures of quality of care provision, though some staff indices wereincluded, such as retention and turnover. However, Ohio was not entirely satisfied with thatincentive system, and in addition was observing wide price variations among facilities, even withina geographic peer group. Ohio therefore was interested in addressing both the variation in ratesand incentives for quality. The Ohio Medicaid program has strong leverage to influence both qualityand price due to the fact that Medicaid comprises 65-70% of the nursing home market, with 925 of960 total nursing homes in the state participating in the Medicaid program.
In 2011, a new gubernatorial administration took office with what was described as a “real vision”for reviewing what the state was paying for LTSS and ensuring consumers were getting value forthose expenditures, along with access to quality LTSS across the continuum. The state also wantedto impact the manner in which care was provided and shift from primarily financially basedperformance incentives to a more resident-centered quality of care approach. The Governor’s Officeissued guiding principles for the development of the new P4P system.
The P4P program is called the Ohio Long Term Care Quality Initiative. Along with the Governor’sguidelines, Ohio incorporates and presents its quality improvement initiatives based on EverettRogers’ Diffusion of Innovations, the seminal book on how and why new information is spreadthrough cultures. Assistance for understanding and implementing each measure is broken downinto Rogers’ five attributes of innovation:
� Relative Advantage - The degree to which an innovation is perceived as better than the
idea or practice it supersedes.
� Simplicity - The degree to which an innovation is perceived as simple to understand, apply,
and use.
� Compatibility - The degree to which an innovation is perceived as being consistent with
the existing values, experiences, beliefs, needs, and practices of potential adopters.
� Trialability - The degree to which an innovation can undergo a trial and be tested on a
small scale.
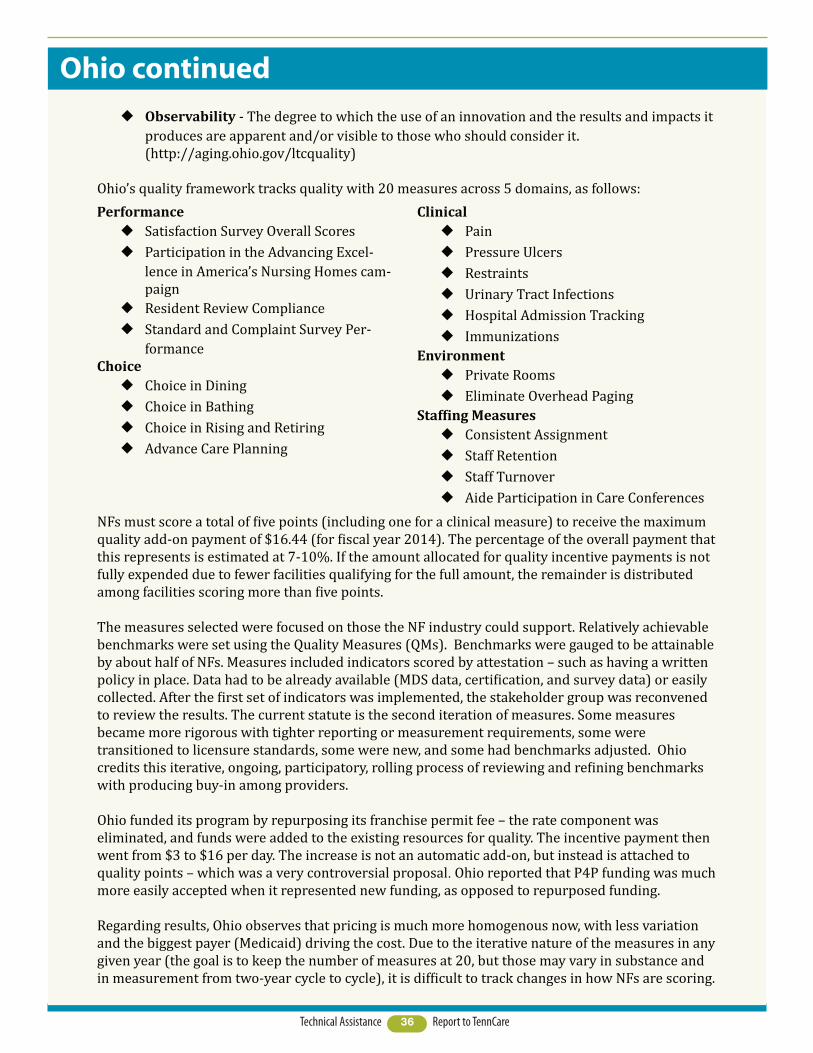
36Technical Assistance Report to TennCare
Ohio continued
� Observability - The degree to which the use of an innovation and the results and impacts it
produces are apparent and/or visible to those who should consider it.(http://aging.ohio.gov/ltcquality)
Ohio’s quality framework tracks quality with 20 measures across 5 domains, as follows:
NFs must score a total of five points (including one for a clinical measure) to receive the maximumquality add-on payment of $16.44 (for fiscal year 2014). The percentage of the overall payment thatthis represents is estimated at 7-10%. If the amount allocated for quality incentive payments is notfully expended due to fewer facilities qualifying for the full amount, the remainder is distributedamong facilities scoring more than five points.
The measures selected were focused on those the NF industry could support. Relatively achievablebenchmarks were set using the Quality Measures (QMs). Benchmarks were gauged to be attainableby about half of NFs. Measures included indicators scored by attestation – such as having a writtenpolicy in place. Data had to be already available (MDS data, certification, and survey data) or easilycollected. After the first set of indicators was implemented, the stakeholder group was reconvenedto review the results. The current statute is the second iteration of measures. Some measuresbecame more rigorous with tighter reporting or measurement requirements, some weretransitioned to licensure standards, some were new, and some had benchmarks adjusted. Ohiocredits this iterative, ongoing, participatory, rolling process of reviewing and refining benchmarkswith producing buy-in among providers.
Ohio funded its program by repurposing its franchise permit fee – the rate component waseliminated, and funds were added to the existing resources for quality. The incentive payment thenwent from $3 to $16 per day. The increase is not an automatic add-on, but instead is attached toquality points – which was a very controversial proposal. Ohio reported that P4P funding was muchmore easily accepted when it represented new funding, as opposed to repurposed funding.
Regarding results, Ohio observes that pricing is much more homogenous now, with less variationand the biggest payer (Medicaid) driving the cost. Due to the iterative nature of the measures in anygiven year (the goal is to keep the number of measures at 20, but those may vary in substance andin measurement from two-year cycle to cycle), it is difficult to track changes in how NFs are scoring.
Performance
� Satisfaction Survey Overall Scores
� Participation in the Advancing Excel-
lence in America’s Nursing Homes cam-paign
� Resident Review Compliance
� Standard and Complaint Survey Per-
formanceChoice
� Choice in Dining
� Choice in Bathing
� Choice in Rising and Retiring
� Advance Care Planning
Clinical
� Pain
� Pressure Ulcers
� Restraints
� Urinary Tract Infections
� Hospital Admission Tracking
� Immunizations
Environment
� Private Rooms
� Eliminate Overhead Paging
Staffing Measures
� Consistent Assignment
� Staff Retention
� Staff Turnover
� Aide Participation in Care Conferences

37Technical Assistance Report to TennCare
Stakeholder Input
Introduction
In order to provide opportunities for input regarding the QuILTSS initiative, TennCare andLipscomb University jointly hosted, and Lipscomb University facilitated, variousstakeholder processes. Self-report data was gathered from consumers and providers via anonline survey and a series of statewide QuILTSS Community Forums. The goal was toidentify which indicators are most important to the various constituencies in long termservices and supports (LTSS), with particular emphasis on the perspective of carerecipients. Additionally, discussions with providers and provider organizations were heldto elicit input on topics ranging from quality indicators to implementation and funding.
Community Forums
Eighteen Community Forums were held across Tennessee during the time period of October24, 2013 through November 4, 2013. Two sessions were held in each of the nine districts ofthe Area Agencies on Aging (AAAD). A geographical representation of the AAADs is available atthe following link: www.tn.gov/comaging/localarea.html. In each location, one session washeld for consumers, family members, and other stakeholders representing consumer interests(e.g., advocates, Long Term Care (LTC) Ombudsmen, etc.), and one for providers – both nursingfacility (NF) and home and community based services (HCBS) – in each region. Consumers
were encouraged to attend the consumer group sessions (Consumer Forums), and providerswere directed to attend the provider sessions (Provider Forums).
Press releases were sent twice to 298 media outlets encompassing the nine regions: once toannounce the forums and provide information about their purpose; and again closer to thedate of each local forum to further encourage participation. In addition to these pressreleases, the AAADs distributed letters and flyers promoting the forums to constituents,with a special focus on engaging consumer attendance. TennCare sent invitations directly toNF providers. In addition, TennCare enlisted MCOs in disseminating the provider invitationto all contracted NF and HCBS providers. All provider invitations included a copy of theconsumer invitation and a request that providers distribute to persons served by theiragency. MCOs were also asked to assist (e.g., through Care Coordination contacts, etc.) indisseminating the invitation to members. The invitations were sent to all members of theTennCare LTSS Stakeholder group (including representatives from AARP and the disabilityadvocacy community, as well as provider associations for NF and HCBS providers), withrequest to disseminate to their membership and other interested community members. Theinvitations were also sent to members and staff of the Tennessee Commission on Aging andDisability as well as all paid and volunteer LTC Ombudsmen and volunteer monitors, andmembers of the State’s Advancing Excellence Coalition. Finally, TennCare developed anddistributed to members of the Tennessee General Assembly a letter describing the QuILTTSinitiative and inviting their participation. The availability of the online survey washighlighted in the press releases and invitations.1
The three Managed Care Organizations (MCOs) contracted with TennCare sponsored andhad staff present at all eighteen sessions. Input was also gathered separately from thisgroup. 290 consumers (including family members and other stakeholders representingconsumer interests) and 831 provider representatives attended the forums statewide (388NF providers and 443 HCBS providers), along with 82 MCO staff, for a total of 1,203participants. It is worthwhile to note that most of the consumers who attended the forumswere not NF residents, but rather recipients of HCBS.
Consumer Forums and Provider Forums began with a twenty-minute PowerPointpresentation describing the purpose and vision behind the QuILTSS initiative2 Thispresentation allowed attendees to better understand the context of the concepts to bediscussed later in the forum, providing a starting point in their thinking. At the conclusionof the presentation, participants moved to discussion circles, described below.
Discussion Circles
A discussion circle methodology was used to generate a menu of priority recommendationsfrom Consumer Forum and Provider Forum participants. The composition of these circleswas structured to create conversations between participants with similar roles andresponsibilities. A forced randomization was used to minimize the likelihood that thosewho work together or were acquainted were in the same group.
The discussion circles contained 8-14 participants. Each team had a flip chart pad andabout two hundred index cards. The large group facilitator instructed each group to identify
38Technical Assistance Report to TennCare
1.Copies of the invitations and online survey are available in the Appendix Section.
2Copies of the Community Forum and Provider Forum presentations are available in the Appendix Section.
the person whose birthdate was closest to the date of the community forum as the scribefor the group. Consumer Forums were conducted with a slightly different process from theProvider Forums. Each process is described below.
Consumer Forums
In round one of the discussion group, the large group facilitator instructed the small groupsto reflect on the presentation just heard, and asked each attendee to write down the fivemost important clinical indicators of quality, one idea on each of five index cards. Then inround-robin fashion, each participant’s ideas were listed on the flip chart pad one idea perround and numbered by the scribe. After recording each participant’s ideas, the scribecollected the cards. Next, the large group facilitator instructed each group to list the non-clinical indicators of quality, using the same five ideas per person process. Participants’ideas were then transcribed to the flip chart.
In round two, each participant was given six new notecards and asked to review the totallist of clinical and non-clinical quality indicators. The facilitator then instructedparticipants to identify their top three quality indicators from the list of clinical indicators,and their top three from the list of non-clinical indicators. Participants were theninstructed to rank their top three choices in the clinical category as follows: the card withthe most important indicator was marked with a “three”, the least important wasdesignated with a “one”, and the remaining choice was indicated as a “two.” This processwas repeated to rank the non-clinical indicators.
The scribe then recorded each participant’s scores for the corresponding items on the flipchart, and the points for each indicator were totaled. To complete the process, each groupreported out the top three clinical and top three non-clinical indicators among theirmembers to all the Forum participants. The facilitator noted common themes from thegroups along with highlighting differences found among responses in Forums from otherparts of the state. This immediate feedback to the participants provided context for theirresponses relative to their counterparts in other parts of the state, and framed individualconcerns within a wider perspective.
Provider Forums
During registration, providers were asked to select a group they represented: NF or HCBS(non-medical direct care providers, home health agencies, social service agencies, etc.), orMCO. Using the same forced randomization process described in the Consumer Forums,participants were assigned to a discussion group within those three categories.
Provider Forums also began with a PowerPoint presentation, which was similar in themeand content to the presentation from the Consumer Forums, but included additional slideswith detailed information pertinent to service providers. Provider participants were askedto join their discussion circles following the presentation. Provider discussion circles wereconducted using the same process for obtaining input as described in the consumerdiscussion circles above. In addition, providers were asked to list out barriers toimplementation of pay-for-performance as the last segment of their session.3
39Technical Assistance Report to TennCare
3 Please see the Appendix Section for a summary of the input provided in this segment of the Provider Forums.

PAGE 39Technical Assistance
4 Materials from collateral interviews and from the Tennessee Association for Home Care are included in the Appendix Section. 5 The full report of the data analysis is included in the Appendix Section.
After each forum, all the flip charts were collected, identified by date, type of forum(consumer or provider) and subgroup (NF, HCBS, MCO) for data collection purposes. All ofthe response data was then transcribed, and together with data from the online survey,became the basis of the data analysis, described below.
Online Survey
An online survey was developed in order to provide a means for input for those who couldnot attend the Community Forums. The survey was composed of nearly 60 topics related toa potential measurement and payment system for quality that respondents were asked torate from Not Important to Extremely Important on a 4-point Likert scale, along withproviding basic demographic information about their relationship to LTSS (categories suchas consumer, family member, provider) and if a provider, whether their work was related toNF care or HCBS. Through AARP of Tennessee, volunteers were made available to assistconsumers who were unable to access or complete the survey via the internet. Lipscomb’sSchool of TransformAging provided a toll-free number for survey participants to call if theywished to take the survey by telephone. The survey was open and continuously accessiblevia Survey Monkey from October 9, 2013 through November 8, 2013.
Key Informant Interviews
At the conclusion of each forum, participants were encouraged to contact the facilitatorwith any additional questions, thoughts, or concerns, and were given contact informationfor that purpose. Several representatives from organizations in attendance requestedfollow up meetings, including the Tennessee Health Care Association, LeadingAgeTennessee, and National Healthcare Corporation. The first two entities are the tradeassociations in Tennessee that represent most of the nursing and assisted living facilities.
In addition, a meeting was held with Golden Living, a participant in Medicare Pay forPerformance, to gain their insights and recommendations. Input and recommendations onquality in HCBS were also obtained from the Tennessee Association for Home Care.4
These meetings revealed the following provider perspectives on QuILTSS:
� Stakeholder input about QuILTSS is needed from development until implementation
and beyond;
� Coordination among the MCOs, the Bureau of TennCare, and state survey and
licensing agencies as QuILTSS is implemented is essential;
� Interest and support exists for exploring additional funding mechanisms, including
alternative revenue sources, such as an increased bed tax rate with new fundsearmarked for quality improvement;
� Developing a quality “dashboard” may have potential;
� The Bureau of TennCare’s support for both improvement in underperforming
agencies and recognition of high performing providers is important;
� A straightforward and non-burdensome measurement system is key; and
� Financial support for culture change is needed.
Report to TennCare40

41Technical Assistance
Building/Grounds (BG)� Clean� Safe� Home � Privacy� Affordable� Finance
Clinical (C)� Medicines� Falls� Wound/sore� Emergency room (utiliza-tion)
� Infection� Transition� Improve outcomes� Antipsychotic medica-tion (use)
� Pain� Restraint
Health/Wellness (HW)� Needed care� Nutrition� Preventative � Chronic� Active � Mental health� Activities of Daily Living� Weight
Categories and Indicators of Quality from Community Forums
Meaningful Day (MD)� Life� Transportation� Activities� Religious (access to)� Social Independence
Person-Centered Care(PCC)� Choice� Hygiene� Individual� Communication� Consumer satisfaction� Family
Workforce (W)� Dignity/caring� Trained� Consistent/stable� Employee retention/satisfaction
� Reliable� Coordination� Responsive� Compatibility� Flexibility� Ethical/professional� Abuse� Supervision
Discharge to Home (No indicators)
TABLE 1
6 It is helpful to provide some further distinction between “indicators” and “measures” of quality as used in this section. Quality “measures,” especially asused by the Centers for Medicare and Medicaid, refer to rates or scores on specified events or processes linked to quality outcomes (such as pressure ulcersor immunizations). Quality “indicators,” on the other hand, is a term that is often used somewhat more broadly to cover various ways of identifying andtracking conditions or practices related to quality. While there clearly is overlap between the terms, participants in Community Forums were asked to iden-tify and rank potential indicators of quality, and survey participants were similarly asked to rank among identified indicators, which were used with onlybroad definitions in the forums and the online survey. These responses form the basis for the data analysis, and hence will be referred to as “indicators.”
Data Analysis5 of Stakeholder Input from Forums and Surveys
The community forums yielded data from 290 consumers (including family members andother stakeholders representing consumer interests), who provided a total of 463responses; 388 NF providers and 443 HCBS providers, who contributed 1,155 providerresponses; and 82 staff from MCOs, who added 137 idea responses indicating potentialindicators6 of quality in LTSS and how important participants rated each of the 52indicators. Combining these, a total of 1,755 idea responses from 1,203 respondents werecollected at the forums and subsequently analyzed. Responses at the forums were capturedas described in the Stakeholder Input section, under the broad topics of Clinical indicatorsand Non-clinical indicators. After the data were tabulated, responses receiving votes werefurther sorted into seven overarching categories, six of which were comprised ofindicators, as reflected in Table 1 below.
Report to TennCare
In addition, 91 respondents to the online survey provided additional data in the form ofresponses to a list of questions covering nearly 60 topics which were rated using a 4-pointLikert scale according to the relative importance of potential indicators related to quality ofcare. These respondents consisted of consumers (59), providers (30) and MCO staff (2).
A statistician, Jenny Mason, M.Ed., of Lipscomb University, was retained to evaluate andanalyze the data collected from participants in the Community Forums and the onlinesurvey. Ms. Mason did not attend the Community Forums nor did she participate in thedevelopment of the survey. Her role was to objectively analyze responses from stakeholdersgathered through these processes for trends, commonalities, and differences usingaccepted statistical methods.
Data were analyzed in several different ways. Community Forum and online survey datawere analyzed individually and collectively. Data were first screened and not found torequire cleaning. Distributions were found to be acceptable for analysis. Data were testedfor level of differences between respondents and responses and across different categoriesof care, focusing on which respondents are most likely to agree on measures and whichcategories are viewed as interconnected. Statistical analysis revealed that the responses ofconsumers and advocates in the online survey were so similar that they were betterunderstood as a single group of responders. In addition, consumers and advocates weregrouped together in the Community Forums; therefore they are treated as a single group inthe tables presented below.
This section summarizes the combined data analysis. Once data from the forums and onlinesurvey were pooled into a single data set, analyses were computed to determine the overalllevel of differences between respondents and categories of responding. Specific analysesincluded comparisons of consumers to providers and MCO staff, and whether thoseproviders worked in a NF or HCBS, clinical versus non-clinical response topics, andcategorical differences. Finally, all six categories were ranked by these comparisons basedon their specific topics to display levels of interest for respondents and further delineatedby whether they were clinical or non-clinical.
For consumers, it was found that the largest difference in response was between thecategories of Building & Grounds versus Clinical, while the smallest difference in responsewas between the categories of Person-Centered Care and Workforce. NF providers differedthe most on categories of Building & Grounds versus Meaningful Day and least between thecategories of Person-Centered Care and Workforce. HCBS providers differed most oncategories of Meaningful Day and Building & Grounds, and differed least on categories ofHealth & Wellness versus Person-Centered Care.
When separating the pooled data based on whether a respondent was a consumer(including consumer advocates), a provider or an MCO staff, some overarching topics ofquality care were found to be more important than others. The overall highest rankedtopics for consumers were having a Well-trained Workforce and higher Quantities ofWorkforce. The lowest ranked topic for quality care according to consumers wereMeaningful Day’s topic of Social and Clinical’s topic of Making a Transition. MCO staff gavethe highest rankings for Flexibility and Quantity in the Workforce, and gave the lowestscores to Training within the Workforce category and Safety in Building & Grounds.
42Technical Assistance Report to TennCare
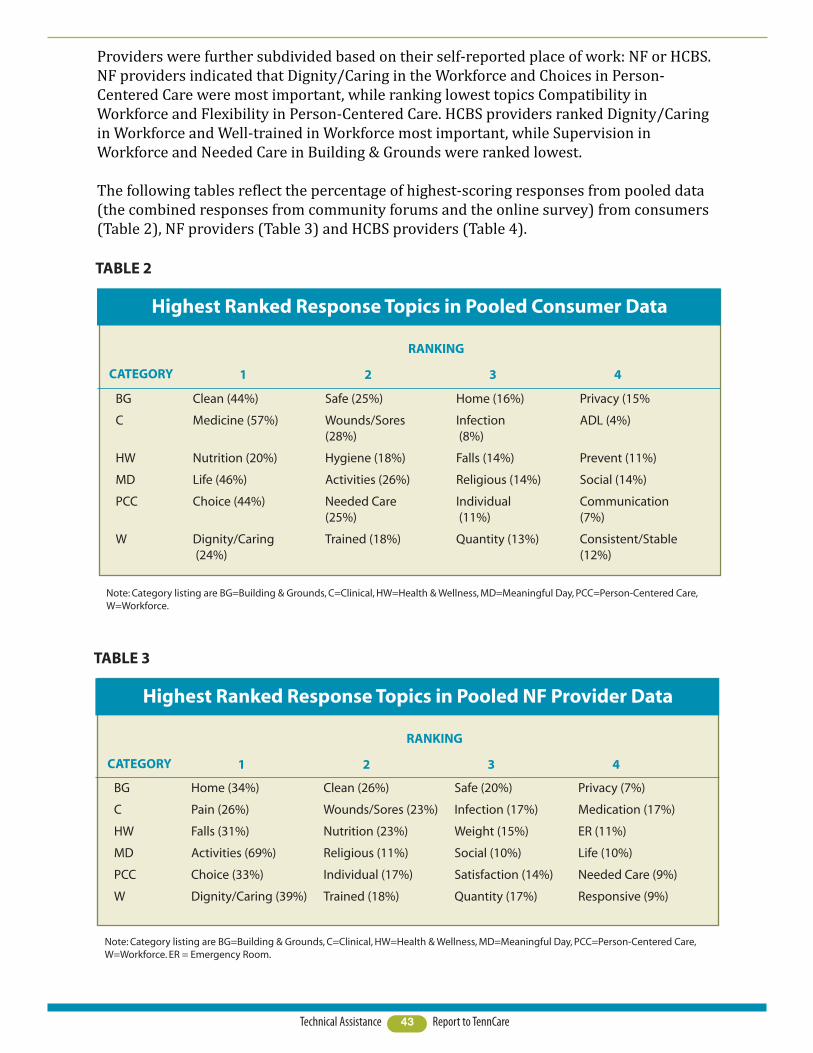
Providers were further subdivided based on their self-reported place of work: NF or HCBS.NF providers indicated that Dignity/Caring in the Workforce and Choices in Person-Centered Care were most important, while ranking lowest topics Compatibility inWorkforce and Flexibility in Person-Centered Care. HCBS providers ranked Dignity/Caringin Workforce and Well-trained in Workforce most important, while Supervision inWorkforce and Needed Care in Building & Grounds were ranked lowest.
The following tables reflect the percentage of highest-scoring responses from pooled data(the combined responses from community forums and the online survey) from consumers(Table 2), NF providers (Table 3) and HCBS providers (Table 4).
43Technical Assistance Report to TennCare
CATEGORY
Highest Ranked Response Topics in Pooled Consumer Data
TABLE 2
BG Clean (44%) Safe (25%) Home (16%) Privacy (15%
C Medicine (57%) Wounds/Sores Infection ADL (4%)(28%) (8%)
HW Nutrition (20%) Hygiene (18%) Falls (14%) Prevent (11%)
MD Life (46%) Activities (26%) Religious (14%) Social (14%)
PCC Choice (44%) Needed Care Individual Communication (25%) (11%) (7%)
W Dignity/Caring Trained (18%) Quantity (13%) Consistent/Stable (24%) (12%)
1 2 3 4
Note: Category listing are BG=Building & Grounds, C=Clinical, HW=Health & Wellness, MD=Meaningful Day, PCC=Person-Centered Care,W=Workforce.
RANKING
CATEGORY
Highest Ranked Response Topics in Pooled NF Provider Data
TABLE 3
BG Home (34%) Clean (26%) Safe (20%) Privacy (7%)
C Pain (26%) Wounds/Sores (23%) Infection (17%) Medication (17%)
HW Falls (31%) Nutrition (23%) Weight (15%) ER (11%)
MD Activities (69%) Religious (11%) Social (10%) Life (10%)
PCC Choice (33%) Individual (17%) Satisfaction (14%) Needed Care (9%)
W Dignity/Caring (39%) Trained (18%) Quantity (17%) Responsive (9%)
1 2 3 4
Note: Category listing are BG=Building & Grounds, C=Clinical, HW=Health & Wellness, MD=Meaningful Day, PCC=Person-Centered Care,W=Workforce. ER = Emergency Room.
RANKING

Summary and Conclusions
A broad cross-section of stakeholder input was gathered for this technical assistanceproject. Input was gathered face -to- face in QuILTSS Community Forums held throughoutthe state in both urban and rural areas, as well as through online surveys and informantinterviews. Extensive efforts were made to widely promote the availability of the forumsand survey for providing input. All of those responding to the invitations to attend aCommunity Forum were afforded the opportunity to attend and participate. This sectionsummarizes and compares top choices in recommendations for possible quality indicatorsamong the three primary stakeholder groups: consumers, NF providers, and HCBSproviders.
Participants were asked to rank topics in order of importance based on clinical and non-clinical categories. Thus, further analysis was conducted along these distinctions. Therewere too few MCO responders when taken collectively to constitute sufficient statisticalpower to delineate them as an individual group. MCO staff responses were thereforeremoved from this particular data analysis process. Clinical and non-clinical topic rankingsare discussed here as separated by consumers, NF providers, and HCBS providers.
Under clinical topics, consumers ranked Medicine and Nutrition as highest, under thecategories of Clinical and Health & Wellness, respectively. NF providers scored Nutritionand Pain (in the category of Clinical) as most important, while HCBS providers rankedMedicine (in the Clinical category) and Nutrition in Health and Wellness first and second. Inthe non-clinical topic areas, consumers raked Dignity/Caring in the category Workforce andChoice under Person-Centered Care highest in importance. NF and HCBS providers agreedon Dignity/Caring as their highest scoring topic, but NF providers ranked Choice underPerson-Centered care second, while HCBS providers chose Training under Workforce fortheir second spot.
44Technical Assistance Report to TennCare
CATEGORY
Highest Ranked Response Topics in Pooled HCBS Provider Data
TABLE 4
BG Home (38%) Safe (27%) Privacy (14%) Clean (11%)
C Medicine (42%) Wounds/Sores (16%) Infection (13%) Pain (11%)
HW Nutrition (19%) Falls (18%) ER (17%) Transportation (9%)
MD Activities (56%) Life (26%) Social (18%)
PCC Choice (28%) Satisfaction (15%) Needed Care (14%) Individual (13%)
W Dignity/Caring (24%) Trained (20%) Consistent/Stable Coordination (19%) (8%)
1 2 3 4
Note: Category listing are BG=Building & Grounds, C=Clinical, HW=Health & Wellness, MD=Meaningful Day, PCC=Person-Centered Care,W=Workforce. Meaningful Day only received scores for three topics.
RANKING
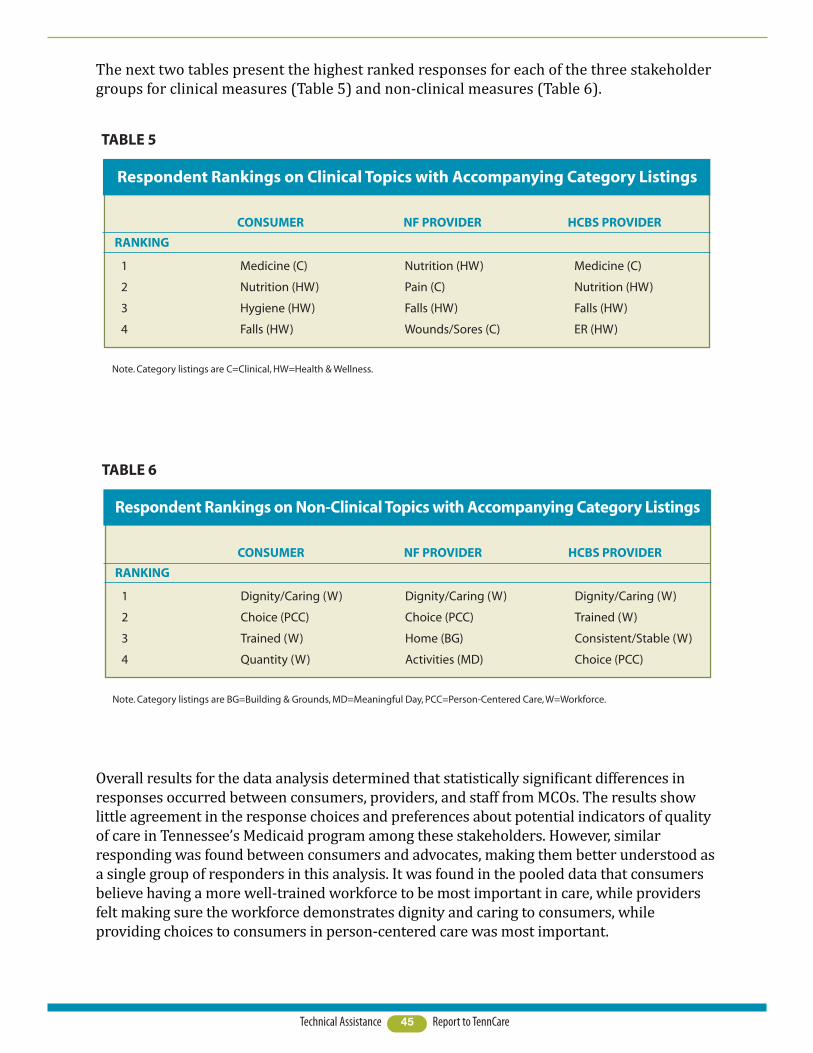
The next two tables present the highest ranked responses for each of the three stakeholdergroups for clinical measures (Table 5) and non-clinical measures (Table 6).
Overall results for the data analysis determined that statistically significant differences inresponses occurred between consumers, providers, and staff from MCOs. The results showlittle agreement in the response choices and preferences about potential indicators of qualityof care in Tennessee’s Medicaid program among these stakeholders. However, similarresponding was found between consumers and advocates, making them better understood asa single group of responders in this analysis. It was found in the pooled data that consumersbelieve having a more well-trained workforce to be most important in care, while providersfelt making sure the workforce demonstrates dignity and caring to consumers, whileproviding choices to consumers in person-centered care was most important.
45Technical Assistance Report to TennCare
RANKING
Respondent Rankings on Clinical Topics with Accompanying Category Listings
TABLE 5
1 Medicine (C) Nutrition (HW) Medicine (C)
2 Nutrition (HW) Pain (C) Nutrition (HW)
3 Hygiene (HW) Falls (HW) Falls (HW)
4 Falls (HW) Wounds/Sores (C) ER (HW)
CONSUMER NF PROVIDER HCBS PROVIDER
Note. Category listings are C=Clinical, HW=Health & Wellness.
RANKING
Respondent Rankings on Non-Clinical Topics with Accompanying Category Listings
TABLE 6
1 Dignity/Caring (W) Dignity/Caring (W) Dignity/Caring (W)
2 Choice (PCC) Choice (PCC) Trained (W)
3 Trained (W) Home (BG) Consistent/Stable (W)
4 Quantity (W) Activities (MD) Choice (PCC)
CONSUMER NF PROVIDER HCBS PROVIDER
Note. Category listings are BG=Building & Grounds, MD=Meaningful Day, PCC=Person-Centered Care, W=Workforce.

Thus, the commonalities are in the persons who care for those in TennCare’s services.Again, there are significant differences, making these findings both statistically andclinically meaningful, which means that consumer, provider, and MCO responses should betaken into account separately. Categorical rankings were also provided for different servicesettings as it is believed that different settings have different needs in quality of care.Providers working in NFs had similar responses to overall provider data, rankingDignity/Caring and Consumer Choices at the top, while providers working in HCBS agreedon Dignity/Caring, but also ranked Training in the Workforce as high. To respondents inthe forums and online survey, it seems that those serving the consumers have the greatestimpact on quality of care.
46Technical Assistance Report to TennCare

47Technical Assistance Report to TennCare
Based on the literature review, stakeholder input, and lessons learned from interviews withother states with Pay for Performance programs, the following recommendations have beendeveloped for the process to be used for the planning and implementation of QuILTSS:
The state should continue to establish and clearly articulate the vision for
QuILTSS, its aim, purpose and scope, and definition of success.A clear vision for QuILTSS will provide consumers, providers and the public with a set ofexpectations for the quality of LTSS in Tennessee, as well as define appropriate roles andresponsibilities among LTSS partners and stakeholders.
Engage a diverse and inclusive array of stakeholders and experts in the
development of the implementation plan.This best practice, which was used successfully by TennCare in developing its approach tomanaged care in LTSS (MLTSS), was emphasized virtually universally among the statesinterviewed. The large attendance, particularly by providers, at the eighteen communityforums is evidence of a high degree of interest in QuILTSS and in providing input to itsdevelopment. Analysis of stakeholder input reveals differing perspectives on qualitymeasures and the relative importance of various quality domains. This poses a potentiallyimportant barrier, one that can be effectively addressed through an ongoing collaborativeprocess for input.
In collaboration with stakeholders, develop guiding principles for the selection
and implementation of quality measures.In situations where perspectives differ, it is often more effective to first identify overarchingvalues that enjoy broad support among diverse constituencies at the beginning of theprocess. For example, according to the stakeholder analysis, there is widespreadrecognition of the importance of measuring and improving quality. This understandingcould form the basis for a guiding principle. The recommended ongoing dialogue withstakeholders provides a forum for the identification, review, and vetting of values andpriorities, which over time has the potential for increased levels of clarity and sharedunderstanding among the various constituencies.
Process Recommendations
Emphasize simplicity in the program design.A relatively simple and straightforward quality framework has several advantages. It iseasier and less expensive to administer both for the state and for providers. This feature isimportant for gaining provider acceptance as well as conserving state resources. A leanerframework is more easily understood by consumers and the general public, which is key toits eventual usefulness as a decision- -making tool for patients and families. As the programis implemented and tracked for unintended results, fewer variables also mean greaterlikelihood of success in pinpointing cause. Measures should be objective, reliable, valid, andwhenever possible, derived from existing and auditable data.
Consider a provider- -driven component for inclusion in the program.This recommendation is supported both by the literature review and best practices fromseveral states. Examples include (but are certainly not limited to) the PEAK program inKansas, in which nursing homes choose their level of participation (including whether theymay be eligible for quality payments) and how to pursue person- -centered care, and thePerformance- -Based Incentive Payment Program (PIPP) in Minnesota. PIPP is voluntary andcompetitive (although other components of Minnesota’s quality program and associatedpayments are applicable across all facilities). Facilities select a targeted area forimprovement, complete an application process and must agree to share their learning.Change efforts that are identified by the provider are more likely to gain acceptance andendure than those that are driven by penalties or prescribed interventions.
Consider the use of composite measure scoring. Composite measures combine scores across various quality domains, and reduce the riskof penalizing providers whose overall performance is strong. Composite scoring is alsosimpler to calculate and report.
Utilize rewards and quality capacity- -building to promote change.The program should reward high performing service providers, while providing assistanceand incentives for improved quality in both high performers and underperformers.Examples of such assistance could include offering training materials and programs thatbuild an organization’s capacity to deliver quality care, similar to efforts in Kansas andMinnesota. Utilizing a capacity- -building approach is both more likely to produce higherlevels of improved quality of care and foster broad- -based support for the initiative.
Include measures of both absolute quality performance and quality
improvement in the quality framework.These two axes of quality measurement – absolute performance and improvement – areboth necessary for the advancement of quality of care to consumers. Factoring incentivesfor both types of performance provides a more comprehensive framework andconcurrently recognizes and rewards high performers while still supporting much- -neededimprovements in lower performers.
48Technical Assistance Report to TennCare
Implement QuILTSS in stages, with separate timetables for NF and HCBS
implementation, as follows (note: stages may overlap and may be implemented
concurrently):
i) Dialogue, education, and increasing shared understanding
ii) Development of measurement system
iii) Collection of baseline data, and impact analysis of proposed measures
based on baseline data
iv) Benchmark setting/tracking without impact on payment
v) Full implementation of P4P
vi) Monitor for unintended results and adjust as needed
vii) Ongoing review and refinement of measures
A phased approach for QuILTSS allows for opportunities for dialogue withstakeholders as each phase is implemented. Although forecasting the timeframes for eachphase is beyond the scope of these recommendations, different timelines canbe expected between NF and HCBS implementation.
If possible, identify new revenue source(s) to contribute to the new payment
system.The need for LTSS is increasing at a time when resources are tightening both at the stateand Federal levels. Budget neutrality is nearly a given for new initiatives in thisenvironment. There is significant industry concern about changes to base payments, andfunding issues have posed challenges in other states. While quality should be anexpectation of all LTSS, Tennessee should be deliberate in its choice of funding model.
49Technical Assistance Report to TennCare

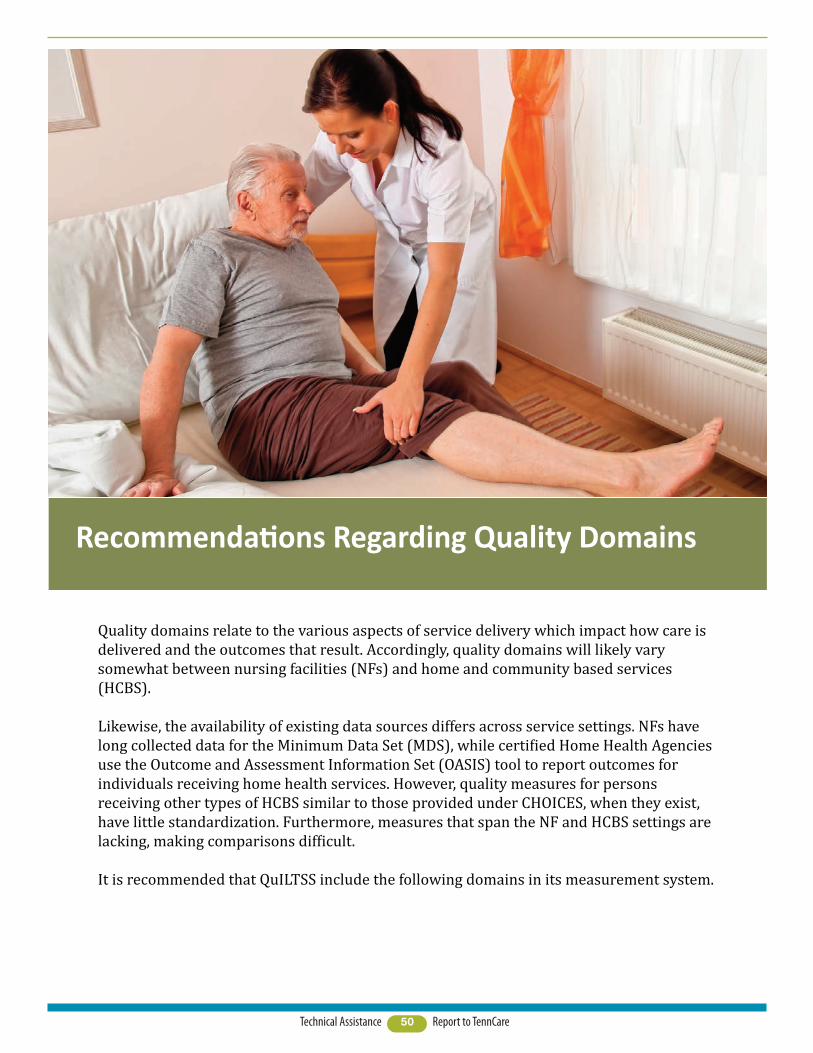
50Technical Assistance Report to TennCare
Recommendations Regarding Quality Domains
Quality domains relate to the various aspects of service delivery which impact how care isdelivered and the outcomes that result. Accordingly, quality domains will likely varysomewhat between nursing facilities (NFs) and home and community based services(HCBS).
Likewise, the availability of existing data sources differs across service settings. NFs havelong collected data for the Minimum Data Set (MDS), while certified Home Health Agenciesuse the Outcome and Assessment Information Set (OASIS) tool to report outcomes forindividuals receiving home health services. However, quality measures for personsreceiving other types of HCBS similar to those provided under CHOICES, when they exist,have little standardization. Furthermore, measures that span the NF and HCBS settings arelacking, making comparisons difficult.
It is recommended that QuILTSS include the following domains in its measurement system.

51Technical Assistance Report to TennCare
Non-clinical Domains
Quality of Life: These measures concern how meaning and purpose in living is supportedin LTSS, regardless of setting, condition, or functional needs. Measures may includeassessments of how the NF and HCBS provider actively assist residents/clients in living inmeaningful ways by offering personalized activities and supports designed to specificallyrespond to individual preferences. Examples of these activities can include access to theoutdoors and gardening, religious services of the resident/client’s choosing, employmentand volunteer opportunities, and music, art, and pet therapy. In NFs, performance scoresmight reflect how the facility fosters a resident’s purposefulness and the development of asense of community by supporting meaningful social interactions amongst residents andstaff, and how the NF continues to support residents’ engagement with family and friendsoutside the facility.
Culture Change: Primarily focused on NFs, these measures reflect how LTSS employ aperson-centered culture, which allows residents/clients to choose how they wish to receivetheir care, in contrast with the traditional and inflexible “institutional” approach. This isclearly centered on choice – choice in bathing, sleep patterns, roommates, food, etc. Culturechange also includes increased communication with residents and their families whencreating individualized care plans and actively involving family in the lives of consumers.The goal is to treat each resident with respect and as an individual, and allow for as muchindependence as is safely possible.
Satisfaction (resident/family/employee): As states move beyond the MDS as a primarysource of quality data, satisfaction among residents/clients and their families are oftenamong the non-clinical measures chosen. Employee satisfaction is thought to be related toboth turnover and quality of care. Important considerations with satisfaction measures areadministration, cognitive functioning of consumers, and response rates. Another strategyinvolves assuring that families and consumers are able to give honest feedback on theperformance of caregiving employees without fear of retribution.
Staffing/Staff Competency (training, turnover, consistent assignment, amount of
nursing/CNA/PSSA staff hours per day): Workforce issues are a reality in nursing homeand HCBS care, however, quality care depends upon staff who demonstrate a commitmentto maintaining the dignity of the individuals receiving services and ensure that services arefree of abuse and neglect. Care should be coordinated to avoid both duplication of servicesand service delivery failures (when staff fails to show for a shift). Families and consumersprefer the opportunity to choose their caregiver for compatibility purposes and then desireconsistent and stable assignment of workers. Staff must know patients’ rights and ensurethose are not violated. Sufficient staff is essential to ensure quality of care. Training is key tostaff performance, and recordkeeping should allow consumers to compare the quality andquantity of caregiver training. Further, individualized training on the needs and preferencesof consumers is important.

52Technical Assistance Report to TennCare
Quality Systems
QuILTSS offers an opportunity to incentivize robust internal quality assurance andimprovement in NFs and HCBS. Recognition and reward could be given for voluntaryparticipation in national quality improvement campaigns, demonstratedimprovement in targeted areas, achievement of accreditation (particularly wherethat accreditation standard requires the use of data and quality systems to evaluateperformance and proactively prevent undesirable outcomes), and the inclusion ofprovider-driven, data based improvement initiatives similar to those in other states,discussed elsewhere in this report.
Survey Results
While some states directly reward performance on NF survey results (bothcomplaint and standard), others use survey results as an eligibility threshold, so thatfacilities with serious deficiencies are precluded from quality payments orincentives. However, at least one state still computes quality scores for thosefacilities for informational and improvement purposes. HCBS licensure requirementsare largely focused on documentation, and monitoring is less frequent andstructured; these requirements should be reviewed to ensure there is appropriateregulatory oversight while also exploring alternative quality monitoring andimprovement approaches. The potential for undetected and unreported abuse andneglect are heightened in the home setting, where the consumer is frequently moreisolated, and measures should be implemented to provide increased safeguards.
Clinical Domains
Clinical Indicators and Outcomes – Clinical indicators have traditionally beenrecognized as objective data for evaluating outcomes. In addition, these measurescan be drawn from a longstanding practice of data collection. For NFs, the MinimumData Set (MDS) has been collected since 1996, and providers are accustomed to thisreporting. Home health providers participate in OASIS; however, this does notcapture data related to most of the TennCare members receiving HCBS underCHOICES. Initially, it is likely that HCBS providers will be more challenged by clinicalindicators, while NFs will find measures related to Culture Change and Quality of Lifemore difficult to incorporate. Examples of clinical indicators used in other statesinclude, but are not limited to incidence of: pressure ulcers, urinary tract infections,falls, pain, restraints, use of antipsychotic medication, immunizations, andhospitalizations.

53Technical Assistance Report to TennCare
AARP,(2009).Quality of care and litigation in tennessee nursing homes.RetrievedfromThe
LewinGroupwebsite:
http://assets.aarp.org/www.aarp.org_/cs/misc/qualitynursinghomereporttn2009.pdf.
(“Qualityofcare,”2009)
Arling,G.,Cooke,V.,Lewis,T.,Perkins,A.,Grabowski,D.,&Abrahamson,K.(2013).Minnesota’s
provider-initiatedapproachyieldscarequalitygainsatparticipatingnursinghomes.Health
Affairs,32(9),1631-1638.doi:10.1377/hlthaff.2013.0294.(Arlingetal.,2013)
Arling,G.,Job,C.,&Cooke,V.(2009).Medicaidnursinghomepayforperformance:Wheredo
westand?.The Gerontologist,49(5),587-595.doi:10.1093/geront/gnp044.(Arling,Job
&Cooke,2009)
Baier,R.,Butterfield,K.,Harris,Y.,&Gravenstein,S.(2008).Aimingforstarperformance:The
relationshipbetweensettingtargetsandimprovednursinghomequalityofcare.Journal
of the American Medical Directors Association,9(8),594-598.doi:
10.1016/j.jamda.2008.06.008.(Baier,Butterfield,Harris&Gravenstein,2008)
References

Briesacher,B.,Field,T.,Baril,J.,&Gurwitz,J.(2009).Pay-for-performanceinnursinghomes.
Health Care Financing Review,30(3),1-13.Retrievedfrom
http://www.ncbi.nlm.nih.gov/pmc/articles/PMC2758526/pdf/nihms132435.pdf.
(Briesacher,Field,Baril&Gurwitz,2009)
Castle,N.,&Ferguson,J.(2010).Whatisnursinghomequalityandhowisitmeasured?.The
Gerontologist,50(4),426-442.doi:10.1093/geront/gnq052.(Castle&Ferguson,2010)
Cohen,M.,Miller,J.,&Shi,X.TheSCANFoundation,(2013).Satisfaction with long-term
services and supports across the continuum of care.RetrievedfromLifePlanswebsite:
http://www.thescanfoundation.org/sites/thescanfoundation.org/files/lifeplans_satisfaction
_of_ltss_across_the_continuum_of_care-9-18-13_0.pdf.(Cohen,Miller&Shi,2013)
Graham,J.(2012,August14).Medicarestudyingplanstopaynursinghomesbasedonquality.
Kaiser Health News.Retrievedfrom
http://www.kaiserhealthnews.org/stories/2012/august/15/medicare-nursing-homes-
quality.aspx?referrer=search.(Graham,2012)
Miller,J.,Cohen,M.,&Shi,X.TheSCANFoundation,(2013).Understanding satisfaction
among older adults using long-term services and supports.RetrievedfromLifePlans,
Inc.website:
http://www.thescanfoundation.org/sites/thescanfoundation.org/files/lifeplans_understandi
ng_satisfaction_among_older_adults_using_ltss-9-18-13.pdf.(Miller,Cohen&Shi,
2013)
Miller,E.,&Rudder,C.(2012).EngagingconsumersinMedicaidnursinghomereimbursement
policy:LessonsfromNewYorkandMinnesota.The Gerontologist,53(4),627-640.doi:
10.1093/geront/gns141.(Miller&Rudder,2012)
Mor,V.(2005).Improvingthequalityoflong-termcarewithbetterinformation.The Milbank
Quarterly,83(3),333-364.doi:10.1111/j.1468-0009.2005.00405.x.(Mor,2005)
Mukamel,D.,Weimer,D.,Spector,W.,Ladd,H.,&Zinn,J.(2008).Publicationofqualityreport
cardsandtrendsinreportedqualitymeasuresinnursinghomes.Health Services
Research,43(4),1244-1262.doi:10.1111/j.1475-6773.2007.00829.x.(Mukamel,
Weimer,Spector,Ladd&Zinn,2008)
Murtaugh,C.,Peng,T.,Aykan,H.,&Maduro,G.(2007).Riskadjustmentandpublicreporting
onhomehealthcare.Health Care Financing Review,28(3),77-94.Retrievedfrom
http://www.cms.gov/Research-Statistics-Data-and-
Systems/Research/HealthCareFinancingReview/downloads/07springpg77.pdf.
(Murtaugh,Peng,Aykan&Maduro,2007)
Rantz,M.,Flesner,M.,&Zwygart-Stauffacher,M.(2010).Improvingcareinnursinghomes
usingqualitymeasures/indicatorsandcomplexityscience.Journal of Nursing Care
Quality,25(1),5-12.doi:10.1097/NCQ.0b013e3181c12b0f.(Rantz,Flesner&Zwygart-
Stauffacher,2010)
54Technical Assistance Report to TennCare
Starkey,K.,Weech-Maldonado,R.,&Mor,V.(2005).Marketcompetitionandqualityofcarein
thenursinghomeindustry.Journal of Health Care Finance,32(1),67-81.(Starkey,
Weech-Maldonado&Mor,2005)
Tenn.CodeAnn.§71-5-1402(i),(2013).
Tenn.CodeAnn.§71-5-1415,(2013).
U.S.DepartmentofHealthandHumanServices,CentersforMedicare&MedicaidServices
(CMS).(n.d.).Report to Congress: Plan to implement a medicare skilled nursing facility
value-based purchasing program.Retrievedfromwebsite:
http://www.cms.gov/Medicare/Medicare-Fee-for-Service-
Payment/SNFPPS/Downloads/SNF-VBP-RTC.pdf.(“Plantoimplement,”n.d.)
Werner,R.,Konetzka,R.,&Polsky,D.(2013).Theeffectofpay-for-performanceinnursing
homes:EvidencefromstateMedicaidprograms.Health Services Research,48(4),1393-
1414.doi:10.1111/1475-6773.12035.(Werner,Konetzka&Polsky,2013)
55Technical Assistance Report to TennCare


Acknowledgements
This product was prepared with support provided through a grant from the Robert WoodJohnson Foundation’s State Quality and Value Strategies Program.
A project of this scope relies on the efforts of many in order to come to fruition. Lipscomb wouldlike to thank all those who contributed their time, knowledge, and viewpoints to this project.
We thank the Robert Wood Johnson Foundation and Princeton University for the financialresources that made this work possible. Staff from the Bureau of Tenncare’s (TennCare’s)Long Term Services and Supports (LTSS) Division worked diligently with us throughout thisprocess. This includes Patti Killingsworth, Assistant Commissioner and Chief of LTSS; JayTaylor, Deputy LTSS Audit and Compliance; John Goetz, TennCare Legislative Liaison; MollyGreenwade, Assistant Deputy LTSS Audit and Compliance; Michelle Morse Jernigan, DeputyLTSS Quality and Administration; Rachel Turner, Assistant Deputy LTSS Quality andAdministration; and Amanda Johnson, LTSS Director Elderly/Disabled Services. Weappreciate the assistance of the Area Agencies on Aging and Disability (AAADs), and theManaged Care Organizations (Amerigroup, BlueCare and UnitedHealthCare) acrossTennessee for their sponsorship of refreshments for the Community Forums. We are alsograteful to Rebecca Kelly of AARP for arranging volunteers and other assistance.
We thank the more than 1,400 Community Forum attendees and Survey Monkey respondentsfor their thoughtful participation and input. We are grateful for the generosity of time andexpertise provided by the key informants interviewed from state Medicaid agencies, whoshared invaluable insights into programs in their respective states along with supportingdocumentation, as well as for the dedicated staff from provider organizations, for articulatingtheir perspectives both through interviews and opinion papers.
Personnel from Lipscomb University’s School for TransformAging® conducted the research andhave prepared this report. This team included Dr. Charla Long, Dean of the College of ProfessionalStudies; Beverly Patnaik, Academic Director, School of TransformAging®; Kathryn O’Day,Executive in Residence; and Nancy Childers, Graduate Assistant. Kim Chaudoin, Assistant VicePresident for University Communication and Marketing for Lipscomb, developed the reportformat and final document.
The School of TransformAging® at Lipscomb is designed to address the issues facing seniorsand the individuals who serve them by finding lasting and meaningful solutions to America’saging crisis. This crisis requires everyone to think differently about aging services anddemands innovative leadership from all sectors, including education.
The School of TransformAging® offers innovative multidisciplinary undergraduate degrees,including certificate programs and a master’s program in aging services leadership. TheSchool strives to develop a new workforce to passionately pursue careers with the agingand demonstrate a holistic skill set. It also serves as a neutral convener of conversations ofsignificance regarding aging issues; provides useful and timely information and training forboth professional and family caregivers; and serves as the catalyst for applied research anddesign for professionals in the field.
56Technical Assistance Report to TennCare


57Technical Assistance Report to TennCare
Appendix
In the course of developing this Technical Assistance Report, many of those interviewedgenerously shared supporting documentation from Pay for Performance programs in otherstates that may be helpful to the reader. In addition, the report references materials such asthe invitations to consumers and providers for the Community Forums, the online survey,and reference materials furnished by service providers, which may also be of interest toreaders.
These documents form a wealth of information on LTSS and Pay for Performance. However,their total volume is too great to produce in printed form with this report. Instead, readerswho wish to access these materials can visit www.lipscomb.edu/transformaging/TAReportto download any or all of the appendices to this report.
58Technical Assistance Report to TennCare
The following Appendices can be found at the web address provided above:
State Interviews:Colorado
CO – PCG 2012 NF P4P Performance reviewCO – PCG 2013 NF P4P Performance reviewColorado legislation
GeorgiaGA – GHCA Quality ReportGA – Nursing Facility 04-10-13 144752GA – Applicable pages are XI 21GA – NF Rate Calculations in Shorthand-DT-2
IndianaIN statute 405 IAC 1-14
IowaIOWA – Chapter.441.81
KansasKS – 75-7435 Quality care assessmentsKS – Action plan form – revisedKS – Core Practices 10-24 vers revisedKS – KCCI Leader VersionKS – KCCI Staff VersionKS – Notice of Final Rates for FY14KS – PEAK 2.0 WebinarKS – Resource kitKS – Person-Centered Care Home Evaluation Form…EnvironmentKS – Person-Centered Care Home Evaluation Form…Meaningful LifeKS – Person-Centered Care Home Evaluation Form…ChoiceKS – Person-Centered Care Home Evaluation Form…Empowerment
MarylandMD – 4.19 D pp 7C and 7DMD – 2012 MHCC NF Family SurveyMD – 2012 NF P4P Scores PT 11-13
MinnesotaAARP Minnesota LTSS Case StudyMN – NH Report Card Fact SheetMN Report Card Technical User GuideMN Status of LTSS
Stakeholder Input:Barriers to implementation summaryCAHPS SurveyCollateral – Elijay Report 2012 Payment SystemCollateral – FY 2013-14 Medicaid Wage IndexCollateral – FY 2014-15 Medicaid Wage IndexCollateral – Medicare rates THCA commentsCollateral – Medicare rates Collateral – SE states Ave FY 2013-14 Medicaid ratesCommunity Forum Consumer Invitation with scheduleCommunity Forum Provider InvitationCommunity Forum CONSUMER PRESENTATIONCommunity Forum PROVIDER PRESENTATIONData Analysis for TennCare’s QuILTSS InitiativeSurvey Monkey QuILTSSTAHC Work Group Feb 2014-2
MiscellaneousAbt Nursing Home Compare Five-Star Quality Report