Technical Assistance Program - Department for Energy ...energy.ky.gov/Programs/Documents/KY Econ...
98
Technical Assistance Program Energy Efficiency Cost-Effective Resource Assessment for Kentucky March 8, 2012
Transcript of Technical Assistance Program - Department for Energy ...energy.ky.gov/Programs/Documents/KY Econ...
Technical Assistance ProgramEnergy Efficiency Cost-Effective
Resource Assessment for KentuckyMarch 8, 2012
Technical Assistance ProgramEnergy Efficiency Cost-Effective
Resource Assessment for KentuckyMarch 8, 2012

This work has been performed by the American Council for an Energy-Efficient Economy under the Contract No. 4200000341 with Oak Ridge National Laboratory, which is managed by UT-Battelle, LLC, under Contract with the U.S. Department of Energy No. DE-AC05-00OR22725.
Contact Information:
Max Neubauer, American Council for an Energy-Efficient EconomyPrimary Authormailto:[email protected](202) 507.4005
R. Neal Elliott, American Council for an Energy-Efficient EconomySecondary [email protected](202) 507.4009

Energy Efficiency Cost-Effective Resource Assessment for KY, ACEEE
EXECUTIVE SUMMARY
As the Commonwealth of Kentucky moves forward to fully integrate energy efficiency into its future resource planning, it is critical to first quantify the volume of potential energy and economic savings available from energy efficiency. Conducting this assessment allows policymakers and stakeholders to understand the degree to which demand-side resources can meet increasing consumption and load requirements. Energy efficiency can also help reduce the strain on the Commonwealth’s current system and delay, or even negate, the need for future investments in supply-side resources, such as generation facilities and transmission infrastructure. Quantifying the potential energy savings available also highlights the role energy efficiency plays in lowering customers’ utility bills, creating jobs, and stimulating economic activity for Kentucky’s businesses. Ultimately, the goal of this process is to provide tangible evidence to stakeholders that energy efficiency is the least-cost energy resource available to spur economic development and guarantee environmental health.
This assessment is the first of three (3) documents that comprise ACEEE’s energy efficiency potential study for the Commonwealth. This report presents the results from our analysis of the cost-effective energy efficiency resources available in residential, commercial, and industrial buildings and facilities in Kentucky. We examine the potential energy savings and costs generated by specific efficient technology measures, such as high-efficiency windows, water heaters, and central air conditioning units.
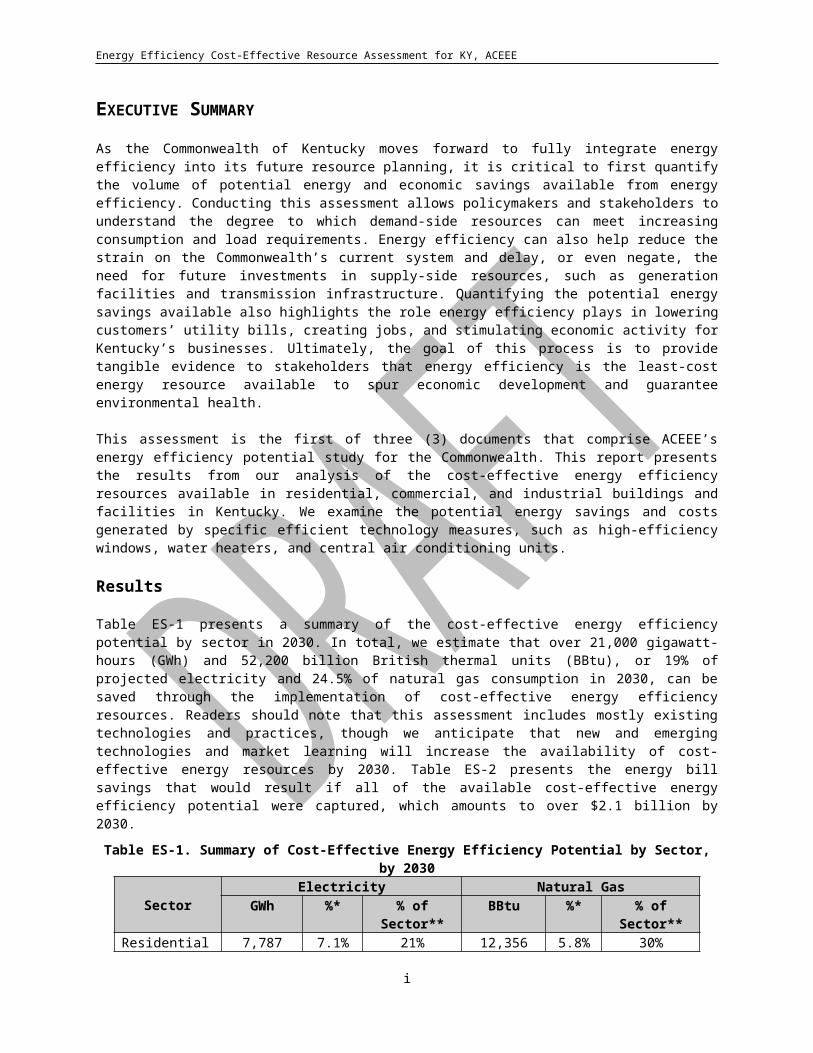
ResultsTable ES-1 presents a summary of the cost-effective energy efficiency potential by sector in 2030. In total, we estimate that over 21,000 gigawatt-hours (GWh) and 52,200 billion British thermal units (BBtu), or 19% of projected electricity and 24.5% of natural gas consumption in 2030, can be saved through the implementation of cost-effective energy efficiency resources. Readers should note that this assessment includes mostly existing technologies and practices, though we anticipate that new and emerging technologies and market learning will increase the availability of cost-effective energy resources by 2030. Table ES-2 presents the energy bill savings that would result if all of the available cost-effective energy efficiency potential were captured, which amounts to over $2.1 billion by 2030.
Table ES-1. Summary of Cost-Effective Energy Efficiency Potential by Sector, by 2030
Sector Electricity Natural GasGWh %* % of Sector** BBtu %* % of Sector**
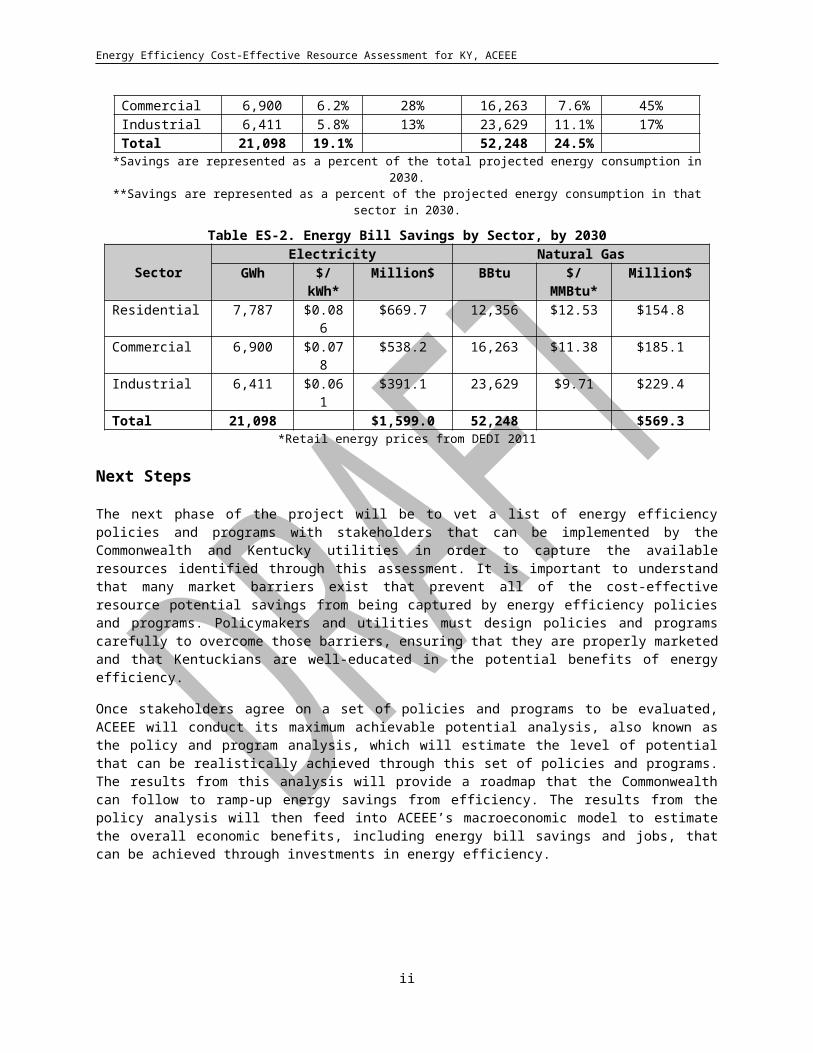
Residential 7,787 7.1% 21% 12,356 5.8% 30%Commercial 6,900 6.2% 28% 16,263 7.6% 45%Industrial 6,411 5.8% 13% 23,629 11.1% 17%Total 21,098 19.1% 52,248 24.5%
*Savings are represented as a percent of the total projected energy consumption in 2030.**Savings are represented as a percent of the projected energy consumption in that sector in 2030.
Table ES-2. Energy Bill Savings by Sector, by 2030
Sector Electricity Natural GasGWh $/kWh* Million$ BBtu $/MMBtu* Million$
Residential 7,787 $0.086 $669.7 12,356 $12.53 $154.8Commercial 6,900 $0.078 $538.2 16,263 $11.38 $185.1Industrial 6,411 $0.061 $391.1 23,629 $9.71 $229.4Total 21,098 $1,599.0 52,248 $569.3
*Retail energy prices from DEDI 2011
Next StepsThe next phase of the project will be to vet a list of energy efficiency policies and programs with stakeholders that can be implemented by the Commonwealth and Kentucky utilities in order to capture the available resources identified through this assessment. It is important to understand that many market barriers exist that prevent all of the cost-effective resource potential savings from being captured by
i
Energy Efficiency Cost-Effective Resource Assessment for KY, ACEEE
energy efficiency policies and programs. Policymakers and utilities must design policies and programs carefully to overcome those barriers, ensuring that they are properly marketed and that Kentuckians are well-educated in the potential benefits of energy efficiency.
Once stakeholders agree on a set of policies and programs to be evaluated, ACEEE will conduct its maximum achievable potential analysis, also known as the policy and program analysis, which will estimate the level of potential that can be realistically achieved through this set of policies and programs. The results from this analysis will provide a roadmap that the Commonwealth can follow to ramp-up energy savings from efficiency. The results from the policy analysis will then feed into ACEEE’s macroeconomic model to estimate the overall economic benefits, including energy bill savings and jobs, that can be achieved through investments in energy efficiency.
ii
Energy Efficiency Cost-Effective Resource Assessment for KY, ACEEE
IntroductionAs the Commonwealth of Kentucky moves forward to fully integrate energy efficiency into its future resource planning, it is critical to first quantify the volume of potential energy and economic savings available from energy efficiency. Conducting this assessment allows policymakers and stakeholders to understand the degree to which demand-side resources can meet increasing consumption and load requirements. Energy efficiency can also reduce the strain on the Commonwealth’s current system and delay, or even negate, the need for future investments in supply-side resources, such as generation facilities and transmission infrastructure. Quantifying the potential energy savings available also highlights the role energy efficiency plays in lowering customers’ utility bills, creating jobs, and stimulating economic activity for Kentucky’s businesses. Ultimately, the goal of this process is to provide tangible evidence to stakeholders that energy efficiency is the least-cost energy resource available to spur economic development and guarantee environmental health.
This assessment is the first of three (3) documents that comprise ACEEE’s energy efficiency potential study for the Commonwealth. This report presents the results from our analysis of the cost-effective energy efficiency resources available in residential, commercial, and industrial buildings and facilities in Kentucky.
MethodologyThis assessment is a bottom-up, measure-by-measure analysis of energy efficiency resources, meaning that we quantify the potential energy savings and costs through 2030 generated by specific efficient technology measures over their lifetime, such as windows, water heaters, and central air conditioning units. These values are then used to determine each measure’s overall cost-effectiveness, taking into account the current market share/penetration. The measures included in this analysis are limited to those that are currently commercially available and currently cost-effective. New efficiency measures will become available or become cost-effective in the future, however, and therefore there will be new opportunities for cost-effective energy efficiency that are not captured in this analysis. For all measures that are deemed cost-effective, we aggregate the potential savings, grouped by end-use, to provide an estimate of the volume of statewide energy savings potential available in each sector.
The volume of savings quantified in this assessment shows the maximum cost-effective energy savings potential available for utility- and state-funded energy efficiency policies and programs to capture. It is important to understand that many market barriers exist that prevent all of the cost-effective resource potential savings identified from being captured by energy efficiency programs. The maximum achievable potential analysis, also known as the policy/program analysis, follows this cost-effective resource assessment and provides an estimate of the percent of the cost-effective resource potential that can be captured through energy efficiency policies and programs.1
The results of the policy analysis — specifically total program costs, energy and dollar savings, and investments (customer costs and incentives) — are then fed into ACEEE’s Dynamic Energy Efficiency Policy Evaluation Routine (DEEPER) model, a macroeconomic model that is used to determine the impact of the energy efficiency policies and programs on a number of economic indicators, such as job creation and gross state product.
Individual measure assumptions, methodologies, and detailed results of the measure-by-measure analyses can be found in the appendices of this document.
1 A list of suggested energy efficiency policies and programs will be compiled by ACEEE and shared with stakeholders to give them an opportunity to weigh in on the relative political palatability and economic feasibility of each suggested policy or program. Once a list has been vetted and finalized, it will serve as the basis for the policy analysis.
1

Energy Efficiency Cost-Effective Resource Assessment for KY, ACEEE
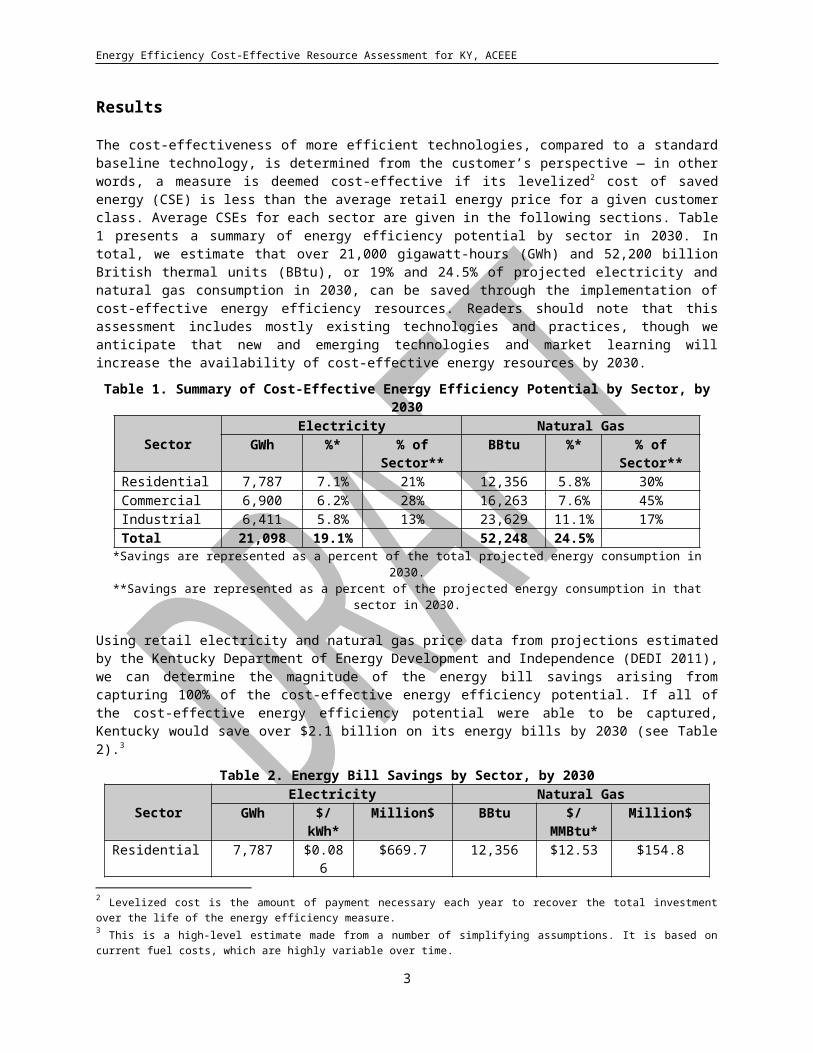
ResultsThe cost-effectiveness of more efficient technologies, compared to a standard baseline technology, is determined from the customer’s perspective — in other words, a measure is deemed cost-effective if its levelized2 cost of saved energy (CSE) is less than the average retail energy price for a given customer class. Average CSEs for each sector are given in the following sections. Table 1 presents a summary of energy efficiency potential by sector in 2030. In total, we estimate that over 21,000 gigawatt-hours (GWh) and 52,200 billion British thermal units (BBtu), or 19% and 24.5% of projected electricity and natural gas consumption in 2030, can be saved through the implementation of cost-effective energy efficiency resources. Readers should note that this assessment includes mostly existing technologies and practices, though we anticipate that new and emerging technologies and market learning will increase the availability of cost-effective energy resources by 2030.
Table 1. Summary of Cost-Effective Energy Efficiency Potential by Sector, by 2030
Sector Electricity Natural GasGWh %* % of Sector** BBtu %* % of Sector**
Residential 7,787 7.1% 21% 12,356 5.8% 30%Commercial 6,900 6.2% 28% 16,263 7.6% 45%Industrial 6,411 5.8% 13% 23,629 11.1% 17%Total 21,098 19.1% 52,248 24.5%
*Savings are represented as a percent of the total projected energy consumption in 2030.**Savings are represented as a percent of the projected energy consumption in that sector in 2030.
Using retail electricity and natural gas price data from projections estimated by the Kentucky Department of Energy Development and Independence (DEDI 2011), we can determine the magnitude of the energy bill savings arising from capturing 100% of the cost-effective energy efficiency potential. If all of the cost-effective energy efficiency potential were able to be captured, Kentucky would save over $2.1 billion on its energy bills by 2030 (see Table 2).3
Table 2. Energy Bill Savings by Sector, by 2030
Sector Electricity Natural GasGWh $/kWh* Million$ BBtu $/MMBtu* Million$
Residential 7,787 $0.086 $669.7 12,356 $12.53 $154.8Commercial 6,900 $0.078 $538.2 16,263 $11.38 $185.1Industrial 6,411 $0.061 $391.1 23,629 $9.71 $229.4Total 21,098 $1,599.0 52,248 $569.3
*Retail energy prices from DEDI 2011
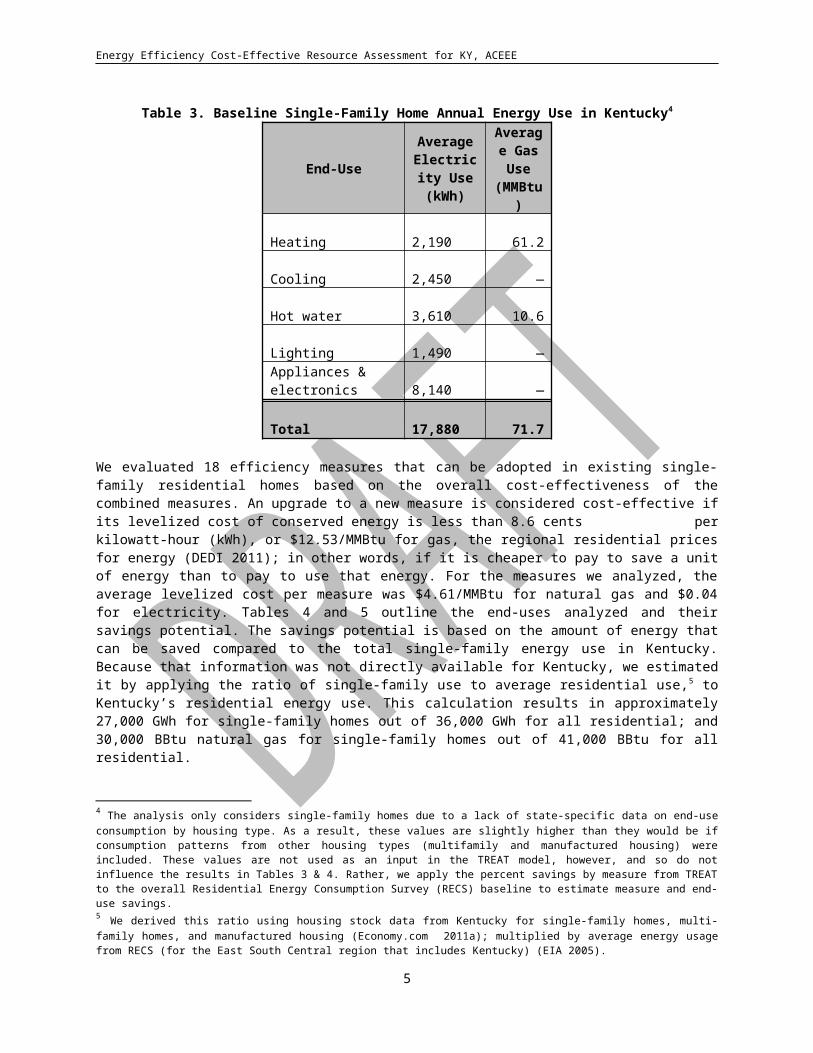
ResidentialFor our analysis of energy efficiency potential for Kentucky’s residential sector, we used a residential building energy modeling software package, the Targeted Retrofit Energy Analysis Tool (TREAT), to compute the average baseline Kentucky single-family home, and the potential energy savings available (PSD 2011). The baseline home was computed using a variety of housing characteristics gathered from a local utility as well as national datasets. First, we input these housing characteristics into TREAT to model a typical home. Table 3 shows the baseline energy use for a typical Kentucky home.
2 Levelized cost is the amount of payment necessary each year to recover the total investment over the life of the energy efficiency measure.3 This is a high-level estimate made from a number of simplifying assumptions. It is based on current fuel costs, which are highly variable over time.
2
Energy Efficiency Cost-Effective Resource Assessment for KY, ACEEE
Table 3. Baseline Single-Family Home Annual Energy Use in Kentucky4
End-UseAverage
Electricity Use (kWh)
Average Gas Use
(MMBtu)
Heating 2,190 61.2Cooling 2,450 —Hot water 3,610 10.6Lighting 1,490 —Appliances & electronics 8,140 —Total 17,880 71.7
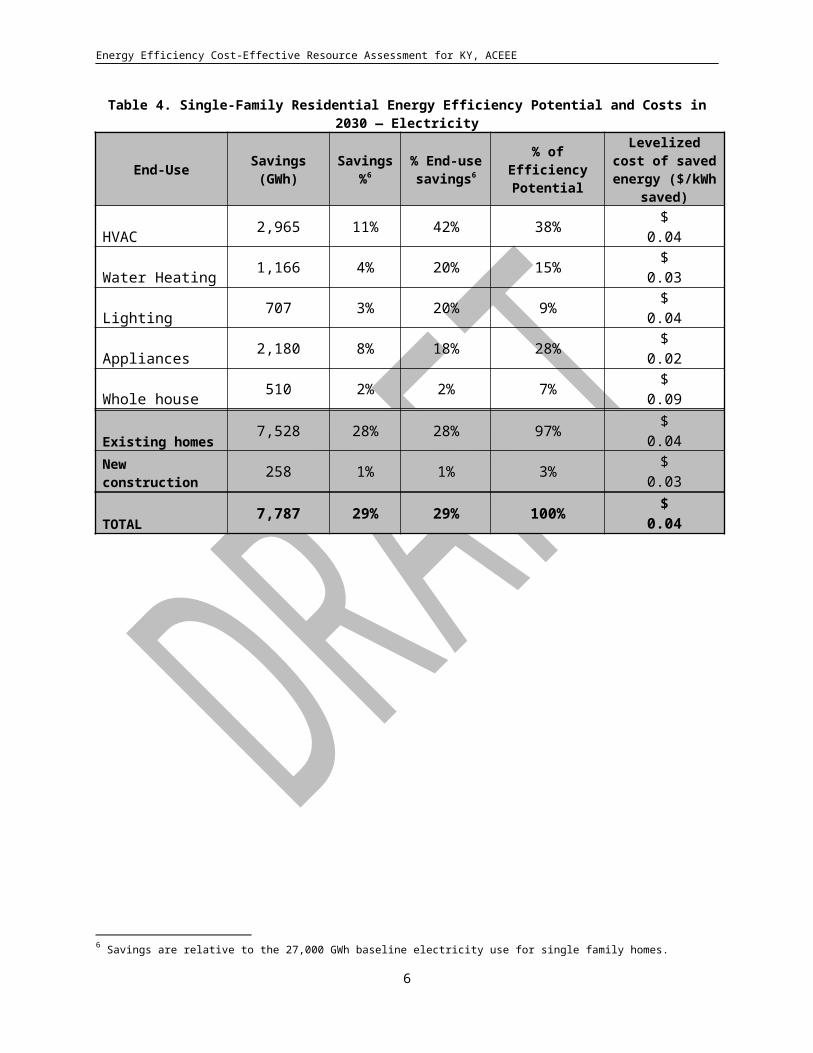
We evaluated 18 efficiency measures that can be adopted in existing single-family residential homes based on the overall cost-effectiveness of the combined measures. An upgrade to a new measure is considered cost-effective if its levelized cost of conserved energy is less than 8.6 cents per kilowatt-hour (kWh), or $12.53/MMBtu for gas, the regional residential prices for energy (DEDI 2011); in other words, if it is cheaper to pay to save a unit of energy than to pay to use that energy. For the measures we analyzed, the average levelized cost per measure was $4.61/MMBtu for natural gas and $0.04 for electricity. Tables 4 and 5 outline the end-uses analyzed and their savings potential. The savings potential is based on the amount of energy that can be saved compared to the total single-family energy use in Kentucky. Because that information was not directly available for Kentucky, we estimated it by applying the ratio of single-family use to average residential use,5 to Kentucky’s residential energy use. This calculation results in approximately 27,000 GWh for single-family homes out of 36,000 GWh for all residential; and 30,000 BBtu natural gas for single-family homes out of 41,000 BBtu for all residential.
Table 4. Single-Family Residential Energy Efficiency Potential and Costs in 2030 — Electricity
End-Use Savings (GWh)
Savings %6
% End-use savings6
% of Efficiency Potential
Levelized cost of saved energy ($/kWh saved)
HVAC 2,965 11% 42% 38% $ 0.04Water Heating 1,166 4% 20% 15% $ 0.03Lighting 707 3% 20% 9% $ 0.04Appliances 2,180 8% 18% 28% $ 0.02Whole house 510 2% 2% 7% $ 0.09Existing homes 7,528 28% 28% 97% $ 0.04New construction 258 1% 1% 3% $ 0.03TOTAL 7,787 29% 29% 100% $ 0.04
4 The analysis only considers single-family homes due to a lack of state-specific data on end-use consumption by housing type. As a result, these values are slightly higher than they would be if consumption patterns from other housing types (multifamily and manufactured housing) were included. These values are not used as an input in the TREAT model, however, and so do not influence the results in Tables 3 & 4. Rather, we apply the percent savings by measure from TREAT to the overall Residential Energy Consumption Survey (RECS) baseline to estimate measure and end-use savings.5 We derived this ratio using housing stock data from Kentucky for single-family homes, multi-family homes, and manufactured housing (Economy.com 2011a); multiplied by average energy usage from RECS (for the East South Central region that includes Kentucky) (EIA 2005).6 Savings are relative to the 27,000 GWh baseline electricity use for single family homes.
3
Energy Efficiency Cost-Effective Resource Assessment for KY, ACEEE
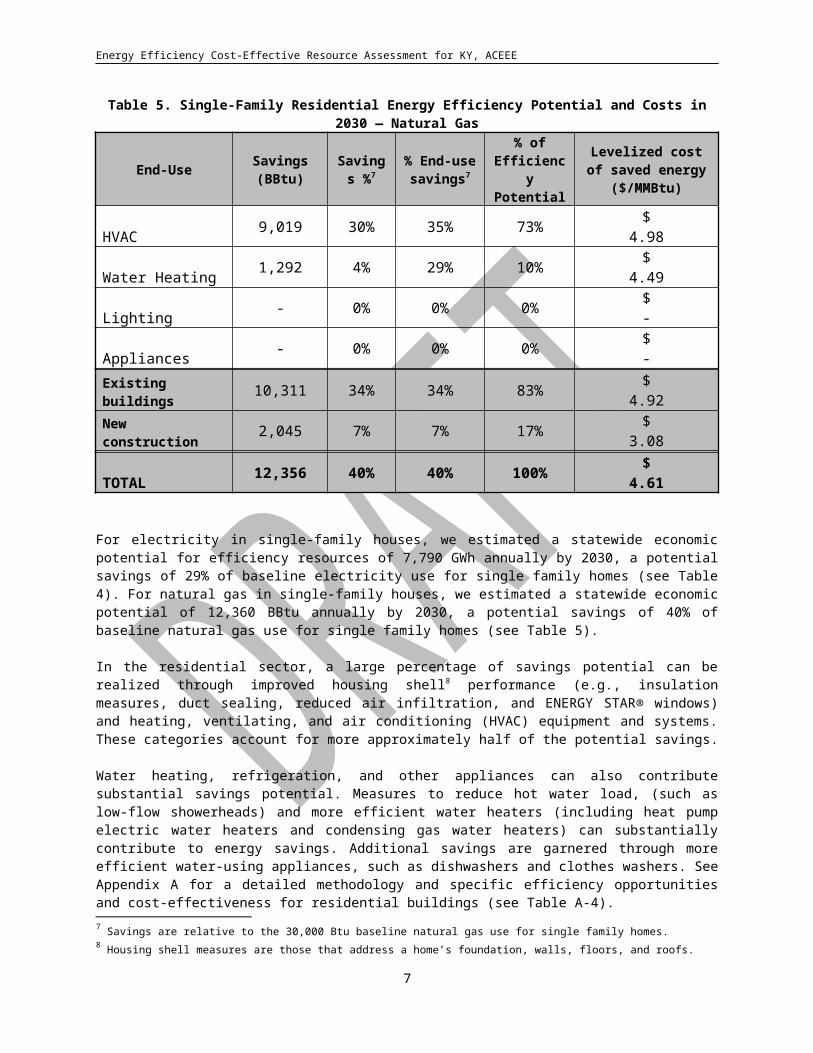
Table 5. Single-Family Residential Energy Efficiency Potential and Costs in 2030 — Natural Gas
End-Use Savings (BBtu)
Savings %7
% End-use savings7
% of Efficiency Potential
Levelized cost of saved energy
($/MMBtu)HVAC 9,019 30% 35% 73% $ 4.98Water Heating 1,292 4% 29% 10% $ 4.49Lighting - 0% 0% 0% $ -Appliances - 0% 0% 0% $ -Existing buildings 10,311 34% 34% 83% $ 4.92New construction 2,045 7% 7% 17% $ 3.08TOTAL 12,356 40% 40% 100% $ 4.61
For electricity in single-family houses, we estimated a statewide economic potential for efficiency resources of 7,790 GWh annually by 2030, a potential savings of 29% of baseline electricity use for single family homes (see Table 4). For natural gas in single-family houses, we estimated a statewide economic potential of 12,360 BBtu annually by 2030, a potential savings of 40% of baseline natural gas use for single family homes (see Table 5).
In the residential sector, a large percentage of savings potential can be realized through improved housing shell8 performance (e.g., insulation measures, duct sealing, reduced air infiltration, and ENERGY STAR® windows) and heating, ventilating, and air conditioning (HVAC) equipment and systems. These categories account for more approximately half of the potential savings.
Water heating, refrigeration, and other appliances can also contribute substantial savings potential. Measures to reduce hot water load, (such as low-flow showerheads) and more efficient water heaters (including heat pump electric water heaters and condensing gas water heaters) can substantially contribute to energy savings. Additional savings are garnered through more efficient water-using appliances, such as dishwashers and clothes washers. See Appendix A for a detailed methodology and specific efficiency opportunities and cost-effectiveness for residential buildings (see Table A-4).
7 Savings are relative to the 30,000 Btu baseline natural gas use for single family homes.8 Housing shell measures are those that address a home’s foundation, walls, floors, and roofs.
4
Energy Efficiency Cost-Effective Resource Assessment for KY, ACEEE
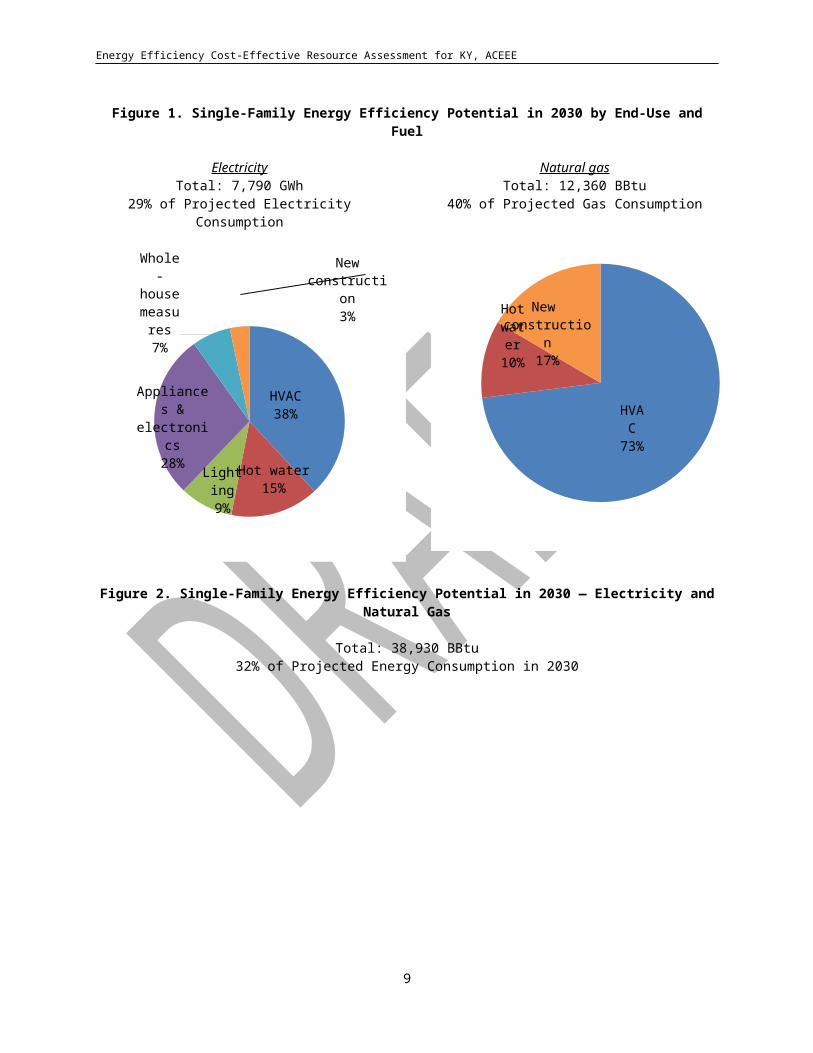
Figure 1. Single-Family Energy Efficiency Potential in 2030 by End-Use and Fuel
ElectricityTotal: 7,790 GWh
29% of Projected Electricity Consumption
HVAC38%
Hot water15%
Light -ing9%
Whole-
house mea-sures
7%
Appliances & electronics
28%
New construc-tion3%
Natural gasTotal: 12,360 BBtu
40% of Projected Gas Consumption
HVAC73%
Hot water10%
New construction
17%
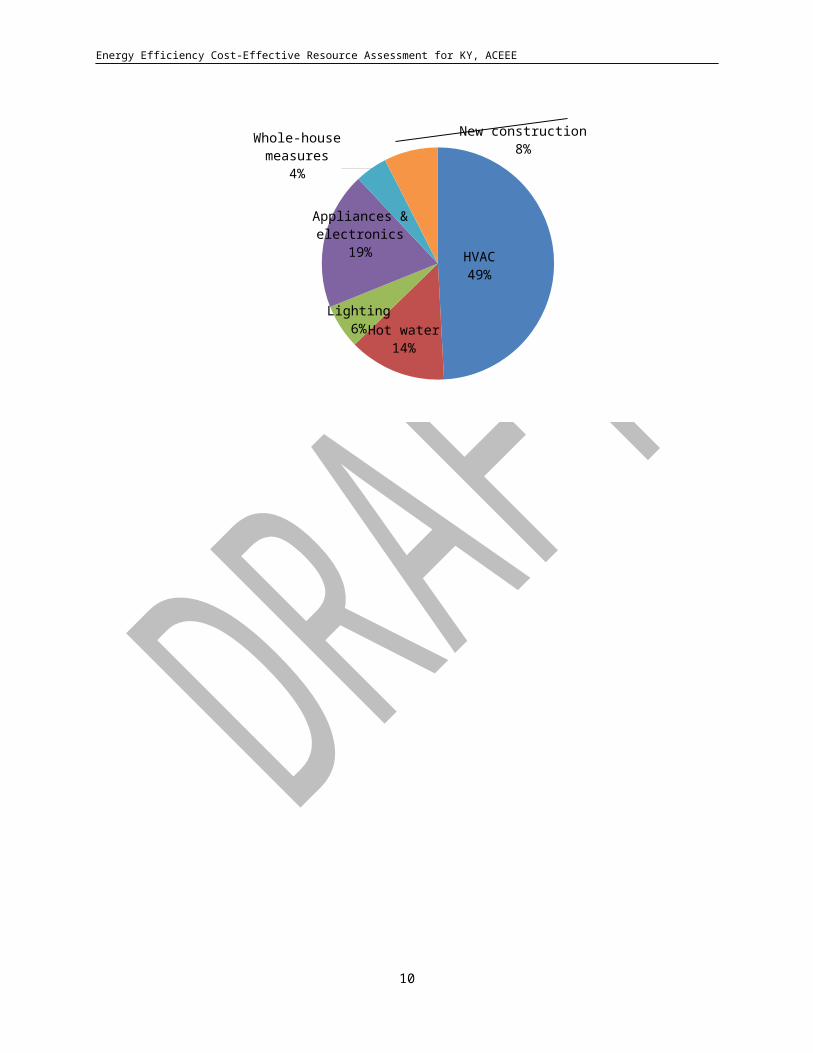
Figure 2. Single-Family Energy Efficiency Potential in 2030 — Electricity and Natural Gas
Total: 38,930 BBtu32% of Projected Energy Consumption in 2030
HVAC49%
Hot water14%
Lighting6%
Appliances & electronics
19%
Whole-house measures
4%
New construction8%
5
Energy Efficiency Cost-Effective Resource Assessment for KY, ACEEE
CommercialOur analysis of energy efficiency potential in the commercial buildings sector is based on a proprietary Microsoft Excel spreadsheet model. This ACEEE buildings model evaluates sector-wide savings relative to the basecase energy forecast and estimated commercial floor space in Kentucky. We use two separate models to evaluate electric and natural gas savings, accounting for the fact that the electric and natural gas measures are applicable to different percentages of commercial floorspace in the state.
Electricity
The potential for electricity savings through energy efficiency for the commercial sector in Kentucky is examined through a scenario of 41 cost-effective measures for electricity savings that would be adopted during the 21-year period from 2010 to 2030. An upgrade to a new measure is considered cost-effective if its levelized cost of conserved energy is less than 7.8 cents/kWh saved, which is the average retail electricity price for the commercial sector in Kentucky over the study time period (DEDI 2011). For the sum of all measures, the estimated levelized cost is 1.7 cents/kWh saved (see Table 6). See Appendix A for a detailed methodology and specific efficiency opportunities and cost-effectiveness for commercial buildings (see Table A-7).
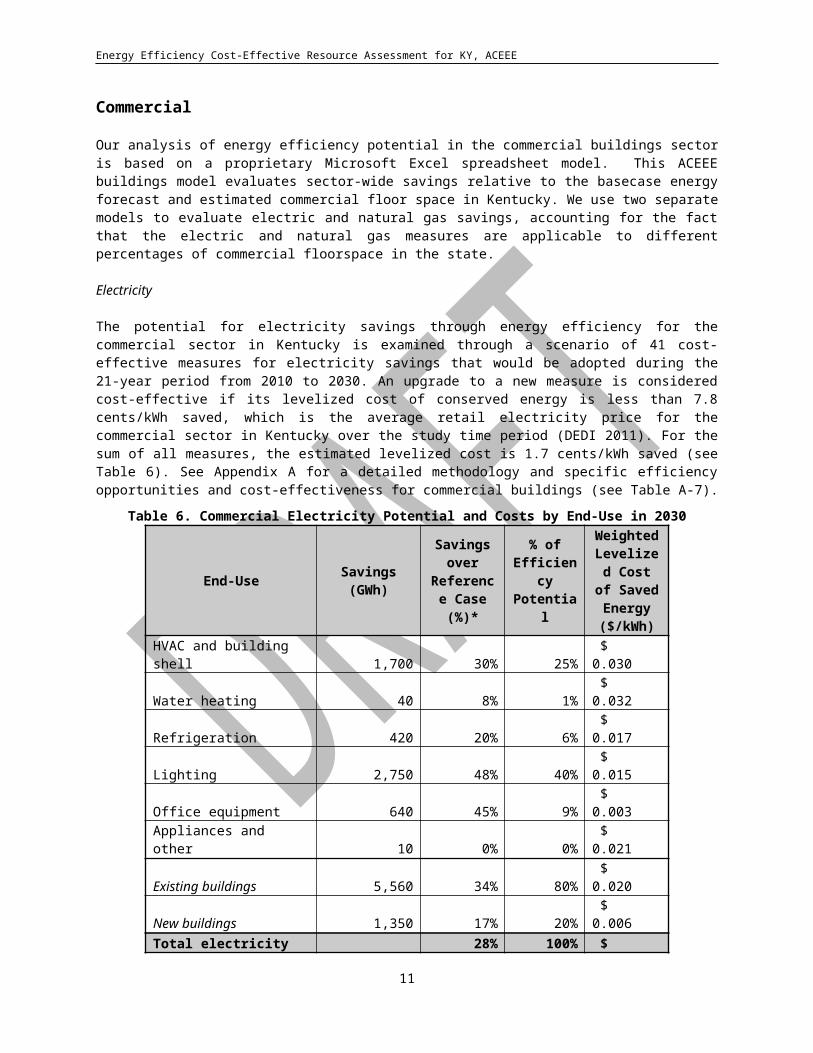
Table 6. Commercial Electricity Potential and Costs by End-Use in 2030
End-Use Savings (GWh)
Savings over
Reference Case (%)*
% of Efficiency Potential
Weighted Levelized Cost of Saved Energy ($/kWh)
HVAC and building shell 1,70
0 30% 25% $ 0.030
Water heating 4
0 8% 1% $ 0.032
Refrigeration 42
0 20% 6% $ 0.017
Lighting 2,75
0 48% 40% $ 0.015
Office equipment 64
0 45% 9% $ 0.003
Appliances and other 1
0 0% 0% $ 0.021
Existing buildings 5,56
0 34% 80% $ 0.020
New buildings 1,35
0 17% 20% $ 0.006
Total electricity 6,90
0 28% 100% $ 0.017*Percent savings are relative to forecasted consumption for the commercial sector in 2030.
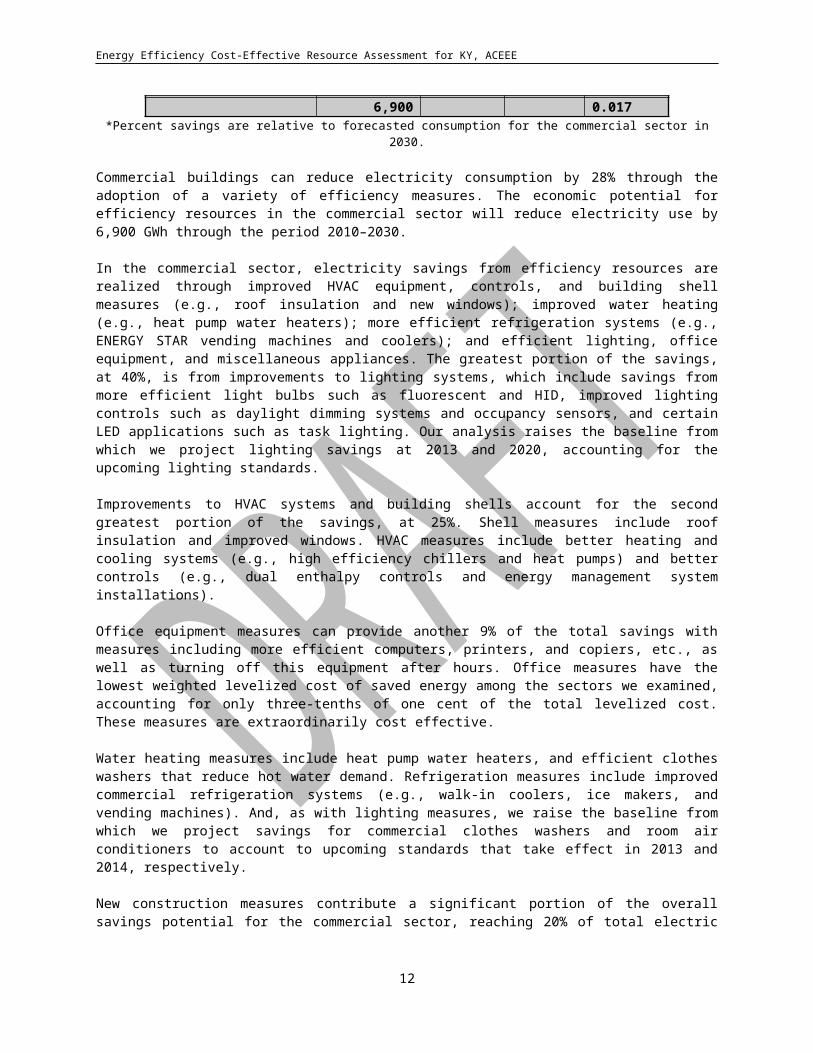
Commercial buildings can reduce electricity consumption by 28% through the adoption of a variety of efficiency measures. The economic potential for efficiency resources in the commercial sector will reduce electricity use by 6,900 GWh through the period 2010–2030.
In the commercial sector, electricity savings from efficiency resources are realized through improved HVAC equipment, controls, and building shell measures (e.g., roof insulation and new windows); improved water heating (e.g., heat pump water heaters); more efficient refrigeration systems (e.g., ENERGY STAR vending machines and coolers); and efficient lighting, office equipment, and miscellaneous appliances. The greatest portion of the savings, at 40%, is from improvements to lighting
6
Energy Efficiency Cost-Effective Resource Assessment for KY, ACEEE
systems, which include savings from more efficient light bulbs such as fluorescent and HID, improved lighting controls such as daylight dimming systems and occupancy sensors, and certain LED applications such as task lighting. Our analysis raises the baseline from which we project lighting savings at 2013 and 2020, accounting for the upcoming lighting standards.
Improvements to HVAC systems and building shells account for the second greatest portion of the savings, at 25%. Shell measures include roof insulation and improved windows. HVAC measures include better heating and cooling systems (e.g., high efficiency chillers and heat pumps) and better controls (e.g., dual enthalpy controls and energy management system installations).
Office equipment measures can provide another 9% of the total savings with measures including more efficient computers, printers, and copiers, etc., as well as turning off this equipment after hours. Office measures have the lowest weighted levelized cost of saved energy among the sectors we examined, accounting for only three-tenths of one cent of the total levelized cost. These measures are extraordinarily cost effective.
Water heating measures include heat pump water heaters, and efficient clothes washers that reduce hot water demand. Refrigeration measures include improved commercial refrigeration systems (e.g., walk-in coolers, ice makers, and vending machines). And, as with lighting measures, we raise the baseline from which we project savings for commercial clothes washers and room air conditioners to account to upcoming standards that take effect in 2013 and 2014, respectively.
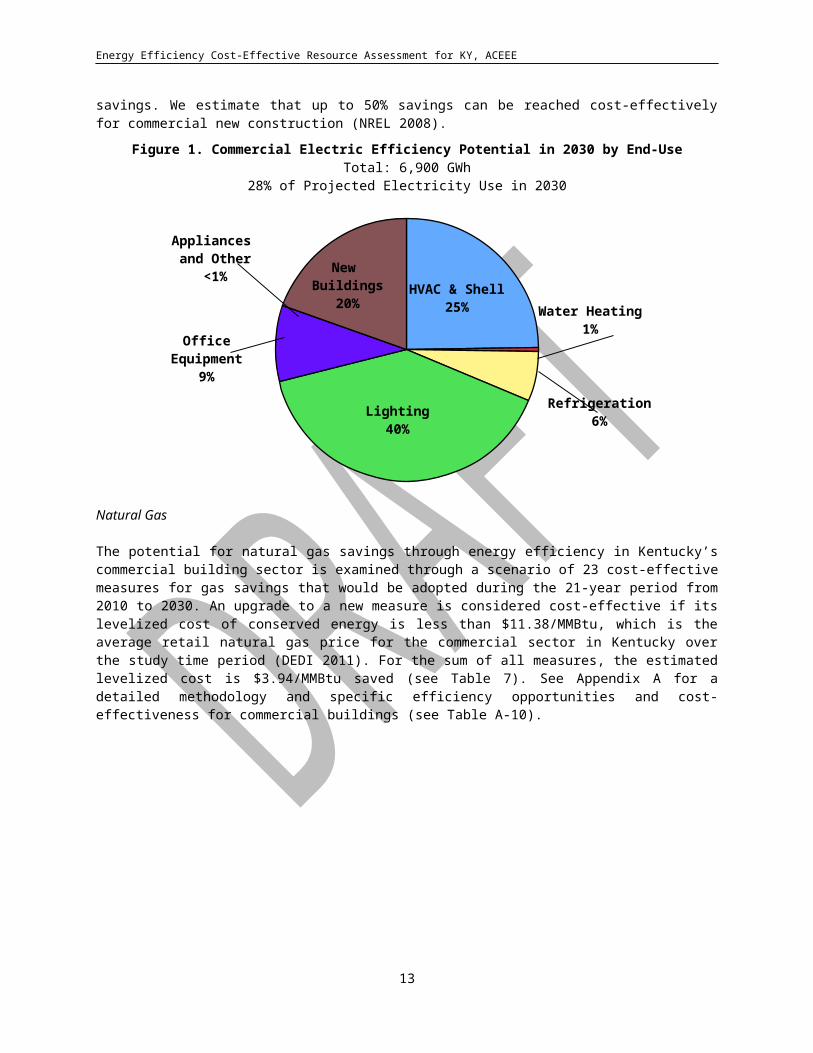
New construction measures contribute a significant portion of the overall savings potential for the commercial sector, reaching 20% of total electric savings. We estimate that up to 50% savings can be reached cost-effectively for commercial new construction (NREL 2008).
Figure 1. Commercial Electric Efficiency Potential in 2030 by End-Use Total: 6,900 GWh
28% of Projected Electricity Use in 2030
HVAC & Shell25%
New Buildings
20%
OfficeEquipment
9%
Refrigeration6%Lighting
40%
Water Heating1%
Appliances and Other
<1%
Natural Gas
The potential for natural gas savings through energy efficiency in Kentucky’s commercial building sector is examined through a scenario of 23 cost-effective measures for gas savings that would be adopted during the 21-year period from 2010 to 2030. An upgrade to a new measure is considered cost-effective if its levelized cost of conserved energy is less than $11.38/MMBtu, which is the average retail natural gas price for the commercial sector in Kentucky over the study time period (DEDI 2011). For the sum of all
7
Energy Efficiency Cost-Effective Resource Assessment for KY, ACEEE
measures, the estimated levelized cost is $3.94/MMBtu saved (see Table 7). See Appendix A for a detailed methodology and specific efficiency opportunities and cost-effectiveness for commercial buildings (see Table A-10).
8

Energy Efficiency Cost-Effective Resource Assessment for KY, ACEEE
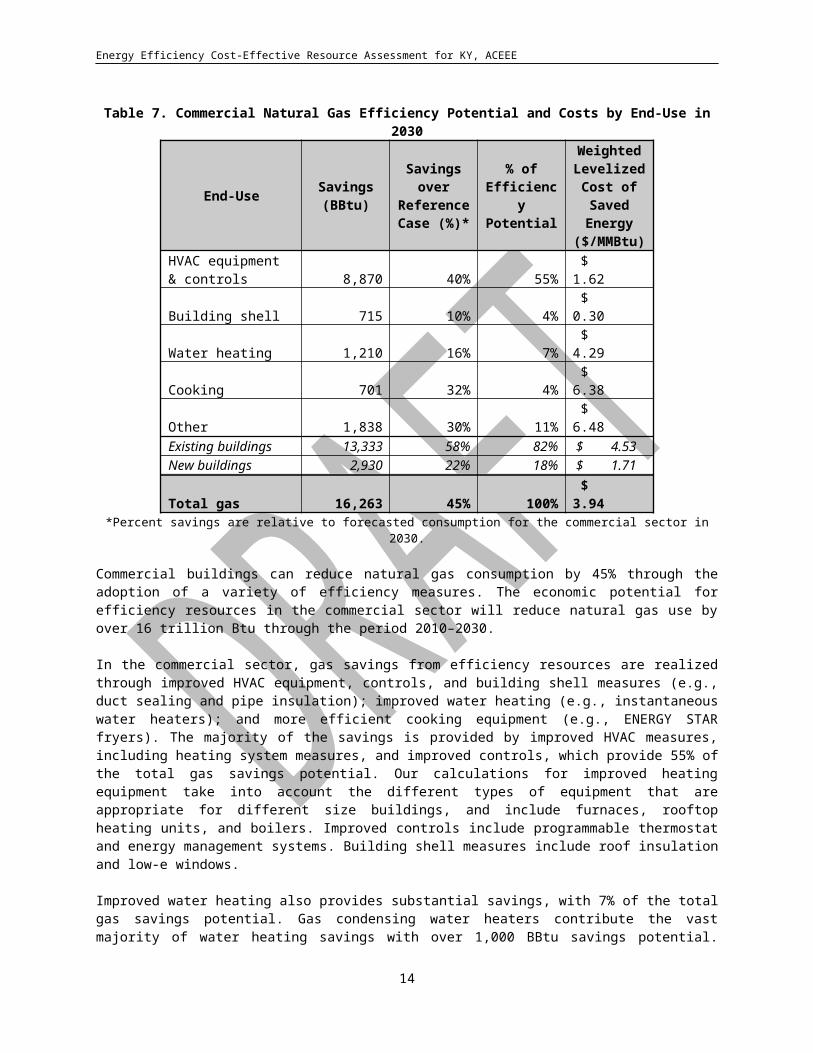
Table 7. Commercial Natural Gas Efficiency Potential and Costs by End-Use in 2030
End-Use Savings (BBtu)
Savings over
Reference Case (%)*
% of Efficiency Potential
Weighted Levelized Cost of Saved Energy
($/MMBtu)HVAC equipment & controls 8,870 40% 55% $ 1.62Building shell 715 10% 4% $ 0.30Water heating 1,210 16% 7% $ 4.29Cooking 701 32% 4% $ 6.38Other 1,838 30% 11% $ 6.48Existing buildings 13,333 58% 82% $ 4.53New buildings 2,930 22% 18% $ 1.71Total gas 16,263 45% 100% $ 3.94*Percent savings are relative to forecasted consumption for the commercial sector in 2030.
Commercial buildings can reduce natural gas consumption by 45% through the adoption of a variety of efficiency measures. The economic potential for efficiency resources in the commercial sector will reduce natural gas use by over 16 trillion Btu through the period 2010–2030.
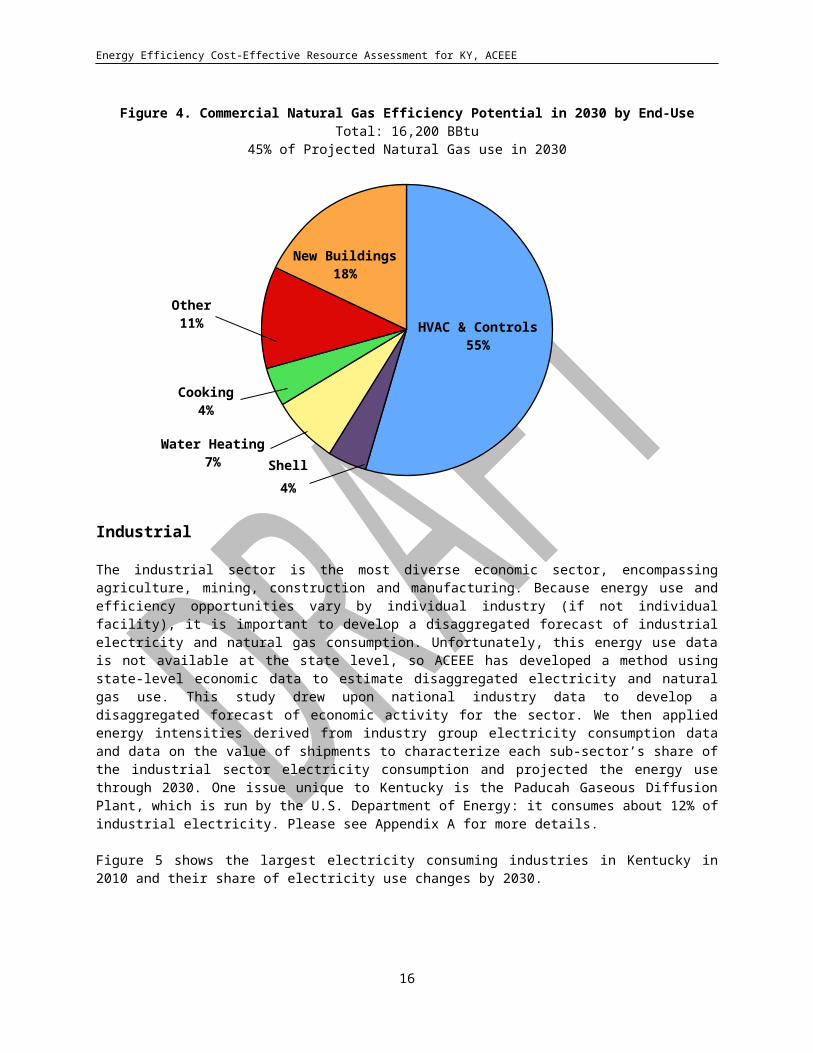
In the commercial sector, gas savings from efficiency resources are realized through improved HVAC equipment, controls, and building shell measures (e.g., duct sealing and pipe insulation); improved water heating (e.g., instantaneous water heaters); and more efficient cooking equipment (e.g., ENERGY STAR fryers). The majority of the savings is provided by improved HVAC measures, including heating system measures, and improved controls, which provide 55% of the total gas savings potential. Our calculations for improved heating equipment take into account the different types of equipment that are appropriate for different size buildings, and include furnaces, rooftop heating units, and boilers. Improved controls include programmable thermostat and energy management systems. Building shell measures include roof insulation and low-e windows.
Improved water heating also provides substantial savings, with 7% of the total gas savings potential. Gas condensing water heaters contribute the vast majority of water heating savings with over 1,000 BBtu savings potential. Building shell and cooking measures each provide another 4% of the savings potential. For cooking measures, high efficiency convection range/ovens and ENERGY STAR fryers provide the largest portion of the savings, while roof insulation and low-e windows comprise the shell measures.
New construction measures contribute a sizeable portion of the overall savings potential for the commercial sector as well, totaling 18% of natural gas savings. We estimate that up to 50% savings can be reached cost-effectively for commercial new construction (NREL 2008).
9
Energy Efficiency Cost-Effective Resource Assessment for KY, ACEEE
Figure 4. Commercial Natural Gas Efficiency Potential in 2030 by End-Use Total: 16,200 BBtu
45% of Projected Natural Gas use in 2030
HVAC & Controls55%
New Buildings18%
Cooking4%
Water Heating7%
Other11%
Shell 4%
IndustrialThe industrial sector is the most diverse economic sector, encompassing agriculture, mining, construction and manufacturing. Because energy use and efficiency opportunities vary by individual industry (if not individual facility), it is important to develop a disaggregated forecast of industrial electricity and natural gas consumption. Unfortunately, this energy use data is not available at the state level, so ACEEE has developed a method using state-level economic data to estimate disaggregated electricity and natural gas use. This study drew upon national industry data to develop a disaggregated forecast of economic activity for the sector. We then applied energy intensities derived from industry group electricity consumption data and data on the value of shipments to characterize each sub-sector’s share of the industrial sector electricity consumption and projected the energy use through 2030. One issue unique to Kentucky is the Paducah Gaseous Diffusion Plant, which is run by the U.S. Department of Energy: it consumes about 12% of industrial electricity. Please see Appendix A for more details.
Figure 5 shows the largest electricity consuming industries in Kentucky in 2010 and their share of electricity use changes by 2030.
10
Energy Efficiency Cost-Effective Resource Assessment for KY, ACEEE
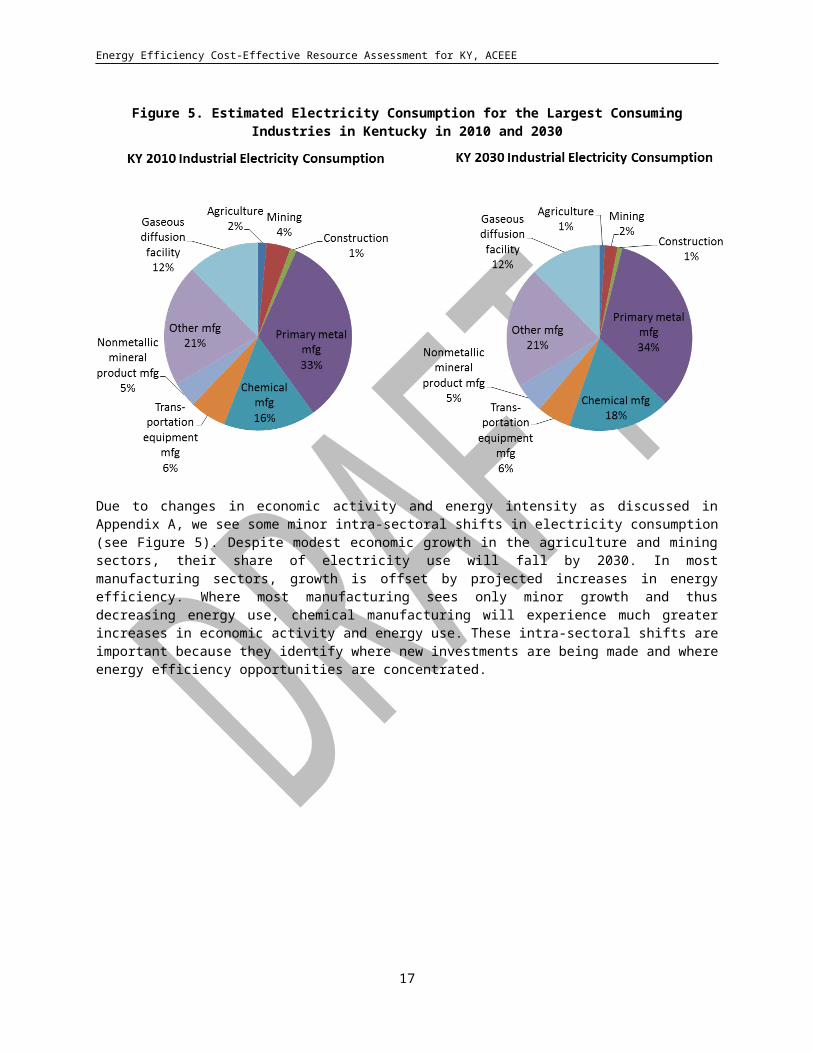
Figure 5. Estimated Electricity Consumption for the Largest Consuming Industries in Kentucky in 2010 and 2030
Due to changes in economic activity and energy intensity as discussed in Appendix A, we see some minor intra-sectoral shifts in electricity consumption (see Figure 5). Despite modest economic growth in the agriculture and mining sectors, their share of electricity use will fall by 2030. In most manufacturing sectors, growth is offset by projected increases in energy efficiency. Where most manufacturing sees only minor growth and thus decreasing energy use, chemical manufacturing will experience much greater increases in economic activity and energy use. These intra-sectoral shifts are important because they identify where new investments are being made and where energy efficiency opportunities are concentrated.
11
Energy Efficiency Cost-Effective Resource Assessment for KY, ACEEE
Figure 6 shows the largest natural gas consuming industries in Kentucky in 2010 and their share of electricity use changes by 2030.
Figure 6. Estimated Natural Gas Consumption for the Largest Consuming Industries in Kentucky in 2010 and 2030
Similar changes in economic activity and energy intensity cause significant intra-sectoral shifts in natural gas consumption. The chemical manufacturing will see substantial growth in natural gas use, due largely to a projected increase in energy intensity. Combined with modest economic growth, the chemical industry will increase from consuming 31% of industry sector natural gas in 2010 to 42% in 2030. A similar (but more modest) increase in natural gas intensity will lead to an increase in natural gas consumption in the petroleum and coal products sector. These intra-sectoral shifts are important because they identify where new investments are being made and where energy efficiency opportunities are concentrated.
Electricity
We examined 18 electricity saving measures, nine of which were cost effective considering Kentucky's average industrial electric rate9 of $0.061/kWh (DEDI 2011). These measures were applied to an industry specific end-use electricity breakdown. 8 shows results for industrial energy efficiency potential by 2030.
9 Average electricity rate taken from actual and projected rates from 2009–2030.
12
Energy Efficiency Cost-Effective Resource Assessment for KY, ACEEE
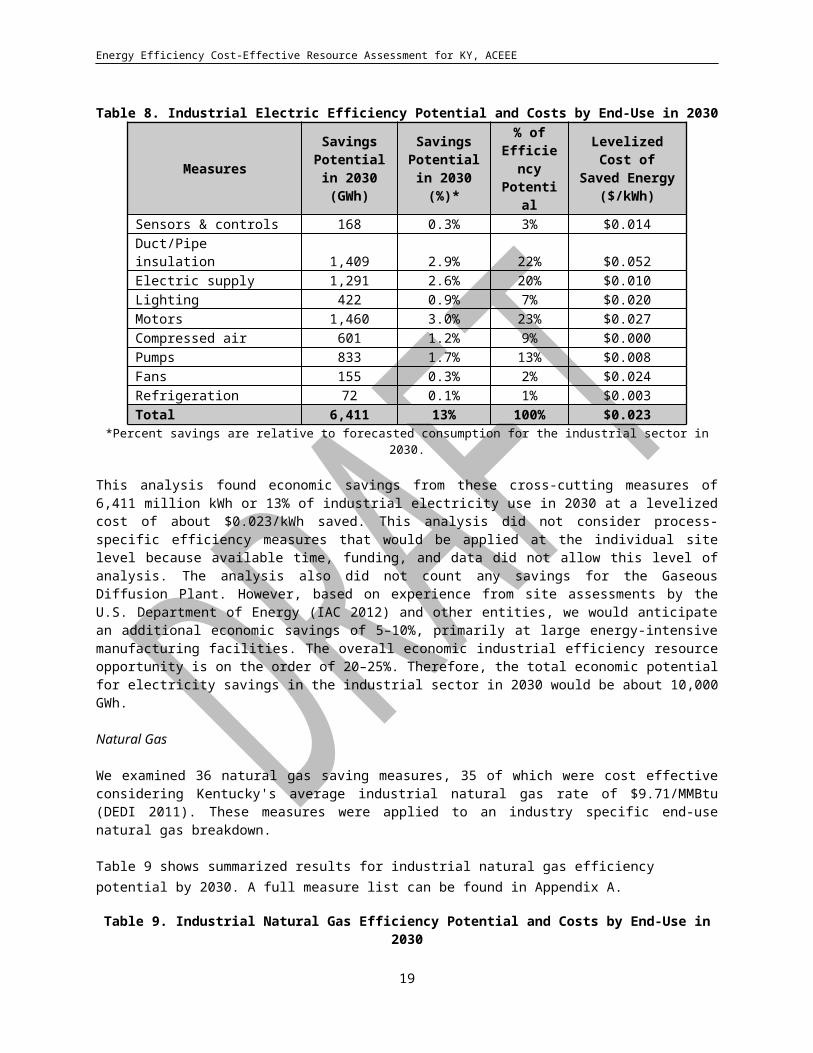
Table 8. Industrial Electric Efficiency Potential and Costs by End-Use in 2030
MeasuresSavings
Potential in 2030 (GWh)
Savings Potential in 2030 (%)*
% of Efficiency Potential
Levelized Cost of Saved
Energy ($/kWh)Sensors & controls 168 0.3% 3% $0.014Duct/Pipe insulation 1,409 2.9% 22% $0.052Electric supply 1,291 2.6% 20% $0.010Lighting 422 0.9% 7% $0.020Motors 1,460 3.0% 23% $0.027Compressed air 601 1.2% 9% $0.000Pumps 833 1.7% 13% $0.008Fans 155 0.3% 2% $0.024Refrigeration 72 0.1% 1% $0.003Total 6,411 13% 100% $0.023
*Percent savings are relative to forecasted consumption for the industrial sector in 2030.
This analysis found economic savings from these cross-cutting measures of 6,411 million kWh or 13% of industrial electricity use in 2030 at a levelized cost of about $0.023/kWh saved. This analysis did not consider process-specific efficiency measures that would be applied at the individual site level because available time, funding, and data did not allow this level of analysis. The analysis also did not count any savings for the Gaseous Diffusion Plant. However, based on experience from site assessments by the U.S. Department of Energy (IAC 2012) and other entities, we would anticipate an additional economic savings of 5–10%, primarily at large energy-intensive manufacturing facilities. The overall economic industrial efficiency resource opportunity is on the order of 20–25%. Therefore, the total economic potential for electricity savings in the industrial sector in 2030 would be about 10,000 GWh.
Natural Gas
We examined 36 natural gas saving measures, 35 of which were cost effective considering Kentucky's average industrial natural gas rate of $9.71/MMBtu (DEDI 2011). These measures were applied to an industry specific end-use natural gas breakdown.
Table 9 shows summarized results for industrial natural gas efficiency potential by 2030. A full measure list can be found in Appendix A.
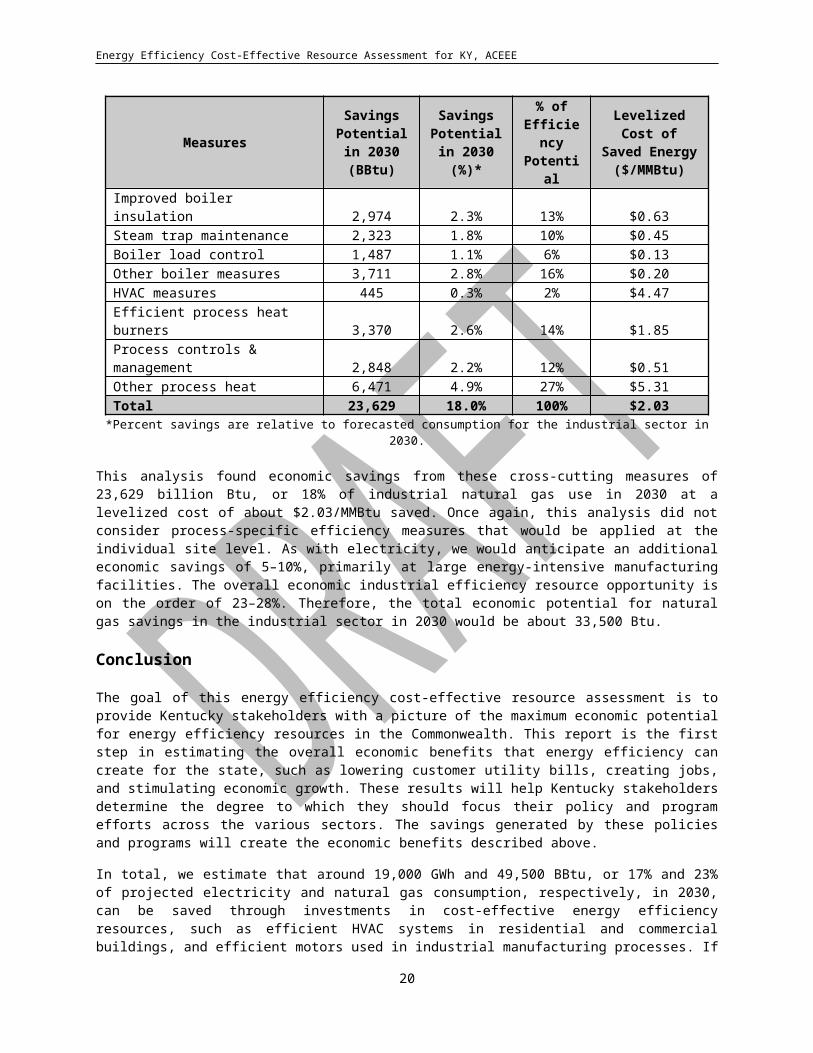
Table 9. Industrial Natural Gas Efficiency Potential and Costs by End-Use in 2030
MeasuresSavings
Potential in 2030 (BBtu)
Savings Potential in 2030 (%)*
% of Efficiency Potential
Levelized Cost of Saved Energy
($/MMBtu)Improved boiler insulation 2,974 2.3% 13% $0.63Steam trap maintenance 2,323 1.8% 10% $0.45Boiler load control 1,487 1.1% 6% $0.13Other boiler measures 3,711 2.8% 16% $0.20HVAC measures 445 0.3% 2% $4.47Efficient process heat burners 3,370 2.6% 14% $1.85Process controls & management 2,848 2.2% 12% $0.51Other process heat 6,471 4.9% 27% $5.31Total 23,629 18.0% 100% $2.03
*Percent savings are relative to forecasted consumption for the industrial sector in 2030.
13
Energy Efficiency Cost-Effective Resource Assessment for KY, ACEEE
This analysis found economic savings from these cross-cutting measures of 23,629 billion Btu, or 18% of industrial natural gas use in 2030 at a levelized cost of about $2.03/MMBtu saved. Once again, this analysis did not consider process-specific efficiency measures that would be applied at the individual site level. As with electricity, we would anticipate an additional economic savings of 5–10%, primarily at large energy-intensive manufacturing facilities. The overall economic industrial efficiency resource opportunity is on the order of 23–28%. Therefore, the total economic potential for natural gas savings in the industrial sector in 2030 would be about 33,500 Btu.
ConclusionThe goal of this energy efficiency cost-effective resource assessment is to provide Kentucky stakeholders with a picture of the maximum economic potential for energy efficiency resources in the Commonwealth. This report is the first step in estimating the overall economic benefits that energy efficiency can create for the state, such as lowering customer utility bills, creating jobs, and stimulating economic growth. These results will help Kentucky stakeholders determine the degree to which they should focus their policy and program efforts across the various sectors. The savings generated by these policies and programs will create the economic benefits described above.
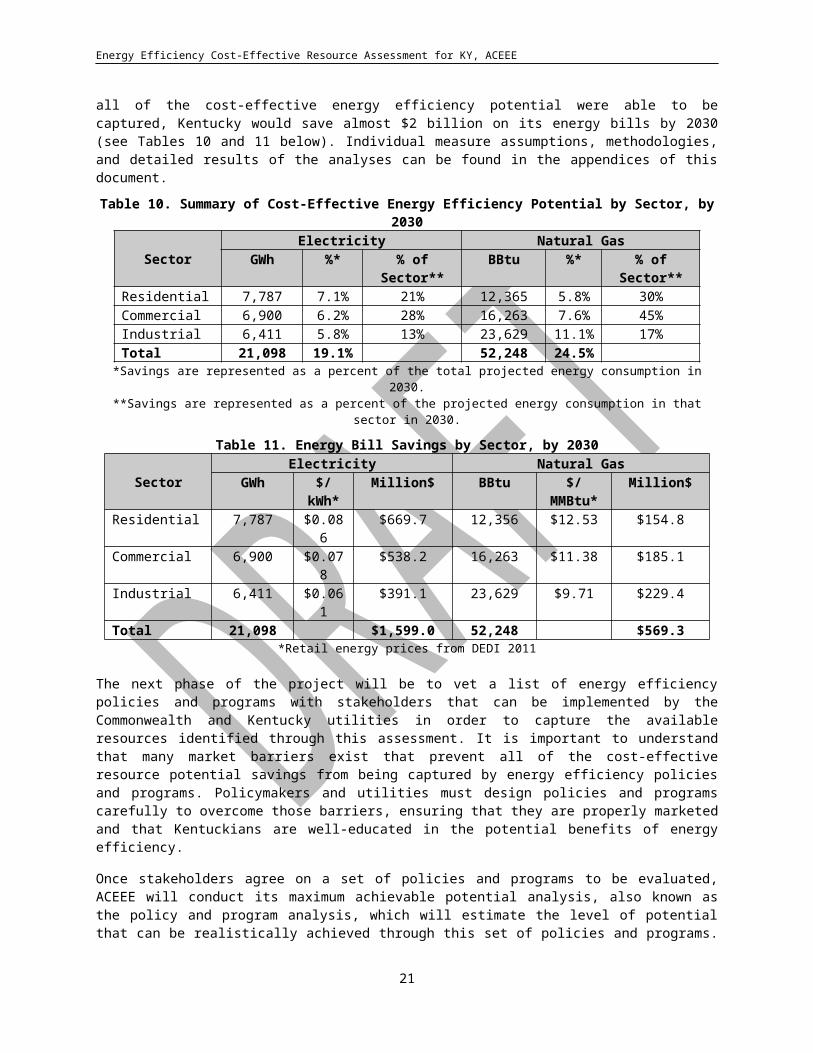
In total, we estimate that around 19,000 GWh and 49,500 BBtu, or 17% and 23% of projected electricity and natural gas consumption, respectively, in 2030, can be saved through investments in cost-effective energy efficiency resources, such as efficient HVAC systems in residential and commercial buildings, and efficient motors used in industrial manufacturing processes. If all of the cost-effective energy efficiency potential were able to be captured, Kentucky would save almost $2 billion on its energy bills by 2030 (see Tables 10 and 11 below). Individual measure assumptions, methodologies, and detailed results of the analyses can be found in the appendices of this document.
Table 10. Summary of Cost-Effective Energy Efficiency Potential by Sector, by 2030
Sector Electricity Natural GasGWh %* % of Sector** BBtu %* % of Sector**
Residential 7,787 7.1% 21% 12,365 5.8% 30%Commercial 6,900 6.2% 28% 16,263 7.6% 45%Industrial 6,411 5.8% 13% 23,629 11.1% 17%Total 21,098 19.1% 52,248 24.5%
*Savings are represented as a percent of the total projected energy consumption in 2030.**Savings are represented as a percent of the projected energy consumption in that sector in 2030.
Table 11. Energy Bill Savings by Sector, by 2030
Sector Electricity Natural GasGWh $/kWh* Million$ BBtu $/MMBtu* Million$
Residential 7,787 $0.086 $669.7 12,356 $12.53 $154.8Commercial 6,900 $0.078 $538.2 16,263 $11.38 $185.1Industrial 6,411 $0.061 $391.1 23,629 $9.71 $229.4Total 21,098 $1,599.0 52,248 $569.3
*Retail energy prices from DEDI 2011
The next phase of the project will be to vet a list of energy efficiency policies and programs with stakeholders that can be implemented by the Commonwealth and Kentucky utilities in order to capture the available resources identified through this assessment. It is important to understand that many market barriers exist that prevent all of the cost-effective resource potential savings from being captured by energy efficiency policies and programs. Policymakers and utilities must design policies and programs carefully to overcome those barriers, ensuring that they are properly marketed and that Kentuckians are well-educated in the potential benefits of energy efficiency.
Once stakeholders agree on a set of policies and programs to be evaluated, ACEEE will conduct its maximum achievable potential analysis, also known as the policy and program analysis, which will estimate the level of potential that can be realistically achieved through this set of policies and programs. The results from this analysis will provide a roadmap that the Commonwealth can follow to ramp-up
14
Energy Efficiency Cost-Effective Resource Assessment for KY, ACEEE
energy savings from efficiency. The results from the policy analysis will then feed into ACEEE’s macroeconomic model to estimate the overall economic benefits, including energy bill savings and jobs, that can be achieved through investments in energy efficiency.
15

Energy Efficiency Cost-Effective Resource Assessment for KY, ACEEE
REFERENCES
[ACEEE] American Council for an Energy-Efficient Economy. 1994. Gas DSM and Fuel-Switching: Opportunities and Experiences. Prepared for New York State Energy Research and Development Authority. Washington, D.C.: American Council for an Energy-Efficient Economy
____. 1997. Energy Efficiency in and Economic Development in New York, New Jersey, and Pennsylvania. Washington, D.C.: American Council for an Energy-Efficient Economy.
[ADL] 2001. “New Line of High-Efficiency Refrigerators Delivers 50% Energy Savings.” www.adltechnology.com/press/delfield.htm. Cambridge, Mass.: Arthur D. Little, Inc.
Amann, J.T., Alex Wilson, and Katie Ackerly. 2007. Consumer Guide to Home Energy Savings. 9th
edition. Washington, D.C.: American Council for an Energy-Efficient Economy.
[ANSI/ASHRAE] American National Standards Institute/American Society of Heating, Refrigeration, and Air-Conditioning Engineers. 1999. 90.1-1999: Energy Efficient Design of New Buildings Except Low-Rise Residential Buildings. Atlanta, Ga.: American Society of Heating, Refrigeration, and Air-Conditioning Engineers.
[ASAP] Appliance Standards Awareness Project. 2007. Opportunities for State-Level Appliance Efficiency Standards. Boston, Mass.: Appliance Standards Awareness Project.
The Cadmus Group, Inc. 2011. Assessment of Long-Term, System-Wide Potential for Demand-Side and Other Supplemental Resources. Volume II: Appendices. Portland, OR: The Cadmus Group, Inc. Prepared for: PacifiCorp.
[CEC] 2005. Database for Energy Efficiency Resources 2004-05, Version 2.01. http://www.energy.ca.gov/deer/. Sacramento, Calif.: California Energy Commission.
[Census]. U.S. Census Bureau. 2007. Annual Survey of Manufacturers. http://www.census.gov/manufacturing/asm/index.html. Washington, D.C.
[CL&P] Connecticut Lighting & Power Company, & The United Illuminating Company. 2007. CL&P and UI Program Savings Documentation for 2008 Program Year. Hartford & New Haven, Conn.: Connecticut Lighting & Power Company, & the United Illuminating Company.
[CPUC] California Public Utilities Commission. 2006. RCA Verification Program for New and Existing Residential and Commercial Air Conditioners. Prepared by Robert Mowris & Associates. Olympic Valley, Calif.: Robert Mowris & Associates.
[DEDI] Kentucky Department for Energy Development and Independence. 2011. Electricity and Natural Gas Price Forecast, 1970-2050. Frankfort, KY: Kentucky Department for Energy Development and Independence.
[DOE] United States Department of Energy. 2004. Technical Support Document: Energy Efficiency Program for Commercial and Industrial Equipment: Commercial Unitary Air Conditioners and Heat Pumps. http://www.eere.energy.gov/buildings/appliance_standards/commercial/pdfs/cuac_tsd_title.pdf. Washington, D.C.: United States Department of Energy.
____. 2007. Technical Support Document: Residential Dishwashers, Dehumidifiers, and Cooking Products and Commercial Clothes Washers. http://www1.eere.energy.gov/buildings/appliance_standards/residential/home_appl_tsd.html. Washington, D.C.: United States Department of Energy.
16
Energy Efficiency Cost-Effective Resource Assessment for KY, ACEEE
____. 2009. Technical Support Document: Energy Efficiency Program for Consumer Products and Commercial and Industrial Equipment: Residential Dishwashers, Dehumidifiers, and Cooking Products, and Commercial Clothes Washers. http://www1.eere.energy.gov/buildings/appliance_standards/commercial/clothes_washers_ecs_final_rule_tsd.html. Washington, D.C.: United States Department of Energy.
____. 2011. Technical Support Document: Residential Clothes Dryers and Room Air Conditioners Direct Final Rule. http://www1.eere.energy.gov/buildings/appliance_standards/residential/residential_clothes_dryers_room_ac_direct_final_rule_tsd.html. Washington, D.C.: United States Department of Energy.
Economy.com. 2011a. Data Buffet: Historical and Forecasted Employment. Downloaded September 2011.
____. 2011b. Data Buffet: Housing Stock, Historical and Forecasted. Downloaded September 2011.
____. 2011c. Data Buffet: Gross State Product: Historical and Forecasted. Downloaded September 2011.
[EIA] U.S. Energy Information Administration. 2005. Residential Energy Consumption Survey. http://www.eia.gov/consumption/residential/data/2005/. Washington, D.C.: U.S. Department of Energy.
____. 2006. 2003 Commercial Building Energy Consumption Survey. http://www.eia.doe.gov/emeu/cbecs/contents.html. Washington, D.C.: U.S. Department of Energy.
____. 2009. 2006 Manufacturing Energy Consumption Survey. http://www.eia.gov/emeu/mecs/. Washington, D.C.: U.S. Department of Energy.
____. 2010. Annual Energy Outlook, 2010. www.eia.gov/oiaf/aeo/pdf/0383( 2010 ).pdf . Washington D.C.: U.S. Department of Energy, Energy Information Administration.
____. 2011. Annual Energy Outlook, 2011. http://www.eia.gov/forecasts/aeo/pdf/0383(2011).pdf. Washington D.C.: U.S. Department of Energy, Energy Information Administration.
Eldridge, M., S. Nadel, A. Korane, J. Laitner, V. McKinney, M. Neubauer, and J. Talbot. 2009. Potential for Energy Efficiency, Demand Response, and Onsite Solar Energy in Pennsylvania. Washington, D.C.: American Council for an Energy-Efficient Economy.
[EPA] Environmental Protection Agency. 2007. “2006 Appliance Sale Data — National, State and Regional.” http://www.energystar.gov/ia/partners/manuf_res/2006FullYear.xls. Washington, D.C.: U.S. Environmental Protection Agency.
____. 2008. "Savings Calculator — Central Air Conditioners." http://www.energystar.gov/ia/business/bulk_purchasing/bpsavings_calc/Calc_CAC.xls. Washington, D.C.: U.S. Environmental Protection Agency.
____. 2011. “Coal Unit Characteristics 2010.” http://www.epa.gov/airmarkets/images/CoalUnitCharacteristics2010.pdf Washington, D.C.: U.S. Environmental Protection Agency.
[GAMA] Gas Appliance Manufacturers Association. 2007. Consumers’ Directory of Certified Efficiency Ratings for Heating and Water Heating Equipment. Berkeley Heights, N.J.: Gas Appliance Manufacturers Association.
17
Energy Efficiency Cost-Effective Resource Assessment for KY, ACEEE
[GDS] GDS Associates, Inc. 2005. The Maximum Achievable Cost Effective Potential for Natural Gas Energy Efficiency in the Service Territory of PNM. Marietta, Ga.: GDS Associates, Inc.
[IAC] U.S. Department of Energy Industrial Assessment Center Database. 2012. http://iac.rutgers.edu/database/. Accessed March 5, 2012.
KEMA, Inc. 2011. Missouri Statewide DSM Market Potential Study. Burlington, MA: KEMA, Inc. Prepared for: Missouri Public Service Commission.
[LBNL] Lawrence Berkeley National Laboratory. 2003. Commercial Unitary Air Conditioner & Heat Pump: Life-Cycle Cost Analysis: Inputs and Results. http://www.eere.energy.gov/buildings/appliance_standards/commercial/pdfs/comm_ac_lcc.pdf. Berkeley, Calif.: Lawrence Berkeley Nationl Laboratory.
Lowenberger, A., J. Mauer, A. deLaski, M. DiMascio, J. Amann, and S. Nadel. 2012. The Efficiency Boom: Cashing In on the Savings from Appliance Standards. Washington, D.C.: American Council for an Energy-Efficient Economy, and Appliance Standards Awareness Project.
Nadel, Steven. 2007. Energy Efficiency Resource Standards Around the U.S. and the World. Washington, D.C.: American Council for an Energy-Efficient Economy.
[Navigant] Navigant Consulting. 2002. U.S. Lighting Market Characterization – Volume 1: National Lighting Inventory and Energy Consumption Estimate. Washington, D.C.: U.S. Department of Energy.
____. 2008. Energy Savings Estimates of Light Emitting Diodes in Niche Lighting Applications. Washington, D.C.: U.S. Department of Energy.
Neubauer, Max, Andrew deLaski, Marianne DiMascio, and Steven Nadel. 2009. Ka-Boom! The Power of Appliance Standards: Opportunities for New Federal Appliance and Equipment Standards. Appliance Standards Awareness Project and American Council for an Energy-Efficient Economy.
[NGRID] National Grid. 2007. Personal Communication with Michael McAteer and Fran Boucher. January e-mail. Northborough, Mass.: National Grid.
[NREL] National Renewable Energy Laboratory. 2008. Technical Support Document: Development of the Advanced Energy Design Guide for Medium Box Retail—50% Energy Savings. Golden, Colo.: U.S. Department of Energy.
[NYSERDA] New York State Energy Research and Development Authority. 2003. Energy Efficiency and Renewable Energy Resource Potential Development in New York State. Albany, N.Y.: New York State Energy Research and Development Authority.
____. 2006. Natural Gas Energy Efficiency Resource Development Potential in New York. Albany, N.Y.: New York State Energy Research and Development Authority.
[PG&E] Pacific Gas and Electric Company. 2004a. Analysis of Standards Options for Commercial Packaged Refrigerators, Freezers, Refrigerator-Freezers and Ice Makers. Prepared by the American Council for an Energy-Efficient Economy. San Francisco, Calif.: Pacific Gas and Electric Company.
____. 2004b. Draft Analysis of Standards Options for Commercial Hot Food Holding Cabinets. Prepared by Davis Energy Group and Energy Solutions. San Francisco, Calif.: Pacific Gas and Electric Company.
18

Energy Efficiency Cost-Effective Resource Assessment for KY, ACEEE
____. 2004c. Analysis of Standards Options for Metal Halide Lamps and Fixtures. Prepared by the American Council for an Energy-Efficient Economy. San Francisco, Calif.: Pacific Gas and Electric Company.
____. 2005. Analysis of Standards Options for Commercial Packaged Refrigerators, Freezers, Refrigerator-Freezers and Ice Makers. Prepared by the American Council for an Energy-Efficient Economy. San Francisco, Calif.: Pacific Gas and Electric Company.
____. 2007. Analysis of Standards Options for Residential Refrigerators. Prepared by the American Council for an Energy-Efficient Economy, Maggie Eldridge and Steve Nadel. San Francisco, Calif.: Pacific Gas and Electric Company.
____. 2008. Preliminary CASE Report: Analysis of Standards Options for Walk-in Refrigerated Storage. Prepared by Heschong Mahone Group. San Francisco, Calif.: Pacific Gas and Electric Company.
[PIER] Public Interest Energy Research. 2003. 2003 Annual Report. Sacramento, Calif.: California Energy Commission.
[PSD] Performance Systems Development. 2011. Targeted Retrofit Energy Analysis Tool (TREAT). Ithica, NY: Performance Systems Development.
Sachs, Harvey, S. Nadel, J. Thorne Amann, M. Tuazon, E. Mendelsohn, L. Rainer, G. Todesco, D. Shipley, and M. Adelaar. 2004. Emerging Energy-Savings Technologies and Practices for the Buildings Sector as of 2004. Washington, D.C.: American Council for an Energy-Efficient Economy.
Sanchez, M., C. Webber, R. Brown, and G. Homan. 2007. 2008 Status Report: Savings Estimates for the ENERGY STAR Voluntary Labeling Program. Washington, D.C.: U.S. Environmental Protection Agency.
[SWEEP] Southwest Energy Efficiency Project. 2002. The New Mother Lode: The Potential for More
Efficient Electricity Use in the Southwest. Boulder, Colo.: Southwest Energy Efficiency Project.
___. 2012. Achieving 20% Savings by 2020 in the Southwest States (Forthcoming Report). Boulder, CO: Southwest Energy Efficiency Project.
Xcel Energy. 2006. 2005 Status Report and Associated Compliance Filings: Minnesota Natural Gas and Electric Conservation Improvement Program. Minneapolis, Minn.: Xcel Energy.
XEnergy. 2002. United States Industrial Electric Motor Systems Market Opportunities Assessment. Washington, D.C: U.S. Department of Energy. http://www1.eere.energy.gov/manufacturing/tech_deployment/pdfs/mtrmkt.pdf
USA Technologies. 2008. EnergyMisers: Vending Miser. http://www.usatech.com/energy_management/energy_vm.php. Malvern, Penn.: USA Technologies.
19
Energy Efficiency Cost-Effective Resource Assessment for KY, ACEEE
APPENDIX A – ENERGY EFFICIENCY RESOURCE ASSESSMENT
A.1. Residential Buildings Sector
A.1.1. Overview of Approach
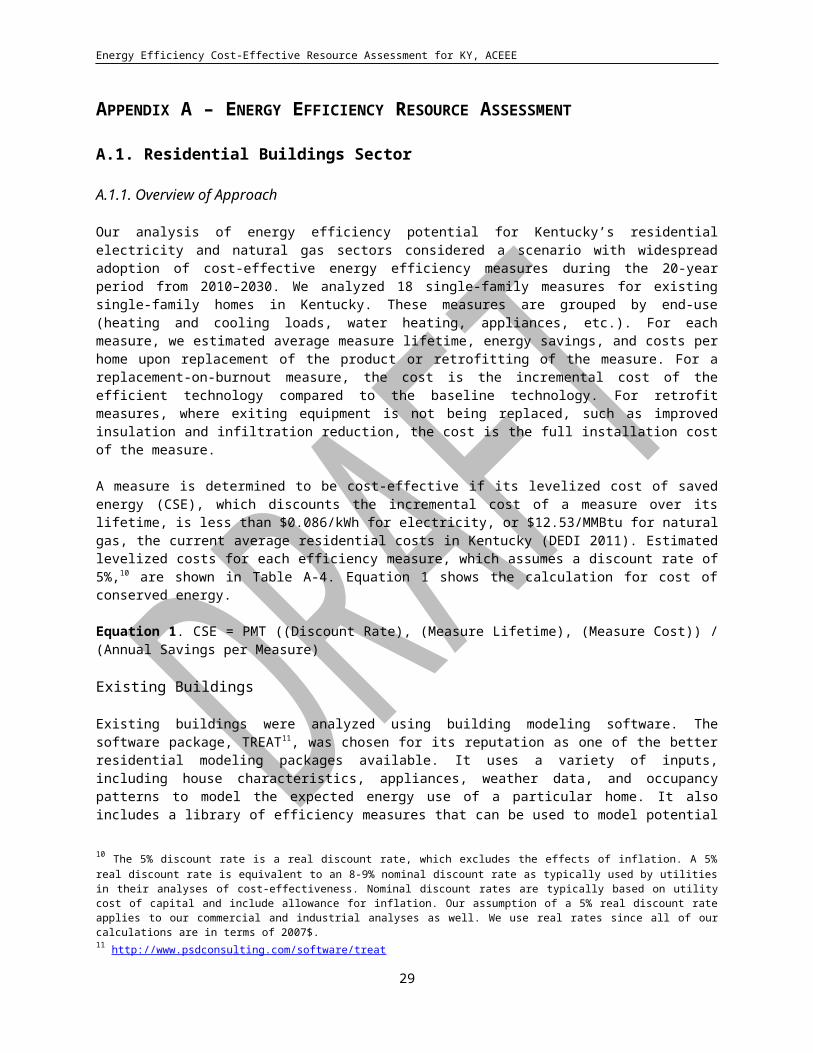
Our analysis of energy efficiency potential for Kentucky’s residential electricity and natural gas sectors considered a scenario with widespread adoption of cost-effective energy efficiency measures during the 20-year period from 2010–2030. We analyzed 18 single-family measures for existing single-family homes in Kentucky. These measures are grouped by end-use (heating and cooling loads, water heating, appliances, etc.). For each measure, we estimated average measure lifetime, energy savings, and costs per home upon replacement of the product or retrofitting of the measure. For a replacement-on-burnout measure, the cost is the incremental cost of the efficient technology compared to the baseline technology. For retrofit measures, where exiting equipment is not being replaced, such as improved insulation and infiltration reduction, the cost is the full installation cost of the measure.
A measure is determined to be cost-effective if its levelized cost of saved energy (CSE), which discounts the incremental cost of a measure over its lifetime, is less than $0.086/kWh for electricity, or $12.53/MMBtu for natural gas, the current average residential costs in Kentucky (DEDI 2011). Estimated levelized costs for each efficiency measure, which assumes a discount rate of 5%,10 are shown in Table A-4. Equation 1 shows the calculation for cost of conserved energy.
Equation 1. CSE = PMT ((Discount Rate), (Measure Lifetime), (Measure Cost)) / (Annual Savings per Measure)
Existing Buildings
Existing buildings were analyzed using building modeling software. The software package, TREAT11, was chosen for its reputation as one of the better residential modeling packages available. It uses a variety of inputs, including house characteristics, appliances, weather data, and occupancy patterns to model the expected energy use of a particular home. It also includes a library of efficiency measures that can be used to model potential efficiency improvements. TREAT was used to establish a baseline as well as model the effects of efficiency improvement measures on the average Kentucky single-family home.
Establishing a Baseline
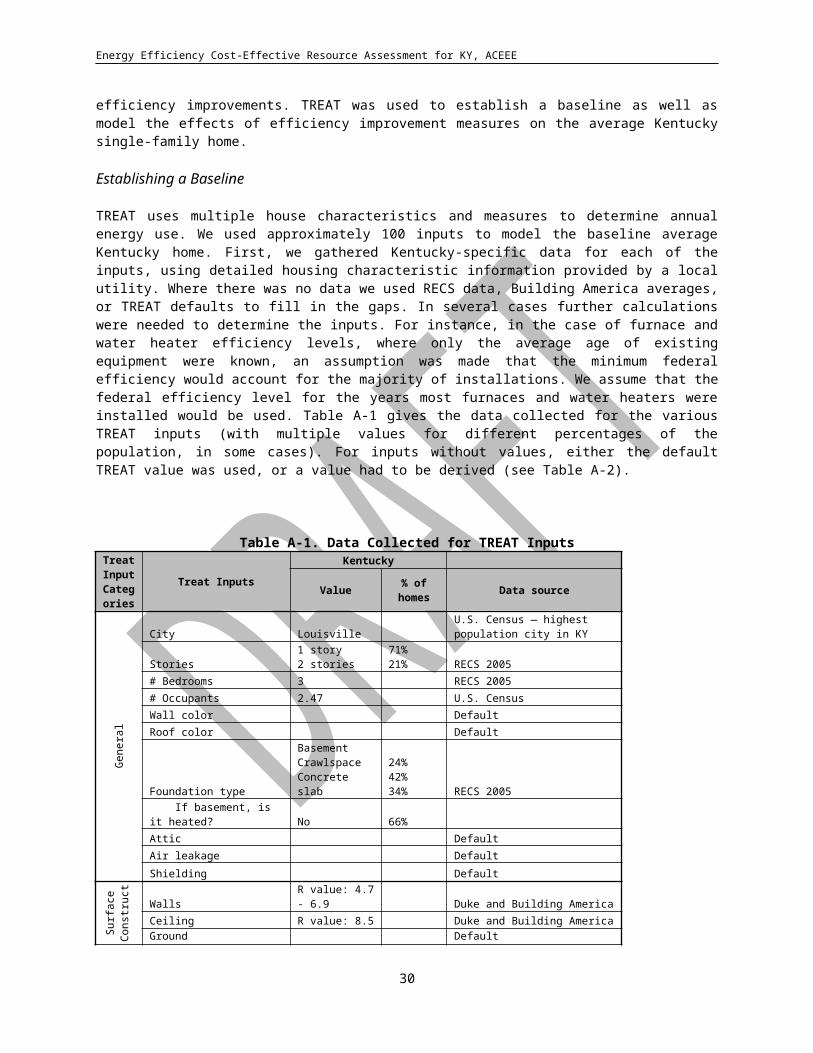
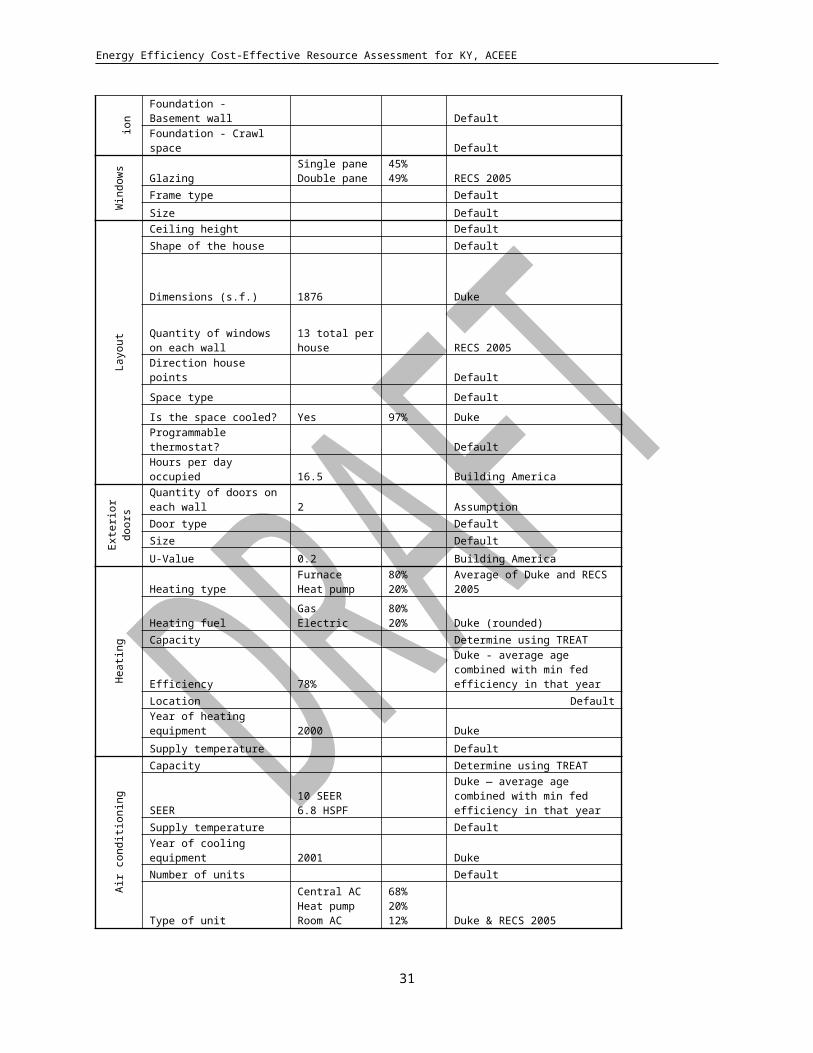
TREAT uses multiple house characteristics and measures to determine annual energy use. We used approximately 100 inputs to model the baseline average Kentucky home. First, we gathered Kentucky-specific data for each of the inputs, using detailed housing characteristic information provided by a local utility. Where there was no data we used RECS data, Building America averages, or TREAT defaults to fill in the gaps. In several cases further calculations were needed to determine the inputs. For instance, in the case of furnace and water heater efficiency levels, where only the average age of existing equipment were known, an assumption was made that the minimum federal efficiency would account for the majority of installations. We assume that the federal efficiency level for the years most furnaces and water heaters were installed would be used. Table A-1 gives the data collected for the various TREAT inputs (with multiple values for different percentages of the population, in some cases). For inputs without values, either the default TREAT value was used, or a value had to be derived (see Table A-2).
10 The 5% discount rate is a real discount rate, which excludes the effects of inflation. A 5% real discount rate is equivalent to an 8-9% nominal discount rate as typically used by utilities in their analyses of cost-effectiveness. Nominal discount rates are typically based on utility cost of capital and include allowance for inflation. Our assumption of a 5% real discount rate applies to our commercial and industrial analyses as well. We use real rates since all of our calculations are in terms of 2007$.11 http://www.psdconsulting.com/software/treat
20
Energy Efficiency Cost-Effective Resource Assessment for KY, ACEEE
Table A-1. Data Collected for TREAT InputsTreat Input Categories
Treat InputsKentucky
Value % of homes Data source
Gen
eral
City LouisvilleU.S. Census — highest population city in KY
Stories1 story2 stories
71%21% RECS 2005
# Bedrooms 3 RECS 2005# Occupants 2.47 U.S. CensusWall color DefaultRoof color Default
Foundation type
BasementCrawlspaceConcrete slab
24%42%34% RECS 2005
If basement, is it heated? No 66%Attic DefaultAir leakage Default
Shielding Default
Sur
face
C
onst
ruct
ion Walls
R value: 4.7 - 6.9 Duke and Building America
Ceiling R value: 8.5 Duke and Building AmericaGround DefaultFoundation - Basement wall Default
Foundation - Crawl space Default
Win
dow
s
GlazingSingle paneDouble pane
45%49% RECS 2005
Frame type Default
Size Default
Layo
ut
Ceiling height DefaultShape of the house Default
Dimensions (s.f.) 1876 Duke
Quantity of windows on each wall
13 total per house RECS 2005
Direction house points Default
Space type Default
Is the space cooled? Yes 97% Duke
Programmable thermostat? Default
Hours per day occupied 16.5 Building America
Ext
erio
r doo
rs Quantity of doors on each wall 2 AssumptionDoor type DefaultSize Default
U-Value 0.2 Building America
Hea
ting Heating type
FurnaceHeat pump
80%20% Average of Duke and RECS 2005
Heating fuelGasElectric
80%20% Duke (rounded)
Capacity Determine using TREAT
21
Energy Efficiency Cost-Effective Resource Assessment for KY, ACEEE
Efficiency 78%Duke - average age combined with min fed efficiency in that year
Location DefaultYear of heating equipment 2000 Duke
Supply temperature Default
Air
cond
ition
ing
Capacity Determine using TREAT
SEER10 SEER6.8 HSPF
Duke — average age combined with min fed efficiency in that year
Supply temperature DefaultYear of cooling equipment 2001 DukeNumber of units Default
Type of unit
Central ACHeat pumpRoom AC
68%20%12% Duke & RECS 2005
Fans
Ventilated area 2.4 fans/home DefaultVentilation rate DefaultHeat recovery effectiveness Default
Hours/day used Default
Hot
Wat
er
Type of unit Storage unit Assumption
Hot water fuelElectricGas
64%36% Duke and RECS 2005
Tank volume 43 gallons RECS 2005Input DefaultSupply temperature DefaultAdditional insulation R-Value DefaultNumber of units DefaultSolar fraction of water heating DefaultYear 2003 Duke
Thermal efficiency0.540.89
GasElectric
Duke — average age combined with min fed efficiency in that year
Hot
Wat
er
Pip
ing
Insulation R-Value DefaultTotal area of piping DefaultRecirculating system Default% Piping running through each space Default
Hot
W
ater
D
ema Usage adjustment multiplier Default
Are dishes handwashed Default
Ligh
ting
Watts per fixture6738
IncandescentFluorescent
Navigant Lighting Characterization
Hours/day used1.92.2
IncandescentFluorescent
Navigant Lighting Characterization
# of fixtures376
IncandescentFluorescent
Navigant Lighting Characterization
App
lianc
es Refrigerator 1 Duke
Clothes Dryer 1 DukeClothes Washer 1 Duke
22

Energy Efficiency Cost-Effective Resource Assessment for KY, ACEEE
TVs 3 Duke
Freezer 0 Duke
Dishwasher 1 Duke
Microwave 1 Duke
Computer 1 Duke
Oven/range 1 Duke
DVD/Blu Ray 1 Duke
DVR 1 Duke
MP3/CD player 1 Duke
Gaming system 0 Duke
After gathering and/or calculating the data, we determined which values to use in TREAT. Because TREAT models a single home, for inputs that had multiple values (e.g., 71% of homes are one story and 21% are two stories) a determination was made which value to use. Wherever possible an average was used. However, for discrete data points (e.g., gas vs. electric), the majority won. This method was used for all inputs except for five. Five inputs that were deemed most critical to baseline energy use, including foundation type, heating equipment, square footage, air conditioner type, and water heater fuel, were selected to have variable inputs. We ran the model 36 times to account for every possible combination of these five inputs, and used a weighted average of the results to calculate the average baseline home. Table A-2 lists the inputs chosen or calculated for the TREAT baseline model.
Table A-2. TREAT InputsTreat Input
Categories
Treat Inputs
Gen
eral
City Louisville
Stories 1 story# Bedrooms 3# Occupants 2Wall colorRoof color
Foundation type VARIABLE If basement, is it heated? NoAttic DefaultAir leakage
Shielding Default
Sur
face
C
onst
ruct
ion Walls R value: 4.7 - 6.9
Ceiling R value: 8.5Ground DefaultFoundation - Basement wall Default
Foundation - Crawl space Default
Win
dow
s
Glazing Double paneFrame type Default
Size Default
Layo
ut Ceiling height Default
Shape of the house Default
23
Energy Efficiency Cost-Effective Resource Assessment for KY, ACEEE
Dimensions
104919863278
Quantity of windows on each wall
9 for small houses13 for medium houses16 for large houses
Direction house points Default
Space type Default
Is the space cooled? Yes
Programmable thermostat? Default
Hours per day occupied 16.5
Ext
erio
r doo
rs Quantity of doors on each wall 2Door type DefaultSize Default
U-Value 0.2
Hea
ting
Heating type VARIABLE
Heating fuelGas for furnaceElectric for heat pump
Capacity Determine using TREAT
Efficiency 78% for furnacesLocation DefaultYear of heating equipment 2000
Supply temperature Default
Air
cond
ition
ing
Capacity Determine using TREAT
SEER10 SEER6.8 HSPF
Supply temperature DefaultYear of cooling equipment 2001Number of units 1
Type of unit VARIABLE
Fans
Ventilated area 2.4 fans/homeVentilation rate DefaultHeat recovery effectiveness Default
Hours/day used Default
Hot
Wat
er
Type of unit Storage
Hot water fuel VARIABLE
Tank volume
38 gallons for small houses43 gallons for medium houses47 gallons for large houses
Input DefaultSupply temperature DefaultAdditional insulation R-Value DefaultNumber of units 1Solar fraction of water heating DefaultYear 2003
Thermal efficiency0.54 - Gas0.89 - Electric
24
Energy Efficiency Cost-Effective Resource Assessment for KY, ACEEE
Hot
Wat
er
Pip
ing
Insulation R-Value DefaultTotal area of piping DefaultRecirculating system Default
% Piping running through each space DefaultH
ot
Wat
er
Dem
and
Usage adjustment multiplier Default
Are dishes handwashed DefaultLi
ghtin
g Watts per fixture67 W incandescent38 W fluorescent
Hours/day used1.9 for incandescent2.2 for fluorescent
# of fixtures37 incandescents6 fluorescents
App
lianc
es
Refrigerator 1
Clothes Dryer 1
Clothes Washer 1
TVs 3
Freezer 0
Dishwasher 1
Microwave 1
Computer 1
Oven/range 1
DVD/Blu Ray 1
DVR 1
MP3/CD player 1
Gaming system 0
TREAT takes these inputs and gives total home energy use as well as electricity and natural gas consumption by end-use category. All of these outputs were collected for all 36 scenarios, and weighted averages were calculated. Table A-3 gives the average energy use of a Kentucky single-family home, per TREAT.
Table A-3. Average Energy Use of a Single-Family Kentucky Home
End-UseAverage
Electricity Use (kWh)
Average Gas Use
(MMBtu)Heating 2,190 61.2Cooling 2,450 —Hot water 3,610 10.6Lighting 1,490 —Appliances & electronics 8,140 —Total 17,880 71.7
New Construction
We estimate savings from new construction by looking at three levels of efficiency in new homes: 15%, 30%, and 50% better than current energy code. In estimating new home energy savings, we use a similar approach as building codes, which address HVAC and water heating consumption only. We estimated % Applicable by allocating each home into one of the three bins, with 15% predominating the
25
Energy Efficiency Cost-Effective Resource Assessment for KY, ACEEE
early years and 50% the later years. See Equation 2 for a summary of how we calculate savings in new construction.
Equation 2. Efficiency Resource Potential in 2030 (GWh/MMBtu) = (% savings per home) x (Percent Applicable) x (Baseline energy use per single family home) x (Projected number of new homes)
Efficiency Potential Analysis
For the analysis of energy efficiency improvement measures, we used TREAT to calculate the savings against the established baseline. Measures were chosen that were applicable to the baseline (e.g., efficient pool pumps were not chosen since pool pumps were not included in the baseline), and were available in the TREAT library of efficiency improvement measures. Cost assumptions and lifetime estimates for each of the measures came from multiple sources.
One of the advantages of using modeling software is that the interaction factors between various measures are automatically calculated. For instance, when lighting is switched from incandescents to CFLs, the cooling load decreases and the heating load increases. These interactions are difficult to account for without the assistance of modeling software. Because TREAT displays both the savings from individual measures and the overall savings of all the measures as a package, this phenomenon can be quantified: in many of the scenarios, the sum of the individual measure savings was roughly double the actual savings of the measures as a package.
We ran these efficiency improvement models on all of the variable scenarios. The weighted average individual measure savings were used to compute the residential efficiency potential in Kentucky.
The next step was to adjust the measure savings by the current market share of products that already meet the efficiency criteria. We also adjusted the incremental cost so that the cost would be split between gas and electric savings. The electric incremental cost for a measure was determined by the percentage of savings attributed to electricity (versus gas); and vice versa for determining gas incremental cost. These assumptions are made explicit in Tables A-4 and A-5.
We then adjusted replacement measures with lifetimes more than 20 years to only account for the percent turning over in 20 years, which represents the time period of the analysis.
Equation 3 shows our calculation for efficiency resource potential, incorporating the 2 factors discussed above.
Equation 3. Efficiency Resource Potential = ∑ (Annual Savings per Measure) x (Percent Turnover) x (Adjustment Factor)
To calculate the efficiency resource potential savings by end-use in 2030, we present savings as a percent of end-use energy consumption (assuming current energy consumption by end-use from the baseline TREAT modeling). We then multiply the “% savings” by projected residential energy consumption for that end-use in 2030 to estimate the total savings potential in that year (see Equation 3).
26
Energy Efficiency Cost-Effective Resource Assessment for KY, ACEEE
Table A-4. Residential Single-Family Energy Efficiency Measure Characterizations - Electricity
Measures End-use category
Adjusted savings per
home
Cost of saved energy
% Turnove
r
% End-use
savings
Total savings in 2030
kWh $/kWh GWhAttic insulation HVAC 761.7 $ 0.01 95% 16% 1,100Infiltration reduction HVAC 75.3 $ 0.02 100% 2% 110SEER 16 AC HVAC 574.6 $ 0.08 100% 12% 870Efficient heat pump HVAC 250.9 $ 0.05 100% 5% 380Triple-paned windows HVAC 209.5 $ 0.04 95% 4% 300HVAC tune-up HVAC 129.8 $ 0.03 100% 3% 200
HVAC measures 42% 2,960CFLs Lighting 165.2 $ (0.01) 100% 11% 250Advanced lighting (LEDs) Lighting 300.3 $ 0.06 100% 20% 460
Lighting Measures 31% 7101 W Standby Appliances 164.3 $ - 100% 2% 250Energy Star refrigerator Appliances 394.9 $ 0.01 100% 5% 600Energy Star clothes washer Appliances 266.3 $ 0.02 100% 3% 400Energy Star dishwasher Appliances 252.9 $ 0.01 100% 3% 380Energy Star TV Appliances 34.9 $ 0.64 100% 0% 50Second refrigerator removal Appliances 323.0 $ - 100% 4% 490
Appliance Measures 18% 2,170Low Flow Showerheads Water heating 306.2 $ 0.00 100% 8% 460Heat pump water heater Water heating 412.2 $ 0.06 100% 11% 630
Water Heating Measures 20% 1,090Whole-house information feedback system ALL 336.3 $ 0.09 100% 2% 510
Whole House Measures 2% 510New home 15% better than code (Energy Star home) New Construction 122.7 $ 0.03 63% 0% 20New home 30% better than code (Proposed Building Code) New Construction 486.9 $ 0.03 63% 2% 80New home 50% better than code (Tax-credit-eligible) New Construction 1043.4 $ 0.04 63% 4% 160
New Construction 6% 260TOTAL 7,700
27
Energy Efficiency Cost-Effective Resource Assessment for KY, ACEEE
Table A-5. Residential Single-Family Energy Efficiency Measure Characterizations – Natural Gas
Measures End-use category
Adjusted savings per
home
Cost of saved energy
% Turnove
r
% End-use
savings
Total savings in 2030
MMBtu $/MMBtu BbtuAttic insulation HVAC 10.4 $ 3.71 95% 16% 4,200Infiltration reduction HVAC 1.9 $ 4.43 100% 3% 820Condensing furnace HVAC 7.5 $ 5.95 95% 12% 3,020Triple-paned windows HVAC 1.2 $ 12.09 95% 2% 500HVAC tune-up HVAC 1.7 $ 2.36 100% 3% 730Energy Star refrigerator HVAC -0.6 $ - 100% -1% (250)
HVAC measures 35% 9,020Energy Star clothes washer Water heating 0.7 $ 6.75 100% 7% 290Energy Star dishwasher Water heating 0.3 $ 2.32 100% 3% 130Efficient water heater - gas Water heating 1.2 $ 6.35 100% 11% 500Low Flow Showerheads Water heating 0.9 $ 0.94 100% 8% 370
Water Heating Measures 29% 1,290New home 15% better than code (Energy Star home) New Construction 1.6 $ 3.08 63% 1% 150New home 30% better than code (Proposed Building Code) New Construction 6.4 $ 2.84 63% 6% 600New home 50% better than code (Tax-credit-eligible) New Construction 13.8 $ 3.19 63% 12% 1,290
New Construction 19% 2,040TOTAL 12,350
28

Energy Efficiency Cost-Effective Resource Assessment for KY, ACEEE
A.1.4 Residential Sector Measure Descriptions
Infiltration Reduction
Measure Description: Application of foam and/or caulk around leakage areas applied and tested by a professional using a blower-door.
Data Explanation: Cost ($100) from MT 2004. Useful life of 15 years from SWEEP (2002).
Attic Insulation
Measure Description: Add insulation in attic floor to R-38.
Data Explanation: Incremental cost of $0.32/sq ft from DEER database (CEC 2005). Useful measure life of 20 years from NYSERDA (2003).
Efficient Windows
Measure Description: Window replacements that are triple-paned, argon-filled, and e=0.1 on surface 2 or 3.
Data Explanation: Incremental cost of $1.50/sq ft. Number of windows determined by regional RECS data, and size of windows set as TREAT default, resulting in an average of 195 sq ft of fenestration.
Efficient Central AC
Measure Description: 16 SEER Central AC
Data Explanation: Incremental cost of $556 from ENERGY STAR calculator (EPA 2008).
Efficient Gas Furnace
Measure Description: AFUE 94%
Data Explanation: Incremental cost ($320) from ENERGY STAR calculator (EPA 2008). Market share (32%) and measure life (18 years) from Sanchez et al. (2007).
Efficient Heat Pump
Measure Description: HSPF 9.
Data Explanation: Incremental cost ($1000) from ENERGY STAR calculator. Measure life (18 years) from Sanchez et al. (2007).
HVAC Tune-up
Measure Description: Tune-up of heating and cooling eq uipment.
Data Explanation: Incremental cost ($125) from Kema (2011). Measure life (5 years) from Cadmus (2011).
Low-Flow Showerhead
Measure Description: 2.0 gallons per minute (gpm) showerhead.
29
Energy Efficiency Cost-Effective Resource Assessment for KY, ACEEE
Data Explanation: Cost estimate ($23) for a low-cost, basic model from the DEER database (CEC 2005). Measure life (10 years) from ACEEE (1994).
Condensing Gas Water Heater
Measure Description: 54 gallon natural gas storage water heater, 0.86 EF.
Data Explanation: Incremental cost ($750) and measure life (13 years) from Amann et al. (2007).
Efficient Electric Water Heater
Measure Description: 54 gallon electric storage water heater, 0.93 EF.
Data Explanation: Incremental cost ($90) from Amann et al. (2007). Measure life (14 years) from NYSERDA (2003). Market share (36%) estimated based on percent of products on the market meeting EF 0.93 in the GAMA product database (GAMA 2007).
Heat Pump Water Heater
Measure Description: 40-55 gallon heat pump water heater, 2.0 EF.
Data Explanation: Incremental cost ($814), measure life (13 years), and market share (5%) from Lowenberger et al (2012).
Compact Fluorescent Lighting
Measure Description: 22W CFL’s replacing 70% of baseline lighting that isn’t already CFL.
Data Explanation: Lamp installed base, wattage, and proportion of CFL’s from Navigant study (2008) and ACEEE estimates of market changes since the release of the Navigant report. Negative incremental cost is due to the higher initial costs for CFLs being canceled out by the longer lifetime of CFLs.
LED Lighting
Measure Description: LED lighting replacing 30% of baseline lighting that isn’t already CFL.
Data Explanation: Savings and market share from SWEEP (2012). The incremental cost was determined from ACEEE’s analysis of market prices from common home improvement stores.
Efficient Refrigerator
Measure Description: ENERGY STAR 20-CF top-freezer refrigerator.
Data Explanation: Incremental cost ($34) and measure life (19 years) from ACEEE analysis for PG&E/CA Title 24 (PG&E 2007). Market share (28%) from Sanchez et al. (2007) appliance sales data.
Removal of Second Refrigerator
Measure Description: Removal service for homes with a second refrigerator.
Data Explanation: Average savings determined through TREAT. The incremental cost is assumed to be zero, because utilities typically offer an incentive to for refrigerator removal. Market share is zero, as there are no known programs currently being run in Kentucky.
Efficient Clothes Washer
30
Energy Efficiency Cost-Effective Resource Assessment for KY, ACEEE
Measure Description: ENERGY STAR clothes washer
Data Explanation: Incremental cost ($167) from Sanchez et al. (2007). Current market share (36%) from EPA (2007).
Efficient Dishwasher
Measure Description: ENERGY STAR dishwasher
Data Explanation: Incremental cost ($30) from DOE (2007). Market share (15%) from Sanchez et al. (2007).
Efficient Televisions
Measure Descriptions: ENERGY STAR televisions.
Data Explanation: Incremental cost ($50) from the incremental cost of 3 televisions ($25 each); ACEEE estimate. Current market share (25%) from ENERGY STAR 2006 appliance sales data.
One-Watt Standby for All Household Electronics
Measure Description: All new electronics devices required to have maximum “off” mode power level of 1 watt.
Data Explanation: New measure consumption (440 kWh) and baseline energy consumption (175 kWh) from Sachs et al. (2004). Current market share (34%) assumed by averaging market shares of all ENERGY STAR home electronics equipment.
Enhanced Billing and Home Energy Reports
Measure Description: Improved information on how energy is being used in the home included on the utility bills, along with customized home energy reports.
Data Explanation: Savings (1.9% of electricity use) from SWEEP (2012). Current market share (1%), measure life (11 years), and incremental cost ($250) from Eldridge et al (2009).
31
Energy Efficiency Cost-Effective Resource Assessment for KY, ACEEE
A.2. Commercial Buildings Sector
A.2.1. Electric Analysis
To estimate the resource potential for efficiency in commercial buildings in Kentucky, we first developed a disaggregate characterization of baseline electricity consumption in the state for current electricity use and a reference load forecast (see Table A-6 below). Highly disaggregated commercial electricity consumption data is unfortunately not available at the state level. To estimate these data, we started with current electricity consumption for the Kentucky commercial sector (EIA 2011) and a forecast out to 2030 based on DEDI projections, and we disaggregated by end-use using average regional data from CBECS 2003 (EIA 2006) and AEO 2011 (EIA 2011).
Table A-6. Baseline Commercial Electricity Consumption by End-Use (GWh)End-Use 2010 % 2020 % 2030 %
Heating 798 4% 899 4% 880 4%Cooling 2,539 13% 2,861 13% 2,879 12%
Ventilation 2,272 12% 2,559 12% 2,912 12%HVAC subtotal 5,609 29% 6,319 29% 6,671 27%Water Heating 429 2% 483 2% 509 2%
Refrigeration 2,079 11% 2,342 11% 2,353 10%Lighting 5,740 30% 6,467 30% 7,015 29%
Office Equipment 1,409 7% 1,588 7% 1,863 8%Other 4,102 21% 4,622 21% 6,203 25%Total 19,389 100% 21,846 100% 24,613 100%
Next, we estimated commercial square footage in Kentucky using commercial square footage data for the East South Central census region from EIA 2011. We apportion this square footage to Kentucky based on employment data from Moody’s Economy.com (Economy.com 2011a). We assume that the percentage of employment in the East South Central census region attributable to Kentucky is roughly equal to the percentage of commercial square floorspace attributable to the state. By multiplying this percentage to the total commercial square footage in the East South Central census region we calculated 1.02 billion square feet of commercial floorspace in the state.
A.2.1.1 Measure Cost-Effectiveness
We then analyzed thirty-eight efficiency measures for existing commercial buildings and three new construction whole-building measures to examine the cost-effective energy efficiency resource potential. For each efficiency measure, we estimated electricity savings (Annual Savings per Measure) and incremental cost (Measure Cost) in a “replacement on burnout scenario,” which assumes that the product is replaced or the measure is installed at the end of the measure’s useful life. Savings and costs are incremental to an assumed Baseline Measure. We estimated savings (kWh) and costs ($) on a per-unit and/or a per-square foot commercial floorspace basis. For each measure we also assumed a Measure Lifetime, or the estimated useful life of the product.
A measure is determined to be cost-effective if its levelized cost of saved energy, or cost of conserved energy (CCE), is less than 7.8 cents/kWh, the estimated current average commercial cost of electricity in Kentucky (DEDI 2011). The estimated CCE for each efficiency measure, which assumes a discount rate of 5%, are shown in the measure descriptions below. Equation 1 shows the calculation for cost of conserved energy.
Our assumed Baseline Measure, Annual Savings per Measure, Measure Cost, Measure Lifetime, and CCE are reported for each of the efficiency measures in the list of measure descriptions below. We group the thirty-eight efficiency measures for existing commercial buildings by end-use and list the three new building measures last.
32
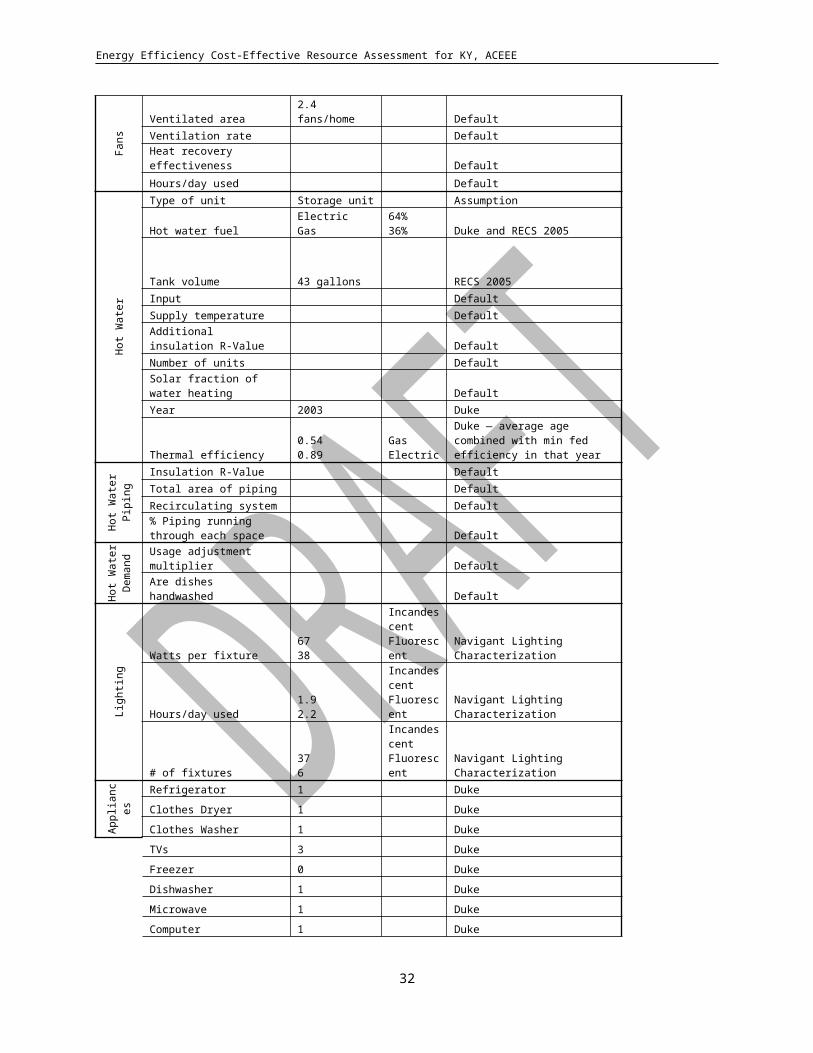
Energy Efficiency Cost-Effective Resource Assessment for KY, ACEEE
Equation 1. CCE = PMT ((Discount Rate), (Measure Lifetime), (Measure Cost)) / (Annual Savings per Measure (kWh))
A.2.1.2. Total Statewide Resource Potential
For each measure, we derived Annual Savings per Measure on a per square foot basis (kWh per square foot) for the applicable end-use. For measures that we only have savings on a per-unit or per-building basis, we first derive the percent savings and multiply by the Baseline Electricity Intensity for that end-use. The assumed baseline intensities for each end use are shown in Table A-7. As an example, for a specific lighting measure we multiply its percent savings by the baseline electricity intensity (kWh per square foot) for the lighting end-use.
Table A-7. Commercial End-Use Baseline Electricity Intensities (kWh per s.f.)End Use 2010
kWh/s.f.Heating 0.67Cooling 2.1
Ventilation 1.90Water Heating 0.4
Cooking 0.1Lighting 4.8
Refrigeration 1.74Office Equipment 1.2
Other 3.3HVAC Subtotal 4.7
Total 16.2
To estimate the total efficiency resource potential in existing commercial buildings in Kentucky by 2030, we first adjusted the individual measure savings by an Adjustment Factor (see Equation 2). This factor accounts for two adjustments: the technical feasibility of efficiency measures, called the Percent Applicable (the percent of Kentucky floorspace that satisfies the basecase conditions and other technical prerequisites such as heating fuel type and cooling equipment, etc.); and the Current Market Share, or the percent of products that already meet the efficiency criteria. These assumptions are outlined in each of the efficiency measure descriptions below.
Equation 2. Adjustment Factor = Percent Applicable x (1-Current Market Share)
We then adjusted total savings for interactions among individual measures. For example, we adjusted HVAC equipment savings downward to account for savings already realized through improved building envelope measures (insulation and windows), which reduce heating and cooling loads. Similarly, we adjusted water heating equipment savings to account for reduced water heating loads from the use of more efficient clothes washers. The multiplier for these adjustments is called the Interaction Factor.
Finally, we adjusted replacement measures with lifetimes more than 11 and 21 years to only account for the percent turning over in 11 and 21 years, which represents the benchmark years of 2020 and 2030, respectively. Note that the multiplier, Percent Turnover, is only applicable to products being replaced upon burnout and not retrofit measures such as insulation. These retrofit measures therefore have 100% of measures “turning over.” We then calculated the resource potential for each measure in the state using Equation 3, which takes into account all of the adjustments described above. The sum of the resource potential from all measures is the overall energy efficiency resource potential in the state’s commercial buildings sector.
33
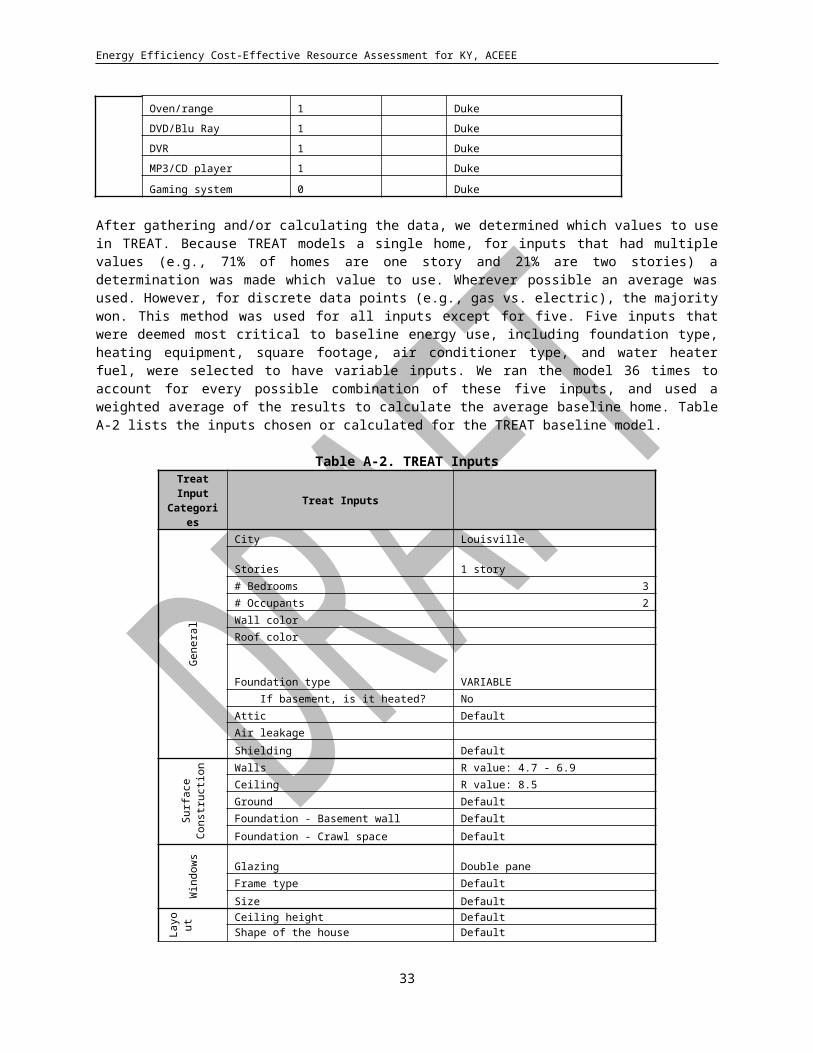
Energy Efficiency Cost-Effective Resource Assessment for KY, ACEEE
Equation 3. Efficiency Resource Potential in 2020 and 2030 (GWh) = (Annual Savings per Measure (kWh per square foot)) x (Commercial floor space in Kentucky in millions of square feet) x (Percent Applicable) x (Interaction Factor) x (Percent Turnover)
A.2.1.3 Efficiency Measures
Below we present the forty-one efficiency measures examined for this analysis, grouped by end-use costs, savings (kWh) per product or square foot, Percent Applicable, Interaction Factor, Percent Turnover, and total savings potential (GWh) in 2030. Detailed descriptions of each measure are given below, grouped by end-use.
Building Shell Improvements
Cool Roof
Measure Description: This measure involves installing a sun-reflective coating on the roof of a building with a flat top. This reduces air conditioning energy loads by reducing the solar energy absorbed by the roof.
Basecase: The baseline electricity intensity for HVAC end uses in Kentucky (4.7 kWh/ft2/year) is used as the basecase.
Data Explanation: We assume 4% HVAC load savings (ACEEE 1997) off the baseline electricity intensity for HVAC end-uses in Kentucky (EIA 2006), an incremental cost of $0.25/ft2 (SWEEP 2002), and a 20-year average lifetime (SWEEP 2002). Percent applicable (80%) is an ACEEE estimate. Savings and cost per unit are based on a 15,000 ft2 building (ACEEE 1997). The levelized cost is calculated to be 5.5 cents/kWh.
Roof Insulation
Measure Description: Fiberglass or cellulose insulation material in roof cavities will reduce heat transfer, though the type of building construction limits insulation possibilities. R-values describe the performance factor for insulation levels.
Basecase: The basecase electricity intensity for this measure was disaggregated from the post-savings electricity intensity and the percentage of savings.
Data Explanation: We assume 3% savings and a post-savings electricity intensity of 0.28 kWh/ft2/year, based on an average of four building types (ACEEE 1997). An average lifetime of 25 years (CL&P 2007) and an incremental cost of 11 cents/s.f. were also assumed. The measure is shared with gas savings as well, so the portion of the incremental cost attributed to electric savings is 6 cents/s.f. The levelized cost is 1.7 cents/kWh.
Double Pane Low-Emissivity Windows
Measure Description: Double-pane windows have insulating air- or gas-filled spaces between each pane, which resist heat flow. Low-emissivity (low-e) glass has a special surface coating to reduce heat transfer back through the window, and a window’s R-value represents the amount of heat transfer back through a window. Low-e windows are particularly useful in climates with heavy cooling loads, because they can reflect anywhere from 40% to 70% of the heat that is normally transmitted through clear glass. The Solar Heat Gain Coefficient (SHGC) represents the fraction of solar energy transferred through a window. For example, a low-e window with a 0.4 SHGC keeps out 60% of the sun’s heat.
Basecase: The basecase electricity intensity for this measure was disaggregated from the post-savings electricity intensity and the percent savings.
Data Explanation: Percent savings of 3% apply to whole-building electricity consumption (ACEEE 1997). Incremental costs assume $2 per square foot of window (SWEEP 2002). This measure is shared with gas savings as well. A measure life of 25 years is from SWEEP (2002). Percent applicable is an ACEEE estimate. The levelized cost is calculated to be 1.1 cents/kWh.
Heating and Cooling Measures: Equipment and Controls
34
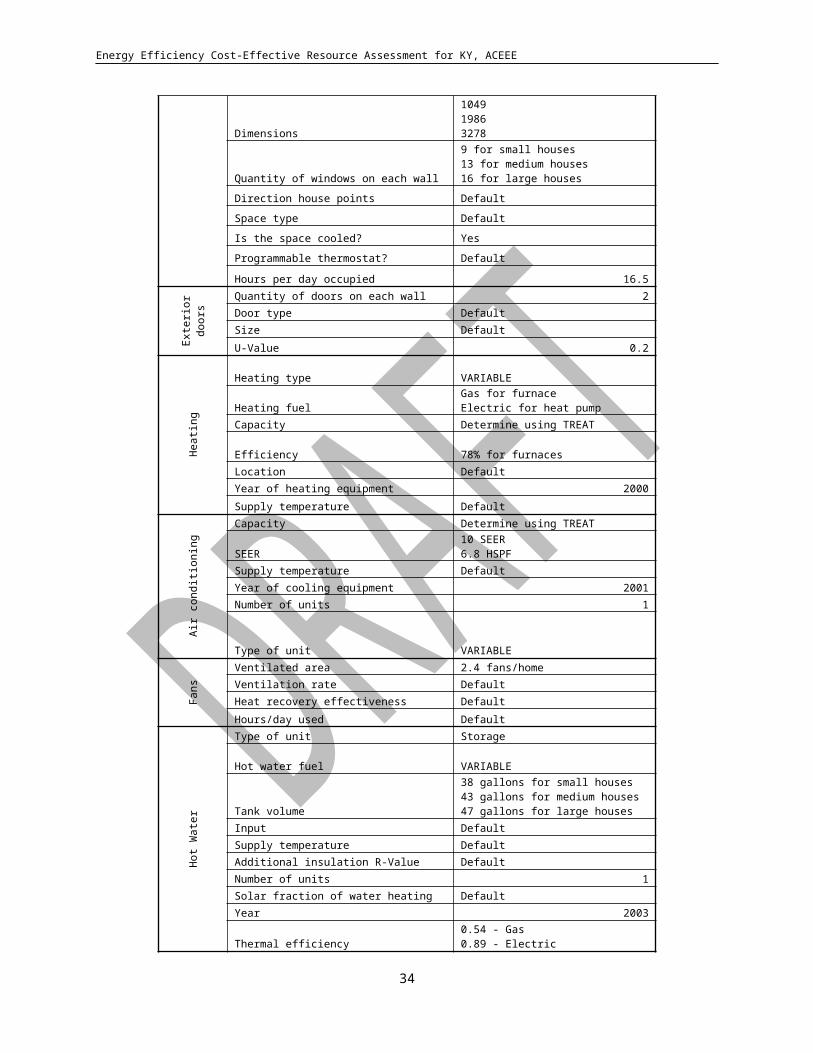
Energy Efficiency Cost-Effective Resource Assessment for KY, ACEEE
Duct Testing and Sealing
Measure Description: Testing and sealing air distribution ducts saves energy. This measure assumes supply and return ducts will be fully sealed.
Basecase: The basecase assumes air loss of 29% of fan flow, and leakage of 15% of the system flow.
Data Explanation: Percent savings of 6% apply to whole-building electricity consumption (SWEEP 2002). An incremental cost of $3,375, which assumes $300 per ton, a 10 year lifetime, and 25% applicability are ACEEE estimates. The levelized cost is calculated to be 1.1 cents/kWh.
Primary Air-Handler Fans with Variable-Frequency Drive
Measure Description: Variable Frequency Drive (VFD) controls the speed of a motor by adjusting the frequency of incoming power. By controlling the speed of a motor, the output of the system can be matched to the requirements of the process, thereby improving efficiency.
Basecase: The basecase unit is a 50 hp fan with 60% load factor, 93% efficiency (ODP, EPAct levels) and 3653 operating hours/year (21-50 hp category from ACEEE standards savings analysis).
Data Explanation: We assume 25% savings applies to ventilation only (ACEEE 1997), which is a conservative estimate. We estimate a $6,650 incremental cost, which assumes $125/hp for VFD and $8/hp for a better fan, and a 10-year measure life (SWEEP 2002). ACEEE estimates that this measure can apply to 40% of systems. The levelized cost is calculated to be 3.9 cents/kWh.
High-Efficiency Unitary AC/HP
65,000 Btu – 135 Btu135,000 Btu – 240,000 Btu
Measure Description: Unitary packaged air conditioners and heat pumps represent the heating, ventilating, and air conditioning (HVAC) equipment class with the greatest energy use in the commercial sector in the United States, and are used in approximately 48 percent of the cooled floor space in the commercial sector (DOE 2004). High efficiency units have a greater energy efficiency ratio (EER).
Basecase: The assumed basecase unit meets the 2010 federal efficiency standard. Baseline electricity intensity for this end-use, 4.9 kWh/ft2, is the estimated HVAC consumption in commercial buildings in Kentucky. This is data from the West South Central census division from EIA’s commercial buildings survey (EIA 2006).
Data Explanation: This measure includes two size ranges; the first is 65,000 Btu to 135,000 Btu, and the second is 135,000 Btu to 240,000 Btu. The measure assumes a 12 EER unit relative to the 2010 federal standard, which ranges from about 10.4 EER to 11.2 EER, depending on the unit type and size. The energy savings average 1,070 kWh (7.2%) for the smaller unit and 3,371 kWh (10.8%) for the larger unit. We assume a measure lifetime of 15 years (LBNL 2003). Incremental costs (average $629 for 65 kBtu to135 kBtu and $1,415 for 135 kBtu to 240 kBtu) are derived from DOE’s Technical Support Document (DOE 2004). Percent applicable (33% for 65 kBtu to 135 kBtu and 15% for 135 kBtu to 240 kBtu), and the percent of floorspace with cooling from unitary equipment are also from DOE’s Technical Support Document (DOE 2004). The levelized cost is calculated to be 4–5.7 cents/kWh, depending on unit type and size.
High-Efficiency Packaged Terminal AC/HP
Measure Description: PTACs and PTHPs are self-contained heating and air-conditioning units encased inside a sleeve specifically designed to go through the exterior building wall. The basic design of a PTAC is comprised of a compressor, an evaporator, a condenser, a fan, and an enclosure. They are primarily used to provide space conditioning for commercial facilities such as hotels, hospitals, apartments, dormitories, schools, and offices. High-efficiency units have a higher energy efficiency ratio (EER) for cooling units and coefficient of performance (COP) for heat pumps.
Basecase: Consistent with all HVAC-related measures, the baseline electricity intensity is 4.7 kWh/ft2, which is the estimated HVAC consumption in commercial buildings in Kentucky. This is based on the East South Central region from EIA’s commercial buildings survey (EIA 2006).
35
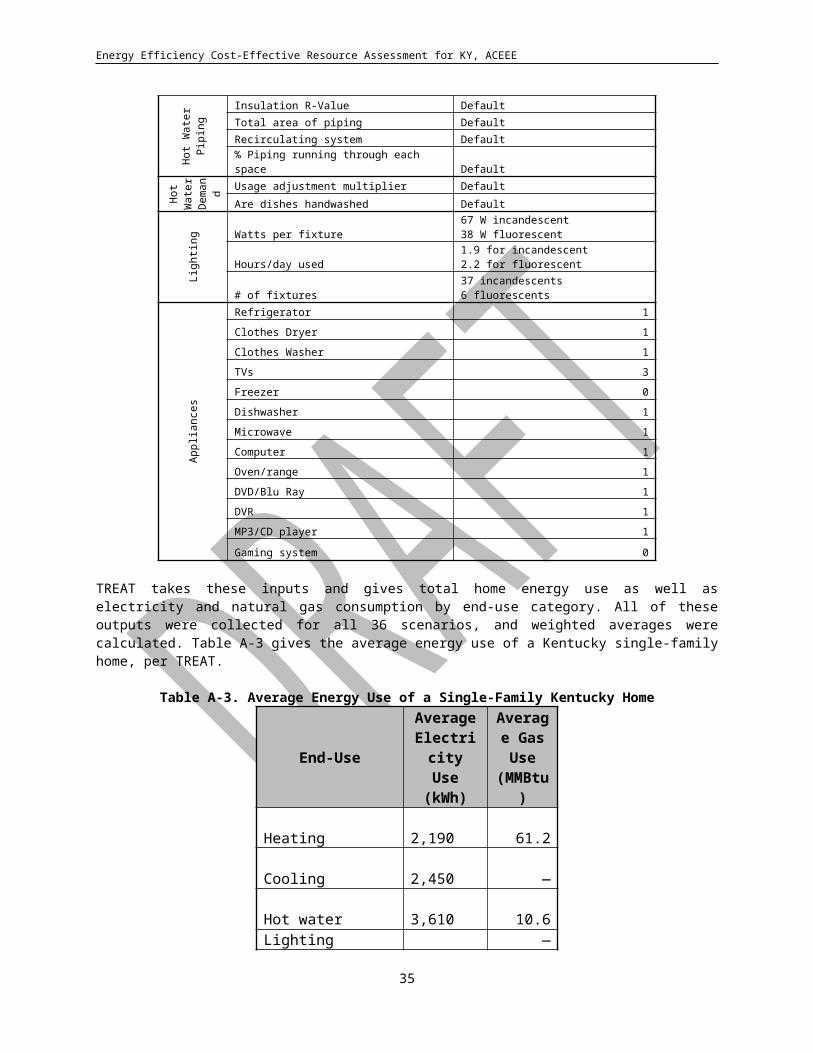
Energy Efficiency Cost-Effective Resource Assessment for KY, ACEEE
Data Explanation: We assume that high efficiency units save an average of 7.8%, or 226 kWh per unit, relative to a basecase, which is based on an ACEEE submission to ASHRAE using web data. The measure life is 15 years (ANSI/ASHRAE 1999). Percent applicable is 5%, which is the percent of cooling floorspace from packaged terminal units (ADL 2001). The levelized cost is calculated to be 3.8 cents/kWh.
Efficient Room Air Conditioner
Measure Description: An ENERGY STAR room AC must be at least a 10% improvement over the 2000 federal standard (an average 8000 Btu unit must have a 10.8 EER).
Basecase: The assumed basecase unit is a room AC that meets 2000 federal energy standards (an average 8000 Btu unit has a 9.8 EER) and uses an average of 677 kWh per unit. Baseline electricity intensity for this end-use, 2.1 kWh/ft2, is the estimated cooling consumption in commercial buildings in Kentucky. This is based on the East South Central census division from EIA’s commercial buildings survey (EIA 2006).
Data Explanation: We assume an ENERGY STAR room AC uses 590 kWh per year, saves 13% of basecase energy, and has an incremental cost of $35 (ENERGY STAR calculator). We assume a measure life of 13 years (ENERGY STAR calculator), a current market share of 52% (EPA 2007), and percent applicable assumes 8% percent of cooling floorspace uses room AC units (ADL 2001). The levelized cost is calculated to be 4.3 cents/kWh. This measure is applicable only from 2010 through the end of 2013.
2014 Efficient Room Air Conditioner
Measure Description: A room AC with higher efficiency than the 2014 federal standard (an 8000 Btu unit must have a 10.9 CEER).
Basecase: The assumed basecase unit is a room A/C that meets 2014 federal energy standards (an 8000 Btu unit must meet 10.9 CEER) and uses an average of 969 kWh per unit in commercial applications. Baseline electricity intensity for this end-use, 2.1 kWh/ft2, is the estimated cooling consumption in commercial buildings in Kentucky. This is based on the East South Central census division from EIA’s commercial buildings survey (EIA 2006).
Data Explanation: We assume a moderate increase in efficiency to 11.5 CEER, which saves 51 kWh/year, or 5% of annual energy consumption. This efficiency level carries an incremental cost of $28 (DOE 2011). We assume a measure life of 13 years (ENERGY STAR calculator), a current market share of 52% (EPA 2007), and percent applicable assumes 8% percent of cooling floorspace uses room AC units (ADL 2001). The levelized cost is calculated to be 5.8 cents/kWh. This measure is applicable only from 2014 through 2030.
High-Efficiency Chiller
Measure Description: “Chillers” are the hearts of very large air-conditioning systems for buildings and campuses with central chilled water systems. A centrifugal chiller utilizes the vapor compression cycle to chill water and reject the heat collected from the chilled water plus the heat from the compressor to a second water loop controlled by a cooling tower.
Basecase: The basecase unit assumes 0.634 kW/ton T24 from DEER for an average 150 ton system and 1,593 national average full-load operating hours from the ASHRAE 90.1-1999 analysis. Baseline electricity intensity for this end-use, 4.7 kWh/ft2, is the estimated HVAC consumption in commercial buildings in Kentucky. This is based on the East South Central census division from EIA’s commercial buildings survey (EIA 2006).
Data Explanation: We assume the new measure has 20% savings, which is derived from estimates provided in SWEEP (2002) and ACEEE (1997). The lifetime estimate of 23 years is from the ASHRAE Handbook (ASHRAE 2007). Incremental costs are $9,900 and assume a 150 ton average unit (CEC 2005). Percent applicable (33%) assumes percentage of cooling floorspace using chillers (ADL 2001). The levelized cost is calculated to be 2.4 cents/kWh.
Dual-Enthalpy Economizer
Measure Description: Economizers modulate the amount of outside air introduced into the ventilation system based on the relative temperature and humidity of the outside and return air. If the enthalpy, or the latent and sensible heat, of the outside air is less than that of the return air when space cooling is required, then the outside air is allowed to reduce or eliminate the cooling requirement of the AC equipment.
36
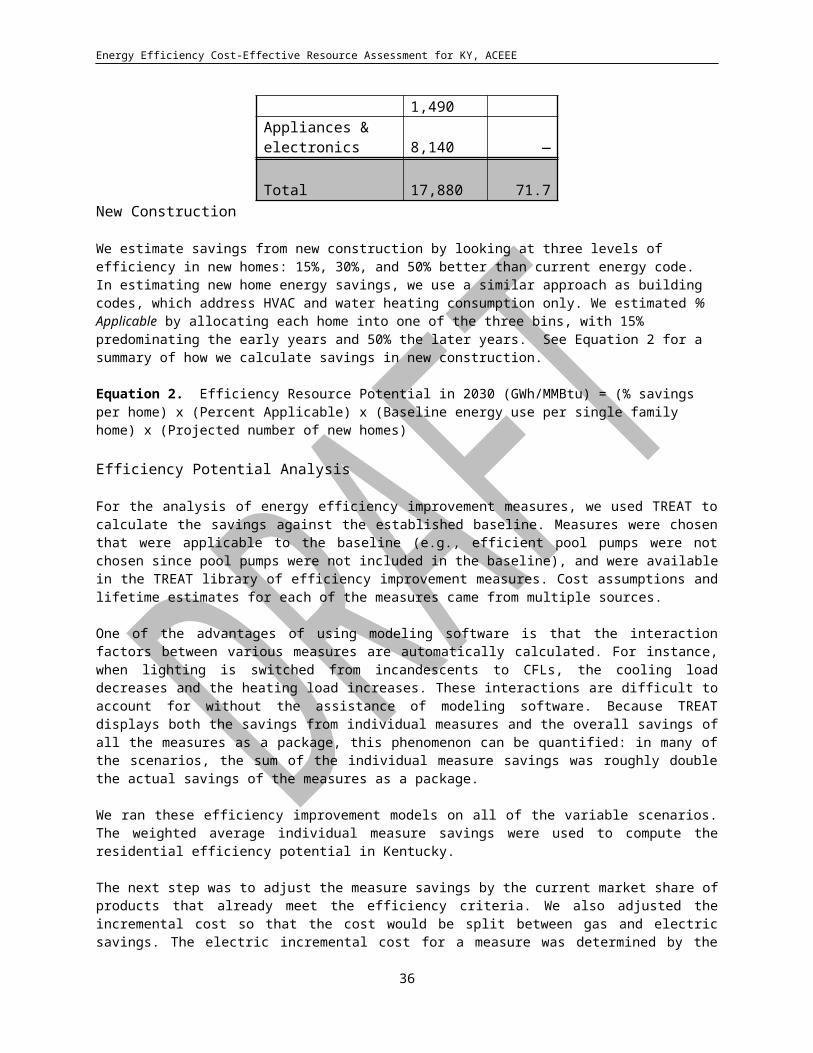
Energy Efficiency Cost-Effective Resource Assessment for KY, ACEEE
Basecase: Baseline electricity intensity, 2.1 kWh/ft2, is the estimated cooling intensity in commercial buildings in Kentucky. This is based on the East South Central census division from EIA’s commercial buildings survey (EIA 2006).
Data Explanation: Savings per unit assume 276 kWh (20% savings) per ton for an average 11-ton unit (CL&P 2007). Average measure life is 10 years (CL&P 2007). Incremental costs per unit are from NYSERDA (2003). Percent applicable is the portion of cooling square footage represented by packaged AC and HP units, and assumes that 90% of these unitary systems could benefit from economizers (ACEEE estimate). It also assumes a 5% current market share (ACEEE estimate). The levelized cost is calculated to be 3.8 cents/kWh.
Demand-Controlled Ventilation
Measure Description: Often, HVAC systems are designed to supply ventilated air based on assumed occupancy levels, resulting in over-ventilation. Demand-controlled ventilation monitors CO2 levels in different zones and delivers the required ventilation only when and where it is needed.
Basecase: The basecase is standard ventilation electricity consumption for a 50,000 ft2 office building, or about 40,000 kWh/year (Sachs et al. 2004). Baseline electricity intensity for this end-use, 1.9 kWh/ft2, is the estimated ventilation consumption in commercial buildings in Kentucky. This is based on the East South Central census division from EIA’s commercial buildings survey (EIA 2006).
Data Explanation: We assume 20% savings for this measure (Sachs et al. 2004). Energy use per unit is 32,000 kWh/year, assuming a 50,000 ft2 building (Sachs et al. 2004). The lifetime estimate is 15 years, and incremental costs are $3,450 (Sachs et al. 2004). The measure is applicable to 90% of larger (60%) cooling units (Sachs et al. 2004). The levelized cost is calculated to be 4.2 cents/kWh.
HVAC Tune-Up
Measure Description: Most HVAC technicians lack interest, training, equipment and methods to perform quality refrigerant charge and airflow (RCA) tune-ups. Because many new and existing air conditioners have improper RCA, which reduces efficiency, there is significant potential for energy savings by diagnosing and correcting RCA.
Basecase: The assumed basecase unit is a 4.5 ton commercial unitary AC/HP per California program experience (CPUC 2006), estimated to use 8,396 annual kWh per the unitary AC/HP measure. The base electricity intensity for the HVAC end-use is 4.1 kWh/ ft2, the average for small buildings less than 25,000 ft2, for which this measure is applicable.
Data Explanation: We assume 11% percent savings from this measure according to California’s DEER database (CEC 2005) and the California Refrigerant and Air Charge (RCA) program report (CPUC 2006). We assume that 60% of units have improper RCA (CPUC 2006), and therefore this measure is applicable to 60% of unitary HVAC units in buildings less than or equal to 25,000 ft2 (EIA 2006; average of south and mid-Atlantic regions). We estimate an average measure life of 3 years, as units need to be periodically re-tuned. We assume a cost of $158 for this measure, based on a $35/ton labor cost (CEC 2005) and an assumed 4.5-ton unit. The levelized cost is calculated to be 6.3 cents/kWh.
Retrocommissioning
Measure Description: Commercial building performance tends to degrade over time, and many new buildings do not perform as designed, requiring periodic upgrades to restore system functions to optimal performance. Retrocommissioning (RCx) is a systematic process to optimize building performance through O&M tune-up activities and diagnostic testing to identify problems in mechanical systems, controls, and lighting. The best candidates for RCx are buildings over 50,000 or 100,000 ft2.
Basecase: The baseline is electricity intensity for HVAC and lighting end-uses in buildings greater than 50,000 ft2 (10 kWh/ ft2), which is based on data from CBECS (EIA 2006). We take the average of the East South Central census division to estimate electricity intensity in Kentucky buildings.
Data Explanation: We assume 10% savings for HVAC and lighting end-uses (Sachs et al. 2004) in all commercial floorspace for buildings greater than 100,000 ft2, and 50% of floorspace in buildings 50,000 ft2 or greater based on data from CBECS (EIA 2006). Xcel Energy’s RCx program results estimate an average RCx useful life of 7 years (Xcel Energy 2006). We assume a $0.14 cost per ft2 (Sachs et al. 2004). The cost is shared with gas savings from the
37
Energy Efficiency Cost-Effective Resource Assessment for KY, ACEEE
same measure, so the actual cost for electric savings is $0.13/s.f. The levelized cost is calculated to be 2.2 cents/kWh.
Water Heating Measures
Heat Pump Water Heater
Measure Description: A heat pump water heater uses electricity to move heat from one place to another, rather than a less efficient electric resistance water heater which uses electricity to generate the heat directly. The heat source is the outside air or air in the basement where the unit is located.
Basecase: The basecase is standard electric water heating, with electricity consumption of 28,310 kWh/year (derived from energy savings and percent savings). Baseline electricity intensity for this end-use, 0.36 kWh/ft2, is the estimated water heating intensity in commercial buildings in Kentucky. This is based on the East South Central region from EIA’s commercial buildings survey.
Data Explanation: We assumed a 50% savings, based on a simple coefficient of performance ratio. The assumed 14,155 kWh savings, $4,067 incremental cost, and 12 year lifetime estimates are from NYSERDA (2003). Percent applicable is based on engineering estimates for NYSERDA (2003), which assumes the measure is applicable to 70% of food service floorspace and 30% of lodging, education, and health care floorspace. Percent applicable is then multiplied by 2, since these building types are more energy and hot-water intensive than the average commercial building. The levelized cost is calculated to be 3.2 cents/kWh.
Efficient Commercial Clothes Washer (Water Heating Portion)
Measure Description: A high-efficiency commercial clothes washer saves both energy and water, and as a result reduces water heating loads. For a high-efficiency clothes washer, we assume a unit with an MEF of 2.0, which represents about 80% of products on ENERGY STAR's product lists.
Basecase: The basecase unit is a clothes washer that meets DOE’s federal efficiency standard of 1.26 MEF. An average unit consumes 1,136 kWh annually for water heating, which is derived from DOE (2007). Baseline electricity intensity for this end-use is 0.36 kWh/ft2/year (water heating portion only).
Data Explanation: Savings on electric water heating from this measure assume a 2.0 MEF clothes washer uses an average 431 kWh annually, for a 62% savings, which is derived from DOE's TSD (DOE 2007). We assume the measure is applicable to the 17% of units that have electric water heating, and assume a 20% market share of efficient products. The overall stock estimate is based on national stock data (DOE 2007) and prorated to Kentucky based on commercial building floorspace. We assume an incremental cost for an efficient unit is $316 and an 11-year measure life (DOE 2007). The levelized cost is calculated to be 3.2 cents/kWh. This measure is applicable from 2010 through the end of 2012.
2013 Efficient Commercial Clothes Washer (Water Heating Portion)
Measure Description: A commercial clothes washer that achieves higher efficiency than the 2013 federal standard, with a weighted average MEF of 2.2.
Basecase: The basecase unit is a clothes washer that meets DOE’s 2014 federal efficiency standard of 1.74 MEF (weighted average of top- and front-loading models). An average unit consumes 600 kWh annually for water heating, which is derived from DOE (2009). Baseline electricity intensity for this end-use is 0.36 kWh/ft2/year (water heating portion only).
Data Explanation: Savings on electric water heating from this measure assume a 2.2 MEF clothes washer uses an average 360 kWh annually, for a 40% savings, which is derived from DOE's TSD (DOE 2009). We assume the measure is applicable to the 17% of units that have electric water heating, and assume a 20% market share of efficient products. The overall stock estimate is based on national stock data (DOE 2007) and prorated to Kentucky based on commercial building floorspace. We assume an incremental cost for an efficient unit is $63 and an 11-year measure life (DOE 2007). The levelized cost is calculated to be 0.7 cents/kWh. This measure is applicable only from 2013 through 2030.
Refrigeration Measures
38
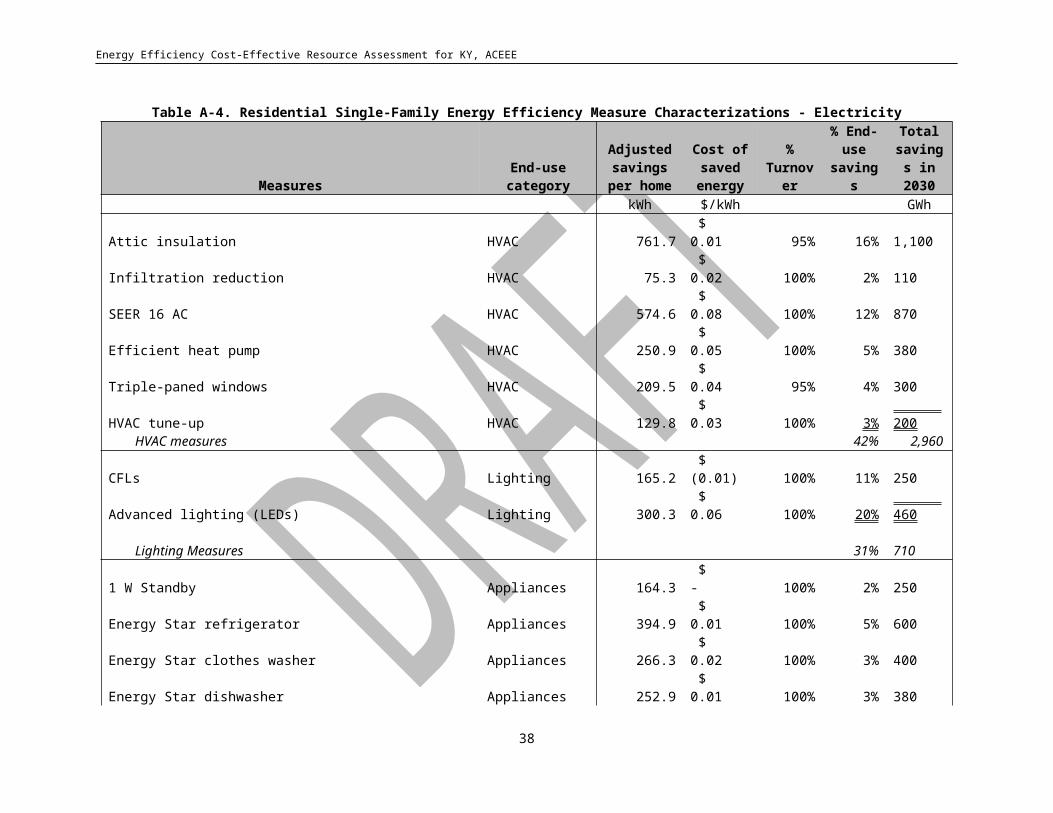
Energy Efficiency Cost-Effective Resource Assessment for KY, ACEEE
Efficient Walk-In Refrigerators & Freezers
Measure Description: Walk-in refrigerators and freezers (walk-ins) are medium and low-temperature refrigerated spaces that can be walked into, and that are used to maintain the temperature of pre-cooled materials (not to rapidly cool down materials from warmer temperatures). A high-efficiency walk-in is defined as meeting the 2004 CEC standard for walk-ins. This includes prescriptive requirements such as higher levels of insulation, motor types, and the use of automatic door-closers (Nadel et al. 2006).
Basecase: The baseline energy use for an average walk-in is 18,859 kWh/year (Nadel et al. 2006). Baseline electricity intensity for this end-use, 1.74 kWh/ft2, is the estimated refrigeration energy intensity in commercial buildings in Kentucky. This is based on the East South Central division from EIA’s commercial buildings survey.
Data Explanation: For a high-efficiency walk-in unit, we assume 44% savings over a baseline unit, or 8220 kWh/year, $957 incremental cost, and a 12 year measure lifetime (Nadel et al. 2006), which are based on PG&E (2008). We estimate percent applicable as the 18% of refrigeration energy use attributed to walk-ins (ADL 1996) and estimate a 50% current market share of high-efficiency products (ACEEE estimate). The levelized cost is calculated to be 1.3 cents/kWh.
Efficient Reach-In Coolers & Freezers
Measure Description: This measure includes high-efficiency packaged commercial reach-in refrigerators and freezers with solid doors, and refrigerators with transparent doors such as beverage merchandisers. High-efficiency units are those that meet the CEE Tier 2 performance standard, as estimated in PG&E (2005).
Basecase: We assume a baseline unit that meets the 2010 federal standard and uses 4,027 kWh per year. This is weighted by sales of unit type per PG&E (2004b). Baseline electricity intensity for this end-use, 1.74 kWh/ft2, is the estimated refrigeration energy intensity in commercial buildings in Kentucky. This is based on the East South Central division from EIA’s commercial buildings survey.
Data Explanation: The savings estimate for a high-efficiency unit, 31% savings or 1,268 kWh per year, is a weighted average of different types of reach-ins that meet CEE’s Tier 2 performance standard (PG&E 2004a). We estimate an average lifetime of 9 years and an incremental cost of $177, both per PG&E (2004a). We estimate percent applicable as the percent of refrigeration energy use attributed to reach-ins and beverage merchandisers, or 17% (ADL 1996), and assume a 10% current market share of high-efficiency products per PG&E (2004a). The levelized cost is calculated to be 2.0 cents/kWh.
Efficient Ice-Maker
Measure Description: Commercial ice makers, which are used in hospitals, hotels, and food service and preservation, have energy savings potential largely in their refrigeration systems. We assume an efficient icemaker meets CEC’s Tier 2 level of energy savings, which incorporate improved compressors, heat exchangers, and controls, as well as better insulation and gaskets.
Basecase: The baseline energy use, 3,338 kWh per year, is a weighted average of different types of ice-makers that meet the 2010 federal standard. Baseline electricity intensity for this end-use, 1.74 kWh/ft2, is the estimated refrigeration energy intensity in commercial buildings in Kentucky. This is based on the East South Central region from EIA’s commercial buildings survey.
Data Explanation: The 16% savings estimate for a high-efficiency unit, or 542 kWh per year, is a weighted average of different types of ice-makers that meet CEC’s tier 2 energy savings (PG&E 2004a. We estimate an average lifetime of 10 years and an incremental cost of $100, both per PG&E (2005). We estimate percent applicable as the percent of refrigeration energy use attributed to ice-makers, or 10% (ACEEE estimate), and assume a 10% current market share of high-efficiency products per PG&E (2004a) and ACEEE judgment. The levelized cost is calculated to be 2.4 cents/kWh.
Efficient Built-Up Refrigeration System
Measure Description: Built-up or supermarket refrigeration systems are primarily made up of refrigerated display cases for holding food for self-service shopping, as well as machine room cooling technologies. More efficient built-up systems include improved machine room technologies (evaporative condensers, mechanical sub-cooling, and
39
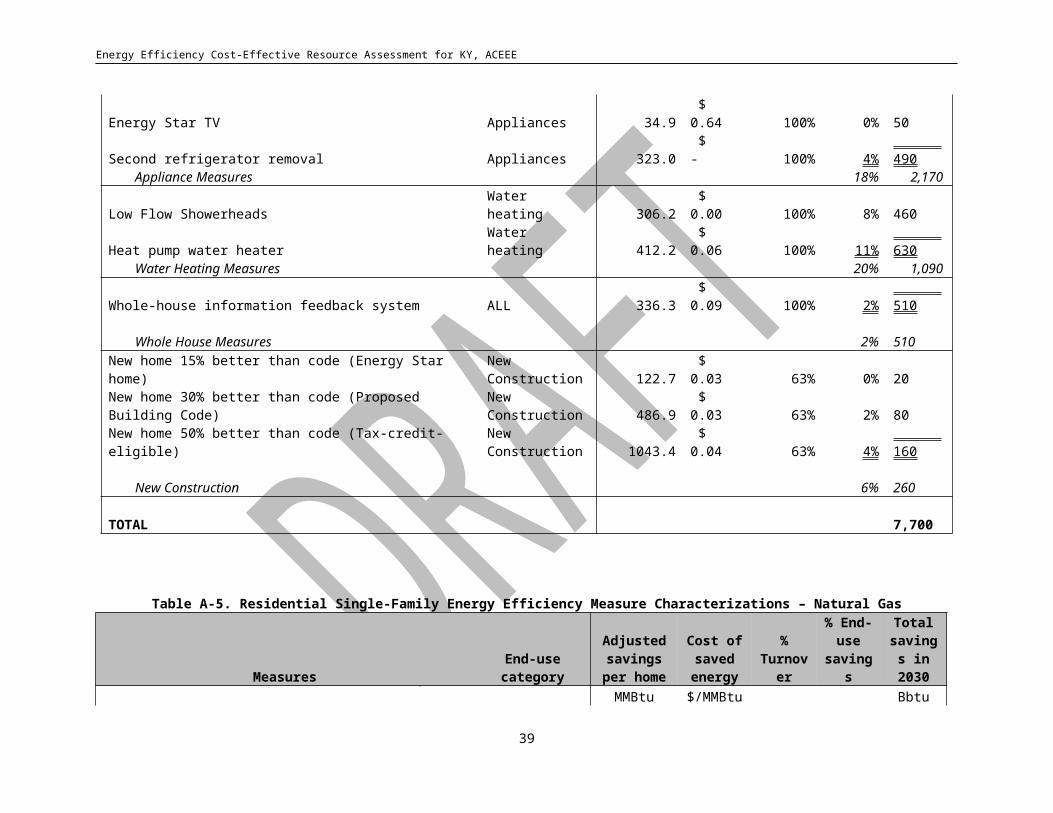
Energy Efficiency Cost-Effective Resource Assessment for KY, ACEEE
heat reclaim), high-efficiency evaporative fan motors, hot gas defrost, liquid-suction heat exchangers, antisweat control, and defrost control.
Basecase: The measure baseline is 1,600,000 kWh for a 45,000 ft2 supermarket with a built-up refrigeration system. Baseline electricity intensity for this end-use, 1.74 kWh/ft2, is the estimated refrigeration energy intensity in commercial buildings in Kentucky. This is based on the East South Central division from EIA’s commercial buildings survey.
Data Explanation: Per-unit savings of 336,000 kWh (21%) are from ADL 1996 and assume an average new 45,000 ft2
supermarket with a 5-year payback. We estimate percent applicable as the percent of refrigeration energy use attributed to built-up refrigeration, or 33% (ADL 1996). Incremental cost ($37,000) and lifetime (10 years) are from ADL 1996. The levelized cost is calculated to be 1.4 cents/kWh.
Efficient Vending Machine
Measure Description: ENERGY STAR vending machines must consume 50% less energy than standard machines. Under the Tier II ENERGY STAR level, this translates to a maximum energy consumption of 2309 kWh/year for a 600-can machine.
Basecase: A Tier I ENERGY STAR level vending machine is assumed to be the basecase. On average, it uses 2,816 kWh per year (ENERGY STAR calculator for a 600 can machine). Baseline electricity intensity for this end-use, 1.74 kWh/ft2, is the estimated refrigeration energy consumption in commercial buildings in Kentucky. This is based on the East South Central division from EIA’s commercial buildings survey.
Data Explanation: Per unit savings of 18% (507 kWh/year) are estimated from ASAP (2007) based on ENERGY STAR calculator estimates. Likewise, an incremental cost of $30, and a lifetime estimate of 10 years are from ASAP (2007). We estimate percent applicable as the percent of refrigeration energy use attributed to built-up refrigeration, or 13% (NYSERDA 2003). The levelized cost is calculated to be 0.8 cents/kWh.
Vending Miser
Measure Description: A Vending Miser is an energy control device for refrigerated vending machines. Using an occupancy sensor, the control turns off the machine’s lights and duty cycles the compressor based on ambient air temperature.
Basecase: The basecase unit is an efficient vending machine that meets the ENERGY STAR tier II level and uses 2,309 kWh per year (ENERGY STAR calculator for a 600 can machine). Baseline electricity intensity is for the refrigeration end-use (1.74 kWh/ ft2).
Data Explanation: We assume 35% savings for this measure based on manufacturer data (USA Technologies 2008), an incremental cost of $167 (NYSERDA 2003), and a measure life of 10 years (NYSERDA 2003). The levelized cost is calculated to be 2.7 cents/kWh.
Appliances
Efficient Hot Food Holding Cabinets
Measure Description: Commercial hot food holding cabinets are used in the commercial kitchen industry primarily for keeping food at safe serving temperature, without drying it out or further cooking it. These cabinets can also be used to keep plates warm and to transport food for catering events. High efficiency models differ mainly in that they are better insulated.
Basecase: The basecase unit is an uninsulated cabinet that consumes 5,190 kWh per year. This was calculated from PG&E (2004b) using a simple average of three sizes of cabinets, and then weighting the average using CASE figures for insulated cabinets.
Data Explanation: The energy savings from an insulated holding cabinet are 1,815 kWh per year (35% savings), with an incremental cost of $453, and an estimated 15 year lifetime (Neubauer et al. 2009). Percent applicable refers to the 25% of holding cabinets that are currently uninsulated (Neubauer et al. 2009). The levelized cost is calculated to be 2.4 cents/kWh.
Efficient Commercial Clothes Washer (excluding hot water energy)
40
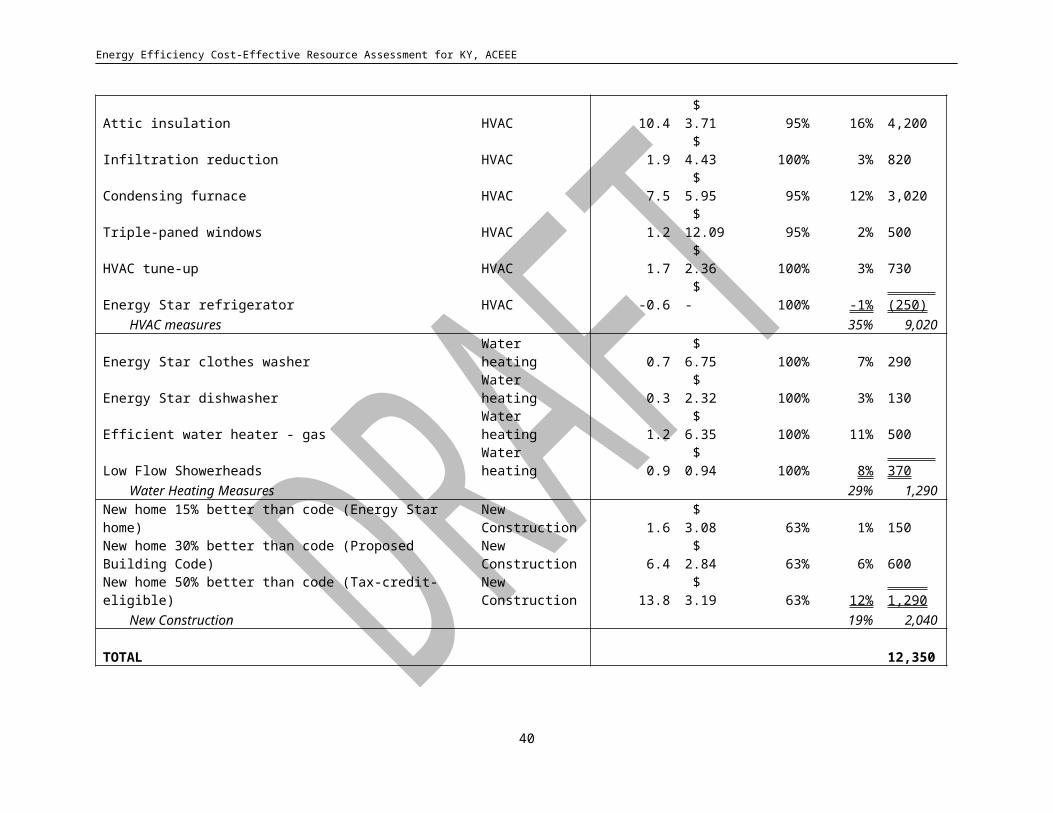
Energy Efficiency Cost-Effective Resource Assessment for KY, ACEEE
Measure Description: A high-efficiency commercial clothes washer saves both energy and water. For a high-efficiency clothes washer, we assume a unit with an MEF of 2.0, which represent about 80% of products on ENERGY STAR's product lists.
Basecase: The basecase unit is a clothes washer that meets DOE’s federal efficiency standard of 1.26 MEF. An average unit consumes 1,530 kWh annually for non-water heating uses, which is derived from DOE 2007.
Data Explanation: Electric savings from this measure assume a 2.0 MEF clothes washer uses an average 1,186 kWh annually, for a 22% savings, which is derived from DOE's TSD (DOE 2007). We assume the measure is applicable to the 37% of units that have electric dryer heating (removal of moisture from clothes), and assume a 20% market share of efficient products. The overall stock estimate is based on national stock data (DOE 2007) and prorated to Kentucky based on commercial building floorspace. We assume an incremental cost for an efficient unit is $316 and an 11-year measure life (DOE 2007). The levelized cost is calculated to be 3.2 cents/kWh. This measure is applicable from 2010 through the end of 2012.
2013 Efficient Commercial Clothes Washer (excluding hot water energy)
Measure Description: A commercial clothes washer that achieves higher efficiency than the 2013 federal standard, with a weighted average MEF of 2.2.
Basecase: The basecase unit is a clothes washer that meets DOE’s 2013 federal efficiency standard of 1.74 MEF (weighted average of top- and front-loading models). An average unit consumes 1,294 kWh annually for non-water heating uses, which is derived from DOE 2009.
Data Explanation: Electric savings from this measure assume a 2.0 MEF clothes washer uses an average 1,107 kWh annually, for a 14% savings, which is derived from DOE's TSD (DOE 2009). We assume the measure is applicable to the 37% of units that have electric dryer heating (removal of moisture from clothes), and assume a 20% market share of efficient products. The overall stock estimate is based on national stock data (DOE 2007) and prorated to Kentucky based on commercial building floorspace. We assume an incremental cost for an efficient unit is $63 and an 11-year measure life (DOE 2007). The levelized cost is calculated to be 0.6 cents/kWh. This measure is applicable only from 2013 through 2030.
Lighting Measures
Fluorescent Lighting Improvements
Measure Description: The new measure assumes extra-efficient ballasts and high-lumen lamps are installed with the ballast factor of new ballasts chosen to provide the right amount of light for an application.
Basecase: Basecase watts per square foot reflects current installed fixtures. This includes 84,000 kWh used annually for fluorescent lighting per average 14,000 ft2 commercial building (Navigant 2002). On average, fluorescent lights are operated 9.7 hours/day. We assume 2-lamp standard T8 fixtures and electronic ballasts as the baseline, plus a small number of existing 3-lamp T12 fixtures with magnetic ballasts that are not likely to be replaced in the absence of programs over the time horizon.
Data Explanation: We assume a percent savings of 27%. The incremental costs are $2 extra per ballast, and $1 extra for each of 2 lamps. The percent applicable (56%) is the fluorescent percent of total commercial lighting kWh (Navigant 2002). The levelized cost is calculated to be 0.7 cents/kWh.
41
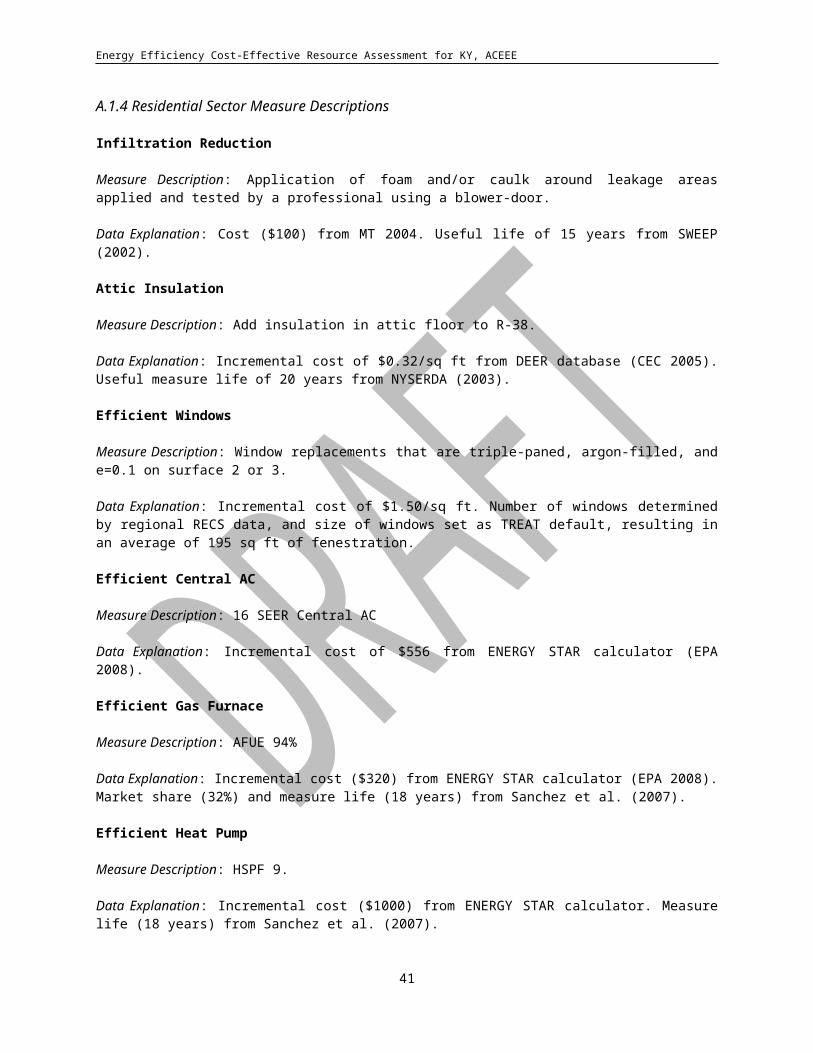
Energy Efficiency Cost-Effective Resource Assessment for KY, ACEEE
HID Lighting Improvements
Measure Description: Metal halide lamps produce light by passing an electric arc through a mixture of gases. Efficiency improvements in metal halide lamps include pulse start lamp technology, electronic ballasts, and improved fixtures.
Basecase: Same basecase as fluorescent lighting improvements.
Data Explanation: The new measure savings and costs are from a PG&E CASE study on Metal Halide Lamps & Fixtures (PG&E 2004c). Energy savings were 447 kWh per year (26%), and incremental costs were $60. Percent applicable (12%) is the percentage of commercial electricity use for lighting that comes from HIDs (Navigant 2002). The levelized cost is calculated to be 6.3 cents/kWh.
Replace Incandescent Lamps with CFLs
Measure Description: We assume that 32% of lighting in the commercial sector is incandescent (Navigant 2002). The new measure assumes that 70% of current incandescents are replaced with CFLs.
Basecase: The basecase is an electric load of 2.0 kWh/s.f. This represents the amount of energy used for incandescent lighting in the average commercial building, and is derived from the average number of lamps, the average lamp wattage, and the average annual operating time (Navigant 2002).
Data Explanation: Energy savings are 1.5 kWh/s.f. annually, or 72%. This equates to annual per unit savings of 223 kWh. Incremental costs include $10 in the cost of a CFL, but save $8 in labor for replacing every 4 bulbs. ACEEE estimates that 70% of sockets are applicable for the new measure. The levelized cost is calculated to be 0.2 cent/kWh. This measure is applicable from 2010 through the end of 2012.
2013 Replace Incandescent Lamps with CFLs
Measure Description: We assume that 32% of lighting in the commercial sector is incandescent (Navigant 2002). The new measure assumes that 70% of current incandescents are replaced with CFLs.
Basecase: As federal standards phase in, the basecase load for incandescent lighting falls to 1.4 kWh/s.f. This represents the amount of energy used for incandescent lighting in the average commercial building, and is based on an interpolation of data from Navigant (2002).
Data Explanation: Energy savings are 0.9 kWh/s.f. annually, or 61%. This equates to annual per unit savings of 136 kWh. Incremental costs include $10 in the cost of a CFL, but save $8 in labor for replacing every 4 bulbs. ACEEE estimates that 70% of sockets are applicable for the new measure. The levelized cost is calculated to be 0.3 cent/kWh. This measure is applicable from 2013 through the end of 2019.
2020 Replace Incandescent Lamps with CFLs
Measure Description: We assume that 32% of lighting in the commercial sector is incandescent (Navigant 2002). The new measure assumes that 70% of current incandescents are replaced with CFLs.
Basecase: Based on expected 2020 lighting standards, the basecase load for incandescent lighting is further reduced to 1.1 kWh/s.f. This represents the amount of energy used for incandescent lighting in the average commercial building, and is based on an interpolation of data from Navigant (2002).
Data Explanation: Energy savings are 0.5 kWh/s.f. annually, or 72%. This equates to annual per unit savings of 82 kWh. Incremental costs include $10 in the cost of a CFL, but save $8 in labor for replacing every 4 bulbs. ACEEE estimates that 70% of sockets are applicable for the new measure. The levelized cost is calculated to be 0.5 cent/kWh. This measure is applicable from 2020 through 2030.
Replace Incandescent Lamps with LEDs
Measure Description: The new measure assumes that 20% of current incandescents (10% low-wattage and 10% miscellaneous) are used for display lighting, and can be replaced with LED lights.
Basecase: The basecase is 0.23 kWh/s.f. annually. This is derived from the average wattage of quartz halogen, low-wattage, and average incandescents; the average number of each type of bulb in a commercial building; and the average annual operating time (Navigant 2002).
42
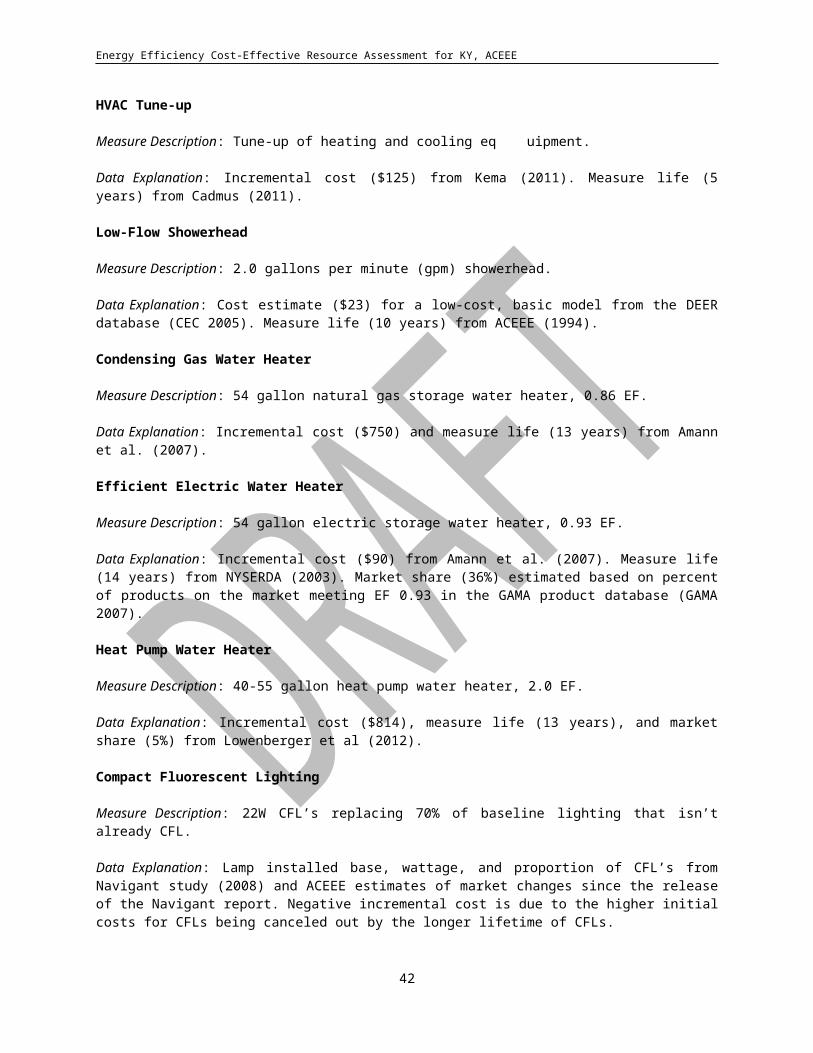
Energy Efficiency Cost-Effective Resource Assessment for KY, ACEEE
Data Explanation: Energy savings are 0.2 kWh/s.f. annually, or 88%, assuming LED replacement wattages as indicated by Navigant (2008). Incremental costs include $0.05/s.f., a weighted average of the costs of each bulb, and including a $32 labor savings for replacing each bulb. The LED prices were calculated using average efficacy and $/klm projections for 2010 (Navigant 2008). Percent applicable assumes that 100% of these specific bulbs are replaceable (Navigant 2008). Between this measure and the previous measure (replacing incandescents with CFLs), 90% of incandescents are assumed to be replaceable, allowing 10% of incandescents (for specialty applications) to remain. The levelized cost is calculated to be 3.7 cents/kWh.
Occupancy Sensor for Lighting
Measure Description: Installation of occupancy sensors can greatly reduce lighting energy demands in commercial spaces, by automatically turning off lights in unoccupied spaces.
Basecase: Same basecase as fluorescent lighting improvements.
Data Explanation: Energy savings of 361 kWh per year (NYSERDA 2003) assumes 30% energy reduction in individual offices and rooms and 7.5% reduction in open spaces (ACEEE estimate). Incremental cost ($48) and lifetime (10 years) estimates are from NYSERDA (2003). Percent applicable (38%) is from Sachs et al. (2004). The levelized cost is calculated to be 1.7 cents/kWh.
Daylight Dimming System
Measure Description: A daylight dimming system automatically dims electric lights to take advantage (or “harvest”) natural daylight.
Basecase: Same basecase as fluorescent lighting improvements
Data Explanation: Energy savings are estimated to be 143 kWh per year, or 35% (NYSERDA 2003). Savings apply for lamps on the perimeters of buildings (25% applicable—PIER 2003). Incremental cost ($68) and lifetime (20 years) estimates are from NYSERDA (2003). The levelized cost is calculated to be 3.8 cents/kWh.
Outdoor Lighting—Controls
Measure Description: This measure includes a variety of lighting control technologies for exterior lights.
Basecase: No basecase data was available for this measure.
Data Explanation: We assume a savings of 174 kWh, or 20%, from lighting controls. Incremental costs of $43 are from DEER 2001 and assume each control on average controls three fixtures. Percent applicable of 30% is an ACEEE estimate. Number of installed units is based on national stock for parking and roadway from Navigant (2002), apportioned to Kentucky based on commercial floorspace. The levelized cost is calculated to be 2.5 cents/kWh.
Miscellaneous
Office Equipment
Measure Description: This measure assumes a high-efficiency fax, printer, computer display, internal power supply, and a low mass copier.
Basecase: Baseline electricity use is 2886 kWh per year (NYSERDA 2003). Baseline electricity intensity for this end-use, 1.2 kWh/ft2, is the estimated office equipment energy intensity in commercial buildings in Kentucky. This is based on the East South Central Division from EIA’s commercial buildings survey.
Data Explanation: Energy savings were 1410 kWh per year (49%), lifetime was 5 years, and incremental costs were $20. Percent applicable is estimated to be (50%) (NYSERDA 2003). The levelized cost is calculated to be 0.3 cents/kWh.
Turn Off Office Equipment after Hours
43
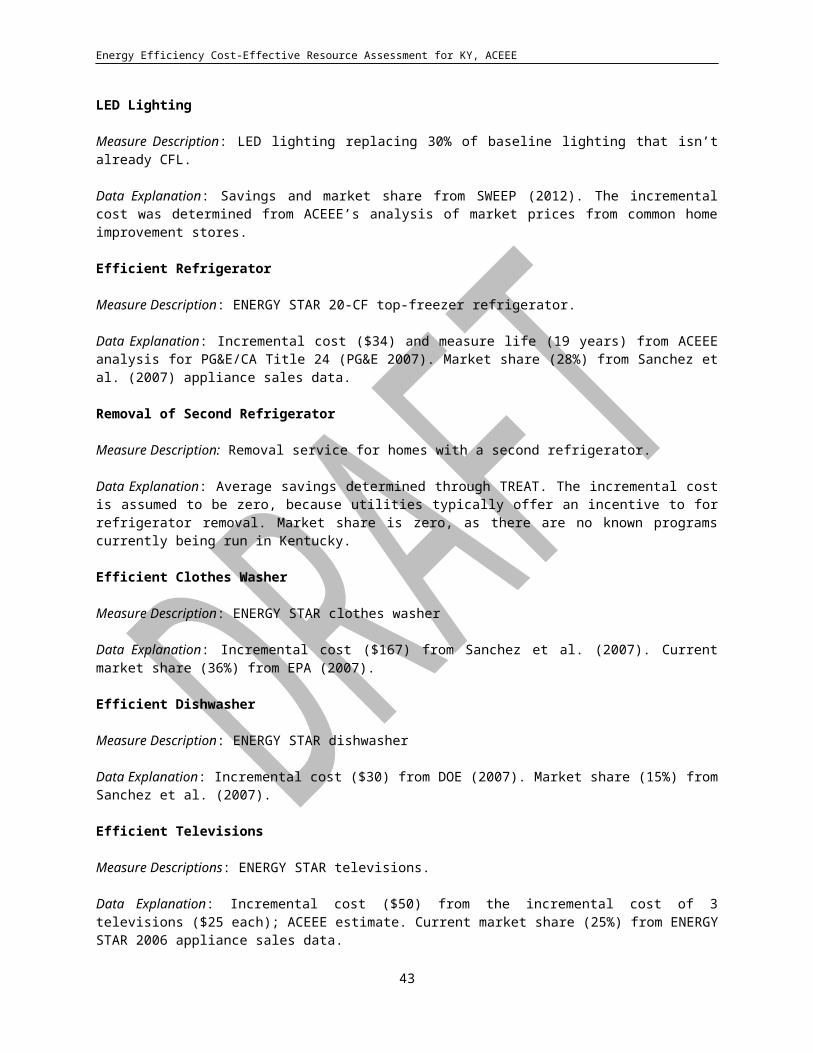
Energy Efficiency Cost-Effective Resource Assessment for KY, ACEEE
Measure Description: This measure involves turning off, or putting into a low-power state: vending machines, computers, monitors, printers and copiers.
Basecase: Baseline electricity use is 1.2 kWh/ft2, based on data from CBECS, LBNL, and ENERGY STAR.
Data Explanation: Energy savings were 6763 kWh per year (40%), lifetime was 20 years, and incremental costs were $0. Percent applicable is 100%, as data for the savings already took into account the number of buildings that already shut down equipment after hours. The levelized cost is $0/kWh
New Buildings
Efficient New Building (15% Savings)
Measure Description: Incorporating energy efficiency into building design is best achieved at the time of construction. New buildings can achieve major energy savings in heating and cooling, as well as energy-saving appliances.
Basecase: Basecase of 15.1 kWh/ft2 is an estimate of HVAC, water heating, and lighting end-use electricity intensity for new buildings in Kentucky, derived from data for buildings built from 2000–2003 (EIA 2006).
Data Explanation: Incremental cost of $0.35 per ft2 and measure life of 17 years are from NGRID (2007). The cost is shared with gas savings from the same measure, so the actual cost for electric savings is $0.18. Percent applicable of 18% for this new buildings measure assume that 30% and 50% new buildings savings are phased in one to two years prior to enactment of codes in the policy scenarios (30% in 2012 and 50% in 2020). The levelized cost is calculated to be 0.7 cents/kWh.
Efficient New Building (30% Savings)
Measure Description: Incorporating energy efficiency into building design is best achieved at the time of construction. New buildings can achieve major energy savings in heating and cooling, as well as energy-saving appliances.
Basecase: Basecase of 15.1 kWh/ft2 is an estimate of HVAC, water heating, and lighting end-use electricity intensity for new Kentucky buildings, derived from data for buildings built from 2000–2003 (EIA 2006).
Data Explanation: In New York, estimates show that commercial buildings can reach 30% beyond code at an investment of $0.70/kWh. To be conservative, we estimate $0.70/kWh by doubling the costs of a 15%-beyond-code building. The cost is shared with gas savings from the same measure, so the actual cost for electric savings is $0.36.Measure life of 17 years is from NGRID (2007). Percent applicable of 35% for 30% savings new buildings assume that 30% and 50% new buildings savings are phased in one to two years prior to enactment of codes in the policy scenarios (30% in 2012 and 50% in 2020). The levelized cost is calculated to be 0.7 cents/kWh.
Tax-Credit Eligible Building (50% Savings)
Measure Description: A federal tax incentive is available for new buildings that are constructed to save at least 50% of the heating, cooling, ventilation, water heating, and interior lighting cost of a building that meets ASHRAE standard 90.1-2001.
Basecase: Basecase of 15.1 kWh/ft2 is an estimate of HVAC, water heating, and lighting end-use electricity intensity for new buildings in Kentucky, derived from data for buildings built from 2000–2003 (EIA 2006).
Data Explanation: Incremental costs of $0.66 per ft2 are derived from NREL (2008) studies on energy savings for medium box retail stores and supermarkets. This cost is shared with gas savings from the same measure, so the actual cost for electric savings is $0.34. Percent applicable is 18%, accounting only for the share of buildings that call into the two types of buildings covered in the NREL studies. Measure life of 17 years is from NGRID (2007). The levelized cost is calculated to be 0.4 cents/kWh.
44
Energy Efficiency Cost-Effective Resource Assessment for KY, ACEEE
Table A-8. Commercial Building Electricity Measure Characterizations
MeasuresMeasure Life
(Years)
Annual kWh svgs per unit
2007 Kentucky Stock
kWh
svgs
per sf
Incremental cost per
unit
Incremental cost per sf
Cost of Conserved Energy
(2010$/kWh saved)
Adjustment Factor
% Turnov
erInteraction Factor
Savings in 2030
(GWh)
Existing BuildingsBuilding Shell
Cool roof 20
5,500 NA 0.17 $ 3,750
$ 0.25
$ 0.05 80% 100% 100%
142
Roof insulation 25 NA NA 0.28 NA
$ 0.06
$ 0.02 35% 100% 100%
99
Low-e windows 25 NA NA 0.26 NA
$ 0.04
$ 0.01 75% 84% 100%
171 412
HVAC
Duct testing and sealing 10
24,800 NA 0.53 $ 3,380 NA
$ 0.02 25% 100% 100%
136
Efficient ventilation fans & motors w VFD 10
22,000 NA 0.47 $ 6,650 NA
$ 0.04 40% 100% 91%
176
HVAC Load-Reducing Measures Subtotal 312
High-effic. unitary AC & HP (65-135 kBtu) 15
1,100 NA 0.34 $ 630 NA
$ 0.06 33% 100% 91%
103
High-effic. unitary AC & HP (135-240 kBtu) 15
3,400 NA 0.51 $ 1,420 NA
$ 0.04 15% 100% 91%
70
Packaged Terminal HP and AC 15
230 NA 0.37 $ 90 NA
$ 0.04 5% 100% 91%
17
Efficient room air conditioner 13 90 NA 0.27 $ 40 NA
$ 0.04 4% 38% 91%
4
2014 Efficient room air conditioner 13 50 NA 0.11 $ 30 NA
$ 0.06 4% 62% 91%
3
High-efficiency chiller system 23
30,300 NA 0.94 $ 9,900 NA
$ 0.02 33% 91% 91%
263
HVAC Equipment Measures Subtotal 459
Dual Enthalpy Control 10
3,000 NA 0.43 $ 890 NA
$ 0.04 46% 100% 80%
162
Demand-Controlled Ventilation 15
8,000 NA 0.38 $ 3,450 NA
$ 0.04 54% 100% 80%
169
HVAC tuneup (smaller buildings) 92 NA 0.45 $ 160 NA $ 29% 100% 80%
45
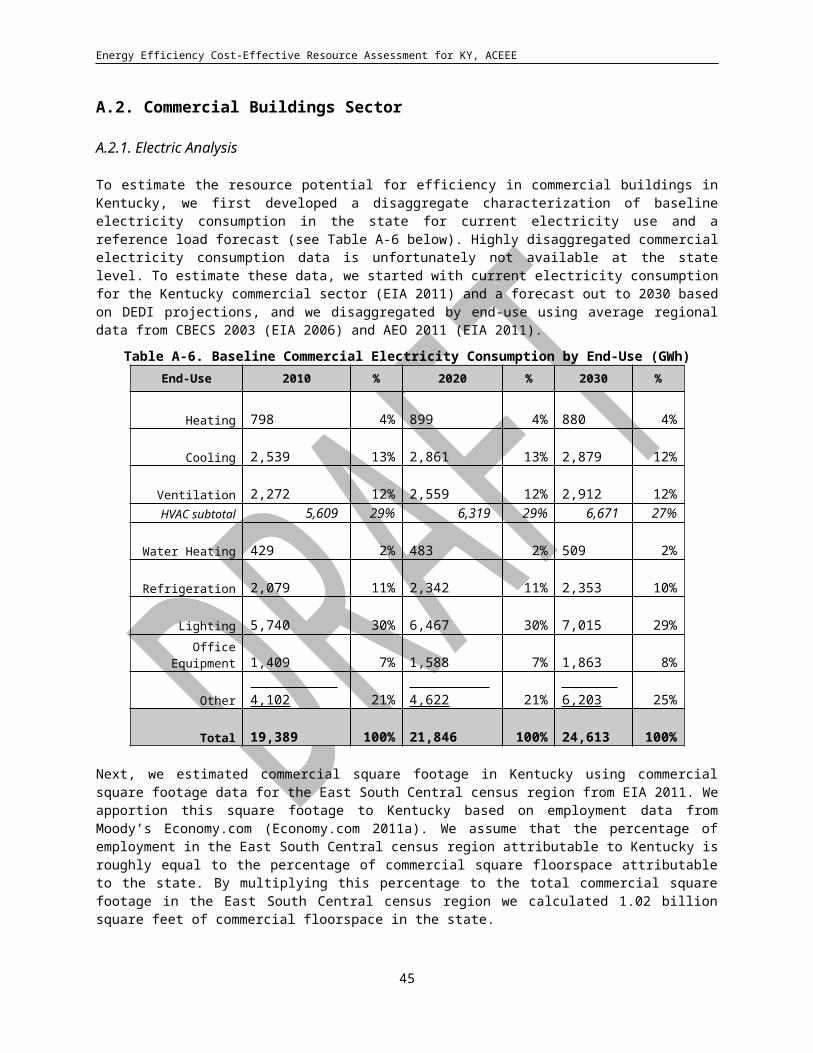
Energy Efficiency Cost-Effective Resource Assessment for KY, ACEEE
3 0 0.06 110
Retrocommissioning 7 NA NA 0.98 NA
$ 0.13
$ 0.02 10% 100% 80%
81
HVAC Control Measures Subtotal 522
HVAC Subtotal 1,294
Water Heating
Commercial clothes washers 11
700
31,300 0.00 $ 320 NA
$ 0.03 14% 37% 100%
1
2013 High efficiency commercial clothes washer
11 240
31,300 0.00 $ 60 NA
$ 0.01 14% 63% 100%
1
Heat pump water heater 12
14,200 NA 0.18 $ 4,070 NA
$ 0.03 19% 100% 99%
34 36
Refrigeration
Walk-in coolers & freezers 12
8,200 0.76 $ 960 NA
$ 0.01 9% 100% 100%
70
Reach-in coolers & freezers 9
1,300 0.55 $ 180 NA
$ 0.02 15% 100% 100%
87
Ice-makers 10
540 0.28 $ 100 NA
$ 0.02 9% 100% 100%
27
Supermarket (built-up) refrigeration system 10
336,000 0.36 $ 37,000 NA
$ 0.01 33% 100% 100%
122
Vending machines (to tier 2 ENERGY STAR level)
10 500 0.31 $ 30 NA
$ 0.01 13% 100% 100%
43
Vending miser 10
800 0.50 $ 170 NA
$ 0.03 13% 100% 100%
69 418
Lighting
Fluorescent lighting improvements 13 60
- 1.31 $ 5 NA
$ 0.01 56% 100% 100%
750
HID lighting improvements 2
450
- 1.25 $ 60 NA
$ 0.06 12% 100% 100%
153
Replace incandescent lamps with CFLs 13
220
- 1.45 $ NA $ 0.03
$ 0.00 70% 31% 100%
639
Replace 2013 incandescent lamps with CFLs 13 140 - 0.88 $ NA $ 0.03
$ 0.00 70% 54% 100%
340
Replace 2020 incandescent lamps with CFLs 13 80 - 0.53 $ NA $ 0.03
$ 0.01 70% 15% 100%
59
Replace incandescent lamps with LEDs 16 0.21 $ 760 $ $ 100% 100% 100%
46
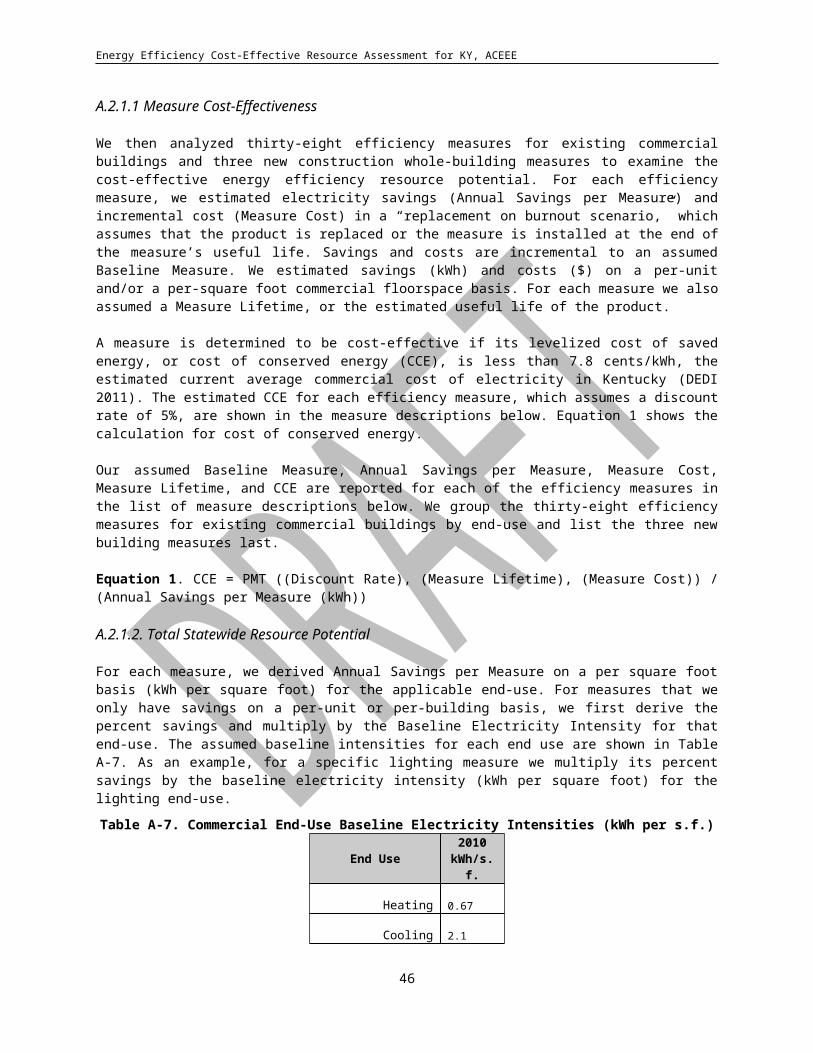
Energy Efficiency Cost-Effective Resource Assessment for KY, ACEEE
9 0 - 0.05 0.04 210
Occupancy sensor for lighting 10
360
- 0.90 $ 50 NA
$ 0.02 38% 100% 59%
207
Daylight dimming system 20
140
- 1.68 $ 70 NA
$ 0.04 25% 100% 54%
233
Outdoor Lighting Controls 14 170 860,000 NA $ 40 NA$
0.03 30% 100% 100% 45 2,752
Office Equipment
Office equipment 5
1,400
- 0.58 $ 0.01
$ 20
$ 0.003 50% 100% 100%
294
Turn off office equipment after-hours 5 4,500 NA 0.44 $ - $ - $ - 100% 100% 76%
344 638
Appliances/Other
Hot Food Holding Cabinets 15
1,800
8,500 NA $ 450 NA
$ 0.02 25% 100% 100%
4
Commercial clothes washers 11
340
31,300 NA $ 320 NA
$ 0.03 29% 37% 100%
1
2013 High efficiency commercial clothes washers
11 190
31,300 NA 60 NA
$ 0.01 29% 63% 100%
1 6
Existing Buildings Subtotal 5,143
New Buildings
Efficient new building (15% savings) 17 NA
- 2.27 NA
$ 0.18
$ 0.01 18% 100% 100%
160
Efficient new building (30% savings) 17 NA
- 4.53 NA
$ 0.36
$ 0.01 35% 100% 100%
642
Tax credit eligible building (50% svgs) 17 NA
- 7.56 NA
$ 0.34
$ 0.00 18% 100% 100%
546 1,348
TOTAL 6,491
47
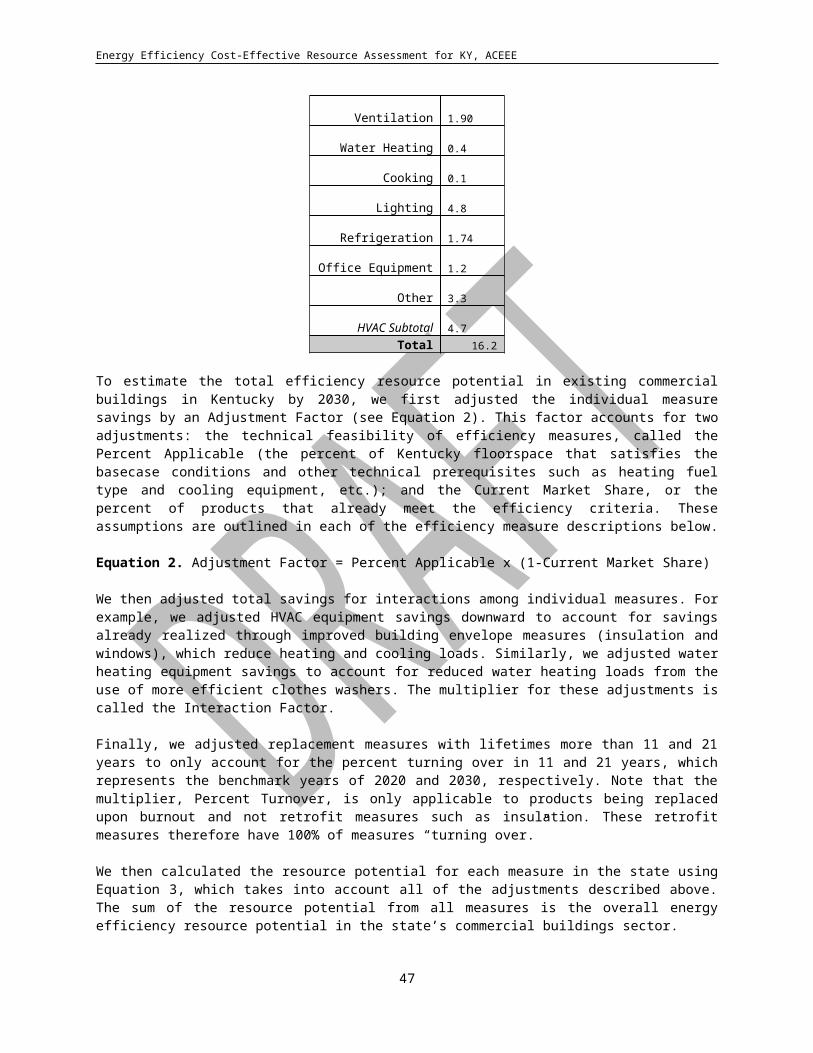
Energy Efficiency Cost-Effective Resource Assessment for KY, ACEEE
48
Energy Efficiency Cost-Effective Resource Assessment for KY, ACEEE
A.2.2. Natural Gas Analysis
To estimate the resource potential for efficiency in commercial buildings in Kentucky, we first develop a disaggregate characterization of baseline natural gas consumption in the state for current gas use and a reference load forecast (see Table A-9 below). Highly disaggregated commercial gas consumption data is unfortunately not available at the state level. To estimate these data, we start with current natural gas consumption for the Kentucky commercial sector (EIA 2008) and a forecast out to 2030 based on SERC forecasts, and we disaggregate by end-use using average regional data from CBECS 2003 (EIA 2006) and AEO 2011 (EIA 2011).
Table A-9. Baseline Commercial Natural Gas Consumption by End-Use (BBtu)End-Use 2010 % 2020 % 2030 %
Heating 22,104 58% 21,565 58% 20,292 56%Cooling 240 0.6% 234 0.6% 192 1%
HVAC subtotal 22,344 59% 21,798 59% 20,483 56%Water Heating 7,443 20% 7,261 20% 7,435 21%
Cooking 2,186 6% 2,133 6% 2,158 6%Other 6,123 16% 5,974 16% 6,183 17%Total 38,096 100% 37,166 100% 36,259 100%
Next, we estimated commercial square footage in Kentucky using commercial square footage data for the East South Central census region from EIA 2011. We apportion this square footage to Kentucky based on employment data from Moody’s Economy.com (Economy.com 2011a). We assume that the percentage of employment in the East South Central census region attributable to Kentucky is roughly equal to the percentage of commercial square floorspace attributable to the state. By multiplying this percentage to the total commercial square footage in the East South Central census region we calculated 1.02 billion square feet of commercial floorspace in the state.
A.2.2.1 Measure Cost-Effectiveness
We then analyzed twenty efficiency measures for existing commercial buildings and 3 new construction whole-building measures to examine the cost-effective energy efficiency resource potential. For each efficiency measure, we estimated natural gas savings (Annual Savings per Measure) and incremental cost (Measure Cost) in a “replacement on burnout scenario,” which assumes that the product is replaced or the measure is installed at the end of the measure’s useful life. Savings and costs are incremental to an assumed Baseline Measure. We estimate savings (MMBtu) and costs ($) on a per-unit and/or a per-square foot commercial floorspace basis. For each measure we also assume a Measure Lifetime, or the estimated useful life of the product.
A measure is determined to be cost-effective if its levelized cost of saved energy, or cost of conserved energy (CCE), is less than $11.38/MMBtu, the estimated current average commercial cost of natural gas in Kentucky (DEDI 2011). Commercial natural gas prices in Kentucky dipped precipitously for the year 2010, but are projected to rise over the period of this study. For this reason, we averaged gas prices from DEDI 2011 for the years 2009 and 2011 to use as a baseline for cost-effectiveness. The estimated CCE for each efficiency measure, which assumes a discount rate of 5%, are shown in the measure descriptions below. Equation 1 shows the calculation for cost of conserved energy.
Our assumed Baseline Measure, Annual Savings per Measure, Measure Cost, Measure Lifetime, and CCE are reported for each of the efficiency measures in the list of measure descriptions below. We group the 20 efficiency measures for existing commercial buildings by end-use and list the 3 new building measures last.
Equation 1. CCE = PMT ((Discount Rate), (Measure Lifetime), (Measure Cost)) / (Annual Savings per Measure (kWh))
49
Energy Efficiency Cost-Effective Resource Assessment for KY, ACEEE
A.2.2.2. Total Statewide Resource Potential
For each measure, we derived Annual Savings per Measure on a per square foot basis (MMBtu per square foot) for the applicable end-use. For measures that we only have savings on a per-unit or per-building basis, we first derive the percent savings and multiply by the Baseline Natural Gas Intensity for that end-use. The assumed baseline intensities for each end use are shown in Table A-10. As an example, for a specific HVAC measure we multiply its percent savings by the baseline gas intensity (MBtu per square foot) for the HVAC end-use.
Table A-10. Commercial End-Use Baseline Natural Gas Intensities (MMBtu per sf.)
End Use2010
MMBtu/s.f.
Heating 24.7Cooling 0.3
Ventilation 0.0Water Heating 8.3
Cooking 2.4Other 6.8
HVAC Subtotal 25.0Total 42.6
To estimate the total efficiency resource potential in existing commercial buildings in Kentucky by 2030, we first adjusted the individual measure savings by an Adjustment Factor (See Equation 2). This factor accounts for two adjustments: the technical feasibility of efficiency measures, called the Percent Applicable (the percent of Kentucky floorspace that satisfy the basecase conditions and other technical prerequisites such as heating fuel type and cooling equipment, etc); and the Current Market Share, or the percent of products that already meet the efficiency criteria. These assumptions are outlined in each of the efficiency measure descriptions below.
Equation 2. Adjustment Factor = Percent Applicable x (1-Current Market Share)
We then adjusted total savings for interactions among individual measures. For example, we must adjust HVAC equipment savings downward to account for savings already realized through improved building envelope measures (insulation and windows), which reduce heating and cooling loads. Similarly, we adjust water heating equipment savings to account for reduced water heating loads from the use of more efficient clothes washers. The multiplier for these adjustments is called the Interaction Factor.
Finally, we adjust replacement measures with lifetimes more than 11 and 21 years to only account for the percent turning over in 11 and 21 years, which represents the benchmark years of 2020 and 2030, respectively. Note that the multiplier, Percent Turnover, is only applicable to products being replaced upon burnout and not retrofit measures such as insulation. These retrofit measures therefore have 100% of measures “turning over.”
We then calculate the resource potential for each measure in the state using Equation 3, which takes into account all of the adjustments described above. The sum of the resource potential from all measures is the overall energy efficiency resource potential in the state’s commercial buildings sector.
A.2.3. Efficiency Measures
Table A-10 shows the twenty-three efficiency measures examined for this analysis, grouped by end-use costs, savings (MBtu) per product or square foot, Percent Applicable, Interaction Factor, Percent Turnover, and total savings potential (MMBtu) in 2030. Detailed descriptions of each measure are given below, grouped by end-use.
50
Energy Efficiency Cost-Effective Resource Assessment for KY, ACEEE
Building Shell Improvements
Roof Insulation
Measure Description: Fiberglass or cellulose insulation material in roof cavities will reduce heat transfer, though the type of building construction limits insulation possibilities. R-values describe the performance factor for insulation levels.
Basecase: The basecase electricity intensity for this measure was disaggregated from the post-savings electricity intensity and the percentage of savings.
Data Explanation: We assume 3% savings and a post-savings gas intensity 24.2 Mbtu/ft2/year, based on HVAC natural gas intensity per EIA commercial building survey for East South Central region. An average lifetime of 25 years (CL&P 2007) and an incremental cost of 11 cents/ft2 were also assumed. The measure is shared with gas savings as well, so the portion of the incremental cost attributed to gas savings is 5 cents/s.f. The levelized cost is $4.86/MMBtu.
Double Pane Low-Emissivity Windows
Measure Description: Double-pane windows have insulating air- or gas-filled spaces between each pane, which resist heat flow. Low-emissivity (low-e) glass has a special surface coating to reduce heat transfer back through the window, and a window’s R-value represents the amount of heat transfer back through a window. Low-e windows are particularly useful in climates with heavy cooling loads, because they can reflect anywhere from 40% to 70% of the heat that is normally transmitted through clear glass. The Solar Heat Gain Coefficient (SHGC) represents the fraction of solar energy transferred through a window. For example, a low-e window with a 0.4 SHGC keeps out 60% of the sun’s heat.
Basecase: The basecase electricity intensity for this measure was disaggregated from the post-savings electricity intensity and the percent savings.
Data Explanation: Percent savings of 3% apply to whole-building electricity consumption (ACEEE 1997). Incremental costs assume $2 per window (SWEEP 2002). As with roof insulation, this measure is shared with gas savings. A measure life of 25 years is from SWEEP (2002). Percent applicable is an ACEEE estimate. The levelized cost is calculated to be $3.22/MMBtu.
Heating and Cooling: Equipment and Controls
Boiler Tune-Up
Measure Description: A boiler tune-up should be done regularly to keep the boiler system running at optimal efficiency.
Basecase: Same basecase as for high-efficiency main/front-end boilers is assumed.
Data Explanation: A boiler tune-up saves 2% of the energy of a baseline unit annually, or 30 MMBtu, and has an incremental cost of $250 per boiler (GDS 2005). Percent applicable of 7% was calculated using CBECS data of percentage of buildings with boilers that don’t perform regular maintenance (CBECS 2003). We assume a measure life of 2 years (GDS 2005). The levelized cost is $9.04/MMBtu.
Duct Sealing
Measure Description: Duct sealing involves sealing gaps in ductwork that allow conditioned air to escape.
Basecase: The basecase is heating and cooling energy intensity, 25.0 MBtu/ft2. This is the average of data for the East South Central census division (from the EIA’s commercial building survey) and the AEO.
Data Explanation: This measure saves 18% (48 MMBtu) of heating and cooling energy annually, and has an incremental cost of $7,000 (Sachs et al 2004). Percent applicable is 49% based on the number of buildings under 25,000 s.f., and the measure life is 25 years (Sachs et al 2004). The levelized cost is $10.43/MMBtu.
51
Energy Efficiency Cost-Effective Resource Assessment for KY, ACEEE
Pipe Insulation
Measure Description: This measure includes insulating accessible steam or hot water supply pipes in the boiler room.
Basecase: The basecase is standard heating energy intensity, 24.7 MBtu/ft2. This is the average of data for the East South Central census division (from the EIA’s commercial building survey) and the AEO.
Data Explanation: This measure saves 2% (5 MMBtu) of heating energy annually (NYSERDA 2006), and has an incremental cost of $450, based on an ACEEE estimate of 75 feet of pipe to insulate at $6 per linear foot of pipe (RSMeans). Percent applicable is 48%, current market share is 75%, and the measure life is 15 years (NYSERDA 2006). The levelized cost is $8.49/MMBtu.
High-Efficiency Rooftop Furnace Unit
Measure Description: This measure involves technologies such as condensing units to capture latent heat from water vapor in the flue, and modulating units which have a variable firing rate to match the output to heat load.
Basecase: The basecase is a 10 ton gas-fired condensing rooftop packaged unit with 80% steady state efficiency. The average annual gas use is 179 MMBtu (Sachs et al. 2004).
Data Explanation: A high efficiency rooftop unit uses 150 MMBtu/year, saves 16% of basecase energy, and has an incremental cost of $1,000 (Sachs et al. 2004). Percent applicable is 35% based on the percent of buildings less than 100,000 square feet multiplied by the assumption that the following percentages of size buildings use rooftop units: 40% of buildings 1,000-5,000 s.f., 80% of buildings 5,000-25,000 s.f., and 66% of buildings 25,000-100,000 s.f. This assumption is based on CBECS data as well as ACEEE estimates. We assume a measure life of 15 years and 0% current market share (Sachs et al. 2004). The levelized cost is shown to be $3.42/MMBtu.
High-Efficiency Standalone Furnace
Measure Description: This measure replaces minimum-efficiency gas furnaces with condensing furnaces and/or modulating capacity (variable firing rate that matches the output to heat load).
Basecase: The basecase is a 80 AFUE residential furnace. The average annual gas use is 142 MMBtu (ENERGY STAR figure modified by a factor of 1.45 to represent the slightly larger average size of a small commercial building than a residential building).
Data Explanation: A high efficiency furnace with 90 AFUE (ENERGY STAR minimum) uses 126 MMBtu/year, saves 11% of basecase energy, and has an incremental cost of $464 (ENERGY STAR; cost and savings modified as per basecase). Percent applicable is 2% based on the percent of buildings less than 5,000 square feet multiplied by the assumption that 40% of smaller buildings use furnaces. This assumption is based on CBECS data as well as ACEEE estimates. We assume a measure life of 18 years and 35% current market share (ENERGY STAR). The levelized cost is shown to be $2.51/MMBtu.
High-Efficiency Boiler
Measure Description: Substitution of condensing boilers with outdoor reset or equivalent controls (including circulation pump time clocks) for basecase non-condensing boilers without adaptive controls (just thermostats and equivalent).
Basecase: A case study of boilers with 68% efficiency was assumed. The average annual gas use is 1,106 MMBtu, which was modified from the original statistic (26,267 MMBtu) to account for the difference in the case study building size and the average commercial building size in Kentucky(Sachs et al. 2004).
Data Explanation: Boilers with 90% efficiency use 832 MMBtu/year in an average commercial building, save 50% of basecase energy (Durkin), and have an incremental cost of $3,024 (Sachs et al. 2004). The cost reflects the incremental cost of a high-efficiency boiler as well as the cost of an outdoor temperature reset system. Percent applicable is 41% based on assumptions of percentage of buildings in each size class that use boilers and an assumption of 90% that can be easily replaced, per CBECS and ACEEE estimates. We assume a measure life of 24 years (Sachs et al. 2004). The levelized cost is shown to be $0.88/MMBtu.
52
Energy Efficiency Cost-Effective Resource Assessment for KY, ACEEE
Programmable Thermostat
Measure Description: This measure involves replacing conventional thermostats with programmable thermostats. This measure is only appropriate to smaller buildings.
Basecase: The basecase of 29.1 MBtu/ft2 is the standard heating and cooling intensity modified by the overall intensity ratio of small buildings to the average (EIA 2006, 2011).
Data Explanation: This measure saves 5% (3 MMBtu) of heating energy annually (RLW 2007). The measure has an incremental cost of $101 (CEC 2005) and a percent applicable of 7%. The percent applicable derives from the percentage of East South Central commercial buildings under 2,000 s.f. and the fact that 80% of these buildings do not have an EMS (EIA 2006). The measure life is 12 years (GDS 2005) and the levelized cost is $5.28/MMBtu.
Demand-Controlled Ventilation
Measure Description: Often, HVAC systems are designed to supply ventilated air based on assumed occupancy levels, resulting in over-ventilation. Demand-controlled ventilation monitors CO2 levels in different zones and delivers the required ventilation only when and where it is needed.
Basecase: The basecase energy use is 215 MMBtu/year, or the portion of commercial gas heating attributable to ventilation (Sachs et al 2004).
Data Explanation: Demand-controlled ventilation saves 20% of the ventilation energy a year (43 MMBtu), and has an incremental cost of $575 per zone (six zones were assumed as an average, for a total cost of $3,450) (Sachs et al 2004). Percent applicable is 54%, and the measure life is 15 years (Sachs et al 2004). The levelized cost is $7.75/MMBtu.
Outdoor Temperature Boiler Reset
Measure Description: Normally, boilers heat water to a fixed temperature. With an outdoor air reset system, the maximum temperature the boiler operates at is variable, depending on the outdoor temperature. The warmer the outdoor temperature, the lower the boiler temperature needs to be, saving energy over the standard fixed (high) temperature operation of a conventional boiler.
Basecase: The basecase is standard heating energy intensity, 24.7 MBtu/ft2. This is the average of data for the East South Central census division (from the EIA’s commercial building survey) and the AEO.
Data Explanation: This measure saves 2% (5 MMBtu) of heating energy annually (NYSERDA 2006), and has an incremental cost of $600 (GDS 2005). Percent applicable is 5%, based on the percent of boilers not included in the High Efficiency Boiler measure. The current market share is 60% (NYSERDA 2006), and the measure life is 15 years (ACEEE 2006). The levelized cost is $11.14/MMBtu.
Water Heating
Smart Circulation Pump Controls
Measure Description: This measure involves shutting down the DHW recirculation pump during periods when there is little or no demand for hot water. These periods are determined by the controls from historical use patterns. This leads to savings from heat loss through piping, as well as savings associated with the running of the pump.
Basecase: The basecase is standard water heating energy intensity, 8.3 MBtu/ft2. This is the average of data for the East South Central census division (from the EIA’s commercial building survey) and the AEO.
Data Explanation: This measure saves 3% (3 MMBtu) of water heating energy annually, and has an incremental cost of $143 (GDS 2005). Percent applicable is 5% based on the percent of buildings with boilers that are not covered in the high efficiency boiler measure, and the measure life is 15 years (GDS 2005). The levelized cost is $5.34/MMBtu.
Condensing DHW Stand-Alone Tank
53
Energy Efficiency Cost-Effective Resource Assessment for KY, ACEEE
Measure Description: This measure involves a new high-efficiency residential-sized tank-type gas water heater, for smaller commercial operations.Basecase: The basecase is standard water heating energy intensity, 8.3 MBtu/ft2. This is the average of data for the East South Central census division (from the EIA’s commercial building survey) and the AEO.
Data Explanation: This measure saves 36% (37 MMBtu) of water heating energy annually (NYSERDA 2006), and has an incremental cost of $1,100 (Sachs et al. 2004). Percent applicable is 35%, current market share is 5%, and the measure life is 15 years (NYSERDA 2006). The levelized cost is $3.43/MMBtu.
Indirect-Fired DHW Off Space Heating Boiler
Measure Description: DHW cylinders are heated indirectly with water from the boiler.
Basecase: The basecase is standard water heating energy intensity, 8.3 MBtu/ft2. This is the average of data for the East South Central census division (from the EIA’s commercial building survey) and the AEO.
Data Explanation: This measure saves 30% (30 MMBtu) of water heating energy annually (NYSERDA 2006), and has an incremental cost of $4,000. Percent applicable is 6%, the current market share is close to 0%, and the measure life is 25 years (NYSERDA 2006). The levelized cost is $11.19/MMBtu.
Instantaneous High-Modulating Water Heater
Measure Description: “Instant” or “tankless” water heaters heat water on demand. Advanced units have modulating burners with electronic controls to maintain constant outlet temperature despite variations in inlet temperature and variable demand.
Basecase: The basecase is standard water heating energy intensity, 8.3 MBtu/ft2. This is the average of data for the West South Central census division (from the EIA’s commercial building survey) and the AEO.
Data Explanation: This measure saves 21% (21 MMBtu) of water heating energy annually (NYSERDA 2006), and has an incremental cost of $650 (Sachs et al. 2004). Percent applicable is 4%, the current market share is 14%, and the measure life is 15 years (NYSERDA 2006). The levelized cost is $3.55/MMBtu.
Cooking
Direct Fired Convection Range/Oven
Measure Description: Convection ovens use a small fan to circulate hot air within the oven cavity. Circulating air can heat food more efficiently than the still air found in conventional ovens.
Basecase: A conventional range/oven uses approximately 160 MMBtu/year (Food Service Technology Center 2002).
Data Explanation: This measure saves 35% (56 MMBtu) per year per unit (GDS 2005), and has an incremental cost of $2,625 (RSMeans 2008). The measure life is 8 years and the percent applicable is 7%, which accounts for weighted applicability in only the commercial sectors that would have ovens (NYSERDA 2006). The levelized cost is $7.25/MMBtu.
High Efficiency ENERGY STAR Fryer
Measure Description: ENERGY STAR fryers can save 15-25% of the energy used by a conventional model. High-efficiency gas fryers utilize technology such as heat pipes, infrared burners, recirculation tubes, power burners, and pulse combustion.
Basecase: A conventional fryer uses 163 MMBtu per year on average (EPA 2007).
Data Explanation: An ENERGY STAR fryer saves 31% (51 MMBtu) per year per unit, and has an incremental cost of $3,795 (ENERGY STAR). Current market share is 11% (EPA 2007), and the Kentucky stock data (42,000 units) was derived from national annual shipments (EPA 2007), measure life (12 years—ENERGY STAR), and the ratio of commercial buildings that include cooking equipment that use natural gas (CBECS). The levelized cost is $8.48/MMBtu.
54
Energy Efficiency Cost-Effective Resource Assessment for KY, ACEEE
55
Energy Efficiency Cost-Effective Resource Assessment for KY, ACEEE
High Efficiency ENERGY STAR Steam Cooker
Measure Description: ENERGY STAR steam cookers have better insulation to reduce heat loss, and a more efficient steam delivery system. These steamers can be up to 50% more energy-efficient than conventional steamers.
Basecase: A conventional steamer uses 91 MMBtu per year on average (data derived from ENERGY STAR and Food Service Technology Center data).
Data Explanation: An ENERGY STAR steam cooker saves 50% (45 MMBtu) per year per unit (ENERGY STAR), and incremental cost is a net savings of $1,995 (CEC 2005). Current market share is 8%, and the Kentucky stock data (17,000 units) was derived from national annual shipments (ENERGY STAR) , measure life (10 years—Food Service Technology Center 2002), and the ratio of commercial buildings that include cooking equipment that use natural gas (EIA 2006). The levelized cost is a net savings of $5.63/MMBtu.
High Efficiency Griddle
Measure Description: High efficiency griddles take advantage of technologies such as double sided griddles, chrome finishes, snap-action thermostats, infrared burners, heat pipes, thermal fluid or steam to reduce energy consumption.
Basecase: A conventional griddle uses 112 MMBtu per year on average (Food Service Technology Center 2002).
Data Explanation: A high efficiency griddle saves 14% (15 MMBtu) of energy per year per unit (GDS 2005), and has an incremental cost of $50 (CEC 2005). Percent applicable is 90%. The levelized cost is $0.37/MMBtu.
Miscellaneous
Retrocommissioning
Measure Description: Retrocommissioning results in optimized energy usage of buildings through better operations and maintenance, control calibration, and facilities staff training.
Basecase: The basecase is average heating, cooling, and water heating energy intensity, 33.3 MBtu/ft2. This is the average of data for the East South Central census division (from the EIA’s commercial building survey) and the AEO.
Data Explanation: This measure saves 10% (34 MMBtu) of heating, cooling, and water heating energy (Sachs et al 2004), and has an incremental cost of $0.25 per square foot. This cost is shared with electric savings from the same measure, so the actual cost of gas savings is $0.12. Percent applicable is 54%, and the measure life is 7 years (Sachs et al 2004). The levelized cost is $6.48/MMBtu.
New Buildings
Efficient New Building (15% Savings)
Measure Description: Incorporating energy efficiency into building design is best achieved at the time of construction. New buildings can achieve major energy savings in heating and cooling, as well as energy-saving appliances.
Basecase: The basecase is 48.4 MBtu/ft2 per year, based on the HVAC and water heating energy intensities for commercial buildings built between 2000 and 2003 (EIA 2006).
Data Explanation: Incremental cost of $0.35 per ft2 and measure life of 17 years are from NGRID (2007). The cost is shared with electric savings from the same measure, so the actual cost for gas savings is $0.17. Percent applicable of 18% for this new buildings measure assume that 30% and 50% new buildings savings are phased in one to two years prior to enactment of codes in the policy scenarios (30% in 2012 and 50% in 2020). The levelized cost is calculated to be $2.07/MMBtu.
Efficient New Building (30% Savings)
Measure Description: Incorporating energy efficiency into building design is best achieved at the time of construction. New buildings can achieve major energy savings in heating and cooling, as well as energy-saving appliances.
56
Energy Efficiency Cost-Effective Resource Assessment for KY, ACEEE
Basecase: The basecase is 48.4 MBtu/ft2 per year, based on the HVAC and water heating energy intensities for commercial buildings built between 2000 and 2003 (EIA 2006).
Data Explanation: In New York, estimates show that commercial buildings can reach 30% beyond code at an investment of $0.70/kWh. To be conservative, we estimate $0.70/kWh by doubling the costs of a 15%-beyond-code building. The cost is shared with electric savings from the same measure, so the actual cost for gas savings is $0.34. Measure life of 17 years is from NGRID (2007). Percent applicable of 35% for 30% savings new buildings assume that 30% and 50% new buildings savings are phased in one to two years prior to enactment of codes in the policy scenarios (30% in 2012 and 50% in 2020). The levelized cost is calculated to be $2.07/MMBtu.
Tax-Credit Eligible Building (50% Savings)
Measure Description: A federal tax incentive is available for new buildings that are constructed to save at least 50% of the heating, cooling, ventilation, water heating, and interior lighting cost of a building that meets ASHRAE standard 90.1-2001.
Basecase: Basecase of 48.4 MBtu/ft2 is an estimate of HVAC, water heating, and lighting end-use electricity intensity for new buildings in Kentucky, derived from data for buildings built from 2000–2003 (EIA 2006).
Data Explanation: Incremental costs of $0.66 per ft2 are derived from NREL (2008) studies on energy savings for medium box retail stores and supermarkets. This cost is shared with electric savings from the same measure, so the actual cost for gas savings is $0.32. Percent applicable is 18%, accounting only for the share of buildings that call into the two types of buildings covered in the NREL studies. Measure life of 17 years is from NGRID (2007). The levelized cost is calculated to be $1.17/MMBtu.
57
Energy Efficiency Cost-Effective Resource Assessment for KY, ACEEE
Table A-11. Commercial Natural Gas Measure Characterizations
MeasuresMeasure
Life (Years)
Annual MMBtu svgs per unit
2007 Kentucky Stock
MBtu svgs per s.f.
Incremental cost per unit
Incremental cost per s.f.
Cost of Conserved
Energy (2010$/MMBt
u saved)
Adjustment Factor
% Turnover
Interaction
Factor
Savings in 2030
(BBtu)
Existing BuildingsBuilding ShellRoof insulation 25 8 NA 0.78 $ - 0.05 4.86 35% 84% 100% 234,929Low-e windows 25 8 NA 0.75 $ - 0.03 3.22 75% 84% 100% 480,366
715,295HVACBoiler tune-up 2 15 NA 1.44 $ 250 $ - $ 9.04 7% 100% 100% 102,993Duct sealing 25 48 NA 4.61 $ 7,000 $ 1 $ 10.43 49% 84% 100% 1,944,801Pipe insulation - heating 15 5 NA 0.49 $ 450 $ - $ 8.49 12% 100% 100% 60,614
Load-Reducing Measures Subtotal 2,108,408High Efficiency rooftop furnace unit 15 28 NA 2.73 $ 1,000 $ - $ 3.42 35% 100% 84% 818,763High efficiency standalone furnace 18 16 NA 1.53 $ 464 $ - $ 2.51 1% 100% 84% 17,027High efficiency main/front-end boiler 24 184 NA 17.83 $ 2,229 $ - $ 0.88 37% 88% 84% 4,981,615HVAC Equipment Measures Subtotal 5,817,405
Programmable thermostat 12 2 NA 1.45 $ 101 $ - $ 5.28 7% 100% 39% 41,084Demand-controlled ventilation 15 43 NA 4.15 $ 3,450 $ - $ 7.75 54% 100% 39% 899,015Outdoor temperature boiler reset 15 5 NA 0.49 $ 590 $ - $ 11.14 2% 100% 39% 3,808
HVAC Control Measures Subtotal 943,907HVAC Subtotal 8,869,720
Water HeatingCirculation pump time clock 15 3 0.25 $ 143 $ - $ 5.34 5% 100% 100% 11,736
Control Measures Subtotal 11,736Condensing DHW stand-alone tank 15 31 NA 2.99 $ 1,100 $ - $ 3.43 33% 100% 100% 1,007,290Indirect-fired DHW off space heating boiler 25 25 2.45 $ 4,000 $ - $ 11.19 6% 84% 100% 130,991Tankless high-modulating water heater 15 18 1.71 $ 650 $ - $ 3.55 3% 100% 100% 59,903
Equipment Measures Subtotal 1,198,185Water Heating Subtotal 1,209,920
CookingDirect fired convection range/oven 8 56 104,000 0.00 $ 2,625 $ - $ 7.25 7% 100% 100% 390,725High efficiency ENERGY STAR fryer 12 51 42,000 0.00 $ 3,795 $ - $ 8.48 11% 100% 100% 233,178High efficiency ENERGY STAR steam cooker 10 45 17,000 0.00 $ (1,955) $ - $ (5.63) 8% 100% 100% 62,206High efficiency griddle 12 15 19,000 0.00 $ 50 $ - $ 0.37 5% 100% 100% 14,493
700,601
58
Energy Efficiency Cost-Effective Resource Assessment for KY, ACEEE
MiscellaneousRetrocommissioning 7 34 NA 3.33 $ - $ 0.12 $ 6.48 54% 100% 100% 1,837,822
1,837,822
Existing Buildings Subtotal 13,333,360New BuildingsEfficient new building (15% savings) 17 NA NA 7.25 NA $ 0.17 $ 2.07 18% 100% 100% 348,796Efficient new building (30% savings) 17 NA NA 14.51 NA $ 0.34 $ 2.07 35% 100% 100% 1,395,183Tax credit eligible building (50% svgs) 17 NA NA 24.18 NA $ 0.32 $ 1.17 18% 100% 100% 1,185,905
2,929,884TOTAL 6,263,243
59
Energy Efficiency Cost-Effective Resource Assessment for KY, ACEEE
A.3. Industrial Buildings Sector
A.3.1. Overview of Approach
According to 2006 Manufacturing Energy Consumption Survey (MECS) (EIA 200912), the South region (which includes Kentucky) industrial energy use is broken down as follows: electricity (15%), natural gas (34%), fuel oil (3%), coal & coke (5%), and other (43%). Therefore, this analysis focused on the electricity and natural gas savings potential. It was accomplished in several steps. First, the industrial market in Kentucky was characterized at a disaggregated level and energy consumption for key end-uses was estimated. Then cost effective energy-saving measures were selected based on the projected average retail industrial electricity and natural gas prices. The economic potential savings for these measures was estimated by applying the efficiency measures to end-use energy consumption. The following sections described the process for estimating the savings potential in Kentucky.
A.3.2. Market Characterization and Estimation of Base Year Electricity Consumption
The industrial sector is made up of a diverse group of economic entities spanning agriculture, mining, construction and manufacturing. Significant diversity exists within most of these industry sub-sectors, with the greatest diversity within manufacturing. The various product categories within manufacturing are classified using the North American Industrial Classification System (NAICS) (Census 2007).13
Comprehensive, highly-disaggregated electricity or natural gas data for the industrial sector is not available at the state level. To estimate the electricity and natural gas consumption, this study drew upon a number of resources, all using the NAICS system and a consistent sample methodology. Fortunately, a conjunction of the various economic censuses for each state allows us to use a common base-year of 2007.
We then used national industry energy intensities derived from industry group electricity and natural gas consumption data reported in the 2010 Annual Energy Outlook (AEO) (EIA 2010) and value of shipments data reported in the 2007 Annual Survey of Manufacturing (ASM) (Census 2007) to apportion industrial energy consumption. These intensities were then applied to the value of shipments data for the manufacturing energy groups (three-digit NAICS) in Kentucky. These energy consumption estimates were then used to estimate the share of the industrial sector electricity and natural gas consumption for each sub-sector.
Paducah Gaseous Diffusions Plant
The Department of Energy operates a Gaseous Diffusion plant in West Paducah, Kentucky, which enriches uranium for power generation. However, no value of shipments data (or estimates of energy intensity) exists for this one-of-a-kind plant. Based on conversations with staff at the Kentucky Department for Energy Development and Independence, we estimate that this plant consumes a significant portion of the nearby TVA Shawnee power plant (ORISPL 1379),which generated about 8,500 GWh in 2010 (EPA 201114). We assume that about two-thirds of the electricity generated by this plant powers the Gaseous Diffusion plant, accounting for 12% of total industrial electricity consumption. We further assume that the future electricity use will remain at 12%. While the plant is scheduled for shutdown in 2012, there are efforts underway to extend the plant’s life. If you have any additional information on the energy use and future of the Paducah Gaseous Diffusion plant, please respond with comments.
12 http://205.254.135.24/emeu/mecs/mecs2006/2006tables.html 13 The industry sector is comprised of four sub-sectors: Manufacturing, Mining, Agriculture, and Construction. Each sub-sector is further broken down into individual industry groups, reflecting the many different definitions for the term ‘industrial.’14 http://www.epa.gov/airmarkets/images/CoalUnitCharacteristics2010.pdf
60
Energy Efficiency Cost-Effective Resource Assessment for KY, ACEEE
Preparation of Baseline Industrial Electricity and Natural Gas Forecast
As is the case for state-level energy consumption data, no state-by-state disaggregated electricity or natural gas consumption forecasts are publicly available. Several alternate data sources were used to calculate estimated energy consumption growth rates for each state and sub-sector. We made the assumption that energy consumption will be a function of gross state value of shipments (VOS). Electricity and natural gas consumption, however, will not grow at the same rate as value of shipments. This is because in general, energy intensity (energy consumed per value of output) decreases with time.
Because state-level disaggregated economic growth projections are not publicly available, data was used from Moody’s Economy.com. The average growth rate for specific industrial-subsectors was estimated based on Economy.com’s estimates of gross state product (Economy.com 2011c). We used this estimated industrial energy consumption distribution to apportion the EIA estimate (2010) of industrial energy consumption.
The industry sector is comprised of four sub-sectors: Manufacturing, Mining, Agriculture, and Construction. The manufacturing sector is broken down into 21 subsectors, defined by three digit NAICS codes. In order to most closely match available data from the ASM and AEO, three subsectors were further broken down to four digit NAICS codes: chemical manufacturing, nonmetallic mineral product manufacturing, and primary metal manufacturing. Table A-12 below shows the estimated electrical and natural gas consumption for all these subsectors in Kentucky in 2010.
61
Energy Efficiency Cost-Effective Resource Assessment for KY, ACEEE
Table A-12. 2010 Electricity & Natural Gas Consumption by Industry in Kentucky
(GWh) (%) (BBtu) (%)Agriculture 11 663 1% 605 0%Mining 21 1,890 4% 7,407 6%Construction 23 482 1% 1,555 1%
Food mfg 311 1,164 3% 3,991 3%Beverage & tobacco product mfg 312 460 1% 1,577 1%Textile mills 313 56 0% 108 0%Textile product mills 314 56 0% 108 0%Apparel mfg 315 56 0% 108 0%Leather & allied product mfg 316 0 0% 0 0%Wood product mfg 321 479 1% 350 0%Paper mfg 322 1,633 4% 5,042 4%Printing & related support activities 323 323 1% 618 1%Petroleum & coal products mfg 324 1,366 3% 14,293 12%Chemical mfg 325 7,200 16% 37,771 31%
Pharmaceutical & medicine mfg 3254 128 0% 672 1%All other chemical products -3253,3255- 7,072 16% 37,099 31%
Plastics & rubber products mfg 326 1,364 3% 1,244 1%Nonmetallic mineral product mfg 327 2,021 4% 13,264 11%
Glass & glass product mfg 3272 567 1% 2,949 2%Cement & concrete product mfg 3273 1,113 2% 8,542 7%Other minerals 3271,3274- 341 1% 1,773 1%
Primary metal mfg 331 15,108 33% 26,046 21%Iron & steel mills & ferroalloy mfg 3311 4,450 10% 13,194 11%Steel product mfg from purchased steel 3312 520 1% 1,543 1%Alumina and Aluminum 3313 8,161 18% 8,338 7%Nonferrous Metals, except Aluminum 3314 1,485 3% 1,517 1%Foundries 3315 491 1% 1,454 1%
Fabricated metal product mfg 332 1,007 2% 1,676 1%Machinery mfg 333 519 1% 613 1%Computer & electronic product mfg 334 319 1% 263 0%Electrical equipment, appliance, & component mfg 335 433 1% 594 0%Transportation equipment mfg 336 2,849 6% 3,770 3%Furniture & related product mfg 337 114 0% 218 0%Miscellaneous mfg 339 181 0% 346 0%Gaseous Diffusion Plant x 5,588 12% x x
Total Industrial Sector 45,332 100% 121,566 100%
NAICS CodeIndustry Electricity Natural Gas
A.3.3. Market Characterization Results
In 2010, Kentucky’s industrial sector consumed 45,332 GWh of electricity and 121,566 billion Btus of natural gas. Within the manufacturing sector, the chemical, primary metal, petroleum & coal, and non-metallic mineral products manufacturing industries are the largest consumers of energy, accounting for 65% of electricity consumption and 75% of natural gas.
Industrial Electricity End Uses
In order to determine the electricity savings for any technology, the fraction of the electricity to which the technology is applicable must be determined. Much of the energy consumed by industry is directly involved in processes required to produce various products. Electricity accounts for about a third of the primary energy used by industries (EIA 2010). Electricity is used for many purposes, the most important being to run motors, provide lighting, provide heating, and drive electrochemical processes.
62
Energy Efficiency Cost-Effective Resource Assessment for KY, ACEEE
While detailed end-use data is only available for each manufacturing sub-sector and group through the MECS survey (EIA 2009), motor systems are estimated to consume 60% of the industrial electricity (Xenergy 2002). The fraction of total electricity attributed to motors is presented in Figure A-1.
Figure A-1. Percent of Total Electricity Consumption by Motor Systems
0%
10%
20%
30%
40%
50%
60%
70%
80%
90%
Chemical mfg Petroleum & coalproducts mfg
Computer &electronic
product mfg
Food mfg Transportationequipment mfg
Fabricated metalproduct mfg
Nonmetallicmineral product
mfg
Primary metalmfg
Source: XENERGY (2002)
Motors are used for many diverse applications from fluid applications (pumps, fans, and air and refrigeration compressors), to materials handling and processing (conveyors, machine tools and other processing equipment). The distribution of these motor uses varies significantly by industry, with material processing being the largest consumer in the sector. Figure A-2 shows the total weighted average of end-use electricity consumption in Kentucky with a breakdown of motors use in the state.
63

Energy Efficiency Cost-Effective Resource Assessment for KY, ACEEE
Figure A-2. Weighted Average of Industrial End-Uses with Breakdown of Industrial Motor System End-Uses
As discussed above, motors make up the majority of industrial electricity use. Electricity use for process heating is also significant, mostly due to the large amount of primary metals manufacturing, particular aluminum. (Note: this excludes end-use consumption at the Gaseous Diffusion Plant.)
Industrial Natural Gas End Uses
A similar methodology was used to determine industrial natural gas end use. The MECS survey (EIA 2010) provided both end use categories and nationwide consumption by industry, which was then applied to the actual industry mix in Kentucky. The results are shown below in Figure A-3.
Figure A-3. Weighted Average of Total Industrial Natural Gas End-Uses in Kentucky
Direct process heating is responsible for nearly half of natural gas use in Kentucky, followed by boilers, which account for close to 50%.
64
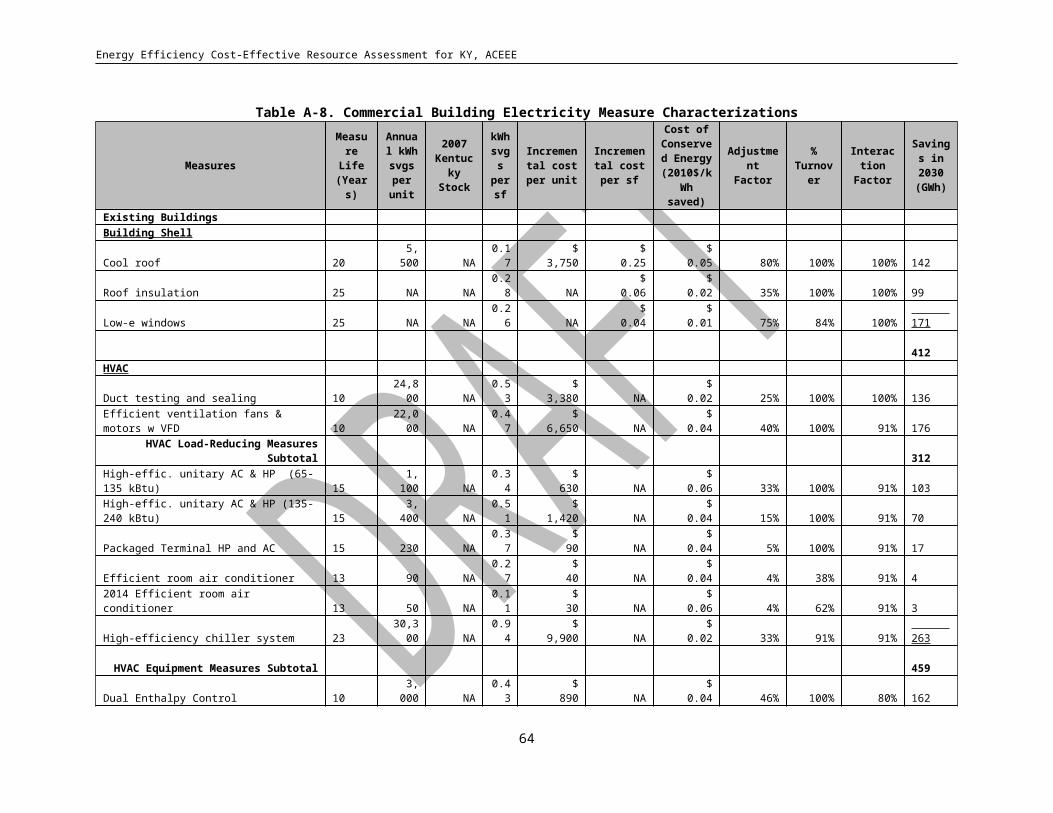
Energy Efficiency Cost-Effective Resource Assessment for KY, ACEEE
A.3.4. Overview of Efficiency Measures Analyzed
The first step in our technology assessment was to collect limited information on a broad “universe” of potential technologies. Our key sources of information included the DOE, Office of Industrial Technologies; the Center for the Analysis and Dissemination of Demonstrated Energy Technologies (CADDET); Lawrence Berkeley National Laboratory (LBNL) and American Council for an Energy-Efficient Economy reports; information from NYSERDA; and Itron. We did not collect any primary data on technology performance.
Oftentimes, no one source provided all of the information we sought for our assessment (energy use, energy savings compared to average current technology, investment cost, operating cost savings, lifetime, etc.). We therefore made our best effort to combine readily available information along with expert judgment where necessary.
We sought to identify technologies that could have a large potential impact in terms of saving energy. These may be technologies that are specific to one process or one industry sector, or so-called “cross-cutting” technologies that are applicable to a variety of sectors. In estimating energy savings, we first identified the specific energy savings of each technology by comparing the energy used by the efficient technology to the energy required by current processes. Our second step was to “scale up” this savings estimate to see how much energy savings—for industry overall—this technology would achieve. For the most part, we derived specific energy savings information from the various technology assessment studies noted above.
In scaling up the technology-specific energy savings, we relied on our general knowledge of the various industrial processes to which this technology could be applied. We also took into account structural limitations to the penetration of the technology. Additionally, we recognized that market penetration, in the absence of significant policy support, can take time given the slowness of stock turnover in many industrial facilities.
Electricity Measures
We identified 13 measures that were cost effective at the average projected industrial electricity rates in Kentucky of $0.061/kWh (see Table B-12). The cost and performance of these measures has been developed over the past decade by ACEEE from research into the individual measures and review of past project performance. The costs of many of these measures has increased in recent years as a result of significant increases in key commodity costs such as copper, steel and aluminum, as well as overall manufacturing costs due to energy prices and market pressures. The estimates presented in Table B-12 represent ACEEE’s most current estimates. We present the full normalized installed measure cost (i.e., the full cost required to install a measure per unit of saved energy) as well as the levelized cost (i.e., the annual cost of the measure amortized over the life of the measure).
65
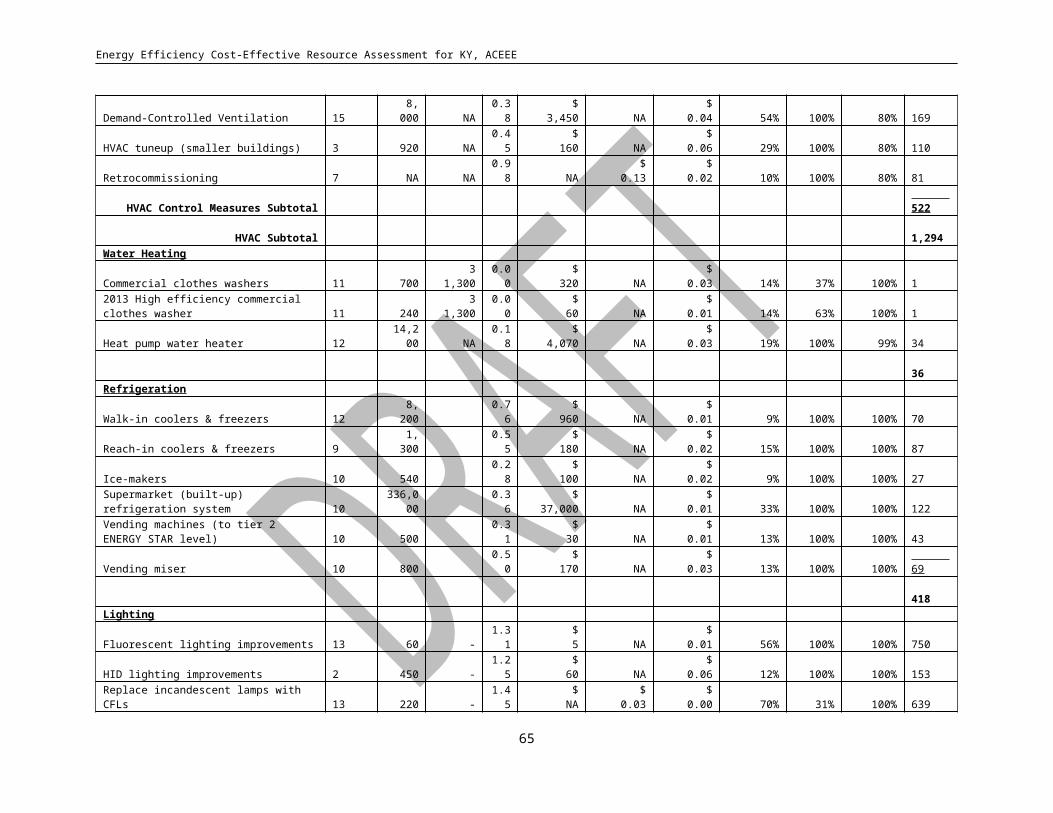
Energy Efficiency Cost-Effective Resource Assessment for KY, ACEEE
Table A-13. Cost and Performance of Industrial Electricity Measures
Measure Measure Life
Cost of Saved Energy Annual Savings for
End-UseInstalled cost/kWh
Levelized cost/kWh
Sensors & Controls 15 $0.145 $0.014 3%Duct/Pipe insulation 20 $0.653 $0.052 20%Electric supply 15 $0.104 $0.010 3%Lighting 15 $0.212 $0.020 23%Advanced efficient motors 25 $0.491 $0.035 6%Motor management 5 $0.079 $0.018 1%Lubricants 1 $0.000 $0.000 3%Motor system optimization 15 $0.097 $0.009 1%Compressed air manage 1 $0.000 $0.000 17%Compressed air –advanced 15 $0.001 $0.000 4%Pumps 15 $0.083 $0.008 20%Fans 15 $0.249 $0.024 6%Refrigeration 15 $0.034 $0.003 10%
In addition, we estimated the average normalized cost of industrial energy efficiency investments to be $0.23/kWh saved. This estimate was arrived at by estimating the sum of the annual incremental savings for each measure in each industry based on end-use energy distribution and dividing the corresponding total investment required.
Natural Gas Measures
We identified 35 measures that were cost effective at the average projected industrial natural gas rate in Kentucky of $9.71/MMBtu (see Table B-13). The cost and performance of these measures were taken from a 2006 Itron report. We present the full normalized installed measure cost (i.e., the full cost required to install a measure per unit of saved energy) as well as the levelized cost (i.e., the annual cost of the measure amortized over the life of the measure).
66
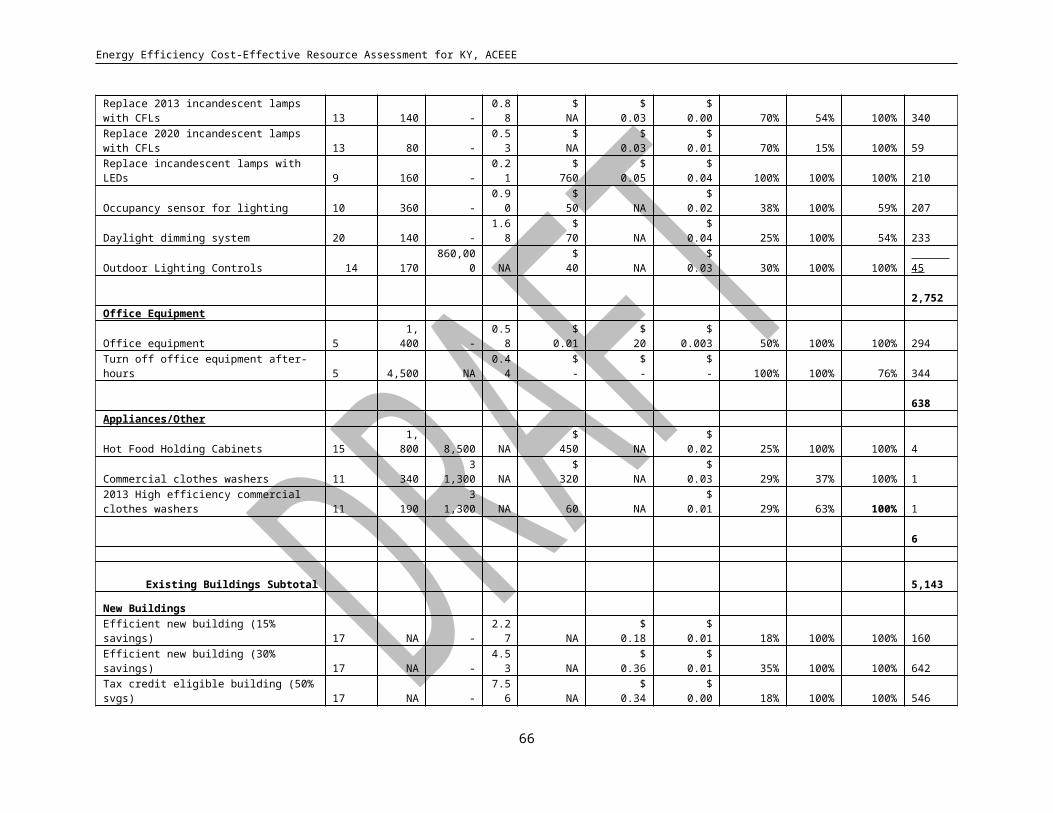
Energy Efficiency Cost-Effective Resource Assessment for KY, ACEEE
Table A-14. Cost and Performance of Industrial Natural Gas Measures
Measure Measure Life
Installed Cost
($/MMBtu Saved)
Levelized Cost
($/MMBtu Saved)
Annual Savings for
End-Use
Boiler MeasuresImproved process control 15 $1.23 $0.12 3%Maintain boilers 2 $0.02 $0.01 10%Flue gas heat recovery/economizer 15 $3.48 $0.34 2%Blowdown steam heat recovery 15 $3.06 $0.29 1%Upgrade burner efficiency 20 $2.50 $0.20 1%Water treatment 10 $0.63 $0.08 1%Load control 15 $1.36 $0.13 4%Improved insulation 15 $6.55 $0.63 8%Steam trap maintenance 2 $0.84 $0.45 13%Automatic steam trap monitoring 15 $3.41 $0.33 5%Leak repair 2 $0.22 $0.12 4%Condensate return 15 $9.57 $0.92 10%
HVAC MeasuresImprove ceiling insulation 20 $85.70 $6.88 24%Install HE(95%) cond. furnace/boiler 20 $37.88 $3.04 18%Stack heat exchanger 20 $18.41 $1.48 5%Duct insulation 20 $3.52 $0.28 2%EMS install 20 $31.79 $2.55 10%EMS optimization 5 $0.30 $0.07 1%
Process Heat MeasuresProcess Controls & Management 8 $3.33 $0.51 5%Heat Recovery 20 $92.06 $7.39 20%Efficient burners 10 $14.27 $1.85 18%Process integration 15 $87.04 $8.39 17%Efficient drying 20 $61.55 $4.94 17%Closed hood 15 $34.82 $3.35 5%Extended nip press 20 $92.59 $7.43 16%Improved separation processes 20 $26.30 $2.11 10%Flare gas controls and recovery 15 $87.04 $8.39 50%Fouling control 5 $1.77 $0.41 7%Efficient furnaces 20 $13.89 $1.11 6%Oxyfuel 20 $63.13 $5.07 20%Batch cullet preheating 15 $27.85 $2.68 16%Preventative maintenance 5 $0.30 $0.07 2%Combustion controls 8 $5.32 $0.82 8%Optimize furnace operations 10 $9.52 $1.23 10%Insulation/reduce heat losses 15 $29.79 $2.87 5%
We estimated the average normalized cost of industrial energy efficiency investments to be $2.03/MMBtu saved. This estimate was arrived at by estimating the sum of the annual incremental savings for each measure in each industry based on end-use energy distribution and dividing the corresponding total investment required.
A.3.5. Potential for Energy Savings
67

Energy Efficiency Cost-Effective Resource Assessment for KY, ACEEE
In Kentucky, a diverse set of efficiency measures will provide electricity savings for industry. The application of these measures contributes to total economic electric savings potential of 15%. These savings are distributed as presented in Figure A-4.
Figure A-4. Fraction of Electricity Savings Potential by Measure
The total natural gas savings potential for the Kentucky is about 18%. These savings are distributed as presented in Figure A-5.
Figure A-5. Fraction of Natural Gas Savings Potential by Measure
In addition, this analysis did not consider process-specific efficiency measures that would be applied at the individual site level because available data does not allow this level of analysis. However, based on experience from site assessments by DOE and other entities, we would anticipate an additional economic savings of 5-10%, primarily at large energy intensive manufacturing facilities. Therefore, the overall economic industrial efficiency resource opportunity for electricity and natural gas is on the order of 20-25% and 23%-28%, respectively.
68


![Introduction - interoperability.blob.core.windows.netinteroperability.blob.core.windows.net/.../[MS-OFORMS] … · Web viewTechnical Documentation. ... The set is also referred](https://static.fdocuments.us/doc/165x107/5a78b7b07f8b9a21538c5e00/introduction-ms-oforms-web-viewtechnical-documentation-the-set-is-also.jpg)