Technical and Economic Assessment of Small-Scale Fischer-Tropsch Liquids Facilities...
104
Technical and Economic Assessment of Small-Scale Fischer-Tropsch Liquids Facilities DOE/NETL-2007/1253 Final Report February 27, 2007
Transcript of Technical and Economic Assessment of Small-Scale Fischer-Tropsch Liquids Facilities...

Technical and Economic Assessment of Small-Scale
Fischer-Tropsch Liquids Facilities
DOE/NETL-2007/1253
Final Report
February 27, 2007

Disclaimer
This report was prepared as an account of work sponsored by an agency of the United States Government. Neither the United States Government nor any agency thereof, nor any of their employees, makes any warranty, express or implied, or assumes any legal liability or responsibility for the accuracy, completeness, or usefulness of any information, apparatus, product, or process disclosed, or represents that its use would not infringe privately owned rights. Reference therein to any specific commercial product, process, or service by trade name, trademark, manufacturer, or otherwise does not necessarily constitute or imply its endorsement, recommendation, or favoring by the United States Government or any agency thereof. The views and opinions of authors expressed therein do not necessarily state or reflect those of the United States Government or any agency thereof.

Technical and Economic Assessment of Small-Scale Fischer-Tropsch Liquids Facilities
DOE/NETL-2007/1253
Final Report for Subtask 41817.401.01.08.003
February 27, 2007
NETL Contact: Michael Reed
Senior Systems Analyst Office of Systems Analyses and Planning
Prepared by:
Lawrence Van Bibber Research & Development Solutions, LLC (RDS)/ Science Applications International Corp. (SAIC)
Erik Shuster RDS/SAIC
John Haslbeck RDS/Parsons
Michael Rutkowski RDS/Parsons
Scott Olson RDS/Nexant
Sheldon Kramer RDS/Nexant
National Energy Technology Laboratory www.netl.doe.gov

Final Report 1
BACKGROUND
Economic and national security concerns related to liquid fuels have revived national interest in alternative liquid fuel sources. Coal to Fischer-Tropsch fuels production has emerged as a major technology option for many states and the Department of Energy. This report summarizes the preliminary results of an NETL study examining the feasibility of small-scale, coal-to-liquids production.

Final Report 2
Technical and Economic Assessment of Small-Scale Fisher-Tropsch Liquids Facilities
EXECUTIVE SUMMARY
OVERVIEW
This report examines the technical and economic feasibility of a small-scale coal-to-liquids (CTL) facility in southwestern West Virginia. The facility employs gasification and Fischer-Tropsch (F-T) technology to produce commercial-grade diesel and naphtha liquids from a high-sulfur bituminous coal. The scope of the study includes conceptual design development, process analysis, component descriptions, capital and operating cost estimates, and a comparative financial analysis.
PLANT DESIGN
The feasibility study evaluated two design concepts:
• Co-located Plant: Concept 1 consists of an F-T plant co-located with an integrated gasification combined-cycle (IGCC) facility. The plant includes three nominal 300 MW1 gasifiers, two predominantly dedicated to the IGCC portion of the plant for electric power production, and the third specifically dedicated to syngas production for the F-T plant. The only integration between the two plants is the transport of syngas (a maximum of 40% of the output from one gasifier) from the IGCC to the F-T plant for four hours per day. The F-T train is designed to process 140% of the output from a single gasifier, producing about 8,320 barrels per day (bbl/day) of liquids when the syngas from the IGCC is routed to the F-T plant.
• Stand-Alone Plant: Concept 2 consists of an independent, stand-alone CTL facility. The design includes two dedicated 300 MW gasifiers generating syngas for an F-T reactor system. Liquids production for Concept 2 is 9,609 bbl/day.
Both concepts produce distillate and naphtha liquid pools. With the addition of additives, the distillate can be converted to a saleable diesel fuel. The naphtha liquids can be shipped to a refinery for upgrading into gasoline or directly marketed as a chemical feedstock. The F-T reactor is slurry-based and employs an iron-based catalyst. Carbon capture and sequestration are not considered in the analysis.
Figure ES-1 provides a block flow diagram of the F-T plant. The analysis is based on Pittsburgh No. 8 bituminous coal and GE Energy’s oxygen-blown, entrained-flow, refractory-lined gasifier with continuous slag removal. Syngas leaving the gasifier is
1 This study is based on nominal 300 MWe gasifiers sized such that two gasifiers would provide sufficient syngas to yield a nominal 600 MWe output from an IGCC.

Final Report 3
cooled in an integrated radiant syngas cooler, producing high-pressure steam, and then directed to a water scrubber to remove particulates and trace components. For the co-located plant (Concept 1), the design incorporates transfer of up to 40% of the syngas exiting the water scrubber from the IGCC gasifiers to the F-T plant.
The resulting syngas stream is reheated and sent to a hydrolysis reactor, in which carbonyl sulfide (COS) and hydrogen cyanide (HCN) are converted into hydrogen sulfide (H2S). A mercury removal system removes mercury, arsenic and other materials from the syngas stream, while a Selexol unit preferentially removes H2S from the cool, particulate-free gas stream.
The clean syngas is then sent to the Fischer-Tropsch slurry reactors to produce marketable hydrocarbon liquids. Because syngas conversion is less than 100% per pass in the F-T reactors, the incoming syngas is mixed with recycle gas to maximize liquids production. The overhead vapor stream from the F-T reactors is cooled. The aqueous phase and condensed hydrocarbon liquids are separated. The liquid hydrocarbons are further cooled and sent to the hydrocarbon recovery section. The vapor stream goes to the carbon dioxide removal unit. The CO2 lean vapor is then compressed, dehydrated, and sent to the hydrocarbon recovery plant.
The carbon dioxide removed is vented to the atmosphere. Carbon dioxide capture and sequestration is possible but was not considered in this analysis.
In the F-T unit’s distillation column, the liquid product is separated into light components, naphtha, distillate, and wax fractions for further processing. The light components are compressed and used as fuel in an aeroderivative gas turbine to generate electric power. Unburned fuel remaining in the turbine exhaust is combusted in a downstream duct burner. The duct burned raises the temperature of the turbine exhaust gas to meet the superheat and reheat duties of the downstream steam cycle. Hot flue gas from the duct burner passes through a heat recovery steam generator to produce superheated high-pressure steam; the resulting steam is expanded in a steam turbine to generate additional electric power.
The naphtha fraction from the distillation column is sent to a catalytic hydrotreating unit for processing into naphtha products. The distillate and wax fractions are sent to catalytic hydrotreating units for processing into distillate. The combined distillate stream is blended with the required additives to produce a marketable diesel fuel. The naphtha and diesel liquids are shipped off-site either by rail tanker cars or barges.
The table within Figure ES-1 summarizes the main performance characteristics for the two concepts. The coal feedrate shown for Concept 1 is the design feedrate for a single gasifier; however, the F-T plant is designed to process 140% of the output from a single gasifier. Multiplying the coal feedrate by a factor of 1.4 gives a design feedrate of 3,683 TPD of coal generating 8,320 bbl/day of liquids. This equates to 2.3 barrels of liquid per ton of coal. For Concept 2, the design coal feedrate is 4,254 TPD yielding 9,609 bbl/day or 2.3 barrels of liquid per ton of coal.

Final Report 4
Figure ES-1 Block Flow Diagram for the F-T Plant
Parameter Concept 1 – Co-located Plant Concept 2 – Stand-Alone Plant Gasifier(s) coal feedrate, lb/hr 219,250 354,488 Net Plant Power, MWe 29.7 39.5
Naphtha
Production bbl/day 3,690 4,262 Diesel Production bbl/day 4,630 5,347

Final Report 5
FINANCIAL ANALYSIS
Capital cost estimates were developed for both concepts at the Total Plant Cost (TPC) level, which includes equipment, materials, labor, indirect construction costs, engineering and contingencies. The capital cost components were determined by estimating the cost of every significant piece of equipment and bulk quantity using actual cost data. Table ES-1 compares the TPC estimates for both cases, expressed in July 2006 dollars. The capital cost estimate for the stand-alone plant is 33% higher than that for the co-located plant.
Table ES-1 Capital Cost Estimates
Plant Component
Concept 1 Co-located Plant
TPC Cost ($million)
Concept 2 Stand-Alone Plant
TPC Cost ($million)
Coal & Slurry Preparation 41 60
Gasifier & Gas Clean-up 328 466
F-T Process 117 131
Power Block 41 50
Balance of Plant 71 91
TOTAL 598 798
Operations and maintenance cost values were determined on a first-year basis and then applied over the 30-year plant life. Quantities for major consumables such as fuel and chemicals were obtained from technology-specific heat and mass balance diagrams. Other consumables were estimated using reference data. Operation costs were calculated on the basis of the number of operators, and maintenance costs on the basis of requirements for each major plant section. First year operations and maintenance (O&M) estimates for Concept 1 are $75.7 million per year, $24.8 million for fixed O&M and $50.9 million for variable O&M. For Concept 2, first year O&M estimates are $115.2 million per year, $32.7 million for fixed O&M and $82.5 million for variable O&M. Variable O&M costs include the cost of coal and credits for sale of export power.
The capital and O&M cost estimates provide the required input for the financial analysis. Because Concept 1 is partially integrated with an IGCC facility, those portions of the IGCC gasification trains used to produce syngas for the F-T plant have to be factored into the analysis. Conversely, as a stand-alone facility, Concept 2 can be evaluated in its entirety.

Final Report 6
The financial analysis was performed using the NETL Power Systems Financial Model, Version 5.0.5. Assumptions include a 26% project contingency applied across the CTL plant, a 25% process contingency applied to the F-T liquids portion of the plant, and a CTL plant capacity factor of 85%. Additional assumptions include a 40% tax rate, a 42-month construction period, a 30-year plant life, a 55:45 debt-to-equity ratio for project financing, a 3% annual price escalation on all plant outputs, and a 2% annual escalation in the price of coal.
The financial analysis provides key metrics against which to gauge project viability, including return on equity investment, net present value, and parameter sensitivities. Table ES-2 summarizes the results of the financial analysis for both concepts.
Table ES-2 Financial Analysis Results
Parameter Concept 1 Co-located
Plant
Concept 2 Stand-Alone
Plant
Relative Difference, Concept 2 vs. Concept
1
Return on Investment, % 11.9 14.3 20%
Net Present Value, $MM, 12% discount rate -1.84 84.8
Payback Period, years 9 7 -22%
Concept 2 produces more favorable financial results relative to Concept 1. This is due both to the economy of scale advantage and higher capacity factor for Concept 2. At design capacity, Concept 2 produces 15% more product than Concept 1. The capacity factor for Concept 2 is 85% based on the output from two dedicated, nominal 300 MW gasifier trains. The capacity factor for Concept 1 is 65% based on output from one dedicated, nominal 300 MW gasifier train plus an intermittent supply of syngas (four hours per day) from the adjacent IGCC plant. Concept 2 is the better investment since it generates more products and more profit per unit of capital investment.
The financial analysis also included a sensitivity analysis to identify the parameters with the greatest impact on ROI, using a ±25% change in the input value as the basis for variable comparison. All model inputs were varied except for plant feed rate and liquid product output rate. The range of model input variables used in the sensitivity analysis is listed in Table ES-3. The “tornado diagram” shown in Figure ES-2, for Concept 2, ranks the variables from highest to lowest in terms of their relative impact on ROI. Plant capacity factor and capital cost (“EPC cost”) have a very strong impact on ROI. This is a common sensitivity found in gasification studies; reliable plant operation and carefully controlled plant costs are critically important to a successful project. For example, if plant capacity factor were to fall from its base case value of 85% to a value of 70%, the plant ROI for Concept 2 would decline from 14.3% to about 12%.

Final Report 7
Table ES-3 Range of Values Used in the Sensitivity Analysis
(+25%) (-25%)High Low
Model Inputs Base Range Range
Delivered Coal Price ($/ton) 54.77 68 41Electric Tariff ($/MWh) 35 44 26Naphtha ($/gallon) 1.30 1.63 0.98Diesel ($/gallon) 1.96 2.45 1.47Sulfur ($/ton) 10 12.5 7.5
EPC Cost ($MM) 617 771 463O&M Cost ($MM) 51.6 64.6 38.7Loan Interest Rate (%) 8 10 6Availability (%) 85 100 64Project Life (Yrs) 30 38 23Debt Financing (%) 55 69 41Tax Rate (%) 40 50 30
The estimated market values for the F-T products, naphtha and diesel, also strongly impact the financial results. Changes of 25% in each product value would impact ROI by two to four percentage points.

Final Report 8
Figure ES-2 Concept 2: Relative Sensitivities of Major Plant Inputs, +/-25%
Figure ES-3 illustrates the impact of crude oil prices on plant ROI. ROIs in excess of 10% are possible for the evaluated designs if the F-T products are valued at prices greater than $57/bbl to compete with crude oil. For comparison purposes, Figure ES-3 references two crude oil price scenarios: a base case tied to average crude prices of $61/bbl in 2005-2006, and an alternate case tied to an average $38/bbl price in 2000-2006. A change of this magnitude in the value of crude oil could potentially change the decision of whether or not a plant is built.
Change in ROI, +/- 25% Model Inputs
-5 -4 -3 -2 -1 0 1 2 3 4 5
Sulfur ($/MT)
Electric Tariff ($/MWh)
Project Life (Yrs)
Loan Interest Rate
O&M Cost (% of EPC)
Tax Rate
% Debt Financing
Delivered Coal Price ($/ton)
Naphtha ($/Gallon)
EPC Cost ($MM)
Capacity Factor
Diesel ($/Gallon)
Change in ROI (Percentage Points)

Final Report 9
Figure ES-3 Range of Values Used in the Sensitivity Analysis
-10
-5
0
5
10
15
20
25 35 45 55 65 75
WTI Crude Price ($/Barrel)
RO
I (%
)
Concept 2 Concept 1
Base Case(2005 -2006 Avg.)
Alternate Case(2000 -2006 Avg.)
Various policy initiatives at the state and federal level could support development of small-scale CTL plants. The financial analysis considered four alternatives, each evaluated independently: (1) state bonds to raise project funds, (2) a $6/barrel production tax credit for “unconventional” fuels, (3) federal loan guarantees, and (4) a 20% investment tax credit.
Table ES-4 presents the results of the analysis, showing the ROI and NPV (net present value) for each alternative at a 12% discount rate. The use of loan guarantees has the most positive impact on overall plant economics, increasing the ROI from 11.9% to 16.8% for Concept 1 and from 14.3% to 21.1% for Concept 2. Loan guarantees not only lower the interest rate used for debt financing, but also allow a greater portion of the project to be financed through debt. This change in the debt-to-equity ratio is responsible for the majority of the benefit. The results for the state bond case emphasize this point; simply reducing the interest rate on project debt increases the ROI by only about one percentage point.

Final Report 10
Table ES-4 Financial Impact of Policy Initiatives
Concept 1 – Co-located Plant Concept 2 – Stand-Alone Plant
Alternative ROI (%) NPV ($million) ROI (%) NPV ($million)
Base Case 11.9 -1.8 14.3 84.8
State Bonds 12.7 19.5 15.1 111.6
Production Tax Credits 14.1 57.7 16.8 175.0
Federal Loan Guarantees 16.8 75.8 21.1 186.8
Investment Tax Credits 13.9 45.1 16.5 145.7
CONCLUSIONS
The following conclusions should be viewed in the context of this study, i.e., a feasibility analysis of two process concepts. Further study is required to verify the accuracy of these conclusions.
• Both of the conceptual designs evaluated are technically feasible using equipment that has been demonstrated at commercial scale, although no commercial CTL plants are currently operating in the U.S.
• Both conceptual designs use high sulfur bituminous coal to produce distillate and naphtha liquid pools via indirect coal liquefaction (F-T process). With the addition of additives, the distillate can be converted to a saleable diesel fuel. The naphtha liquids can be shipped to a refinery for upgrading into gasoline or directly marketed as a chemical feedstock.
• Capital cost estimates were developed for both concepts at the Total Plant Cost (TPC) level, which includes equipment, materials, labor, indirect construction costs, engineering and contingencies. The TPC for Concepts 1 and 2 are $598M and $798M, respectively.
• First year operations and maintenance (O&M) estimates for Concept 1 are $75.7 million per year, $24.8 million for fixed O&M and $50.9 million for variable O&M. For Concept 2, first year O&M estimates are $115.2 million per year, $32.7 million for fixed O&M and $82.5 million for variable O&M. Variable O&M costs include the cost of coal and credits for sale of export power.
• Small-scale CTL plants using bituminous coal can be economical in specific applications. F-T plants producing 8,000 to 10,000 bbls/day can achieve ROIs greater than 12% under the base case set of financial assumptions.

Final Report 11
• F-T liquids value, plant capacity factor, and capital costs have the greatest impact on financial results. For capacity factors greater than 70%, ROIs greater than 12% can be achieved for both conceptual designs. A 25% jump in capital costs can reduce ROI by four percentage points.
• Project viability depends on future crude oil price scenarios. At crude oil prices greater than $57/bbl, both concepts achieve ROIs greater than 10%. Crude oil prices greater than $57/bbl are at the low end of price trends in 2005-2006, but above the average price over the 2000-2006 time frame.
• State and Federal policy actions can impact expected ROIs for small-scale F-T plants. Loan guarantees have the largest impact, increasing the ROI by 5 percentage points or more from the base case for both F-T plant concepts. Investment tax credits provide a two percentage point increase in ROI, while state bonds provide less than a one percentage point benefit. Production tax credits could increase the ROI by two to eight percentage points depending on their magnitude and how the incentives are credited.

Final Report 12
CONTRIBUTIONS AND ACKNOWLEDGEMENTS
This work was funded by the U.S. Department of Energy's National Energy Technology Laboratory (U.S. DOE-NETL). The NETL sponsor for this project was Daniel Cicero, Technology Manager for Hydrogen and SynGas in the Office of Coal and Power R&D. Michael Reed of the Office of Systems Analysis and Planning (OSAP) was the NETL Technical Monitor for this work. John Wimer, the Systems Team Leader for OSAP, worked closely with Michael. This NETL management team provided guidance and technical oversight for the study. The authors would like to acknowledge the significant role played by U.S. DOE/NETL in providing the programmatic guidance and review of this report.
TECHNICAL CONTRIBUTORS Daniel Cicero Technology Manager, SCC, NETL
Michael Reed Project Technical Monitor, OSAP, NETL
John Wimer Systems Team Leader, OSAP, NETL
Larry Van Bibber Subtask Manager, RDS/SAIC
John Haslbeck Design Leader, RDS/Parsons
Sheldon Kramer F-T Plant Analysis RDS/Nexant
Erik Shuster F-T Plant Analysis RDS/SAIC
Howard McIlvried F-T Plant Consultant RDS/SAIC
Scott Olson Financial Analysis Leader RDS/Nexant
Mike Rutkowski Design and Costing RDS/Parsons
William McMahon Cost Engineer, RDS/Econ Opportunities, Inc.
John Marano F-T Plant Consultant

Final Report 13
TABLE OF CONTENTS BACKGROUND ............................................................................................................................1 EXECUTIVE SUMMARY ...........................................................................................................2
OVERVIEW ................................................................................................................................2 PLANT DESIGN.........................................................................................................................2 FINANCIAL ANALYSIS ...........................................................................................................5 CONCLUSIONS .......................................................................................................................10
CONTRIBUTIONS AND ACKNOWLEDGEMENTS............................................................12 TECHNICAL CONTRIBUTORS .............................................................................................12
TABLE OF CONTENTS ............................................................................................................13 LIST OF FIGURES .....................................................................................................................14 LIST OF TABLES .......................................................................................................................15 ACRONYMS AND ABBREVIATION......................................................................................16 1. INTRODUCTION................................................................................................................20 2. PLANT DESIGN BASIS .....................................................................................................22
2.1 SITE DESCRIPTION ..........................................................................................................22 2.2 DESIGN FUEL CHARACTERISTICS ....................................................................................23 2.2 ENVIRONMENTAL REQUIREMENTS..................................................................................23
2.2.1 Carbon Dioxide..........................................................................................................25 2.2.2 Mercury......................................................................................................................25 2.2.3 Raw Water Usage ......................................................................................................25
2.3 BALANCE OF PLANT........................................................................................................26 3. PLANT ANALYSIS.............................................................................................................28
3.1 ASSUMPTIONS FOR ANALYSIS .........................................................................................28 3.2 ANALYSIS OF CONCEPT 1................................................................................................28
3.2.1 Concept 1 Process Description with Block/Process Diagrams.................................30 3.2.2 Heat and Mass Balances............................................................................................33 3.2.3 Performance Summary...............................................................................................36 3.2.4 F-T Output Summary .................................................................................................37
3.3 ANALYSIS OF CONCEPT 2................................................................................................37 3.3.1 Process Description with Block/Process Diagrams ..................................................38 3.3.2 Heat and Mass Balances............................................................................................40 3.3.3 Performance Summary...............................................................................................43 3.3.4 F-T Output summary..................................................................................................44
4. PLANT DESIGN..................................................................................................................45 4.1 CONCEPT 1: CTL PLANT CO-LOCATED WITH IGCC ......................................................45
4.1.1 Description.................................................................................................................45 4.1.2 Major Equipment List ................................................................................................53 4.1.3 Capital Costs..............................................................................................................53 4.1.4 Operating and Maintenance Costs ............................................................................54
4.2 CONCEPT 2 - NOMINAL 10,000 BBL/DAY INDEPENDENT COMMERCIAL F-T FACILITY ....57 4.2.1 Description.................................................................................................................57 4.2.2 Major Equipment List ................................................................................................57 4.2.3 Capital and Operating Costs .....................................................................................57
5. FINANCIAL ANALYSIS....................................................................................................60

Final Report 14
5.1 METHODOLOGY ..............................................................................................................61 5.2 RESULTS AND SENSITIVITIES...........................................................................................64
5.2.1 Performance and Cost Sensitivities ...........................................................................67 5.2.2 Policy Considerations................................................................................................72
6. CONCLUSIONS ..................................................................................................................76 6.1 RECOMMENDATIONS FOR FURTHER STUDY ....................................................................77
APPENDICES..............................................................................................................................78 APPENDIX A DETAILED EQUIPMENT LISTS FOR CONCEPT 1.....................................79 APPENDIX B DETAILED EQUIPMENT LISTS FOR CONCEPT 2 .....................................89 APPENDIX C FINANCIAL MODEL ENTRIES.....................................................................99
LIST OF FIGURES Figure ES-1 Block Flow Diagram for the F-T Plant...................................................................... 4 Figure ES-2 Concept 2: Relative Sensitivities of Major Plant Inputs, +/-25% ............................ 8 Figure ES-3 Range of Values Used in the Sensitivity Analysis .................................................... 9 Figure 3-1 Concept 1 Syngas Flow Diagram............................................................................... 29 Figure 3-2 Concept 1 - Process Block Flow Diagram ................................................................. 32 Figure 3-3 Concept 2 - Process Block Flow Diagram ................................................................. 39 Figure 4-1 Concept 1 Plant Process Diagram.............................................................................. 46 Figure 5-1 Key Plant Inputs/Outputs, West Virginia Co-located F-T Plant (Concept 1)........... 60 Figure 5-2 Key Plant Inputs/Outputs, West Virginia Stand Alone F-T Plant (Concept 2) ........ 61 Figure 5-3 Concept 2 - Relative Sensitivities of Major Plant Inputs, +/-25%............................. 68 Figure 5-4 PADD 2 Petroleum Product Values........................................................................... 69 Figure 5-5 Impact of Petroleum Prices on Plant ROI .................................................................. 70 Figure 5-6 Effect of Capacity Factor on Project ROI .................................................................. 71

Final Report 15
LIST OF TABLES Table ES-1 Capital Cost Estimates ................................................................................................ 5 Table ES-2 Financial Analysis Results.......................................................................................... 6 Table ES-3 Range of Values Used in the Sensitivity Analysis ..................................................... 7 Table ES-4 Financial Impact of Policy Initiatives....................................................................... 10 Table 2-1 Site Ambient Conditions ............................................................................................. 22 Table 2-2 Site Characteristics ...................................................................................................... 22 Table 2-3 Pittsburgh No. 8 Design Coal...................................................................................... 23 Table 2-4 BACT Guidelines ........................................................................................................ 24 Table 2-5 Standards of Performance for Electric Utility Steam Generating Units...................... 24 Table 2-6 Process and Cooling Water Properties ........................................................................ 27 Table 3-1 Concept 1 Process Stream Compositions .................................................................... 33 Table 3-2 Concept 1 Plant Performance Summary...................................................................... 36 Table 3-3 Naphtha Components .................................................................................................. 37 Table 3-4 Diesel Components...................................................................................................... 37 Table 3-5 Concept 2 Process Stream Compositions .................................................................... 40 Table 3-6 Concept 2 Plant Performance Summary...................................................................... 43 Table 3-7 Naphtha Components .................................................................................................. 44 Table 3-8 Diesel Components...................................................................................................... 44 Table 4-1 Concept 1 - Total Plant Cost Summary....................................................................... 55 Table 4-2 Concept 1 - Operating and Maintenance Expenses..................................................... 56 Table 4-3 Concept 2 - Total Plant Cost Summary....................................................................... 58 Table 4-4 Concept 2 - Operating and Maintenance Expenses..................................................... 59 Table 5-1 Financial Model Results .............................................................................................. 64 Table 5-2 Concept Performance Comparison.............................................................................. 66 Table 5-3 Total Plant Costs.......................................................................................................... 67 Table 5-4 Range of Values Used in the Sensitivity Analysis ...................................................... 68 Table 5-5 Financial Results, Concept 1 Without Swing.............................................................. 72 Table 5-6 Financial Impacts on Evaluated Policies..................................................................... 74
Final Report 16
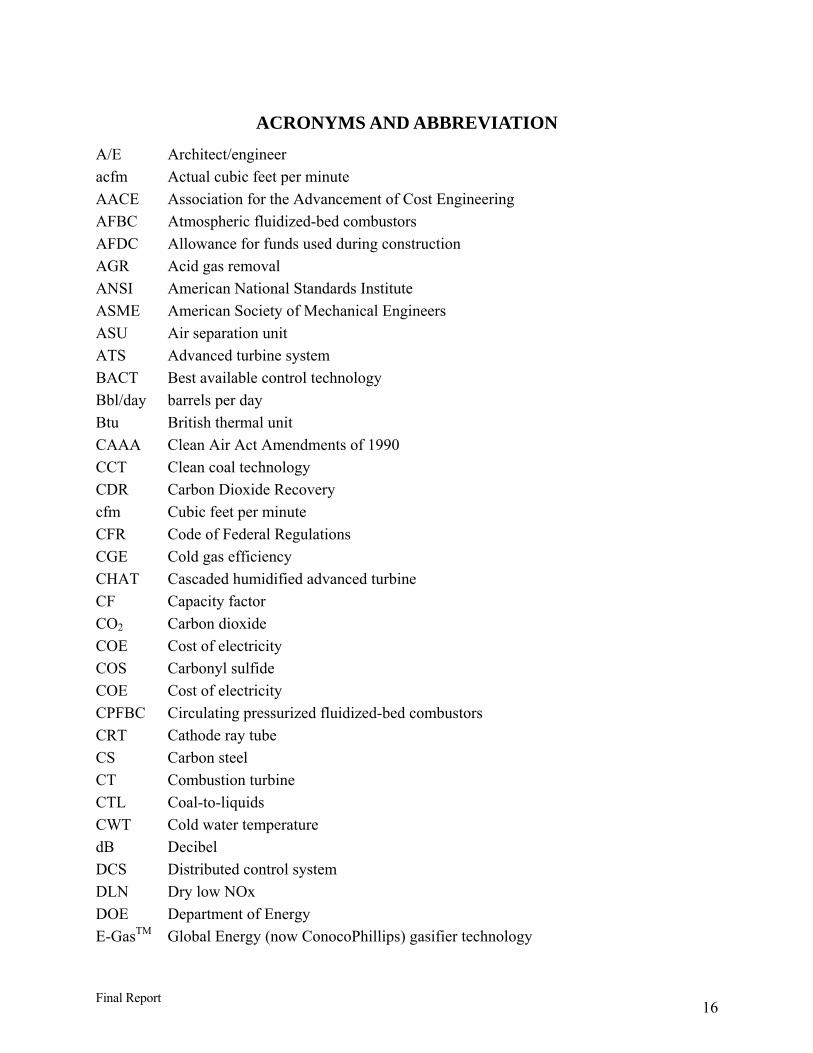
ACRONYMS AND ABBREVIATION
A/E Architect/engineer acfm Actual cubic feet per minute AACE Association for the Advancement of Cost Engineering AFBC Atmospheric fluidized-bed combustors AFDC Allowance for funds used during construction AGR Acid gas removal ANSI American National Standards Institute ASME American Society of Mechanical Engineers ASU Air separation unit ATS Advanced turbine system BACT Best available control technology Bbl/day barrels per day Btu British thermal unit CAAA Clean Air Act Amendments of 1990 CCT Clean coal technology CDR Carbon Dioxide Recovery cfm Cubic feet per minute CFR Code of Federal Regulations CGE Cold gas efficiency CHAT Cascaded humidified advanced turbine CF Capacity factor CO2 Carbon dioxide COE Cost of electricity COS Carbonyl sulfide COE Cost of electricity CPFBC Circulating pressurized fluidized-bed combustors CRT Cathode ray tube CS Carbon steel CT Combustion turbine CTL Coal-to-liquids CWT Cold water temperature dB Decibel DCS Distributed control system DLN Dry low NOx DOE Department of Energy E-GasTM Global Energy (now ConocoPhillips) gasifier technology

Final Report 17
EPA Environmental Protection Agency EPRI Electric Power Research Institute ESP Electrostatic precipitator ETA Effective thermal efficiency FBHE Fluidized-bed heat exchanger FD Forced draft FERC Federal Energy Regulatory Commission FGD Flue gas desulfurization FOAK First of a kind FRP Fiberglass-reinforced plastic F-T Fischer-Tropsch gpm Gallons per minute GJ Gigajoule GT Gas turbine h, hr Hour H2 Hydrogen H2SO4 Sulfuric acid HAP Hazardous air pollutant HCl Hydrochloric acid HDPE High density polyethylene HHV Higher heating value hp Horsepower HP High pressure HRSG Heat recovery steam generator HVAC Heating, ventilating, and air conditioning HWT Hot water temperature Hz Hertz in. H2O Inches water in. Hga Inches mercury (absolute pressure) in. W.C. Inches water column ID Induced draft IEEE Institute of Electrical and Electronics Engineers IGCC Integrated gasification combined cycle IOU Investor-owned utility IP Intermediate pressure IPP Independent power producer IRP Integrated resource planning ISO International Standards Organization

Final Report 18
ITM Ion transfer membrane kPa Kilopascal absolute kV Kilovolt kW Kilowatt kWe Kilowatts electric kWh Kilowatt-hour kWt Kilowatts thermal LAER Lowest achievable emission rate lb Pound LCOE Levelized cost of electricity LASH Limestone ash LEBS Low emissions boiler systems LHV Lower heating value LP Low pressure MC Mitigation cost MAF Moisture and Ash Free MCR Maximum coal burning rate MDEA Methyldiethanolamine MEA Monoethanolamine MHz Megahertz MMBtu Million British thermal units (also shown as 106 Btu) MMBtuh Million British thermal units (also shown as 106 Btu) per hour MPa Megapascals absolute MWe Megawatts electric MWh Megawatts-hour MWt Megawatts thermal NETL National Energy Technology Laboratory N/A Not applicable NAAQS National Ambient Air Quality Standards NGCC Natural gas combined cycle NM3 Normal Cubic meter NOx Oxides of nitrogen NSPS New Source Performance Standards O&M Operations and maintenance OD Outside diameter OP/VWO Over pressure/valve wide open OTR Ozone transport region PA Primary air

Final Report 19
PC Pulverized coal pph Pounds per hour ppmvd Parts per million volume, dry PSA Pressure Swing Adsorption psia Pounds per square inch absolute psid Pounds per square inch differential psig Pounds per square inch gage QF Qualifying facility RDS Research Development Solutions, LLC RPD Restricted pipe discharge rpm Revolutions per minute SC Supercritical SCFD Standard cubic feet per day scfm Standard cubic feet per minute scmh Standard cubic meter per hour SCOT Shell Claus Off-gas Treating SCR Selective catalytic reduction SIP State implementation plan SNCR Selective non-catalytic reduction SO2 Sulfur dioxide SOFC Solid oxide fuel cell SS Stainless steel TAG Technical Assessment Guide ST Steam turbine TCR Total capital requirement TGTU Tail gas treating unit TPC Total plant capital (cost) THGD Transport hot gas desulfurizer TPC Total plant cost tpd Tons per day tph Tons per hour TPI Total plant investment V-L Vapor Liquid portion of stream (excluding solids) WB Wet bulb wt% Weight percent

Final Report 20
1. INTRODUCTION The rise in petroleum and natural gas prices over the last few years, coupled with increasing U.S. dependence on foreign suppliers of liquid fuels, has sparked strong national interest in alternative sources of energy. Various supply-side and demand-side options have been proposed and discussed to reduce oil imports and apply downward pressure on prices, including higher vehicle fuel efficiency, the use of renewable fuels such as ethanol, and greater access to domestic fuel resources offshore and on Federal lands.
The production of liquid fuels from coal – America’s most abundant fuel resource – provides another option. Liquefaction technologies that can produce liquid fuels from coal have existed for more than 80 years. The most widely used coal liquefaction technology employs an indirect process in which the coal is gasified into a synthesis gas that is then converted into liquid fuels using the Fischer-Tropsch (F-T) process. Commercial coal-to-liquid (CTL) plants are in operation in South Africa, the largest of which produces 124,000 barrels per day (bbl/day) of light olefins and gasoline from coal. Commercial CTL plants have not been built in the United States, primarily because the price of coal-derived liquid fuels has been unable to compete with the price of fuels derived from crude oil.
Many recent analyses have examined CTL in terms of large production facilities, yielding 50,000 to 100,000 barrels per day of liquid fuels. In a world market characterized by rising oil prices, smaller CTL facilities may become viable. This report summarizes the results of a technical and economic assessment of small-scale CTL plants in West Virginia.
Two design concepts are analyzed in this report, each producing less than 10,000 bbl/day. In Concept 1, the CTL plant is adjacent to a nominal 600 MW integrated gasification combined-cycle (IGCC) plant equipped with two 300 MW trains2. The CTL plant is equipped with one 300 MW gasifier. A portion of the syngas from the IGCC gasifiers (maximum of 40% of the output from one gasifier) is combined with the syngas from the CTL gasifier and then directed to F-T reactors for liquid fuels production. The CTL plant produces 8,320 bbl/day of a naphtha and distillate pool, which is further upgraded to commercial-grade end products, primarily diesel fuel. The CTL plant also generates electric power, primarily for internal use, but also for export to the grid.
In Concept 2, the CTL plant is a completely independent facility sized to meet the minimum production requirements of a commercially viable plant. The design consists of two 300 MW gasifier trains, producing syngas that is converted into 9,609 bbl/day of liquid fuels. Other than being a larger, stand-alone facility, the plant design for Concept 2 is identical to that for Concept 1.
2 This study is based on nominal 300 MWe gasifiers sized such that two gasifiers would provide sufficient syngas to yield a nominal 600 MWe output from an IGCC plant.

Final Report 21
This report details the technical and economic assessment of a small-scale CTL plant, and includes conceptual design assumptions, equipment descriptions and lists, process flow diagrams, heat and material balances, and energy and performance summaries. Also included are estimates of capital and operating and maintenance costs and a financial analysis of the commercial viability of the concepts under various sets of economic assumptions.

Final Report 22
2. PLANT DESIGN BASIS
2.1 Site Description
The generic characteristics of the plant site in West Virginia are presented in Table 2-1 and Table 2-2.
Table 2-1 Site Ambient Conditions
Elevation, ft 0 Barometric Pressure, psia 14.696
Design Ambient Temperature, Dry Bulb, °F 59
Design Ambient Temperature, Wet Bulb, °F 51.5
Design Ambient Relative Humidity, % 60
Table 2-2 Site Characteristics
Location West Virginia
Topography Level
Size, acres 300
Transportation Road, Rail, Barge, Pipeline
Ash/Slag Disposal Off Site
Water River
CO2 Storage Not considered
The following design parameters are considered site-specific, and are not quantified in this study. Allowances for normal conditions and construction requirements, however, will be included in the cost estimates.
• Flood plain considerations
• Existing soil/site conditions
• Water discharges and reuse
• Rainfall/snowfall criteria
• Seismic design
• Fire protection
• Local code height requirements
• Noise regulations – Impact on site and surrounding area

Final Report 23
2.2 Design Fuel Characteristics
The design coal for this study is Pittsburgh No. 8 coal. The coal characteristics are presented in Table 2-3.
Table 2-3 Pittsburgh No. 8 Design Coal
Rank Medium Volatile Bituminous
Seam Pittsburgh #8
Source Indiana Co., PA
Proximate Analysis (weight %)
As Rec’d Dry
Moisture 6.0 0.0
Ash 9.9 10.6
Volatile Matter 35.9 38.2
Fixed Carbon 48.2 51.2
HHV, Btu/lb 12,450 13,244
Ultimate Analysis (weight %)
As Rec’d Dry
Carbon 69.36 73.79
Hydrogen 5.18 4.81
Nitrogen 1.22 1.29
Sulfur 2.89 3.07
Ash 9.94 10.57
Oxygen 11.41 6.47
Total 100.00 100.00
2.2 Environmental Requirements
The environmental control equipment used in the conceptual design conforms to Best Available Control Technology (BACT) guidelines. Specific emission limits and the corresponding environmental control equipment are summarized in Table 2-4.

Final Report 24
Table 2-4 BACT Guidelines
Gasification Technologies
Pollutant Control Technology Limit
Sulfur Selexol/Econamine Plus/Sulfinol-M + Claus Plant 99+% or ≤ 0.050 lb/106Btu
NOx Low-NOx Burners and N2 Dilution 15 ppmvd (@ 15% O2)
PM Cyclone/Barrier Filter/Wet Scrubber/AGR Absorber 0.006 lb/106Btu
Hg Activated Carbon Bed 95% removal
The current regulations governing new, reconstructed, or modified fossil-fuel fired power plants are the New Source Performance Standards (NSPS) published in February 2006 and shown in Table 2-5. These NSPS standards supersede the previous NSPS standards established in 1978. The new standards apply to units with the capacity to generate greater than 73 MW of power by burning fossil fuels, as well as cogeneration units that sell more than 25 MW of power and more than one-third of their potential output capacity to any utility power distribution system. The rule also applies to combined-cycle plants, IGCC plants, and combined heat and power combustion turbines that burn 75 percent or more synthetic-coal gas.
Table 2-5 Standards of Performance for Electric Utility Steam Generating Units Built, Reconstructed, or Modified After February 28, 2005
New Units Reconstructed Units Modified Units
Emission Limit
% Reduction
Emission Limit
(lb/106Btu)
% Reduction
Emission Limit
(lb/106Btu)
% Reduction
PM 0.015 lb/106Btu 99.9 0.015 99.9 0.015 99.8
SO2 1.4
lb/MWh 95 0.15 95 0.15 90
NOx 1.0 lb/MWh N/A 0.11 N/A 0.15 N/A
The BACT technologies assumed for this study meet the emission requirements of the 2006 NSPS. It is possible; however, that state and local requirements could supersede NSPS and impose even more stringent requirements.

Final Report 25
2.2.1 Carbon Dioxide
Carbon dioxide emissions from the plant are vented to the atmosphere. The design criteria do not include systems for carbon capture/sequestration.
2.2.2 Mercury
The mercury content of medium volatile bituminous coals (Pittsburgh #8) averages 99 ppb (dry basis).
The plant design assumes mercury capture of 95% via activated carbon, based on data from the Eastman Chemical Company’s gasification facility in Kingsport, Tennessee. EPA has determined that some mercury is captured in systems conventionally used to capture PM, sulfur, and nitrogen oxides. Oxidized mercury is captured in fabric filters and electrostatic precipitators, wet and dry flue gas desulfurization (FGD) systems, and selective catalytic reduction and selective non-catalytic reduction (SCR/SNCR) systems. The co-benefit of mercury capture in these systems is particularly high for bituminous coals (such as Pittsburgh No. 8 used in this study), ranging from 84 to 98%. The analysis estimates co-benefit mercury capture in the F-T plant and factors the result into the design of the activated carbon mercury control system.
2.2.3 Raw Water Usage
Raw water makeup is provided by the local river. The plant is equipped with an evaporative cooling tower, and all process blowdown streams are treated and recycled to the cooling tower.

Final Report 26
2.3 Balance of Plant
Assumed balance-of-plant requirements are as follows:
Cooling system Recirculating, evaporative cooling tower or hybrid air/water cooling tower.
Fuel and Other Storage Coal 30 days Slag 30 days Sulfur 30 days
Plant Distribution Voltage Motors below 1 hp 110/220 volt Motors 250 hp and below 480 volt Motors above 250 hp 4,160 volt Motors above 5,000 hp 13,800 volt Steam and gas turbine generators 24,000 volt Grid interconnection voltage 345 kV
Water and Waste Water Makeup water Process water is available from the river or from existing
or new wells at a flow rate of 1,500 gpm. The quality of the process water is shown in Reference 3.
Feedwater Treatment of the water supply is included and will produce boiler feed quality water for the IGCC plant.
Process wastewater Water associated with gasification activity and storm water that contacts equipment surfaces will be collected and treated for discharge through a permitted discharge permit.
Sanitary waste disposal Design will include a packaged domestic sewage treatment plant with effluent discharged to the industrial wastewater treatment system. Sludge will be hauled off site.
Water discharge Most of the wastewater is to be recycled for plant needs. Blowdown will be treated for chloride and metals, and recycled to the cooling tower.
Solid waste Gasifier slag is assumed to be a solid waste that is classified as non-hazardous. An offsite waste disposal site is assumed to have the capacity to accept waste generated throughout the life of the facility. Solid waste sent to disposal is at an assumed nominal fee per ton, even if the waste is hauled back to the mine. Solid waste that can be recycled or reused is assumed to have a zero cost

Final Report 27
Process water and cooling water come from two different treatment facilities. Their composition and physical properties are shown in Table 2-6.
Table 2-6 Process and Cooling Water Properties
Property Process Water Cooling Water Total Dissolved Solids (TDS) 200 μS/cm 1250 μS/cm Total Suspended Solids (TSS) Not Available Not Available Hardness 100 mg/l as CaCO3 75 mg/l as CaCO3 Alkalinity 100 ppm 350 ppm Sulfate 4 ppm 50 ppm Chloride 10 ppm 200 ppm Silica 30 mg/l 30 mg/l Aluminum Not Available Not Available Iron 0.25 mg/l 0.25 mg/l Calcium 70 mg/l 25 mg/l Magnesium 25 mg/l 45 mg/l Phosphate 0.4 mg/l 6.0 mg/l (ortho) Ammonia <1 mg/l 19 mg/l Chlorine <0.1 mg/l <0.1 mg/l pH 8.0 8.0

Final Report 28
3. PLANT ANALYSIS
Two conceptual process designs were developed for small-scale gasification-based F-T liquid fuel production facilities. Concept 1 applies to an F-T plant co-located with an IGCC plant. Concept 2 applies to a stand-alone gasification-based F-T plant.
3.1 Assumptions for Analysis
Both conceptual designs are based on a location in West Virginia, using Pittsburgh No. 8 as the design coal.
The design and operation of the gasifier system is based on models developed using public domain information. The IGCC power system consists of a two-train GE Energy Radiant Quench slurry feed gasifier configuration with two aeroderivative combustion turbines. A Selexol acid gas removal system with a Claus sulfur recovery system is used for sulfur removal and recovery. The design and operation of the slurry-bed, iron-based catalyst F-T reactor system is also based on a model developed from public information. The F-T model used was originally developed by Bechtel/Amoco in 1993.3
The plant does not include carbon capture and sequestration, but does include all pollution control technologies needed to meet existing Federal Regulations.
3.2 Analysis of Concept 1
Concept 1 consists of a coal-to-liquids (CTL) facility equipped with a single, dedicated 300 MW gasifier co-located with an existing nominal 600 MW IGCC facility that uses two gasifiers for full-load operation. Figure 3-1 illustrates the syngas flow scheme for Concept 1.
3 Baseline Design/Economics for Advanced Fischer-Tropsch Technology, DOE Contract No. DE-AC22-91PC90027, Topical Report Volume 1, Process Design – Illinois No. 6 Coal Case with Conventional Refining, October, 1994.

Final Report 29
Figure 3-1 Concept 1 Syngas Flow Diagram
Gasifier 1300MWe size
(100%)
600 MWe Base* IGCC Plant(*If no syngas streams were sent to the F-T Plant)
LT Gas Cooling (1)
Sized for 300MWe (100%)
Gas Cleaning
(1)Sized for
300MWe (100%)
Power Production
(1)Sized for
300MWe (100%)
Gasifier 2300MWe size
(100%)
Gasifier 3300MWe size
(100%)
Integrated F-T Plant140% of One Gasifier
LT GasCooling (3)Sized for 140%
Gas Cleaning (3)Sized for 140%
F-T Plant Power Production
20%
140%100%
Radiant Cooling (1)
Sized for 300MWe (100%)
Radiant Cooling (2)
Sized for 300MWe (100%)
Radiant Cooling (3)
Sized for 300MWe (100%)
80%100%
100%
Less Than 300 MW*
Coal Slurry & Oxygen
Coal Slurry & Oxygen
Coal Slurry & Oxygen
Water Scrubber (1)
Sized for 300MWe (100%)
LT Gas Cooling (2)
Sized for 300MWe (100%)
Gas Cleaning
(2)Sized for
300MWe (100%)
Power Production
(2)Sized for
300MWe (100%)
80%Less Than 300 MW*
Water Scrubber (2)
Sized for 300MWe (100%)
Water Scrubber (3)
Sized for 300MWe (100%)
20%
The following parameters and assumptions are the basis for Concept 1:
• The CTL facility is sized to accept 140% of the raw, untreated syngas from a single gasifier. Syngas from the IGCC plant is pooled and then distributed to the power trains or the CTL train at the discretion of the plant operators.
• There are no interactions between the IGCC plant and the CTL plant except for the sharing of syngas.
• The F-T system utilizes recycle and other reasonable unit operations to maximize liquid fuels production.
• The F-T system includes sufficient upgrading capabilities to produce commercial-grade diesel fuel and to produce other liquid products or chemical feedstocks that can be shipped to a conventional oil refinery or chemical plant.
• The system does not include carbon capture/sequestration technology.
• The CTL plant will be self-sufficient in terms of electric power requirements; however, extra power may be exported to the grid.

Final Report 30
3.2.1 Concept 1 Process Description with Block/Process Diagrams
The Concept 1 block flow diagram is shown in Figure 3-2. The objective of the process design is to maximize liquids production by recycling the F-T reactor off-gases after CO2 removal.
The single, dedicated gasifier in the CTL plant is fueled with Pittsburgh No. 8 coal. The coal is pulverized and mixed with water to make a slurry. The GE Energy coal gasification technology features an oxygen-blown, entrained flow, refractory-lined gasifier with continuous slag removal. The coal slurry reacts with oxygen in the gasifier at about 1,900 ºF. A dedicated air separation unit supplies 95% purity oxygen to the gasifiers and pure nitrogen to the combustion turbine.
High-temperature syngas leaving the gasifier is cooled in the integrated radiant syngas cooler, producing high-pressure steam. The raw syngas is quenched and further cooled in a water scrubber to remove particulates and trace components. At this point, up to 40% of the syngas from the existing 600 MW IGCC plant can be combined with the syngas generated in the F-T plant for further processing.
The combined syngas streams are reheated and pass through a COS hydrolysis reactor in which the COS and HCN are hydrolyzed to H2S, followed by additional cooling, where water and nearly all of the ammonia are removed.
The syngas then passes through a mercury removal system, based on technology used at Eastman Chemical Company’s gasification facility in Kingsport, Tennessee. Dual beds of sulfur-impregnated carbon provide a 20-second superficial gas residence time to achieve greater than 95% mercury removal. Other volatile heavy metals such as arsenic are also removed.
H2S is preferentially removed from the cool, particulate-free gas stream by a Selexol process, producing a concentrated H2S product stream. The stripped H2S stream goes to a Claus plant to produce elemental sulfur. Clean syngas leaving the Selexol unit contains less than 1 ppm total sulfur. The sulfur level is further reduced to less than 1 ppb using a zinc oxide sulfur polishing bed. This low-sulfur syngas represents the feed for the F-T process, which produces an essentially sulfur-free diesel fuel. Since the operating pressure of the gasifiers is greater than that of the F-T process, a power recovery expander is used to reduce the syngas pressure and recover 7.1 MW power.
Clean syngas from the gasification area is sent to the F-T slurry reactors to produce the hydrocarbon products. Because syngas conversion per pass is less than 100%, the entering syngas is mixed with recycle before entering the F-T reactors. Cooling tubes are located within the reactor to cool the reactor and produce steam that is ultimately used to generate auxiliary power. Two reactor effluent streams are produced. The liquid reactor effluent stream is cooled and then flashed. The liquid is sent to the distillation column.
The overhead vapor stream from the F-T reactors is cooled. The aqueous phase and condensed hydrocarbon liquids are separated. The liquid hydrocarbons are further cooled and sent to the hydrocarbon recovery section. The vapor stream goes to the carbon

Final Report 31
dioxide removal unit, where CO2 is captured and subsequently vented to the atmosphere. The CO2 lean vapor is then compressed, dehydrated, and sent to the hydrocarbon recovery plant. The hydrogen recovery plant produces high-purity hydrogen for the product upgrading units. Hydrogen is removed by a pressure swing absorption unit. The vapor then goes to an autothermal reformer, where it is mixed with steam and oxygen to minimize the buildup of light ends in the recycle loop by converting them to syngas.
In the distillation column, the F-T liquid product is separated into light components, naphtha, distillate, and wax fractions for further processing. All the light-end components (C4s and lighter) from the F-T process provide fuel gas to the combustion turbine, although the butanes and propane (LPG) could be recovered and sold if a market for these materials were available. The naphtha fraction is catalytically hydrotreated to produce naphtha, the distillate fraction is catalytically hydrotreated to produce diesel, and the wax fraction is catalytically hydrocracked to produce diesel and naphtha cuts.
The F-T process converts the clean syngas to 8,320 barrels per day of total liquids, 3,690 barrels per day of naphtha and 4,630 barrels per day of distillate. The distillate is blended with the required additives to produce a saleable grade diesel fuel. The liquids are shipped off-site either by rail or barge.
The off-gas from the F-T process is compressed and used as fuel for the aeroderivative combustion turbine, a unit that produces 27 MWe. A duct burner is placed after the gas turbine to consume any fuel gas not combusted in the gas turbine. The burner raises the temperature of the gas to meet the input design parameters of the downstream steam cycle. Hot flue gas from the gas turbine passes through a HRSG in which superheated high-pressure steam is produced; the resulting steam produces 54 MWe from a steam turbine.
The net plant output power, after plant auxiliary power requirements are deducted, is nominally 29.7 MWe. The overall plant thermal efficiency (thermal value of FT product and power produced as a percentage of thermal input in coal) is 50.2% on an HHV basis.

Final Report 32
Figure 3-2 Concept 1 - Process Block Flow Diagram
GE Gasifier-Based FT Liquid Production Plant

Final Report 33
3.2.2 Heat and Mass Balances
Table 3-1 shows the temperature, pressure and flow of the process streams in the gasification and F-T areas of the Concept 1 facility at the design feed rate, including stream compositions and state points.
Table 3-1 Concept 1 Process Stream Compositions
1A 2 3 4 5 6 7 8 9 10V-L Mole Fraction Slurry Air Air Oxygen Slag Oxygen Syngas Syngas Sulfur Syngas
Ar 0 0.0094 0.0094 0.0320 0 0.0320 0.0089 0.0096 0 0.0100CH4 0 0 0 0 0 0 0.0006 0.0007 0 0.0007CO 0 0 0 0 0 0 0.4300 0.4604 0 0.4799CO2 0 0.0003 0.0003 0 0 0 0.1314 0.1415 0 0.1115COS 0 0 0 0 0 0 0.0003 0 0 0H2 0 0 0 0 0 0 0.3433 0.3688 0 0.3871H2O 1.0 0.0104 0.0104 0 0 0 0.0673 0.0013 0 0.0009H2S 0 0 0 0 0 0 0.0083 0.0083 0 0N2 0 0.7722 0.7722 0.0180 0 0.0180 0.0088 0.0094 0 0.0099NH3 0 0 0 0 0 0 0.0010 0.0002 0 0O2 0 0.2077 0.2077 0.9500 0 0.9500 0 0 0 0SO2 0 0 0 0 0 0 0 0 0 0
Total 1.0 1.0 1.0 1.0 0.0 1.0 1.0 1.0 0.0 1.0
V-L Flowrate (lbmol/hr) 5,730 26,185 21,301 6,192 0 145 31,007 28,861 0 27,172V-L Flowrate (lb/hr) 103,228 755,536 614,617 199,252 0 4,601 640,697 601,161 0 538,912Solids Flowrate (lb/hr) 206,104 0 0 0 23,171 0 0 0 8,840 0
Temperature (°F) 60 59 59 207 300 90 322 102 355 112Pressure (psia) 1,050 14 14 1,025 798 375 798 720 25 719Density (lb/ft3) --- 0.075 0.075 4.606 --- 2.062 1.966 2.487 --- 2.324Molecular Weight --- 28.85 28.85 32.18 --- 31.80 20.66 20.83 --- 19.83
A - Solids flowrate includes dry coal; V-L flowrate includes slurry water and water from coal
Note: The mass fraction of Argon in stream 10 is added to the mass fraction of Nitrogen before entering the FT- Reactor.This is done because the F-T reactor model cannot handle Argon.

Final Report 34
Table 3-1 Concept 1 Process Stream Compositions (Continued)
11 12 13 14 15 16 17 18 19V-L Mole Fraction Water CO2 F-T Liquids Recycle Steam Recycle H2 H2 H2
H2 0 0 0.0077 0.58499 0 0.51348 1.0 1.0 1.0 N2 0 0 0.0058 0.29980 0 0.22729 0 0 0 O2 0 0 0 0 0 0 0 0 0 H2S 0 0 0 0 0 0.000137 0 0 0 CO 0 0 0.001151 0.06166 0 0.07639 0 0 0 CO2 0 1.0 0.050741 0.00392 0 0.01465 0 0 0 H2O 1.0 0 0.056187 0 1.0 0.16085 0 0 0 NH3 0 0 0 0 0 0 0 0 0 COS 0 0 0 0 0 0 0 0 0 CH4 0 0 0.001032 0.03527 0 0.00720 0 0 0 C2H4 0 0 0.000480 0.01066 0 0 0 0 0 C2H6 0 0 0.000139 0.00254 0 0 0 0 0 C3H6 0 0 0.000719 0.00080 0 0 0 0 0 C3H8 0 0 0.000135 0.00011 0 0 0 0 0 IC4H8 0 0 0.000042 0 0 0 0 0 0 NC4H8 0 0 0.000815 0.00005 0 0 0 0 0 IC4H10 0 0 0.000010 0 0 0 0 0 0 NC4H10 0 0 0.000219 0.00001 0 0 0 0 0 C5H10 0 0 0.000921 0 0 0 0 0 0 NC5H12 0 0 0.000325 0 0 0 0 0 0 IC5H12 0 0 0.000033 0 0 0 0 0 0 C6H12 0 0 0.001248 0 0 0 0 0 0 NC6H14 0 0 0.000402 0 0 0 0 0 0 IC6H14 0 0 0.000041 0 0 0 0 0 0 C7H14 0 0 0.001431 0 0 0 0 0 0 C7H16 0 0 0.000653 0 0 0 0 0 0 C8H16 0 0 0.001712 0 0 0 0 0 0 C8H18 0 0 0.000784 0 0 0 0 0 0 C9H18 0 0 0.002089 0 0 0 0 0 0 C9H20 0 0 0.000945 0 0 0 0 0 0C10 - C20 Olefins 0 0 0.059154 0 0 0 0 0 0C10 - C20 Paraffins 0 0 0.026271 0 0 0 0 0 0 C7-300HC 0 0 0 0 0 0 0 0 0 3-350HC 0 0 0 0 0 0 0 0 0 350-5HC 0 0 0 0 0 0 0 0 0 500+HC 0 0 0 0 0 0 0 0 0 C7-300HT 0 0 0 0 0 0 0 0 0 3-350HT 0 0 0 0 0 0 0 0 0 350-5HT 0 0 0 0 0 0 0 0 0 500+HT 0 0 0 0 0 0 0 0 0 OXVAP 0 0 0 0 0 0 0 0 0 OXHC 0 0 0.002285 0 0 0 0 0 0 OXH2O 0 0 0.000725 0 0 0 0 0 0C21 - C29 Paraffin/Olefin Mix 0 0 0.161721 0 0 0 0 0 0C30+Waxes 0 0 0.613866 0 0 0 0 0 0
Total 1.0000 1.0000 1.0000 1.0000 1.0000 1.0000 1.0000 1.0000 1.0000
V-L Flowrate (lbmol/hr) 452 8,688 96 4,713 1,063 6,248 138 68 359V-L Flowrate (lb/hr) 8,146 382,339 51,776 58,753 19,147 82,501 278 138 724Solids Flowrate (lb/hr) 0 0 0 0 0 0 0 0 0
Temperature (°F) 240 100 488 1,706 650 1,780 100 100 100Pressure (psia) 325 265 304 375 615 355 600 600 120Stream Density (lb/ft3) 56.237 2.138 42.391 0.200 1.022 0.194 0.197 0.197 0.040Liquid Vol @ 60°F (ft3/hr) --- --- --- --- --- --- --- --- ---Molecular Weight 18.02 44.01 537.66 12.47 18.02 13.20 2.02 2.02 2.02

Final Report 35
Table 3-1 Concept 1 Process Stream Compositions (Continued)
20 21 22 23 24 25 26 27V-L Mole Fraction F-T Liquids F-T Liquids F-T Liquids Naphtha Distillate FG FG FG
H2 0 0 0 0 0 0.389444 0.389444 0.389444 N2 0 0 0 0 0 0.354406 0.354406 0.354406 O2 0 0 0 0 0 0 0 0 H2S 0 0 0 0 0 0.000211 0.000211 0.000211 CO 0 0 0 0 0 0.072891 0.072891 0.072891 CO2 0 0 0 0 0 0.007290 0.007290 0.007290 H2O 0 0 0 0 0 0.001037 0.001037 0.001037 NH3 0 0 0 0 0 0 0 0 COS 0 0 0 0 0 0 0 0 CH4 0 0 0 0 0 0.045343 0.045343 0.045343 C2H4 0 0 0 0 0 0.012702 0.012702 0.012702 C2H6 0 0 0 0 0 0.008913 0.008913 0.008913 C3H6 0 0 0 0 0 0.033052 0.033052 0.033052 C3H8 0 0 0 0 0 0.020058 0.020058 0.020058 IC4H8 0 0 0 0 0 0.001362 0.001362 0.001362 NC4H8 0 0 0 0 0 0.025880 0.025880 0.025880 IC4H10 0 0 0 0 0 0.010571 0.010571 0.010571 NC4H10 0 0 0 0 0 0.016612 0.016612 0.016612 C5H10 0.000571 0 0 0.114 0 0.000022 0.000022 0.000022 NC5H12 0.042554 0 0 0.083495 0 0.000007 0.000007 0.000007 IC5H12 0 0 0 0.056398 0 0.000001 0.000001 0.000001 C6H12 0.183910 0 0 0 0 0.000018 0.000018 0.000018 NC6H14 0.055171 0 0 0.156872 0 0.000006 0.000006 0.000006 IC6H14 0.006131 0 0 0.081914 0 0 0 0 C7H14 0.142292 0 0 0 0 0.000015 0.000015 0.000015 C7H16 0.060981 0 0 0 0 0.000007 0.000007 0.000007 C8H16 0.118068 0 0 0 0 0.000013 0.000013 0.000013 C8H18 0.050600 0 0 0 0 0.000006 0.000006 0.000006 C9H18 0.097952 0 0 0 0 0.000012 0.000012 0.000012 C9H20 0.041979 0 0 0 0 0.000005 0.000005 0.000005C10 - C20 Olefins 0.081256 0.584636 0.025897 0 0 0.000047 0.000047 0.000047C10 - C20 Paraffins 0.034823 0.250559 0.011099 0 0 0.000020 0.000020 0.000020 C7-300HC 0 0 0 0.1735 0 0 0 0 3-350HC 0 0 0 0.0457 0 0 0 0 350-5HC 0 0 0 0 0.2641 0 0 0 500+HC 0 0 0 0 0.3860 0 0 0 C7-300HT 0 0 0 0.2333 0 0 0 0 3-350HT 0 0 0 0.0544 0 0 0 0 350-5HT 0 0 0 0 0.2407 0 0 0 500+HT 0 0 0 0 0.1092 0 0 0 OXVAP 0 0 0 0 0 0 0 0 OXHC 0 0 0 0 0 0.000020 0.000020 0.000020 OXH2O 0 0 0 0 0 0.000014 0.000014 0.000014C21 - C29 Paraffin/Olefin Mix 0 0 0.27264 0 0 0.000005 0.000005 0.000005C30+Waxes 0 0 0.69036 0 0 0 0 0
Total 1.0000 1.0000 1.0000 1.0000 1.0000 1.0000 1.0000 1.0000
V-L Flowrate (lbmol/hr) 180 99 87 347 232 1,874 1,503 1,150V-L Flowrate (lb/hr) 18,746 17,454 53,663 36,943 52,466 37,225 29,859 22,845Solids Flowrate (lb/hr) 0 0 0 0 0 0 0 1
Temperature (°F) 100 100 100 128 236 90 90 385Pressure (psia) 50 50 50 40 20 20 20 460Stream Density (lb/ft3) 43.055 46.129 51.397 40.769 43.599 0.067 0.067 1.000Liquid Vol @ 60°F (ft3/hr) 421.74 361.13 1,029.76 863.33 1,083.14 --- --- ---Molecular Weight 104.30 176.49 617.86 106.52 226.04 19.86 19.86 19.86

Final Report 36
3.2.3 Performance Summary
Table 3-2 summarizes the plant power output, including auxiliary load, for the Concept 1 facility at the design capacity.
Table 3-2 Concept 1 Plant Performance Summary
Plant Output Gas Turbine Power 27,040 kWe Steam Turbine Power 54,455 kWe Syngas Power Recovery Turbine Net Power 7,098 kWe Total 88,593 kWe
F-T Liquids Production F-T Liquids Production 8,320 bbl/day
Auxiliary Load Coal Handling 40 kWe Coal Milling 1,020 kWe Coal Slurry Pumps 250 kWe Slag Handling and Dewatering 520 kWe Air Separation Unit Auxiliaries 515 kWe Air Separation Unit Main Air Compressor 37,372 kWe Oxygen Compressor 5,696 kWe Fuel Gas Compressor 2,552 kWe All FT Processes 3,610 kWe Boiler Feedwater Pumps 879 kWe Condensate Pump 11 kWe Flash Bottoms Pump 200 kWe Circulating Water Pump 800 kWe Cooling Tower Fans 180 kWe Scrubber Pumps 176 kWe Selexol Plant Auxiliaries 1,711 kWe Claus Plant Auxiliaries 141 kWe Miscellaneous Balance-of-Plant 3,000 kWe Transformer Losses 260 kWe Total Net Auxiliary Load 58,933 kWe
Plant Performance Net Plant Power 29,660 kWe Single Gasifier Coal Feed Flowrate 219,250 lb/hr Thermal Input1 799,985 kWt Elemental Sulfur Production2 106.1 tons/day Condenser Duty 193 MMBtu/hr
1 HHV of as-received Pittsburgh No. 8 coal is 12,450 Btu/lb. 2At 100% capacity factor

Final Report 37
3.2.4 F-T Output Summary
The 538,912 lb/hr of clean syngas feed to the F-T plant produces a total of 8,320 bbl/day of liquid products. The product stream is separated into naphtha and distillate pools. The liquid products are further characterized by carbon numbers and/or component boiling fractions. The overall compounds in the naphtha and diesel pools are shown in Table 3-3 and Table 3-4. The percentages of these components are based on standard liquid volumes.
Table 3-3 Naphtha Components
3,690 Bbl/day Naphtha Production
Naphtha Products Product Distribution (liquid vol.)
C5-C6 (paraffins) 38%
C7+ to 300 F boiling point 48%
300 to 350 F boiling point 14%
Table 3-4 Diesel Components
4,630 Bbl/day Diesel Production
Diesel Products Product Distribution
(liquid vol.)
350 to 500 F boiling point 42%
500+ F boiling point 58%
The F-T diesel product is a high-value product because it is sulfur, nitrogen and aromatic free. An additive package must be added to the diesel pool in order to bring the fuel up to specification for sale as diesel fuel to the end-use consumer.
3.3 Analysis of Concept 2
The Concept 2 CTL facility is an independent plant sized to meet the minimum size of a commercially available slurry-based F-T plant (producing about 10,000 bbls/day of F-T liquid products). Based on recent IGCC power plant proposals, the average size of a new

Final Report 38
IGCC plant is approximately 600 MW net, using two gasifier trains. Since 300 MW gasifiers represent current commercial offerings, the CTL facility uses two 300 MW gasifiers to produce a nominal 10,000 bbls/day of liquids.
The following parameters and assumptions are the basis for Concept 2:
• The CTL facility is an independent, stand-alone facility.
• The system includes recycle to maximize liquids production and produces sufficient power for self-sufficient operation.
• The system includes sufficient refining capabilities to produce commercial-grade end products, with an emphasis on diesel.
• The system does not include carbon capture/sequestration technology.
• The CTL plant will be self-sufficient in terms of electric power requirements; however, extra power may be exported to the grid.
3.3.1 Process Description with Block/Process Diagrams
The Concept 2 process description is the same as Concept 1 (as described in Section 3.2.1) except that Concept 2 is a stand-alone facility and uses two 300 MW gasifiers to produce the syngas for the F-T products and the power. The Concept 2 block flow diagram is shown in Figure 3-3.

Final Report 39
Figure 3-3 Concept 2 - Process Block Flow Diagram GE Gasifier-Based FT Liquid Production Plant

Final Report 40
3.3.2 Heat and Mass Balances
Table 3-5 shows the temperature, pressure and flow of the process streams in the gasification and F-T areas of the Concept 2 facility at the design feed rate, including stream compositions and state points.
Table 3-5 Concept 2 Process Stream Compositions
1A 2 3 4 5 6 7 8 9 10Slurry Air Air Oxygen Slag Oxygen Syngas Syngas Sulfur Syngas
V-L Mole Fraction Ar 0 0.0094 0.0094 0.0320 0 0 0.0089 0.0096 0 0.0100CH4 0 0 0 0 0 0 0.0006 0.0007 0 0.0007CO 0 0 0 0 0 0 0.4300 0.4604 0 0.4799CO2 0 0.0003 0.0003 0 0 0 0.1314 0.1415 0 0.1115COS 0 0 0 0 0 0 0.0003 0.0000 0 0H2 0 0 0 0 0 0 0.3433 0.3688 0 0.3871H2O 1.0 0.0104 0.0104 0 0 0 0.0673 0.0013 0 0.0009H2S 0 0 0 0 0 0 0.0083 0.0083 0 0N2 0 0.7722 0.7722 0.0180 0 0.0500 0.0088 0.0094 0 0.0099NH3 0 0 0 0 0 0 0.0010 0.0002 0 0O2 0 0.2077 0.2077 0.9500 0 0.9500 0 0 0 0SO2 0 0 0 0 0 0 0 0 0 0
Total 1.0 1.0 1.0 1.0 0.0 1.0 1.0 1.0 0.0 1.0
V-L Flowrate (lbmol/hr) 9,264 42,061 32,616 10,010 0 167 35,808 33,329 0 31,379V-L Flowrate (lb/hr) 166,893 1,213,637 941,123 322,141 0 5,313 739,890 694,234 0 622,347Solids Flowrate (lb/hr) 333,218 0 0 0 37,461 0 0 0 10,209 0
Temperature (°F) 60 59 59 207 300 90 322 102 355 112Pressure (psia) 1,050 14 14 1,025 798 375 798 720 25 719Density (lb/ft3) --- 0.075 0.075 4.606 --- 2.062 1.966 2.487 --- 2.324Molecular Weight --- 28.85 28.85 32.18 --- 31.80 20.66 20.83 --- 19.83
A - Solids flowrate includes dry coal; V-L flowrate includes slurry water and water from coal
Note: The mass fraction of Argon in stream 10 is added to the mass fraction of Nitrogen before entering the FT- Reactor.This is done because the F-T reactor model cannot handle Argon.

Final Report 41
Table 3-5 Concept 2 Process Stream Compositions (Continued)
11 12 13 14 15 16 17 18 19V-L Mole Fraction Water CO2 F-T Liquids Recycle Steam Recycle H2 H2 H2
H2 0 0 0.0077 0.58499 0 0.51348 1.0 1.0 1.0 N2 0 0 0.0058 0.29980 0 0.22729 0 0 0 O2 0 0 0 0 0 0 0 0 0 H2S 0 0 0 0 0 0.000137 0 0 0 CO 0 0 0.001151 0.06166 0 0.07639 0 0 0 CO2 0 1.0 0.050741 0.00392 0 0.01465 0 0 0 H2O 1.0 0 0.056187 0 1.0 0.16085 0 0 0 NH3 0 0 0.000000 0 0 0 0 0 0 COS 0 0 0 0 0 0 0 0 0 CH4 0 0 0.001032 0.03527 0 0.00720 0 0 0 C2H4 0 0 0.000480 0.01066 0 0 0 0 0 C2H6 0 0 0.000139 0.00254 0 0 0 0 0 C3H6 0 0 0.000719 0.00080 0 0 0 0 0 C3H8 0 0 0.000135 0.00011 0 0 0 0 0 IC4H8 0 0 0.000042 0 0 0 0 0 0 NC4H8 0 0 0.000815 0.00005 0 0 0 0 0 IC4H10 0 0 0.000010 0 0 0 0 0 0 NC4H10 0 0 0.000219 0.00001 0 0 0 0 0 C5H10 0 0 0.000921 0 0 0 0 0 0 NC5H12 0 0 0.000325 0 0 0 0 0 0 IC5H12 0 0 0.000033 0 0 0 0 0 0 C6H12 0 0 0.001248 0 0 0 0 0 0 NC6H14 0 0 0.000402 0 0 0 0 0 0 IC6H14 0 0 0.000041 0 0 0 0 0 0 C7H14 0 0 0.001431 0 0 0 0 0 0 C7H16 0 0 0.000653 0 0 0 0 0 0 C8H16 0 0 0.001712 0 0 0 0 0 0 C8H18 0 0 0.000784 0 0 0 0 0 0 C9H18 0 0 0.002089 0 0 0 0 0 0 C9H20 0 0 0.000945 0 0 0 0 0 0C10 - C20 Olefins 0 0 0.059154 0 0 0 0 0 0C10 - C20 Paraffins 0 0 0.026271 0 0 0 0 0 0 C7-300HC 0 0 0 0 0 0 0 0 0 3-350HC 0 0 0 0 0 0 0 0 0 350-5HC 0 0 0 0 0 0 0 0 0 500+HC 0 0 0 0 0 0 0 0 0 C7-300HT 0 0 0 0 0 0 0 0 0 3-350HT 0 0 0 0 0 0 0 0 0 350-5HT 0 0 0 0 0 0 0 0 0 500+HT 0 0 0 0 0 0 0 0 0 OXVAP 0 0 0.000198 0 0 0 0 0 0 OXHC 0 0 0.002285 0 0 0 0 0 0 OXH2O 0 0 0.000725 0 0 0 0 0 0C21 - C29 Paraffin/Olefin Mix 0 0 0.161721 0 0 0 0 0 0C30+Waxes 0 0 0.613866 0 0 0 0 0 0
Total 1.0000 1.0000 1.0000 1.0000 1.0000 1.0000 1.0000 1.0000 1.0000
V-L Flowrate (lbmol/hr) 522 10,033 111 5,442 1,227 7,215 160 79 415V-L Flowrate (lb/hr) 9,407 441,533 59,792 67,849 22,112 95,274 322 159 837Solids Flowrate (lb/hr) 0 0 0 0 0 0 0 0 0
Temperature (°F) 240 100 488 1,706 650 1,780 100 100 100Pressure (psia) 325 265 304 375 615 355 600 600 120Stream Density (lb/ft3) 56.237 2.138 42.391 0.200 1.022 0.194 0.197 0.197 0.040Liquid Vol @ 60°F (ft3/hr) --- --- --- --- --- --- --- --- ---Molecular Weight 18.02 44.01 537.66 12.47 18.02 13.20 2.02 2.02 2.02

Final Report 42
Table 3-5 Concept 2 Process Stream Compositions (Continued)
20 21 22 23 24 25 26 27V-L Mole Fraction F-T Liquids F-T Liquids F-T Liquids Naphtha Distillate FG FG FG
H2 0 0 0 0 0 0.389448 0.389448 0.389448 N2 0 0 0 0 0 0.354404 0.354404 0.354404 O2 0 0 0 0 0 0 0 0 H2S 0 0 0 0 0 0.000211 0.000211 0.000211 CO 0 0 0 0 0 0.072891 0.072891 0.072891 CO2 0 0 0 0 0 0.007290 0.007290 0.007290 H2O 0 0 0 0 0 0.001037 0.001037 0.001037 NH3 0 0 0 0 0 0 0 0 COS 0 0 0 0 0 0 0 0 CH4 0 0 0 0 0 0.045342 0.045342 0.045342 C2H4 0 0 0 0 0 0.012702 0.012702 0.012702 C2H6 0 0 0 0 0 0.008913 0.008913 0.008913 C3H6 0 0 0 0 0 0.033052 0.033052 0.033052 C3H8 0 0 0 0 0 0.020058 0.020058 0.020058 IC4H8 0 0 0 0 0 0.001362 0.001362 0.001362 NC4H8 0 0 0 0 0 0.025880 0.025880 0.025880 IC4H10 0 0 0 0 0 0.010571 0.010571 0.010571 NC4H10 0 0 0 0 0 0.016612 0.016612 0.016612 C5H10 0.0005714 0 0 0.114465 0 0.000022 0.000022 0.000022 NC5H12 0.0425540 0 0 0.083495 0 0.000007 0.000007 0.000007 IC5H12 0 0 0 0.056398 0 0.000001 0.000001 0.000001 C6H12 0.1839110 0 0 0 0 0.000018 0.000018 0.000018 NC6H14 0.0551715 0 0 0.156873 0 0.000006 0.000006 0.000006 IC6H14 0.0061314 0 0 0.081914 0 0 0 0 C7H14 0.1422931 0 0 0 0 0.000015 0.000015 0.000015 C7H16 0.0609817 0 0 0 0 0.000007 0.000007 0.000007 C8H16 0.1180673 0 0 0 0 0.000013 0.000013 0.000013 C8H18 0.0506000 0 0 0 0 0.000006 0.000006 0.000006 C9H18 0.0979516 0 0 0 0 0.000012 0.000012 0.000012 C9H20 0.0419791 0 0 0 0 0.000005 0.000005 0.000005C10 - C20 Olefins 0.081255 0.584636 0.025897 0 0 0.000047 0.000047 0.000047C10 - C20 Paraffins 0.034823 0.250559 0.011099 0 0 0.000020 0.000020 0.000020 C7-300HC 0 0 0 0.173512 0 0 0 0 3-350HC 0 0 0 0.045721 0 0 0 0 350-5HC 0 0 0 0 0.264090 0 0 0 500+HC 0 0 0 0 0.385986 0 0 0 C7-300HT 0 0 0 0.233267 0 0 0 0 3-350HT 0 0 0 0.054356 0 0 0 0 350-5HT 0 0 0 0 0.240683 0 0 0 500+HT 0 0 0 0 0.109241 0 0 0 OXVAP 0 0 0 0 0 0.000004 0.000004 0.000004 OXHC 0.0837097 0.1648054 0 0 0 0.000020 0.000020 0.000020 OXH2O 0 0 0 0 0 0.000014 0.000014 0.000014C21 - C29 Paraffin/Olefin Mix 0 0 0.2726436 0 0 0.000005 0.000005 0.000005C30+Waxes 0 0 0.690361 0 0 0 0 0
Total 1.0000 1.0000 1.0000 1.0000 1.0000 1.0000 1.0000 1.0000
V-L Flowrate (lbmol/hr) 208 114 100 401 268 2,164 1,736 1,715V-L Flowrate (lb/hr) 21,649 20,157 61,971 42,663 60,589 42,988 34,481 34,065Solids Flowrate (lb/hr) 0 0 0 0 0 0 0 1
Temperature (°F) 100 100 100 128 236 90 90 385Pressure (psia) 50 50 50 40 20 20 20 460Stream Density (lb/ft3) 43.055 46.129 51.397 40.769 43.599 0.067 0.067 1.000Liquid Vol @ 60°F (ft3/hr) 487.04 417.04 1,189.19 997.00 1,250.83 --- --- ---Molecular Weight 104.30 176.49 617.86 106.52 226.04 19.86 19.86 19.86

Final Report 43
3.3.3 Performance Summary
Table 3-6 summarizes the plant power output, including auxiliary load, for the Concept 2 facility at the design capacity.
Table 3-6 Concept 2 Plant Performance Summary
Plant Output Gas Turbine Power 34,330 kWe Steam Turbine Power 70,599 kWe Syngas Power Recovery Turbine Net Power 8,197 kWe Total 113,126 kWe
F-T Liquids Production F-T Liquids Production 9,609 bbl/day
Auxiliary Load Coal Handling 60 kWe Coal Milling 1,650 kWe Coal Slurry Pumps 400 kWe Slag Handling and Dewatering 850 kWe Air Separation Unit Main Air Compressor 45,865 kWe Oxygen Compressor 8,935 kWe Fuel Gas Compressor 3,325 kWe All FT Processes 4,170 kWe Boiler Feedwater Pumps 875 kWe Condensate Pump 17 kWe Flash Bottoms Pump 200 kWe Circulating Water Pump 1,290 kWe Cooling Tower Fans 290 kWe Scrubber Pumps 203 kWe Selexol Plant Auxiliaries 1,976 kWe Claus Plant Auxiliaries 162 kWe Miscellaneous Balance-of-Plant 3,000 kWe Transformer Losses 330 kWe Total Net Auxiliary Load 73,598 kWe
Plant Performance Net Plant Power 39,528 kWe Gasifiers Coal Feed Flowrate 354,488 lb/hr Thermal Input1 1,293,432 kWt Elemental Sulfur Production 122.5 tons/day Condenser Duty 310 MMBtu/hr
1 - HHV of as-received Pittsburgh No. 8 coal is 12,450 Btu/lb. 2 – at 100% capacity factor

Final Report 44
3.3.4 F-T Output summary
The 622,347 lb/hr of clean syngas feed produces a total of 9,609 barrels per day of liquid products from the F-T plant. The product stream is separated into naphtha and distillate. The liquid products are further characterized by carbon numbers and/or the component boiling point (BP) fractions. The overall compounds in the naphtha and diesel pools are shown in Table 3-7 and Table 3-8. The percentages shown in the tables are based on standard liquid volumes.
Table 3-7 Naphtha Components
4,262 Bbl/day Naphtha Production
Naphtha Products Product Distribution
(liquid vol.)
C5-C6 (paraffins) 38%
C7+ to 300 F boiling point 48%
300 to 350 F boiling point 14%
Table 3-8 Diesel Components
5,347Bbl/day Diesel Production
Diesel Products Product Distribution
(liquid vol.)
350 to 500 F boiling point 42%
500+ F boiling point 58%
The F-T diesel product is a high-value product that is sulfur, nitrogen and aromatic free. An additive package is added to the diesel product in order to bring the fuel up to specification for sale as diesel fuel to the end-use consumer.

Final Report 45
4. PLANT DESIGN
4.1 Concept 1: CTL Plant Co-Located with IGCC
4.1.1 Description
The CTL plant is adjacent to a nominal 600 MW net IGCC plant that uses two gasifier trains to produce power. The CTL plant is equipped with a third gasifier. All three gasifiers are based on GE Energy’s entrained flow, radiant quench technology, similarly sized, and are fed by Pittsburgh No. 8 coal. The CTL plant gas cleanup equipment is sized to handle 140% of the syngas generated by one gasifier. After water scrubbing to remove solids, halides and trace contaminants, raw syngas from the IGCC plant is pooled and a maximum of 40% of the syngas generated by a single gasifier is fed to the CTL plant. There is no integration between the CTL plant and the IGCC facility except for the exchange of syngas. The CTL plant uses a slurry-bed, iron catalyst-based F-T process to produce the maximum amount of coal liquids from the design syngas feed. The CTL plant produces power by burning off-gas from the F-T reactors in a combustion turbine equipped with a backend heat recovery steam generator (HRSG) in a combined cycle. The HRSG recovers heat from the gasification process and exothermic reactions in the F-T reactor and feeds the steam produced to a steam turbine. The power generated by the CTL plant is primarily for internal use, although a small amount of excess power can be exported to the grid. The CTL plant produces a naphtha and a distillate pool that is further upgraded to a commercial grade diesel product for sale. The naphtha is exported to an oil refinery for upgrading into gasoline or use as a chemical feedstock. The CTL plant is not designed for carbon capture/sequestration.
Figure 4-1 illustrates the plant concept.

Final Report 46
Figure 4-1 Concept 1 Plant Process Diagram

Final Report 47
General Description of the Process Systems
The CTL plant is sized to handle syngas in an amount equal to 140% of the output from a single gasifier. The pressurized entrained-flow GE single-stage gasifier uses a coal/water slurry and oxygen generated in a cryogenic air separation unit (ASU) to produce a medium heating value fuel gas.
The gasifier vessel is a refractory-lined, high-pressure combustion chamber. Coal slurry is transferred from the slurry storage tank to the gasifier with a high-pressure pump. The coal slurry and oxygen reacts in the gasifier at a pressure of 815 psia and a temperature in excess of 1,900 °F to produce syngas. Hot syngas and molten solids from the reactor flow downward into a radiant heat exchanger where the syngas is cooled to 1,100°F and the ash solidifies. Raw syngas continues downward into a quench system and then into the syngas scrubber for removal of entrained solids and water soluble components.
The gas goes through a series of additional gas coolers and cleanup processes including a COS hydrolysis reactor, an activated carbon bed for mercury removal, and a two-stage Selexol Acid Gas Removal (AGR) system. Slag captured by the syngas scrubber is recovered in a slag recovery unit. Sulfur containing gases are captured in the AGR and sent to a Claus plant where elemental sulfur is recovered.
Clean syngas leaving the Selexol process contains <1ppm total sulfur. The sulfur level is further reduced to <1ppb using a zinc oxide sulfur polishing bed. After sulfur polishing, the clean syngas is reduced in pressure through an expansion turbine (producing about 7 MWe of electric power) and fed to the F-T reactor. Off gas from the F-T reactors is recycled to maximize liquid production. CO2 is removed from the F-T process and vented. The F-T process generates roughly 8,320 barrels of hydrocarbon liquids per day, consisting of both naphtha and diesel fractions. The products are upgraded through hydrotreating and hydrocracking to a commercial grade diesel fuel and naphtha. The naphtha is sent to a petroleum refinery for upgrading or to a chemical plant as a chemical feedstock.
The off-gas from the F-T process is compressed and used to fuel a combustion turbine. The turbine produces 27 MWe. Hot flue gas from the turbine passes through a HRSG generating high pressure steam that is fed to a steam turbine to generate an additional 54 MWe of electric power.
The following sections describe the process in more detail.
Coal Grinding and Slurry Preparation
Coal is fed onto a conveyor by vibratory feeders located below each coal silo. The conveyor feeds the coal to an inclined conveyor that delivers the coal to the rod mill feed hopper. The feed hopper provides a surge capacity of about two hours and contains two hopper outlets. A vibrating feeder on each hopper outlet supplies the weigh feeder, which in turn feeds a rod mill. Each rod mill is sized to process 60% of the coal feed requirements of the gasifier. The rod mill grinds the coal and wets it with treated slurry

Final Report 48
water transferred from the slurry water tank by the slurry water pumps. The coal slurry is discharged into the rod mill product tank, and then the slurry is pumped from the rod mill product tank to the slurry storage and slurry blending tanks.
The coal grinding system is equipped with a dust suppression system consisting of water sprays aided by a wetting agent. All of the tanks have vertical agitators to keep the coal slurry solids suspended.
The equipment in the coal grinding and slurry preparation system is fabricated of materials appropriate for the abrasive environment present in the system. The tanks and agitators are rubber lined. The pumps are either rubber-lined or hardened metal to minimize erosion. Piping is fabricated of high-density polyethylene (HDPE).
Gasification
The CTL plant utilizes one gasification train to process a maximum total capacity of 2,631 TPD of Pittsburgh No. 8 coal. The gasifier operates at maximum capacity. The slurry feed pump takes suction from the slurry run tank and discharges it to the feed injector of the GE gasifier. Oxygen from the ASU is vented during preparation for startup and is sent to the feed injector during normal operation. The air separation plant supplies nearly 2,450 tons/day of 95% purity oxygen to the gasifier, the F-T autothermal reformer and the Claus plant.
The gasifier vessel is a refractory-lined, high-pressure combustion chamber. Coal slurry is transferred from the slurry storage tank to the gasifier with a high-pressure pump. A combination fuel injector is at the top of the gasifier vessel through which the coal slurry feedstock and oxidant (oxygen) are fed. The coal slurry and the oxygen react in the gasifier at about 815 psia and 1,900 °F to produce syngas.
The syngas consists primarily of hydrogen and carbon monoxide, with lesser amounts of water vapor and carbon dioxide, and small amounts of hydrogen sulfide, carbonyl sulfide, methane, argon, and nitrogen. The heat in the gasifier liquefies coal ash. Hot syngas and molten solids from the reactor flow downward into a radiant heat exchanger where the syngas is cooled to 1,100°F and the solids solidify. The raw syngas is quenched and cooled further in a water bath. The solids collect in the water sump at the bottom of the gasifier and are removed periodically using a lock hopper system. Raw syngas then flows to the syngas scrubber for entrained solids removal.
Raw Gas Cooling
Hot raw gas exits the gasifier at 815 psia and 2,450ºF, and then is cooled to approximately 1,100ºF in a radiant exchange boiler. The waste heat from this cooling is used to generate high-pressure steam. Boiler feedwater in the tubes is saturated, and the steam and water are separated in a steam drum. Saturated steam is produced at 1,800 psig. This steam forms part of the general heat recovery system that provides steam to the steam turbine. The raw syngas is saturated and further cooled in a water bath quench.

Final Report 49
Syngas Quench
The water/syngas mixture enters the syngas quench area and is directed downwards by a dip tube into a water sump at the bottom of the radiant cooler. Most of the solids are separated from the syngas at the bottom of the dip tube as the syngas goes upwards through the water. From the overhead of the quench, the syngas enters the low-temperature gas cooling section for further cooling.
The water removed from the syngas quench contains all the solids that were not removed in the quench gasifier water sump. To limit the amount of solids recycled to the quench chamber, a continuous blowdown stream is removed from the bottom of the syngas quench. The blowdown is sent to the vacuum flash drum in the black water flash section. The circulating quench water is pumped by circulating pumps to the quench gasifier.
The slag handling system removes solids from the gasification process equipment. These solids consist of a small amount of unconverted carbon and essentially all of the ash contained in the feed coal. These solids are in the form of glass, which fully encapsulates any metals.
Sour Water Stripper
The sour water stripper removes NH3, SO2, and other impurities from the waste stream of the scrubber. The sour water stripper system consists of a sour drum that accumulates sour water from the gas scrubber and condensate from syngas coolers. Sour water from the drum flows to the sour water stripper, which consists of a packed column with a steam-heated reboiler. Sour gas is stripped from the liquid and sent to the sulfur recovery unit. Remaining water is sent to wastewater treatment.
Mercury Removal
Mercury removal is accomplished by packed beds of sulfur-impregnated carbon similar to what has been used at Eastman Chemical’s gasification plant. Dual beds of sulfur-impregnated carbon provide a 20-second superficial gas residence time to achieve 95% mercury reduction in addition to removal of other volatile heavy metals such as arsenic.
Acid Gas Removal
H2S is removed from the syngas in a single-stage Selexol unit, which preferentially removes H2S from the syngas.
Cool, dry, and particulate-free syngas enters the absorber unit at approximately 720 psia and 100°F. In this absorber, H2S is preferentially removed from the syngas stream. The rich solution leaving the bottom of the absorber is regenerated in a stripper through the indirect application of thermal energy via condensing low-pressure steam in a reboiler. The stripper acid gas stream is then sent to the Claus unit. Sweet gas from the absorber is polished in a zinc oxide bed to reduce sulfur content in the F-T feed to <1 ppb.

Final Report 50
Claus Unit
Acid gas from the Selexol stripper unit is routed to the Claus plant. The Claus plant partially oxidizes the H2S in the acid gas to elemental sulfur. About 8,840 lb/hr of elemental sulfur are recovered, providing an overall sulfur recovery of 99.6%.
Acid gas from the Selexol unit is preheated to 450°F. A portion of the acid gas along with all of the sour gas and oxidant are fed to the Claus furnace. In the furnace, H2S is catalytically oxidized to SO2 using 95% pure oxygen. A furnace temperature greater than 2,450°F must be maintained to thermally decompose all of the NH3 present in the sour gas stream.
Three preheaters and three sulfur converters are used to obtain a per-pass H2S conversion of approximately 97.8%. In the furnace waste heat boiler, 650 psia steam is generated. This steam is used to satisfy all Claus process preheating and reheating requirements as well as provide steam to the medium-pressure steam header. The sulfur condensers produce 50 psig steam for the low-pressure steam header.
Air Separation Unit (ASU)
The ASU is designed to produce a nominal output of 2,450 TPD of 95% pure O2 for use in the gasifier and Claus plant. The ASU is designed with a single production train. Approximately 5,000 TPD of nitrogen are also generated and vented.
The air feed to the air separation unit is supplied from a stand-alone electric air compressor. The filtered air is compressed in the centrifugal compressor, with intercooling between each stage. The air stream is cooled and then fed to an adsorbent-based pre-purifier system.
The air from the pre-purifier is split into three streams. About 70% of the air is fed directly to the cold box. About 25 to 30% of the air is compressed in an air booster compressor. This boosted air is cooled in an aftercooler against cooling water before it is fed to the cold box. About 5% of the air is fed to a turbine driven, single stage, centrifugal booster compressor. This stream is cooled in a shell and tube aftercooler against cooling water before it is fed to the cold box.
All three air feeds are cooled in the cold box to cryogenic temperatures against returning product oxygen and nitrogen streams in plate-and-fin heat exchangers. The large air stream is fed directly to the first distillation column to begin the separation process. The second air stream is liquefied against boiling liquid oxygen before it is fed to the distillation columns. The third, small air stream is fed to the cryogenic expander to produce refrigeration to sustain the cryogenic separation process. The work produced from the expansion is used to power the turbine booster compressor.
Inside the cold box the air is separated into oxygen and nitrogen products. The oxygen product is withdrawn from the distillation columns as a liquid and is pressurized by a cryogenic pump. The pressurized liquid oxygen is vaporized against the high-pressure air feed before being warmed to ambient temperature. The gaseous oxygen exits the cold

Final Report 51
box and is split into two streams. Essentially all of the gaseous oxygen is fed to the centrifugal compressor with intercooling between each stage of compression. The compressed oxygen is then fed to the gasification unit. A small oxygen stream is fed to the autothermal reformer in the F-T area and to the Claus plant.
Nitrogen is produced from the cold box and split into two streams. A small portion of the nitrogen is used as the regeneration gas for the pre-purifiers; the remainder is vented to the atmosphere.
F-T Process
The F-T process converts the clean syngas to 8,320 barrels per day of hydrocarbon liquids per day, consisting of both naphtha and fungible diesel.
The F-T slurry-bed reactor converts the sulfur-free syngas primarily into olefinic hydrocarbons by the reaction:
n CO + 2n H2 = CnH2n + n H2O
The iron-based F-T catalyst also promotes the water-gas shift reaction which produces hydrogen for the F-T synthesis reaction.
CO + H2O = CO2 + H2
The objective of the process design is to maximize the liquid production, which is accomplished by the recycle of off-gas from the F-T reactor. The lighter F-T products are hydrotreated for stabilization, while the heavier F-T products are hydrocracked to lower their pour point and produce a commercial diesel fuel.
The lighter hydrocarbon products leaving the slurry-bed reactor in the vapor phase are cooled, condensed and collected. The heavier hydrocarbons are removed as liquids from the reactor, separated from the suspended catalyst, cooled, and combined with the lighter products to make the liquid fuel precursor product.
The F-T reactor relies on continual addition of fresh catalyst and continual withdrawal of used catalyst from the slurry bed to maintain constant catalyst activity. The fresh catalyst must be pretreated in a reducing atmosphere at an elevated temperature to ensure proper activation. The catalyst pretreating system consists of a vessel similar to the slurry-bed reactor, but without the internal cooling facilities.
The cleaned syngas from the gasification block is preheated and mixed with steam and recycle gas and fed to the slurry-bed F-T hydrocarbon synthesis reactor. The slurry-bed F-T hydrocarbon synthesis reactor converts the hydrogen and carbon monoxide to straight chain olefinic and aliphatic hydrocarbons, carbon dioxide and water. The heat of reaction is removed from the slurry-bed F-T reactor by the generation of 375 psia steam inside tubes within the slurry-bed reactor. Boiler feed water (BFW) is circulated between the steam drum and the F-T reactor to ensure that sufficient BFW always is flowing through the cooling tubes. A cyclone removes entrained catalyst particles from the vapor

Final Report 52
stream leaving the top of the F-T reactor. The vapor stream then is cooled to 40°F in four exchangers.
CO2 from the vapor stream is captured by the absorption tower with an amine acid gas removal process. The CO2 is regenerated from the amine-based solvent and vented to the atmosphere. The vapor stream is then dehydrated and compressed for recycle to the F-T reactor. In the event the CO2 needs to be sequestered (not part of the design), additional processing steps would be required such as compression and piping the CO2 off-site.
The liquid hydrocarbon stream leaving the F-T vapor condenser is mixed with the cooled liquid hydrocarbons from the slurry-bed F-T reactor and sent for upgrading into liquid transportation fuels. The liquid stream leaving the slurry-bed F-T reactor passes through a hydroclone to remove a majority of the entrained catalyst particles. The catalyst-rich hydroclone bottoms go to a mixing tank, from which a portion is withdrawn for recycle back to the slurry-bed reactor. Residual catalyst particles are removed from the hydroclone overhead stream in the filter system.
The catalyst-free liquid leaving the filter system is reduced in pressure and flashed. The vapor stream is further cooled to 100°F and flashed. The vapor stream is split to separate the light hydrocarbons (C4s and lighter), which provide fuel for the gas turbine, from the remaining vapor, which is mixed with the CO2-free vapor stream for recycle to the F-T reactor. The recycled gas to the F-T reactor passes through an autothermal reformer, in which the hydrocarbons are converted to syngas, predominantly hydrogen and carbon monoxide.
The central hydrocarbons process serves several functions. It is a collection point for the liquid and vapor streams and a separation area from which several streams leave. The resultant vapor stream is split, with most of the gas being recycled to the autothermal reformer and the F-T reactor. The rest of the gas goes through a hydrogen recovery process to produce hydrogen that is used for hydrotreating the liquids. The liquids are split into three streams: a naphtha stream, a distillate stream, and a heavy wax stream. Hydrogen is used to hydrotreat the naphtha and distillate streams, and to hydrocrack the wax into naphtha and distillate.
The final liquid product consists of 44% naphtha and 56% diesel. Off-gas from the liquid production processes provides fuel for the combustion turbines.
Combustion Turbine Generator
The combustion turbine generator selected for this application is an aeroderivative turbine, producing 27,040 kW at maximum design power output. Since the turbine output is discrete, any remaining fuel gas is consumed in a duct burner.
Steam Generation
Hot raw gas exiting the gasifier is cooled to approximately 1,100ºF in a radiant exchange boiler. The waste heat from this cooling is used to generate high-pressure steam. Boiler feedwater in the tube walls is saturated, and then steam and water are separated in a

Final Report 53
steam drum. Approximately 388,000 lb/h of saturated steam at 1,800 psia is produced. This steam then forms part of the general heat recovery system that provides steam to the steam turbine. The raw syngas is saturated and cooled further in a water bath quench.
The HRSG is a horizontal gas flow, drum-type, multi-pressure design that is matched to the characteristics of the gas turbine exhaust gas. The HP (high-pressure) drum produces steam at main steam pressure; while the IP (intermediate-pressure) drum produces steam for export to the cold reheat. Natural steam circulation is accomplished in the HRSG by utilizing differences in densities due to temperature differences of the steam. The natural circulation HRSG provides the most cost-effective and reliable design.
Superheater, boiler, and economizer sections are supported by shop-assembled structural steel. Inlet and outlet ductwork routes the gases from the gas turbine outlet to the HRSG inlet and from the HRSG outlet to the stack. A diverter valve is included in the inlet duct to bypass the gas when appropriate. Suitable expansion joints are included.
Flare Stack
A self-supporting, refractory-lined, carbon steel flare stack is provided to combust and dispose of product gas during startup, shutdown, and upset conditions. The flare stack is provided with multiple pilot burners, fueled by natural gas or propane, with pilot monitoring instrumentation.
4.1.2 Major Equipment List
The major equipment lists for Concept 1 are found in Appendix A.
4.1.3 Capital Costs
Capital cost estimates are based on costs developed independently for current IGCC power plants and F-T liquids facilities and adjusted for the specific design criteria of Concept 1. Costs are based on a combination of adjusted vendor-furnished cost data and the RDS cost estimating database.
The capital costs are provided at the Total Plant Cost level, which includes equipment, materials, labor, indirect construction costs, engineering, and contingencies. Additional characteristics of the capital cost analysis include:
• Total Plant Costs, or “Overnight Construction Costs,” are expressed in July 2006 dollars.
• The estimate represents current commercial offerings for the gasification technology.
• The estimate represents a complete power plant facility, including necessary integrations with existing facilities, except for the items listed below.
• The boundary limit is defined as the total plant facility within the “fence line,” including coal receiving and water supply system.

Final Report 54
• The site is in West Virginia. Costs are based on a relative equipment/material/labor factor versus Gulf Coast USA.
• Costs are grouped according to a process/system oriented code of accounts; all reasonably allocable components of a system or process are included in the specific system account, in contrast to a facility, area, or commodity account structure.
The capital cost, specifically referred to as the Total Plant Cost (TPC) for this plant, was estimated for several categories: bare erected cost, engineering and home office overheads, and fee plus contingencies. The TPC level of capital cost is the “overnight construction” estimate.
Consistent with conventional power plant practices, project contingencies were added to the TPC accounts to cover project uncertainty and the cost of any additional equipment that could result from a detailed design. Such contingencies represent costs that are expected to occur. Each cost account is evaluated against the level of estimate detail and field experience to determine project contingencies.
4.1.4 Operating and Maintenance Costs
Operation and maintenance costs have been determined on a first-year basis and subsequently analyzed over the 20-year plant book life. Quantities for major consumables such as fuel and chemicals have been taken from technology-specific heat and mass balance diagrams developed for each plant application. Other consumables have been evaluated on the basis of the quantity required using reference data. Operation costs have been determined on the basis of the number of operators. Maintenance costs have been evaluated on the basis of requirements for each major plant section.
Tables 4-1 and 4-2 show the capital and operating costs for the Concept 1 plant. The accuracy of the results presented herein conforms to an AACE Estimate Class 5: Concept Screening. These results form the basis for the Economic Analysis described in Section 5.

Final Report 55
Table 4-1 Concept 1 - Total Plant Cost Summary Client: DEPARTMENT OF ENERGY Report Date: 19-Nov-06 Project: NETL Coal To Liquids Study - West Virginia
TOTAL PLANT COST SUMMARY Case: GE IGCC Design for Fischer-Tropsch (Analysis 3-1 with Diesel Additive)
Plant Size: 29.660 MW,net Estimate Type: Conceptual Cost Base (July) 2006 ; $x10008,320 FT Liquids bbl/day
Acct Equipment Material Labor Bare Erected Eng'g CM Contingencies TOT. PLANTNo. Item/Description Cost Cost Direct Indirect Cost $ H.O.& Fee Process Project COST $1 COAL & SORBENT HANDLING 5,868 1,127 4,722 331 12,049 964 3,253 16,2662 COAL-WATER SLURRY PREP & FEED 9,060 1,841 6,955 487 18,342 1,467 4,952 24,7623 FEEDWATER & MISC. BOP SYSTEMS 2,021 1,759 1,973 138 5,891 471 1,590 7,9524 GASIFIER & ACCESSORIES4.1 Gasifier & Auxiliaries 44,196 19,423 33,940 2,376 99,934 7,995 26,982 134,9114.2 Syngas Cooling w/4.1 w/4.1 w/4.14.3 ASU/Oxidant Compression 46,444 w/equip. 46,444 3,715 12,540 62,699
4.4-4.9 Other Gasification Equipment 9,028 10,365 11,710 820 31,923 2,554 8,619 43,096Subtotal 4 99,668 29,788 45,650 3,195 178,301 14,264 48,141 240,706
5A GAS CLEANUP 29,712 3,649 29,008 2,031 64,399 5,152 17,388 86,9395b FISCHER-TROPSCH SYSTEMS 52,275 5,750 10,455 732 69,213 5,537 18,687 23,359 116,7966 COMBUSTION TURBINE GENERATOR6.1 Combustion Turbine Generator 11,844 387 27 12,258 981 3,310 16,548
6.2-6.9 Combustion Turbine/Generator Accessories 63 56 4 122 10 33 165Subtotal 6 11,844 63 442 31 12,380 990 3,343 16,713
7 HRSG, DUCTING & STACK7.1 Heat Recovery Steam Generator 3,411 387 27 3,824 306 1,033 5,163
7.2-7.9 HRSG Accessories, Ductwork and Stack 331 209 247 17 803 64 217 1,084Subtotal 7 3,741 209 633 44 4,628 370 1,249 6,247
8 STEAM TURBINE GENERATOR 8.1 Steam TG & Accessories 7,430 921 64 8,416 673 2,272 11,361
8.2-8.9 Turbine Plant Auxiliaries & Steam Piping 3,175 182 1,525 107 4,988 399 1,347 6,734Subtotal 8 10,605 182 2,446 171 13,404 1,072 3,619 18,096
9 COOLING WATER SYSTEM 2,233 1,393 1,961 137 5,724 458 1,546 7,72810 ASH/SPENT SORBENT HANDLING SYS 6,585 3,686 6,232 436 16,939 1,355 4,573 22,86711 ACCESSORY ELECTRIC PLANT 2,172 967 2,444 171 5,755 460 1,554 7,77012 INSTRUMENTATION & CONTROL 3,555 538 2,667 187 6,947 556 1,876 9,37913 IMPROVEMENTS TO SITE 1,641 967 3,621 253 6,483 519 1,750 8,75214 BUILDINGS & STRUCTURES 1,894 3,113 218 5,225 418 1,411 7,054
TOTAL COST $240,981 $53,814 $122,322 $8,563 $425,679 $34,054 $18,687 $119,605 $598,026

Final Report 56
Table 4-2 Concept 1 - Operating and Maintenance Expenses INITIAL & ANNUAL O&M EXPENSES Cost Base (July) 2006
GE IGCC Design for Fischer-Tropsch (Analysis 3-1 with Diesel Additive)11/21/2006 Heat Rate-net(Btu/kWh): N/AMWe-net: 29.660
Capacity Factor: (%): 85.0OPERATING & MAINTENANCE LABOR
Operating Labor Operating Labor Rate(base): 32.50 $/hour Operating Labor Burden: 30.00 % of base Labor O-H Charge Rate: 25.00 % of labor
Total Operating Labor Requirements(O.J.)per Shift: 1 unit/mod. Plant
Skilled Operator 1.0 4.0 Operator 5.0 20.0 Foreman 1.0 4.0 Lab Tech's, etc. 2.0 8.0 TOTAL-O.J.'s 9.0 36.0
Annual Cost$
Annual Operating Labor Cost(calc'd) $13,323,960Maintenance Labor Cost(calc'd) $6,741,732Administrative & Support Labor(calc'd) $4,775,619TOTAL FIXED OPERATING COSTS $24,841,311VARIABLE OPERATING COSTS
Maintenance Material Cost(calc'd) $11,453,705
Consumables Consumption Unit Initial Initial /Day Cost Cost
Water(/1000 gallons) 0 5,350 1.20 $0 $1,991,805
Chemicals MU & WT Chem.(lbs) 56,976 8,139 0.19 $10,647 $471,866 Carbon (Mercury Removal) (lb.) 54,428 98 0.90 $48,985 $27,364 COS Catalyst (lb) 123,700 68 0.91 $112,567 $19,198 Selexol Solution (gal.) 111,330 25 14.40 $1,603,152 $111,690 MDEA Solution (lb) 1,621 49 0.89 $1,449 $13,585 Zinc Oxide 123,700 15 0.20 $24,740 $931 Ammonia (28% NH3) ton 0 0 228.00 $0 $0
Subtotal Chemicals $1,801,540 $644,634 Other Supplemental Fuel(MBtu) 0 0 0.00 $0 $0 SCR Catalyst Replacement w equip 0 9,480 $0 $0 Emission Penalties 0 0 0.00 $0 $0
Subtotal Other $0 $0 Waste Disposal Spent Mercury Catalyst (lb.) 0 98 0.38 $0 $11,554 Flyash (ton) 0 0 18.00 $0 $0 Bottom Ash(ton) 0 278 18.00 $0 $1,552,491
Subtotal Solid Waste Disposal $0 $1,564,045 By-products & Emissions Sulfur(tons) 0 106 -10.00 $0 ($328,865) Power Production, MWh 0 843 -35.00 $0 ($9,153,926)
Subtotal By-Products $0 ($9,482,791)
TOTAL VARIABLE OPERATING COSTS $6,171,398FUEL (tons) 0 2,631 54.77 $0 $44,706,985

Final Report 57
4.2 Concept 2 - Nominal 10,000 bbl/day Independent Commercial F-T Facility
4.2.1 Description
The Concept 2 CTL plant is a completely independent facility sized to meet the minimum production requirement of a commercially viable CTL plant. The design is predicated on a nominal product output of 10,000 barrels per day. Two 300 MW GE Energy gasifier trains produce the syngas required to meet the roughly 10,000 barrel per day output.
Description of the Process Systems
The Concept 2 CTL process systems are nearly identical to those of Concept 1 (see Section 4.1.1 of this report). The only difference is that in Concept 2 the CTL plant is a stand-alone facility processing syngas from two gasifier trains, as opposed to 1.4 trains in Concept 1. The gasifiers in Concept 2 are the same size as the gasifiers in Concept 1. If used to produce power, the two gasifiers in Concept 2 would generate roughly 600 MW.
The F-T process converts the clean syngas to 9,609 barrels per day of hydrocarbon liquids, consisting of both naphtha and diesel. The CTL plant produces power by burning off-gas from the F-T reactors in a combustion turbine equipped with a backend heat recovery steam generator (HRSG) in a combined cycle. The HRSG recovers heat from the gasification process and exothermic reactions in the F-T reactor and feeds the steam produced to a steam turbine. The power generated by the CTL plant is primarily for internal use, although a small amount of excess power can be exported to the grid. The gross power output of the plant is 113 MW, with an auxiliary power load of 74 MW, leaving a net of 39 MW of excess power exported to the grid.
The detailed process descriptions for the Concept 2 plant are identical to Concept 1. The two gasifier trains are copies of the single train of the Concept 1 plant through the syngas scrubber. Downstream of the scrubber, the size and capacity of the process equipment is proportionally larger at a size ratio of 2.0/1.4.
4.2.2 Major Equipment List
Appendix B contains the equipment lists for Concept 2.
4.2.3 Capital and Operating Costs
Tables 4-3 and 4-4 show the capital and operating costs for the Concept 2 CTL plant. The accuracy of the results presented herein conforms to an AACE Estimate Class 5: Concept Screening. These results form the basis for the Economic Analysis described in Section 5.

Final Report 58
Table 4-3 Concept 2 - Total Plant Cost Summary Client: DEPARTMENT OF ENERGY Report Date: 26-Sep-06 Project: NETL Coal To Liquids Study - West Virginia
TOTAL PLANT COST SUMMARY Case: GE IGCC Design for Fischer-Tropsch (Analysis 3-2 LM5000 Turbine)
Plant Size: 39.528 MW,net Estimate Type: Conceptual Cost Base (July) 2006 ; $x10009,609 FT Liquids bbl/day
Acct Equipment Material Labor Bare Erected Eng'g CM Contingencies TOT. PLANTNo. Item/Description Cost Cost Direct Indirect Cost $ H.O.& Fee Process Project COST $1 COAL & SORBENT HANDLING 8,619 1,656 6,936 485 17,696 1,416 4,778 23,8892 COAL-WATER SLURRY PREP & FEED 13,307 2,703 10,214 715 26,939 2,155 7,274 36,3683 FEEDWATER & MISC. BOP SYSTEMS 2,577 2,243 2,515 176 7,511 601 2,028 10,1404 GASIFIER & ACCESSORIES4.1 Gasifier & Auxiliaries 70,835 31,129 54,396 3,808 160,167 12,813 43,245 216,2264.2 Syngas Cooling w/4.1 w/4.1 w/4.14.3 ASU/Oxidant Compression 67,859 w/equip. 67,859 5,429 18,322 91,610
4.4-4.9 Other Gasification Equipment 12,252 14,067 15,892 1,112 43,324 3,466 11,697 58,487Subtotal 4 150,946 45,196 70,288 4,920 271,350 21,708 73,264 366,322
5A GAS CLEANUP 34,014 4,178 33,208 2,325 73,724 5,898 19,905 99,5275b FISCHER-TROPSCH SYSTEMS 58,660 6,453 11,732 821 77,666 6,213 20,970 26,212 131,0616 COMBUSTION TURBINE GENERATOR6.1 Combustion Turbine Generator 13,861 453 32 14,345 1,148 3,873 19,366
6.2-6.9 Combustion Turbine/Generator Accessories 74 65 5 143 11 39 193Subtotal 6 13,861 74 518 36 14,488 1,159 3,912 19,559
7 HRSG, DUCTING & STACK7.1 Heat Recovery Steam Generator 3,991 453 32 4,476 358 1,208 6,042
7.2-7.9 HRSG Accessories, Ductwork and Stack 387 244 289 20 940 75 254 1,269Subtotal 7 4,378 244 741 52 5,416 433 1,462 7,311
8 STEAM TURBINE GENERATOR 8.1 Steam TG & Accessories 9,474 1,174 82 10,731 858 2,897 14,487
8.2-8.9 Turbine Plant Auxiliaries & Steam Piping 3,893 232 1,925 135 6,185 495 1,670 8,350Subtotal 8 13,367 232 3,099 217 16,916 1,353 4,567 22,837
9 COOLING WATER SYSTEM 2,848 1,776 2,500 175 7,299 584 1,971 9,85410 ASH/SPENT SORBENT HANDLING SYS 9,671 5,413 9,152 641 24,877 1,990 6,717 33,58411 ACCESSORY ELECTRIC PLANT 2,506 1,116 2,820 197 6,640 531 1,793 8,96412 INSTRUMENTATION & CONTROL 3,879 586 2,910 204 7,579 606 2,046 10,23113 IMPROVEMENTS TO SITE 1,790 1,055 3,950 276 7,072 566 1,909 9,54714 BUILDINGS & STRUCTURES 2,283 3,703 259 6,246 500 1,686 8,432
TOTAL COST $320,422 $75,209 $164,286 $11,500 $571,418 $45,713 $20,970 $159,525 $797,627

Final Report 59
Table 4-4 Concept 2 - Operating and Maintenance Expenses
INITIAL & ANNUAL O&M EXPENSES Cost Base (July) 2006GE IGCC Design for Fischer-Tropsch (Analysis 3-2 LM5000) 9/26/2006 Heat Rate-net(Btu/kWh): N/A
MWe-net: 39.528Capacity Factor: (%): 85.0
OPERATING & MAINTENANCE LABOROperating Labor
Operating Labor Rate(base): 32.50 $/hour Operating Labor Burden: 30.00 % of base Labor O-H Charge Rate: 25.00 % of labor
Total Operating Labor Requirements(O.J.)per Shift: 1 unit/mod. Plant
Skilled Operator 2.0 8.0 Operator 7.0 28.0 Foreman 1.0 4.0 Lab Tech's, etc. 2.0 8.0 TOTAL-O.J.'s 9.0 48.0
Annual Cost$
Annual Operating Labor Cost(calc'd) $17,765,280Maintenance Labor Cost(calc'd) $9,033,921Administrative & Support Labor(calc'd) $5,885,949TOTAL FIXED OPERATING COSTS $32,685,150VARIABLE OPERATING COSTS
Maintenance Material Cost(calc'd) $15,347,965
Consumables Consumption Unit Initial Initial /Day Cost Cost
Water(/1000 gallons) 0 6,184 1.20 $0 $2,302,303
Chemicals MU & WT Chem.(lbs) 65,858 9,408 0.19 $12,307 $545,452 Carbon (Mercury Removal) (lb.) 64,000 117 0.90 $57,600 $32,669 COS Catalyst (lb) 140,000 76 0.91 $127,400 $21,457 Selexol Solution (gal.) 130,000 29 14.40 $1,872,000 $127,773 MDEA Solution (lb) 1,872 57 0.89 $1,673 $15,803 Zinc Oxide 140,000 137 0.20 $28,000 $8,501 Ammonia (28% NH3) ton 0 0 228.00 $0 $0
Subtotal Chemicals $2,098,980 $751,656 Other Supplemental Fuel(MBtu) 0 0 0.00 $0 $0 SCR Catalyst Replacement w equip 0 9,480 $0 $0 Emission Penalties 0 0 0.00 $0 $0
Subtotal Other $0 $0 Waste Disposal Spent Mercury Catalyst (lb.) 0 117 0.38 $0 $13,794 Flyash (ton) 0 0 18.00 $0 $0 Bottom Ash(ton) 0 450 18.00 $0 $2,510,411
Subtotal Solid Waste Disposal $0 $2,524,205 By-products & Emissions Sulfur(tons) 0 123 -10.00 $0 ($381,608) Power Production, MWh 0 949 -35.00 $0 ($10,301,392)
Subtotal By-Products $0 ($10,683,000)
TOTAL VARIABLE OPERATING COSTS $10,243,129FUEL (tons) 0 4,254 54.77 $0 $72,285,638

Final Report 60
5. FINANCIAL ANALYSIS
The cost estimate presented in Section 4 formed the basis for the financial analysis of the CTL conceptual designs. For Concept 1, the analysis incorporated the plant inputs involved in the production of the F-T liquids: the gasification train dedicated to F-T liquids production and the portions of the co-located IGCC plant used to provide syngas for F-T synthesis. The IGCC costs and process inputs (power, coal, and slag) used to produce power are not included in the financial analysis. Since Concept 2 represents a stand-alone facility, all the necessary information for the financial analysis was included in the design. The analysis strived to reflect the overall economics of each unit used in the production of F-T liquids by considering the capital cost, operating requirements, and all major plant products.
Figures 5-1 and 5-2 provide simplified schematics of the plant inputs and outputs used for the financial modeling. The flowrates shown represent full daily capacity for each case; plant capacity factor figures were used to determine yearly rates for all flows.
Figure 5-1 Key Plant Inputs/Outputs, West Virginia Co-located F-T Plant (Concept 1)
CO2
79 MMscfd
FT Naphtha3,690 Bbl/day
Coal3,683 sTPD FT Diesel
4,630 Bbl/day
Export Power30.6 MWe
Slag Sulfur389 sTPD 106 sTPD
Liquids Production
Coal Gasification andFischer-Tropsch
Note that these numbers are slightly different than what is presented in Sections 3 and 4 to take into account the syngas imported from the IGCC plant to the CTL plant.

Final Report 61
Figure 5-2 Key Plant Inputs/Outputs, West Virginia Stand Alone F-T Plant (Concept 2)
CO2
91 MMscfd
FT Naphtha4,262 Bbl/day
Coal4,254 sTPD FT Diesel
5,347 Bbl/day
Export Power39.5 MWe
Slag Sulfur450 sTPD 123 sTPD
Liquids Production
Coal Gasification andFischer-Tropsch
The key results desired from the analysis are the project return on equity investment, discounted cash flow, and identification of key model sensitivities. An important sensitivity involved varying the value of the F-T liquids to evaluate the financial results from different crude oil price scenarios. The analysis also addressed the impact of different state and federal policies intended to support plants of this nature. The financial analysis used the NETL/Nexant Power Systems Financial Model (PSFM), Version 5.0.5 to perform the evaluation. This model was originally developed in May 2002 and has since been modified to incorporate additional functionality. The model has been used in numerous gasification studies, and is now the standard used by NETL for IGCC systems analysis. It is a robust discounted cash flow model that takes into account all major financial and scenario assumptions in developing the key economic outputs.
5.1 Methodology
The analysis strived to mirror standard assumptions used for facilities with a similar size and risk profile. Several sources were consulted to develop appropriate assumptions for the financial analysis: NETL’s “Quality Guidelines for Energy System Studies,” team and reviewer inputs, and previous gasification optimization studies performed for NETL.4 Information on commodity pricing was also gathered from utilities evaluating the economics of similar facilities. Details of the financial assumptions can be found in Appendix C. The financial analysis used similar assumptions for both concepts to allow
4 Tasks 1 and 2, Gasification Plant Cost and Performance Optimization study, DOE Contract number DE-AC26-99FT40342, September 2003.

Final Report 62
a direct comparison of the model results. A few of the major assumptions and some of the areas that were explored via sensitivity analysis are listed below:
• A 26% project contingency was applied across the entire plant to reflect the uncertainty in the cost estimate at this phase of the analysis.
• A process contingency of 25% was applied to the F-T liquids synthesis unit to reflect greater cost and design uncertainty relative to the rest of the plant.
• 85% maximum plant capacity factor
The design for Concept 1 has the F-T plant receiving syngas from two sources: a dedicated gasification train (71% of the syngas) and a co-located IGCC plant (29%). The syngas from the IGCC plant “swings” between power production at the IGCC plant when power demand is high (20 hours/day) and liquids production at the F-T plant during off-peak hours (4 hours/day). Since the F-T plant is only at full capacity for 4 hours per day, the net capacity factor of this design, once an 85% capacity factor is applied, is 64.76%.
Concept 2 assumes that the plant always operates at full capacity (85% capacity factor).
• 40% tax rate
• 42-month construction period
• 30-year plant life
• 55:45 debt-to-equity ratio for project financing, 8% cost of capital. Since additional financing analysis was performed, the basis was made as consistent as possible with recent analysis performed in this area5.
• 3% cost escalation on all plant outputs, 2% on the price of coal
Specific plant performance and operating data were entered into the model from the design basis. The material and energy balance provided the power output, production rate of F-T liquids, sulfur generation, coal feed requirements, and all other input/output streams. The EPC cost used for the model analysis was determined from installed cost estimates for all major unit operations, off-sites, and balance-of-plant items. A more rigorous explanation of how these numbers were developed is outlined in Section 4.
For Concept 1, the additional cost, coal required, slag produced, and net power impact due to the syngas imported from the 600 MW IGCC facility was taken into account. Three different methodologies were considered in determining how to best consider the “cost” of generating this additional syngas:
1) Assume no cost beside the coal required to generate the additional syngas. Under this methodology, all capital costs, operating costs, and other impacts of generating the
5 Rosenberg, W., Walker, M., Alpern, D., “The 3 Party Convenant – A Path to IGCC Financing”, presented at the 2004 Gasification Technologies Conference, Washington, DC, October 2004.

Final Report 63
additional syngas are allocated to the 600 MW IGCC facility, not the F-T plant. This approach was rejected because it undervalues the cost of producing the syngas, which would artificially improve the F-T unit economics.
2) Place a cost on the imported syngas, similar to what is done for other plant feedstocks. This methodology recognizes that there is a lost opportunity to the IGCC plant by moving syngas from power to F-T production. Calculating this lost opportunity requires a complete design of the 600 MW IGCC plant, along with financial and design scenarios at different power generation levels. It was determined that the methodology selected (option 3 below) was a very close proxy given the resources available.
3) Allocate all costs, inputs, and outputs specific to the syngas coming from the 600 MW IGCC plant to the F-T unit. This approach places appropriate value on the imported syngas, and allows the results to be directly compared to other studies by accounting for all feedstocks. The stream flows into the financial model are for the F-T unit fully loaded; the impact of the IGCC syngas “swinging” between the two plants is addressed in the capacity factor. A sensitivity case was developed to compare the Concept 1 base case to a case where the syngas from the IGCC plant is dedicated to the F-T unit.
To develop an appropriate EPC cost for the F-T plant, the cost of the dedicated train was added to the allocated cost of gasification, coal handling, slurry preparation, and oxygen production to generate the syngas from the IGCC unit for 4 hours per day. Besides an increase in EPC cost, the power required to increase ASU load, power generated from extra radiant cooling, slag produced, and additional coal feed required were all taken into consideration. Including these changes into the financial model leads to slightly different entries relative to the numbers listed in Sections 3 and 4. None of these steps were necessary in Concept 2 since the plant is a stand-alone facility.
The values for most commodity inputs are based on previous analysis and information from utilities near the proposed plant site. The coal price of $54.77/short ton (~$2.20/MMBTU) is based on information from utilities planning future coal plant investments. An electricity value of $35/MWh is used as a conservative basis, assuming the continued availability of low cost power in the region. Finally, the slag and sulfur produced are assumed to have little value, based on previous coal gasification studies performed by the team.
The strategy used to assign values to the F-T liquids product differed from that used for the other commodities. Because the liquid product could have different values based upon crude prices and the eventual end user, a range of potential liquid product values was used to estimate potential results. As a starting point, the average value for diesel and gasoline in the U.S. Midwest (data obtained for Petroleum Area Defense District (PADD) 2 from the U.S. DOE) from January 2005 to June 2006 was used with some modification:
• For diesel fuel, the wholesale PADD 2 low sulfur (LS) diesel price was directly entered into the model. Because of the additional refinement performed in the F-T

Final Report 64
plant, the F-T diesel quality should closely mirror that of LS diesel fuel ready for transportation use. Although the F-T diesel has additional qualities (namely high cetane, low aromatics, and low sulfur) that may lead to a premium price, this assumption cannot be confirmed at this time without further market analysis.
• The F-T naphtha was significantly discounted from PADD 2 conventional gasoline to account for the low octane value of the stream. Unlike the F-T diesel stream, the naphtha cannot directly be used as a transportation fuel, and will require blending or other upgrading to make it suitable for transportation use. While the low sulfur content of the stream is favorable to the gasoline pool, the very low octane value (~40) will outweigh this benefit. Initial value estimates were derived from a model incorporating refinery LP runs and the operating cost to upgrade the F-T naphtha. This was later refined after consultation with utilities and petroleum refiners to develop the $1.30/gallon estimate. Individual refiners will value the stream differently based on their gasoline pool constraints.
5.2 Results and Sensitivities
The general methodology followed for performing the financial analysis was outlined in Section 5.1. Inputs were placed into the PSFM Version 5.0.5 to obtain the results discussed in this section. Appendix C provides the model inputs for both cases considered.
The plant EPC cost entered into the financial model was taken from the analysis done in Section 4. “Bare Erected Cost” was combined with the engineering and home office fees provided in the cost estimate to produce the EPC cost. On top of these costs, a 26% project contingency, 25% process contingency on the F-T synthesis section of the plant, 2% start-up cost, and 10% owner’s cost were included to reflect the total plant costs. As mentioned in Section 5.1, the cost and impacts to the plant from the syngas imported from the IGCC train in Concept 1 were included in the financial model. Since Section 4 only shows costs for the items dedicated to the F-T plant, the entries listed in this section for Concept 1 will differ.
Table 5-1 presents the results of the financial analysis for both concepts.
Table 5-1 Financial Model Results
Concept 1 Co-located
Plant
Concept 2 Stand-Alone
Plant
Relative Difference, Concept 2 vs.
Concept 1
Return on Investment, % 11.9 14.3 20%
Net Present Value, $MM, 12% discount rate -1.84 84.8
Payback Period, years 9 7 -22%
Final Report 65
Concept 2 produces more favorable financial results than Concept 1, due to its economy of scale advantage and higher capacity factor. While there are integration benefits in Concept 1 by being sited next to an IGCC facility, these benefits are not significant enough to outweigh the disadvantages. In the financial model developed for Concept 1, the integration benefits are represented by not scaling the fixed O&M costs for the syngas imported from the IGCC plant. While scaling was performed on EPC costs to properly account for the value of the syngas, fixed O&M costs will be constant regardless of where the IGCC syngas is used. Once capacity factor is taken into account, Concept 2 requires less investment per unit of product export, as shown in Table 5.2.
Because the design basis has the syngas from the IGCC unit “swinging” to the F-T unit only 4 hours per day, major sections of the plant, including the gas cooling, gas cleaning, F-T synthesis, and power generation units, will be nearly 30% unloaded for most of the day. This under-utilization hampers process economics. However, when considered relative to the economics of an IGCC facility that does not swing its production, this may still be attractive. A broader analysis of an integrated facility should be performed to determine if this overall configuration is desired. Also, alternative F-T process designs that take syngas from other locations in the IGCC train should be considered to potentially reduce the amount of F-T train equipment sparing.

Final Report 66
Table 5-2 Concept Performance Comparison
Concept 1 Co-located
Plant
Concept 2 Stand-Alone
Plant
Change
FT Liquids (Bbl/Day) 8,320 9,609 15%
Power Export (MW) 30.66 39.5 29%
CO2 (MMSCFD) 79 91 15%
Sulfur (TPD) 106 123 16%
Slag (TPD) 3896 450 16%
Capacity Factor (%) 64.8 85.0 31%
Maximum Coal Feed (TPD)
3,683 6 4,254 16%
EPC Cost ($MM) 4756 617 30%
O&M Cost ($MM) 39 52 33%
The amount of export power available in Concept 2 does not scale at the same rate due to the availability of two dedicated gasifier trains and the greater amount of auxiliary power demand. Turbines are only available in specific sizes, and the type selected for each concept was deemed most appropriate. As additional work is performed in Concept 1 on the co-located facility, it may be determined that additional integration benefits are possible. This is an EPC cost sensitivity that will be addressed in Section 5.2.1.
Table 5-3 breaks down the total plant cost including EPC costs, fees, start-up costs, and costs incurred from project financing for both concepts. The additional fees are the same for both concepts, allowing a direct comparison on an equivalent financial basis.
6 These numbers are slightly different than what is presented in Sections 3 and 4 to take into account the syngas imported from the IGCC plant to the CTL plant.

Final Report 67
Table 5-3 Total Plant Costs
Construction/Project Cost (in Thousand Dollars)
Capital Costs Concept 1 Concept 2
EPC Costs $474,834 $617,131
Initial Working Capital $10,197 $15,450
Project Contingency $123,534 $159,525
Process Contingency (FT Liquids Synthesis) $18,688 $20,970
Start-up (% of EPC Costs) $9,467 $12,343
Initial Debt Reserve Fund $0 $0
Owner's Cost (in thousand dollars) $47,483 $61,713
Additional Capital Cost $0 $0
Total Capital Costs $684,233 $887,132
Financing Costs
Interest During Construction $56,386 $73,107
Financing Fee $12,220 $15,844
Additional Financing Cost $0 $0
Total Financing Costs $68,606 $88,951
Total Project Cost $752,839 $976,083
Sources of Funds
Equity $338,778 $439,238
Debt $414,061 $536,845
Total Sources of Funds $752,839 $976,083
5.2.1 Performance and Cost Sensitivities
With the exception of plant feed and output rates, all financial model inputs were varied to determine the project financial sensitivities. The range of model input variables used in the sensitivity analysis is listed in Table 5-4. Input changes for the model were based on previous sensitivity analysis and commodity input ranges. ROI sensitivity was evaluated using a ±25% change in the unit input. The variables and their impact on the

Final Report 68
financial outputs were then ranked to determine the model inputs of highest sensitivity, as shown in Figure 5-3. Since the financial basis was not varied between the two concepts, the sensitivity responses are very similar, and only results for Concept 2 are shown.
Table 5-4 Range of Values Used in the Sensitivity Analysis
(+25%) (-25%)High Low
Model Inputs Base Range Range
Delivered Coal Price ($/ton) 54.77 68 41Electric Tariff ($/MWh) 35 44 26Naphtha ($/gallon) 1.30 1.63 0.98Diesel ($/gallon) 1.96 2.45 1.47Sulfur ($/ton) 10 12.5 7.5
EPC Cost ($MM) 617 771 463O&M Cost ($MM) 51.6 64.6 38.7Loan Interest Rate (%) 8 10 6Availability (%) 85 100 64Project Life (Yrs) 30 38 23Debt Financing (%) 55 69 41Tax Rate (%) 40 50 30
Figure 5-3 Concept 2 - Relative Sensitivities of Major Plant Inputs, +/-25%
Change in ROI, +/- 25% Model Inputs
-5 -4 -3 -2 -1 0 1 2 3 4 5
Sulfur ($/MT)
Electric Tariff ($/MWh)
Project Life (Yrs)
Loan Interest Rate
O&M Cost (% of EPC)
Tax Rate
% Debt Financing
Delivered Coal Price ($/ton)
Naphtha ($/Gallon)
EPC Cost ($MM)
Availability
Diesel ($/Gallon)
Change in ROI (Percentage Points)

Final Report 69
Plant capacity factor and EPC cost were found to have very strong impacts on plant financial returns (note that capacity factor was not allowed to exceed 100% in Figure 5-3). This is a common sensitivity found in many gasification studies and comes as no surprise; reliable plant operation and controlling plant costs are very important to a successful project. The model sensitivity to changes in capacity factor explains much of the reason why Concept 1 has worse financial results when compared to Concept 2.
The value of the main products, F-T naphtha and diesel, were also found to strongly impact the financial results. In fact, these variables may impact the results even more strongly once the range of potential values is taken into consideration. Naphtha and diesel prices are more volatile and less predictable than many other process variables, and are likely to vary more than the ±25% displayed in Figure 5-3. The amount of debt financing and tax rate used were also found to be important, although less so than plant cost, capacity factor, and F-T liquids value. Greater investigation into policies that could impact the financial basis will be explored in Section 5.2.2.
Liquids prices exhibit significant price volatility, as shown in Figure 5-4, which plots historic values for West Texas Intermediate (WTI) crude oil, gasoline, and low-sulfur diesel in PADD 2.
Figure 5-4 PADD 2 Petroleum Product Values7
PADD 2 Finished Product and WTI Values
0
20
40
60
80
100
120
Jan-00 Jul-00 Jan-01 Jul-01 Jan-02 Jul-02 Jan-03 Jul-03 Jan-04 Jul-04 Jan-05 Jul-05 Jan-06
$/B
arr
el
PADD 2 Gasoline PADD 2 LS Diesel WTI
2005 to 2006 WTI Average
2000 to 2006 WTI Average
7 Information from the US Department of Energy, Energy Information Agency, available at www.eia.doe.gov

Final Report 70
Financial results can vary considerably depending on the timeframe chosen for pricing F-T liquids. In choosing the 2005-2006 timeframe as the basis for both concepts – in which crude oil prices are high by historic standards – F-T liquids prices are 60 to 70 cents a gallon higher when compared to the average of prices this decade. Recent analysis of the petroleum market indicates that the 2005-2006 price average of near $60/barrel for crude oil may represent a new basis for the market, rather than previous historic averages.8 The impact of petroleum price on plant ROI can be seen in Figure 5-5. A correlation based on historic spreads was established between the F-T liquids price and WTI to develop this figure.
Figure 5-5 Impact of Petroleum Prices on Plant ROI
-10
-5
0
5
10
15
20
25 35 45 55 65 75
WTI Crude Price ($/Barrel)
RO
I (%
)
Concept 2 Concept 1
Base Case(2005 -2006 Avg.)
Alternate Case(2000 -2006 Avg.)
Using the 2000-2006 average ($38/barrel for WTI) rather than the 2005-2006 average reduces the plant ROI by about 12 percentage points for both concepts, and emphasizes how critical product prices can be in assessing project viability. Discussions should be held with local refiners and product distributors to determine how they would value the F-T product streams relative to crude oil, gasoline, or diesel. Once this information is obtained, more refined estimates can be made to determine if the price level necessary to make the plant economically attractive can be obtained.
As mentioned above, the plant EPC cost and capacity factor also has a large impact on the ROI. The base case financial analysis includes a 26% project contingency plus an additional 25% process contingency on the F-T island in an attempt to estimate EPC
8 Hargreaves, Steven, “Why Oil Won’t Go Below $60”, Money Magazine, 2 August 2006, available at http://money.cnn.com/2006/08/01/news/economy/oil_floor/index.htm

Final Report 71
uncertainty at this stage of the design. Because other model inputs are based on a percentage of the plant EPC cost, changes in this variable has a multiplier impact on the overall economic results. In a capital investment of this magnitude, developing the most accurate estimate for the plant cost is critical to understanding the project economics.
Figure 5-6 shows the relationship between plant capacity factor and project ROI. The range of expected availabilities for the two cases is different due to the intentional limitation of syngas from the IGCC plant in Concept 1. Even if the F-T plant was able to run 100% of the time (instead of the 85% expected), the maximum capacity factor due to IGCC syngas being kept out of the plant 20 hours a day is about 76%. A sensitivity considering full loading of the F-T plant by allocating additional costs from the IGCC facility is addressed later in this section.
Figure 5-6 Effect of Capacity Factor on Project ROI
0
2
4
6
8
10
12
14
16
18
20
45 55 65 75 85 95
Availability (%)
RO
I (%
)
Concept 2 Concept 1
Base Case (Concept 2)
Base Case (Concept 1)
Concept 1 cannot exceed 75% availability without additional IGCC syngas
Reliable operation is critical to capital cost recovery. Long downtimes will significantly hamper overall project economics over a 30-year project life. However, plant availabilities as low as 70% in Concept 2 will still provide a plant ROI of roughly 12%, just over 2 percentage points lower than the base case. Concerns over gasification or F-T plant performance, therefore, should not be a major hindrance to project development, since potentially acceptable rates of return can be achieved even with lower than expected capacity factor for this plant.
As an alternative to the “swing” case presented in Concept 1, a sensitivity was performed estimating the economic performance of a similar plant that is fully loaded 24 hours a day. The major changes to the financial model include higher plant capacity factor and an increase in EPC cost due to a greater allocation of IGCC plant costs to the F-T system. Table 5-5 presents the results for this alternative case.

Final Report 72
Table 5-5 Financial Results, Concept 1 Without Swing
Base Case Co-located Plant
No Swing Co-located Plant
Change
Capacity Factor (%) 64.8 85.0 31%
EPC Cost ($MM) 474.8 549.8 16%
ROI (%) 11.9 13.7 15%
NPV ($MM, 12%) -1.8 57.2
As a result of this change, the economics of the F-T plant alone become more attractive. As shown in Figure 5.3, the plant economics are more sensitive to changes in capacity factor than to changes in EPC costs. Provided the change in capacity factor is proportional to the change in EPC cost, increasing capacity factor at the expense of EPC cost is worthwhile. However, this operating regime would not be chosen unless it had benefits to the co-located IGCC/F-T plant as a whole. This type of operation must be considered in the overall context of the complete facility, which is outside the scope of this analysis. Another potential downside to the “swing” configuration is that this type of scheme will lead to major daily operational changes due to the different syngas flowrates. The impact this will have on both the IGCC train and the F-T reactors should be evaluated.
The tornado diagram in Figure 5-3 indicates that the project finance inputs are robust. The rates of return do not change by more than 4 percentage points regardless of the variables changed, when using the base case values for F-T liquids. The three items most critical to the financial analysis are EPC costs, capacity factor and F-T liquids value, which can vary significantly based on plant design and market conditions. These variables should be carefully examined when considering the range of financial outcomes. Other inputs, while important to a complete picture of a facility’s financial potential, have lesser impacts.
5.2.2 Policy Considerations
The analysis evaluated several financial scenarios to reflect various policy initiatives that may support project development. The scenarios were developed through consultation with the analysis team and the project sponsors. The base case PSFM models were changed under each scenario to reflect the different conditions that would result from application of the policy incentives.
Four policy scenarios were evaluated independently. While project developers could conceivably take advantage of multiple incentive programs, the point of this analysis was to examine how each policy option independently impacts project economics.

Final Report 73
• State Bonding Initiative – Under this scenario, the state of West Virginia assists in project financing by issuing bonds to raise project funds. Because the debt being used by the project is now supported by the state, the cost of capital is lowered. It is assumed that the state does not issue bonds for more than the amount of debt estimated in the base case, so the total amount of debt financing, 55%, remains unchanged. IMPACT: Interest rate on debt financing lowered from 8% to 6%.
• Subsidy on F-T Liquids – Per the Energy Policy Act (EPAct) of 2005, tax credits could be available for fuel produced from “unconventional sources,” including coal. This provision modifies Internal Revenue Code (IRC) Section 29 with Section 45K by allowing credits based on a sliding scale relative to the price of crude oil. Additional policy modifications may be required to make this section applicable for all F-T plants, since eligibility is based on the start-up year of the plant. For simplicity, an average credit value was used for the life of the project, based on the value of crude assumed in the base case. IMPACT: A $6 tax credit per barrel of FT liquids produced. A sensitivity case was also performed using the 50 cent/gallon ($21/barrel) incentive included in the 2005 Federal Transportation Bill (H. Res 109-203, Title XI, Section 11113(d)).
• Federal Loan Guarantees – Another component of EPAct 2005 are a series of loan guarantees for advanced coal projects. Section 1703(c) specifically outlines benefits for Industrial Gasification projects where electrical output is less than 65% of the useful product, such as a small-scale F-T plant. Loan guarantees will not only lower the interest rate used for debt financing, but could also allow a greater portion of the project to be financed through debt. Assumptions for the changes in each of these variables are based on the Rosenberg paper referenced earlier. IMPACT: Interest rate on debt financing lowered from 8% to 6%, and debt/equity ratio increased to 80/20 from 55/45.
• Investment Tax Credit (ITC) – The final EPAct item evaluated is the 20% investment tax credit allowed per the modifications to IRC 48B. This tax credit is applied in the first year of plant operation, and cannot exceed $130MM ($350MM of total funding is available for all projects). IMPACT: 20% investment tax credit on the total plant capital costs, reflected in the first year of plant operation.
Table 5-6 presents the results of the analysis, listing both the ROI and NPV ($MM) for a 12% discount rate, along with the change from the base case.

Final Report 74
Table 5-6 Financial Impacts on Evaluated Policies
Concept 1 Concept 2
ROI (change) NPV (change) ROI (change) NPV (change)
Base Case 11.9 -1.8 14.3 84.8
State Bonds 12.7 (+0.8) 19.5 (+21.3) 15.1 (+0.8) 111.6 (+26.8)
FT Subsidies 14.1 (+2.2) 57.7 (+59.5) 16.8 (+2.5) 175.0 (+90.2)
Loan Guarantees 16.8 (+4.9) 75.8 (+77.6) 21.1 (+6.8) 186.8 (+102.0)
ITC 13.9 (+2.0) 45.1 (+46.9) 16.5 (+2.2) 145.7 (+60.9)
The use of loan guarantees in project financing has the most positive impact on the overall plant economics. It is the change in the debt-to-equity ratio, and not the change in the loan interest rate, that is responsible for the majority of the benefit. The “State Bonds” case makes this point clear: reducing the interest rate on project debt only without changing the amount of debt financing will only increase the ROI by roughly one percentage point. For projects with strongly positive cash flows throughout the life of the project, reducing the up-front capital required by increasing the amount of debt will have a greater impact than reducing the interest payments. While the interest payments are higher in an 80% debt case relative to a 55% case, the increase in this factor is much lower relative to the savings gained by reducing initial capital outlays.
The investment tax credits and F-T subsidies outlined in the EPAct have similar impacts on the ROI. F-T subsidies typically have a greater impact on the project NPV by reducing the net project tax burden throughout the life of the project, rather than just at the beginning. Subsidies are good for hedging against crude price volatility; the EPAct credit, since it varies based on the price of crude oil, provides an effective hedge. The credit will be higher during times of low crude price to protect project developers against price uncertainty. Because of the major sensitivity that these concepts have to the value of the F-T liquids, policies that reduce the price volatility risk would likely be of great interest to project developers.
The incentives provided by Title XI of the Federal Transportation Bill were also evaluated. This bill provides a 50 cent/gallon tax credit for any liquid fuel derived from coal. While the current legislation phases the incentive out in 2009, a sensitivity case was run evaluating the impact of the credit extended throughout the life of the plant, assuming that all diesel and naphtha is used as a transportation fuel. Using the assumption that any credits exceeding the tax burden will lead to a refund, the subsidies

Final Report 75
increase the base case ROI by roughly 8 percentage points in both concepts. Under this scenario, the tax burden to the project owner is cut by about 85% due to the subsidies. Representing the credit in this fashion likely reflects the greatest level of potential subsidies available, since it is unclear if the credits will be extended and how the IRS will handle credits exceeding the tax burden. NPVs for both Concepts under this sensitivity are the highest of any case evaluated, $206MM for Concept 1 and $400MM for Concept 2.

Final Report 76
6. CONCLUSIONS • Small-scale CTL plants using bituminous coal can be economical in specific
applications. Two plant design concepts, producing roughly 8,000 to 10,000 bbl/day of F-T liquids, can achieve ROIs greater than 12% under baseload operating conditions for a site in southwestern West Virginia. Both concepts are self-sufficient in terms of electric power, generating excess power for export to the grid.
• Both of the conceptual designs evaluated are technically feasible using equipment that has been demonstrated at commercial scale, although no commercial CTL plants are currently operating in the U.S.
• Both conceptual designs use high sulfur bituminous coal to produce distillate and naphtha liquid pools via indirect coal liquefaction (F-T process). With the addition of additives, the distillate can be converted to a saleable diesel fuel. The naphtha liquids can be shipped to a refinery for upgrading into gasoline or directly marketed as a chemical feedstock.
• Capital cost estimates were developed for both concepts at the Total Plant Cost (TPC) level, which includes equipment, materials, labor, indirect construction costs, engineering and contingencies. The stand-alone plant design (Concept 2), which produces 15% more F-T liquids than the co-located plant design (Concept 1), has a 33% higher Total Plant Cost (TPC). TPC costs, assuming a 26% project contingency and a 25% process contingency for the F-T plant, are $598 million and $798 million, respectively. EPC costs for Concepts 1 and 2, which encompass the bare erected cost and engineering and home office fees, are $460 million and $620 million, respectively.
• First year operations and maintenance (O&M) estimates for Concept 1 are $75.7 million per year, $24.8 million for fixed O&M and $50.9 million for variable O&M. For Concept 2, first year O&M estimates are $115.2 million per year, $32.7 million for fixed O&M and $82.5 million for variable O&M. Variable O&M costs include the cost of coal and credits for sale of export power.
• Assuming a delivered coal price of $54.77/ton and a CTL plant capacity factor of 65%, the financial analysis indicates a 11.9% return on investment and a -$1.8 million net present value for Concept 1. The low capacity factor is due to no syngas being provided by the IGCC plant for 20 hours/day. A 14.3% return on investment and a $85 million net present value is expected for Concept 2.
• Project viability depends heavily on future crude oil price scenarios. At crude oil prices greater than $55/bbl, both concepts achieve ROIs greater than 10%. Project developers should weigh acceptable risk positions against future price trends in assessing project viability. Crude oil prices greater than $55/bbl are at the low end of price trends in 2005-2006, but above average price levels over the 2000-2006 time frame.
• State and Federal policy actions can impact expected ROIs for small-scale F-T plants. Loan guarantees have the largest impact, increasing the ROI by 5 percentage points or

Final Report 77
more from the base case for both F-T plant concepts. Investment tax credits provide a two percentage point increase in ROI, while state bonds provide less than a one percentage point benefit. F-T liquid subsidies could increase the ROI by two to eight percentage points depending on their magnitude and how the incentives are credited.
6.1 Recommendations for Further Study
Several ideas emerged from this preliminary assessment as recommendations for follow-up studies:
• Evaluate plant performance and economics assuming carbon capture/sequestration is added to the plant design.
• Evaluate plant performance and economics in Concept 1 assuming that the syngas from the IGCC plant is fully cleaned before it is exported to the CTL plant.
• Evaluate plant performance and economics in Concept 1 assuming that the air separation unit at the CTL plant is sized to meet the needs of the IGCC facility and that oxygen and nitrogen are sold across the fence to the IGCC facility.
• Evaluate plant performance and economics in Concept 1 assuming a range of selling prices on the basis of production costs for the syngas delivered from the IGCC plant rather than prorating part of the IGCC capital costs.
• Evaluate plant performance and economics for both concepts using Rectisol in place of Selexol and eliminating the COS hydrolysis step prior to sulfur removal.
• Evaluate plant performance and economics for both concepts using refrigerated Selexol process for sulfur removal to reduce size and cost of the sulfur recovery unit.
• Quantify effluent discharge from the CTL plant and compare to new, stricter limits regulating discharges to the Ohio River.
• Generate and evaluate conceptual designs that produce zero effluent discharge.
• Evaluate the technical feasibility of ramp up and turndown of CTL plant production rate to accommodate variations in the availability of syngas from the IGCC plant.

Final Report 78
APPENDICES

Final Report 79
APPENDIX A DETAILED EQUIPMENT LISTS FOR CONCEPT 1
ACCOUNT 1 COAL HANDLING
ACCOUNT 1A COAL RECEIVING AND HANDLING
Equipment No.
Description Type Design Condition
Qty
1 Bottom Trestle Dumper and Receiving Hoppers
N/A 125 ton 1
2 Feeder Vibratory 125 tph 1
3 Conveyor No. 1 54" belt 1000 tph 1
4 Conveyor No. 2 54" belt 1000 tph 1
5 As-Received Coal Sampling System
Two-stage N/A 1
6 Reclaim Hopper N/A 40 ton 1
7 Feeder Vibratory 125 tph 1
8 Conveyor No. 3 48" belt 125 tph 1
9 Crusher Tower N/A 125 tph 1
10 Coal Surge Bin w/ Vent Filter Compartment 200 ton 2
11 Crusher Granulator reduction
6"x0 - 3"x0 2
12 Crusher Impactor reduction 3"x0 - 1¼"x0 2
13 As-Fired Coal Sampling System
Swing hammer 1
14 Conveyor No. 4 48" belt 125 tph 1
15 Coal Silo w/ Vent Filter and Slide Gates
N/A 2,500 ton 1

Final Report 80
ACCOUNT 2 COAL PREPARATION AND FEED
ACCOUNT 2A FUEL SLURRY PREPARATION AND FUEL INJECTION
Equipment No.
Description Type Design Condition
Qty
1 Vibratory Feeder 125 tph 1
2 Conveyor No. 1 Belt 125 tph 1
3 Conveyor No. 2 Belt 125 tph 1
4 Rod Mill Feed Hopper Vertical, double hopper
100 tons 1
5 Vibratory Feeder 125 tph 2
6 Weight Feeder Belt 125 tph 2
7 Rod Mill Rotary 125 tph 2
8 Slurry Water Storage Tank with Agitator
Field erected 100,000 gal 2
9 Slurry Water Pumps Horizontal, centrifugal 1,500 gpm 2
10 Rod Mill Product Tank with Agitator
Field erected 100,000 gal 2
11 Rod Mill Product Pumps Horizontal, centrifugal 2,500 gpm 2
12 Slurry Storage Tank with Agitator
Field erected 350,000 gal 2
13 Centrifugal Slurry Pumps Horizontal, centrifugal 3,000 gpm 2
14 Positive Displacement Slurry Pumps
Progressing cavity 600 gpm 2
15 Slurry Blending Tank with Agitator
Field erected 100,000 gal 2
16 Slurry Blending Tank Pumps
Horizontal, centrifugal 450 gpm 2

Final Report 81
ACCOUNT 3 FEEDWATER AND MISCELLANEOUS SYSTEMS AND
EQUIPMENT
ACCOUNT 3A CONDENSATE AND FEEDWATER SYSTEM
Equipment No.
Description Type Design Condition Qty
1 Condensate Storage Tank
Vertical, cylindrical, outdoor
10,000 gal 2
2 Condensate Pumps Vertical canned 250 gpm @ 400 ft 2
3 Deaerator (integral with HRSG)
Horizontal spray type 100,000 lb/h 200°F to 240°F
2
4 Low-Pressure Feed Pump
Horizontal centrifugal single stage
100 gpm/1,000 ft 1
5 High-Pressure Feed Pump
Barrel type, multi-staged, centrifugal
250 gpm @ 5,500 ft & 350 gpm @ 1,700 ft
2

Final Report 82
ACCOUNT 3B MISCELLANEOUS EQUIPMENT
Equipment No.
Description Type Design Condition
Qty
1 Auxiliary Boiler Shop fabricated, water tube
400 psig, 650°F 70,000 lb/h
1
2 Service Air Compressors
Reciprocating, single stage, double acting, horizontal
100 psig, 750 cfm
1
3 Instrument Air Dryers Duplex, regenerative 750 cfm 1
4 Service Water Pumps Horizontal centrifugal, double suction
200 ft, 1,200 gpm
2
5 Closed Cycle Cooling Water Pumps
Horizontal, centrifugal 70 ft, 500 gpm 1
6 Fire Service Booster Pump
Two-stage horizontal centrifugal
250 ft, 1,200 gpm
1
7 Engine-Driven Fire Pump
Vertical turbine, diesel engine
350 ft, 1,000 gpm
1
8 Raw Water Pumps SS, single suction 60 ft, 300 gpm 1
9 Filtered Water Pumps SS, single suction 160 ft, 120 gpm 1
10 Filtered Water Tank Vertical, cylindrical 15,000 gal 1
11 Makeup Demineralizer Anion, cation, and mixed bed
70 gpm 1
12 Sour Water Stripper System
Vendor supplied 50,000 lb/h sour water
1
13 Liquid Waste Treatment System
Vendor supplied 200 gpm 1

Final Report 83
ACCOUNT 4 GASIFIER AND ACCESSORIES
ACCOUNT 4A GASIFICATION
Equipment No.
Description Type Design Condition
Qty
1 Gasifier and Associated Equipment
Pressurized slurry-feed, entrained bed
2,500 dry ton/day/ 815 psia
1
2 Syngas Cooler Vertical Downflow Radiant Heat Exchanger with Outlet Quench Chamber
500,000 lb/hr syngas
1
3 Syngas Scrubber Vertical, upflow 500,000 lb/h 1
4 Flare Stack Self-supporting, carbon steel, stainless steel top, pilot ignition
500,000 lb/h, medium-Btu gas
1
ACCOUNT 4B AIR SEPARATION PLANT
Equipment No.
Description Type Design Condition
Qty
1 Air Compressor Centrifugal, multi-stage
50,000 scfm, 199 psia discharge pressure
2
2 Cold Box Vendor Design 2,500 ton/day O2 1
3 Oxygen Compressor Centrifugal, multi-stage
20,000 scfm, 1,000 psia discharge pressure
2
4 Nitrogen Compressor Centrifugal, multi-stage
50,000 scfm, 303 psia discharge pressure
1

Final Report 84
ACCOUNT 5 SYNGAS CLEANUP
Equipment No.
Description Type Design Condition Qty
1 COS Hydrolysis Reactor Packed bed 750 psia, 410°F 1
2 Mercury Removal Sulfated Carbon Bed
600,000 lb/hr syngas, 750 psia
1
3 Acid Gas Absorber Packed bed 8.5 ft OD x 104 ft 1
4 Acid Gas Stripper Packed bed 8.5 ft OD x 96 ft 1
5 Lean/Rich Exchanger Shell & tube 140 x 106 Btu/h (total)
1
6 Stripper Reboiler Shell & tube 40 x 106 Btu/h 1
7 Lean Pump Horizontal, centrifugal
3,000 gpm 1,000 hp
1
8 Rich Pump Horizontal, centrifugal
2,000 gpm 100 hp
1
9 Syngas Expansion Turbine-Generator
RotoFlow 550,000 lb/hr 7,100 kW
1
10 Sulfur Plant Claus plant 95 long ton/day 1

Final Report 85
ACCOUNT 5b FISCHER-TROPSCH PROCESS
Equipment No.
Description Type Design Condition Qty
1 Sulfur Polisher ZnO Packed Bed 600,000 lb/hr Syngas, 719 psia
1
2 F-T Synthesis Reactor Slurry Reactor 300,000 lb/hr Syngas, 350 psia, 5,000 BPD Liquids
2
3 CO2 Removal Process Proprietary Amine 4,600 TPD CO2 1
4 Hydrocarbon Recovery Fractionator 150,000 lb/hr 1
5 Hydrogen Recovery PSA 1,600 lb/hr H2 1
6 Recycle Compressor Reciprocal 60,000 lb/hr 1
7 Autothermal Reactor Self-heating Catalytic
30,000 lb/hr 1
8 Naphtha Hydrotreating Catalytic Bed 18,000 lb/hr 1
9 Distllate Hydrotreating Catalytic Bed 18,000 lb/hr 1
10 Wax Hydrotreating Catalytic bed 55,000 lb/hr 1

Final Report 86
ACCOUNT 6 COMBUSTION TURBINE AND AUXILIARIES
Equipment No.
Description Type Design Condition
Qty
1 27 MWe Gas Turbine Generator
Axial flow, single spool based on GE LM2500
2200°F rotor inlet temp.; 28.0:1 pressure ratio, 154 lb/sec
1
2 Enclosure Sound attenuating 85 dB at 3 ft 1
3 Air Inlet Filter/Silencer Two-stage 3.0 in. H2O pressure drop, dirty
1
4 Starting Package Electric motor, torque converter drive, turning gear
500 hp, time from turning gear to full load ~30 minutes
1
5 Mechanical Package CS oil reservoir and pumps dual, vertical cartridge filters, air compressor
1
6 Oil Cooler Air-cooled, fin fan 1
7 Electrical Control Package
Distributed control system
1 sec. update time 8 MHz clock speed
1
8 Generator Glycol Cooler Air-cooled, fin fan 1
9 Compressor Wash Skid 1
ACCOUNT 7 WASTE HEAT BOILER, DUCTING, AND STACK
Equipment No.
Description Type Design Condition Qty
10 Heat Recovery Steam Generator
Drum, multi-pressure, with economizer section and integral deaerator
HP-1015 psia/ 1000°F 100,000 lb/h IP-385 psia/1000°F 100,000 lb/h
1
2 Stack Carbon steel plate, type 409 stainless steel liner
50 ft high x 6 ft dia. 1

Final Report 87
ACCOUNT 8 STEAM TURBINE GENERATOR AND AUXILIARIES
Equipment No.
Description Type Design Condition Qty
1 55 MW Steam Turbine Generator
Multi-pressure 1000 psig 1000°F/1000°F
1
2 Bearing Lube Oil Coolers
Plate and frame 2
3 Bearing Lube Oil Conditioner
Pressure filter closed loop
1
4 Control System Digital electro-hydraulic 1000 psig 1
5 Generator Coolers Plate and frame 2
6 Hydrogen Seal Oil System
Closed loop 1
7 Surface Condenser Single pass, divided waterbox
100,000 lb/h steam @ 2.4 in. Hga
1
ACCOUNT 9 COOLING WATER SYSTEM
Equipment No.
Description Type Design Condition Qty
1 Circulating Water Pumps
Vertical wet pit 10,000 gpm @ 60 ft 2
2 Cooling Tower Mechanical draft 30,000 gpm 1

Final Report 88
ACCOUNT 10 SLAG RECOVERY AND HANDLING
Equipment No.
Description Type Design Condition Qty
1 Slag Quench Tank Water bath 12 tph 1
2 Slag Crusher Roll 12 tph 1
3 Slag Depressurizer Proprietary 12 tph 1
4 Slag Handling Tank Horizontal, weir 6 tph 2
5 Slag Conveyor Drag chain 6 tph 2
6 Slag Separation Screen
Vibrating 6 tph 1
7 Coarse Slag Conveyor
Belt/bucket 6 tph 1
8 Fine Ash Storage Tank
Vertical 15,000 gallons 1
9 Fine Ash Transfer Pumps
Horizontal/centrifugal 75 gpm 2
10 Storage Bin Vertical 1,500 tons 1
11 Unloading Equipment Telescoping chute 25 tph 1

Final Report 89
APPENDIX B DETAILED EQUIPMENT LISTS FOR CONCEPT 2
ACCOUNT 1 COAL HANDLING
ACCOUNT 1A COAL RECEIVING AND HANDLING
Equipment No.
Description Type Design Condition
Qty
1 Bottom Trestle Dumper and Receiving Hoppers
N/A 100 ton 2
2 Feeder Vibratory 100 tph 2
3 Conveyor No. 1 54" belt 1000 tph 2
4 Conveyor No. 2 54" belt 1000 tph 2
5 As-Received Coal Sampling System
Two-stage N/A 2
6 Reclaim Hopper N/A 40 ton 2
7 Feeder Vibratory 100 tph 2
8 Conveyor No. 3 48" belt 100 tph 2
9 Crusher Tower N/A 100 tph 2
10 Coal Surge Bin w/ Vent Filter
Compartment 200 ton 4
11 Crusher Granulator reduction
6"x0 - 3"x0 4
12 Crusher Impactor reduction 3"x0 - 1¼"x0 4
13 As-Fired Coal Sampling System
Swing hammer 2
14 Conveyor No. 4 48" belt 100 tph 2
15 Coal Silo w/ Vent Filter and Slide Gates
N/A 2,500 ton 2
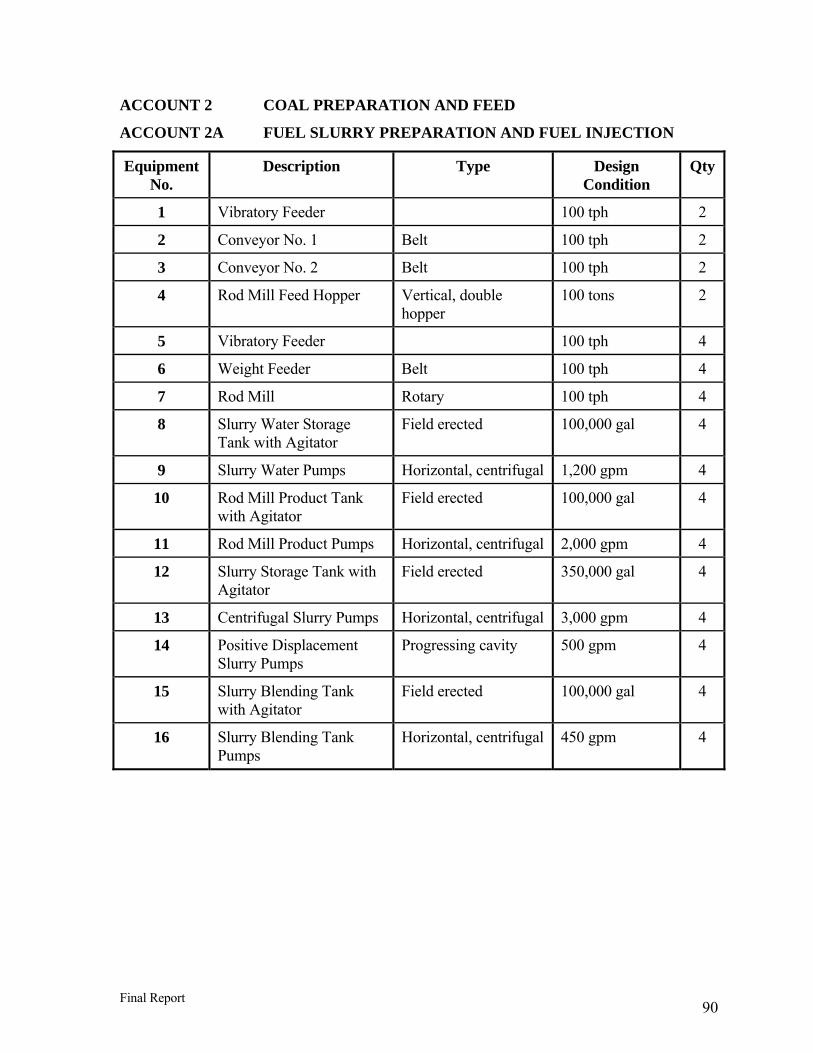
Final Report 90
ACCOUNT 2 COAL PREPARATION AND FEED
ACCOUNT 2A FUEL SLURRY PREPARATION AND FUEL INJECTION
Equipment No.
Description Type Design Condition
Qty
1 Vibratory Feeder 100 tph 2
2 Conveyor No. 1 Belt 100 tph 2
3 Conveyor No. 2 Belt 100 tph 2
4 Rod Mill Feed Hopper Vertical, double hopper
100 tons 2
5 Vibratory Feeder 100 tph 4
6 Weight Feeder Belt 100 tph 4
7 Rod Mill Rotary 100 tph 4
8 Slurry Water Storage Tank with Agitator
Field erected 100,000 gal 4
9 Slurry Water Pumps Horizontal, centrifugal 1,200 gpm 4
10 Rod Mill Product Tank with Agitator
Field erected 100,000 gal 4
11 Rod Mill Product Pumps Horizontal, centrifugal 2,000 gpm 4
12 Slurry Storage Tank with Agitator
Field erected 350,000 gal 4
13 Centrifugal Slurry Pumps Horizontal, centrifugal 3,000 gpm 4
14 Positive Displacement Slurry Pumps
Progressing cavity 500 gpm 4
15 Slurry Blending Tank with Agitator
Field erected 100,000 gal 4
16 Slurry Blending Tank Pumps
Horizontal, centrifugal 450 gpm 4

Final Report 91
ACCOUNT 3 FEEDWATER AND MISCELLANEOUS SYSTEMS AND
EQUIPMENT
ACCOUNT 3A CONDENSATE AND FEEDWATER SYSTEM
Equipment No.
Description Type Design Condition Qty
1 Condensate Storage Tank
Vertical, cylindrical, outdoor
20,000 gal 2
2 Condensate Pumps Vertical canned 400 gpm @ 400 ft 2
3 Deaerator (integral with HRSG)
Horizontal spray type 200,000 lb/h 200°F to 240°F
2
4 Low-Pressure Feed Pump
Horizontal centrifugal single stage
200 gpm/1,000 ft 1
5 High-Pressure Feed Pump
Barrel type, multi-staged, centrifugal
400 gpm @ 5,500 ft & 600 gpm @ 1,700 ft
2

Final Report 92
ACCOUNT 3B MISCELLANEOUS EQUIPMENT
Equipment No.
Description Type Design Condition
Qty
1 Auxiliary Boiler Shop fabricated, water tube
400 psig, 650°F 70,000 lb/h
1
2 Service Air Compressors
Reciprocating, single stage, double acting, horizontal
100 psig, 750 cfm
1
3 Instrument Air Dryers Duplex, regenerative 750 cfm 1
4 Service Water Pumps Horizontal centrifugal, double suction
200 ft, 1,200 gpm
2
5 Closed Cycle Cooling Water Pumps
Horizontal, centrifugal 70 ft, 500 gpm 1
6 Fire Service Booster Pump
Two-stage horizontal centrifugal
250 ft, 1,200 gpm
1
7 Engine-Driven Fire Pump
Vertical turbine, diesel engine
350 ft, 1,000 gpm
1
8 Raw Water Pumps SS, single suction 60 ft, 300 gpm 1
9 Filtered Water Pumps SS, single suction 160 ft, 120 gpm 1
10 Filtered Water Tank Vertical, cylindrical 15,000 gal 1
11 Makeup Demineralizer Anion, cation, and mixed bed
70 gpm 1
12 Sour Water Stripper System
Vendor supplied 50,000 lb/h sour water
1
13 Liquid Waste Treatment System
Vendor supplied 200 gpm 1

Final Report 93
ACCOUNT 4 GASIFIER AND ACCESSORIES
ACCOUNT 4A GASIFICATION
Equipment No.
Description Type Design Condition
Qty
1 Gasifier and Associated Equipment
Pressurized slurry-feed, entrained bed
2,500 dry ton/day/ 815 psia
2
2 Syngas Cooler Vertical Downflow Radiant Heat Exchanger with Outlet Quench Chamber
400,000 lb/hr syngas
2
3 Syngas Scrubber Vertical, upflow 400,000 lb/h 2
4 Flare Stack Self-supporting, carbon steel, stainless steel top, pilot ignition
400,000 lb/h, medium-Btu gas
2
ACCOUNT 4B AIR SEPARATION PLANT
Equipment No.
Description Type Design Condition Qty
1 Air Compressor Centrifugal, multi-stage
100,000 scfm, 199 psia discharge pressure
2
2 Cold Box Vendor Design 2,000 ton/day O2 2
3 Oxygen Compressor
Centrifugal, multi-stage
30,000 scfm, 1,000 psia discharge pressure
2
4 Nitrogen Compressor
Centrifugal, multi-stage
50,000 scfm, 303 psia discharge pressure
2

Final Report 94
ACCOUNT 5 SYNGAS CLEANUP
Equipment No.
Description Type Design Condition Qty
1 COS Hydrolysis Reactor
Packed bed 750 psia, 410°F 2
2 Mercury Removal Sulfated Carbon Bed
500,000 lb/hr syngas, 750 psia
2
3 Acid Gas Absorber Packed bed 8.5 ft OD x 104 ft 2
4 Acid Gas Stripper Packed bed 8.5 ft OD x 96 ft 2
5 Lean/Rich Exchanger Shell & tube 140 x 106 Btu/h (total) 2
6 Stripper Reboiler Shell & tube 40 x 106 Btu/h 2
7 Lean Pump Horizontal, centrifugal
3,000 gpm, 1,000 hp 2
8 Rich Pump Horizontal, centrifugal
2,000 gpm, 100 hp 2
9 Syngas Expansion Turbine-Generator
RotoFlow 450,000 lb/hr 6,000 kW
2
10 Sulfur Plant Claus plant 110 long ton/day 1

Final Report 95
ACCOUNT 5b FISCHER-TROPSCH PROCESS
Equipment No.
Description Type Design Condition Qty
1 Sulfur Polisher ZnO Packed Bed 500,000 lb/hr Syngas, 719 psia
2
2 F-T Synthesis Reactors Slurry Reactors 800,000 lb/hr Syngas, 350 psia
2
3 CO2 Removal Process Proprietary Amine 5,200 TPD CO2 1
4 Hydrocarbon Recovery Fractionator 175,000 lb/hr 1
5 Hydrogen Recovery PSA 1,850 lb/hr H2 1
6 Recycle Compressor Reciprocal 70,000 lb/hr 1
7 Autothermal Reactor Self-heating Catalytic
35,000 lb/hr 1
8 Naphtha Hydrotreating Catalytic Bed 21,000 lb/hr 1
9 Distllate Hydrotreating Catalytic Bed 21,000 lb/hr 1
10 Wax Hydrotreating Catalytic bed 65,000 lb/hr 1

Final Report 96
ACCOUNT 6 COMBUSTION TURBINE AND AUXILIARIES
Equipment No.
Description Type Design Condition Qty
1 34 MWe Gas Turbine Generator
Axial flow, single spool based on GE LM2500
2200°F rotor inlet temp.; 18.0:1 pressure ratio, 154 lb/sec
1
2 Enclosure Sound attenuating 85 dB at 3 ft 1
3 Air Inlet Filter/Silencer
Two-stage 3.0 in. H2O pressure drop, dirty
1
4 Starting Package Electric motor, torque converter drive, turning gear
500 hp, time from turning gear to full load ~30 minutes
1
5 Mechanical Package
CS oil reservoir and pumps, dual vertical cartridge filters, air compressor
1
6 Oil Cooler Air-cooled, fin fan 1
7 Electrical Control Package
Distributed control system
1 sec. update time 8 MHz clock speed
1
8 Generator Glycol Cooler
Air-cooled, fin fan 1
9 Compressor Wash Skid
1
ACCOUNT 7 WASTE HEAT BOILER, DUCTING, AND STACK
Equipment No.
Description Type Design Condition Qty
1 Heat Recovery Steam Generator
Drum, multi-pressure, with economizer section and integral deaerator
HP-1015 psia/ 1000°F 200,000 lb/h IP-385 psia/1000°F 200,000 lb/h
1
2 Stack Carbon steel plate, type 409 stainless steel liner
213 ft high x 10 ft dia. 1

Final Report 97
ACCOUNT 8 STEAM TURBINE GENERATOR AND AUXILIARIES
Equipment No.
Description Type Design Condition Qty
1 76 MW Steam Turbine Generator
Multi-pressure 1000 psig 1000°F/1000°F
1
2 Bearing Lube Oil Coolers
Plate and frame 2
3 Bearing Lube Oil Conditioner
Pressure filter closed loop 1
4 Control System Digital electro-hydraulic 1000 psig 1
5 Generator Coolers Plate and frame 2
6 Hydrogen Seal Oil System
Closed loop 1
7 Surface Condenser Single pass, divided waterbox
100,000 lb/h steam @ 2.4 in. Hga
1
ACCOUNT 9 COOLING WATER SYSTEM
Equipment No.
Description Type Design Condition (per each)
Qty
1 Circ. Water Pumps Vertical wet pit 20,000 gpm @ 60 ft 2
2 Cooling Tower Mechanical draft 20,000 gpm 2

Final Report 98
ACCOUNT 10 SLAG RECOVERY AND HANDLING
Equipment No.
Description Type Design Condition Qty
1 Slag Quench Tank Water bath 8 tph 2
2 Slag Crusher Roll 8 tph 2
3 Slag Depressurizer Proprietary 8 tph 2
4 Slag Handling Tank Horizontal, weir 4 tph 4
5 Slag Conveyor Drag chain 4 tph 4
6 Slag Separation Screen
Vibrating 4 tph 2
7 Coarse Slag Conveyor
Belt/bucket 4 tph 2
8 Fine Ash Storage Tank
Vertical 10,000 gallons 2
9 Fine Ash Transfer Pumps
Horizontal/centrifugal 50 gpm 4
10 Storage Bin Vertical 1,000 tons 2
11 Unloading Equipment Telescoping chute 20 tph 2

Final Report 99
APPENDIX C FINANCIAL MODEL ENTRIES
Financial Model Entries—Plant Inputs
Project Name Concept 1 Concept 2
Project Location West Virginia West Virginia
Primary Output/Plant Application (Options: Power, Multiple Outputs) Multiple Outputs Multiple Outputs
Primary Fuel Type (Options: Gas, Coal, Petroleum Coke, Other/Waste) Coal Coal Secondary Fuel Type (Options: None, Gas, Coal, Petroleum Coke, Other/Waste) None NonePlant Output and Operating Data : Note - All ton units are US Short Tons (2000 lbs)
Syngas Capacity (MMcf/Day) 0 0
Gross Electric Power Capacity (MW) 89 113.1
Net Electric Power Capacity (MW) 30.6 39.5
Steam Capacity (Tons/Hr) 0 0
Hydrogen Capacity (MMcf/Day) 0 0
Carbon Dioxide Capacity (MMcf/Day) 79 91
Elemental Sulfur Capacity (Tons/Day) 106 123
Slag Ash Capacity (Tons/Day) 389 450
FT Naphtha (Bbls/Day) 3,690 4,262
FT Diesel (Bbls/Day) 4,630 5,347
Environmental Credit (Tons/Day) 0 0
Overall Capacity Factor (includes planned and unplanned outages) 64.76% 85%Enter One of the Following Items(For Each Primary/Secondary Fuel) Depending on Project Type: Primary Fuel Heat Rate (Btu/kWh) based on HHV FOR POWER PROJECTS Secondary Fuel Heat Rate (Btu/kWh) based on HHV FOR POWER PROJECTS Primary Fuel Annual Fuel Consumption (Tons/Day) FOR NON POWER PROJECTS 3,683 4,254 Secondary Fuel Annual Fuel Consumption (in Tons/Day) FOR NON POWER PROJECTS Initial Capital and Financing Costs (enter 'Additional Costs' in thousand dollars)
EPC (in thousand dollars) 474,834 617,131
Owner's Contingency (% of EPC Costs) 26.0% 25.8%
Process Contingency (% of Tech. Uncertain EPC Costs) 25.0% 25.0%
Portion of Plant that is Technologically Uncertain 16% 14%
Start-up (% of EPC Costs) 2% 2%
Owner's Cost (in thousand dollars) 47,483 61,713
Operating Costs and Expenses
Variable O&M (Thousand Dollars) $14,569 $18,959
Fixed O&M Cost (Thousand Dollars) $24,841 $32,685
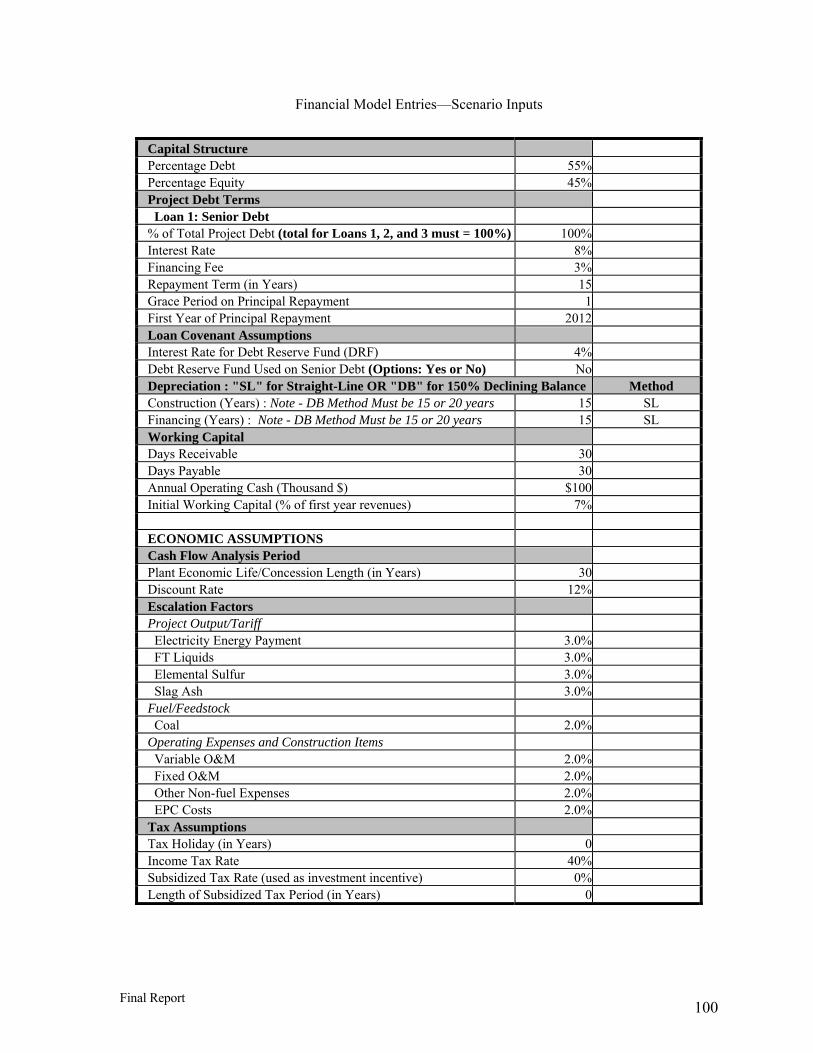
Final Report 100
Financial Model Entries—Scenario Inputs
Capital Structure Percentage Debt 55% Percentage Equity 45% Project Debt Terms Loan 1: Senior Debt % of Total Project Debt (total for Loans 1, 2, and 3 must = 100%) 100% Interest Rate 8% Financing Fee 3% Repayment Term (in Years) 15 Grace Period on Principal Repayment 1 First Year of Principal Repayment 2012 Loan Covenant Assumptions Interest Rate for Debt Reserve Fund (DRF) 4% Debt Reserve Fund Used on Senior Debt (Options: Yes or No) No Depreciation : "SL" for Straight-Line OR "DB" for 150% Declining Balance Method Construction (Years) : Note - DB Method Must be 15 or 20 years 15 SL Financing (Years) : Note - DB Method Must be 15 or 20 years 15 SL Working Capital Days Receivable 30 Days Payable 30 Annual Operating Cash (Thousand $) $100 Initial Working Capital (% of first year revenues) 7% ECONOMIC ASSUMPTIONS Cash Flow Analysis Period Plant Economic Life/Concession Length (in Years) 30 Discount Rate 12% Escalation Factors Project Output/Tariff Electricity Energy Payment 3.0% FT Liquids 3.0% Elemental Sulfur 3.0% Slag Ash 3.0% Fuel/Feedstock Coal 2.0% Operating Expenses and Construction Items Variable O&M 2.0% Fixed O&M 2.0% Other Non-fuel Expenses 2.0% EPC Costs 2.0% Tax Assumptions Tax Holiday (in Years) 0 Income Tax Rate 40% Subsidized Tax Rate (used as investment incentive) 0% Length of Subsidized Tax Period (in Years) 0
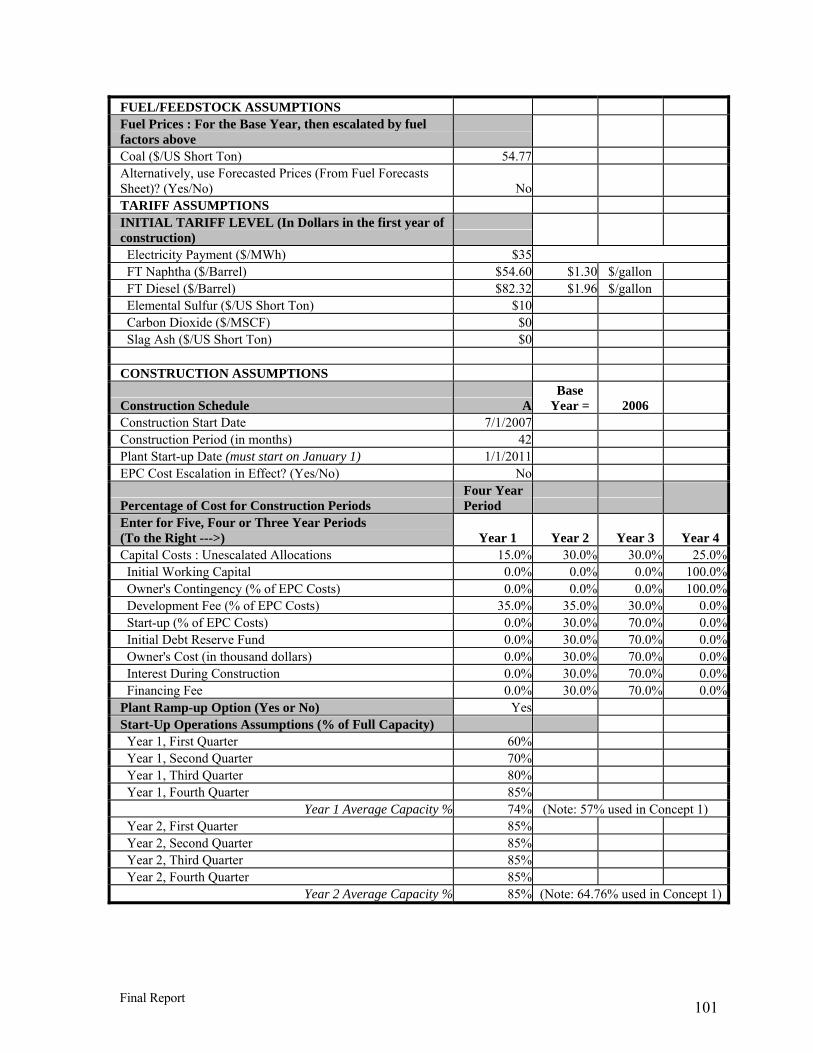
Final Report 101
FUEL/FEEDSTOCK ASSUMPTIONS Fuel Prices : For the Base Year, then escalated by fuel factors above
Coal ($/US Short Ton) 54.77 Alternatively, use Forecasted Prices (From Fuel Forecasts Sheet)? (Yes/No) No
TARIFF ASSUMPTIONS INITIAL TARIFF LEVEL (In Dollars in the first year of construction)
Electricity Payment ($/MWh) $35 FT Naphtha ($/Barrel) $54.60 $1.30 $/gallon FT Diesel ($/Barrel) $82.32 $1.96 $/gallon Elemental Sulfur ($/US Short Ton) $10 Carbon Dioxide ($/MSCF) $0 Slag Ash ($/US Short Ton) $0 CONSTRUCTION ASSUMPTIONS
Construction Schedule ABase
Year = 2006 Construction Start Date 7/1/2007 Construction Period (in months) 42 Plant Start-up Date (must start on January 1) 1/1/2011 EPC Cost Escalation in Effect? (Yes/No) No
Percentage of Cost for Construction Periods Four Year Period
Enter for Five, Four or Three Year Periods (To the Right --->) Year 1 Year 2 Year 3 Year 4 Capital Costs : Unescalated Allocations 15.0% 30.0% 30.0% 25.0% Initial Working Capital 0.0% 0.0% 0.0% 100.0% Owner's Contingency (% of EPC Costs) 0.0% 0.0% 0.0% 100.0% Development Fee (% of EPC Costs) 35.0% 35.0% 30.0% 0.0% Start-up (% of EPC Costs) 0.0% 30.0% 70.0% 0.0% Initial Debt Reserve Fund 0.0% 30.0% 70.0% 0.0% Owner's Cost (in thousand dollars) 0.0% 30.0% 70.0% 0.0% Interest During Construction 0.0% 30.0% 70.0% 0.0% Financing Fee 0.0% 30.0% 70.0% 0.0%Plant Ramp-up Option (Yes or No) Yes Start-Up Operations Assumptions (% of Full Capacity) Year 1, First Quarter 60% Year 1, Second Quarter 70% Year 1, Third Quarter 80% Year 1, Fourth Quarter 85%
Year 1 Average Capacity % 74% (Note: 57% used in Concept 1) Year 2, First Quarter 85% Year 2, Second Quarter 85% Year 2, Third Quarter 85% Year 2, Fourth Quarter 85%
Year 2 Average Capacity % 85% (Note: 64.76% used in Concept 1)