Technical and Economic Analysis of Composting Enterprises ... · Technical and Economic Analysis of...
116
Nieuwehaven 201 2801 CW Gouda The Netherlands fax: +31 182 550313 e-mail: [email protected] website: http://www.waste.nl Technical and Economic Analysis of Composting Enterprises in Bangalore - India Case-Study Report Composting Esha Shah Kasturba Sambaraju December 1997
Transcript of Technical and Economic Analysis of Composting Enterprises ... · Technical and Economic Analysis of...

Nieuwehaven 201 2801 CW Gouda The Netherlands
fax: +31 182 550313 e-mail: [email protected] website: http://www.waste.nl
Technical and Economic Analysis of Composting Enterprises in Bangalore - India Case-Study Report Composting Esha Shah Kasturba Sambaraju December 1997

Copyrights The research for this publication received financing from the Netherlands Development Assistance (NEDA), Ministry of Foreign Affairs. Citation is encouraged. Short excerpts may be translated and/or reproduced without prior permission, on the condition that the source is indicated. For translation and/or reproduction in whole WASTE should be notified in advance. Responsibility for the contents and for the opinions expressed rests solely with the authors; publication does not constitute an endorsement by WASTE or the financier. Code: CS-com ind

Technical and Economic Analysis of Composting Enterprises in Bangalore - India WASTE, December 1997
1
PREFACE
This study has been done in the framework of UWEP, the Urban Waste Expertise Programme, a six-year programme - 1995-2001 - of research and project execution in the field of urban waste management in the south. UWEP aims at: * generating knowledge on community and small and micro enterprise involvement in waste management * developing and mobilizing south expertise on urban waste issues The Urban Waste Expertise Programme covers a range of topics related to waste management in the context of the urban environment in the south - solid waste collection and transfer, waste minimization, recycling of various waste fractions, resource recovery and liquid waste treatment. Waste management and its various stakeholders now form a rapidly growing area of interest. The role played by small and microenterprises and communities, however, is still much neglected. UWEP aims to generate, analyse, document and customize the information that is gathered during research and pilot projects, in order to enhance the expertise of the UWEP target groups, ultimately aiming at an improved integrated sustainable waste management system. This will in the long run lead to an improved environment, create more employment and offer improved urban services for everyone. One of the UWEP research topics was composting. This report, "Technical and Economic Analysis of Composting Enterprises in Bangalore - India ", reflects the results of a case-study research done by Esha Shah and Kasturba Sambaraju, commissioned by WASTE, the executing agency of the UWEP programme. Similar researches on the topic of composting were undertaken in the Philippines, Egypt and Nepal. By publishing these case-study reports, we explicitly aim at divulging the data gathered during the researches. UWEP sees this report as one of the ways of focusing attention on small and microenterprises, community involvement and their invaluable role in urban waste management. Hopefully this publication helps you to form a picture of the role the various stakeholders play in urban waste management. More information and an overview of the other UWEP reports and books can be obtained from WASTE. The UWEP Case-study Report series are published informally by WASTE. In order that the information contained in them can be presented with the least possible delay, the typescript has not been prepared in accordance with the procedures normally adhered to. WASTE accepts no responsibility for errors.
Inge Lardinois, UWEP research coordinator Arnold van de Klundert, UWEP director
WASTE advisers on urban environment and development Gouda, September 1998

Technical and Economic Analysis of Composting Enterprises in Bangalore - India WASTE, December 1997
2
CONTENTS
PREFACE ........................................................................................................................ 1
CONTENTS ........................................................................................................................ 2
CHAPTER 1 URBAN SOLID WASTE MANAGEMENT: AN OVERVIEW ............. 7
1.1 Composition .............................................................................................................. 7
1.2 Solid Waste Management by Formal Sector ....................................................... 10 1.2.1 Solid Waste Management by Health Department........................................ 10
1.3 Solid Waste Management by Informal Sector..................................................... 12 1.3.1 Waste pickers ............................................................................................... 12 1.3.2 Itinerant Buyers............................................................................................ 13 1.3.3 Middle dealers.............................................................................................. 13 1.3.4 Wholesalers.................................................................................................. 13 1.3.5 Recycling units............................................................................................. 14
1.4 Initiatives By NGOs And CBOs............................................................................ 14
1.5 Initiatives for Recycling Organic Waste .............................................................. 14 1.5.1 History of Composting................................................................................. 14 1.5.2 Other Ways of Recycling Organic Waste.................................................... 15
1.6 Policies and Legislation.......................................................................................... 17 1.6.1 74 th Amendment and Decentralization of Power....................................... 17 1.6.2 Swabhimana................................................................................................. 18
REFERENCES FOR CHAPTER 1 ...................................................................................... 19
CHAPTER 2 TECHNICAL AND ECONOMIC ANALYSIS OF COMPOSTING ENTERPRISES: KARNATAKA COMPOST DEVELOPMENT CORPORATION LIMITED .................................................................... 21
2.1 General Overview................................................................................................... 21 2.1.1 History.......................................................................................................... 21 2.1.2 Management Structure ................................................................................. 23 2.1.3 Composting Process..................................................................................... 24 2.1.4 Bottlenecks................................................................................................... 25 2.1.5 Future Plans ................................................................................................. 26
2.2 Financial Analysis .................................................................................................. 26 2.2.1 Average Production ..................................................................................... 26 2.2.2 Running Costs.............................................................................................. 26 2.2.3 Cost of Depreciation .................................................................................... 28 2.2.4 Cost of Grant Capital ................................................................................... 29 2.2.5 The Cost Price of Product ............................................................................ 29 2.2.6 Cost of Taxes ............................................................................................... 29 2.2.7 Revenue........................................................................................................ 29 2.2.8 Profitability Statement ................................................................................. 30
2.3 Marketing Analysis ................................................................................................ 30

Technical and Economic Analysis of Composting Enterprises in Bangalore - India WASTE, December 1997
3
2.3.1 Market Segments ......................................................................................... 30 2.3.2 Market Share of Compost ............................................................................ 31 2.3.3 Marketing Mix ............................................................................................. 36 2.3.4 Marketing Positioning.................................................................................. 39 2.3.5 Market Strategy............................................................................................ 40
REFERENCES FOR CHAPTER 2 ...................................................................................... 45
CHAPTER 3 TECHNICAL AND ECONOMIC ANALYSIS OF COMPOSTING ENTERPRISES: TERRA-FIRMA BIOTECHNOLOGIES PRIVATE LIMITED.................................................................................................... 46
3.1 History ..................................................................................................................... 46 3.1.1 Motivation.................................................................................................... 46 3.1.2 Organization................................................................................................. 46
3.2 The Process ............................................................................................................. 47 3.2.1 Procurement of Raw Material and Additives............................................... 47 3.2.2 Composting .................................................................................................. 48
3.3 Obstacles and Solutions ......................................................................................... 49
3.4 Future Plans............................................................................................................ 50
3.5 Financial Analysis .................................................................................................. 51 3.5.1 Average Production Level ........................................................................... 51 3.5.2 Running Costs.............................................................................................. 51 3.5.3 Cost of Depreciation .................................................................................... 53 3.5.4 Financing Costs............................................................................................ 56 3.5.5 Cost Price of Product ................................................................................... 56 3.5.6 Cost of Taxes ............................................................................................... 56
3.6 Marketing Analysis ................................................................................................ 57 3.6.1 Market Segments ......................................................................................... 57 3.6.2 Marketing-Mix............................................................................................. 58 3.6.3 Market-Positioning ...................................................................................... 61 3.6.4 Market-Strategy ........................................................................................... 64
3.7 Technical and Economic Analysis of Composting Enterprises: NGOs and CBOs 67 3.7.1 Overview...................................................................................................... 67 3.7.2 Composting .................................................................................................. 67 3.7.3 Finance......................................................................................................... 68 3.7.4 Pit Design..................................................................................................... 69 3.7.5 Composting Process..................................................................................... 69 3.7.6 Future Plans ................................................................................................. 70 3.7.7 Strengths and Weaknesses ........................................................................... 70
3.8 Financial Analysis .................................................................................................. 71 3.8.1 Average Production Level ........................................................................... 71 3.8.2 Running Costs.............................................................................................. 71 3.8.3 Cost of Bought-in-Services.......................................................................... 72 3.8.4 Hidden Cost of Rent..................................................................................... 73 3.8.5 Cost of Depreciation .................................................................................... 73

Technical and Economic Analysis of Composting Enterprises in Bangalore - India WASTE, December 1997
4
3.8.6 Cost of Grant Capital ................................................................................... 75 3.8.7 Cost Price of Product ................................................................................... 75 3.8.8 Cost of Taxes ............................................................................................... 75 3.8.9 Cost of Revenue........................................................................................... 75 3.8.10 Profitability Statement ................................................................................. 76
3.9 Marketing Analysis ................................................................................................ 76 3.9.1 Marketing Segments and Product Range..................................................... 76 3.9.2 Market Positioning....................................................................................... 76 3.9.3 Market-Mix.................................................................................................. 77
3.10 Overview ................................................................................................................. 78 3.10.1 History.......................................................................................................... 78 3.10.2 Jayanagar Solid Waste Management Programme........................................ 78
3.11 Financial Analysis .................................................................................................. 81 3.11.1 Production Level.......................................................................................... 81 3.11.2 Running Cost ............................................................................................... 81 3.11.3 Cost of Rent ................................................................................................. 83 3.11.4 Cost for Bought-in-Services ........................................................................ 84 3.11.5 Cost of Depreciation .................................................................................... 84 3.11.6 Cost of Grant Capital ................................................................................... 87 3.11.7 Cost Price of Product ................................................................................... 87 3.11.8 Cost of Taxes ............................................................................................... 87 3.11.9 Revenue........................................................................................................ 87 3.11.10 Profitability Statement ................................................................................. 88
3.12 Marketing Analysis ................................................................................................ 88 3.12.1 Marketing Segments and Product Range..................................................... 88 3.12.2 Market-Mix.................................................................................................. 88 3.12.3 Market Positioning....................................................................................... 89
3.13 General Overview................................................................................................... 89 3.13.1 The Organisation.......................................................................................... 89 3.13.2 Objectives .................................................................................................... 90 3.13.3 Solid Waste Management Programme......................................................... 91
3.14 Rajajinagar Solid Waste Management Programme ........................................... 92 3.14.1 Overview...................................................................................................... 92 3.14.2 Waste Flow and Collection.......................................................................... 92 3.14.3 Composting .................................................................................................. 92
3.15 Financial Analysis .................................................................................................. 93 3.15.1 Average Production Level ........................................................................... 93 3.15.2 Running Costs.............................................................................................. 93 3.15.3 Cost of Bought-in-Services.......................................................................... 94 3.15.4 Cost of Rent ................................................................................................. 94 3.15.5 Cost of Depreciation .................................................................................... 94 3.15.6 Cost of Grant Capital ................................................................................... 97 3.15.7 Cost Price of the Product ............................................................................. 97 3.15.8 Cost of Taxes ............................................................................................... 97 3.15.9 Revenue........................................................................................................ 97 3.15.10 Profitability Statement ................................................................................. 98

Technical and Economic Analysis of Composting Enterprises in Bangalore - India WASTE, December 1997
5
3.16 Marketing Analysis ................................................................................................ 98 3.16.1 Market Segments ......................................................................................... 98 3.16.2 The Marketing Mix ...................................................................................... 98 3.16.3 Market Strategy............................................................................................ 99
CHAPTER 4 ISSUES...................................................................................................... 100
4.1 Decentralised Community Based Composting .................................................. 100
4.2 Large Scale Composting ...................................................................................... 102
REFERENCES FOR CHAPTER 4:................................................................................... 105
CHAPTER 5 OCCUPATIONAL HEALTH IMPACT ............................................... 106
5.1 Case Study 1: ........................................................................................................ 106 5.1.1 Observations .............................................................................................. 106 5.1.2 Physical Hazards........................................................................................ 106 5.1.3 Chemical Hazard........................................................................................ 108 5.1.4 Biological Hazards..................................................................................... 108 5.1.5 Mechanical Hazard .................................................................................... 109 5.1.6 Suggestions ................................................................................................ 109
5.2 Case Study 2 : Terra Firma Bio-Technology Limited 1. Observation ............ 110 5.2.1 Problems Observed .................................................................................... 112 5.2.2 Suggestions ................................................................................................ 112
5.3 Case study 3: Clean Environ, Malleswaram...................................................... 112 5.3.1 Observation................................................................................................ 112 5.3.2 Suggestions ................................................................................................ 113
REFERENCES FOR CHAPTER 5 .................................................................................... 114

Technical and Economic Analysis of Composting Enterprises in Bangalore - India WASTE, December 1997
6
Technical and Economic Analysis of Composting Enterprises in Bangalore - India WASTE, December 1997
7
CHAPTER 1 URBAN SOLID WASTE MANAGEMENT: AN OVERVIEW
Solid waste is defined differently by different agencies. Technically it is defined as the wastes arising from human and animal activities that are normally solid, non-free flowing, and discarded as useless or unwanted (Tchobanoglous, 1993); whereas to consider the intrinsic value of material as a resource, solid waste is defined as organic and inorganic waste material produced by households, commercial, institutional and industrial activities that have lost their value in the eyes of the first owner (Cointreau, 1982). The characteristics of municipal solid waste (MSW) include, garbage-organic material discarded or remaining as a result of the storage, preparation and consumption of food, rubbish, paper, wood, glass, metal, leaves, dead animals; and debris-construction and demolition of structures mainly generated from vegetable markets, hotels, community halls, street sweepings and residential areas (Rao, 1994).
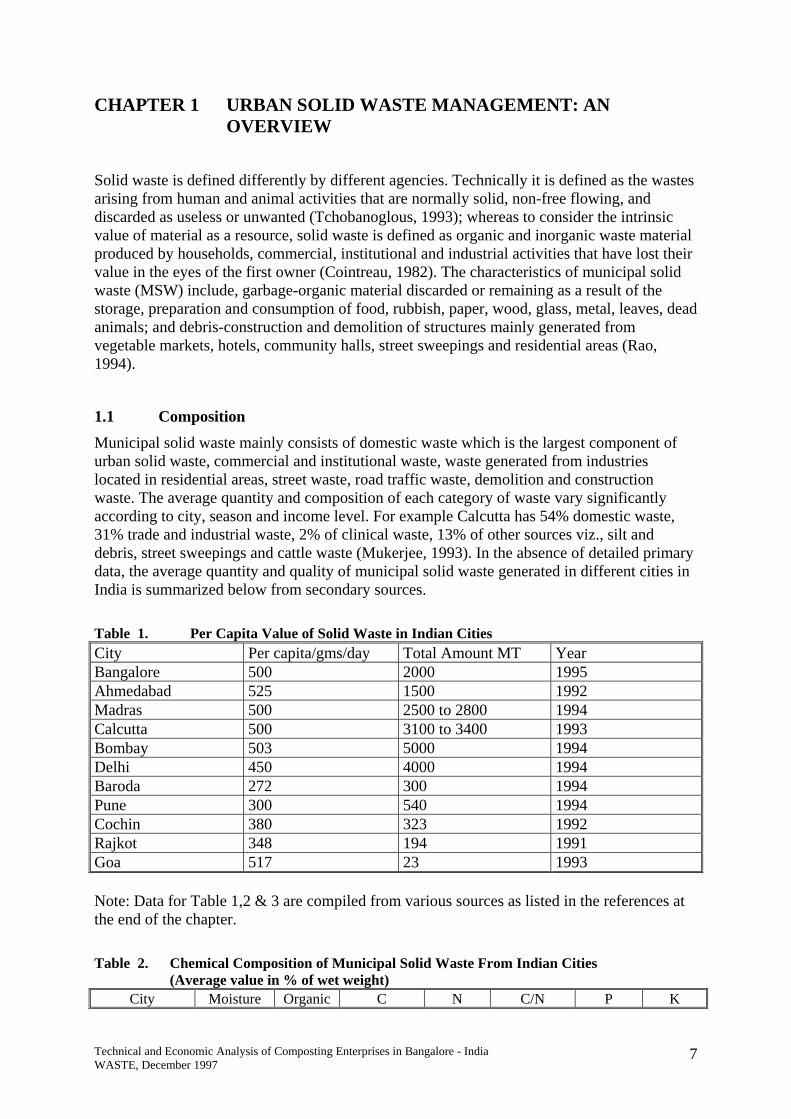
1.1 Composition Municipal solid waste mainly consists of domestic waste which is the largest component of urban solid waste, commercial and institutional waste, waste generated from industries located in residential areas, street waste, road traffic waste, demolition and construction waste. The average quantity and composition of each category of waste vary significantly according to city, season and income level. For example Calcutta has 54% domestic waste, 31% trade and industrial waste, 2% of clinical waste, 13% of other sources viz., silt and debris, street sweepings and cattle waste (Mukerjee, 1993). In the absence of detailed primary data, the average quantity and quality of municipal solid waste generated in different cities in India is summarized below from secondary sources. Table 1. Per Capita Value of Solid Waste in Indian Cities City Per capita/gms/day Total Amount MT Year Bangalore 500 2000 1995 Ahmedabad 525 1500 1992 Madras 500 2500 to 2800 1994 Calcutta 500 3100 to 3400 1993 Bombay 503 5000 1994 Delhi 450 4000 1994 Baroda 272 300 1994 Pune 300 540 1994 Cochin 380 323 1992 Rajkot 348 194 1991 Goa 517 23 1993 Note: Data for Table 1,2 & 3 are compiled from various sources as listed in the references at the end of the chapter. Table 2. Chemical Composition of Municipal Solid Waste From Indian Cities
(Average value in % of wet weight) City Moisture Organic C N C/N P K

Technical and Economic Analysis of Composting Enterprises in Bangalore - India WASTE, December 1997
8
Content Matter Bangalore (1990)
Residential 40.47 31.86 18.46 - - - 1283.24 Commercial 31.83 25.68 15.00 - - - 1188.24 Market 38.83 38.48 22.32 - - - 1233.20 Industrial 30.79 19.82 11.49 - - - 977.19 Calcutta (1993) 41.41 35.24 19.58 0.55 37.41 0.58 2707.70 Bombay (1994) 43.54-57.69 - 13.48-17.46 0.39-0.54 - 0.26-0.45 529.83- Goa (1993) 74.00-77.00 - 27.40-30.40 1.11-1.80 15.20 - 24.7 0.70-
1.03 711.48

Technical and Economic Analysis of Composting Enterprises in Bangalore - India WASTE, December 1997
Table 3. Physical Composition of Municipal Solid Waste in Indian Cities ( Average Values in % of Total Weight) City Paper Plastic Rags Metals Glass Rubber
&Leather Wooden Matter
Crockery Bones Stones & Bricks
Ash & Fine Earth
Putrescible Matter
Delhi (1982) 5.88 0.51 3.56 0.59 0.31 0.95 0.42 0.32 - 3.86 33.95 47.85 Delhi (1971-73) 6.29 0.85 - 1.21 0.57 - - - - - 36 35.00 Delhi (1994) 5.88 0.51 3.56 0.59 0.31 5.03 0.42 - - - 33.95 47.84 Calcutta (1993) 5.2 3.5 - 1.45 - 2.0 - 8.5 0.45 1.5 27.00 41.00 Calcutta (1971-73) 3.18 0.65 2.9 0.66 0.38 - - - - - 34.00 47.00 Hyderabad (1971-73)
4.81 0.83 - 1.22 0.93 - - - - - 36.00 37.00
Ahmedabad (1971-73)
3.02 0.84 - 0.42 0.23 - - - - - 34.00 49.00
Bangalore (1971-73)
1.91 0.32 0.74 0.30 0.21 0.09 0.10 0.33 - 1.18 40.58 53.83
Bangalore (1990) Residential Area 3 0.75 2.8 0.92 0.55 0.99 0.37 1.12 0.35 3.65 41.16 44.70 Commercial Area 10.76 5.4 11.15 2.66 7.11 2.19 10.22 4.87 - 0.38 32.44 23.11 Market 0.4 0.47 4.47 - 0.41 0.52 0.85 - 4.34 1.08 21.00 69.40 Industrial Area 3.95 8.95 7.49 3.9 6.82 9.29 2.21 7.13 - 29.09 15.55 19.94 Bombay (1994) City 6.16 4.23 - 0.85 1.28 4.15 - - - - 18.09 42.29 Eastern Suburb 10.93 4.87 - 0.65 0.87 11.8 - - - - 14.95 35.72 Western Suburb 6.61 5.47 - 1.42 3.48 11.07 - - - - 12.39 39.52 Goa(1993) 16.1 3.0 2.7 6.6 2.4 - - - - - 3.30 70.50 Pune(1994) 8.74 0.72 1.63 - 0.58 - - - - - - 60.00 Cochin (1994) 4.9 1.10
+ rubber2.0 0.7 0.3 - 6.0 - - 14.00
Ash + Earth
- 58.00

Technical and Economic Analysis of Composting Enterprises in Bangalore - India WASTE, December 1997
10
1.2 Solid Waste Management by Formal Sector The Bangalore City Corporation (BCC) is governed by the Karnataka Municipal Corporations Act. 1976, wherein collection and disposal of solid waste generated by households and institutions is one among many responsibilities of the Municipal Corporation. Responsibility of Solid Waste Management in newly developed areas lies with the Bangalore Development Authority (BDA) and the notified areas come under the purview of village panchayats. The General Administration Department of the BCC is the chief co-ordinating office to monitor and guide the work of all other Departments with the help of 17,400, employees as of March, 1995. The two other departments involved in municipal solid waste management are the Health and the Engineering Departments.
1.2.1 Solid Waste Management by Health Department
For the purpose of administration of services the city is divided into 12 ranges, which are further divided into 87 divisions and 125 sanitary or health units. On an average, a range has 7 to 8 divisions, which are also sometimes referred to as wards, which may or may not coincide with the wards designated for the election of corporators. Following are the major responsibilities and duties of the Health Department: - sanitation - medical relief - registration of birth and death - vaccination - medical inspection of different licensable places like schools, theatres, factories, restaurants,
dispensaries and hospitals - Food adulteration - control of infectious diseases - Inspection of burial grounds - inspection of tanks, wells, drains and low lying areas in the city from health point of view - issue of licenses - maternity and child health The collection, transportation and disposal of municipal solid waste generated in urban areas is one of the many responsibilities of the Health Department.
City Wide Coverage
There is no house to house collection organised by city corporation as yet, but more prosperous areas are better served, kept clean and swept regularly. By contrast, the low income areas are occasionally attended to. The areas not served are mostly illegal settlements or slums. The situation in BDA and notified areas is pathetic as huge quantity of accumulated garbage is not a rare sight. Of the 444 sq. kms of urban agglomeration of Bangalore city, in 125 sq. km of area (28%) BCC staff directly provides for solid waste management services, and 75 sq. km (17%)of area coming under the purview of corporation has been contracted to private agencies. The rest of the area (55%) falls under the jurisdiction of BDA, wherein SWM service is provided by private agencies on a contract basis. Out of the 430 slums in Bangalore, 64 slums are served by the BCC (directly by staff or contractor) for solid waste management services and 64 by BDA (which in turn is contracted

Technical and Economic Analysis of Composting Enterprises in Bangalore - India WASTE, December 1997
11
out). The remaining slums numbering 215 coming under the slum clearance board and the 87 slums on private land are not covered by any agency for solid waste management services.
Collection, Storage, Transportation and Disposal
The collection system comprises a pair of pourakarmikas sweeping their beat of road and transporting the waste into roadside bins. The residents are expected to deposit their waste into the community bin. The bins are supposed to be collected daily by corporation staff or contractor crew whichever the case may be and transported to landfill site. As per the latest data available, 79 city corporation vehicles, 85 tender contract trucks and 45 trucks for BDA layouts operate in Bangalore for collection and transportation of solid waste. In addition 10 compactors and 5 dumper placers are under operation. The workers from the vehicle get down at the bin site, empty the bin and surrounding waste into basket with the help of brooms, long sticks and spades, and physically shift it into the truck. The trucks are usually not covered while the waste is being transported to dumping site. The waste collected from road and bins is directly transported to dumping site as Bangalore has no transfer station. The collected solid waste in Bangalore city is disposed through open dumping, which includes both corporation earmarked dumping spots and un-earmarked dumping spots. Part of the waste from vegetable market is also sent to Kamataka Compost Development Corporation for compost production. The BCC earmarked site for dumping are: Binny mill dumping yard, Chinnappa Garden, Beggar's Colony located on Magadi road, Koramangala dog pound, Bommanahalli compost yard. Large quantities of the collected garbage is thrown at places which are not officially declared as dumping sites. Such areas include: Swatharapalya on Mysore road, Banshankari II Stage, next to Netkallappa circle, Koramangala quarry on Hosur Road, Old eh (a water pool) on Hosur road, road leading to Peenya from Malleswaram, Few spots on Magadi road, Jalahalli (an abandoned quarry of 20-25 ft depth is unofficially earmarked for dumping), Bettahalli (which is an unused quarry pit 25ft deep covering 6-7 acres of land), Hebbal (an open field 10 kms. from Bangalore), Yelahanka dumping site located 16-18kms away from Bangalore.
Collection Efficiency
Following is an attempt to comprehend collection efficiency in the city of Bangalore
Generation - Population (including BDA and notified areas as per 1991 census) = 40,86,548 - Garbage generation = 0.5kg/person/day - Total garbage generation in Bangalore city = 2043 tones
Recycling (by Private Agencies) - As per a waste wise study (1995) each waste picker collects on an average 12 kgs paper, 4
kgs plastic, 5 bottles, 5 kgs of metal per day. The estimated number of 25,000 waste pickers can collect = 412.5 tones (20%). Alternatively, ASTRA estimated that 15% of total waste is picked up. Therefore, the total collected waste by private people is 347 tones a day (assuming 17% of the waste is picked up).
- Net quantity of garbage to be lifted by BCC = 1696 tones.

Technical and Economic Analysis of Composting Enterprises in Bangalore - India WASTE, December 1997
12
Available Resources and Quantity Transported - Corporation trucks (each truck carries on an average 5 tons/day/trip = 79 x 5 = 395 tones - Refuse Compactors (9 to 10 tones capacity/trip) = 2 trips x l x 10 = 20 tones - Tender/Contractor lorries 85 (6 tones capacity per trip) = 6 x 85 x 1 = 425 tones - BDA layout lorries = 45 x 5 = 225 tones Total quantity of garbage transported by formal sector = 1065 tones. Total quantity of garbage recycled or disposed otherwise = 1065 + 347 = 1412 tones. With the existing infrastructure for transportation garbage being lifted = 62.79%. Backlog of uncollected waste everyday = 631 tones/day.
1.3 Solid Waste Management by Informal Sector Bangalore like many other Asian cities has an extensive and well structured system for recycling of inorganic wastes. A variety of materials such as paper, plastic, glass and metals are picked from corporation bins and open dumps, sorted and traded through a hierarchical system of waste pickers, dealers and factories. In addition, varieties of items like Newspapers, bottles, metal, plastic cans and glass are separated by the households in all income areas and sold to itinerant waste buyers, which are again traded and sold to recycling factories.
1.3.1 Waste pickers
Waste pickers occupy the lowermost position economically and socially among the chain of actors in the informal sector. Waste pickers in Bangalore form a heterogeneous group in terms of caste, region, language and religion. Men, women and children of all age groups are involved in this activity. There are no reliable statistics on the number of men, women and children involved in waste picking in the city. However, a widely suggested number by Governmental and Non-governmental agencies is 25,000 waste pickers (De Souza, 1991). A distinction can be made among the waste pickers on the basis of their picking habits and source from where they collect the waste. This include : those who pick waste from the road side bins, those who collect directly from commercial places (offices & shops) and the dumpsite pickers.
Quantity of Materials Collected
All types of materials which have a potentially resale value are collected by waste pickers. The quantity as well as quality of material collected is influenced by the source of collection and timings (Waste Wise, 1995). Table 3. summarizes the predominant types and quantity of materials collected by a waste picker. Table 3. Average Quantity of materials collected by a Waste picker
Type Quantity Kg/day Price Rs./kg Total Rs./dayPaper Brown Board 15-20 0.75 13.00 Card Board 3-4 2.50 10.00 Record 5-6 2.50 15.00 Plastic Road Waste 4 2.00 8.00 Pugga and Milk Covers 2-3 9.00 24.00

Technical and Economic Analysis of Composting Enterprises in Bangalore - India WASTE, December 1997
13
Kadak 2 6.00 12.00 Glass Beer Bottle 5-6 No. 2.00/No 12.00 Whisky Bottle 10 No. 0.75/No 7.50 Phenyl and Small 2-3 No. 0.50/No 1.50 Metal (all) 1 20 20.00 Total Rs./day 123.00 Source: Waste Wise, 1995. Considering waste picking for 17 days a month total income per month = Rs. 2091.
1.3.2 Itinerant Buyers
Newspaper, glass bottles, plastic are retrieved directly from households by itinerant collectors. The number of such dealers is estimated at 3000-4000 in Bangalore (Furedy, 1994). On an average an itinerant buyer collects 50 to 75 kgs of waste daily (Shoba 1995; Huysman et.al 1994, Furedy, 1994). IWBs are generally related to middle dealers by cast or kinship. Many of them also stay with middle dealer. The relationship between IWB and middle dealer is that of give and take. IWBs receive capital for daily business and handy loans for various purposes from middle dealers. Purchased waste is sold to middle dealers in return.
1.3.3 Middle dealers
The middle dealers form a link between the waste pickers, sweepers, individual households and the wholesalers. They usually accept any type and quantity of material that has a market value. There are 800 small, 50 middle level dealers' shops estimated in the city of Bangalore (Furedy, 1994). Every neighborhood has at least 3 to 4 dealers' shops. It is difficult to quantify the waste purchased every day by these dealers as there is a large diversity in the traded materials. A small dealer purchases waste ranging from 50 to 100 Kgs per day, a medium dealer 200 to 300 kgs per day and a large dealer above 500 kgs per day (Waste Wise, 1995; Huysman et.al, 1994). The materials are sold to wholesalers once in three days or on a weekly basis. A study showed that on an average middle dealers trade 2.5 tons with a monthly turn over of Rs. 29,725 (Van Beukering, 1993). The main suppliers for the middle dealers are waste pickers(28%), households (24%) itinerant collectors (19%) and institutions (4%) (Van Buekering, 1993). The same study estimated that 6.5% is spent on labor. Usually the middle dealers have a few boys attached to their shops. Procurement of waste depends largely on the number of boys staying with them (De Souza, 1991).
1.3.4 Wholesalers
A wholesaler usually specializes in one type of materials. His role is to mainly accumulate material and sort it to the requirements of the factory. Since the capacity of a middle dealer to store is limited, a wholesaler has to depend on a few number of middle dealers. Regular supply from middle dealers is ensured by offering them transportation of waste at low costs. In addition a wholesaler collects waste material directly from the factories. A wholesaler trades at an inter-state level. Considerable investment is required as working capital. The available information on the number of wholesalers differs, but paper, plastics, glass, rubber and metal trades seem to be prevalent in the city.

Technical and Economic Analysis of Composting Enterprises in Bangalore - India WASTE, December 1997
14
1.3.5 Recycling units
Paper
Waste paper up to 50% is recycled in three large scale paper mills including a handmade paper unit. In addition to this it is reported that there are 2 large mills and 17 medium and small scale paper and board mills in the city (Murthy, 1995).
Plastic
As per an estimate, Bangalore has around 300 reprocessing units with main thrust on recycling of all polyolefins and PVC, although PVC recycling units are only 7 to 10. 70 % to 80 % of the collected, post-consumer waste is exported to Delhi, Bombay and Gujarat for reprocessing. Jolly Maholla is the center for the purchase of scrap material, whereas the reprocessing units are spread all over Bangalore with more concentration in Nayandahalli and New Timber Market on Mysore Road. In Nayandahalli itself around 100 pelletisation and product manufacturing units are located.
Glass
In Bangalore, there are 3 glass factories located on the outskirts of the city (Whitefield) of which one semi-automated unit has a capacity of 11 tons per day and two automated units have a capacities of 55 tons and 70 tons per day respectively (Asha, 1991;Huysman, 1994).
1.4 Initiatives By NGOs And CBOs A number of citizens' groups have started decentralized waste management schemes in the city with the help of non-governmental organizations. The three major initiatives are: Waste Wise, CEE and Exnora. They are discussed in detail in the forth chapter.
1.5 Initiatives for Recycling Organic Waste
1.5.1 History of Composting
In rural areas vegetable waste has been composted since ancient times. Use of cowdung mixed with agriculture waste as a fertiliser is an age old practice in India. There have been various methods of composting prevailing in different regions, wherein the ingredients, presence or absence of air, microbial population, mixing frequency differ considerably. First time it became a recognised method to treat the organic waste in 1920s. India can take credit for developing systematic manual composting when Howard and his associates, as also Acharya and Subramanyam independently, developed Indore and Bangalore methods of composting. (Bhide and Sundaresan, 1983). In the Bangalore method, alternate layers of refuse and nightsoil are repeated till it reaches a height of 30 cm above 25 cm deep pit. Mass is either covered with soil or rounded to prevent the rain water entry. It is allowed to decompose for 4 to 6 months after which the compost is taken out for use. The Indore method of composting in pits is similar except that it is turned at specific intervals to maintain aerobic conditions. First turning is carried out after 4-7 days, the second 9-17 days. Further turning is not necessary and composting will be complete in a period of 13-27 days. Initially aerobic and anaerobic methods of composting were known as Indore and

Technical and Economic Analysis of Composting Enterprises in Bangalore - India WASTE, December 1997
15
Bangalore methods. These methods were not only employed to treat vegetable and agricultural left over but also to treat animal and human excreta. At present, the research has led to the establishment of 30 different patented process of composting world over. However, composting of large quantities of urban waste in India was considered only in 1970s. A committee headed by Sri. B. Shivaraman, former member, Planning Commission, recommended composting for the hygienic disposal of urban solid waste. On the basis of this recommendation, ten semi-mechanized composting plants were set up in Ahmedabad, Bombay, Bangalore, Baroda, Delhi, Calcutta, Jodhpur, Jaipur, Kanpur and Vijayawada in 1975-76. The process included removal of big pieces, pulverisation, forced aeration with augers and sieving. Almost all the plants have stopped working as there were many problems. They include: - Semi-mechanized machinery was imported and a minor mechanical fault usually led to
breakdown due to non-availability of spare parts. - Mixed nature of waste was a major difficulty. Pulverizes got frequently clogged with pieces
of rags, plastic and rubber etc. and blades of which were broken down due to metal and glass pieces present in the waste. Amount of soil mixed into the waste also caused problem in the process, in addition to the lowering of the quality produced.
- Lack of continuous power supply was another problem. - The process could not be continued in rainy season. - The actual capacity turned out to be far less than the designed capacity. - Lack of market for the finished product was another problem. As a result the enterprise
could not become self sustained. It took a decade to realise that semi or fully automatic composting plants may not perform in the Indian conditions. The concept of decentralised composting with the help of community initiative and waste pickers involvement was conceived in late 1980s. At present, such experiments are going on in parts of Pune, Ahmedabad, Cochin, Hyderabad and Bangalore. Effectiveness of this approach in solving the problem is yet to be evaluated objectively. There are various other means by which organic waste generated in the urban areas is used as resource. Relatively "clean" restaurant waste is taken away by piggeries regularly. Vegetable market waste is picked up by farmers. Near dumping site in Bangalore, farmers with their tractors were found waiting for corporation trucks so that they can lift fresh waste. Feeding fish with kitchen waste is an age old practice in the state of West Bengal in India. Such a traditional practice of rearing fish with sewage water and solid waste is endangered in Calcutta due to encroachment by housing colonies on the land used for the purpose (Ghosh and Sen, 1987). Nevertheless, while dry waste is picked by extensive network of waste pickers, bulk of the organic waste is still burnt by residents, municipal scavengers and waste pickers.
1.5.2 Other Ways of Recycling Organic Waste
Excel Industries Plant
Excel Industries has developed a solid waste microbial degradation process, which within few hours, eliminates all smell emanating from solid waste and helps its rapid decomposition. The process is exothermic fermentation and therefore treated wastes become free of bacterial contamination; fly and mosquito problems are also prevented. It is reported that conversion process is completed in 6 to 8 weeks time. The degraded biomass is processed using indigenously designed mechanical sievers, gravity separators and vibrating sieves to remove non-biodegradable substances. The final product is subjected to quality control for microbial parameters, analysis and standardization and can be used as soil enricher or as fertilizer in

Technical and Economic Analysis of Composting Enterprises in Bangalore - India WASTE, December 1997
16
agricultural operation. It is being packed in 50, 5 and 1 kg packets and are distributed through dealers. The plant in Bombay is currently treating 300 tons of solid waste. The end product is also being supplied to Bombay Municipal Corporation for use in the Municipal gardens. (GOI, 1996).
Fuel Pelletisation Plant Operated at Deonar
This pelletisation plant was started in June 1991 on a plot of approximately 3500 sq. mt. at Deonar dumping ground, Bombay. The garbage received in trucks is unloaded in a specially prepared floor for sun drying so that the moisture content is reduced to 40 to 60 per cent. Further drying is done by rotary dryers to achieve a reduction in moisture to 10 per cent. Biomass from garbage is used as a fuel for drying. After drying, the inert and metallic particles are removed by sieve and by magnet. The final material is crushed and mixed with binders and fed into pelletiser. Fuel pellets of 30, 20 and 8 mm are manufactured. Calorific value of the pellet is 3500 to 4000 K.cal/kg. The market for the pellets is domestic medium scale industrial furnaces. It is estimated that for 100 tones of raw garbage 20 tones of pellets will be produced. Currently, the plant is processing about 50 tones of garbage daily and is producing 10 tones of pellets. (GOI, 1996)
Pelletisation Plant Operated by Shiv Shankar Engineering, Bangalore
Pelletisation process used by Shiv Shankar Engineering, Bangalore is essentially similar to the process used at Deonar dumping, Bombay. It however overcomes one of the drawbacks, i.e., primary dependence on sun for drying the waste, by utilizing heat for drying of the solid waste. In the Bangalore model, there is provision for substantial amount of mechanical drying which would imply that this plant could function, though at reduced efficiency, even during rainy season. The pilot plant has not been in operation for a while and is now mainly being used as a demonstration plant.
Ucal Power Systems Limited, Madras
Ucal Power Systems Ltd., Madras is planning to start a project in Madras for using municipal solid waste for electricity generation. The fuel preparation will be a modified version of the Shiv Shankar pelletisation. Instead of pelletising, dry waste will be pressed to a degree sufficient for easy combustion as a fuel for boiler operation. 500 tones of solid waste is expected to generate about 5 MW of power, of which 1.25 MW would be utilised for internal combustion, leaving 3.75 MW for sale or other use. The cost of electricity produced has been worked out to be Rs.2.40. (GOI, 1996)
Petrocoal Pellets
Gujarat Oil Industries and Baroda Municipal Corporation had started a joint experiment in manufacturing pellets from municipal waste and waste from petro chemical industries ( Bhuvaneshwari , 1994). The process involves separation of combustible garbage from non-combustibles, mixing of garbage and petro waste, drying and pelletising.
Vermicomposting
Vermicomposting involves use of earthworms in composting organic waste. On a commercial basis, this has been tried in Pune and Bangalore. The notable among them are Bawalkar's institute and Zambegar's institute based in Pune and Terra Firma in Bangalore. In addition,
Technical and Economic Analysis of Composting Enterprises in Bangalore - India WASTE, December 1997
17
vermicomposting is being tried at one of the dumping sites in Bombay in collaboration with Bawalkar's institute.
1.6 Policies and Legislation
1.6.1 74 th Amendment and Decentralization of Power
74th Constitutional Amendment and Karnataka Legislative Amendment for decentralization of powers at local level is, by far, considered as a watershed policy intervention for improved urban planning, sanitation and health. The bill was first introduced in 1989, was passed in December 1992 and came into force in June 1993. According to the Constitutional Amendment, the state governments were required to alter their legislation by 1 June 1994. The revision of the Karnataka State legislation was prepared by the Department of Housing and Urban Development which had set up a special task force and called for recommendations from citizen's groups and NGOs. On 7th September 1994, the Karnataka state legislation corresponding to the 74th Constitutional Amendment was passed. The objectives of the Act, important in connection with solid waste management are: to provide Constitutional status to institutions of local self governments and to decentralize decision making and planning process. The Act conceives of municipal bodies to consist of directly elected public representatives as well as persons nominated on the basis of their expertise. In addition, the municipal bodies are required to constitute committees for various subjects and ward committees for planning and implementation. The Act provides enlarged list of functions by inclusion of the 12th schedule in the Constitution. The most important functions to be entrusted to local bodies will include the entire process of urban planning and administration to reorient it to function bottom to top. (Chaturvedi, 1995). Other relevant subjects for the purpose of solid waste management included in the 12th schedule are: - Urban Planning including Town Planning - Regulation of land use and construction of buildings - Water supply, public health, solid waste management and sanitation - Urban Poverty alleviation and slum improvement. Points for discussion o The size of the Ward Committee is constituted to cover 3,00,000 of the population, which is
felt to be too large for the demographic participation. o Almost all the members in the Ward Committee are nominated by the state government
except the councilor who is the only elected member. o Karnataka Legislation on decentralization provides for a metropolitan Planning Committee
(MPC) for the Bangalore metropolitan region to supersede the BMRDA (Bangalore Metropolitan Region Development Authority). Though the MPC should consist of one third of its members as elected representatives, the Commissioner of the Bangalore Development Authority should be the Secretary. Interestingly, MPC would send finalised plans for the approval of the state government.
o Similar provisions have been made for ward level committee, wherein, though planning at ward level would be one of the functions of the ward committee, the plans for the implementation would be finally approved by the state government.
o Though the nature and functions of ward level committee is not much clear, the experimental one, constituted, as of now, would monitor and maintain civic amenities in the area. This, itself, can bring in quality change in the services, nevertheless, conceptually it may be just dispersal of administrative responsibilities where as "decentralised planning" as

Technical and Economic Analysis of Composting Enterprises in Bangalore - India WASTE, December 1997
18
it is envisaged in the Act, may continue to be rested with state/parastatal bodies owing to sheer technical and resource raising capacities of such bodies.
o The constitution ward level committees may favor powerful groups of the society, being more local and organised, to be selected or nominated as members. It would not be unlikely that high income section within the ward, capable of generating higher revenue would be able to have high quality services increasing the disparity. In a highly fragmented society like India in terms of caste and economic status, the conflict of interests in planning and implementing the development process at local levels cannot be ruled out. In such case, the state and its functionaries still have to play a role of mediator. The process of decentralization of power has its own interest limitations (Shah, 1996).
1.6.2 Swabhimana
Swabhimana, as the term implies, seeks to generate a sense of self-respect among the people. It is a movement launched in July 1995 with the object of promoting people's participation in the planning, development and management of Bangalore city. CBOs, NGOs, business organisations, Civic agencies like Bangalore Development Authority, Bangalore City Corporation and other Governmental agencies are expected to come together to solve city's problems. Swabhimana Core Group is formed with representation from these organisations. This process is expected to facilitate creation of ward offices, decentralization of services, promoting access to information and transparency in administration. A model ward level committee is constituted under the Swabhimana movement in Malleswaram ward. (Ravindra, undated) With regard to solid waste management, a conceptual procedure to reach NGOs, resident groups and public at large is worked out. This procedure aims at forming decentralised arrangement for evolving efficient solid waste management programme. At the macro level, the core group will identify and organize residents' groups within 12 zones of the city. The core group will help the Swabhimana local groups to work on continuos programme on waste collection and disposal through Corporation's zonal offices. This will be done in the following steps: - The core group will form a zonal level committee mobilizing various residents' groups. This
committee should have a membership of not more than 20 residents and every locality should be equally and uniformly represented.
- NGOs will conduct training meetings. In collaboration with Corporation, citizens will identify stress areas.
- Finance will be generated through residents' initiatives. Corporation will assist the groups to implement the rules and guidelines prepared.
- The Corporation will provide a zonal office with telephone connection, a geographical map of the zone and information on the Corporation's procedures and systems. A Corporation officer will be available full time for coordinating.
In addition, the core group will study issues at macro level, in terms of training municipal officers, creating city-wide public awareness, conducting studies to identify critical gaps in the Corporation machinery, system and procedures for an overall policy on waste management for Bangalore city. Such zonal groups are formed in Malleswaram, Jaymahal, Sadashivnagar, Lavelle Road, Jayanagar, BTM layout and Church Street. {Swabhimana, undated)

Technical and Economic Analysis of Composting Enterprises in Bangalore - India WASTE, December 1997
19
REFERENCES FOR CHAPTER 1
Asnani, P.U. 1992. Modernisation of Solid Waste Management Practices in the City of Ahmedabad, Ahmedabad: Municipal Corporation. Bangalore Mahanagara Palika, 1995-1996. Details of Information Submitted to Legislative Subject Committee on Housing and Urban Development, Mimeo. Bhide, AD. and Sundaresan, B.B. 1983. Solid Waste Management in Developing Countries, New Delhi: Indian National Scientific Documentation Center. Bhuvaneshwari, R. 1994. Approaches to Urban Solid Waste Management by NGOs & CBOs in Indian Cities, Amsterdam: University of Amsterdam. Chaturvedi. T.N. 1995. "The New Constitutionalism and Urban Government; Impeding Transformations", Paper presented at the Conference on Urban Local Government and Decentralisation, Bangalore, March 10-12, 1995. Cointreau, S. 1982. Environmental Management of Urban Solid Wastes in Developing Countries, Washington.D.C: Urban Development Department , World Bank. De Souza, Asha. 1991. The Waste That People Want: An Intermediate Report on Solid Waste Collection and Disposal in Bangalore, Mimeo. Furedy, C, 1990. "Social Aspects of Solid Waste Recovery in Asian cities", Environmental Sanitation Review Series, No.39 Bangkok: Environmental Sanitation Information Center. Ghosh D. and Susmita Sen, 1987. Ecological History of Calcutta Wetland Conversion, Environmental Conservation, Vol 14, No.3. Gopalkrishnan, K.R. 1993. Towards Better Environment - A Project Proposal for Upgrading Solid Waste Management in the City of Cochin, Loughborough: Waste Engineering and Development Cenre, University of Technology. Governemnt of India, 1995. Report on High Power Committee on Urban Solid Waste Management in India, New Delhi, Planning Commission. Huysman, M. 1994. "Solid Waste Recovery, Reuse and Recycling: Formal and Informal Aspects of Production and Employment in Indian Cities", in Baud, I. and H. Schenk, eds., Solid Waste Management: Modes, Assessments, Appraisals and Linkages in Bangalore, Delhi: Manohar Publications. Mishra, G.K. and R. Gupta. 1982. Organisation and Management of Solid Wastes in Delhi, New Delhi: Indian Institute of Public Administration. Mukherjee, N. 1993. "Solid Waste Management of the City of Calcutta", Paper Presented in Regional Workshop on Solid Waste Recycling and Reuse in Developing Countries at Manila, 20- 22 January. NEERI. 1994. Solid Waste Management in Greater Bombay, Nagpur: NEERI. Rajabapaiah, P. 1990. Preliminary Study on Energy From Bangalore Garbage, Bangalore: ASTRA, Mimeo.
Technical and Economic Analysis of Composting Enterprises in Bangalore - India WASTE, December 1997
20
Rao, M.J. 1994. "Note", Prepared for Indo-French Seminar on Solid Waste Management, 25th to 27 th April at New Delhi. Rao, M. J. 1990. "Environment and Solid Waste Management", in Sahani, A. ed., Health of the Metropolies : Bangalore, Bangalore: ISHA. Ravindra. A., "Swabhimana News", Swabhimana Newsletter, (Bangalore) undated. Shah, E. 1996. Capacity Building at local level: Health and Environmental Impact of Solid Waste Management in Bangalore, Bangalore: WasteWise. Shoba, S. and Dhanalakshmi. 1994. Approaches to Urban Solid Waste Management: Linkages Between Formal and Informal Systems of Source Separation and Recycling: a profile of Madras, Madras: Nayudamma Science Foundation. Soni, S.L. and A.A. Basha. 1992. A Case Study Report on Slum of Baroda Municipal Corporation, Memio. Swabhimana, Guidelines for Decentralization of City Waste Management, Bangalore: undated. Tchobanoglous, G., H. Theisen, and R. Eliassen, eds., 1997. Solid Wastes, Tokyo: McGraw - Hill. UNDP, World Bank Waste and Sanitation programme. 1993. Community Based Waste Management: Panaji Case Study, New Delhi. University of Newcastle, 1992. A Case Study Report on Solid Waste Management of Rajkot Corporation, Memio. Van Beukering, Pieter. 1994. "The Recycling Sector in Bangalore: An Economic Analysis of Different Types of Formal and Informal Entrepreneurs Recovering Urban Waste", in Baud, I. and H. Schenk, eds., Solid Waste Management: Modes, Assessments.Appraisals and Linkages in Bangalore, Delhi: Manohar Publications. Waste Wise. 1995. A Survey of Waste Pickers in Two Settlements of Bangalore - a Report Prepared for Bangalore Urban Poverty Alleviation Programme, Bangalore.

Technical and Economic Analysis of Composting Enterprises in Bangalore - India WASTE, December 1997
21
CHAPTER 2 TECHNICAL AND ECONOMIC ANALYSIS OF COMPOSTING ENTERPRISES: KARNATAKA COMPOST DEVELOPMENT CORPORATION LIMITED
2.1 General Overview
2.1.1 History
Solid Waste Management and establishment of compost plants in various cities in India was started on the recommendation of the committee on Urban Waste Management headed by a technical team in 1970. The Government of India gave capital subsidy to start 24 compost plants in major cities by Agro Industries Corporation or municipal corporations. 10 plants were started in Ahmedabad, Bombay, Bangalore, Baroda, Delhi, Calcutta, Jodhpur, Jaipur, Kanpur and Vijayawada around 1975. Due to technical snags and financial losses, all of them were closed down except the Bangalore plant, i.e., Karnataka Compost Development Corporation (KCDC). KCDC was started based on the World Health Organisation experts' report. Its main semi mechanized plant was commissioned in 1978. KCDC is a subsidiary of Karnataka Agro Industries Corporation Limited (KAIC), was set up by Karnataka Government and is managed as an autonomous body. It was established with a subsidy (grant in aid) of Rs. 29.00 lakhs1 by Government of India, towards capital cost. KAIC contributed Rs. 26 lakhs, Bangalore City Corporation and Karnataka State Co-operative Marketing Federation Limited contributed Rs. 12.00 lakhs1 each, and in addition Rs. 12.53 lakhs was borrowed as loan from State Bank of India. The share capitals now is Rs. 100 lakhs. The office and plant are situated in its own land of 15 acres and 10 guntas at Haralakunte, Singasandra Post, Bangalore.
Objectives
The main objectives with which KCDC started are: - Collection, transportation and treatment of all kinds of domestic, market, institutional and
street refuse. - Production and marketing of all kinds of organic manure and to convert it into compost, deal
in materials, chemicals otherwise required for the manufacture of organic manure of better value.
- Promote the use of compost and all other kinds of organic manure. Establish demonstration farms and encourage and assist farmers to use compost and organic manure.
- Promote waste disposal and establish or assist associations, organisations and co-operatives with capital, loan, credit resources and the like.
- KCDC has adopted a pronged strategy to achieve the main objectives. First, the environmental objective is to hygienically dispose the Solid Wastes of Bangalore city; and the second, economic objective, is to produce compost to make the enterprise self-sustained.
Technology
The mechanical compost plant was manufactured and erected by M/s. Fertiplant Engineers Co. Pvt. Ltd., Bombay at the cost of Rs. 41.25 lakhs. The plant had designed capacity of 200 MT per day. The machinery consisted of payloaders for loading, unloading and windrowing. Auger for turning and decomposing in windrows, tractors and trailers, and conveyors, magnetic separators, rasping machines for crushing, and screening plant for grading. Although the designed capacity was 200 MT per day, the actual production level achieved was only 20 MT per day between 1 1 lakh = 10 million 17

Technical and Economic Analysis of Composting Enterprises in Bangalore - India WASTE, December 1997
22
1977 and 1985. The main plant became dysfunctional during the year 1985 and was found uneconomical to repair. At this time KCDC switched over to smaller capacity screening plants. At present, 100 Mt of mixed garbage is handled per day. Two numbers of screening plants containing 40 mm screen for producing grade B and C compost and 10 mm screen for producing grade A compost are obtained. These screens contained middle shaft around which the fine screen mesh rotates. Clogging of the shaft is a main problem as two hours running requires 2 hours of cleaning. In 1993, a horizontal vibrating screen was designed and fabricated by KCDC staff. At present, two sieving drums each with the capacity of 10 MT per day and vibrator screen with capacity of 25 MT per day are operated. Other machinery include two front loaders and auger to mix the garbage windrows. A cow dung slurry spraying machine was acquired but is not in use now.
Production, Sales and Revenue
Following is an overview of production, sales and revenue of compost from 1991-92 to 1995-96: Year Garbage
Consumed in MT
Production in MT
Sales in MT Revenue in lakhs Rs.
Expenses in lakhs Rs.
Profit/Loss in lakhs Rs.
1991-92 13622 6217 5277 25.08 34.16 (-)9.08 1992-93 14355 6525 5479 27.15 34.85 (-)7.70 1993-94 17287 9507 5478 39.64 43.05 (-)3.41 1994-95 20906 11499 5545 61.72 59.94 1.78 1995-96 17490 9622 6454 96.34 95.28 1.06 For 1996-97, unto end of September '96, KCDC produced 4265 MT of organic manure and sold 3874 MT and realised an amount of Rs.45 lakhs and incurred an expenditure of 35.29 lakhs (before depreciation) and there is a surplus of Rs.9.71 lakhs. The Corporation receives a grant-in-aid of Rs.10 lakhs every year for the production of the compost at Rs.75/- per MT and transport subsidy of Rs.30/- per MT which is passed on to farmers in the form of subsidized cost of transportation of manure. Comparative Monthly Sales Statement & revenue for 1994/95 and 1995/96
1994 - 95 1995 - 96 Month Qty. in MT Value in lakhs in
Rs. Qty. in MT Value in lakhs
inRs. April 204 0.90 283 2.82 May 503 2.22 534 5.82 June 840 3.58 517 5.41 July 477 2.62 585 6.91 August 565 3.10 480 4.40 September 725 4.39 657 8.18 October 414 3.22 409 3.57 November 320 3.24 751 8.03 December 312 4.74 385 4.15 January 288 2.94 474 4.98 February 260 3.42 329 3.37 March 637 5.35 1050 13.12 Total 5545 39.72 6454 70.76

Technical and Economic Analysis of Composting Enterprises in Bangalore - India WASTE, December 1997
23
The enterprise has generated a surplus of Rs. 1.78 lakhs after depreciation during 1994-95 for the first time in 20 years, and added Rs. 15.00 lakhs as capital assets. As of 1995-96 the accumulated loss is reported to be 98.18 lakhs.
2.1.2 Management Structure
Constitution of the Board
KCDC is a subsidiary unit of Karnataka Agro Industries Corporation Limited (KAIC) and it has 8 Board members who are not required to hold any qualification shares. As per the provisions of section 255 of the Companies Act, 1956, KAIC has the right, as long as it continues to be the holding company of KCDC, to appoint one-third of the total number of board of Directors of the Company and to remove any or all of them at any time and appoint one or more Directors to fill up the vacancies caused by the removal of Directors. The share is under the control of the Directors, as it is a limited company, who allot or otherwise dispose the same on terms and conditions the Directors think fit. The business of KCDC is managed by the Directors and they can appoint Adviser, Managing Director, Executive Director or whole time Director(s) for a fixed term not exceeding 5 years at a time. The board of directors comprises, managing director of KAIC and a senior official from BCC, they being share holders of KCDC. In addition, the director of horticulture and agriculture of Karnataka Government are appointed as board of directors of KCDC. A microbiology professor from Agricultural University also is appointed. Apart from the other conditions as mentioned in the Memorandum and Articles of Association, the Government of Karnataka can issue directions or instructions in regard to the affairs or the conduct of the business of the company. The Directors have to comply with directions or instructions so issued.

Technical and Economic Analysis of Composting Enterprises in Bangalore - India WASTE, December 1997
24
Organisational Chart
There are totally 46 full-time and permanent employees at KCDC plant and the daily labor constitutes to around 25 persons.
2.1.3 Composting Process
Waste Flow
KCDC has a capacity to handle 100 MT of mixed waste every day, however, 200 MT of mixed waste is received at site. The production level is 50 MT of organic manure i.e. compost
Chairman (represented KAIC, Shareholder)
Managing Director (represented KAIC, Shareholder)
Director
Manager (Production & Marketing)
Asst. Manager (1) Administration
Asst. Manager (1) (accounts)
Asst. Manager (1) (Production & Marketing))
Personal assistant (1)
Sales (1)
Senior Assistant
Senior Mechanic Driver / Welder (2)
Senior Drivers (8)
Helpers/Watchman/Attender (24)
Sr. Assistant (1) Production Supervisor (1)
& Sales Assistant/
Junior Sales Assistant (5)

Technical and Economic Analysis of Composting Enterprises in Bangalore - India WASTE, December 1997
25
everyday. The municipal lorries transport the mixed waste to the KCDC yard. The composition of the mixed waste is approximately 60% of organic waste, mainly from the residential and market areas, while the rest 40% is plastic, glass, paper, iron, syringes (clinical waste), clothes, rubble etc.
Composting Method
Designed: KCDC has adopted simple aerobic decomposition in windrow method. The garbage I received is arranged neatly in windrows after segregation of contraries on the concrete I platform of 5 acres. A nitrogen fixing innoculent is sprayed on the garbage to speed up j decomposition and to reduce odors. Sometimes cow dung slurry is also sprayed. The i windrows are turned with the help of auger and front end loaders for proper aeration once '. in 5 days so that aerobic process continues un-interrupted. Water is sprayed as and when j required depending on the moisture content. The decomposition is continued for about 3 to 4 weeks and the degraded compost is : fed to the screening plants to produce different grades of organic manure. Organic manure obtained is in two forms, viz. organic manure in pure form and organic manure in enriched form. The latter has more micro nutrients with enrichment at the stage of decomposition. The decomposed mass is lifted with front end loaders on top of the siever having j 10mm and 25 mm sieve. Both the coarse and finely sieved compost are heaped under the shed and mixed with additives and packed as per the order. The residue is sold to a contractor annually.
Actual: The process mentioned above is followed in ideal conditions which rarely prevail. Two years backlog of waste dumped in the yard is hardly turned regularly. As mass is not frequently turned, it generates odor when mixed. The smell level on site is also comparatively high, however, it may be due to huge backlog of decomposing mass. The decomposing mass due to temperature rise catches fire or fumes are emanated. Highly decomposed mass is sieved and heaped under the shed where it rarely watered. Lack of proper process control results into serious loss of nutrients and carbon. The heavy metals may not be removed and pathogens and weed seeds may not be destroyed. The end result is that the compost is taken by farmers as soil conditioner rather than fertilizer. Although part of the compost is enriched with neem oil, gypsum, cow dung, rock phosphate and poultry litter and sold under the brand name BIO AGR RICH farmers still treat it as soil conditioner. Besides, small bits of broken glass, rags, needles, metal etc., are able to pass through 25 and 40 mm seive as mixed waste is used as raw material ( see pp 107, 108 for quality analysis of compost). KCDC has an arrangement with the local contractor to separate inorganic part from the mixed waste. The contractor manages men and machinery and pays annual lump-sum amount to KCDC.
2.1.4 Bottlenecks
- KCDC finds it difficult to procure compostible garbage. KCDC has requested BCC to get garbage of vegetable origin from market areas to the plant site. In this connection BCC has suggested KCDC to take over the contract of lifting the garbage from the market area.

Technical and Economic Analysis of Composting Enterprises in Bangalore - India WASTE, December 1997
26
- The waste received at the site is mixed often with chemicals and huge load of clinical waste. This generates problem not only at the time of processing, clogging the sieving machines and causing injuries to the staff but gives inferior variety of product. Most of the farmers and urban households who buy KCDC compost complained about needles, glass and metal pieces, plastic, rag and leather mixed with compost. Mixed nature of waste is a bottleneck.
- The rejects after sieving along with other material such as debris dumped in KCDC land occupies almost 2 acres of land which could otherwise be used productively.
- On an average 200 MT of garbage is received at the site everyday whereas the production capacity of the existing infrastructure could be stretched only to 50 MT of compost per day at best. This results in piling up of the garbage in huge quantity. As per an estimate 2 years backlog is piled up at present. Less efficient technology coupled with mixed nature of waste are the major bottlenecks.
- Compost is heaped after production awaiting for the takers. Heap is hardly watered during this period. Exposed compost looses carbon by evaporation which reduces nutrient value of the compost.
- Although 4 varieties of compost are developed with some efforts of value addition, finding market is a major problem.
2.1.5 Future Plans
• Solid Waste Management in the Bangalore Mega City project is entrusted to KCDC by earmarking Rs.6 crores for revitalizing the existing plant, starting two more compost plants and a fuel pelletising plant. With this there will be increase in the intake capacity of solid wastes and production of organic manure. • KCDC is planning to offer Consultancy Services for setting up of compost plants elsewhere in India at nominal charge. • It is setting up a bio-fertilizer plant to provide value addition to the compost products. • KCDC will enter into contracts with BCC to lift waste from the urban & market areas, which will not only be a source of income but ensure smooth flow of raw material, especially organic waste.
2.2 Financial Analysis
2.2.1 Average Production
The average production for the year 1995-96 is 96,22 tones of Compost.
2.2.2 Running Costs
Cost of Labor
Table 4. Staff Staff Number Salary for
1995-96 in Rs. Bonus or gifts for
1995-96 in Rs. Permanent employees 46 Laborers 25 Total 20,81,000 65,000 Total 21,46,000 The Actual Cost of labor per tone of compost = Rs.21,46,000/96,22 tones
= Rs.223.03

Technical and Economic Analysis of Composting Enterprises in Bangalore - India WASTE, December 1997
27
2.2.2. Cost of Materials
Table 5.Materials Component Source Quantity in kgs Cost
(Purchase price in Rs.)Urban Waste Bangalore City
Corporation 1,74,90,000 11,66,000.00
Additives type 1 -Neem oil cake 2,71,000 type 2-Gypsum 4,96,000 type 3-RockPhosphate - type 4-Cowdung - type 5-Poultry litter 3,87,000 9,81,000.00 Packing material - HDPE bags
Lakshmi Polymers, Bangalore
5800 nos.
7,00,000.00 Power & Fuel - - 2,62,000.00
Tools or Equipment - - 50,777.00
Cost of Raw Material The organisation does not incur any costs on raw material as there is an MoU signed between BCC and KCDC for the supply of waste. Therefore cost of waste is taken as hidden cost. KCDC consumed 17490 metric tones of garbage for the year 1995- 96. The hidden cost = 17490 MT / 4.5 MT (average capacity of a lorry transporting garbage by BCC) = 3887 truck loads BCC pays Rs. 300 per truck load to the private contractor for the transportation of garbage from the city to the dumping site. Therefore, the transport costs incurred by BCC to transport the garbage to KCDC = 3887 truck loads x Rs. 300 = Rs. 11,66,000. Hence, hidden cost of waste per tone of compost = Rs. 11,66,000/96,22 tones
= Rs. 121.18
Cost of Additives and Packing Materials Cost of Additives & Packing materials per tone of compost
= Rs. 1,681,000.00/ 96,22 tone = Rs. 174.70
The total amount spent indicated here is inclusive of transportation.
Cost of Energy Actual cost incurred by the enterprise for power and fuel per tone of compost
= Rs. 2,62,000 / 96,22 = Rs. 27.23

Technical and Economic Analysis of Composting Enterprises in Bangalore - India WASTE, December 1997
28
Cost of Spare parts and Maintenance Actual cost incurred for the cost of spare parts and maintenance per tone of compost
= Rs. 50,777 / 96,22 tone =Rs. 5.27
Cost of Bought-in-Services
Actual costs for bought-in-services is maintenance of machinery. Actual Cost of Bought-in-Services per tone of compost made
= Rs. 2,99,000 / 96,22 tone = Rs. 31.07
Cost of Rent
All land, building and machinery used in the production of the compost is owned by the enterprise. However, there is opportunity cost connected with land which is calculated as below. Monthly leasing rent KCDC may obtain = 50,000 Rs./acre Annual leasing rent KCDC may obtain from 15 acres of land = 7.5 lakhs2
x 12 = 90 lakhs Opportunity cost per tone of compost = 935.35 Rs.
Table 6. Fixed Assets register Price and Value of Asset in Rs. Depreciation Cost
Per kg of Compost Name of Asset Year of
Purchase Estimated Total Life Time (yrs)
Historical Purchase Price
Replacement Value
Hidden Value
Residual Value
Actual Cost
Hidden Cost
Buildings 1 Plant, 1 Administration Block, 1 Ammunity Block, 5 Acres of Concrete yard
1978 30 yrs 19,10,000 95,50,000 76,40,000 96,000 6.28 26.46
Vehicles 1 Maruti Van 2 Trucks
1993
1989/93 14 yrs14 yrs
3,63,00022,53,00
2,00,0002,00,000
1,63,00025,300
18,150 11,265
2.561.59
1.210.18
Machinery 5 Payloaders 2 Auger Machines 5 Vibrator Screening Plants 3 Rotating Screening Plants
1989 1977 1994 1990
20 yrs20 yrs20 yrs20 yrs
24,07,0004,16,0002,05,000
75,000
30,00,00010,00,0003,00,0001,20,000
5,93,0005,84,000
95,00045,000
1,20,350
20,800 10,250 3,750
11.882.051.010.37
3.083.030.490.23
Equipment Office Furniture Water Borewell
1978 1977
30 yrs20 yrs
12,93535,000
20,0001,00,000
706565,000
647
1750 0.040.17
0.0240.33
Total 25.95 35.034
2.2.3 Cost of Depreciation
Under section 205 (2) of the Indian Companies Act, the depreciation for the fixed assets can be calculated by various methods. It is assumed on the basis of Straight Line method adopted for the purpose of this study that 5 per cent of the historical purchase price will be residual value at the end of the life time of the asset. On the basis of the advise from an expert Chartered Accountant, the life time of vehicles and machinery is estimated 14 years whereas for buildings, it is anywhere between 20 to 30 years. Replacement value of vehicles and machinery are at current 2 1 lakh = 10 million

Technical and Economic Analysis of Composting Enterprises in Bangalore - India WASTE, December 1997
29
market prices. However, for buildings, equipment and tools they are calculated @ 10 per cent inflation per year.
2.2.4 Cost of Grant Capital
Loan taken from State Bank India is paid back. It is assumed that instead of grant capital contributed by various organisations, if KCDC had to take loan to raise capital in 1978, it would have paid it back in 12 years of time. This analysis is for the year 1995-96, cost of grant capital is not calculated.
2.2.5 The Cost Price of Product
Table 7 Cost Price of the product Cost Item Average Unit Cost per kilogram of Compost Actual cost Hidden cost Cost of labor 223.03 0.00 Cost of materials: cost of raw materials 0.000 121.18 cost of additives & packing materials 174.70 0.000 cost of energy, water & tools 27.23 0.000 cost of miscellaneous 5.27 0.000 Total of material cost 207.20 121.18 Cost of bought-in-services 31.07 0.00 Cost of rent 0.000 935.35 Sub-total of running cost 461.30 1056.53 Cost of depreciation 25.95 35.034 Cost of interest 0.000 0.000 Sub-total of capital cost 25.95 35.034 Cost price 487.25 1091.564
2.2.6 Cost of Taxes
There are no taxes paid by the enterprise as it is exempted from taxes under the Companies Act. As the enterprise manufactures organic fertiliser, it is exempted from the product taxes and since it is government sponsored, it is further exempted from corporate taxes. Hence there are no Actual or Hidden Costs calculated for taxes.
2.2.7 Revenue
Revenue from Compost Sales
For the year 1995-96, the total revenue from compost sales recorded is Rs.9634000. Hence the average sales price per kilogram of compost = Rs. 9634000 / 96,22 tone
= Rs. 1001.24
Revenue from Supporting Agencies/Subsidies
Revenue from production subsidy is received from the Government of Karnataka @ Rs. 75 per metric tone. Hence the subsidy per kilogram of compost = Rs. 75

Technical and Economic Analysis of Composting Enterprises in Bangalore - India WASTE, December 1997
30
Revenue from Waste Recovery
KCDC has an arrangement with local contractors for sorting and lifting recyclables from the factory. The contractor pays Rs.8000 per annum to the enterprise. He employs waste pickers and transports them to his godown at his own cost. Sales price of recyclables per kilogram of compost = Rs. 8000 / 96,22
= Rs. 0.83
2.2.8 Profitability Statement
Table 8. Profitability Statement for the year 1995-96 Item Rs. Per kilogram of
Compost Produced Revenue Revenue from tariffs 1001.24Revenue from subsidies 75.00Revenue from waste recovery sales 0.83Total revenue 1077.07Actual running cost 461.30Gross profit 615.77Actual capital cost 25.95Net profit before tax 589.82Cost of taxes 0.000Net profit after tax 589.82Hidden cost 1091.564Net loss after tax 501.744
2.3 Marketing Analysis
2.3.1 Market Segments
KCDC markets compost in three states of South India, viz., Karnataka, Tamilnadu and Kerala through Dealers network. Majority of consumer segment are farmers, urban house owners and Government institutions. The farmers either buy directly from KCDC or indent through the dealers or buy from KAIC outlets from their own taluks. These farmers are mostly located in rural areas and are usually those owning more than five acres of land. KCDC also sells to the marginal farmers through State Agriculture Departments with 50 per cent subsidy, under a scheme to promote organic farming. The compost was once distributed to the farmers of a district adopted by state agriculture department. In addition, big & small farmers, plantations (tea, coffee, areca-nut), farms and vegetable gardens are potential customers. KCDC's other major customer are the Government Departments such as Sericulture, Horticulture and Forest Departments. KCDC also sells compost through the 'Agro-Kendras', the outlets of KAIC, located in each taluk of the state. They sell agricultural inputs to the farmers, and also act as vehicles for implementation of the state and central agriculture schemes to the farmers.

Technical and Economic Analysis of Composting Enterprises in Bangalore - India WASTE, December 1997
31
Table 9. Demand per Market Segment Market Segments Geographic Area Demographic
Conditions, Behavior Compost sold in kgs. (Aug'95-Sep '96)
Farmer/ Floriculturists/ Nurseries/ Plantations
Karnataka, Tamilnadu & Kerala
Big, and Small Plantations, Farms, paddy, vegetables & others Farmers
20,36,000
Urban Household Bangalore Law & High Income 3,60,000 Government Departments
Karnataka Sericulture, Horticulture, Forest and Agriculture Departments
4,78,000
Dealers Bangalore Karnataka, Tamilnadu & Kerala
23,20,000
Retailers (KAIC) Bangalore Govt. Retail Outlets spread all over the state to provide agricultural inputs to the fanners
12,60,000
Total 64,54,000 Note : For the analysis of marketing segments and demand, the urban households & government departments are treated as separate categories. Rest of the sales is treated as sales to the farmers directed, including dealers and retailers.
2.3.2 Market Share of Compost
Conversion Factor
We came across a complex system when tried to develop conversion factor to specify how many kilos of compost is equivalent to one kilo of chemicals or manure. Following is an account to indicate the basis on which compost can be compared with the other two forms of fertilizer. This is analysed in the perspective of mechanism of fertilizing. The fertilizing effect of any fertilizer is analysed in terms of available nutrients such as N (Nitrogen), P (Phosphorus) and K (Potash). These nutrients are available to a plant in the form of N2O and NO3 in case of Nitrogen, KCL for Potash, and P2O as Phosphorous. It is estimated that 0.75 to 1 per cent of N, 0.5 to 1.25 per cent of P and 0.75 to 1.25 per cent of K remains in the body of a plant as a constituent of dry matter (i.e. after 15 per cent of the moisture is removed). That means 1 kg of dry matter multiplied by per cent remains of NPK in the plant as a dry matter will give theoretical value of required NPK by that particular plant. Of total demand of NPK by plant 30 to 35 per cent is mineralized from NPK available in the soil itself. The rest is balanced from outside sources which may be chemical fertilizer, farm yard manure or compost. Moreover, not all NPK of a fertilizer are available to a plant. In case of chemical fertilizer, depending upon the type, 40 to 46 per cent N, 25 to 30 per cent P and 50 to 60 per cent of K are available to a plant. That means the rest is wasted, i.e., evaporated, leached out in run off or in the ground water table. In case of organic fertilizers, which include FYM, compost and vermicompost, value of available NPK differ from batch to batch. It will not only differ based on the method employed for decomposition, i.e., aerobic, anaerobic or vermicomposting, but will depend largely on the process factors like ingredients of raw material, temperature control and composition of bacteria and earthworms present. Furthermore, even for similar method of composting, different batches will contain different NPK values. Hence, various references quote different figures of available NPK in organic manure or fertilizers. On an average, following values are suggested.

Technical and Economic Analysis of Composting Enterprises in Bangalore - India WASTE, December 1997
32
Table 10. NPK Value of Organic Manure/Fertilizer Available NPK FYM Vermicompost Compost %N 0.75 1 to 1.25 0.75 to 1 %P 0.5 to 1 0.75 to 1 3 %K 1 1.25 to 1.5 1 to 1.5 Source: Cooke, 1982 Although no amount of available NPK in the case of organic manure/fertilizers is wasted, they are released slowly and it takes three cropping seasons to completely make them available. On the basis of above discussion it is estimated that if 100 kgs. of chemical fertilizer provides 46 kgs. of nitrogen (@ 46 %) for the similar amount of available nitrogen, it will require 4600 kgs of vermicompost assuming 1 % available nitrogen. Further these 4600 kgs. of vermicompost will release the available nitrogen spread over three seasons. Hence, for one particular season it will require 4600 kgs. x 3 = 138,00 kgs. of vermicompost (based on the discussion with Dr. S. C. V. Reddy, Joint Director, Agriculture Inputs, Department of Agriculture, Bangalore). The Agriculture Department suggests 10 MT of FYM per hectares as against 118 kgs of chemical fertilizer. Above argument is refuted by Dr. Radha Kale, an expert on vermicomposting and Professor of Zoology at the University of Agricultural Sciences, Bangalore. She argues that available NPK are assimilated completely by a plant only if the soil is rich in microbial population. In reality only 16 per cent of the available NPK can be assimilated by a plant and rest is fixed in a form which cannot be assimilated by a plant unless broken down by bacteria. Therefore, if recommended dose of nitrogen is 1000 gms there will be 460 gms of theoretically available N at the rate of 46 %. From the applied chemical only 16 per cent will be assimilated by the plant, i.e., 73.6 gms. For the equivalent amount of nitrogen available, 7.36 kgs of vermicompost will be required. (Kale and Seenappa, 1997) The above calculation does not take into account the slow release of nitrogen over three seasons in case of vermicompost. If it is taken into consideration, for the equivalent amount of nitrogen to be released over three seasons, i.e., 73.6 x 3 = 220.8 gms, 22.08 kgs. of vermicompost will be required. Four different ratios developed are presented in the following table. Table 11. Conversion Factor Method Chemical Fertilizer in
kgs Vermicompost in kgs Ratio Fc = CF/VC
1. Dr.S.C.V. Reddy 1 138 0.007 2. Recommended dose
by agricultural department based on the similar logic of Dr. S. C. V. Reddy
118 10,000 0.011
3. Dr. Radha Kale 1 7.36 0.14 4. If 16% assimilation
of nitrogen of CF and 1/3 release of nitrogen from Vermicompost are taken into consideration.
1 22.8 0.04

Technical and Economic Analysis of Composting Enterprises in Bangalore - India WASTE, December 1997
33
Note : Above ratios are based on the hypothetical case in which 1% available nitrogen is assumed from vermicompost which may go up to 3 % depending upon the process control and ingredients in raw material. Having gone through this exercise we were left confused, and decided to meet another expert on organic farming. Dr. Shivshankar, a professor in Forestry in University of Agricultural Sciences, who proposed a framework by and large similar to the one prescribed by Dr. Radha Kale. The chemical fertilizer and organic manure or fertilizer have different functions to perform. Organic manure or fertilizer fixes atmospheric nitrogen and supply appreciable amount of other micro nutrients. It promotes the activity of soil-micro organisms which liberates carbon dioxide, speeds up chemical reactions in the soil and more plant food is made available. Organic acids produced during decomposition of organic manure helps to release phosphates and make them available for next cropping season. Organic manure improves structure i.e. chemical nature and texture i.e. physical arrangement of the soil particles, acts as binding material and increases overall water absorptive, percolation and holding capacity of the soil. Each application of organic manure increases soil fertility for the next cycle of cropping. (Gowda, 1997) All these advantages, which invariably lead to higher yields, are difficult to quantify. Comparing organic manure or fertilizer with chemical fertilizer only on the basis of available nitrogen, is therefore, misleading. Each successive cycle of cropping will require progressively less amount of organic manure/fertilizer, while the reverse is the case with chemical fertilizer. There have been various experiments to evaluate performance of organic manure or fertilizer (Shivshankar, 1995; Kale, Bano and Satyavati, 1991; Kale and Bano, 1994) which do not include comparison of yield of organic manure or fertilizer with that of chemical fertilizer even in controlled environment. Finally, we felt that the only way to compare both the systems, as we would like to call them, would be to compare the net economic returns of farmers exclusively following organic farming, with those dependent on chemicals. It is very rare to find an experienced farmer exclusively opting for chemicals, although it was not difficult to trace farmers following organic farming. Last, but not the least, there seems to be an apparent contradiction in the attempt (terms of reference : Marketing Analysis for a composting enterprise: methodology) to 'technically' replace chemicals and manure with compost, when it is acknowledged that they cannot replace each other, endorsing, as a result that both are different systems and can play complementary rather than competitive roles. Although, we ideologically believe that a system of organic farming (not just use of compost alone) can give comparable results to that of chemical farming (Kumar, 1996), we will have to wait till the scientific community comes up with comparative results based on long term experimentation. As we could not arrive at meaningful values of Fc and Fm, alternatively we present following case studies to understand share of compost in the total fertilizer market. Few case studies from each potential group of buyers were selected to understand their fertilizer demand-; We came across a pattern wherein varieties of fertilizers usually bought by a buyer. It further substantiate the point that the buyer do not perceive different varieties of fertilisers as mutually exclusive, whether theoretically it is possible or not is a different issue.

Technical and Economic Analysis of Composting Enterprises in Bangalore - India WASTE, December 1997
Table 12. Demand per Marketing Segments Name Type Consumption & Cost Chemical fertilizer FYM/ Animal
manure Terra-Firma Black Gold
KCDC compost BA/BAR
Others
Vol. in kgs
Cost in Rs.
Vol. in MT
Cost in Rs.
Vol. In MT
Cost in Rs.
Vol. in MT
Cost in Rs. Vol. in MT
Cost in Rs.
Taj West End Hotel, Institution … … 32 HM 8000 1 5000 … … 3KO 12 OC
6000 3600
Golf Course Institution 5000 U
12,000 …. … 10 70,000 … … … …
MEG & Cen tre Golf Course, Institution
1750 U 5500 SP
1750 P
6545 25,300
8050
…. … 2 10,000 200 1,42,000 … …
Das Flowers Floriculture … … …. … 2 9000 … … … … Prakash Alvares Landscape
Architect 1500 U 300 SP
500 S
5610 1380 2300
120HM 48,000 … … 20 22,000 8 OrC 8600
Prof. Somkrishnan Urban House hold 10U 4P
200 100
…. … 0.2 1050 … … 0.02GO 200
IIMB Institution 5000 U 15000 S
8750 60,000
60FYM 30,000 … … 10 6000 … …
Priya Horticulture Nurseries/ landscape
… … 30 HM 6 CD
50 GM
21,000 1800
45,000
… … 800 5,20,000 … …
Narasimha Murthy farmer 50 C 325 … … … 0.35 262.50 … … Bhushan farmer … … 60FYM 18,000 … … 17 13,600 20 6000 TMT India Ltd. Floriculture … … … … … … 10 8000 … … Sri Balaji Farms Farmer 15 U
20 C 80
115 4FYM 1200 … … 0.4 300 … …
Taj Residency Hotel, Institution 100 U 250 32FYM 9000 … … … … … … Vedavalli Narayan, Malleswaram
Urban Household … … 1 HM/CD 200 … … 0.15 500 20 CE 100
Nandi Farm Farmer … 3,00,000 40 FYM 1600 … … 10 18,500 20 V 50000

Technical and Economic Analysis of Composting Enterprises in Bangalore - India WASTE, December 1997
35
Name Type Consumption & Cost Chemical fertilizer FYM/ Animal
manure Terra-Firma Black Gold
KCDC compost BA/BAR
Others
Vol. in kgs
Cost in Rs.
Vol. in MT
Cost in Rs.
Vol. In MT
Cost in Rs.
Vol. in MT
Cost in Rs. Vol. in MT
Cost in Rs.
Krishna Kumari Menon, Jayanagar
Urban Household … … 0.5 HM 100 … … … … … …
Nagamani, Jayanagar
Urban Household … … 0.025 HM 50 … … 0.005 25
Lakshmi, Jayanagar
Urban Household … … 2HM 500 50 200
Lalitha Rathod, Rajajinagar
Urban Household … … 0.025 AM 30 0.025 75
Rachaana, JT, Rajajinagar
Urban Household … … 0.002 CD … 0.005 15
Nagarathna C.P, Rajajinagar
Urban Household … … 50HM 20CD
90 50
0.75 225
Forest Department Institution … … … … … … 35 … … … Agriculture Department
Institution … … … … … … 205 … … …
Horticulture Department
Institution … … … … … … 117 … … …
Sericulture Department
Institution … … … … … … 120 … … …
U - Urea; P - Potash, C- Complex; Su - Suphola; SP - Super Phosphate; HM - Horse Manure; FYM - Farm Yard Manure; CD - Cowdung; GM - Goat Manure; KO - Kissan Organic; BA - Bio Agro; BAR - Bio Agro Rich; OC - Own Compost; OrC - Ordinary Compost; GO-Green One; CE-Clean Environ, V-Vital.

Technical and Economic Analysis of Composting Enterprises in Bangalore - India WASTE, December 1997
36
2.3.3 Marketing Mix
Product
KCDC markets compost products as BIOAGRO, BIOAGRO RICH, B Grade, C Grade and Vermicompost. BIO-AGRO is the pure form of screened compost without any additives, whereas BIOAGRO RICH is enriched with additives such as Neem, Gypsum, Cowdung, Rock Phosphate, and Poultry Litter. B Grade is decomposed matter after 25 mm sieving and C Grade is decomposed matter without sieving. C Grade is rarely sold as it is the decomposed material before screening ( see pp 106-109 for further comments). In keeping tune with the market needs, KCDC also ventured into the production of vermicompost to cater to urban households and in addition, to sell to 100 per cent Export Oriented Units of the floriculture in loose and 2 kg packing. In the year 1995-96, the enterprise produced and sold 500 kgs. of vermicompost. Table 13. Product Brand Name Quality Size per
Unit Packing Volume
Produced MT/yr
Market Segments
Total Amount Sold MT/yr
BIOAGRO Organic manure, 10 mm sieved
loose 50 kg 25 kg
loose & HDPE bags
2225.0 Nurseries 1834.0
BIOAGRO RICH
Organic manure enriched with additives, 10 mm sieved
loose 50 kg 25 kg
loose & HDPE bags
4470.0 Farmers, plantations & others
3097.5
B Grade Coarse material Decomposed, 25 mm sieved
loose 50 kg 25 kg
loose & HDPE bags
572.0 Farmers for initial planting
194.0
C Grade Decomposed material without sieving
loose loose 2354.5 -- Negligible Sale
Vermicompost Earthworm loose loose & 0.5 Strawberry 0.5

Technical and Economic Analysis of Composting Enterprises in Bangalore - India WASTE, December 1997
37
Castings 2 kg LDPE bags Indoor plants, kitchen gardens
9622.0 5320.0
Place
KCDC sells compost through three different channels, viz., direct, retail network of KAIC outlets located all over Karnataka and dealers located in'Karnataka, Tamilnadu and Kerala. Table 14. Distribution channels Product No. Unit Distribution Channels Dealer Retailer
(KAIC) Direct from Enterprise
Total (in kgs.)
1 2 3 4 9 All products Location … KKA, TN,
Kerala KKA
Number # 18 153 - Direct sales kg/yr - - 28,74,000 28,74,000 Indirect sales kg/yr 23,20,000 1,26,000 - 24,46,000 Total 53,20,000
Pricing
The pricing is based on cost price and profit margin. BIOAGRO is sold at Rs.1000 PMT as loose and Rs.1550 PMT if bagged. BIOAGRO RICH is sold at Rs.1500 PMT as loose and Rs.1850 PMT if bagged. Vermicompost is sold at Rs.5000 PMT in loose and bagged. All the three pricing include transportation up to 100 kms. and free loading charges. A subsidy of Rs.30 PMT from Government is provided if the user segment is farmers. A dealer margin of 10% is given on loose and Rs.300 for bagged compost per metric ton, irrespective of the brands. The enterprise does not change price as per season as the decision making powers on prices is vested with the board of directors.

Technical and Economic Analysis of Composting Enterprises in Bangalore - India WASTE, December 1997
38
Table 15. Price Distribution Channel
BIO AGRO BIOAGRO RICH
Loose Bagged Loose Bagged
B Grade (loose only)
Vermicompost
Dealer Gross Sales Price 0.70 1.55 1.50 1.85 0.02 5.00 Discount/Bonus or dealers' margin
0.07 0.30 0.15 0.30 0.002 0.50
Net Sales Price 0.93 1.25 1.35 1.55 0.98 4.50 Tax/Subsidy 0.00 0.00 0.00 0.00 0.00 0.00 Customer Price 0.70 1.55 1.50 1.85 0.02 5.00 Enterprise Direct Sale
Net Sales Price 1.00 1.55 1.50 1.85 0.02 5.00 Tax/Subsidy 0.00 0.00 0.00 0.00 0.00 0.00 Customer Price 1.00 1.55 1.55 1.85 0.02 5.00 Note : All the above mentioned rates are inclusive of free transportation up to 100 kms. Only farmers get a transport subsidy of Rs.30 per MT from the Government of Karnataka. 3.3.4. Promotion The products are promoted through exhibitions and dealer seminars, press advertisements, direct mailing of literature to the customers and personal selling by the Marketing team of KCDC. Table 16. Promotional activities Entity Types of
Promotion Media Target Groups Goals Cost/ Year
inRs. All products Advertisement,
exhibitions, dealer seminars, pamphlets, personal selling
Print, dealer meetings
Farmers, government departments, horticulturists, dealers
Product promotion
1,09304

Technical and Economic Analysis of Composting Enterprises in Bangalore - India WASTE, December 1997
39
2.3.4 Marketing Positioning
In the absence of documentation of marketing data in the format required, it seemed extremely difficult task to fit the existing data in the framework of this study. The enterprise, at the best, could provide how much is sold through which marketing channel. However, the amount sold through each marketing channel is targeted to almost all the marketing segments and it is difficult to further know how much would have been sold to each of the marketing segments. The figures presented in the table 6.1 are indicative and on the basis of which the following tables are worked out. In such circumstances, it could be understood that sales in high and low season and expenditure of promotional activities for that particular segment can be least expected. Incompatibility of data between two competing brands was another stumbling block. For the sake of arriving at some reasonable understanding we have taken Terra-Firma compost as the only competing product. The sales data of which are recorded in a different fashion. However, for the sake of comparing at least these two products, three types of marketing segments are included. Big, small and plantations farmers, nurseries and Floriculturists are combined together. The urban households and institutions are taken separately. Table 17. Market-Positioning of Farmers/Nursery/Floriculture Segment
(Total Demand: 56,14,000 kgs.) Data Items Unit Enterprise Products Competing Products -Terra Firma Bio Agro B Grade Bio Agro Rich Black Gold A Black Gold C Black Gold E Black Gold F Black Gold G Sales & Price Data 1995/96 Sales volume MT/yr 1834 194 3586 1500 300 300 350 200 Customer price In Rs/kg 1.55 0.20 1.85 5.50 10.00 5.50 5.50 5.50 Sales revenue (Sales volume x customer price) In Rs/yr 28,43,000 39,000 66,34,000 82,50,000 30,00,000 16,50,000 19,25,000 11,00,000 Promotion Type Dealer meetings, discussions, seminars Media Dealer meetings Goal Product awareness, promotion of organic farming, sales

Technical and Economic Analysis of Composting Enterprises in Bangalore - India WASTE, December 1997
40
Table 18. Market/positioning of Urban Household segment Total demand 3,60,000
Data Items Unit Enterprises' Product Competing Products
KCDC Bio Agro Rich 25 kg pack
KCDC vermicompost 1 kg pack
Terra-Firma Black Gold B 1 kg pack
Sales & Price Data 1995/96
Sales volume MT/yr 360 500 150 Customer price in Rs/kg 1,85 5,00 15,00 Sales revenue (Sales volume x customer price)
in Rs/yr 6,66,000 25,00,000 22,50,000
Table 19. Market-Positioning of Institution Segment
Total demand: 4,78,000 kgs Data Items Unit Enterprises'
Product Competing Products
KCDC Bio Agro Rich
Terra-Firma Black Gold C
Terra-Firma Black Gold D
Sales & Price Data 1995/96
Sales volume MT/yr 478 50 450 Customer price in Rs/kg 1.85 5.50 5.50 Sales revenue (Sales volume x customer price)
in Rs/yr 2,84,000 2,75,000 24,75,000
2.3.5 Market Strategy
Few farmers from one district of Bangalore rural were interviewed to understand their perception about product quality. Similarly, households, institutions and nurseries/Floriculturists were randomly selected and interviewed. The findings are presented below.

Technical and Economic Analysis of Composting Enterprises in Bangalore - India WASTE, December 1997
41
Table 20. Marketing Strategy and Performance for Farmer Segment (inclusive of Floriculture, Horticulture, & Nurseries) Marketing Mix Instruments Enterprise Policy Perception of Customer Product The main objective of the enterprise is to
organically treat the urban waste and to sell the compost such produced is sold to recover cost.
- It is used as a soil conditioner along with FYM and chemical fertilizer.
- The product is not sterilized and generates weed culture.
- The product contains glass & metal pieces, needles, rags, plastic etc. which is not preferred for farming.
- Increase in water retention capacity and good growth of plant are registered.
Place Distribution through dealers in Karnataka and neighboring states and retail outlets of KAIC in all the districts of Karnataka.
Easily available through dealers in districts and also through KAIC outlets.
Pricing To provide the product at cost price with less margin of profits. To give subsidy to farmers in various ways.
The product is priced more than FYM or animal manure and since it has almost equivalent results, small and marginal farmers are not ready to use if the price are not subsidized.
Promotion Promote product through various departments of agriculture.
It needs to be further promoted.
Overall performance of the enterprise in this segment
KCDC seems to be the leader at present compared to the main competitor, Terra-Firma, mainly due to its long-standing existence. Promotion through government departments and subsidized pricing helps, but product in itself may not do well without substantial improvement.
Opportunity/bottlenecks for improvement Mixed nature of waste taken as raw material for compost production is the main bottleneck even with 10 mm sieving the fine glass pieces and needles are not removed. Secondly, although the process is aerobic decomposition, lack of proper process control has its impact on lower NPK value, loss of carbon, survival of pathogens and weed seeds.
Performance of competitors in this market segment Terra-Firma being the major competitor in this segment, it is perceived to be an up-market product. It is not cost effective for marginal farmers and hence it is catering to big farmers and farm houses only. Hence at that level with subsidies given by Government, KCDC is the only product in the market. However, if the support and subsidies given are withdrawn, how far the product can survive is doubtful.

Technical and Economic Analysis of Composting Enterprises in Bangalore - India WASTE, December 1997
42
Table 21. Marketing Strategy and Performance for Urban Households Marketing Mix Instruments Enterprise Policy Perception of Customer Product Conversion of organic waste into compost. Not as good in quality as horse manure or cow
dung Place Reach through direct sales, door delivery given for
phone orders. Easily available from the office and door delivery
Pricing To provide the product at cost price with less margin of profits.
Prices are high compared to horse or cow manure
Promotion Pamphlets and brochures are printed and circulated by no vigorous efforts to promote the product.
The product is known in the segment more than the competing Terra-Firma due to its environmental aspect connected with it and due to long-standing existence.
Overall performance of the enterprise in this segment
KCDC compost price is high compared to animal manure or FYM. To provide a quality product, the enterprise is manufacturing vermicompost for kitchen gardens but yet to systematically promote it.
Opportunity/bottlenecks for improvement KCDC should increase production of vermicompost as it seems to be acceptable product than ordinary compost by this segment. Also branding and packaging is necessary to target this segment.
Performance of competitors in this market segment Terra-Firma is the major competitor in this segment along with CBOs. The strategy adopted by Terra-Firma for door to door sales of 1 kg packets and through HOPCOMS outlets seems to be reaching this segment well. Compost produced at community based solid waste management programmes can relatively do better, if expanded enough, as the feeling of'own-project' is there.

Technical and Economic Analysis of Composting Enterprises in Bangalore - India WASTE, December 1997
43
Table 15.3: Marketing strategy and performance for Institutions (inclusive of government, educational institutions, golf courses etc.) Marketing Mix Instruments Enterprise Policy Product Urban waste conversion into compost and selling
at subsidized rates. - Contains less NPK compared to FYM. - Not sterilized and promotes weed growth. - Good soil conditioner.
Place Reach through direct sales and through government departments.
Easily available from the office and door delivery.
Pricing To provide the product at cost price with less margin of profits
- Prices are high compared to horse or cow manure.
- Prices are high on the basis of structure, texture and NPK content.
Promotion Promotions through government departments Needs further promotion. Overall performance of the enterprise in this segment
KCDC compost is used as a soil conditioner in replacement of FYM or animal manure.
Opportunity/bottlenecks for improvement Market promotion through government departments has its own disadvantages. Performance of competitors in this market segment Terra-Firma is the major competitor in this segment due to its marketing strategy and quality product,
although price is high.

Technical and Economic Analysis of Composting Enterprises in Bangalore - India WASTE, December 1997
44

Technical and Economic Analysis of Composting Enterprises in Bangalore - India WASTE, December 1997
45
REFERENCES FOR CHAPTER 2
Cooke, G.W. 1982. Fertilizing for Maximum Yield, London. ELBS. Gowda, A. 1997. "Role of Green Manures and Green Leaf Manures in Organic farming," in Training Course on Organic Farming, Bangalore: University of Agricultural Sciences. Kale, R. and Sunita Seenappa, 1997. "Earthworms in Agriculture," in Training Course on Organic Farming, Bangalore: University of Agricultural Sciences. Kale, R., Kubra Bano, Sunita Seenappa, and Gangadhar, 1994. Promotion of Vermicomposting for Production of Organic Fertilizers, Bangalore: University of Agricultural Sciences. Kale, R., Kubra Bano, and G.P. Satyavati, 1991. Influence of Vermicompost Application on Growth and yield of Cereals and Ornamental Plants, Bangalore: University of Agricultural Sciences. Kumar. D. 1996. How organic is Organic Farming, Anubhav, April. Shivshankar.K., (ed), 1995. Alternatives to Fertilizers in Sustainable Agriculture, Bangalore: University of Agriculture Sciences.

Technical and Economic Analysis of Composting Enterprises in Bangalore - India WASTE, December 1997
46
CHAPTER 3 TECHNICAL AND ECONOMIC ANALYSIS OF COMPOSTING ENTERPRISES: TERRA-FIRMA BIOTECHNOLOGIES PRIVATE LIMITED
3.1 History
3.1.1 Motivation
“Terra-Firma Bio-Technologies Limited was motivated with the opportunities the liberalization brought about in India when the future for chemical fertilizers looked bleak due to decreasing subsidies and eventual soaring prices. Also, the generation of solid and liquid wastes is creating a problem and the solution lies in recycling. The organic waste, specially, generated in Bangalore is not being handled well by the Bangalore City Corporation due to infrastructure problems”. This vision of Mr. Ganesha, Managing Director of Terra-Firma having Chemical Engineering background started the project on vermicompost production from urban waste in 1991. Terra-Firma is one of the first private enterprises in India which produces organic fertilizer from urban waste by the method of vermicomposting on relatively larger scale. Mr. Ganesha, with one and a half decades of experience as a Managing Director of Blue Crystal Agro, a sister concern of Terra-Firma was well conversant with agriculture products market at the time of starting Terra-Firma. Blue Crystal Agro has been producing agro chemicals and bio-fertilizers since 1985 with the brand name of Black Gold. The commercial production started in January 1994 on 6 acres of land on Bannerghatta main road at the outskirts of Bangalore. The land owned by Managing Director is used first for the experimentation and finally for the production. It is situated 25 kilometers away from the center of the city. Before the actual production started, 3 years were spent in experimenting the process, cultivating earthworm population and at the same time creating demonstration blocks in various districts for marketing. The product with brand name was on the shelf by 1995. Prior to that the product was sold in small quantities.
3.1.2 Organization
Terra-Firma is a public limited company with shareholders. The board of directors are elected every year. The required expertise is built in-house and the company has a staff of 6 persons at managerial and middle managerial level, 6 to 10 consultants working with it other than the 60-75 number of laborers at factory. A Production Manager in charge of production and Manager in charge of raw material are full time employees of the company whereas services of the consultants are hired as and when required. Market identification and development was initially done by the company itself but later in 1996, complete marketing was handed over to Rallies India.

Technical and Economic Analysis of Composting Enterprises in Bangalore - India WASTE, December 1997
47
Terra-Firma Bio-Technologies Ltd., is operating in the following fields: - liquid and solid waste conversion into vermicompost - culture of earthworms, bacteria and fungus - formulations for different crop applications Existing capacity of Terra-Firma in Bannerghatta plant spread over 6 acres of land, where compost is produced, is about 3300 MT per annum. Exact description of the asset possessed by the enterprise is mentioned in the fixed assets register. The management structure is evolved on trial and error which is presented below.
3.2 The Process
3.2.1 Procurement of Raw Material and Additives
Availability of organic waste without contamination of inorganic elements is a crucial factor for the quality production of vermicompost. The enterprise, initially, bid for the contract to lift vegetable market waste at BCC. It provided fairly uncontaminated organic waste for the first year of production, i.e., 1994, for which the enterprise was also paid by BCC. From the second year onwards, the enterprise did not bid, for reasons largely unexplained. At present,

Technical and Economic Analysis of Composting Enterprises in Bangalore - India WASTE, December 1997
48
Terra-Firma lifts vegetable market waste from few places in Bangalore, procures waste from Agricultural Produce Marketing Corporation (APMC) yard and transport it to its factory by its own trucks. In addition, it has an informal understanding with corporation truck drivers to divert the waste to its factory for which some lumpsum amount is paid. Approximately 60-80 tons per day and 25,000 MT per annum of waste is procured for processing by the enterprise. Other additives like cowdung, and poultry waste are procured from private sources. Press mud is procured from surrounding sugar mills. Slurry waste is taken from Bangalore Water Supply and Sewerage Board for which the enterprise pays only transportation charges. Water hyacinth are collected from local tanks by hired labor. Bacteria for initial volume reduction are cultured in the laboratory and blue-green algae to be added with the final product is cultured at factory. Other additives like fish meal, bone meal, meat meal etc. are purchased from the market. Approximate quantity of additives used is mentioned in financial analysis. Collectively, additives constitute 20 per cent of raw material being processed. The enterprise owns 6 trucks to lift waste from different areas. Each truck makes one or two trips on an average per day depending on the availability of the waste. The enterprise is planning to again bid for contract to lift the waste from vegetable market next year.
3.2.2 Composting
Phase I
Waste is initially dumped on the concrete platform measuring 20,000 square feet area. This prevents mixing of soil with the raw material, retains moisture which otherwise would have leached to ground water. At this stage, the bacteria cultured in its own laboratory, is spread on top of the waste to help faster volume reduction. After 8-10 days, the waste is transferred into the pits.
Phase II
There are 26 pits each measuring 5 ft (w) x 15 ft (1) x 15 ft (d). Waste is heaped in each pit as a windrow. Heaping helps to drain excess water which in turn is drained out of the pit. Heaped waste is initially mixed once in two days and allowed to decompose. Cow dung is mixed with other additives like press mud, slurry waste and poultry and paper waste. The temperature goes up to 60-80 degrees Celsius during this period of decomposition. The waste is also regularly watered during this period. Once the waste is converted into black, earthy smelling mass, which may take anywhere between 10-15 days, perforated pipes are inserted. Pipes measuring 2 inches diameter and 2 ft high have perforations measuring 0.5 inches all along. This facilitates the exchange of gases produced due to digestion and oxygen. The waste is also loosely heaped which helps in further aeration. A mixture of different varieties of earthworms is introduced in the heaped waste at this stage. Around 2000 to 2500 worms are required per cu. mt. of area. The heap is then left untouched, except for watering. After 10 days the castings formed on the upper layer are scraped and sieved. Another 20 days will be required to empty the entire pit.

Technical and Economic Analysis of Composting Enterprises in Bangalore - India WASTE, December 1997
49
Phase III
The scraped castings are shifted to another shed for sieving and packing. They are regularly watered here so that organic carbon is not evaporated. Sieved compost is mixed with required amount of additives as per the formulation and then packed into HDPE bags with UV (Ultra Violet) liner. Residue is heaped beside the sieving shed and allowed to further decompose. After few days the decomposed residual waste is again sieved. This process progressively reduces the residue of composting process. Finally, there will be some matter left mainly plastic, rags etc., which can not be further decomposed. This matter is heaped in the corner and burnt or dumped in corporation bin periodically.
3.3 Obstacles and Solutions The enterprise had spent 3 years in experimenting, including study of existing compost plants. Although production of organic fertilizer with equivalent NPK value of chemical fertilizer is an aim of the enterprise, finding market for such a product is not an easy job. In addition to creating a niche market for the product and concept, the enterprise also had to struggle with process control, procurement of raw material, design and fabrication of infrastructure or machinery and, last but not least, getting it recognised by appropriate government departments. Following is an overview of major obstacles encountered and solutions found. - The land, where the manufacturing unit is existing at present, falls into 'green belt'. Green
belt is an area around the city which cannot be converted into residential or industrial area. The enterprise had to tackle with definition problem to get permission from the Government. The Urban Infrastructure Development Corporation can give income tax benefit if the enterprise is defined as waste management company. However, the manufacturing of compost can be allowed in green belt area only if it is an agricultural industry which may not be provided with power. Eventually the enterprise adopted multiple identity with various departments to avail of maximum benefits.
- The enterprise consciously chose vermicomposting as a method after a careful study of existing composting plants all over the country. Production of quality compost which can compete with chemical fertilizer has been a motivating force from the beginning. However, standardization of the process for large scale production from urban waste is the next challenge.
- Reportedly, the enterprise lost 22 lakhs in trial and error in the beginning. A segregating equipment to remove bigger pieces from the raw material did not work as waste with 70 to 80 per cent of moisture could not be sieved. Two drum and one blender which were bought to mix the waste stand useless due to inadequate capacity. An aerotiller, fabricated on the lines of KCDC model, was hardly used as later it was realised that it will promote aerobic reduction in the initial period and precious organic carbon will be lost bringing down C/N ratio. Electronic weighing machine became useless after few months, for the weight of a truck load can be estimated without weighing. A sturdy metallic sieving equipment was fabricated but found too heavy when rotated and hence abandoned. Trolleys and equipment, specially designed for shifting waste and additives also are not used by laborers.
- The tunnels (pits) meant for digestion of waste were designed to take 550 kg/cu mt., but in reality they are taking 175 kg/cu mt. Hence the area had to be increased from 45000 sq ft to 65000 sq ft to achieve designed production.
- Worms were initially purchased from Israel. At present, they are reared by the enterprise. Mixed culture is used rather than one or two varieties as it is seen that the later is

Technical and Economic Analysis of Composting Enterprises in Bangalore - India WASTE, December 1997
50
vulnerable to climatic changes. American redworms: the surface eating varieties, Nigerian: the deep burrowing variety along with local worms are used. Australian variety are used initially but they could not adapt to the environmental change. The big, voracious eater, Nigerian variety is also cross fertilized with other variety to make it more resistant. At each step advice from microbiologist and vermiculture experts are taken.
o After initial studies, it was clear that aerobic method can handle more volume. However, the compost produced would have lower NPK value and C/N ratio and, heavy metal and toxic elements cannot be reduced. Advantages of vermicomposting on the other hand are many:
o The gutter of worms act as bio-reactor and promotes bacteria which increases NPK value, carbon is preserved and hence C/N ratio is higher.
o Although it is claimed by Terra-Firma that toxicants are removed and pathogens are destroyed in the process of vermicomposting the analysis of compost shows trace elements of heavy metals (see pp 108-109). Micro nutrients and growth promoters are added due to decomposition by worms. Running cost and time to complete one cycle are higher, hence the cost of production is high, although the initial investment is slightly higher in case of aerobic decomposition.
- To reduce the production time and cost, the enterprise has designed a prototype of semi automatic reactor. Waste is pulverised and fed into the reactor through a conveyor belt everyday. Worms can eat 2.5 to 3 inches of waste everyday and move upwards. If, everyday 3-4 inches of waste is added, ready compost can be obtained at bottom. The time can be reduced by 15-25 days. And, as it eliminates labor, running cost will reduce, although the investment cost will be 50 per cent more then the present system.
- Creation of marketing network is a herculean task. Chemical fertiliser is distributed by 500 to 600 dealers with two people working at every taluk level. Frequent visits to villages and repeated demonstrations are part of marketing strategy. This was difficult for an enterprise of Terra-Firma nature to replicate. Nevertheless, an attempt was made during 1995-96, only to realise that creating new network is beyond the financial and human power capacities of the enterprise. Recently, Terra-Firma has entered into an agreement with Rallies (India) Limited. According to the agreement which the enterprise has to achieve production level of 10000 MT by the year 1999. A total production of 100,000 MT per annum will be given to Rallies, which includes production by franchisees in 7 years starting from 1997.
- Terra-Firma has entered into a franchise agreement with 22 such enterprises all over India, out of which 3 are already in operation. By this agreement, Terra-Firma will provide consultancy on technology and methods free of cost, and bio-fertilizers, microbes and worms at cost price to the franchisee. The entire production of the franchisee, in return, will be handed over to Terra-Firma for marketing which will be done through Rallies India. Terra-Firma will hold 24 per cent equity with the franchisee and 10 to 20 per cent of the profit margin will go to the franchisee
3.4 Future Plans
- Terra-Firma is planning to set up 5 satellite plants in Bangalore, which will ensure a
maximum transportation distance of 25 kms. from the city center. Land negotiations with city corporation are underway.

Technical and Economic Analysis of Composting Enterprises in Bangalore - India WASTE, December 1997
51
- The enterprise has plans to start full scale production in 22 franchises all over India for which the agreements are already drawn out and 7 plants are in different stages of production. 2 automatic and 1 semi-automatic vermicomposting plants are being planned at Bannerghatta manufacturing unit. With the operation of franchisee network, the estimated figures of annual production will be 1 lakh metric tones. Rallies India Limited will market all the 1 lakh metric tone production.
- The enterprise is negotiating with an US company to setup R & D laboratory for bacteria culture in collaboration.
- To solve the problem of raw material flow, the enterprise is planning to enter into an agreement with the Bangalore City Corporation to lift waste with its own trucks.
- A prototype automatic vermicomposting plant is being developed. - There are plans to produce organic insecticide. The efficacy of the product and the animal
testing are going on. - A bio-fertilizer capsule is being developed that can be plugged in the soil for diffusion.
This product will have four activities: fertilizing, insecticidal and pesticidal effect and will provide growth enhancers and micronutrients through organic means.
- Production of vermiculite, suppose to be conditioner and filler for tissue culture is the next plan to work. The product is expected to act as organic fertilizer. The advantage of the product would be that it expands 16 times on use. It is expected to be used in tissue culture and ornamental plants for the export markets so as to reduce weight in transportation.
- Sea weed extract plant will be set up at Cochin, Kerala. As 10 tons of sea weed gives only 500 kgs. of powder, it is not economical to transport sea weed to Bangalore. Hence the plant will be set up where the sea weed is available.
3.5 Financial Analysis
3.5.1 Average Production Level
For the year August 1995 to September 1996, the production of vermicompost was 3300 metric tones.
3.5.2 Running Costs
Cost of Labor
Table 22 . Staff Staff Number x Salary in Rs. Salary per Year in Rs. Managerial 3 x 15,000 Rs./Month 5,40,000 Middle managerial 6x 3,000 Rs./Month 2,16,000 Laborers 75 x 45 Rs./Day
(For 312 Days) 10,53,000
Marketing
Manager 1 x 25,000 Rs./ Month 3,00,000 Asst. Manager 3 x 8,000 Rs./ Month 2,88,000 Field Staff 15 x 3,500 Rs./Month 6,30,000

Technical and Economic Analysis of Composting Enterprises in Bangalore - India WASTE, December 1997
52
The Actual cost of labor per kilogram of compost = Rs. 30,30,000 / 33,00,000 kgs. = Rs. 0.91
There are no hidden costs.
Cost of Materials
Table 23. Materials Cost/Purchase Price per Annum in Rs. Component Source Quantity per
Annum in MT Rate Rs./MT Total Rs. Waste BCC 25,000 100 25,00,000 Garbage Surrounding Sugar
Mills 3,000 200 6,00,000
Press Mud Private people and Dairies
1,000 250 2,50,000
Cow Dung Poultry Farms 500 500 2,50,000 Poultry Waste Paper Mills 500 200 1,00,000 Paper Waste BWSSB 1,000 100 1,00,000 Slurry Waste Surrounding Tanks
and Waterbodies Lump sum — 1,00,000
Water Hyacinth and Miscellaneous
Additives Algae, Micronutrients, Fish
Meal, Bone Meal, Meat Meal, Erthrin 7,000 200 14,00,000 Extract Bio-fertilizers 7,000 160 11,20,000 Packaging Material
400 28,00,000
Power K.E.B. 50 HP. 8000 Rs./Month 96,000 Water Borewell 5000 gallons/day — — Diesel 2500 Lits/annum — 25,000 Tools or Equipment
50,000
Any Other 50,000 a. The Actual cost of raw material per kilogram of compost
= Rs. 39,00,000/33,00,000 kgs. = Rs. 1.18
b. The Actual cost of additives and packing materials per kilogram of compost = Rs. 53,20,000 / 33,00,000 kgs. = Rs. 1.61
c. The Actual cost of energy, water and tools per kilogram of compost = Rs. 1,71,000/33,00,000 kgs. = Rs. 0.05
d. The Actual cost for miscellaneous per kilogram of compost = Rs. 50,000 / 33,00,000 kgs. = Rs. 0.02, i.e.,

Technical and Economic Analysis of Composting Enterprises in Bangalore - India WASTE, December 1997
53
Cost of Bought-in-Services
Table 24. Bought-in-Services Component Rs. Per Annum Office Maintenance ~ phone, rent, other expenses 25,000Experts and consultants 5,00,000Public relations 2,40,000Total 7,65,000 The Actual cost of bought-in-services per kilogram of compost
= Rs. 7,65,000 / 33,00,000 kgs. = Rs. 0.23
2.2.4. Cost of Rent
Rent is paid only for the office premises. Land on which the factory is located is owned by the entrepreneur. The actual rent paid by the enterprise for office premises in the last few years is Rs. 3000 per month which is less than the market rate. The office premises of 1500 square feet is in a prime location of the city. The present market rate of rent is Rs. 10 /sq ft on an average. The total cost the enterprise would have otherwise incurred is Rs. 10 x 1500 sq. ft. x 12 months, i.e., Rs. 1,80,000. a. The actual cost of rent per kilogram of compost
= Rs. 36,000 / 33,00,000 kgs. = Rs. 0.01 b. The hidden cost of rent for the office building
=Rs. 1,80,000 - Rs. 36000/33,00,000 kgs. - Rs. 0.04 c. The hidden cost of rent for land of 6 acres per kilogram of compost
= Rs. 8000 x 12 months x 6 acres = Rs. 5,76,000 / 33,00,000 = Rs. 0.18
3.5.3 Cost of Depreciation
Under section 205 (2) of the Indian Companies Act, depreciation for the fixed assets can be calculated by various methods. It is assumed, on the basis of Straight Line method adopted for the purpose of this study, that 5 per cent of the historical purchase price will be residual value at the end of the life time of the asset. On the basis of the advise from an expert Chartered Accountant, the life time of vehicles and machinery is estimated 14 years whereas for buildings, it is anywhere between 20 to 30 years. Replacement value of vehicles and machinery are at current market prices, however for buildings, equipment and tools they are calculated @ 10 per cent inflation per year.


Technical and Economic Analysis of Composting Enterprises in Bangalore - India WASTE, December 1997
55
Table 25. Fixed Assets register Depreciation Cost in Rs Name of Asset No / Vol. /
Area Year of Purchase
Estimated Total Life Time in Years
Historical Purchase Price in Rs.
Price and Value of the Asset Replacement Value in Rs.
Hidden Value in Rs. Residual
Value in Rs. Actual Cost. Hidden
Cost
Vehicles 0.008 1. Tata Tippers 3 No. 1994 14 20,25000 24,00000 3,75000 1,01000 0.04 0.003 2. Swaraj Mazada (second hand)
1 No. 1994 14 56000 7,00000 1,40000 28000 0.01 0.002
3. Tractor 1 No. 1994 14 4,40000 5,50000 1,10000 22000 0.01 0.005 4. Leyland Trucks (Second hand)
2 No. 1996 14 7,50000 10,00000 2,50000 38000 0.02 0.003
5. JCB (Second hand) 1 No. 1996 14 9,50000 11,00000 1,50000 48000 0.02 0.002 6. Car (Second hand) 1 No. 1995 14 1,00000 2,00000 1,00000 5000 0.002 0.002 7. Motor Bike 1 No. 1995 14 50000 50000 0 3000 0.001 0.000 Buildings 1. Tunnels 50,000
sqft. 1994 20 22,00000 30,000000 8,00000 1,10000 0.03 0.012
2. Godown, Watchmen room, and Powerroom
1994 30 7,50000 9,75000 2,25000 38000 0.01 . 0.002
3. Water tank 50,000 liters
1994 10 1,00000 1,30000 30000 5000 0.002 0.001
4. Borewell, Pump house 1994 20 1,00000 1,30000 30000 5000 0.001 0.001 5. Compound wall 1994 20 6,00000 7,80000 1,80000 30000 0.008 0.003 6. Pump and Electric connections
1994 10 5,00000 6,50000 1,50000 25000 0.010 0.005
7. Laboratory building 1995 30 4,37000 5,68000 1,31000 22000 0.004 0.001 8. Concrete platform 1200 sqft. 1994 30 20,00000 24,00000 4,00000 1,00000 0.020 0.004 Machinery 8,50000 10,20000 1. Laboratory Equipment 1995 30 1,70000 42500 0.008 0.002 2. Sprinkler Sets, Water Pipe Lines, Water and Air Compressor
1994 14 1,50000 1,95000 45000 7500 0.003 0.001
3. Sieving Equipment 1995 14 1,00000 1,10000 10000 5000 0.002 0.000 4. Miscellaneous Pollution Equipment
1994 30 5,00000 5,75000 75000 25000 0.005 0.001

Technical and Economic Analysis of Composting Enterprises in Bangalore - India WASTE, December 1997
56
3.5.4 Financing Costs
The main sources of finances for Terra-Firma has been the Banking institutions and share capital. The equity participation is such that the powers to run day to day operations are vested with the Managing Director. Terra-Firma, being a private initiative has not received any grants. Hence the hidden cost of the grant capital is not calculated.
Cost of Loan Capital
Table 26. Loans and Borrowing Rate of Interest per Annum Source Amount in
Rs. Market Actual Period of Repayment
Amount Paid as Interest in Rs.
Loans I Bank 1,35,00000 18% 18% 6 years 24,30,000 The Actual cost of interest per kilogram of compost = Rs. 1,35,00,000 x 18% / 33,00,000
= Rs. 0.74
3.5.5 Cost Price of Product
The following table summarizes all the cost items. Table 27. Cost price per kilogram of compost
Average Unit Cost per Kilogram of Compost Cost Item Actual Cost Hidden Cost
Cost of labor 0.91 0.000 Cost of materials Cost of raw materials 1.18 0.000 Cost of additives & packing materials 1.61 0.000 Cost of energy & water/tools 0.05 0.000 Cost of miscellaneous 0.02 0.000 Total of material cost 2.86 0.000 Cost of bought-in-services 0.23 0.000 Cost of rent 0.01 0.040 Sub-total of Running cost 4.01 0.040 Cost of depreciation 0.21 0.054 Cost of interest 0.74 0.000 Sub-total of Capital cost 0.95 0.054 Cost Price 4.96 0.580
3.5.6 Cost of Taxes
As per the Fertilizer Act, 1956, organic fertilizers are exempted from paying sales tax and turn over tax. An enterprise would have otherwise paid a sales tax of 4 per cent per metric tone and a turn over tax of 2 per cent per metric tone. As the accumulated losses are still not recovered, the 15 per cent infrastructure industry tax, to be paid if the enterprise is making

Technical and Economic Analysis of Composting Enterprises in Bangalore - India WASTE, December 1997
57
profits, is also not required to be paid for another 3 years. A corporate tax of 15 per cent on revenue depreciation is also not paid because the losses are carried forward every year. Hence, the enterprise did not pay any taxes for the year 1995-96. 2.7. Revenue Revenue from product sales is the only source of revenue for the enterprise. The waste residue left after sieving is too little in quantity and is generally dumped. A total of 33,00,000 kilograms of vermicompost is sold for the year 1995-1996 at the gross sales price of Rs. 6.40 per kilogram generated a revenue of Rs. 2,11,20,000. 2.8. Profitability Statement Table 28. Profitability statement of Terra-Firma Bio-Technologies Limited Item Per Kilogram of Compost Rs. per Annum Revenue from tariffs *6.40 2,11,20000.00 Actual running cost 4.01 1,32,33000.00 Gross profit 2.39 78,87,000.00 Actual Capital cost 0.95 31,35,000.00 Net profit before tax 1.44 47,52,000.00 Cost of taxes 0.00 0.00 Net profit after tax 1.44 47,52,000.00 Hidden cost 0.58 19,14,000.00 Net profit after tax 0.86 28,38,000.00 * The selling rate per kilogram of compost is calculated based on the compost sold for different packaging and averaged, i.e., (1 kg packing ) 1,50,000 kgs. @ Rs. 15.00/kg = Rs. 22,50,000.00 (5 kg packing ) 3,50,000 kgs. @ Rs. 10.00/kg = Rs. 35,00,000.00 (50 kg packing ) 28,00,000 kgs. @ Rs. 5.50/kg = Rs. 154,00,000.00
Total Rs. 211,50,000.00 Therefore, the average selling rate is calculated as Rs. 211,50,000 / 33,00,000 kgs. = Rs. 6.40. (please refer Table 27 and Table 29 in Marketing Analysis for more details).
3.6 Marketing Analysis
3.6.1 Market Segments
Terra-Firma was started with a view to produce organic fertilizer from urban waste that can compete with chemical fertilizer. Various formulations have been designed by the enterprise to suit to different crop requirement as a strategy, in addition to other strategies, to target fanners as main marketing segment. Products are also developed for floriculture and horticulture crops catering to export or local markets. Urban households and institutions are not specifically targeted. Large farmers,

Technical and Economic Analysis of Composting Enterprises in Bangalore - India WASTE, December 1997
58
plantation fanners and export oriented farming, floriculture and horticulture seems to have been given more emphasis. As part of the marketing strategy, the enterprise promotes organic farming and provides not only training to farmers at district level but many other relevant products, e.g., bio-fertilizer, organic insecticide etc., produced by its sister concern are made available. The task in front of the enterprise seems to mainly create a niche market for its products. Table 29. Market-segments and demand in 1995-96 Marketing Segments Geographic Area Demographic Condition Compost Sold in
1995-96 in kgs. Farmer Karnataka, Tamilnadu
& Andhra Pradesh Big & small farmers, all types of plantation farms, paddy, vegetables & others
2350000
Urban House- holds Bangalore low & high income groups
150000
Nurseries Bangalore corporate offices, hotels, 50000 Floriculturists Bangalore academic institutions 250000 Institutions Bangalore Urban households, 50000 Miscellaneous/ samples Bangalore demonstration blocks 450000 Total 33,00,000 Note : The enterprise has sold whatever is produced.
3.6.2 Marketing-Mix
Product
Tailor made products to suit to different requirements of different crops is the strongest aspect of the enterprise. Specific products so developed are: - Blue green algae with extra bio-fertilizer and nitrogen fixing bacteria for paddy. - Extra potash formulation for coffee. - Addition of egg shells to provide time release calcium for floriculture. - Addition of sea weed extract for high potash for general crops. - 4.5 liters of Erthrin, extract from body fluid of earthworms, is sprayed on each tone of the
final compost. This gives additional growth promoters. - Micro-nutrients are added like Sulfates of Copper, Manganese and Zinc, apart form other
NPK enhancers. The products are packaged in 50 kgs., 5 kgs. and 1 kg HDPE bags. The products of 50 kgs. and 5 kgs. bags are provided with UV liner3 which has two functions. First, it can protect microbial population till shelf life and second, can prevent carbon loss in the atmosphere. The product has a maximum shelf life of one year and thereafter it has to be used only as a soil conditioner The vermicompost has been sold, as mentioned earlier, under the brand name of Black Gold till December 1996, and from January 1997, it is being sold as Rallies Gold, after the contractual agreement on marketing between Rallies India and Terra-Firma.

Technical and Economic Analysis of Composting Enterprises in Bangalore - India WASTE, December 1997
59
Table 30. Product Range Brand Name
Quality (target crop)
Size per unit
Packing Vol. produced & sold in kgs./yr
Market segment targeted
Black Gold A
Flowers 50 kg HDPE bags with UV liner
1500000 General agree, crops
Black Gold B
General crops with extra neem
1 kg Polythene bags 150000 Urban households
Black Gold C
General 5 kg HDPE bags with UV liner
350000 Nurseries, Floriculture
Black Gold D
General 50 kg HDPE bag with UV liner
450000 Institutions, samples
Black Gold E
Coffee 50 kgs. HDPE bags with UV liner
300000 Coffee plantations
Black Gold F
General crops 50 kg HDPE bags with UV liner
350000 paddy crop
Black Gold G
General crops with extra neem and pungemia
50 kg HDPE bags with UV liner
200000 General agriculture crops
Though all the products are designed to target predominantly a specific market segment, they are sold to other marketing segments as well, except the specific formulation for coffee or paddy crops etc. The figures of volume sold are indicative and are based on the understanding of the Managing Director of the enterprise. They provide, at the best, relative sales in comparison to other products. The brand name column is mentioned as Black Gold with alphabets so as not to reveal the formulations.
Place
The distribution chain adopted is as follows: Terra-Firma ! Distributors ! Clearing & Forwarding agents ! Dealers users ' U V liner is a plastic sheet with black coating. Distributor's role is mainly to sell products in various places using its existing infrastructure, through offices located in various places, with own sales team. They enter into agreement with the enterprise either for sole distribution in a particular place or for particular product. Some of the distributors, however, do not have the infrastructure facilities for storage and inter or intra-state transportation and hence, in turn depend on Clearing and Forwarding agents. The distributors will in turn employ dealers, who act as retailers to reach the customers. The enterprise sells through both direct and indirect channels other than the conventional method of selling through distributors. It also employed field staff to promote the product as well as the concept at district levels. Training camps are organised and also 250 ml of bio-fertilizer is given free with 1 tone of vermicompost as an incentive. At an earlier point of time, sales personnel were employed to do door to door marketing to develop urban market. At that time the product was priced at Rs. 15 per kg, of which Rs. 4 per kg was given as commission to sales personnel.

Technical and Economic Analysis of Composting Enterprises in Bangalore - India WASTE, December 1997
60
Table 31. Distribution channels Distribution Channels Product No. Unit
Distributor Direct from enterprise
Total in kgs
All products Karnataka, Tamil Nadu, Andhra Pradesh
Location Number # 500 . Direct sales kg/yr --- 8,00,000 8,00,000 Indirect sales kg/yr 25,00,000 8,00,000 25,00,000 Total 25,00,000 33,00,000
Pricing
Price setting Although it is an agricultural input, the prices of compost are not controlled by the Government. There are no taxes levied on organic fertilizers as yet. The pricing of Black Gold is, reportedly both cost-oriented and demand oriented. The cost price of the Black Gold per metric tone is Rs. 4950 without hidden cost and the sales price is Rs. 6400 per metric tone on an average. In fixing the price, the other competing products were considered. While its price is higher than the immediate competing product, i.e., KCDC compost, the value addition to suit different crops is considered. Replacing chemical fertilizer in long run has also been considered.
Table 32 . Pricing of Products (in Rs.) Black Gold 1 kg Black Gold 5 kg Black Gold 50 kg Distribution channel per unit per kg per unit per kg per unit per kg
Distributors Gross Sales Price 15.00 10.00 5.50 Discount/bonus 4.00 1.00 3.00 Net Sales Price 11.00 9.00 2.50 Tax/subsidy 0.00 0.00 0.00 Customer price 15.00 10.00 5.50 Direct Sale Net sales Price 15.00 10.00 5.50 Tax/subsidy 0.00 0.00 0.00 Customer price 15.00 10.00 5.50 Since demand for compost is seasonal, having maximum use during May and December, during January and April the product is sold at cost price.
Promotion
The concept of organic farming is also promoted along with its products by the enterprise. An expert is working on a regular basis to provide suggestions. Promotional activities include the enterprise, the concept of organic farming as well as all the products. Table 12: Promotional Activities

Technical and Economic Analysis of Composting Enterprises in Bangalore - India WASTE, December 1997
61
Table 33. Promotional Activities Product No. Types of Promotion Media Target groups or
Market Segments Goals
Enterprise Picture slides Television Commercial crops Promotion of the enterprise
All products Brochures, danglers, tinplate display, banners, video cassettes, group discussions, seminars, training courses
Press, advertisements, samples, demonstrations
All general crops Product promotion and sales
The total cost for all the above mentioned promotions is Rs. 12,00000 for the year 1995- 96.
3.6.3 Market-Positioning
In the absence of documentation of marketing data in the format required, it seemed extremely difficult task to fit the existing data in the framework of this study. The enterprise, at the best, could provide how much is sold through which marketing channel. However, the amount sold through each marketing channel is targeted to almost all the marketing segments and it is difficult to further know how much would have been sold to each of the marketing segments. The figures presented in the table 6.1 are indicative and on the basis of which the following tables are worked out. In such circumstances, it could be understood that sales in high and low season and expenditure of promotional activities for that particular segment can be least expected. Incompatibility of data between two competing brands was another stumbling block. For the sake of arriving at some reasonable understanding we have taken KCDC compost as the only competing product. The sales data of which are recorded in a different fashion. However, for the sake comparing at least these two products, three types of marketing segments are included. Big, small and plantations farmers, nurseries and floriculturists are combined together. The urban households and institutions are taken separately. Table 34. Market-Positioning of Urban Households Segment Data items Unit Black Gold B
(1 kg pack) kcdc - Bio AgroRich (25 kg pack)
kcdc Vermicompost (1 kg pack)
Sales & price data 1995-96 Sales volume MT/yr 150 360 0.50 Customer price inRs/kg 15.00 1.85 5.00 Sales revenue (Sales volume X customer price)
in Rs/yr 2250 666 2500
Promotion type Door to door sales campaign, sampling media Fliers, personal selling goal Product sampling, trials and sales * Total Demand: 150 MT

Technical and Economic Analysis of Composting Enterprises in Bangalore - India WASTE, December 1997
62
Table 35. Market-Positioning of Farmers/ Nursery/ Floriculture Segment
Enterprise products Competing products (only KCDC products, farmer segment includes nurseries, floriculturists
Data Items Unit
Black Gold A Black Gold C Black Gold E Black Gold F Black Gold G Bio Agro Bio Agro Rich Sales & price data 1995/96
Sales volume MT/yr 1500 300 300 350 200 1834 3586 Customer price
in Rs/kg 5.50 10.00 5.50 5.50 5.50 1.55 1.85
Sales revenue (Sales volume x customer price)
in Rs/yr 82,50,000 30,00,000 16,50,000 19,25,000 11,00,000 28,43,000 66,34,000
Promotion type Demonstration blocks, discussions, seminars media Discussions with farmers goal Product awareness and acceptance, sales * Total Demand: 2650 MT

Technical and Economic Analysis of Composting Enterprises in Bangalore - India WASTE, December 1997
63
Table 36. Market-positioning of Institution segment. Enterprise Products Competing
Product Data Items Unit
Black Gold C Black Gold D KCDC - Bio Agro Rich
Sales & price data 1995-96
Sales volume MT/yr 50 450 478 Customer price in Rs/kg 5.50 5.50 1.85 Sales revenue (Sales volume x customer price)
in Rs/yr 275 2475 284
Promotion type group discussions, seminars media Product brochures, personal selling goal Product trials and sales * Total Demand: 500000 legs

Technical and Economic Analysis of Composting Enterprises in Bangalore - India WASTE, December 1997
64
3.6.4 Market-Strategy
Table 37. The Marketing Strategy and Performance of Farmer/Floriculture/Nursery Segment Marketing Mix Instruments Enterprise Policy Product Replace chemical fertilizer and to produce
different products to cater to different types of crops.
There is no significant difference in results noticed in relation to price by the users of this segment, though plantation farmers and export oriented farm houses have experienced positive results.
Place The product to be made easily available and hence entered into contract with Rallies India.
The product is easily available through the dealer network or from the organisation itself.
Pricing Reduce cost price by increasing production of vermicompost.
Expensive compared to FYM or animal manure and other variety of compost. It is beyond the reach of small & marginal farmers. Even middle level farmers also feel it difficult to budget for.
Promotion Promotion of concept of organic farming. Product is not known among small and marginal farmers. Overall performance of the enterprise in this segment
The enterprise is providing vermicompost with different formulations for different crops
Opportunities / bottlenecks for improvement
- There is a vast market opportunity for organic fertilizers as chemical fertilizers may become costlier and availability of FYM is reducing. The organisation's policy to provide value added fertilizer may increase market further compared to competitor's product, e.g., KCDC.
- Higher price compared to other forms of fertilizers is the major constraint and the enterprise is therefore losing a major market of small and marginal farmer segment.
- Though the enterprise envisages replacement of chemical fertilizer in long run, it has a long way to go before the product is made available within the affordable price range of farmers.

Technical and Economic Analysis of Composting Enterprises in Bangalore - India WASTE, December 1997
65
Performance of competitors in this segment
- Competing with chemical fertilizer is the greatest challenge, for it enjoys protective subsidies given by the Government. At present both lower pricing and higher yield of chemical fertilizer disfavour product like Black Gold. It will take some time before the concept of organic farming is accepted by farmers. Besides, chemical fertilizer enjoys extensive marketing network developed in collaboration with government machinery. While Terra-Firma is striving to develop such a network by marketing through Rallies India, the price may relatively increase.
- The main strength of the product is its quality compared to KCDC compost. The fundamental difference in approach by both the enterprises may be the reason. Since, KCDC is originally designed to recycle urban waste, not much attention was given to developing a product. Terra-Firma from the beginning is oriented to develop organic fertilizer as a product targeted to farmers.
- However, KCDC compost is the main competitor in the field of organic fertilizer. Though price of Terra-Firma's product is higher than KCDC compost, KCDC has an advantage due to its higher production capacity and access to all types of farmers.
- KCDC also has an advantage due to its partial control by Government. It has an access to farmers through various departments such as agriculture, horticulture, sericulture etc., and enjoys partly the same marketing network created by Government for chemical fertilizer. For instance, KCDC compost is sold at all Karnataka Agro Industries Corporation Limited (KAIC) outlets.

Technical and Economic Analysis of Composting Enterprises in Bangalore - India WASTE, December 1997
66
Table 38. The Marketing Strategy and Performance of Urban Household Segment Marketing Mix Instruments Enterprise Policy Product Increase awareness on the product for kitchen
gardens The product name is known among the marketing segments
Place The product is made available at departmental stores as well as agricultural inputs and HOPCOM retail outlets. It was also introduced in some parts of city through door to door campaign.
The product is easily available through the retail network or from the organisation itself.
Pricing Reduce cost price by increasing production and packaging size.
Reasonably priced for this marketing segment. Though some section feel that it is costly compared to KCDC compost, FYM or animal manure.
Promotion Promotion with fliers, newspapers, sales promotion through door to door
Promoted well enough for product awareness and through word of mouth.
Overall performance of the enterprise in this segment
The enterprise has entered into a contract for display and sales of compost with HOPCOMS, Horticultural Produce Co-operative Marketing Society selling fruits and vegetables. It has a retail network of 220 stalls spread all over Bangalore and 375 stalls in Karnataka. On a market-test basis, at the moment, Black Gold is available in 50 shops in Jayanagar, Bangalore South. Based on the feedback on sales, it will be extended to all the shops in Bangalore and Karnataka. It has sold 150 MT through these channels and intends to sell more.
Opportunities / bottlenecks for improvement Urban Households use less quantities of compost, but being a wider section has the potential for better sales with higher margins of profits and lower volumes.
Performance of competitors in this segment - The competitors, the community based programmes such as CEE, Clean Environ and Waste Wise although have low production capacities, geographic reach as well as limited marketing network, can do better with help of word of mouth.
- The other major player, KCDC compost is comparatively selling well in this segment due to its long-standing in the market and low price. Besides, it provides door delivery free of charge.
- Another competitor is animal and farm yard manure. Urban households with relatively big gardens buy their own compost every year before rains. Farm yard and animal manure in high income urban areas is provided at door by surrounding farmers. Their longstanding existence in the market and carefully developed personal relations with potential buyers give them upper hand.

Technical and Economic Analysis of Composting Enterprises in Bangalore - India WASTE, December 1997
67
3.7 Technical and Economic Analysis of Composting Enterprises: NGOs and CBOs
A. Clean Environ
3.7.1 Overview
The project was started by residents of 6 th Main, Malleswaram with an objective to keep streets clean and to create healthy surroundings in May, 1995. Waste Wise assisted them in direct mobilisation, provided know how and also helped them to identify and organize waste collectors. The project was officially inaugurated in September, 1995 by the then Irrigation Minister of Karnataka and President of Rotary Club. In the beginning, the project covered 200 households which was later expanded to 227 households. A core group consisting of 15 members and 5-10 active members took complete responsibility of designing, managing and maintaining the project. For the first 9 months, collected waste was disposed in an identified dustbin for the corporation lorries to collect it. This required co-ordination with concerned officer from corporation which was done by core group members. During this period door to door collection was by and large stabilized. After painstaking lobbying with Corporation officers, collection of waste by corporation truck was also regularized. With the success of initial experience, other residents expressed their desire to join. In November 1995, 120 households joined the project, which was named as group II. Later in July 1996, another 134 households joined, named as group III. At present, total 581 households are covered with 100 houses added in group II. The groups are named separately to give them independent identity as well as to facilitate day to day management. It also helps in decision making process, for bigger the group, more the difficulty in arriving at a consensus. All the three groups meet independently every second Saturday to discuss their own affairs, whereas the main core group meets once every month. In addition a composting committee is formed, which has representation of all the three groups. Financial transactions are dealt combined and through a bank account which can be operated with two persons' signature. Four waste collectors are employed for door to door collection. They make one trip a day except one person who collects from 100 houses of an apartment in a second trip. Twice a week they make additional trip for transporting garden waste for which they are paid extra. Since, the composting site is 2 kilometers away from the residential area, waste collectors are paid extra for transporting waste, which includes working at the composting site.
3.7.2 Composting
Although the group had an idea to eventually compost the waste collected, land identification took a long time. First, the BCC parks were considered. Two of them were sunken parks with only steps to go down. Transporting waste down in boxes would have created problems. Two others were very close to residential area and it was feared that accidental smell may cause problem. Land near railway station did not have necessary infrastructure like water and was also a barren piece of land without tree cover which is very essential for vermicomposting. Nearby school was ready to spare a piece of land for composting but the portion suggested by

Technical and Economic Analysis of Composting Enterprises in Bangalore - India WASTE, December 1997
68
the school authority was not agreeable to the residents and when the share in revenue was asked, the proposal fell through. Eventually, a unique concept was worked out. An active member of the core group offered part of her land for composting in exchange of a share from the revenue. The land is located 2 kms. away from the area of collection and is surrounded by industries. It is well protected by walls from all sides and has excellent tree cover. In fact, the location of land is ideal for such purpose like vermicomposting. After few discussions, the Clean Environ group and owner of the land have agreed upon a memorandum of understanding, salient features of which are as follows: - 800 square feet of land, part of a larger vacant plot measuring 2900 sq. ft, will be used for
the purpose of vermicomposting for an initial period of 3 years. - Household organic waste generated from 500 houses in Malleswaram will be composted. - No rent will be paid to the owner for the purpose. - Vermicomposting will be done by the community/Clean Environ at its own expense and
it should be allowed to put up structures on the land for the same purpose. - 50% of the net profit, i.e., after meeting with all expenses will be handed over to the land
owner and rest will be kept as Corpus fund available to community for running of the scheme as well as other community purposes.
- The project will be reviewed after 3 years and if not found profitable will be decommissioned if mutually agreed to both the parties. In such case the Clean Environ/ community will restore the land in its original position.
Based on the above agreement, a committee was formed with representation from all the three groups, mainly to design, manage and maintain composting activities. The committee has complete autonomy to decide on matters related to composting. Incidentally, Mrs. Sita Ravi, the owner of the land, was selected as Project Co-ordinator. The compost committee meets every fortnight and apprises main group once in a month.
3.7.3 Finance
Having gone through the above exercise, the major problem before the group was to raise funds for acquiring composting infrastructure. While searching a piece of land for composting, the group also considered various composting methods, for initial investment is closely connected with the method adopted. The group wanted to opt for vermicomposting as the final product has higher value than it is for aerobic decomposition. First, Waste Wise provided the design of the pits and know how. However, the group felt it was uneconomical. CEE's model of pit design was considered and was not adopted as it is aerobic composting method. Tata's Energy Research Institute (TERI), Bangalore was contacted to review their design of anaerobic digester for urban organic waste. The initial cost in this case was unaffordable for the group, and it was not clear how the generated gas can be utilised. By this time, the then Municipal Commissioner had initiated a movement called Swabhimana with an aim to provide a platform to CBOs, NGOs and interested individuals to work towards participatory planning and implementation process for urban development. As part of this movement, a Swabhimana Initiative for Malleswaram was inaugurated in November 1995. Malleswaram Swabhimana Initiative (MSI) played a crucial role in identifying the land for composting, lobbying with appropriate Government officers and finally finding financial resources for Clean Environ. Due to the intervention of MSI, Tata's Concern for Community Initiative (TCCI) provided financial support of 1.5 lakhs for community based Solid Waste

Technical and Economic Analysis of Composting Enterprises in Bangalore - India WASTE, December 1997
69
Management programme by Clean Environ on the condition that the money be used for treating the organic waste from 500 households. This was also the reason for expanding the collection activity to few more houses. Trolleys for door to door collection were donated by Rotary Club of Bangalore, Srinivasan Trust and TCCI. Uniforms for waste collectors were initially given by Waste Wise and other equipment including bins to collect waste from the apartments were purchased from the financial help of TCCI. Residents participating in the programme were paying Rs. 10 per household per month which was recently increased to Rs. 15. Residents staying in the apartment pay less as they have also to pay the servant employed for internal collection.
3.7.4 Pit Design
A structure consisting of 17 tanks for the purpose of vermicomposting was constructed. It is a low cost construction with a provision to dismantle and shift the entire structure without wasting material. The floor is fixed with nuts and bolts and made of precast reinforced concrete including tanks meant for composting. The wall is made of burnt jali clay. Each precast reinforced tank measuring 3 ft (d) x 3 ft (w) x 6 ft (1) has a capacity to take 3 days waste, i.e., approximately 1200 kgs. Drainage is provided in the bottom to drain off excess water outside the structure. In front of the structure, there is an open space measuring approximately 30 ft x 40 ft with a number of trees.
3.7.5 Composting Process
In the Open Space
Waste was composted in the open space before the tanks were ready which is still continuing. This started in July 1996 whereas composting in tanks started in January 1997. In the open space, waste is composted in small heaps in two rows. Although it needs regular turning in the initial decomposition period, it is hardly done. Except watering every week with hose pipe, it is kept untouched. In the beginning, few earthworms of the species Eisena Fietida and Eudrilus were introduced in the heap. Later, it seems, that even local varieties gathered from surrounding environment. At present, there is hardly any conscious care taken for the waste dumped outside. However, nature itself seems to be taking care of it. The worms find their own way into the heap of garbage where initial decomposition is over and temperature has gone down. The site is also ideal for earthworm habitat as it has thick tree cover and soil is moist having green cover. However, the process in this case takes longer time. Major part of the discussion for this research took place in the middle of the dumped waste in the open space and no smell was encountered, although length of the row is around 20 ft each. After allowing for decomposition for 6 months, waste is sieved and stored.
In the Tanks
Composting in tanks was started in January 1997 though is has not yet been stabilized. Waste is mixed with cowdung slurry every third day after the tank is full. It is also watered frequently and allowed to decompose for two weeks. When temperature comes down the worms are introduced. After another 2-3 weeks, the tank is emptied and fully decomposed

Technical and Economic Analysis of Composting Enterprises in Bangalore - India WASTE, December 1997
70
matter is sieved and stored. Cowdung is purchased from nearby cowshed in exchange of compost. Weekly 8000 liters of water is purchased, mainly used directly to water the decomposing waste, part however is also stored in a tank for subsequent utilisation.
3.7.6 Future Plans
Malleswaram ward has been chosen to create a model ward level committee under the Swabhimana Initiative. Documentation of available services and details of road is done by Waste Wise and TIDE, and digitized in the format of Geographical Information System (GIS). Malleswaram Swabhimana Initiative intends to conceive a comprehensive plan of solid waste management for entire ward of approximately 30,000 population with the help of this data. At present, Clean Environ, is receiving financial support from TCCI through Public Affairs Center (PAC). The group is planning to register so as to receive financial support directly. In addition to strengthening existing process of vermicomposting, trying other options like bio gas generation are also at an informal discussion stage.
3.7.7 Strengths and Weaknesses
- Clean streets was the main objective of the residents when they organised in to a group. There is a perceptible change in that regard after the project started. However, the municipal bins still receive waste, and continues to pose disposal problem, though, residents participating in the programme feel that the problem of heaps of accumulated waste in the street at least is overcome.
- The project has brought residents together. It provided impetus to organize community around common interest issues. While the general tendency of middle class is to depend upon the Government to provide essential services, Clean Environ projects a model of community participation. In fact, groups of this kind can play potentially important role in raising long term policy issues in addition to the work they presently are engaged in.
- There is a strong sense of belonging to the project both among the participants in general, and the core group members in particular. This can have a positive impact, however, it can also potentially create a sense of insecurity. For example, the group may tend to isolate itself from the organisations or researchers or policy initiators fearing misrepresentations or misappropriation of goodwill. Such thing will not only prevent the organisation from receiving help and grow further, but also prevent flow of information which can throw light on larger policy issues.
- Community based composting plant on a private land is a novel idea and it may throw open many more possibilities. However, the lack of clear role definition can lead to misunderstanding.
- Vermicomposting is a labor intensive method and hence needs continuous attention. The experience in other areas shows that success of such endeavors largely depends upon close monitoring and controlling of the process. For people in community, sparing time and energy for such activity is a voluntary action. This may force the land owner to bear major responsibility, owing to the sheer fact that the activities are taking place on his/her land. The dual role of the land owner also as a project coordinator, in this case, facilitates this process. Though convenient at present, it may prove counter productive in the long run.

Technical and Economic Analysis of Composting Enterprises in Bangalore - India WASTE, December 1997
71
- Availability of labor for day to day management of the process is very essential. The waste collectors are supposed to handle day to day operation at composting site and for which they are paid extra. However, their physical capacity to handle such labor intensive jobs is questionable, particularly after transporting, trolley load of waste a distance of 2 Kms.
- Waste Collector seem to be not benefiting from the sale of compost and hence, without close supervision their initiation and participation is marginal. Encouraging their involvement in planning and decision making and sharing revenue earned from sale of compost with them may yield positive results in long run.
- There is a need to institutionalize economic benefits a waste collector likely to accrue working on such a scheme, otherwise he is likely to be on mercy of residents for the salary hike, bonus and other economic benefits.
3.8 Financial Analysis
3.8.1 Average Production Level
During the period, July 1996 to March 1997, around 400 kgs. of compost has been produced. The financial analysis will be therefore limited to the period from July 1996 to March 1997, i.e., 9 months.
3.8.2 Running Costs
Cost of Labor
4 waste collectors are presently working on the project. A Supervisor is employed for monitoring day to day operation. The waste collectors were paid a salary of Rs. 600 per month till December 1996 and are paid Rs. 800 (Rs. 500 as salary and Rs. 300 for the transportation of waste and composting) per month from January 1997. In addition, on an average each waste collector is paid Rs. 50 extra for transporting garden waste since January 1997. Each waste collector is given Rs. 250 to open Savings bank account as a gift by the community and Rs. 300 worth gifts are bought on festival once a year. The total salary and bonus paid during the period July 1996 to March 1997 was: Table 39. Labor Period Amount in Rs. Gifts and Bonus
1. July 1996-Dec 1997 4 waste collectors x Rs. 600 x 6 months
14,400.00
2. Jan 1997 - March 1997 4 waste collectors x Rs. 800 x 3 months
9,600.00
3. Transporting garden waste 4 waste collectors x Rs. 50 x 3 months
600.00 2,200.00
4. July 1996-March 1997 1 Supervisor x Rs. 950 x 9 months
8,550.00 35,350.00
Total 33,150.00 Here, waste collectors' labor is consumed for two major activities: procurement and transportation of waste and composting. As human labor is the form of energy used in this case for the collection and transportation of raw material for composting, the cost of labor is

Technical and Economic Analysis of Composting Enterprises in Bangalore - India WASTE, December 1997
72
divided between cost of raw material and cost of labor for composting. Approximation, in such case, is unavoidable. In the absence of any other model, half the above cost of labor is counted as cost of raw material procurement and half as cost of labor for composting. The Actual Cost of Labor per kilogram of compost produced = Rs. 17,675/400 kgs. = Rs. 44.18
Cost of Raw Material
Actual cost of raw material per kilogram of compost produced = Rs. 17,675/400 kgs. = Rs. 44.18
Cost of Additives and Packaging
The total cost incurred on Additives and Packaging per kilogram of compost is Rs. 120 for the purchase of warms. No amount worth considering is spent for packaging. Actual Cost of Additives and Packaging per kilogram of compost = Rs. 120/400 kgs.
= Rs. 0.3.
Cost of Water and Tools
8000 liters of water at the cost of Rs. 200 a trip is received once a week. Lump Sum amount of Rs. 2000 per annum is assumed towards uniforms and other recurring expenditure. The total cost incurred on water and tools is Rs. 7,400. Actual Cost of water and tools per kilogram of compost produced = Rs. 7,400/400 kgs.
= Rs. 18.5
Cost of Spare Parts and Maintenance Materials
The total cost incurred on Spare Parts and Maintenance Materials is Rs. 1,800, the cost incurred in maintaining tricycles and equipment. Actual Cost of Spare Parts and Maintenance Materials per kilogram of compost
= Rs. 1,800/400 kgs. = Rs. 4.5.
3.8.3 Cost of Bought-in-Services
The total cost on purchase of services such as motivation & training material incurred is assumed as Rs. 5800. Actual Cost of Bought-in-Services per kilogram of compost = Rs. 14.50.

Technical and Economic Analysis of Composting Enterprises in Bangalore - India WASTE, December 1997
73
3.8.4 Hidden Cost of Rent
The built up area of the composting shed is 800 sq. ft. which is also considered for MoU, although the open space in front of it is also utilised for composting. Although it is a prime industrial land, even at the marginal rate of Rs. 2 per sq. ft, the group would have paid Rs. 1600 per month as rent. Hidden Cost of Rent per kilogram of compost = Rs. 36.
3.8.5 Cost of Depreciation
Under section 205 (2) of the Indian Companies Act, the depreciation for the fixed assets can be calculated by various methods. It is assumed on the basis of Straight Line , method adopted for the purpose of this study that 5 per cent of the historical purchase i price will be residual value at the end of the life time of the asset. On the basis of the f advice from an expert Chartered Accountant, the life time of buildings is estimated as 20 years, of trolleys as 5 years and equipment 3 years. Replacement value of buildings, equipment's and tools is calculated @ 10 % inflation per year.

Technical and Economic Analysis of Composting Enterprises in Bangalore - India WASTE, December 1997
74
Table 40. Fixed Assets Register Price and Value of Asset (in Rs.) Depreciation Cost in Rs. Name of Asset Year of
Purchase Estimated Total Life Time (yrs)
Historical purchase price
Replacement value
Hidden value Residual value
Actual cost Hidden cost
Construction of pits and shelter 1996 20 yrs 1,25,000 1,12,500 12,500 6,250 14.84 1.60 3 tricycles 1996 5 yrs 15,000 16,500 1500 750 2.11 0.22 Equipment such as plastic drums, gloves, shoes, gardening implements etc.
1996 3 yrs 2,980 3,278 298 149 2.40 0.25
Total 19.35 2.07

Technical and Economic Analysis of Composting Enterprises in Bangalore - India WASTE, December 1997
75
3.8.6 Cost of Grant Capital
The group received a grant of Rs. 1,50,000. At the market interest rate of 18% per annum, the interest per month is Rs. 22,50. Hidden Cost of Grant Capital per kilogram of compost = Rs. 20,250 / 400 kgs.. = Rs. 50.625
3.8.7 Cost Price of Product
The average cost price of compost per kilogram is calculated by summing up all the cost items. Table 41. Cost price per kilogram of compost
Average Unit Cost per Kilogram of Compost
Cost Item
Actual Cost Hidden Cost Cost of Labour Cost of Materials 44.18 0.00 cost of Raw Material 44.18 0.00 cost of Additives & Packing Materials 0.30 0.00 cost of Water & Tools 18.50 0.00 cost of Spare Parts & Maintenance Material 4.50 0.00 Total Cost of Materials 67.48 Cost of Bought-in-Services 14.50 0.00 Cost of Rent 0.00 36.00 Sub Total of Running Cost 81.98 36.00 Cost of Depreciation 19.35 2.07 Cost of interest 0.00 50.62 Sub Total of Capital Cost 19.35 52.69 Cost Price 101.33 88.69
3.8.8 Cost of Taxes
As the enterprise is in the field of organic manure and being a CBO, it is exempted from paying sales tax, corporate tax and turn over tax. There is no actual or hidden costs incurred on the cost of taxes.
3.8.9 Cost of Revenue
As the project is Community Based, there are two sources of revenue. One source is collection of service fee from residents at the rate of Rs.10 per month from July-Dec 96 and Rs. 15 per month from Jan-Mar 97. The second source of revenue is from compost sales.

Technical and Economic Analysis of Composting Enterprises in Bangalore - India WASTE, December 1997
76
Table 42. Revenue Particulars Amount in Rs. Collection from Households - 581 Households x Rs.10 per month x 6 months 34,860.00 - 581 households x Rs.15 per month x 3 months 26,145.00 Total Revenue from Service fee 61,005.00 Collection from Sale of Compost 1,218.00*Total Revenue 62,223.00* This is actual revenue earned, as per the organisation's register from sale of compost. This does not correspond with amount of compost produced and sold at Rs. 5-8 per kg because part of the compost was initially distributed as free samples, part was mixed with sand as sold as pot-mix at much lower price and part was taken by visitors without paying for it.
3.8.10 Profitability Statement
Table 43. Profitability Statement of the Composting Enterprise Item Per Kilogram of
Compost Per Year
Revenue: revenue from tariffs *3/2=1.50 1,218/2=609.00 revenue from household collection *155.00 62,223.00 Total revenue 156.80 62,832.00 Actual Running Cost 81.98 32,792.00 Gross Profit 74.82 **29,928.00 Actual Capital Cost 19.35 7,740.00 Net Profit Before Tax 55.47 22,188.00 Cost of Taxes 0.00 0.00 Net Profit After Tax 55.47 22,188.00 Hidden Cost 88.69 35,476.00 Net Loss After Tax 33.22 13,288.00 * This figures is on the basis of average price of compost. Half the revenue is paid as land rent. ** Calculation based on the Gross Profit per kilogram of compost multiplied with the total production.
3.9 Marketing Analysis
3.9.1 Marketing Segments and Product Range
Clean Environ has sold 400 kgs. of vermicompost to Urban Households, mainly to the project participants.
3.9.2 Market Positioning
Users perceive the product as a good quality product, although some of them are non-committal on the results.

Technical and Economic Analysis of Composting Enterprises in Bangalore - India WASTE, December 1997
77
The segment is Urban Households and the product is bought by the project participants. Few of them do feel the price is too high. The other competing products like KCDC compost and FYM and animal manure are delivered at door step and hence preferred. For the group of this nature, bulk purchase by the regular customer can provide stability at least in terms of revenue received.
3.9.3 Market-Mix
Table 44. Marketing Mix Marketing Mix Details Product and Price The unbranded product is available in polythene bags on demand. The
vermicompost is processed and packed without any additives. Finely sieved vermicompost is sold at Rs. 8 per kg, course material sometime mixed with sand is sold as potting mix at Rs. 5 per kg. On the bulk purchase of 50 kgs. or more 10 % discount is given.
Place There are no formal channels for distribution, it is informally done either by Project Co-ordinator or Clean Environ Committee members or waste collectors. The compost produced is usually stored at the compost site.
Promotion The only way the product are being promoted is by word of mouth.

Technical and Economic Analysis of Composting Enterprises in Bangalore - India WASTE, December 1997
78
B. Waste Wise
3.10 Overview
3.10.1 History
In the late 1970's, REDS a local NGO in Bangalore, started a programme to support waste picking street children. REDS initiated as part of the project, a waste trading shop and a waste pickers co-operative and started a shelter home on a pilot scale. It was intended to economically help waste pickers. However, REDS later decided to train and help waste picking youth to take up other occupation on the conceptual ground that the earlier approach may perpetuate waste picking. This approach also seemed to have a limited impact as number of people resorting to waste picking increases. This was a beginning point for the then Director of REDS, Mr. Anselm Rosario, to start a program which can link formal and informal systems of city's waste management. In 1990, he launched a project called "Waste Wise" under the banner of Mythri Sarva Seva Samiti trust with the financial assistance from Terres des Hommes and Karnataka Council for Science and Technology. The programme was started with an objective to create an environmentally friendly, socially responsive and participatory approach to solid waste management as an alternative to conventional solid waste management of the city corporation. The project was originally formulated based on a study conducted by Asha D'Souza, a person involved in initial conceptualization. A committee for Clean Bangalore, a platform of NGOs was constituted and due to collective efforts of which the solid waste management programme was officially launched in April 1991 in the neighborhood of Jayanagar.
3.10.2 Jayanagar Solid Waste Management Programme
Overview
A pilot project was started in 7 th and 4 th blocks of Jayanagar a predominantly residential area. The reason for selecting this area was Mythri's contacts with the local waste pickers and middle dealers, willingness of the residents to cooperate with the scheme. Before starting the scheme, several inputs were provided to both the residents and the waste pickers in order to prepare them to participate in the project. They include, research into waste characteristics and collection, surveys and discussions with households, negotiations with Bangalore City Corporation, local ward office and the Housing and Urban Development Corporation and a series of meetings with local waste pickers. A slide and video show were prepared on the benefits of separating recyclables and composting and were shown to the residents in Jayanagar and other interest groups. The project, started with 75 households, was introduced through Jayanagar residential Welfare Association and the Women's club in the area. The participants were asked to keep the waste in three categories: wet, dry and sanitary waste and bamboo baskets were given to the residents to keep the dry waste. Four waste collectors previously involved in waste picking were employed for door to door collection and were equipped initially with baskets

Technical and Economic Analysis of Composting Enterprises in Bangalore - India WASTE, December 1997
79
and bags. When the project expanded to cover 150 households by the end of first year, a trolley with compartments was introduced to collect the waste. During the first year the wet waste collected from the residents was disposed in the municipal bin for subsequent collection and transportation. Since one of the aims of the project, the reduction in the overflowing of bins, was not fulfilled, the organizers decided to compost the waste within the locality. This was also supported by the study which revealed that 70 to 80 % of the house hold waste contain organic matter. However, the main hurdle was availability of land in the vicinity of the collection area so as to avoid long transportation distance. Thanks to the lobbying of active members of the Committee for Clean Bangalore and Waste Wise with BCC, finally the permission for composting in the nearby BCC land was granted.
Source Separation
Another reason to promote decentralised composting is to enable people to see the process of waste picking and the problems that arise when synthetic materials are not kept separate from the organics. Initially, bamboo baskets were distributed among the residents to encourage separation of dry waste. However, many residents used them to store wet waste and as a result baskets were worn off in no time. After two years plastic bins were distributed but by that time the idea of separation had fallen through. In the beginning due to widespread mobilisation and awareness raising through various means the level of separation was high, but never more than 30%.
Composting
Before the programme of solid waste management in Jayanagar, composting was started in a small earthen pit constructed in the compounds of REDS. It measured 4 ft (1) x 2 ft (w) x 2.5 ft (d). Organic waste collected from a nearby hospital was composted for 45 days to 60 days. This did not continue for long as waste was too acidic and worms could survive. In case of Jayanagar, organic waste from 100 to 150 households was transported in hand driven trolleys to the nearby park where four pits each measuring 2.5 ft (d) x 4 ft (1) x 3 ft (w) were constructed. Originally, only the sides were lined with granite stone but later, to prevent bandicoot menace and rain water entry, the bottom was also lined with stone. A roof of tin sheet was provided on each pit so as to prevent rain water. Later the pits were covered with sliding iron mesh to prevent cattle consuming the waste. Vermicomposting was started on the advise of Dr. Radha Kale, an expert on the subject working with University of Agricultural Sciences, Bangalore. Since then composting method has gone through various changes and barring few months in 1993, it would hardly been stabilized. Following is an overview of major points of shift which also sums up various composting methods the organisation has tried in other areas: - The basic process contained initial digestion for about 2 weeks. During this time waste is
turned and mixed regularly. Dry leaves may or may not be added depending upon the season and availability. After the temperature stabilizes the worms are introduced. The species used were Eisena Fietida, Eudrilus and local varieties. After 3-4 weeks, waste is heaped on the ground and scraped from top and sieved. Worms gathered at the bottom are collected and introduced in the next pit.

Technical and Economic Analysis of Composting Enterprises in Bangalore - India WASTE, December 1997
80
- Process control remained a major problem from the beginning. Temperature and moisture content are two parameters that need constant attention. Higher moisture content causes obnoxious smell and would prevent temperature increase. The introduction of worms at the right time is crucial. Number of times, worms died due to various reasons like higher temperature, excessive non-vegetarian waste, high moisture content, etc. For some time, when it was closely monitored by a Research Assistant from Agricultural University, the process was stabilized and steady production was obtained. Rest of the time, although the compost production was continued, the ideal conditions could not be achieved.
- Meanwhile Waste Wise started similar projects in BTM layout, Jayanagar 9th Block, Sadashivnagar and Jayamahal neighborhood, wherein in Sadashivnagar, composting could not be started, although the pits were constructed, due to lack of consensus among the residents. Waste Wise made serious efforts in order to develop a standardized vermicomposting method in Jayamahal neighborhood which are summarized below:
- Two days waste from 200 houses was mixed with half a spoon of urea and cowdung slurry. The pit was kept half empty for mixing and aeration. After few days offensive smell was encountered.
- Dr. Radha Kale suggested to discontinue mixing urea and the pit be filled with alternate layers of organic waste and dry leaves, and each alternate day, cowdung slurry to be sprinkled on top of the waste. Further, after 3rd or 4th day, perforated pipes of 2" diameter to be inserted in upright position. The pit measuring 4 ft (w) x 8 ft (1) x 2.5 ft (d) took one week to be filled. She also suggested to cover the pit with mud pack once it is full to be opened after 2-3 weeks to introduce worms.
- However, in spite of all the care taken there was obnoxious smell from the composting pits. On Dr. Radha Kale's advise addition of cowdung slurry was first reduced and then stopped and dry paper and leaves were thickly layered to absorb extra moisture generated during the process of decomposition. Even then the problem of smell could not be solved. Besides, the worms which were introduced in one of the pits died due to high temperature. The pits full with waste were kept covered under mud pack to prevent smell.
- Meanwhile, Khodays Bio-Chemical Limited experimented with bacterial mixture to speed up the decomposition. However, it could not yield positive results as the mass had already been in septic condition.
- Later, when in the rainy season when the pits got flooded due to high water table, the half decomposed material had to be transported to dumping site by corporation. Here, it would be worthwhile to mention that the pits were located in a sunken park where generally ground water table is high. Fearing that in rainy season there might be a reverse flow of water, drainage was not provided in the pits.
Financial Background
The pits were constructed with financial help from Terres des Hommes and later improved with the help from Karnataka State Council for Science and technology, Bangalore. Three more pits measuring 3 ft (w) x 6 ft (1) x 2.5 ft (d) were constructed with a grant from Environmental Fund for NGOs. A portion of revenue from the sale of compost was also spent on repairing pits. The overall flow of funds for the composting is summarized below:

Technical and Economic Analysis of Composting Enterprises in Bangalore - India WASTE, December 1997
81
Table 45. Overall Funds Source Purpose Year Amount in
Rs. 1. Terres des Hommes Construction of 3+1 pits 1991 20,500.00 2. Kamataka State Council of Science and
Technology Improvement and repair 1992 25,000.00
3. Environmental Fund for NGOs Construction of 3 pits 1995 20,000.00 4. Revenue from sale of compost Repair of 3 pits 1994 10,000.00
3.11 Financial Analysis
From February 1995 to April 1996 is taken as the study period. During the period January and July 1996, Waste Wise managed the project. From August 1996 the project is run by waste collectors themselves. For the purpose of financial analysis both periods are treated separately. The period from January to July 1996 will be referred to as Phase I and August 1996 to March 1997 as phase II. The reason for separate analysis of both the periods is due to differences in the type of costs incurred.
3.11.1 Production Level
Phase Production in Kgs. Phase I - January - July 96 400 Phase II - August - March 97 900
3.11.2 Running Cost
Cost of Labor for Composting
Phase I A waste collector was employed full time for managing the compost operation. Besides a full time Supervisor was responsible to supervise both collection and composting. Hence 50% of the salary of Supervisor is accounted for supervising the raw material flow and is treated as the cost for procurement of raw material, the balance 50% is treated towards labor cost at the composting site. At the time of sieving & packing, the other two waste collectors employed for door to door waste collection and transportation were involved. Sieving and Packing operation was done once every 4 to 6 months. It takes 14 half man-days, i.e., 7 full man-days. Since the other two waste collectors are not paid any specific wages for this purpose but are passed on 50% of revenue generated from the sale of compost, for the purpose of this analysis, the cost incurred towards sieving and packing has been considered as hidden cost and is calculated at the rate of Rs. 40 as wage per day per waste collector. Phase II

Technical and Economic Analysis of Composting Enterprises in Bangalore - India WASTE, December 1997
82
A waste collector works full time for composting and is paid Rs. 600 per month. In addition Rs. 250 is paid to another waste collector for assistance at compost site. Sieving and packing is shared by two other waste collectors working on door to door collection and transportation. The hidden costs are calculated for sieving and packing for phase II at the rate of 10 full days for 2 waste collectors. The costs incurred on labor, both in Phase I and Phase II are summarized in the following table. Table 46. Labor
Cost of Labor per Kilogram of Compost Produced, Rs.
Particulars of Labor Total Amount in Rs.
Actual Cost Hidden Cost Phase I 1. 1. Salary of waste collectors,
1 person x Rs.800 x 6 months
4800.00 1
2.00
0.00 2. 2. Salary of supervisor
1/2 xRs.lOOOx 6 months
3000.00
7.50
0.00 3. 3. Wages for sieving & packing
2 persons x 7 days x Rs.40 * 1000-560
=440.00 0.00
1.10 Total cost of labor for Phase I 8240.00 19.50 1.10 Phase II 1. 1. Salary of waste collectors
1 person x Rs.600 x 9 months 1 person x Rs.250 x 9 months
5400.00 2250.00
6.00 2.50
0.00 0.00
2. 2. Wages for sieving & Packing 2 persons x 10 days x Rs.40
800.00
0.00
0.89
Total cost of labor for Phase II 8450.00 8.50 0.89 *Wage rate for two persons is deducted from 50% revenue earned from sale of compost which is paid to waste collectors.
Cost of Raw Materials
The cost of labor spent on collection and transportation of raw material is accounted as Cost of Raw Materials as human labor is the form of energy used for procurement of raw material as against fossil fuel in other cases. Phase I Two waste collectors were employed. One waste collector was paid a salary of Rs. 1000 for which half salary is already considered in the labor cost above. The other half salary is calculated for the procurement of raw material cost. In addition, half the salary of Supervisor is also considered for this calculation. Phase II Two waste collectors working for the collection and transportation of waste to the composting site received salary @ Rs. 600 per month.

Technical and Economic Analysis of Composting Enterprises in Bangalore - India WASTE, December 1997
83
Table 47. Cost of Raw Material Particulars for Raw Material Total Amount in Rs. Actual Cost of Raw Material
per kilogram of compost, Rs. Phase I 1. Salary of waste collector, 1 person x Rs.800 x 6 months
10,800.00
27.00
2. Salary of supervisor 1/2 xRs.lOOOx 6 months
3000.00
7.50
Total Actual Cost of Raw Material in Phase I 13,800.00 34.50 Phase II 1. Salary of waste collectors, 2 person x Rs.600 x 9 months
10,800.00
12.00
Total Actual Cost of Raw Material in Phase II 10,800.00 12.00
Cost of Additives & Packing Material
Phase I Cost incurred towards purchasing worms, cowdung and packing was Rs. 700. Actual Cost of Additives and Packaging per kilogram of compost = Rs. 1.75. Phase II Cost incurred for purchase of cowdung and gunny bags for packaging is Rs. 340. Actual Cost of Additives and Packaging per kilogram of compost = Rs. 0.37. 2.2.4. Cost of Spare Parts and Maintenance Phase I The total cost incurred on Spare Parts and Maintenance is Rs. 2500. Actual Cost of Spare Parts and Maintenance per kilogram of compost = Rs. 6.25. Phase II The total cost incurred in Phase II is calculated on the basis of Rs. 50 spent on grease & oil and repair of trolley & tyres is Rs. 650. Hence the Actual Cost of Spare Parts and Maintenance per kilograms of compost = Rs. 0.78.
3.11.3 Cost of Rent
We found calculation of hidden cost of rent for land for composting purpose a complex one. The land where composting activity takes place is owned by corporation. It is notified to be used as green space and, it is not allowed to be used for any commercial or residential purposes. Hence, computing rent based on commercial or residential land value in areas like Rajajinagar or Jayanagar would be misleading. However, the composting activity does produce revenue, and if the production is stabilized, it can even make profit. In such a case, should we consider it as a commercial activity or not is a fundamental question. We, finally,

Technical and Economic Analysis of Composting Enterprises in Bangalore - India WASTE, December 1997
84
resolved to consider the hidden cost of rent as zero for the purpose of this study based on the following reasons. Composting is part of a scheme meant to take care of solid waste generated in an area, which is primarily corporation's responsibility. In exchange of community taking care of its own solid waste, corporation allows them to use the land free of cost. In future, if at all such endeavors make profits, corporation can make it mandatory that revenue generated is used only for community purposes.
3.11.4 Cost for Bought-in-Services
Phase I A total amount of Rs. 24000 is paid to a Consultant for services. Also an amount of Rs.21,500 was spent on purchases of services such as motivation, publicity and training. Actual Cost for Bought-in-Services per kilogram of compost = Rs. 35. In Phase II, there were no costs incurred under this head.
3.11.5 Cost of Depreciation
Under section 205 (2) of the Indian Companies Act, depreciation for the fixed assets can be calculated by various methods. It is assumed, on the basis of Straight Line method adopted for the purpose of this study, that 5 per cent of the historical purchase price will be residual value at the end of the life time of the asset. On the basis of the advise from an expert Chartered Accountant, the life time of vehicles and machinery is estimated 14 years whereas for buildings, it is anywhere between 20 to 30 years. Replacement value of vehicles and machinery are at current market prices, however for buildings, equipment and tools they are calculated @ 10 per cent inflation per year. The cost of Depreciation is calculated for both phases.


Technical and Economic Analysis of Composting Enterprises in Bangalore - India WASTE, December 1997
86
Table 48. Fixed Assets Register Price and Value of Asset in Rs. Depreciation Cost
in Rs. Name of Asset Year of
Purchase Estimated Total Life Time (yrs)
Historical purchase price
Replacement value
Hidden value
Residual value
Actual cost
Hidden cost
Construction of Pits and Shelter 1995 20 yrs 75,000 82,500 7,500 3,750 2.74 0.30 5 trolleys 1995 5 yrs 26,000 28,600 2,600 1300 3.80 0.40 Equipment's such as plastic drums, gloves, shoes, gardening implements etc.
1995 3 yrs 9,500 10,450 950 475 2.31 0.24
Total 8.85 0.94

Technical and Economic Analysis of Composting Enterprises in Bangalore - India WASTE, December 1997
87
3.11.6 Cost of Grant Capital
A grant of Rs. 1,21,000 (cost of compost pits and bought in services) is considered as received by the organisation to set up the project and obtain necessary services, though actual grant amount of may be much higher in reality. If a market interest rate of 18% per annum is assumed, then the interest is Rs. 21,780. Hidden Cost of Grant Capital per kilogram of compost = Rs. 21,780/1300 kgs.
= Rs. 16.75.
3.11.7 Cost Price of Product
The average cost price of the compost per kilogram is calculated by summarizing all the cost items and adding them to one total amount in the following table. Table 49. Cost Price per kilogram of Compost
Average Unit per Kilogram of Compost PHASE I, in Rs. PHASE II, in Rs.
Cost Item
Actual Cost Hidden Cost Actual Cost Hidden CostCost of Labor 19.50 1.10 8.50 0.89 Cost of Materials Cost of Raw Material 34.50 0.00 12.00 0.00 Cost of Additives & Packing Materials 1.75 0.00 0.37 0.00 Cost of Spare Parts & Maintenance Material 6.25 0.00 0.78 0.00 Total Cost of Materials 42.50 0.00 13.15 0.00 Cost of Bought-in-Services 35.00 0.00 0.00 0.00 Cost of Rent 0.00 0.00 0.00 0.00 Sub Total of Running Cost 97.00 1.10 21.65 0.89 Cost of Depreciation 8.85 0.94 8.85 0.94 Cost of Interest 0.00 16.75 0.00 16.75 Sub Total of Capital Cost 8.85 17.69 8.85 17.69 Cost Price 105.85 18.79 30.50 18.58 Note: Cost Items on Bought-in-Services, Deprecation, and Interest are calculated only for Phase I.
3.11.8 Cost of Taxes
As the enterprise is in the field of organic manure and being an NGO/CBO, it is exempted from paying sales tax, corporate tax and turn over tax. There is no actual or hidden costs incurred on the cost of taxes.
3.11.9 Revenue
As the project is Community Based, there are two sources of revenue. One source is collection of service fee from residents and the second is from compost sales.

Technical and Economic Analysis of Composting Enterprises in Bangalore - India WASTE, December 1997
88
Table 50. Revenue Particulars Amount in Rs. Phase I Amount in Rs.Phase IICollection from Households - 180 Households X Rs.7 per month X 6 months 7,560.00 - 220 Households X Rs. 10 per month X 9 months 19,800.00 Collection from Sale of Compost 2,000.00 4,500.00 Total Revenue 9,560.00 24,300.00
3.11.10 Profitability Statement
Table 51. Profitability Statement of the Composting Enterprise Phase I Phase II Item
Per Kilogram of Compost
Per 7months Per Kilogram of compost
Per 8months
Revenue: Revenue from tariffs
5.00 2,000.00 5.00 4,500.00
Revenue from household collection
18.90 7,560.00 22.00 19,800.00
Total Revenue 23.90 9,560.00 27.00 24,300.00 Actual Running Cost
105.85 42,340.00 21.65 19,485.00
Gross Profit (-) 81.95 (-) 32,780.00 5.35 4,815.00 Actual Capital Cost
8.85 3,540.00 0.00 0.00
Net Loss Before Tax
(-) 90.80 (-) 36,320.00 5.35 4,815.00
Cost of Taxes 0.00 0.00 0.00 0.00 Net Loss After Tax
(-) 90.80 (-) 36,320.00 5.35 4,815.00
Hidden Cost 18.79 7,516.00 18.58 16722.00 Net Profit/Loss After Tax
(-) 109.59 (-) 43,836.00 (-)13.67 (-) 12303.00
Note: 400 legs of compost produced in Phase I and, 900 kgs of compost produced in phase II.
3.12 Marketing Analysis
3.12.1 Marketing Segments and Product Range
All the compost produced, i.e. 1300 kgs, is sold to Urban Households and to a Nursery.
3.12.2 Market-Mix

Technical and Economic Analysis of Composting Enterprises in Bangalore - India WASTE, December 1997
89
Table 52. Marketing Mix Marketing Mix Details Product and Price The unbranded product is available in gunny bags on demand. The
vermicompost is processed and packed without any additives. Finely sieved vermicompost is sold at anywhere between Rs. 5 to Rs. 8 per kg.
Place There are no formal channels for distribution, it is informally done either by Waste Wise staff or waste collectors. Usually, the entire production of compost is lifted by a local nursery which pays for the transportation charges.
Promotion The only way the product are being promoted is by word of mouth.
3.12.3 Market Positioning
There was no conscious effort to promote the product. Lack of consistency in production did not allow to systematically find the markets. Besides, purpose of the project was social and hence marketing was not given due attention. However, sustainability of the project could be at stake, if there is no revenue from the sale of compost. After the project was handed over to the waste collectors, finding the market for compost evidently became a problem. Waste collectors also try to sell it to the local residents. Here, word of mouth and at the most a sample shown to the potential customer are the easy methods employed by the waste retrievers to promote the product. As per the order, the compost is packed in empty milk sachets, plastic bags or gunny bags. Price is kept at Rs.5 per kg. The regular customer, a local nursery, seems to have resorted to other means of procuring organic fertilizer or manure, due to lack of consistent supply from this project. IV.3. Center for Environment Education
3.13 General Overview
3.13.1 The Organisation
Center for Environment Education (CEE) is a national institution established in 1984 and supported by the Ministry of Environment and Forests, Government of India under the scheme promoting 'centers of excellence'. Through various educational and action programmes CEE aims at creating environmental awareness among children, youth and the general community. The central office is located in Ahmedabad, and CEE South, the Southern Regional Cell, has been functioning from Bangalore since December 1988. CEE South coordinates CEE's activities in the South Indian States viz., Andhra Pradesh, Goa, Karnataka, Kerala, Tamil Nadu and the Union Territories of Pondicherry and Andaman and Nicobar islands. The work on Solid Waste Management started in 1990 with the formation of the activities of the Committee for Clean Bangalore. The committee for Clean Bangalore is an umbrella organization of individuals and several voluntary organizations working together to keep

Technical and Economic Analysis of Composting Enterprises in Bangalore - India WASTE, December 1997
90
Bangalore "clean, green and pollution free". The work is now in progress under the initiative of various agencies, and one of them is the Center for Environment Education. CEE, South has been trying as part of its activities towards protecting the environment in urban areas, to tackle the solid waste problem by motivating and educating the public. It co-ordinates with various government and research institutions to evolve strategies for safe collection and recycling/disposal of waste. Source segregation is an important element of the overall programme. CEE South's 'Environmentally Sound and Productive Use of City Garbage' project started in November 1992, has successfully completed 2 phases and is now entering the III phase from July, 1997. The objectives of phase I was essentially to set up working models of composting in the domestic sector and training other NGOs and CBOs to replicate these models in other areas. Thus four models of door-to-door collection of waste were set up in Coles Park, Rajajinagar, Jayanagar, and Resthouse Park in Bangalore. NGOs and CBOs were also trained. Such projects were started by various other NGOs in different parts of Bangalore. The main aim of phase II of the project, began in 1994, was to set up economically viable, self sustaining projects, maintained and monitored by CBOs independently without any support from NGOs or other funding agencies. It also aimed at replicating such projects in and around Bangalore and in other districts of Karnataka.
3.13.2 Objectives
The primary objective of CEE South is creation of a resource center to develop educational material and methodologies for spreading environmental awareness. Creating awareness on solid waste management through community based approach is one of the primary objectives of CEE's solid waste management programme.
Working Model
Following is CEE's working model of economically viable and self-sustaining CBO based composting enterprise. Step 1: Motivating residents to participate in the project through residents club or welfare
association of the area or any NGO already working in the area. Door to door motivation and a random sample study to get a fair idea of quality and quantity of garbage produced.
Step2: Form an association of the residents, if it does not exist already, and hand over the
management of the entire project to the association. Step 3: Acquiring permission to use land for composting from local municipal or corporation
authorities and locating sponsors for equipment and infrastructure. Step 4: Identification of a supervisor known to the residents, preferably from the locality,
and waste collectors to take up waste collection & composting. Step 5: Training of supervisor and waste collectors in collection & composting.

Technical and Economic Analysis of Composting Enterprises in Bangalore - India WASTE, December 1997
91
Step 6: Construction of composting pits, purchasing tricycles and other equipment. Identification of suitable time for collection.
Step 7: Identification of prospective buyers of compost with the help of residents group and
the supervisor. Rajajinagar solid waste management programme, now being managed by Rajajinagar Swabhimana Initiative has been chosen for in-depth study for the purpose of this research.
3.13.3 Solid Waste Management Programme
After an in-depth study of available technologies and methods, CEE South's solid waste management programme, started in February 1994 in Frazer Town, a residential area near Coles Park in Bangalore. Initially, it was financially supported by NORAD (Norwegian Agency for Development Co-operation) and tricycles required for door to door collection were donated by State Bank of India, Bangalore.
Composting
Composting pits were constructed in an area of 2000 sq. ft in the nearby park of by the Bangalore City Corporation. Originally, 4 pits each measuring 6 ft (1) x 4 ft (w) x 3 ft (d) were constructed with a designed capacity to accommodate organic waste from 180 households. Later it was realised that the capacity was insufficient, for each pit could take only 500 kgs. Hence, 4 more pits of same dimensions were constructed. Pits are lined with granite slabs all round the sides and fixed in cement concrete. The bottom of the pit is given a slight slope and one corner of the pit is packed with sand to facilitate drainage of excess water from the pit. Leachate ultimately meets the ground water table. Pit is covered by a cage like structure with mesh on all sides and covered on the top. Aesthetic acceptance by the residents of the area and people visiting park, convenience to work in the pit, protection from rain water and pests were the factors considered while designing the pits. The same design is more or less adopted in other areas barring minor changes in terms of root design etc.
Method
The organisation tried vermicomposting in the beginning. However, it was found inappropriate for treatment of organic waste from urban households, as it is acidic in nature and often contains waste of non-vegetarian origin. This may lead to smell menace and worms may not survive. Vermicomposting was, therefore, adopted only for farm yard matter, and aerobic decomposition was adopted for composting of residential waste. Organic waste is unloaded into a pit, evenly spread and covered with leaf litter. The material in the pit is turned with rake once in three days to hasten the process of decomposition. Heat generated reaches up to 60 degrees Celsius and is kept under control by turning and watering. It takes 45 days to complete the cycle. Compost is then sieved and packed or stored. Organisation has by and large followed this method for its programme in other areas barring minor changes.

Technical and Economic Analysis of Composting Enterprises in Bangalore - India WASTE, December 1997
92
3.14 Rajajinagar Solid Waste Management Programme
3.14.1 Overview
The Ladies Association of Rajajinagar approached CEE in the beginning of 1996 to help them in clearing garbage from their residential area. CEE assisted the association to establish Swabhimana core group in their residential area, as Swabhimana itself was in the formative stage. Presently, the Swabhimana committee has 6 members in the core group and meetings are held on the 6th day of every month at the BCC ward office to review financial matters. CEE established the project with the help of residents by involving them for collection and segregation of waste. Initially, the segregated waste (except the recyclable matter) was being disposed in the corporation bins, as the composting site was not ready. Subsequently, land for composting a the nearby park was identified and permission from BCC and Horticulture Department was obtained. A Supervisor is appointed to monitor day-to-day operations such as collection & sorting of waste, production of compost, collection of money from the residents, distribution of salaries and marketing of compost. A service charge of Rs. 10 is collected per month from each household. The surplus amount after distribution of salaries from the collections is handed over to the Swabhimana Committee. The community mobilisation is jointly managed by CEE and the Swabhimana committee.
3.14.2 Waste Flow and Collection
Waste from 450 households is collected by 6 waste collectors ( 4 men and 2 women) from door to door, which is further separated into organic, dry, soiled and toxic waste. The organic waste is brought to the composting site, recyclable waste is sold by the waste collectors to retailers/wholesalers, and soiled & toxic wastes are disposed into the BCC bins for safe disposal. Two waste collectors are provided with one tricycle as the number of households is more and the tricycle requires extra push as the area has undulations.
3.14.3 Composting
Design of Pits and Method
The total fenced area is 400 sq. ft. Six pits each measuring 10 (1) x 6 ft (w) x 4 ft (d) are constructed under ground with granite stone lining. Just above the ground is half a foot high metal grill with sliding metal roof. A small door is provided on the roof to deposit the waste. . The site is fenced with granite pillars and barbed wire to prevent vandalism. Aerobic decomposition is adopted as the process of composting as mentioned in the overview. Each pit is filled up to 3/4th level to facilitate easy turning.

Technical and Economic Analysis of Composting Enterprises in Bangalore - India WASTE, December 1997
93
Production: Designed and Actual
Pits are designed to take organic waste from 100 households and currently the collection is extended to 450 households. The total designed capacity of each pit is approximately 500 to 600 legs. Composting was started in January 1996 and till now only two production cycles are completed. One cycle is lost due to rains.
3.15 Financial Analysis
3.15.1 Average Production Level
A total of 1350 kgs of compost was produced for the year April 1996 to March 1997.
3.15.2 Running Costs
Cost of Labor
There are 6 waste collectors, 2 women and 4 men, and an extra waste collector working in case of absenteeism. The men waste collectors are paid Rs. 500 per month and women waste collectors Rs. 450 per month. The running expenses are met from the service fee collected from the residents. Apart from salaries, the waste collectors are paid for breakfast at the rate of Rs. 165 per month. The salary of the Supervisor, Rs. 1500 per month, is divided evenly to calculate cost of labour for raw material procurement and for compost production, for he responsible to supervise the entire operation. CEE paid his salary from September 1996 to March 1997. For the period April to August 1996, the Supervisor's salary is met from the monthly service fee collections from the participants. The total payment for the year April 1996 to March 1997 is, therefore, Rs. 15,800. Only half the cost is treated as cost of labor and the balance is taken into raw material procurement. Each male Waste Collector works for half a day per week at composting site totaling 8 man-days per month. Actual cost of labour per kilogram of compost
= [1/2 x Rs. 15,800] + [8 days x Rs. 20* per day x 12 months ] / 1350 kgs. = Rs. 7.3
* @ Rs. 500 of salary paid per month, Rs. 20 will be the day's payment.
Cost of Raw Materials
Total salary paid to the 4 waste collectors minus labor charges for composting and salaries for 4 women waste collectors is taken as cost of labour for raw material procurement as human labor is the form of energy utilised for collection and transportation of raw material for composting. Cost of labor for raw material procurement is , = [ 4 male waste collectors x Rs.500 x 12 months] - [ 8 man-days x Rs.20 per day x 12 months]

Technical and Economic Analysis of Composting Enterprises in Bangalore - India WASTE, December 1997
94
+ [ 2 women waste collectors x Rs.450 x 12 months] - Rs. 24,000 - Rs.1920 + Rs. 10,800 = Rs. 32,880 Actual Cost of Raw Material per kilogram of compost = Rs. 32,880 / 1350 kgs.
= Rs. 24.4
3.2.3. Cost of Additives and Packaging
The Actual Cost incurred on Additives and Packing Materials is Rs.405 for the year and hence the cost per kilogram of compost = Rs. 405 / 1350 kgs.
= Rs. 0.3
Cost of Spare Parts and Maintenance
The Actual Cost of Spare Parts and Maintenance materials, viz., purchase of gloves, bill-book, soap, tools for the year 1996-97 is Rs. 2,274. Actual Cost of Spare Parts and Maintenance per kilogram of compost
= Rs. 2274 / 1350 kgs. = Rs. 1.7
3.15.3 Cost of Bought-in-Services
A total amount of Rs. 11,200 was paid for services such as motivation & training of the residents through brochures on garbage composting and segregation, VHS cassette and also through door to door personnel. Actual Cost for Bought-in-Services per kilogram of compost = Rs. 11,200/1350 kgs.
= Rs. 8.3
3.15.4 Cost of Rent
The hidden cost of rent of land for composting is considered zero based on the logic mentioned in the section for Waste Wise
3.15.5 Cost of Depreciation
Under section 205 (2) of the Indian Companies Act, depreciation for the fixed assets can be calculated by various methods. It is assumed, on the basis of Straight Line method adopted for the purpose of this study, that 5 per cent of the historical purchase price will be residual value at the end of the life time of the asset. On the basis of the advise from an expert Chartered Accountant, the life time of vehicles and machinery is estimated 14 years whereas for buildings, it is anywhere between 20 to 30 years. Replacement value of vehicles and machinery are at current market prices, however for buildings, equipment and tools they are calculated @ 10 per cent inflation per year. The cost of Depreciation is calculated for both phases.


Technical and Economic Analysis of Composting Enterprises in Bangalore - India WASTE, December 1997
96
Table 53. Fixed Assets Register
Price and Value of Asset (in Rs.) Depreciation Cost per kg of Compost, (in Rs.)
Name of Asset Year of purchase
Estimated Total Life Time (yrs)
Historical purchase price
Replacement value
Hidden Value Residual Value Actual Cost Hidden Cost
6 Granite lined pits 1996 20 yrs 1,00,000 1,10,000 10,000 5,000 3.52 0.37 Construction of shed 1996 20 yrs 30,000 33,000 3000 1500 1.10 0.11 3 tricycles 1996 5 yrs 15,000 16,500 1500 750 2.11 0.22 Equipment such as 9 plastic drums, 9 plastic buckets, gloves, shoes, raincoats, gardening implements etc.
1996 3 yrs 37,925 41,718 3793 1896 8.90 0.94
Total 15.63 1.64

Technical and Economic Analysis of Composting Enterprises in Bangalore - India WASTE, December 1997
97
3.15.6 Cost of Grant Capital
A grant of Rs. 1,94,125 is received by CEE to set up the project. Assuming a market interest rate of 18% interest is Rs.34,942.50 per annum. Hidden Cost of Grant Capital per kilogram of compost = Rs.34,942.50 /1350 kgs. = Rs. 25.9
3.15.7 Cost Price of the Product
The average cost price of the compost per kilogram is calculated by summarizing all the cost items and adding them to one total amount in the following table. Table 54. Cost price per kilogram of compost
Average Unit Cost per Kilogram of Compost Cost Item Actual Cost Hidden Cost
Cost of Labour 7.30 0.00 Cost of Materials Cost of Raw Material 24.40 0.00 Cost of Additives & Packing Materials 0.30 0.00 Cost of Spare Parts & Maintenance Material 1.70 0.00 Total Cost of Materials 26.40 0.00 Cost of Bought-in-Services 8.30 0.00 Cost of Rent 0.00 0.00 Sub Total of Running Cost 42.00 0.00 Cost of Depreciation 15.63 1.64 Cost of interest 0.00 25.90 Sub Total of Capital Cost 15.63 27.54 Cost Price 57.63 27.54
3.15.8 Cost of Taxes
As the enterprise is in the field of organic manure and being a CBO, it is exempted from paying sales tax, corporate tax and turn over tax. There is no actual or hidden costs incurred on the cost of taxes.
3.15.9 Revenue
Since, the project is Community Based, there are two sources of revenue. First, collection of service fee from residents at the rate of Rs.10 per month and second is the revenue from compost sales. For the financial year 1996-97, the revenue generated from service fee collection is Rs. 47,530. A total of 700 kilograms produced is sold and hence total revenue generated from compost sales @ Rs. 3 per kg is Rs. 2,100.

Technical and Economic Analysis of Composting Enterprises in Bangalore - India WASTE, December 1997
98
3.15.10 Profitability Statement
Table 55. Profitability Statement of the Composting Enterprise Item Per Kilogram of
Compost, in Rs. Per Year, In Rs.
Revenue: Revenue from Tariffs 3.00 2,100.00 Revenue from Household Collection *35.20 47,530.00 Total Revenue 38.20 49,630.00 Actual Running Cost 42.00 56,700.00 Gross Profit (-) 3.80 (-)5,130.00 Actual Capital Cost 15.63 21,100.50 Net Loss Before Tax (-)19.43 (-)26,230.50 Cost of Taxes 0.00 0.00 Net Loss After Tax (-)19.43 (-)26,230.00 Hidden Cost 27.54 37,206.54 Net Loss After Tax (-)46.97 (-)63,436.54 * Total revenue from household collection is Rs. 47,530, therefore per kilogram of compost is calculated as Rs. 47530 /1350 kgs of compost.
3.16 Marketing Analysis
3.16.1 Market Segments
A total of 700 kgs of compost is sold for the financial year 1996-97 to the Urban Households located in Rajajinagar and nearby residential areas.
3.16.2 The Marketing Mix
Product Range
There is only one type of unbranded product of compost is available in one kg packets of polythene bags. The compost is processed and packed without any additives.
Place (Distribution)
There are no formal channels for distribution, it is informally done either by CEE representative or by waste collectors. The compost produced is usually stored at the BCC ward office and sold to the project households.
Pricing
Initially, the compost was priced at Rs.5 per kg but due to resistance from the residents, it was reduced to Rs.3 per kg. However, the price at times varies based on customer's willing to pay. Recently, the waste collectors are asked to sell compost at Rs. 4.00 per kg and retain Rs. 1 as his/her commission. This scheme is yet to be fully operational.

Technical and Economic Analysis of Composting Enterprises in Bangalore - India WASTE, December 1997
99
Promotion
The only way to promote the product is by word of mouth. Hence there are no formal promotional strategies adopted, except the new scheme to encourage waste collectors to sell compost as mentioned above.
3.16.3 Market Strategy
Table 6: Marketing Strategy and Performance Marketing mix instruments
Organisation Policy Perception of Customers
Product To convert organic fraction of urban waste into useful product by a method which is less labor intensive and needs less monitoring.
The product is perceived as organic manure & as a replacement for horse manure or FYM. As the product is recently purchased, the customers met were not able to comment on the quality of the product.
Place Direct sale by waste collectors and by project participants.
Easily available to project participants.
Price Priced at Rs.3 per kg. Expensive at Rs.3 per kilogram compared to horse manure or FYM. Some of the customers met are making their own compost at home. It is purchased because participants own the project.
Promotion Word of mouth. Among the project participants, the product is promoted well.
Overall performance of the enterprise in this segment
As there are more kitchen gardens noticed in the project area, the intensive sales strategy adopted, for e.g. through door to door sales by waste collectors once in 15 days may yield better results. At the moment the production capacity is not fully utilised as the waste collectors do not have stake in the production of compost. Other means of selling compost should be given thought.
Performance of competitors in this segment
For all practical purposes, only competition for the product may be compost produced from such community based composting plants and FYM or animal manure. We have to still wait and see how it performs in comparison with FYM and animal manure which seems to have better market in project area. Other community based composting plants are still struggling to streamline their production and not yet have competitive products.

Technical and Economic Analysis of Composting Enterprises in Bangalore - India WASTE, December 1997
100
CHAPTER 4 ISSUES
Inability of semi-mechanized composting plants to take load of urban solid waste efficiently is no more a secret. Karnataka Compost Development Corporation is surviving with its shift to more manually operated process. This has thrown open a challenge of recycling huge amount of organic waste generated in urban areas. Composting of organic waste is one among various options tried on pilot scale. Unique among them are decentralised community based composting plants, commercial production of vermicompost and aerobic decomposition of organic waste. Following is an analysis of strength and weaknesses of each concept.
4.1 Decentralised Community Based Composting
Economically viable scale of such approach seems to be handling of organic waste from anywhere between 200 to 500 houses. Land requirement of each pilot scale model is summarized below: Project Area Method Number of Houses
Covered Land Area sq.ft. Pit Area in sq. ft
1. Rajajinagar Aerobic Composting
450 400 360
2. Clean Environ Vermicomposting 596 800 800+ 1200 (of open space)
3. Jayanagar Vermicomposting 150 2000 192 There is not much difference in terms of land requirements for both the methods of vermicomposting and aerobic decomposition. On an average for 200 houses pit area required would be: Amount of organic waste generated = 387.6 kgs. per day (@ 387.6 gms/capita/day as per the survey of Waste Wise in middle income area.) Pit volume required for 45 days cycle = 2355 cu.ft (@ 200 kg / cu.mt density. Waste is required to be loosely filled in the pits hence density assumed is less). Pit area (@ 2.5 ft depth) = 942 sq ft. If this figure is extrapolated to 5.2 million population of urban agglomeration in Bangalore the land requirement will be phenomenal. Moreover these pilot scale projects have been experimented at land cost significantly less than its commercial value (including the case of Clean Environ) Besides, door to door collection and composting of organic waste needs continuous monitoring for its proper process control. It is doubtful whether middle and high income groups will be willing to spare the time and energy to run such projects on a longer term. Composting of organic waste in close vicinity of residential areas is also not very willingly accepted by residents. It is suggested that even with proper control the process may not be completely smell free, which can lead to non-acceptance by the residents. Cost of production

Technical and Economic Analysis of Composting Enterprises in Bangalore - India WASTE, December 1997
101
per kilogram of compost is much higher compared to centralized production. Following table summarizes production level and cost of production in each project area. Project Area Compost
Theoretically Possible to be Produced in kgs.
Compost Actually Produced in a year
Actual Cost Price, Rs./kg
Hidden Cost Price, Rs./kg
Jayanagar 7,200 1300 102.50 *(22.09)
19.09 *(0.89)
Malleswaram 28,608 400 101.33 88.69 Rajajinagar 21,600 1350 57.63 27.54 * Figures in parenthesis denote values for phase II. In each area, the production level is far below their optimum potential. On an average for 200 houses if 200 kgs. of organic waste is generated in a day, even with very conservative conversion ratio of 16 per cent, there should be 32 kilograms of compost produced per day (assuming that pit capacity is enough and 6 cycles of 45 day each per annum), and approximately 9600 kgs. per annum. No project area has achieved such production level. Standardization of process and stabilization of production level are still a far cry. Although productions in these areas started recently, the concept and method are familiar to the NGOs for the last few years and some of them tried such projects elsewhere. Clean Environ received consultation from various sources and CEE has similar composting project in operation in Frazer Town for the last three years. In case of Jayanagar the low production level is even more striking. Low production level than potentially possible has attributed for high cost of production along with many other problems these projects are facing. The other problems although have their influence on the efficiency, are not discussed here. Marketing of the product is another problem area. Promotion and selling of the product for small groups will be a tough job. So, even if the production is stabilized, unless the product has established market both economic viability and sustainability will be jeopardized. The above mentioned points are not to argue against decentralised composting. What is clear from the case studies is that there is a need to review the scale of operation as well as the style of management. The optimum scale of operation for a decentralised composting plant needs to be evolved. The possibility of organizing waste pickers collectives and training them to manage the composting units need to be explored. As per the provisions of the 74th amendment, the Community Based Organisations will play a major role in service provision and maintenance. In this context the waste pickers need to be organised and represented in the ward committees. The following issues are suggested for further discussion. - earmarking land for the purpose of solid waste management in newly planned areas in the
city can be made mandatory. - standardization of the process and quality of compost in consultation with agricultural
specialists is the need of the hour. - standardized product can be procured by a centralized body for marketing, for marketing
is more economical for bulk volumes than small quantities which a community based group can produce.

Technical and Economic Analysis of Composting Enterprises in Bangalore - India WASTE, December 1997
102
- a thorough review of decentralised approach and its potential to solve the problem of solid waste disposal in urban areas is suggested.
However, it is suggested that economic evaluation of decentralised solid waste management projects, primarily meant for social welfare, need to include social cost incurred and benefits accrued. In the absence of such contextual analysis, assessment of profitability may give misleading results.
4.2 Large Scale Composting
When decentralised composting efforts do not seem promising the only option to recycle organic waste is to have more number of large scale composting plants. History of KCDC and many similar plants in India in 1970s suggest that mechanized or semimechanized composting plants may not be suitable. In this context efforts of both KCDC and Terra-Firma are worth noticing. However, apart from the issue that technology adopted by both the enterprises are still to be developed to handle large quantity of waste, both the enterprises also struggle, - To obtain relatively clean, organic waste. Here, role of source separation of inorganics
from organics may be the only viable solution which may be difficult to achieve. Community based organisations may play crucial role in mobilizing people at the same time door to door collection can reduce chances of further contamination. Terra-Firma did express its desire to enter into contract with community based organisations to lift organic waste regularly if it is assured of supply of separated organic waste. Inorganics are as such much sought after by waste pickers and IWBs.
- To market final product. Compost made of urban waste is still is a niche product in
agricultural country like India. Most of the farmers make compost themselves and may not buy it from the market at substantially high cost. Terra-Firma did struggle to market its product but now have realised that creating a new network may prove costly. It has now contract with Rallies India through which it aims to cover all India market. KCDC has an advantage being semi-government outfit and it enjoys network created for chemical fertiliser although farmers seem to have not aware of the product unless those given free or subsidized rate. In this context it could be understood that for community based organisations it may be difficult to sell small amount of compost it may produce.
Besides, both these enterprises are contrasting examples as KCDC enjoyed Government protection whereas Terra-Firma has to struggle to obtain permission. These double standard seems to be changing as Bangalore City Corporation has started to invite private enterprises to help handle garbage. A note of caution is necessary here. BCC on the one side needs to be cooperative with private agencies, on the other needs to develop standards for process and products and a mechanism to enforce and monitor minimum level of service. It also needs to establish mechanism to control price of service provision and final selling price of product. Without such regulatory mechanism private efforts may prove worst than past record of official agencies.

Technical and Economic Analysis of Composting Enterprises in Bangalore - India WASTE, December 1997
103
Comparison of KCDC and Terra-Firma The fundamental difference between KCDC and Terra-Firma is the approach. The motivating factor for the former enterprise is treatment of organic waste, while the later, began with production of compost with value addition and chose urban organic waste as raw material. This has reflected considerably in the choice of technology and eventually on the quality of the end product. However, there is lack of systematic analysis of quality of various varieties of compost, however, the following table summarizes some of the test results. Parameters KCDC * CEE *
Aerobic Compost
CEE * Vermicompost
Waste Wise ** Vermicompost
Terra Firma ***
PH 7.62 8.2 7.75 7.57 7.5 Organic Carbon %
17.25 14.81 16.61 18.01 -
Nitrogen % 0.98 1.12 1.08 0.68 1.5 P2O5% 0.915 0.12 0.113 0.61 1.5 K2O% 0.68 0.85 0.7 0.35 0.9 Cadmium % 2.5 - - 1.00 - Magnesium % 0.3 - - 0.44 - Sodium % 0.13 - - 0.20 - Sulphur % 0.39 - - 0.00 - Born PPM 680 - - - - Water Holding Capacity %
66.67 - - - -
Bulk Density gms/cc
0.90 - - - -
Moisture % 27.5 - - - - Arsenic % traces nil nil - - Zinc % 0.025 0.0086 0.0048 - traces Cadmium % 0.0018 0.00039 0.00046 - - Hexavalent Chromium %
0.0039 0.00258 0.00102 - -
Total Chromium %
0.072 0.011 0.00489 - -
Copper % 0.065 0.20 0.15 - traces Lead % 0.0036 0.001 0.001 - - Nickel % 0.00395 nil nil - - Cyanide % nil nil nil - - Silica % 66 43 54 - - Manganese % - - - traces traces Iron % - - - 0.15 traces Source: * Krishna, 1994.
** From the files of Waste Wise, 1994 *** As described in brochure of Terra-Firma, 1997
It is very clear from the above table that KCDC compost has high amount of heavy metal. However, vermicompost is also not free from this pollution, although it is claimed that once the matter passes through earthworm's gutter all toxic matters are removed. A systematic analysis of the quality of compost produced organic waste and its long term impact on agriculture is a concerned area for further research. Its comparison with chemical fertilizer in

Technical and Economic Analysis of Composting Enterprises in Bangalore - India WASTE, December 1997
104
the context of pollution and long term environmental health impact caused by chemical farming can provide more pragmatic perspective. However, the need of the hour is standardization of the process and quality control of composts produced from different methods. The complaints received from the farmers, during the period of this study, about the quality of KCDC compost, which is promoted by the Agriculture Department raises serious doubts. The method, technology, process control and, finally, mixed nature of waste composted need a thorough review to draw guidelines for production of organic fertilizer/ conditioner from urban waste. Comparison of Aerobic and Vermicomposting Methods Aerobic Composting Vermicomposting It can convert higher volume of waste in short time.
It needs more time to treat same amount of waste.
There is greater scope for mechanization. It is labor intensive process as human judgment is needed to respond to change in climate and environment.
Needs less process control. Needs close monitoring of the process and quick response.
Inferior final product with Superior final product N 0.75 to 1 % N 1 to 1.25 can go up to 3 % P 3% P 0.75 to 1 % K 1 to 1.5% K 1.25 to 1.5% Final product is not sterilized if temperature rise is not properly monitored controlled it may not kill weed seeds and pathogens. Heavy metals are not removed.
Waste passed through earthworm guts is claimed to be free from pathogens and heavy metals which may not be true always.
Cost of production is less. High.

Technical and Economic Analysis of Composting Enterprises in Bangalore - India WASTE, December 1997
105
REFERENCES FOR CHAPTER 4:
Krishna, Shyamala. 1994. "Solid Waste Management: A Community based Approach", Monograph on Solid Waste Management, Bangalore: CEE.

Technical and Economic Analysis of Composting Enterprises in Bangalore - India WASTE, December 1997
106
CHAPTER 5 OCCUPATIONAL HEALTH IMPACT
Dr. Vasundhra3
5.1 Case Study 1:
Karnataka Compost Development Corporation Limited (KCDC)
5.1.1 Observations
There were series of high piles of garbage with waste materials scattered around the area. The waste was loaded by a mechanical dumper. Application of cowdung slurry as well as sprinkling was done by workers. They turned over the garbage once in five days with the help of long forks. There are two sieving plants one of which is partially covered and the other open . Workers were found to be exposed to inclement weather e.g. high temperature up to 34 °C and ultra violet radiation during summer and to rains during monsoon as most of the work was done in open. The smell was offensive. The sieving plant caused a lot of noise. No proper washing and sanitary facilities were provided. Air pollution occurred during unloading; turning of garbage and sieving. During rains the lechate from the waste materials spread on the ground may cause soil pollution. The threat of ground water pollution was real to the residents of the neighbouring villages. The unprocessed waste as well as non bio degradable residue was piled up and sometimes burnt causing air pollution. Risk perception was found to be lacking regarding the incomplete combustion of waste particularly of the PVC and rubber products. There were dogs straying around the waste piles. The health hazards identified were: - Physical - Chemical - Mechanical - Biological - Psychological
5.1.2 Physical Hazards
- Visual Distress Garbage was piled up to a height of 10'. This may affect workers, supervisory staff, neighbourhood residents and visitors. .
- Smell
The smell was offensive and although workers have got used to it, this is likely to cause psychological distress and headache. The other impacts due to offensive smell is discussed later in the section on animal waste.
3 This paper is an abridged version of a report prepared by Dr. Vasusdhra commissioned for the present study.

Technical and Economic Analysis of Composting Enterprises in Bangalore - India WASTE, December 1997
107
- Noise Sieving operation generates a lot of noise which was found to be disturbing. Workers were reported to be exposed to this noise for 8 hours daily for 6 days a week. Hence, there is a probable risk of deafness besides irritability, headache, fatigue, high blood pressure and speech interference which could lead to accidents. The sieving process is neither enclosed nor isolated to limit the exposure to noise, as a result of which other workers may also be affected..
- Heat
During summer, the heat was stated to be unbearable for workers specially those wearing gum-boots. The temperature during summer often touched 34 C. Heat exhaustion and heat cramps were complained by workers on questioning.
- Radiation
Excessive ultra violet radiation was another hazard faced by outdoor workers. The likely results of excessive radiation are dermatitis and cancer of skin.
- Exposure to Rain
During monsoon and winter, those who are involved in outdoor work reported that they suffer from cold, sore throat and cough.
- Air pollution
o The possibility of health risks due to air pollution exist during and after the composting process for the administrative staff, the outdoor workers engaged in activities such as loading, unloading, packaging, and sieving ; and the residents in the neighborhood.
o Among the outdoor workers, those involved in the sieving process face the highest health risk due to the presence of dust particles smaller than 5 microns. All the outdoor workers are vulnerable to respiratory disorders such as sneezing, sore throat, bronchitis, chest pain, and fibrosis of lungs leading to irreversible pneumoconiosis on cumulative exposures. Exposure to vegetable dust can cause allergic manifestations like asthma and emphysema of lungs.
o One of the workers, female aged 50 years working since 15 years in outdoor composting process complained of cough; pain in chest, difficulty in breathing and loss in weight. On examination it was found there was clubbing of nails and oedema of feet (she was availing treatment from Government hospital). Provisional diagnosis would be allergic bronchitis, corpulmonale, cancer of lung).
o In Bangalore city, the pollens of parthenium weed, which grows wildly in places of garbage accumulation is suspected to be a major cause of allergic manifestations of respiratory disorders. As the pollens of parthenium weeds can be dispersed easily in the air, the administrative staff and the residents in the neighbourhood are also prone to respiratory disorders..
o Non-biodegradable substances in the waste such as the plastic and rubber are accumulated and burnt. The workers stated that the combustion process is invariably incomplete. The workers as well as neighbourhood residents exposed to smoke, smell and fumes generated by the process are prone to irritations.

Technical and Economic Analysis of Composting Enterprises in Bangalore - India WASTE, December 1997
108
- Soil Pollution During unloading of waste, all the materials are scattered on the ground. Further, non-bio degradable substances are piled on the ground. There is a risk of soil pollution due to lechates from the waste during monsoon.
- Ground Water Pollution
There is a likelihood of ground water pollution due to lechate from waste. The possibility of high phosphate and nitrate content in borewell water around the composting plant is high. When the nitrate content in water rises above 45mg per liter of water, infantile methaemoglobinaemea i.e. "blue baby syndrome" may occur among babies below one year of age.
5.1.3 Chemical Hazard
- Hazardous and toxic waste present in the municipal waste due to mixing of industrial, chemical and agricultural waste include pesticides, battery cells, bottles of poisonous chemicals, containers of disinfectants, discarded medicines, fluorescent tubes, electric bulbs and cable wires.
- Pesticide residue, excessive amount of trace element from cowdung slurry and sweepings of poultry feed used in the composting process may prove to be harmful to the crops and has the possibility of entering the food chain. Pesticide residue pose a high risk of environmentally induced cancer.
- Analysis of the sample of compost produced by KCDC showed the presence of heavy metals such as Arsenic, Zinc, Cadmium, Hexavalent Chromium, Copper, Lead, Nickel and Cyanide (Krishna, 1994).
5.1.4 Biological Hazards Waste at the compost site was found to be contaminated with human and animal excreta, infectious waste from hospitals and carcasses of animals. The presence of human excreta in garbage pose a major health risk to the people coming in contact with it.. Further waste provide a conducive environment for the development of vectors or passive carriers of diseases such as flies, cockroaches and mosquitoes. The probable health impact due to the above mentioned factors are: Pathogens Type Health Impact Bacteria Salmonella
Shigella Leptospira V. Cholera
Diahorrea, dysentery, enteric fever, Cholera.
Virus Enterovirus Adenovirus Hepatitis virus
Poliomyelitis Rotovirus diahorrea Hepatitis A
Parasites Entamoeba Histolytia Ascaris lumbricoides ova of hookworm
Dysentery Tapeworm, roundworm and hookworm
Vectors Rats
Plague, leptospirosis and ratbite fever.
Dogs and cats Rabies

Technical and Economic Analysis of Composting Enterprises in Bangalore - India WASTE, December 1997
109
Flies - Common house fly
transmitters of bacterial disease
Mosquitoes - Anopheles Culex, Aedes aegypti
Malaria Filaria, Japanese Encephalitis Dengue fever
Vermin infestation transmitter of pathogens and can cause allergic manifestations like asthma.
Animal Waste
As the waste at the compost site was found to be contaminated with animal faeces there is a danger of spread of Tinea Solium and Tinea Saginita and Echinococcus granulosa. Since the cow dung slurry is used to composting, it has to be taken into account that some animals may discharge pathogens without showing any signs of infection. During the composting process, as mentioned above, cowdung manure slurry is added onto the waste. A fresh cow manure slurry has a high biological oxygen demand up to 100,000 mg oxygen per liter. Excessive loading of soil with waste material (> 100 metric tons /ha) could result in slower decomposition of waste, depletion of oxygen and production of odorous phytotoxic end products. Furthermore, addition of animal manure may also result in production of ethylene - a gas that retards both the root growth and plant development. Uncontrolled application of manure slurry pose hazard of soil pollution which in turn may affect human and animal health. Excessive application may lead to anaerobic decomposition of manure resulting in production of ammonia, hydrogen sulphide and alcohol. These can affect the crop productivity and quality. The microbial metabolism of elements in the waste can produce methylated compounds e.g. methylated lead, mercury, arsenic, selenium, tellurium are toxic and malodorous even at a very low concentration.
5.1.5 Mechanical Hazard
Vibrations from the sieving plant can lead to vasospasm of small blood vessels causing white fingers. Constant friction may cause callosites or tenosynovitis. Loading operation for storage of packed bags of final products can cause strain, sprain, postural defects and even accidental injuries due to fall as the house keeping at the plant was found to be poor.
5.1.6 Suggestions
- Controlled Mixing of manure - Pre-treatment of waste - Grow trees around the plant to help check air, water, soil and noise pollution. - Provide washing and sanitation facilities. - Dust enclosure procedure or isolation of the procedure into entry of limited exposure per
day.

Technical and Economic Analysis of Composting Enterprises in Bangalore - India WASTE, December 1997
110
5.2 Case Study 2 : Terra Firma Bio-Technology Limited 1. Observation
Waste generated from the market area is used for composting. It was reported that every day 14 trucks of waste is bought for composting. The waste materials consisted of vegetable matter, including coconut shells, paper, plastic, glass, rubber, tyres, batteries, photo-films, vermins, animal carcasses. Besides, dogs, cats and rats were found in the waste material. Waste is unloaded manually by men, women and children in the open space. In the process these workers expose themselves to inclement weather. However the workers stated that they prefer to do this job as it would be completed by 2p.m whereas other jobs they have to work from 8.30 a.m. to 4.30 p.m. The possible health hazards during the various processes adopted are: No Stage Process adopted Possible health hazards 1 Unloading of waste Waste is unloaded manually in
bamboo basket from the truck. No protective equipment were found to be used during the process.
a. Air pollution due to disposal of dust particles and exposure to fumes from the diesel engine operating throughout the unloading operation.
b. Accidents: Cuts due to contact with sharp articles, falls and animal bites.
c. Increased risk of contracting dermatitis, food borne infection and worm infestation.
d. Ergonomic problems: strain in the neck muscle, headache, fatigue and postural problems.
e. Exposure to inclement weather. Increased vulnerability to heat cramps, heat exhaustion and cancer of the skin.
2 Sorting of waste The waste is spread on concrete platform for removal of nonbiodegradable materials. This operation was also found to be performed with bare hands.
a. Accidental injuries: Cuts from sharps, falls and animal bites which can lead to rabies or rat bite fever.
b. Smell from putrefied waste: Chances of getting headache is high. The workers get used to the smell on repeated exposure.
c. Biological hazards: Food borne disease and worm infestations. Many workers were found to not clean their hands properly.
d. Respiratory ailments from dust particles dispersed by air.

Technical and Economic Analysis of Composting Enterprises in Bangalore - India WASTE, December 1997
111
No Stage Process adopted Possible health hazards e. Exposure to sun and rain: can
cause dehydration, heat cramps, heat exhaustion, dermatitis, skin cancermelanoma, cold fever and sore throat.
f. Chemical Hazard. Dermatitis or systemic problems specific to the chemicals present in the waste.
3 Manual carrying of waste
Waste from the concrete platform is carried manually to tunnels in bamboo baskets.
a. Mechanical hazards: Psychological problems due to repetitive monotonous nature of work. Ergonomic problems such as strain in neck muscles, body aches and callosities due to constant friction.
b. Physical Hazards. Respiratory ailments due to dispersal of dust particles. Headache and exhaustion due to exposure to sun.
4 Vermicomposting Waste in the tunnel is turned manually three times in 45 days. It is then inoculated with earthworms or micro organism culture. The temperature ranges from 25 to 30 ° C, while the moisture content is maintained.
a. Air pollution leading to respiratory problems.
b. exposure to offensive smell c. risk of rat bite is high. At times
synthetic rodenticide is applied which could lead to mixing of toxic material with the compost.
5 Loading and lifting of compost
Compost from the tunnels is carried over heads in bamboo baskets.
a. head ache and postural defect,
b.'constant friction causing cuts and callosities.
6 Sieving and packing
A locally fabricated machine is used for sieving. The sieved material is packed in gunny bags. This operation takes place in a sheltered environment.
Physical hazards. Air pollution due to scattering of fine dust leading to allergic bronchitis, cough and chest pain. Besides the workers, neighbourhood residents may also be affected if there is strong wind. Ergonomic problem such as body ache and fatigue due to the posture of working during packing.

Technical and Economic Analysis of Composting Enterprises in Bangalore - India WASTE, December 1997
112
No Stage Process adopted Possible health hazards 7 Storage The gunny bags are stored in a closed
space before sale. Discomfort, bending of back and joint pains.
Air pollution. Burning of plastic and rubber produces smoke, smell and fumes leading to eye irritation. The employees as well as the neighbouring residents may be affected.
8 Burning /dumping of nonbiodegradable
The non biodegradable were collected in piles along the wall and burnt once in a while or even thrown over the wall.
Soil Pollution due to lechate from the waste which could affect the ground water. Ground water pollution may cause infantile methamoglobin..
5.2.1 Problems Observed
- It was stated that on an average workers absent themselves from work for 2-3 days in a month for reasons of ill health. The common illnesses reported were injury, cough and asthma.
- Women were found to be anaemic. Some women workers had kolionychia or spoon shaped nails.
- Varicose viens were observed on legs of one male worker and oedema of feet was found in one worker.
- Three workers were affected by fungal infection and cut marks and callositities were found in six workers.
5.2.2 Suggestions
- Provide protective devices including gloves, masks, gum-boots and caps. - Provision of toilet and washing facilities. - The sorting area to be roofed to prevent direct exposure to inclement weather conditions.
5.3 Case study 3: Clean Environ, Malleswaram.
5.3.1 Observation
The boys were observed during the collection process and at the composting site. It was found that the waste material collected from door to door was not separated properly by the households. Waste was found to be mixed with sharp materials like blades, broken bottles and medicine covers. Vermins like cockroaches, mosquitoes and flies were found in the waste material both at the time of collection and at the compost site. Lack of personal hygiene was observed in the nails of the boys. During their work, they were exposed to weather conditions. The health hazards during the collection and the composting process are as follows:

Technical and Economic Analysis of Composting Enterprises in Bangalore - India WASTE, December 1997
113
No Process Possible Health Hazard 1 Collection and
sorting Direct contact with waste during sorting could lead to : - Accidents of cuts and injuries with risk of super infection and tetanus. - Food borne infections like gastro-entreitis, worm infestations and
hepatitis. - Contamination of food with rat droppings leading to leptospirosis. - Bites of stray and pet dogs. Soiled sanitary pads retain blood and
body fluids which could increase the risk of serum hepatitis and HIV infection.
Physical hazards. Excessive exposure to heat, radiation, rain and air pollution could lead to - Heat: Headache, heat exhaustion and dehydration. - Radiation :Dermatitis or melanoma and skin cancer. - Rain : cough, common cold and pharyngitis. - Air pollution: allergic manifestation like rhinitis, asthma, cough and
cold. Chemical hazard due to contact with the unused medicines, solvents, acid containers and adhesives.
2 Composting Exposure to offensive smell may cause headache. Accidental cuts or falls
during loading and unloading. Chemical hazard due to contact with detergent cans, disinfectants or discarded medicines. Biological hazard such as gastro intestinal disease and worm infestation.
Health problems observed: Health hazard during the collection process may be high due to direct contact with mixed waste.. At the composting site, it was observed that: - Since the site is located faraway from the residences, risk due to exposure to smell is
faced mainly by the workers. - The site area is well maintained and also the quantity of waste handled is minimal.
Breeding of rats and flies could be minimal. However, the trough used for storing water for composting provide a conducive environment for breeding of mosquitoes particularly the Aedesaegypti and anopheles which causes malaria and dengue fever.
5.3.2 Suggestions
- Simple devices like "picker" must be provided for the boys during sorting to prevent
direct handling of waste. - The boys must be educated to wear gloves. - Vehicle design to be improved to prevent dispersal of dust and waste materials. - The laborers are to be provided with preventive health measures like immunization with
tetanus toxoid and deworming.

Technical and Economic Analysis of Composting Enterprises in Bangalore - India WASTE, December 1997
114
REFERENCES FOR CHAPTER 5
Ammu Joseph. 1994. "Recognizing the Removers", Hindu Survey of Environment, Madras: The Hindu. Carolene Hunt. 1994. "A Comparative Study of the Health Status of Children Involved in Waste Picking in Bangalore City", unpublished Masters dissertation submitted to University of Amsterdam, The Netherlands. Koppikar S., Ruben Bannerjee, Stephen David and Vijay Menon. 1997. "Drowning in Trash", India Today, May. Krishna, S. 1994. "Solid Waste Management: A Community based Approach", Monograph on Solid Waste Management, Bangalore: CEE. N.B. Mazumdar. 1996. "Municipal Solid Waste Management—Indian Perspective," Energy Environment Monitor, 12(2). Park J.E., and Park K. Textbook of Preventive and Social Medicine, Delhi: Banarasi Das. M.K. Vasundhara. 1992. "Solid Wastes from Hospitals and Nursery Homes" Paper presented at a symposium on solid Waste Management, Bangalore. M.K. Vasundhara. 1994. "Health Hazards of Pollution of Lake" Paper presented at a workshop on Beautification of Bangalore Lakes, Bangalore, March. M.K. Vasundhara. 1996. "Prevention and Control of Water-borne Disease", Paper presented at a seminar on Environment Related Issues, Bangalore.