Technical 3233 - NASA
34
NASA Technical Paper 3233 AVSCOM Technical Report 92-B-002 August 1992 US ARMY AVIATION SYSTEMS COMMAND AVIATION R&T ACTIVITY ¥ .\ Two-Dimen_onal Aerodynamic Characteris_ of Several Polygon-Sti_ed Cross-Sectional Models App_cable to Helicopter Fuselages === - . A., Henry L. Kelley, . Cynthia A. Crowelt,- and John C. Wilson z : _:r - ("'.A]A--I-n-- 3._ 3j) Tt._-c,:r,;r-,_i-?.:,L A:-_,_.._Y,N._YIC CHA_ACT.CRI._TIC:5 jc- ]r-V_,A L p:3LybnN-SHAp[ _) CPZ;S'_-SFCTIn:':AL _'_quF-LS APPLICASLE T] _LIC_;PTE,_ FUSELA(SES (t-,ASA) 3") "-" ) _f _,..J "_-> ?- 3039', Uric I_s HI/02 ell_OO5
Transcript of Technical 3233 - NASA
NASATechnical
Paper3233
AVSCOMTechnical
Report92-B-002
August 1992
US ARMYAVIATION
SYSTEMS COMMANDAVIATION R&T ACTIVITY
¥
.\
Two-Dimen_onal AerodynamicCharacteris_ of Several
Polygon-Sti_ed Cross-Sectional
Models App_cable to
Helicopter Fuselages===
- . A.,
Henry L. Kelley, .
Cynthia A. Crowelt,-
and John C. Wilson
z
: _:r -
( "'.A]A--I-n-- 3._ 3j) Tt._-c,:r,;r-,_i-?.:,L
A:-_,_.._Y,N._YIC CHA_ACT.CRI._TIC:5 jc-
]r-V_,A L p:3LybnN-SHAp[ _)
CPZ;S'_-SFCTIn:':AL _'_quF-LS APPLICASLE
T] _LIC_;PTE,_ FUSELA(SES (t-,ASA)3") "-"
)
_f
_,..J
"_->?- 3039',
Uric I _ s
HI/02 ell_OO5


NASATechnical
Paper3233
AVSCOMTechnical
Report92-B-002
1992
National Aeronautics andSpace Administration
Office of Management
Scientific and Technical
Information Program
Two-Dimensional AerodynamicCharacteristics of Several
Polygon-Shaped Cross-Sectional
Models Applicable to
Helicopter Fuselages
Henry L. Kelley,
Cynthia A. Crowell,
and John C. Wilson
Aeroflightdynamics Directorate
JRPO--La ngley
Langley Research Center
Hampton, Virginia

The use of trademarks or names of manufacturers in this
report is for accurate reporting and does not constitute an
official endorsement, either expressed or implied, of such
products or manufacturers by the National Aeronautics and
Space Administration or the United States Army.

Summary
An investigation was conducted in the Langley14- by 22-Foot Subsonic Tunnel to determine two-
dimensional aerodynamic characteristics of nine
polygon-shaped models applicable to helicopter fuse-lages. The models varied from 1/2 to 1£ scale and
were nominally triangular, diamond, and rectangu-
lar in cross-sectional shape. Section side-force co-
efficients cv and section normal-force coefficients cz
were obtained at a dynamic pressure of 20 psf andat incremental angles of flow incidence 0 from -45 °
to 90 ° . The data were compared with results froma study of a UH-60 tail-boom cross-sectional model
that served as the t)aseline configuration. Data from
a UH-1 class helicopter ,*,ere used in calculations to
estimate effects of the cross-sectional aerodynamicsoi1 tail-rotor power.
Tile overall shapes of the plots of Cz and cy ver-sus 4) for the polygon-shaped models were similar to
the characteristic shape of the baseline data; how-
ever, there were important differences in magnitude.
At 0 = 0°, for example, larger maximum values of Czfor the polygonal models than for the baseline model
resulted in a computed increase in fllselage down-load penalties of about. 1 to 2.5 percent of main-rotor
thrust. Three of the polygonal models had larger val-
ues of the slope of c v versus 0 than the baseline con-
figuration had, an indication of potential among thepolygonal configurations for producing higher fuse-
lage side-force and yawing moments when the cross
sections are incorporated into a helicopter design.
Key parameters from tile polygon-shaped-model datawere compared with UH-60, AH-64, and UH-1 two-
dimensional model data previously reported.
Introduction
Single-rotor helicopters are subject to complexairflows generated by the main- and tail-rotor wakesand the ambient wind. These airflows create aero-
dynamic forces on the fuselage and the tail-boom as-
sembly which, during hover and low-speed sidewardflight, must be counteracted by increased main-rotor
and tail-rotor thrust to maintain aircraft trim (refs. 1
and 2). The additional thrust increases the powerrequirements, which results in a reduction in both
payload and yaw control margins. The magnitude of
the aerodynanfic forces on the fllselage is influenced
by the cross-sectional shape and size of the fuselageas well as by tile angle of attack and dynamic pres-
sure in the wake around tile flmelage. To optimize
the aerodynamics, a fllselage cross-sectional configu-ration should be shaped to minimize the down load
on the fuselage, which must be offset by additional
main-rotor thrust. Also, the side force on the boom
shouht be in the same direction as tail-rotor thrust
to help decrease the thrust. The steet)er the slope of
the fuselage side-force coefficient cv/O and tim largerthe positive and negative values of the section side-
force coefficient cy, the more sensitive the fuselage is
to the velocity and angle-of-attack changes and thegreater the potential is for fllselagc yawing moments
in crosswinds and sideward flight with the attendant
burden on tail-rotor horsepower. The steepness of
the slope of cv/¢, much like the lift-curve slope for
an airfoil, indicates a larger side force tbr a given an-
gle of flow incidence (5 as well as increase(t sensitivityto changes in (5 or velocity.
Previous studies (reN. 3 to 7) have been made
in an effort to understand and modify helicoptertail-boom aerodynamic forces. Botil two-dimensional
wind-tunnel model and flight investigations were con-
ducted on OH-58, UH-1, AH-64, and UH-60 heli-cot)ter tail booms. The two-dimensional tail-boom
cross-sectional shapes investigated in the tmmel weregenerally cylindrical or oval. However. radar de-
tectability requirements of future military helicopters
require a change from more traditiona.1 designs tolow-radar-signature cross-sectional (tesigns that are
generally polygon shaped. The aerodynamic charac-
teristics of the polygonal shapes have not been flfllyinvestigated, and data from wind-tunnel mo(tels are
necessary to validate comt)utational methods that
will be used to predict aerodynamic effects on vehicleperformance an(t handling qualities.
To provide these data, a wind-tunnel investiga-
tion was conducted in the Langley 14- by 22-FootSubsonic Tunnel with nine t;wo-dimensional polygon-shaped models that varied from l,,) to E/_,scale. The
models, shown in figure 1, were based on design in-forination from an investigation sponsored by theU.S. Army oil fllselage low-radar cross se('tions and
represent possible fllture fuselage cross sections. The
results front the polygon-shaped models were con>
pared with those of a modern U.S. Army utility
helicopter tail-boom cross-sectional model (UH-60),
which served as the baseline configuration (rcf. 3).When calculations were made to determine the ef-
fect of side-force characteristics on tail-rotor power, aUH-1 class helicopter (Bell 204B) was used because of
the type of flight data available. Aerodynamic forces
were mea._urcd at a free-stream dynanfic pressure q_cof 20 psf for angles of (5 fronl -45 ° to 90 °. The base-
line configuration data were taken at q_c = 25 psf(ref. 3). The results are presente(t as the section
normal-force coefficient ca and cy as a function of 0for each configuration and are compared with resultsfroIn the baseline model tests. Calculations based
on an assumed helicopter were made to obtain tile

approximateeffectsof thevariationsinside-loadanddown-loadsectioncoefficientsoi1tail-rotorandmain-rotor powerrequiredcomparedwith thoseof thebaselineconfigurations.
Symbols
Conventionsfor positivesenseof Howinclination,modelrefl_rencedimensions,andaerodynamiccoeffi-cientsareS}lO_._/ll ill tigllre 2.
b
(.
C_
C 2
t_f[ I.
q,_-C
/?
7"
maximuztz width of model, in.
maximum depth of model, in.
section side-force coetticient,
Side force per unikle_hbq,c
section normal-force coefficient.
Longitudinal fbrce per unit lengthbqx,
power-factor ratio of tail-rotor power
required to balance aerodynamic forceof tail boom with polygonal cross
sections to tail-rotor power required to
balance aerodynanflc force of baseline
(Bell 204B) tail boom
I ._1:2free-stream dynamic pressure, 2t _' ,psf
Revnohts nlllllber, pl_c, 12t_
corner radii of fllselage (:ross section,iIl.
_-_TIilr
"_111r
change in main-rotor thrust required
tbr helicopter with tail boom equippedwith the polygon-shaped cross sections
compared with helicopter with base-
line (Utt-60) tail boom
}_ free-stream velocity in tunnel, ft/sec
angle of sideslip positive with relativewind approaching aircraft froln the
right, deg
1, at)solute viscosity, slug/ft-sec
p free-stream air density, slug/ft 3
0 angle of flow incidence in plane normalto axis of two-dimensional cylinder,
deg
Abbreviations:
BL baseline
TRDSC tail-rotor drive-shaft (.'over
Sx polygon-shalmd-modcl identification,
with z indicating configuration,at= 1,2 ..... 9
Model and Apparatus
Nine polygon-shaped models representat.ive of
cross sections of rotorcraft filselages or tail boomswere tested. The models varied from approxilnately
tel to IZ,,scale. Dimensions and cross-sectional shapesof the nine models and of the baseline Utt-60 tail-
t)oom model are shown in figure 1. Model configura-
tions S1 and $2 were both basically triangular, withrounded corners on the bottom. Configuration S1
had a flat. top and configuration $2 had a. rounded
top that couht serve as a tail-rotor drive-shaft cover
(TRDSC). Configurations Sa and $4 were both di-amond shaped, with a nearly flat be(rein. Config-
uration $4 had a pointed top and configuration Sa
had a small, fiat top. Configurations S 5 and S(_ were
truncated triangles. Configuration S(i had a TRDSCshape oil top of the trm_eation. Configurations $7
and Ss were both diamond shaped and looked sim-
ilar to configuration S:_ except for larger fiat tops,Configuration Ss had a TRDSC shape on top. Con-
figuration S9 was basically a vertical rectangle with
z'om_ded corller_ azld had a TRDSC shape on top.The baseline model section was taken fi'om the tail
boom of a UH-60 at a station a.pproximately raider-
neath the 80-percent-radius station of the main-rotor
blade and was a rounded oval shape with a TI/I)SCon top.
The lnodels were constructed of aluminum sheet
metal attached to alumimml bulkheads with t!ush
mounting screws. The surfaces were smooth without
the protruding rivet heads characteristic of helicopterfuselages and tail booms. Configurations $3, S4. $7,
and Ss were fabricated from wood and ahlmimmLThe model reference dimensions and directions of
aerodynamic coefficients are shown in figure 2.
The installation of one of the models in the 14-
by 22-Foot Subsonic Tunnel is shown in figure 5. Atechnical description of the 14- by 22-Foot Subsonic
Tunnel is given in reference 8. A schenmtie drawing
of the components of the helicopter fuselage e:oss-
sectional test apparatus is shown in figure 4. The
test apparatus was constructed in three major sec-tions. The upper and lower sections were rigidly
lnounted, whereas the middle section (metric sec! ion)
was attached to a six-component strain-gage babmce.
The apparatus was rotated about the vertical axisto vary the angle of flow incidence 0 on the model.
Large circular plates (48 in. in diameter) we.re pbmed
at both ends of the apparatus to ensure that e\enly

distributedtwo-dinmnsionalflowwouldoccuronthemetricsection.
Test Procedures and Accuracy
Dataweretakenat.a constantq,zc as the me(tel
was rotated through the range of 0 fronl 45 ° to
90 ° . Data were taken every 5 ° from -25 ° to 30 °
and every 10 ° front -45 ° to -25 ° and from 30 °
to 90 °. These angles are equivalent to an angle ofattack on the helicopter fuselage or tail t)oom due to
main-rotor downwash and sideward flight airspeeds.
The value q-_ = 20 psf was selected to include the
approxiniate Reynohts numbers experienced by full-
sca.le helicot)ters (1.0 x lO(i < R < 1.8 x 10⁶). Free-
stream dynamic pressure, as it. relates to Reynoldsnumber, is shown in figure 5 for the baseline inodel
and the nine polygonal models.
During calibration with all beams fiflly loaded,
the strain-gage balance used in the test apparatus foreach of the models had an accuracy for both nornml
force and side force of ± 1.25 lb; however, the general
repeatability of the fi)rce measurements was found tot)e approximately ±0.20 lb. The bahmce had an accu-
racy at q_ = 20 psf of ±0.003 for both normal-force
coefficient and side-force coefficient, with a repeata-bility (tetermined to t)e ±0.001 for the coefficients.
Because the maximum test free-stream Mach
numl)er was 0.11, comi)ressibility effects were negli-
git)k'. Because of the small volume of the ai)paratusrelative to the test-section volume, the (tala did not
require correction for 1)lockage effects (ref. 9).
Based on results in reference 3, several factors
were considered that could have caused uncertainties
in the data, such as model surface roughness, R,
hysteresis effects caused t)y flow set)aration , and flowturbulence level in the test section. For the frst
factor, the model surface was not polished, but unlike
typical helicopter fllselage surfaces it had no rowsof rivet heads. The sheet metal was secured on the
m()(tel frame t)y sunken screws. The screw" holes were
then taped over.
Regarding the secon(t factor, lift and drag forces
measured on the mo(tels are knowm to vary widely
as a flmction of tunnel velocity, particularly ill the
critical /_ range. Full-scale rotorcraft experiencevarying values of R, and for/? = 0.3x 10⁶ to 0.7x 10 6,
large changes are known to occur in lift and dragon bhmt bodies such as these. Because the data
in this investigation were taken at R = 1.0 × 10⁶
to 1.8 x 10 (I (fig. 5), large changes in aerodynamic
forces as a flmction of R were not a concern (refs. 10and 11).
A third factor that can affect aerodymmlic results
as a function of angle of attack or airsl)ee(t is hystere-
sis caused t)y flow separation. This effect call influ-
ence the sequence used when q_c or 0 are w_rie(t to
take data points. To determine the effects of chang-
ing the sequence of O at a given q_c, several rmlswere inade for O = -45° to 90 ° and then hw 0 = 90 °to -45 °. The results indicated that there was rela-
tively little difference in the data. Hysteresis ill the
data can also be experienced during a q_ sweep. If,
for examI)le, one rml is taken with qx: increasing and
the next taken with q.: decreasing, repeatat)ility ()f
the data may 1)e poor. This effect was avoided t)y in-
creasing tmmel q,x: from 0 to 20 psf and then w_rying0 in increments consistently fl'onl -,15 _ to 90 °.
The final factor considered was turl)uhm('e in the
tmmel test section. Because of recent improvements
to the 14- by 22-Foot Subsonic Tunnel. the tm'-
tmlence level was only 0.1 t)ercent ()f free-streamvelocity (ref. 8).
Presentation of Data
The results are presente(t as the section normal-force coeffM(mt c: and the section side-f()rc(, e()ef-
ficient c, as a fmwtion of angle of flow incidence
O. Summary charts for the parameters ()fro andcz at 0 = 0° for eonfigurations Sl to S9 and cal-
culated eiti,cts of these I)arameters on tail-rotor and
main-rotor t)ower are also presented. The coeitici(mts
are based on the (tim(msion b (maximmn width ofmodel), whi(:h is consistent with t)res(mtation of datain reference 3 and references 10 to 15. The baselin(_
tail-boom cross-sectional <tata were obtaine(t fr()mreference 3.
The data are presented as follows:
Figm'e
Aerodynamic characteristics of
configurations S 1 to St) and baseline ..... 6Aerodynamic characteristi(_s of
configurations SI, S:I, $5, $7 (without
TRDSC), and ba,seline ........... 7
Aerodynamic characteristics of
configurations $2, S.I, S[;, Ss, S.q (withTI{DSC), and baseline ........... 8
Aerodynanfic characteristics oft)aseline ..... 9of
baseline .... 10of
t)aseline .... 11of
baseline .... 12
configurations S1, S2, andAerodynamic characteristics
configurations $3, S.4, and
Aerodynamic characteristics
configurations $5, $6, andAerodynanlic characteristics
configurations $7, Ss, and
3
AerodynamiccharacteristicsofconfigurationS9andbaseline....... 13
SlopeCy/¢for configurationsS1to $9andbaseline .............. 14
Tail-rotorpowerfactorcalculatedfromcy
for configurations $1 to $9 and UH-1 15Value of Cz at 05 = 0 ° for configurations S1
to $9 and baseline ............ 16Calculated effect of Cz at 05= 0 ° on main-rotor
thrust (ATtar/Tar) for configurations $1
to $9 and baseline ............ 17
Discussion of Results for General
Aerodynamic Characteristics
The section side-force coefficient cy and sectionnormal-force coefficient Cz as a function of 05 are
presented and discussed. The data from the polygon-shaped sections are compared with data from theUH-60 baseline as well as with data from the other
polygon models. Results from calculations based onthese data are presented to show the effects of Cz and
cy oil main-rotor and tail-rotor power relative to thatof the baseline.
The relationship between 05 and the sideward ve-
locity of a helicopter in combination with down-
wash velocity from the main rotor can be expressedwith simplifying assumptions as tan4) = Sideward
velocity/Average downwash velocity. If a UH-1 sizedhelicopter weighing 8000 lb aim with a rotor 48 ft indiameter is assumed, the rotor disk loading is calcu-
lated to be about 4.4 lt)/ft 2 in hover. A rule-of-thumb
assumption is that, in hover, the average downwash
dynamic pressure is equal to disk loading; therefore,
the average downwash velocity is computed to be
about 60 ft/sec. In left or right sideward flight then,tan ¢ = Sideward velocity/60 ft/sec, and a sideward
velocity of 35 knots yields an angle of flow incidence 05
at the flmelage of 45 °. The sideward-flight-speed en-velope for many helicopters is 0 to 35 knots; there-
fore, if a large percentage of the operational time
spent is assumed to be between 20 knots right and
20 knots left, then the speed range could be repre-
sented by an equivalent range of ¢ of -30 ° to 30 °.
Configurations S1 to 89 Versus Baseline
A summary of Cz and Cy as a function of ¢for configurations $1 to $9 and for the baseline is
presented in figure 6. The results indicate a wide
variation in Cz and cu over the range of 05investigated.The variations were not unexpected, based on the
diversity of blunt shapes under consideration. The
larger the positive value of Cz, the higher the fuselage
down-load penalty that must be compensated for bymain-rotor thrust. Within -15 ° < 4) < 15 ° , Cz
is higher for S 1 to $9 than for the baseline. For
comparison purposes, at 05 = 0° a majority of the
configurations ($1 to $8) result in values of cz thatare from 3.0 to 3.5 times larger than the baseline
values. For $9, Cz at 4) = 0° is about twice as large
as cz at 05= 0° for the baseline.
Results of the data for cy versus 05 (fig. 6(b))indicate a group of three configurations (S1, $2,
and $9) that have slopes (@/¢) which are steeper
than the slope of the baseline data within the linearrange -10 ° < 05< 10 °. Also for these configurations,
the larger positive and negative values of _ are about
2 times as large as the larger baseline values. The re-
maining configurations ($3 to $8) for -10 ° < 05< 10 °
have values of @/05 that vary from about one-thirdto one-eighth of the baseline value. Configuration Sa,which is a flat-bottom diamond with a blunt top, has
a slope of cy/¢ of about one-seventh of the baselinevalue within -10 ° < 05 < 10°. More detailed com-
parisons of configurations S1 to $9 are presented in
figures 7 to 13.
Configurations S1, $3_ 85, and 87 VersusBaseline
Cross-sectional configurations S1, S3, S5, and $7
(polygonal shapes without a representative TRDSC)
are compared with the baseline configuration in
terms of Cz and cy as a function of 05 in figure 7. The
configurations are representative of fuselage cross sec-tions forward of a tail boom because no TRDSC is
included in the shape.
Configurations $1, $3, $5, and $7 all have highervalues of Cz for -15 ° < 05 < 25 ° compared with
the baseline values. This result is not unexpected
because the baseline configuration has a smooth oval
shape compared with the triangular- and diamond-
shaped configurations without a TRDSC contour ontop. Configuration $3 has the highest value of Cz
for -30 ° < 05 < 25 ° , with the Cz values of $1, $5,
and $7 being grouped together at -10 ° < 05 < 10 °but noticeably less (about 25 percent) at 05 = 0°
when compared with $3. It is not obvious by visual
inspection of the shapes of S1, Sa, $5, and $7 why
the values of Cz fall in this order.
At the more extreme values of 0 investigated
(-45 ° < 05 < -20 ° and 25 ° < 05< 90°), values of Czfor the baseline configuration are within the range of
the values of Cz for all the polygon-shaped configura-
tions. Because the magnitude of fuselage down load
is important in hover and low-speed flight (fuselagedown-load loss varies between about 3 and 8 per-
cent of total main-rotor thrust, depending on the
particular helicopter design), the magnitude of Cz

which depends on fuselage size and shape -must begiven serious consideration by the designer. If a large
percent of the low-speed operational time is assumed
to be in the range of -30 ° < ¢ < 30 ° (between
about 20 knots right and 20 knots left), the down-
load penalty on a helicopter that uses $1, $3, $5, andS7 in the tail boom and fuselage would be expected to
be appreciably higher compared with the penalty on
one that uses fuselage sections shaped like the base-
line confguration. In fact, if just the tail-boom por-
tion of the fuselage is considered, and if it is assumed
that the tail boom is responsible for one-fourth ofthe down-load penalty of a given helicopter fuselage
that has a total fuselage down load of 4 percent of
main-rotor thrust, then a tripling of the value of thebaseline Cz at ¢ = 0° would result in a revised total
fuselage down load of 6 percent, or a loss in overallvehicle lift capability of about 2 percent. Likewise,
if the ez were doubled compared with that of the
baseline configuration, the loss in lift would be anadditional 1 percent, for a total of 5 percent.
The linear portions of the curves of cy versus ¢in figure 7(b) are contained for the most part at
-10 ° < ¢ < 10 ° and reflect attached flow (i.e., small
degree of flow separation) on the models. The dataat ¢ > 10 ° and ¢ < -10 ° represent conditions of
massive flow separation (i.e., stall). At -10 ° < ¢
< 10°, the steeper the slope of cy/¢, the higher thepotential side-force sensitivity for a given helicopterfuselage that incorporates these shapes in its design.
Because these nine shapes are generally applicable
to fuselage sections (both tail boom and sections
forward of the tail boom), the effect of the steepness
of cy/O on the net fllselage yawing moment would bean integrated effect along the entire fuselage length.
Also, high fuselage side forces would result from large
positive and negative values of Cy, and correcting forthese forces requires some angle of bank to trim the
vehicle when hovering over a spot on the ground ina crosswind.
The baseline configuration has a large value of
Cy/¢ when compared with those of other typical he-licopter tail-boom cross-sectional configurations such
as the UH-1 and the AH-64 (table I). Interestingly,
$1 (narrow truncated triangle shape) has a slope thatis approximately 30 percent steeper than that of the
baseline configuration for -10 ° < ¢ < 10 °, and the
maximum positive and negative values for S1 of Cyat ¢ = -20 ° and ¢ = 15 °, respectively, are about
2 times as large as the largest values of cy for the
baseline configuration. Also, cy remains high for15 ° < ¢ < 90 ° and -45 ° < 4) < -20 ° for $1. The
values of Cy/¢ at -10 ° < ¢ < 10° for configurations$3, $5, and $7 are about 13 percent, 38 percent, and
24 percent of the baseline cy/O, respectively'. Thevalue of the shallow slope of cy/¢ that is characteris-
tic of the $3 configuration (flat-bottom diamond with
a blunt top) is similar to the value obtained on a two-dimensional circular cylinder reported in reference 3
(table I).
Configurations $2, $4, $6, $8, and $9Versus Baseline
Results from the polygon-shaped fllselage config-
urations equipped with representative TRDSC's ($2,
$4, $6, $8, and $9) are shown with those from the
baseline configuration in figure 8. These configura-tions are geometrically similar to those considered in
figure 7 except for the addition of tile $9 configura-
tion (narrow rectangular shape with representative
TRDSC). The variations of cz and c_ with ¢ (fig. 8)are similar to the results shown in figure 7 and dis-
cussed in tile previous section, with the addition of
TRDSC's having a small effect on the overall results.
The $9 configuration produces ez and c_j results thatare expected based on results from $2, which has asomewhat siinilar shape.
Figure 8(a) shows that the maximum cz value at¢ = 0° results from $4. Also, the maximum value of
c2 for $4 is approximately the same as that for $3 in
figure 7(a). Within -10 ° < 0 < 10 °, the value of cz
for the remaining configurations with TRDSC's fallabove the baseline wdues.
The results shown in figure 8(b) are similar to
those in figure 7(b), except, that the addition of $9 to
the group results in values of cy/O and maxinmm pos-
itive and negative values of cy on the order of thosefor $1 and $2. The comments given in tile previous
section regarding the results shown in figure 7(b) alsogenerally apply to the results in figure 8(b).
Configurations With and Without aTRDSC
In this section of the paper, the effects on cz
and @ of similarly shaped configurations with andwithout a TRDSC ($1 and $2, $3 and $4, $5 and
$6, and $7 and $8) are discussed and compared
with the effects of the baseline configuration. The
results are presented in figures 9 to 12. The resultsfor configuration $9 alone are compared with the
baseline in figure 13. Key values (Cz at 4) = 0 ° and
cy/¢ at -10 ° < 0 < 10 °) taken from the data forconfigurations S1 to $9 are presented in table II. Thesame values for large-scale UH-60, UH-1, and AH-64
models taken from reference 3 are given in table I
to provide additional comparisons. Data for thesemodels were obtained in the same range of Reynolds
numbersasthat for $1to $9.Thetail-boomsections(UH-1, UH-60,and AH-64)weremodeledfrom aboomstationundertile 80-percentmain-rotor-bladeradialstation.
$1 versus $2 versus baseline. The results
for the narrow triangular configurations, one with a
truncated top (S1) and the second with a rounded
top that modeled a TRDSC ($2), are presented withthe baseline results in figure 9. The results show a
much larger cz for S1 and $2 compared with that
of the baseline for -15 ° < ¢ < 10° (fig. 9(a)). At
¢ = 0°, cz for S1 and $2 is about 3 times largerthan the baseline oz. Also, at 25 ° < ¢ < 90 ° , the
values of cz for S1 and $2 are lower than those for
the baseline. The TRDSC on $2 appears to have
little effect in reducing Cz compared with S1. The
$1 and $2 shapes with higher values of cz will yieldlarger down-load losses than will the baseline when
incorporated into a helicopter fuselage.
Measurements in the linear portion of the curves
in figure 9(b) (-10 ° < O < 10°) indicate that $1and $2 have about 30 percent and 40 percent steeper
slopes, respectively, than the baseline. Tim steepness
of the slopes within this range of 0 and the generally
high values of cy throughout the rest of the 0 rangeindicate that, if these shapes were incorporated into
a helicopter fuselage design, higher side-force and
yawing-moment characteristics would likely result for
S1 and $2 compared with the baseline. The effectof the TRDSC on $2 compared with $1 results in a
steeper slope in the linear range and larger positive
and negative values of (:_j for 0 beyond the linearrange (15 ° < q) < -20°).
$3 versus 5;4 versus baseline. Results for the
$3, $4, and baseline configurations are presented in
figure 10. The values of c_- at -20 ° < 0 < 20 °for $3 and $4 are much larger than the values for
the baseline, and at 0 = 0 °, tile vahles for Sa
aim $4 are about 3.5 times larger than the baseline
value (fig. 10(a)). In figure 10(b), slopes of c_/¢
within -10 ° < 0 < 10 ° for $3 and $4 are low
compared with cu/¢ of the baseline. The slope of
cv/¢ for Sa is the lowest of the nine polygon-shapedconfigurations investigated and, in fact, is nearly
as low as cJO for a circular cylinder reported inreference 3. (See tables I and II.) Within the same
range of 0 ( -10° < ¢5 < 10°), $4 has a value
of cy/O about the same as that obtained on thetwo-dimensional AH-64 tail-boom model (cylindrical
shape with a TRDSC) investigated in reference 3.
(See tables I and II.) The TRDSC (pointed top)
results in a steeper slope of @/¢ for $4 than for $3 inthe linear part of the curves. It has a negligible effect
on Cz at ¢ = 0° and reduces cz at -35 ° < O < -10°and 15 °<¢<35 ° .
Outside the linear range of data points for
-10 ° > ¢ > 10 °, the absolute values of Cy for $3 and$4 are generally lower than those for the baseline. If
incorporated into a helicopter fuselage design, $3 and
$4 would likely result in low fuselage side-force and
yawing-moment characteristics compared with thoseof the UH-60 baseline model.
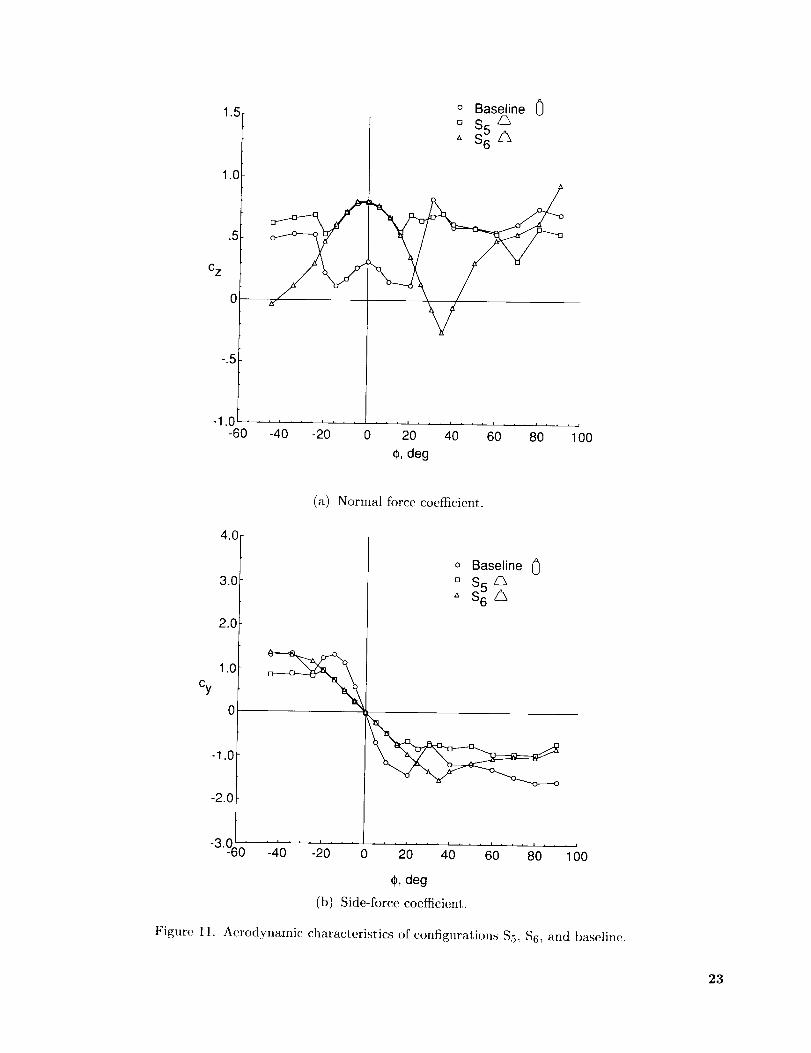
$5 versus $6 versus baseline. The results forthe $5, $6, and baseline configurations are shown
in figure 11. The figure shows results similar to
those of the other configurations investigated, with
values of cz for $5 and $6 at -15 ° < 0 < 15°
being much greater than those for the baseline. For-15 ° < ¢ < 15° , the vahms of Cz for $5 and S(} arc
virtually identical. At 4) = 0 °, cz is about 2.7 times
larger than the baseline vahle (0.8 versus 0.3). The
TRDSC on $6 appears to be effective in reducingcz compared with those of $5 and the baseline for-45 ° <0<-25 ° and 25 ° <0<55 °.
Compared with the baseline configuration
(fig. ll(b)), configurations $5 and $6 have a lower
cy/¢ for -10 ° < 0 < 10°. (See table II for values.)
The magnitudes of c_j for configurations $5 and S(i arevirtually identical for -20 ° < O < 15°, which indi-
cates that the TRDSC on configuration $6 has littleor no aerodynamic effect in this range of 0. Con>
pared with the baseline values, the vahles of cy/O for$5 and $6 in the linear range of ¢ are low (about 2.7
times lower than the baseline). Based on compari-
son with data in tables I and II, if these configura-
tions were used in a helicopter fuselage design, the
fuselage side-force and yawing-moment characteris-tics would be expected to be low" compared with those
of the tail-boom cross-sectional configurations on the
UH-60 and UH-1 helicopters. The values of cy/O for$5 and $6 are, however, larger in magnitude than the
values of cy/O for the AH-64.
S 7 versus Ss versus baseline. The results for
the $7, $8, and baseline configurations are present ed
in figure 12. Both $7 and $8 have a much larger Czwithin -20 ° < ¢ < 20 ° than that of the baseline. At
c) = 0 °, Cz for $7 and $8 are 2.5 to 3 times that
of the baseline. (See table II.) The effect of the
TRDSC on the results of $8 at -45 ° < 4_ < -25 °and 25 ° < O < 60 ° is of interest because cz for Ss is
much lower than it is for $7 and for the baseline. For
70 ° < ¢ < 90 °, S 7 (without a TRDSC) has the lowest
cz and the baseline has the largest value. Because
much of the operational time for a helicopter is at
-30 ° < ¢5 < 30 ° (equal to sideward flight speodsof about 0 to 20 knots), where Cz for configurati,ms

$7 and Ss is 2.5to 3 timesthat of the baselineconfiguration,the down-loadpenaltyfor $7and Ssfuselagedesignswill bemuchgreaterthanthatof thebaseline.
In the rangeof 0 wherethe dataare linearinfigure12(b)(-10° < ¢ < 10°),configurations$7and$8haveidenticalslopes(seevaluesin tableII), andthisequalityindicatesthat theTRDSChasnoeffectoil cy in this range of ¢. Tile side-force and yawing-nloment characteristics of $7 and Ss when included
in a fuselage design will likely be low compared with
those generated by tile baseline and are on the sameorder as those of a circular tail boom with a TRDSC
(AH-64). (See tables I and II.)
S 9 versus baseline. The results for configura-
tion $9 (narrow rectangular shape with a TRDSC)and the baseline results are given in fgure 13. The
cz (fig. 13(a)) is higher for $9 at -10 ° < ¢ < 10 °and is about 2 times larger than that of the baseline
at 0 = 0°. For 45 ° < 0 < 90 ° , Cz for $9 is aboutone-third the baseline value.
The value of cy/O for 8 9 (fig. 13(b)) is about60 percent greater than for the baseline at -10 ° <
0 < 10°- In fact, of the nine configurations inves-
tigated, $9 results in tile steepest slope. It should
also be noted that tile largest positive and nega-
tive values of cy for $9 are about twice as large
as tile corresponding values of c_j for the baseline
configuration, and tile margin continues throughout
-15 ° > 0 > 15 °. $9 would be expected to have highside-force and yawing-moment characteristics com-
pared with those of tile baseline when incorporatedin a helicopter fuselage design.
Effect of Side-Force Characteristics (Cy/Oand maximum c_j) on Tail-Rotor Power
Figure 14 presents a bar chart of Cy/O for-10 ° < 0 < l0 ° for configurations S1 to $9and the baseline. The effects of the maximum
value of Cy on tail-rotor power were then calcu-lated for configurations S1 to $9 based on a UH-1
class (Bell 204B) helicopter and are presented with
flight, data from tile 204B (ref. 6) in figure 15. Tile
204B helicopter was used as a baseline configura-tion in this case because of the type of flight dataavailable.
The data represented in the summary bar chart
(fig. 14) are taken fl'om the linear portion of the
slopes between -10 ° < O < 10°. Configurations $1,$2, and $9 have slopes that are greater than that
of the baseline and therefore, in erosswinds could
be expected to yield higher side-force characteristics
than the baseline configuration when used in a he-
licopter fuselage. Also, higher values of c_j/O con-tribute to higher fuselage yawing moments, which ill
right crosswinds (positive 0) would increase the tail-rotor power required. In right crosswinds, the tail
rotor normally thrusts to tile right; therefore, a pos-itive value of c_j will then assist ill yaw control.
Calculations based on a right crosswind condition
of an airspeed of 20 knots and wind coming from
60 ° to the right of tile nose of a UH-1 class (Bell204B) helicopter indicate that the tail-rotor power
required to overcome the boom force when configu-rations S1 to $9 are used in the tail boom wouht vary
from about 0.3 to 2.3 times the power required of thebaseline Bell 204B (fig. 15). Data are available fl'om
both flight investigation (rcf. 6) and wind-tunnel in-
vestigation (ref. 3) to use in the calculations. The
calculations are based on the following rationale. If
the maximum value of Cy for configuration S!_ (-3.0
at 0 = 15°, fig. 13(b)) is compared with the corre-
sponding value for the UH-1 tail-boom model (-1.3with TRDSC, ref. 3), an estimate of the tail-rotorpower needed to overcome the boom force can be
made. The size and shape of the UH-1 and 204B tail
booms are identical. Tile nlaximum measured c._j forthe UH-1 model is assmned to represent the maxi-
mum boom contribution to tail-rotor power required(20 hp for full-scale helicopter for these conditions,
ref. 6). \Vhen the maximum (::_/for configuration S!j
is divided by the maximum value of cy for the UH-1,the result is 3.0/1.3 = 2.3; therefore, the nlaxinnlm
tail-boom contribution to tail-rotor power required
for configuration $9 is approximately 2.3 x 20 hp= 46 hp if configuration $9 is installed as tile boom
shape on a UH-1 class helicopter. In terms of overall
power, if the helicopter is assumed to require 600 hpto hover in a 20-knot wind, the change in tail-rotor
power of 26 hp (46 hp - 20 hp = 26 hp) for tile heli-copter with an Sg-configured boom compared with
the baseline represents an increase of 4.3 percent.It. must be remembered for these calculations that
two-dimensional data are being applied with three-
dinlensional data so the results shown in figure 15indicate trends only.
Effect of Down-Load Characteristics (cz at0 -- 0 °) on Main-Rotor Power
A summary bar chart that presents the section
nornlal-foree (down-load) coefficients cz at 0 = 0 °for configurations S1 to $9 with those for the baseline
configuration is given in figure 16. The down loads
of all the polygon-shaped configurations are much
higher than that of the oval-shaped baseline modelbecause of the flat surfaces normal to the flow and
7
the increasedsurfacearea.With the sameassump-tionsasgivenpreviously,the effectson main-rotorthrustof tail-boomdownloadinhoverarecomputedand the resultsare presentedin figure 17. If thepolygon-shapedmodelsaresubstitutedforthebase-lineUH-60tail boom,thecalculatedincreaseinhoverdownloadonthe boomwouMrequireanadditionalmain-rotorthrustof approximately1to 2.5percent.Again,the assumptionsincludedin the calculationsmaketheaccuracyofthederivedvaluesquestionable;however,thetrendsarebelievedto beapplicable.
Concluding Remarks
An investigationwasconductedin the Langley14-by 22-FootSubsonicTUnnelto determinetheaerodynamiccharacteristics of nine large-scale two-dimensional polygon-shaped fuselage models that
were nominally triangular (configurations $1, $2,
$5, and $6) , diamond (configurations $3, $4, $7,
and $8), and rectangular (configuration $9) in shape.
Section side-force coefficients Cy and normal-forcecoefficients Cz were obtained on each model at anglesof incidence ¢ from -45 ° to 90 ° and compared withresults from a UH-60 tail-boom cross-sectional model
that served ,as the baseline configuration. Two-dimensional data from AH-64 and UH-1 tail-boom
models were also used for comparison. Calculations
were performed to obtain an approximation of ef-fects of side-load and down-load characteristics of
tile polygon-shaped models on main- and tail-rotorthrust and power compared with those of a baseline.
Based on analyses of results fi'om this investigation,
the following observations can be made:
1. The general trends of Ca and CV as a flmctionof _ for the nine polygon-shaped models were simi-lar to tile characteristic trend of the UH-60 baseline
model data; however, there were important differ-
ences in magnitude.
2. Within -15 ° < _ < 15 ° , values of Cz for $1
to $9 were larger than that for the UH-60 baseline
model. At 4_ = 0 °, values of Cz for $3 and $4 were the
largest of the nine configurations at about 3.5 timesthe baseline wMue. Configuration $9 had the lowestvahm at about 2 times the baseline value.
3. The calculated increase in fuselage down load
for the nine polygon-shaped configurations varied
from 1.0 to 2.5 percent of main-rotor thrust comparedwith the UH-60 baseline.
4. Configurations S1, $2, and $9 yielded greater
slopes of cv/O at -10 ° < ¢ < 10 ° than the UH-60baseline. Steeper slopes of Cy/4) and higher posi-
tive and negative values of cy result in fuselage de-
8
signs that are likely to produce higher side-force and
yawing-moment characteristics than the baseline.
5. Configurations Sa to $8 had lower slopes of
cy/¢ compared with the baseline within -10 ° <
¢ < 10 °. The values were closer to the value of a
circular cylinder with a tail-rotor drive-shaft cover.
Compared with the baseline, configurations $3 to $8
will result in moderate to low side-force and yawing-moment characteristics when incorporated into a he-
licopter fuselage design.
6. Calculations based on the maximum value of
cy for S1 to $9 indicate that the tail-rotor powerrequired to overcome the tail-boom side force variedfrom about 0.3 to 2.3 times the baseline (Bell 204B
helicopter) value.
NASA Langley Research CenterHampton, VA 23681June 25, 1992
References
1. Blake, Bruce; Hodder, David St. J.; and Hanker,Edward J., Jr.: Wind Tunnel Investigation Into the Direc-tional Control Characteristics of an OH-58A Helicopter.USAAVRADCOM TR-83-D-18, U.S. Army, June 1984.(Available from DTIC as AD B084 796L.)
Brocklehurst, Alan: A Significant Improvement to theLow Speed Yaw Control of the Sea King Using a TailBoom Strake. Eleventh European Rotorcraft Forum, CityUniv. (London, England), 1985, pp. 32-1-32-11.
Wilson, John C.; and Kelley, Henry L.: AerodynamicCharacteristics of Several Current Helicopter Tail BoomCross Sections Including the Effect of Spoilers. NASATP-2506, AVSCOM TR 85-B-3, 1986.
Lockwood, Roy A.; Kelly, William A.; and Cason,Randall W.: Flight Characteristics Test of the UH-60AWith Tail Boom Mounted Strake. USAAEFA Proj.No. 85-07, U.S. Army, Oct. 1986.
Wilson, John C.; Kelley, Henry L,; Donahue, Cynthia C.;and Yenni, Kenneth R.: Developments in Helicopter TailBoon, Strake Applications in the United States. NASATM-101496, AVSCOM TM-88-B-014, 1988.
Kelley, Henry L.; Crowell, Cynthia A.; Yenni, Kenneth R.;and Lance, Michael B.: Flight Investigation of the Effectof Tail Boom Strakes on Helicopter Directional Control.AttS 46th Annual Forum and Technolo9y Display, Amer-ican tlelicopter Soc., 1990, pp. 1161-1174.
Crowell, Cynthia A.; and Kelley, Henry L.: AerodynamicEffect of Strakes on Two-Dimensional Tail Boom Modelsof OH-58A and OH-58D Helicopters. NASA TM-4248,AVSCOM TR-90-B-010, 1990.
Gentry, Garl L., Jr.; Quinto, P. Frank; Gatiin,Gregory M.; and Applin, Zachary T.: The Langley 14-
2.
3,
5.
6,
7.
8.

by 22-Foot Subsonic Tunnel: Description, Flow Charac-
teristics, and Guide for Users. NASA TP-3008, 1990.
9. Rae, William H., Jr.; and Pope, Alan: Low-Speed Wind
Tunnel Testing, Second ed. John Wiley & Sons, Inc.,c.1984.
10. Polhamus, Edward C.: Effect of Flow Incidence and
Reynolds Number on Low-Speed Aerodynamic Character-
istics of Several Noneircular Cylinders With Applications
to Directional Stability and Spinning. NASA TR R-29,
1959. (Supersedes NACA TN 4176.)
11. Polhanms, Edward C.; Geller, Edward W.; and Grunwald,
Kalman J.: Pressure and Force Characteristics of Non-
circular Cylinders as Affected by Reynolds Number With
a Method Included for Determining the Potential Flow
About Arbitrary, Shapes. NASA TR R-46, 1959.
12. Lockwood, Vernard E.; and McKinney, Linwood W.:
Effect of Reynolds Number on the Force a_d Pros,sure
Distribution Characteristics of a Two-Dimensiotml Lifting
Circular Cylinder. NASA TN I)-455, 1960.
t3. Taylor, P.: A Method of Predicting Fuselage Loads
in Hover. Seventh European Rotowraft and Powered
Lift Aircraft Forurrt, Deutsche Gesellschaft fur Luft- und
Raumfahrt e.v., Sept. 1981, Paper No. 49.
14. Achenbach, E.; and Heinecke, E.: On Vortex Shedding
From Smooth and Rough Cylinders in the Range of
Reynolds Numbers 6 x l03 to 5 x 10⁶ . ,]. Fluid Mech.,
vol. 109, Aug. 1981, pp. 239 251.
15. Fage, A.; and Warsap, J. H.: The Effects of TurbuleTIcc
and Surface Roughness on tit(! Drag of a Circular Cylin-
der. R. & M. No. 1283, British Aer(mautical l/esearch
Council, 193(}.
9

Table I. Key Values of cz and Cy for Tail-Boom Cross-Sectional Models of
Baseline (UH-60), UH-1, and AH-64 Helicopters
[From ref. 3]
Average cv/O at-10 ° < ¢ < 10 °,
Configuration cz at ¢ = 0 ° per degree
Baseline with TRDSC 0.30 -0.130
UH-1 with TRDSC 0.37 -0.110
AH-64 with TRDSC 0.61 -0.032
AH-64 without TRDSC (circular cylinder) .65 -.010
Table II. Key Values of ca and c v for Configurations S1 to S 9 and Baseline
Configuration
S1
$2 (1
$3$4 a
$5
$6 a
Cz at, 0 = 0°
0.91.97
1.08
1.08
0.79
.80
Average Cy/¢ at-10 ° < ¢ < 10 °,
per degree
$7 0.87 -0.031
$8 a [ .80 -.031
$9 a I 0.62 -0.207
Baseline (UH-60)a l .30 -. 130
aConfiguration with TRDSC.
10

r = 0.75
105 °
21
f-r= 1.0
14
(a) Sl.
r= 1.0
14
(b) $2.
25.5
-- m
r= 1.0
75 °
21 22.75
r=2.0
130 °
1O0 °
r= 1.0
14 ---
24
130 °
14
24
100 °
(c) s3. (d) S4.
Figure 1. Models of polygon-shaped fuselage cross sections. All linear dimensions are in inches.
11

14---- 8.4 ---_1
= 10.2
14.4
°°_[
(e) S_.
8.4
r=2"0_I_TRDSC
8
!= 10.2 =
(f) s6.
14.3
_"- r = 4.0
"_r = 4.0
I-_ 14.3- 29.5
1120°
(g) st.
Figure 1. Continued.
130°
t 24.75
)
110°
(h) $8.
12

r = 1.25 TRDSC
i
r: 1o---_ L_95 °
= 1.25 85 °,,_
_-_ 10.2
24.75
20.4
25
21.0
(i) s9. (j) Ba.seline (UH-60 tail-boom model).
Figure 1. Concluded.
13

c_

ORIGINAL PAGE
BLACK AND WHITE PHOTOGRAPm
L-89-ti135
Figure 3. Two-dimensional test apparat, us in Langley 14- by 22-Foot Subsonic ]Sumel.
15

End plates
(48-in. diam)r-
Strain-gagebalance location
Metricsection
]--
4O
2O
106
Airflow
33
4
_-- Tunnel _-floor
Figure 4. Helicopter cross-sectional test apparatus. All linear dimensions are in inches.
16

25
qoo, psf
20
15
10
I I I I I I I I0 .2 .4 .6 .8 1.0 1.2 1.4 1.6 1.8
R
I2.0 x 10 t_
Figure 5. Variation of model Reynolds number with tunnel free-stream dynamic pressure.
17

18
1.5
1.0
Cz .5
0
°.5 , , A ,
-60 -30 0
1.5
1.0
cz .5
O_
-60 -30
Cz .5
-.5-6(
• , I , I
-30 0
3
2
1
Cy 0
-1
-2
-3-6{ -30 0
¢,3 deg
2
1
Cy 0
-1
-2
o BaselineO
°Sl/_
: s2Ao s3 0
, , I , , I , p
30 60 90
dego Baseline 0
o S4C>
o Baseline 0
o S70o $84_
" $9 [_
o BaselineO
oS 1° S2_
, S30
, I , i I , I
(a) Normal-force coefficient.
30 60 90
o BaselineO
o S4<_
o S5z_,s6z_
0¢,
deg
I , i I , , j
30 60 90
o Baseline
o S70o $8<_
"S 9
30 60 90
deg
(b) Side-force coefficient.
Figure 6. Aerodynamic characteristics of configurations S1 to $9 and baseline.

1.5
1.0
.5
C Z
0
-.5
-1.0 ...........
o Baseline 0
• S5z_
• 87( _
¢, deg
(a) Normal-force coefficient.
4.0
3.0[
2.0
1.0
Cy
0
-1.0
-2.0
-3.0 ...........
o Baseline 0
°Sl_S3< _
• S5Z_
• 87( _
O, deg
(b) Side-force coefficient.
Figure 7. Aerodynamic characteristics of configurations Sl, S3, 85, S 7 (without TRDSC), and baseline.
19

.5
Cz
0
-.5
-1.0 ...........-60 -40 -20
o Baseline 0[] $2/_
S46• S6Z_• S8_
0 20 ,;0 '6'0 80 100¢, deg
(a) Normal-force coefficient.
4.0
3"0I
2.0
1.0
Cy
0
-1.0
-2.0
-a_O;ot4o &
o Baseline 0
os 4A• S6Z_• $8(_)
• $9_ ]
• i
0 20 40 60 80 1O0
¢, deg
(b) Side-force coefficient•
Figure 8. Aerodynamic characteristics of configurations S2, S4, S6, Ss, S9 (with TRDSC), and baseline.
2O

o Baseline 0
1.5 [] Sl
S2_
1.0
-.S
-1% -,;o -2o o 2o 4o 6o 8o ioo
.5
C z
0
9, deg
(a) Normal-force coefficient.
Cy
4-0I3.0
2.0
1.0
-1.0
I
-2" li . .
-3.u 60 " '40" '-20"
o Baseline 0
• . . i • . • i . . . , • . . , • • . J
0 20 40 60 80 1O0
9, deg
(b) Side-force coefficient.
Figure 9. Aerodynamic characteristics of configurations S1, $2, and baseline.
21

1.5
1.0
.5
oZ
0
-.5
-1.0 ...........-60 -40 -20
o Baseline 0
[] S30
S4O
• . . 1 , , . i , • . i . . , i , , . i
20 40 60 80 100
Q, deg
(a) Normal-force coeffici(mt.
4.0
3.0
2.0
1.0
Cy
0
-1.0
-2.0
-3.0 ...........-60 -40 -20
o Baseline 0
" 0
• . . , , . . , . . , . , . , J , . . 1
0 20 40 60 80 1O0
e, deg
(b) Side-force coefficient.
Figure i0. Aerodynamic characteristics of configurations $3, $4, and baseline.
22
.5
c Z
0
-.5
-1.0-6{
,,,i,,,i,,,
-40 -20 0
o Baseline 0
o
' ' ' ' • • , i , , , i , , , i , , , j
20 40 60 80 1O0
e, deg
2.(
(a) Normal-force coefficient.
o Baseline 0
[] S5Z_$6_
1.(
Cy
0
-1.0
-40 -20 0 20 40 60 80 1O0
e, deg
(b) Side-force coefficient.
Figure 11. Aerodynamic characteristics of configurations $5, $6, and baseline.
23

.5
cZ
0
-.5
-1.0 ...........-6O -40 -20 0
o Baseline 0
o $7< _A $8 _
• . , , . . . , . . . , . . . , . . . ,
20 40 60 80 1O0
¢, deg
(a) Normal-force coefficient.
4.0
3.0
2.0
1.0
Cy
0
-1.0
-2.0
-3o60 L, o 2o o
o Baseline 0
o S7(_A S8(_
• . . * . . . , . . . , . . . , . . . ,
20 40 60 80 1O0
¢, deg
(b) Side-force coefficient.
Figure 12. Aerodynamic characteristics of configurations $7, $8, and baseline.
24

1.5
1.0
.5
cZ
0
-.5
-1.0-60
o Baseline 0
[] S9_
-40 -20 0 20 40 60 80 100
_, deg
(a) Normal-force coefficient.
o Baseline 0
[] S9/_
Cy
lo
0
-3.(30 -40 -20 0 20 40 60 80 100
0, deg
(b) Side-force coefficient.
Figure 13. Aerodynamic characteristics of configurations $9 and baseline.
25

-.22 -
Cy/,,per deg
-.20
-.18
-.16
-.14
-.12
-.10
-.08
-.06
-.04
-.02
,i
.
- I
S 1
Ii:!i_ii_iii!i_iiiii
iiiii_iiiiiii_!:!i
$2 S5 S6 S 7
Model configurations
I_i_iiiiiii!ili
ii_iiiii_iiii
BL
Figure 14. Slope c:_j/O in linear range of data, (-10 ° < 0 < 10°) for configurations S1 to $9 and baselinemodel (UIt-60).
PFtr
2.5 r
I
2.0 _-
1.5!
1.0
I
.5-
i0,
!_i!ili!iiiiiii!i
............ i
$1
BL-_
I_= 60°
w
indspeed = 20 knots
..........,.........i i! !ii iiiiiiii!ii !
S 2 S 9 BL
Figure 15. Tail-rotor power factor calculated from data for maximum cp for configurations S1 to $9 and baselinehelicopter (Bell 204B).
26

Cz
1,1 --
n
$2
i!_ i!iji_ !:!
i iI i
Increasingdown loadon fuselage
m
....... 1
$5 $6
m
=
m m
$7
m
$3 $4 S9
m ._ w
$8
Model configurations
BLwith
-TRDSC
BL
Figure 16. Value of cz at ¢ = {)° for configurations S1 to $9 and basulin(, model (UH-60).
3.0_
ATmrTmr
2.0 t-
--,l:ero nt)
1.0 I
01
S1
i _ _i_i !_ _ "_ i
),
$2 $3 S4 S5 S6
Model configurations$7 $8 $9
Figure 17. Effect of c- at _ = 0° oll ATmr/Tmr in hover for c(mfigurations S1 to S!) relative to bas(qin¢, model(UH-60).
27


Form Approved
REPORT DOCUMENTATION PAGE OMB No 0704-0188
Public reporting burden for this collection of information is estimated to average i hour per response, including the time for reviewing instructions, searching existing data sources,gathering and maintaining the data needed, and completing and reviewing the collection of information Send comments regarding this burden estimate or any other aspect of this
' collection of information, including suggestions for reducing this burden, to Washington Headquarters Services, Directorate for Information Operations and Reports, 1215 JeffersonDavis Highway, Suite 1204, Arlington VA 22202-4302, and to the Office of Management and Budget, Paperwork Reduction ProJect (0704-0188), Washington, DC 20503
1. AGENCY USE ONLY(Leave blank) 2. REPORT DATE !3. REPORT TYPE AND DATES COVERED
August 1992 Technical Paper
4. TITLE AND SUBTITLE
Two-Dimensional Aerodynamic Characteristics of Several Polygon-
Shaped Cross-Sectional Models Applicable to Helicopter Fuselages
6. AUTHOR(S)
Henry L. Kelley, Cynthia A. Crowell, and John C. Wilson
7. PERFORMING ORGANIZATION NAME(S) AND ADDRESS(ES)
Aeroflightdynmnics Directorate
,]RPO Langley
Langley Research Center
Hampton, VA 23681
9. SPONSORING/MONITORING AGENCY NAME(S) AND ADDRESS(ES)
National Aeronautics and Space Administration
\Vashington, DC 20546-0001and
U.S. Army Aviation Systems Command
St. Louis, MO 63120-1798
5. FUNDING NUMBERS
WU 505-59-36-01
PR1L236003D313
8. PERFORMING ORGANIZATION
REPORT NUMBER
L-16951
10. SPONSORING/MONITORING
AGENCY REPORT NUMBER
NASA TP-'3233
AVSCOM TR-92-B-002
11. SUPPLEMENTARY NOTES
Kelley and \Vilson: Aeroflight(tynamics Directorate, JRPO
U.S. Army Europe, Bad Schwalbach Germany.
12a. DISTRIBUTION/AVAILABILITY STATEMENT
Unclassified Unlimited
Subject Category 02
Langley, Hampton, VA; Crowell: Now at
12b. DISTRIBUTION CODE
13. ABSTRACT (Maximum 200 words)
A wind-tunnel investigation wa_s conducted to det(,rmine two-dimensional aerodynamic characteristics of nin('
polygon-shaped models applicable to helicopter fuselages. The models varied from I/2 to 1_!_,scale and were
nominally triangular, diamond, and rectangular in shape. Side force and normal force were obtained atincrements of angle of flow incidence from -45 ° to 90 °. The data were compared with results from a baselineUH-60 tail-boom cross-sectional model. The results indicate that the overall shapes of the plots of normal
force and side force were siinilar to the characteristic shape of the baseline data; however, there were important
differences in magnitude. At a flow incidence of 0 °, larger values of normal force for the polygon models indicatean increase in fuselage down load of 1 to 2.5 percent of main-rotor thrust compared with the baseline value.
Also, potential was indicated among some of the configurations to produce high fuselage side forces and yawing
moments compared with the baseline nlodel.
14, SUBJECT TERMS
Helicopter; 151selage; Tail boom; Blunt bodies; Aerodynamics
17. SECURITY CLASSIFICATION 18. SECURITY CLASSIFICATION 19. SECURITY CLASSIFICATIO_
OF REPORT OF THIS PAGE OF ABSTRACT
Unclassified Unclassified
4SN 7540-01-280-5500
15. NUMBER OF PAGES
28
16. PRICE CODE
A03
20, LIMITATION
OF ABSTRACT
itandard Form 298(Rev. 2-89)Prescribed by ANSI Std Z39 18298402
NASA-Langley, 1992