Tech vs. Touch: How digital connectivity impacts marketing and creative teams

UA Tech Park Economic Impacts, CY 2017 1
UA TECH PARKThe Economic Impact Report
for the
TECH PARKS ARIZONA


ECONOMIC IMPACTS OF THE UA TECH PARK
CALENDAR YEAR 2017
Prepared by
VP Research & Consulting, LLC
Tucson, AZ
June 1, 2018


Table of Contents
Introduction ........................................................................................................................................ 1
Impacting Pima County: Direct jobs, wages, and output .......................................................... 1
Indirect and induced impacts ......................................................................................................... 2
Total impact on Pima County’s economy ...................................................................................... 2
Multipliers ........................................................................................................................................... 3
Impacts on Arizona’s economy ....................................................................................................... 3
Contributions to state and local tax revenues ............................................................................ 4
Place of residence of UA Tech Park employees .......................................................................... 4
Data and Methodology ..................................................................................................................... 5
List of Charts
Economic Impacts of UA Tech Park in Pima County, 1997-2017 (Dollars in millions) ........... 6
Economic Impact 2017 Compared to Previous Studies (% Change) ........................................ 7
Number of Tenants, 1997-2017, by Survey Year ........................................................................... 8
Total Annual Job Impacts, 1997-2017 ............................................................................................. 8
Total Annual Wage (Labor Income) Impacts, 1997-2017 ............................................................ 9
Total Annual Dollar (Output) Impacts, 1997-2017 ....................................................................... 9
Total Annual Tax Revenue Impacts, 1997-2017 ........................................................................... 10
UA Tech Park: Comparison with Pima County ............................................................................ 10
Annual Tenant Survey ...................................................................................................................... 11
References ........................................................................................................................................ 12
About the Author .............................................................................................................................. 13


UA Tech Park Economic Impacts, CY 2017 1
ECONOMIC IMPACTS OF THE UA TECH PARK, CALENDAR YEAR 2017
Introduction
Economic impacts of an organization, industry, or a cluster of economic activities such as a university research park are commonly measured in terms of jobs, wages, and total output that these economic entities generate in local and regional economies.
Direct jobs (and associated direct wages and direct output) of the UA Tech Park reflect the actual size and volumes of production of goods and services of all tenants. This is also referred to as the direct contribution to the regional economy.
Indirect and induced impacts (jobs, wages, and output) are generated through relationships with other sectors in the local economy by way of purchasing goods and services for business operations, and household needs. These impacts depend not only on the changes in direct jobs, wages, and outcome at the UA Tech Park, but primarily reflect changes in the complex inter-industry relationships in the entire economy of Pima County and the rest of Arizona.
Impacting Pima County: Direct jobs, wages, and output
In 2017, the UA Tech Park had 52 tenants representing more than 15 different industries such as guided missiles; semiconductor manufacturing; surgical appliance and supplies manufacturing; search, detection, and navigation instruments manufacturing; scientific research and develop-ment services; data processing, and business support services. In addition, a number of tenants provided maintenance services, and support to Park’s employees, such as food services.
The total number of persons employed in 2017 was 5,870 which included regular and contract employees of the established tenants, as well as the personnel in start-up companies within the Arizona Center for Innovation. The direct contribution to the Pima County economy was $465.3 million in labor income. The total direct output (including labor income) was $1,108.6 million. (Exhibit 1)
Exhibit 1
UA Tech Park: Direct impact in Pima County 2017
Number of employees .................... 5,870
Payroll .............................................. $465.3 million
Output (including payroll) .......... $1,108.6 million
Source: Annual tenant survey; IMPLAN model of Pima County

2 UA Tech Park Economic Impacts, CY 2017
Indirect and induced impacts
The local inputs into daily operations at the UA Tech Park together with employee spending in the local economy generated an additional 4,541 jobs in Pima County. The indirect and induced dollar impact (output) was $589.9 million, of which $199.4 million was labor income. (Exhibit 2)
Exhibit 2
Total impact on Pima County’s economy
In 2017, the total number of jobs in the Pima County economy associated with the activities at the UA Tech Park was 10,460. The Park contributed a total of $666.9 million in wages, and an overall contribution to the County’s output in the amount of $ 1,704.6 million. Included in these figures are impacts of construction activity which generated $6.1 million in output, $2.1 million in wages, and 49 jobs in Pima County. (Exhibit 3)
Exhibit 3
UA Tech Park: Indirect & induced impacts in Pima County 2017
Number of jobs .................................... 4,541
Wages .................................................... $199.4 million
Output (including wages) ................. $589.9 million
Source: IMPLAN model of Pima County
UA Tech Park: Total economic impacts in Pima County 2017(Including construction-related)
Jobs .................................................. 10,460
Wages .............................................. $666.9 million
Total output ................................. $1,704.6 million(including wages)
Source: IMPLAN model of Pima County

UA Tech Park Economic Impacts, CY 2017 3
Multipliers
The overall economic impact of the UA Tech Park on the economy of Pima County in 2017 is expressed in terms of multipliers. (Exhibit 4)
Exhibit 4
The multipliers suggest that every job at the UA Tech Park generated 0.7 (or 78 per every 100) additional jobs in Pima County; every one dollar in wages generated an additional 43 cents in wages, while every dollar in the Park’s output generated an additional 53 cents elsewhere in Pima County.
Impacts on Arizona’s economy
The economic impacts of the UA Tech Park are felt throughout the entire state of Arizona. The total number of jobs in Arizona supported by the activity of the UA Tech Park was 11,752 in 2017. This figure includes direct jobs at the UA Tech Park premises and all indirect and induced jobs generated through purchases of industrial inputs and consumer spending in Pima County and the rest of Arizona. Statewide, UA Tech Park activities generated a total of $1,984.5 million in output, of which $769.0 million is in wages. (Exhibit 5)
Exhibit 5
UA Tech Park: Composite multipliers 2017(Including construction-related activities)
Job multiplier ................................ 1.782
Wage multiplier ............................ 1.433
Output multiplier ......................... 1.532
Source: IMPLAN model of Pima County
UA Tech Park: Total impacts on Arizona’s economy in 2017(Including construction-related activity)
Jobs ............................................................ 11,752
Wages ...................................................... $769.0 million
Total output ......................................... $1,984.5 million
(Including wages)
Source: IMPLAN model of Arizona

4 UA Tech Park Economic Impacts, CY 2017
Contributions to state and local tax revenues
In 2017 in Pima County, the UA Tech Park’s activities generated an estimated $40.8 million in tax revenues to local and state governments. Through additional spending outside Pima County, the total tax revenue impact was $51.5 million. (Exhibit 6)
Exhibit 6
Place of residence of UA Tech Park employees
Less than 10 percent of UA Tech Park employees reside within a 5-mi radius. About 28 percent are within a 5 to 10-mi radius, and approximately the same number (or 27%) resides within a 10 and 15 mi radius. Close to 13 percent reside between a 15 and 20 mi radius, and another 10 percent or every tenth employee resides between 20 and 25 mi radius. Less than 8 percent commute from distances beyond 325 miles. For the remaining 5 percent of employees data was not provided (Exhibit 7).
Exhibit 7
UA Tech Park: State and local tax revenues 2017 (including construction-related)
Generated in: Pima County ................................. $40.8 million Arizona (including Pima County) ......... $51.5 millionSource: IMPLAN model of Pima County and Arizona
UA Tech Park: Employees by zip code (85xxx)(based on 2013 survey, average distance)
Less than 5 mi ......................................... 9.5% (85747)
Between 5 and 10 mi ............................. 28.5% (85730, 85706, 85708, 85710, 85 714, 85748, 85711)
Between 10 and 15 mi ............................ 27.5% (85715, 85712, 85713, 85716, 85701, 85641, 85749,
85719, 85746, 85705)
Between 15 and 20 mi ............................ 12.8% (85718, 85750, 85757, 85745, 85704)
Between 20 and 25 mi ........................... 9.6% (85741, 85737, 85743, 85742)
More than 25 mi ...................................... 7.3% (85739, 85755,85735, 85629, 85653, 85614, 85736, 85658, 85602, 85637, 85731, 85744, 85751, 85756, 80504, 91320)
Other & N/A ............................................. 4.9%
Source: Annual tenant survey

UA Tech Park Economic Impacts, CY 2017 5
Data and Methodology
This analysis is based on data for calendar year 2017. Data were gathered through the annual tenant survey conducted in spring 2018 in combination with information extracted from the IMPLAN models of Pima County and Arizona. IMPLAN modeling is widely used in academic and applied research of economic impacts associated with industry changes. Originally developed by the University of Minnesota research team, it is now operated and maintained by the MIG, Inc. of Hudson, Wisconsin. Indirect and induced jobs, associated wages and output in Pima County and Arizona were estimated using the input-output methodology incorporated in the IMPLAN models. The IMPLAN county and state models also provided estimates of aggregated state and local tax revenue.
*Note – “Payroll” and “Wages” are the more commonly used concepts. They correspond to “Labor Income” in the IMPLAN I-O model.

6 UA Tech Park Economic Impacts, CY 2017
Econ
omic
Impa
cts
of U
A T
ech
Park
in P
ima
Coun
ty, 1
997-
2017
(D
olla
rs in
mill
ions
)
1997
-98
1999
200
0-0
120
03-
04
200
720
08
200
920
1020
1320
1520
17
Num
ber
of t
enan
ts17
2131
3132
4040
4547
3852
Dir
ect
jobs
4,1
73
5,30
9 5,
949
6,2
26
6,17
5 6,
938
6,4
94
5,96
1 6,
226
5,12
8 5,
870
Tota
l job
s op
erat
ions
8,4
91
10,8
66
12,1
50
12,9
85
13,0
27
14,7
87
11,8
35
12,6
62
14
,321
8,
971
10,4
11
Tota
l job
s co
nstr
ucti
on14
4
1,67
3 34
5 32
0
220
16
33
77
3852
4
9
Tota
l job
impa
ct8,
635
12,5
39
12,4
95
13,3
05
13,2
47
14,8
03
11,8
68
12,7
39.0
14
,359
9,
023
10
,460
Wag
e im
pact
ope
rati
ons
358.
9 4
37.8
59
5.7
607.
6 6
78.9
90
0.4
61
0.1
652.
2 8
45.
9 60
9.5
664
.7
Wag
e im
pact
con
stru
ctio
n3.
5 4
0.2
8.3
24.0
9.
2 0
.7
1.3
3.0
1.
7 2.
3 2.
1
Tota
l wag
e im
pact
362.
4
478
.0
604
.0
631.
6 68
8.1
901.
1 61
1.4
65
5.2
847.
6 60
9.5
666.
8
Tax
reve
nues
ope
rati
ons
28.7
34
.8
48.
7 4
3.1
63.
0
77.8
41
.0
42.
2 5
1.3
37.
5 4
0.6
Tax
reve
nues
con
stru
ctio
n 0
.1
4.0
0
.3
0.6
0.9
0.1
0.2
0.3
0.1
0.3
0.2
Tota
l tax
rev
. im
pact
28.8
38
.8
49.
0
43.
7 63
.9
77.9
4
1.2
42.
5 51
.4
37.9
4
0.8
Dol
lar
impa
ct o
pera
tion
s1,
127.
3 1,
361.
8 1,
850.
4
1,89
6.9
2,41
7.6
3,0
19.5
2,
163.
9 2,
297.
7 2,
332.
0
1,4
94.9
1,
698.
5
Dol
lar
impa
ct c
onst
r.7.
2 83
.5
17.2
27
.4
35.
9 1
.4
5.2
8.1
5.2
7.8
6.1
Tota
l dol
lar
impa
ct1,
134
.5
1,4
45.
3 1,
867.
6 1,
924
.3
2,4
53.5
3,
020
.9
2,16
9.1
2,30
5.8
2,33
7.2
1,50
2.7
1,70
4.6
Sour
ces:
Eco
nom
ic im
pact
stu
dies
(see
the
Refe
renc
e lis
t).

UA Tech Park Economic Impacts, CY 2017 7
Econ
omic
Impa
ct 2
017
Com
pare
d to
Pre
viou
s St
udie
s (%
Cha
nge)
2017
ove
r 19
97/8
2017
ove
r 19
9920
17 o
ver
200
0/1
2017
ove
r 20
03/
420
17 o
ver
200
720
17 o
ver
200
820
17 o
ver
200
920
17 o
ver
2010
2017
ove
r 20
1320
17 o
ver
2015
%
%
%
%
%
%
%
%
%
%
Num
ber
of t
enan
ts20
5.9
147.
667
.767
.762
.530
.030
.015
.610
.636
.8
Dir
ect
jobs
40.7
10.6
-1.3
-5.7
-4.9
-15.
4-9
.6-1
.5-5
.714
.5
Tota
l job
s op
erat
ions
22.6
-4.2
-14.
3-1
9.8
-20.
1-2
9.6
-12.
0-1
7.8
-27.
316
.1
Tota
l job
s co
nstr
ucti
on-6
6.0
-97.
1-8
5.8
-84.
7-7
7.7
206.
348
.5-3
6.4
28.9
-5.8
Tota
l job
impa
ct21
.1-1
6.6
-16.
3-2
1.4
-21.
0-2
9.3
-11.
9-1
7.9
-27.
215
.9
Wag
e im
pact
ope
rati
ons
85.2
51.8
11.6
9.4
-2.1
-26.
28.
91.
9-2
1.4
9.1
Wag
e im
pact
con
stru
ctio
n-4
0.0
-94.
8-7
4.7
-91.
3-7
7.2
200.
061
.5-3
0.0
23.5
-8.7
Tota
l wag
e im
pact
84.0
39.5
10.4
5.6
-3.1
-26.
09.
11.
8-2
1.3
9.4
Tax
reve
nues
ope
rati
ons
41.4
16.6
-16.
6-5
.8-3
5.6
-47.
8-1
.0-3
.8-2
0.9
8.3
Tax
reve
nues
con
stru
ctio
n12
6.8
-94.
3-2
4.4
-62.
2-7
4.8
126.
813
.4-2
1.8
126.
8-2
4.4
Tota
l tax
rev
enue
impa
ct41
.75.
2-1
6.7
-6.6
-36.
2-4
7.6
-1.0
-4.0
-20.
67.
7
Dol
lar
impa
ct o
pera
tion
s50
.724
.7-8
.2-1
0.5
-29.
7-4
3.7
-21.
5-2
6.1
-27.
213
.6
Dol
lar
impa
ct c
onst
ruct
ion
-15.
3-9
2.7
-64.
5-7
7.7
-83.
033
5.7
17.3
-24.
717
.3-2
1.8
Tota
l dol
lar
impa
ct50
.317
.9-8
.7-1
1.4
-30.
5-4
3.6
-21.
4-2
6.1
-27.
113
.4
8 UA Tech Park Economic Impacts, CY 2017
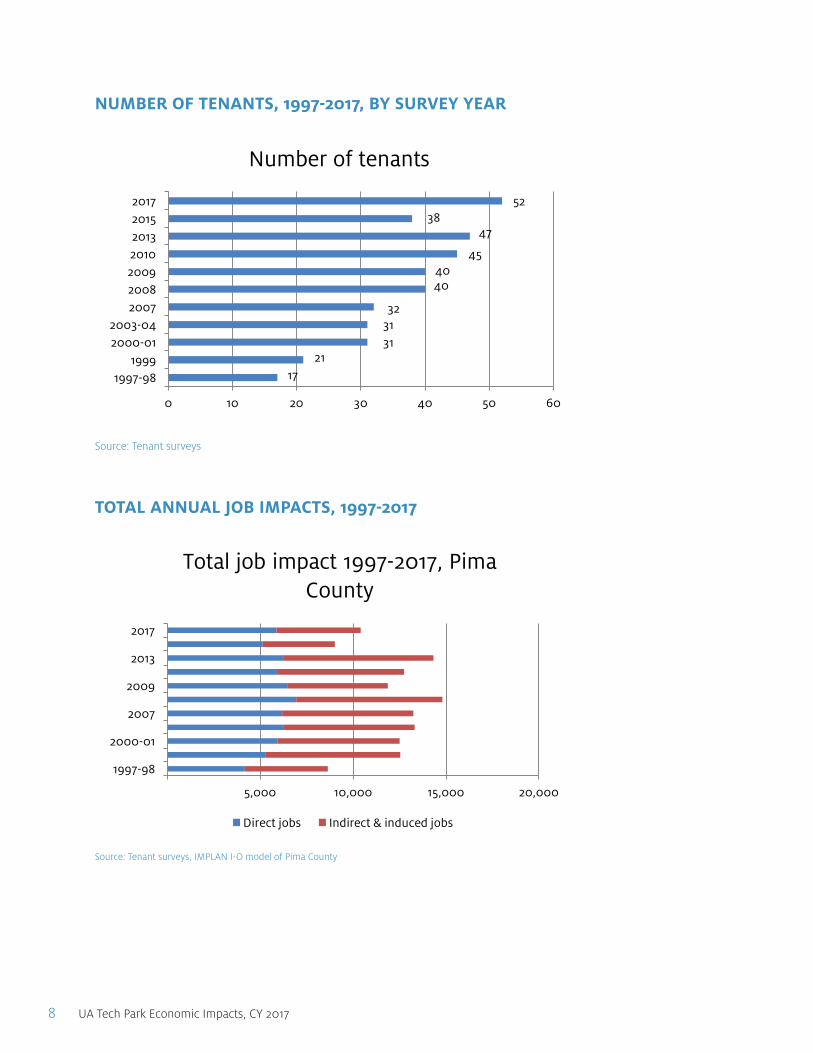
NUMBER OF TENANTS, 1997-2017, BY SURVEY YEAR
1721
313132
4040
45
4738
52
0 10 20 30 40 50 60
1997-981999
2000-012003-04
2007200820092010201320152017
Number of tenants
Source: Tenant surveys
TOTAL ANNUAL JOB IMPACTS, 1997-2017
!"#$%&'#()*+#,&-.-/0/2)&345#67#89:;#<,=%&>30?%#@>//)*A# ()B%#C#!
NUMBER OF TENANTS, 1997-2017, BY SURVEY YEAR
5,000 10,000 15,000 20,000
1997-98
2000-01
2007
2009
2013
2017
Total job impact 1997-2017, Pima County
Direct jobs Indirect & induced jobs
Source: Tenant surveys, IMPLAN I-O model of Pima County

UA Tech Park Economic Impacts, CY 2017 9
TOTAL ANNUAL WAGE (LABOR INCOME) IMPACTS, 1997-2017
0 200 400 600 800 1000
1997-98
2000-01
2007
2009
2013
2017
Total wage impact 1997-2017, Pima County ($million)
Direct wages Indirect & induced
Source: Tenant surveys, IMPLAN I-O model of Pima County
TOTAL ANNUAL DOLLAR (OUTPUT) IMPACTS, 1997-2017
1,134.5 1,445.3
1,867.6 1,924.3
2,453.5 3,020.9
2,009.0 2,010.0
2,332.0 1,502.7
1,704.6
500.0 1,000.0 1,500.0 2,000.0 2,500.0 3,000.0 3,500.0
1997-98
2000-01
2007
2009
2013
2017
Total dollar impact ($million)
Source: IMPLAN I-O model of Pima County

10 UA Tech Park Economic Impacts, CY 2017
TOTAL ANNUAL TAX REVENUE IMPACTS, 1997-2017
28.8 38.8
49.0 43.7
63.9
77.9 41.2
42.5 51.4
37.9 40.8
20.0 40.0 60.0 80.0 100.0
1997-981999
2000-012003-04
2007200820092010201320152017
Total tax revenue impact ($million)
Source: IMPLAN I-O model of Pima County
UA TECH PARK: COMPARISON WITH PIMA COUNTY
Total employment
Employment 2017
Employment 2015
Change to 2017
% change
Total employment Pima County 497,332 495,782 1,550 0.3
Total employment UA Tech Park 5,870 5,128 742 14.5
Average wages Wages/empl 2017
Wages/ empl 2015
Change to 2017
% change
Average wages per employee ($), Pima County
$47,327 $45,576 $1,751 3.8
Average wages per employee ($), UA Tech Park
$74,028 $82,879 ($8,851) -10.7
Selected industry sectors* Employment 2017
Employment 2015
Change to 2017
% change
Pima County 39,021 41,250 (2,229) -5.4
UA Tech Park 5,254 4,704 550 11.7
*Selected industry sectors include: Semiconductor & other device manufacturing; Guided missile & space vehicles; Surgical appliances & supplies manufacturing; Health & personal care – retail; Data processing, hosting, ISP; Computer systems design services; Scientific research & development services; Marketing, research, miscellaneous professional & scientific services; and Business support services.
Source: IMPLAN model of Pima County

UA Tech Park Economic Impacts, CY 2017 11
Annual Tenant Survey for Economic and Revenue Impact Study
Calendar Year 2017
1. Company name: 2. Contact person/phone/email:
3. Principal product/service: 4. NAICS designation:
5. No. of months in operation during 2017 (clrcle): 1 2 3 4 5 6 7 8 9 10 11 12
6. Highest number of regular employees in 2017:
7. Lowest number of regular employees in 2017
8.Total payroll ($) of regular employees (Including benefits) In 2017:
9. Number of contract employees in 2017: 10. Total payroll of contract employees In 2017:
11. Number of out-of-town visitors in 2017: 12. Average day per visitor In 2017:
13. Number of University of Arizona Interns: 14. Total revenues($) in 2017:
15.No of employees by zip code:
85614_ __________ 85708 _______________
85619 _________ 85709 _______________
85629 __________ 85710 _______________
85641 ___________ 85711 _______________
85653 ___________85712 _______________
85658 ___________ 85713 _______________
85719 __________ 85745 _______________
____________________ _______________
85730 __________ 85746 _______________
85735 __________ 85747 _______________
85736 __________ 85748 _______________
85737___________ 85749 _______________
85739 __________ 85750 _______________
85741 __________ 85755 _______________
85742 __________ 85757 _______________
85743 __________ 85744 _______________
____________________ _______________
16. Number of employees that are UA Alumni:

12 UA Tech Park Economic Impacts, CY 2017
References
Economic impact studiesVP Research & Consulting, LLC , Economic Impact of the UA Tech Park 2015. Prepared for The University of Arizona Office of University Research Parks, 2016
VP Research & Consulting, LLC , Economic Impact of the UA Tech Park 2013. Prepared for The University of Arizona Office of University Research Parks, 2014.
Pavlakovich-Kochi, V. The UA Tech Park: Economic Impact 2010. The University of Arizona Eller College of Management, 2013.
Lim, J., The University of Arizona Science and Technology Park: Economic Impact 2009. The University of Arizona Office of University Research Parks, 2012.
Lim, J., The University of Arizona Science and Technology Park: Economic Impact 2008. The University of Arizona Office of University Research Parks, 2010.
Pavlakovich-Kochi, V. and A.H. Charney. Impact of the University of Arizona Science and Technology Park on the Economy of Tucson and Pima County. An Economic and Tax Revenue Impact Analysis for CY 2007. The University of Arizona Office of Economic and Policy Analysis, 2008.
Pavlakovich-Kochi, V. and A.H. Charney. Impact of the University of Arizona Science and Technology Park on the Economy of Tucson and Pima County. An Economic and Tax Revenue Impact Analysis for FY 2003-2004. The University of Arizona Office of Economic and Policy Analysis, 2005.
Pavlakovich-Kochi, V. and A.H. Charney. Impact of the University of Arizona Science and Technology Park on the Economy of Tucson and Pima County. An Economic and Tax Revenue Impact Analysis for FY 2000-2001. The University of Arizona Office of Economic Development, 2002.
Pavlakovich-Kochi, V. and A.H. Charney. Impact of the University of Arizona Science and Technology Park on the Economy of Tucson and Pima County: An Economic and Revenue Impact Analysis 1999. The University of Arizona Office of Economic Development, 2000.
Pavlakovich, V.K., A.H. Charney and A. Weister-Burns. The University of Arizona Science and Technology Park: An Economic and Revenue Impact Analysis for Fiscal Year 1997-98. The University of Arizona Office of Economic Development, 1999.
Other publications
Gibson, L.J., J. Lim, and V. Pavlakovich-Kochi, “The University Research Park as a Micro-Cluster: Mapping its Development and Anatomy,” Studies in Regional Science, Vol.43, No. 2, 2013: 177-189.
Gibson, L/J., V. Pavlakovich-Kochi, R. Gruener, and B. Wright, “Community Engagement and Knowledge Transition: Critical Tools for Bio-Technology Development,” Applied Research in Economic Development, Vol. 6, No. 2, 2009: 78-86.

UA Tech Park Economic Impacts, CY 2017 13
About the author
Dr. Vera Pavlakovich-Kochi is the founder and president of VP Research & Consulting LLC (VP standing for “Very Professional”) in Tucson, Arizona. During more than 25 years at the University of Arizona as senior regional scientist and affiliate faculty, Dr. Pavlakovich-Kochi authored and co-authored numerous studies including impact assessment of various agents on local and regional economies, such as universities and science and research parks, Mexican maquiladora sector, fresh produce industry, Mexican visitors to Arizona, and transborder region-building. Articles on Arizona’s economy and U.S.-Mexican
border have been published in Arizona’s Economy, Arizona’s Review, Journal of Borderlands Studies, Revista de El Colegio de Sonora, Estudios Sociales, Studies in Regional Science, as book chapters, and Arizona Town Hall reports. Currently, Dr. Pavlakovich-Kochi contributes to a sponsor-supported Eller College project focusing on the assessment of Arizona-Mexico economic relationships, online at https://azmex.eller.arizona.edu. She holds B.A. and M.A. degrees from the University of Zagreb, Croatia, and a Ph.D. degree in geography and regional development from Kent State University. Dr. Pavlakovich-Kochi is a Fulbright scholar (Austria 1997).

14 UA Tech Park Economic Impacts, CY 2017
9070 S Rita Rd Ste 1750Tucson AZ 85747-6112(520) 621-4088
techparks.arizona.edu
Tech Parks Arizona creates the interactive ground that generates, attracts and retains technology companies and talent in alignment with the research, mission and goals of the University of Arizona. Tech Parks Arizona directs the UA Tech Park,
the UA Tech Park at The Bridges and the Arizona Center for Innovation, placing the highest priority on recruiting companies desiring connectivity to the UA.