
TeamViewer Q3 2020 Investor Presentation
32
Q4 / FY 2020 Preliminary Results (unaudited) Investor Presentation 9 February 2021
Transcript of TeamViewer Q3 2020 Investor Presentation

Q4 / FY 2020Preliminary Results (unaudited)Investor Presentation
9 February 2021

Q4 / FY 2020 Preliminary Results (unaudited) - Investor Presentation2
Importance NoticeThis presentation as well as any information communicated in connection therewith (the "Presentation") contains information regarding TeamViewer AG (the "Company") and its subsidiaries (the Company, together with its subsidiaries,"TeamViewer"). It is being provided for informational purposes only and should not be relied on for any purpose and may not be redistributed, reproduced, published, or passed on to any other person or used in whole or in part for anyother purpose.
All stated figures are preliminary and unaudited. The Company intends to publish its annual report 2020, including its audited annual financial statements, on 25 March 2021.
Certain statements in this presentation may constitute forward looking statements. These statements are based on assumptions that are believed to be reasonable at the time they are made, and are subject to significant risks and uncertainties, including, but not limited to, those risks and uncertainties described in TeamViewer's disclosures. You should not rely on these forward-looking statements as predictions of future events and we undertake no obligation to update or revise these statements. Our actual results may differ materially and adversely from any forward-looking statements discussed in these statements due to several factors, including without limitation, risks from macroeconomic developments, external fraud, lack of innovation capabilities, inadequate data security and changes in competition levels.
The Company undertakes no obligation, and does not expect to publicly update, or publicly revise, any forward-looking statement, whether as a result of new information, future events or otherwise. All subsequent written and oralforward-looking statements attributable to it or to persons acting on its behalf are expressly qualified in their entirety by the cautionary statements referred to above and contained elsewhere in this Presentation.
This document contains certain alternative performance measures (collectively, “APMs”) including billings and Adjusted EBITDA that are not required by, or presented in accordance with, IFRS, German GAAP or any other generally accepted accounting principles. TeamViewer presents APMs because they are used by management in monitoring, evaluating and managing its business and management believes these measures provide an enhanced understanding of TeamViewer’s underlying results and related trends. The definitions of the APMs may not be comparable to other similarly t itled measures of other companies and have limitations as analytical tools and should, therefore, not be considered in isolation or as a substitute for analysis of TeamViewer’s operating results as reported under IFRS or German GAAP. APMs such as billings and Adjusted EBITDA are not measurements of TeamViewer’s performance or liquidity under IFRS or German GAAP and should not be considered as alternatives to results for the period or any other performance measures derived in accordance with IFRS, German GAAP or any other generally accepted accounting principles or as alternatives to cash flow from operating, investing or financing activities.
TeamViewer has defined each of the following APMs as follows:“Billings” represent the (net) value of goods and services invoiced to customers in a given period if realization is probable – it is defined as revenue adjusted for change in deferred revenue P&L-effective;“Adjusted EBITDA” means EBITDA, adjusted for P&L-effective changes in deferred revenue as well as for certain special items relating to share based compensations and other material items that are not reflective of the operating performance of the business.
This document also includes further certain operational metrics, such as Net Retention Rate, and additional financial measures that are not required by, or presented in accordance with IFRS, German GAAP or any other generally accepted accounting principles (collectively, “other financial measures”). TeamViewer presents these operational metrics and other financial measures for information purposes and because they are used by the management for monitoring, evaluating and managing its business. The definitions of these operational metrics and other financial metrics may not be comparable to other similarly titled measures of other companies and have limitations as analytical tools and should, therefore, not be considered in isolation or as a substitute for analysis of TeamViewer’s operating results , performance or liquidity as reported under IFRS or German GAAP.
TeamViewer has defined these operational metrics and other financial measures for information purposes as follows:“Net retention rate (NRR)” means annual recurring billings of existing subscription customers during the period considered less gross value churn plus billings from upselling and cross-selling, including foreign exchange effects and expiring discounts, as a percentage of annual recurring billings in the previous period;“Levered free cash flow” (FCFE) means net cash from operating activities less capital expenditure for property, plant and equipment and intangible assets (excl. M&A), payments for the capital element of lease liabilities and interest paid for borrowings and lease liabilities; and„Net Leverage“ means the ratio of net financial debt (sum of interest-bearing loans and borrowings, current and non-current, less cash and cash equivalents) to Adjusted EBITDA.

Business OverviewOliver Steil

Q4 / FY 2020 Preliminary Results (unaudited) - Investor Presentation4
Strong Q4 concluded a record FY 2020
1. All figures on LTM 31 Dec 2020 basis; 2incl. Tensor, Remote Management, Remote Access, IoT, Pilot; 3excl. Ubimax with €3.6m billings; 4Growth at constant currencies
• Exceeded revised FY 20 outlook despite higher than expected FX headwinds
• Q4: strongest Enterprise quarter ever with significant upsells and new customer wins
• Enterprise business ramped to 12% of total FY 20 billings
• High new product billings growth (+246%)2
– further diversified revenue base across use cases and customer segments
• Tuck-in M&A strategy progressing well –supported by high profitability and further reduced net leverage
Billings and adjusted EBITDA exceeding revised outlook
Billings(€m)
Outlook was 450-455
Adj. EBITDA(€m)
Outlook was ~56%
+338%Tensor Billings
+360%Pilot
Billings
+389%Remote Access
Billings
Organic3
456.7+41% | +43% cc4
Total
460.3+42% | +44% cc
Margin
56.8%+0.8pp
Total
261.4+44% | +48% cc
+204%Enterprise
Billings
+170%EnterpriseCustomers
FY 2020 Growth 1

Q4 / FY 2020 Preliminary Results (unaudited) - Investor Presentation5
Remote Support for medical devices
Innovative use cases drive enterprise traction
Smart farming and dairy automation company
Remote support for agricultural equipment with Tensor
Serving farmers in more than 45 countries
"The number of use cases we need to provide with secure and high-performanceaccess to our systems is increasing within the clinical environment. That’s why thepartnership with TeamViewer is becoming increasingly important for us and why wesee huge potential to build on that.“Wolfgang Heimsch, Head of Customer Services at Siemens Healthineers
Q4 / FY 2020 Preliminary Results (unaudited) - Investor Presentation6
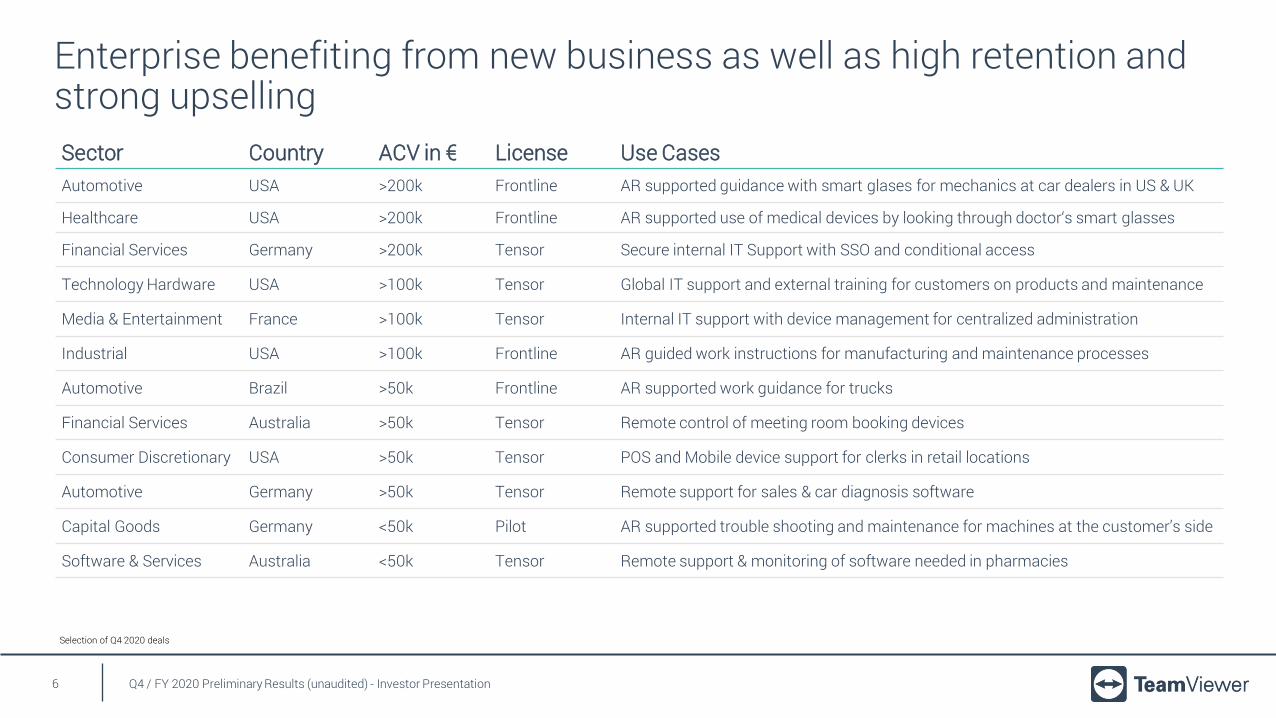
Enterprise benefiting from new business as well as high retention and strong upsellingSector Country ACV in € License Use CasesAutomotive USA >200k Frontline AR supported guidance with smart glases for mechanics at car dealers in US & UK
Healthcare USA >200k Frontline AR supported use of medical devices by looking through doctor‘s smart glasses
Financial Services Germany >200k Tensor Secure internal IT Support with SSO and conditional access
Technology Hardware USA >100k Tensor Global IT support and external training for customers on products and maintenance
Media & Entertainment France >100k Tensor Internal IT support with device management for centralized administration
Industrial USA >100k Frontline AR guided work instructions for manufacturing and maintenance processes
Automotive Brazil >50k Frontline AR supported work guidance for trucks
Financial Services Australia >50k Tensor Remote control of meeting room booking devices
Consumer Discretionary USA >50k Tensor POS and Mobile device support for clerks in retail locations
Automotive Germany >50k Tensor Remote support for sales & car diagnosis software
Capital Goods Germany <50k Pilot AR supported trouble shooting and maintenance for machines at the customer’s side
Software & Services Australia <50k Tensor Remote support & monitoring of software needed in pharmacies
Selection of Q4 2020 deals

Q4 / FY 2020 Preliminary Results (unaudited) - Investor Presentation7
Expanding enterprise customer base with significant billings growthEnterprise billings tripled in size, now representing 12% of total billings
369 419 468 518 590 6981,183
1,457 1,658 1,885
Q3 18 Q4 18 Q1 19 Q2 19 Q3 19 Q4 19 Q1 20 Q2 20 Q3 20 Q4 20
215 271 317 368 432 464 514 534 567 584
Subscribers(LTM, thousand)
Enterprisecustomers1
(LTM)
61%14%
12%
13%€10-50k
>€50k
>€100k
>€200k
+350% +170%
+115% +26%
17.4
53.0
FY 2019 FY 2020
EnterpriseBillings2
(€m, LTM)
Enterprise Billingsby ACV1
(FY 20, LTM)
+204%
1Customers with invoiced billings across all products and services of at least €10,000 during the last twelve months (ACV or annual contract value) 2total billings of all Enterprise Customers

Q4 / FY 2020 Preliminary Results (unaudited) - Investor Presentation8
THE WAY WE WORK HAS CHANGED

Q4 / FY 2020 Preliminary Results (unaudited) - Investor Presentation9
TeamViewer solutions for the entire value chain
Product Development Manufacturing Supply Chain Corporate Sales Service
Leveraging the connectivity platform for horizontal and increasingly vertical solutions
Work From Anywhere
Automated Shopfloor / Warehouse
Internet of ThingsAI & Robotics
Shared Workspace
Training & Quality Assurance
Asset Monitoring & Management
Customer Interaction
Customer Engagement
Customer Support
Repair & Maintenance

Q4 / FY 2020 Preliminary Results (unaudited) - Investor Presentation10
Mid-Term objective: €1 billion billings in 2023Focused execution of targeted growth initiatives
Use case expansion
Full customercoverage
2020
Global 27% Total addressable market growth
New use cases & products
Increasing enterprise footprint
Industrial verticals
Selective M&A
Use case expansion
2018230m
2020460m
20231 billion
Global
Tensor
IoTAR
Enterprise
SoHo & Personal
SME
Industrial verticals
Fron
tline

Stefan Gaiser
Financial Overview

Q4 / FY 2020 Preliminary Results (unaudited) - Investor Presentation12
Record FY 2020 billings with sustained high profitability
62.6 72.1
Q4 2019 Q4 2020
100.6128.1
Q4 2019 Q4 2020
324.9
460.3
FY 2019 FY 2020
+27%
Adj. EBITDA (€m) & Margin1Billings (€m)
+42%
182.1
261.4
FY 2019 FY 2020
+15%
+44%
55.6% 56.3%
53.3%
56.8%
1Adj. EBITDA as % of billings
+32% cc
+44% cc
62.2%
56.0%
+25% cc
+49% cc

Q4 / FY 2020 Preliminary Results (unaudited) - Investor Presentation13
58.073.5
Q4 2019 Q4 2020
32.844.5
Q4 2019 Q4 2020
High regional billings diversification with broad customer coverage
9.9
10.2
Q4 2019 Q4 2020
109.8157.7
FY 2019 FY 2020
+36%
APAC billings (€m)AMERICAS billings (€m)
+44%
41.256.1
FY 2019 FY 2020
+3%
+36%
EMEA billings (€m)
174.0
246.4
FY 2019 FY 2020
+27%
+42%
• Strong traction across all sales channels
• US$ continued to devaluate in Q4
• Very strong enterprise business
• Well balanced growth across countries
• Key markets with strong growth in 2020
• Tighter credit controls and no free user monetization capped growth in Q4
+48% cc +28% cc +6% cc
+50% cc +42% cc +39% cc

Q4 / FY 2020 Preliminary Results (unaudited) - Investor Presentation14
Strong billings growth due to expanding subscriber base with higher deal values and >100% net retention rate
254394
36
19174
171
30. Dec 19 30. Dec 20
Retained Migrated New
464
584
Subscribers (thousand, LTM) Billings by category (€m)
72.995.3
4.5
1.423.0
29.50.1
1.9
Q4 2019 Q4 2020Renewal Migration New Other
100.6
128.1
+27%+26%
+32% cc
1
• Q4 2020: strong new billings growth paired with high renewals and additional billings from Frontline
• 103% NRR (FY 20) slightly down due to FX headwinds in Q4 (calculated net of payment defaults)
• Continued subscriber growth
• New subscribers with higher deal values
• Stable subscriber retention and ongoing conversion of remaining perpetual customers
204.1
319.020.8
8.8
98.0
129.1
2.1
3.4
FY 2019 FY 2020Renewal Migration New Other
324.9
460.3+42%
+44% cc
1 2 2
1Billings generated from subscriptions renewals incl. up and cross sell from all subscribers in the given period 2Incl. non-subscription billings from deployment services, hardware reselling and perpetual licenses

Q4 / FY 2020 Preliminary Results (unaudited) - Investor Presentation15
Superior margins maintained while significant investments across functions support future growth
1) incl. other income/expenses and bad debt expenses of €3.4m in Q2 and €8.5m for H1 2020
€m Q4 20 Q4 19 ∆ FY 20 FY 19 ∆
Billings 128.1 100.6 +27% 460.3 324.9 +42%
Cost of sales% of billings
(9.6)7.5%
(6.9)6.9% +38% (35.9)
7.8%(24.2)
7.5% +48%
Gross profit% Margin
118.6+92.5%
93.7+93.1%
+27%-0.6pp
424.492.2%
300.792.5%
+41%-0.3pp
Sales% of billings
(16.7)13.0%
(9.5)9.4% +76% (58.1)
12.6%(37.9)
11.7% +53%
Marketing% of billings
(9.3)7.2%
(6.6)6.6% +40%
(31.1)6.8%
(22.8)7.0% +37%
R&D% of billings
(10.7)8.3%
(7.4)7.4% +43%
(34.8)7.6%
(28.0)8.6% +24%
G&A% of billings
(7.1)5.5%
(4.0)4.0% +75%
(26.0)5.7%
(16.4)5.0% +59%
Other1
% of billings(2.7)
2.1%(3.6)3.5% -24%
(12.8)2.8%
(13.5)4.2% -5%
Total Opex% of billings
(46.4)36.2%
(31.1)30.9% +49%
(162.9)35.4%
(118.6)36.5% +37%
Adj. EBITDA 72.1 62.6 +15% 261.4 182.1 +44%
% Margin 56.3% 62.2% -5.9pp 56.8% 56.0% +0.8pp
• Cost of sales up as anticipated and reflecting investments in platform infrastructure fully in line with financial model
• Expansion of solutions sales and continued investments in R&D mainly in the areas of AR and IoT
• Strengthened corporate functions
• Lower bad debt expenses
• FY 20 adjusted EBITDA margin slightly ahead of guidance
1incl. other income/expenses and bad debt expenses of €3.8m in Q4 and €14.6 for FY 2020 (€4.2m in Q4 2019 and €15.5m for FY 2019)

Q4 / FY 2020 Preliminary Results (unaudited) - Investor Presentation16
Sharp increase in FCFE due to consistently strong operating cash flow and significantly lower cost of debt
€m Q4 20 Q4 19 ∆ FY 20 FY 19 ∆
Pre-Tax net cash from operating activities (IFRS) 72.9 62.6 +17% 258.0 161.5 +60%
Income tax paid (8.7) (2.6) >100% (33.4) (17.9) +87%
Capital expenditure (excl. M&A) (3.4) (8.8) -61% (26.2) (16.6) +57%
Lease repayments (1.5) 0.0 n.m. (4.9) (3.8) +27%
Interest paid for borrowings and lease liabilities (3.2) (19.6) -83% (28.1) (46.1) -39%
Levered Free Cash Flow (FCFE) 56.1 31.5 +78% 165.4 77.1 +115%
as % of adj. EBITDA 78% 50% 63% 42%
as % of EBITDA 113% 58% 81% 41%
• Capital expenditure mainly related to one-off investments in the ERP system (€13.5m) as well as the new headquarters (€7.6m)
• Significant lower interest paid due to substantial deleveraging and improved loan financing terms
• FY 20 levered free cash flow excludes loan repayments of €62.8m (net) and €84.1m cash paid for Ubimax

Q4 / FY 2020 Preliminary Results (unaudited) - Investor Presentation17
Net leverage further reduced to 1.7x adjusted EBITDA
53.0 83.5
532.3495.1
23.1 27.2
502.4438.7
Cash & cash equiv. Loan facilities
IFRS 16 leases Net financial debt
2.0x 1.7x
1.5
2
Net financial debt and net leverage development (€m)
Net leverage
30 Sep 20 31 Dec 20
0
Strong cash flow and €24m loan repayment
Development cash & cash equivalents in Q4 (€m)
(23.8)

Q4 / FY 2020 Preliminary Results (unaudited) - Investor Presentation18
TeamViewer solutions avoid 37 Mt of greenhouse gases every year
1Based on 2019 data, calculated in 2020. More information here
Remote connectivity solutions by TeamViewer contribute to an avoidance of 37 megatons CO2 equivalent (CO2e)emissions per year. This equals the emissions of 11 million average cars per year or the amount of carbon that 3.5 billion trees can bind in one year.
A typical TeamViewer subscriber avoids 4t CO2e per year which is as much as a train ride of 100,000 kilometers –corresponding to a distance of 2.5x around the world.
An average TeamViewer connection avoids 13kg CO2e which is as much as a 70km drive with an average car or 5.5 liters of gasoline.
Based on a scientific study conducted by the Institute for Energy, Ecology, and Economy (DFGE)1
Q4 / FY 2020 Preliminary Results (unaudited) - Investor Presentation19
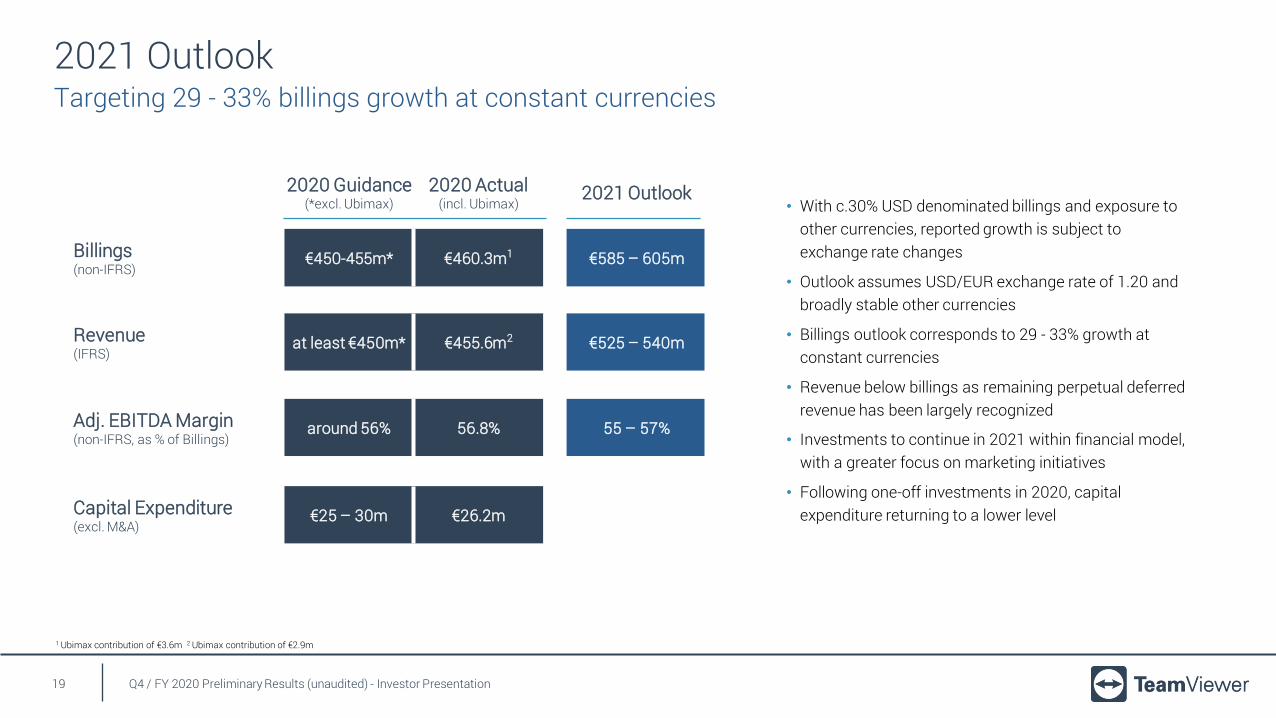
2021 Outlook
2020 Guidance(*excl. Ubimax)
2020 Actual(incl. Ubimax)
2021 Outlook
Billings(non-IFRS)
€450-455m* €460.3m1 €585 – 605m
Revenue(IFRS)
at least €450m* €455.6m2 €525 – 540m
Adj. EBITDA Margin(non-IFRS, as % of Billings)
around 56% 56.8% 55 – 57%
Capital Expenditure(excl. M&A)
€25 – 30m €26.2m
• With c.30% USD denominated billings and exposure to other currencies, reported growth is subject to exchange rate changes
• Outlook assumes USD/EUR exchange rate of 1.20 and broadly stable other currencies
• Billings outlook corresponds to 29 - 33% growth at constant currencies
• Revenue below billings as remaining perpetual deferred revenue has been largely recognized
• Investments to continue in 2021 within financial model, with a greater focus on marketing initiatives
• Following one-off investments in 2020, capital expenditure returning to a lower level
Targeting 29 - 33% billings growth at constant currencies
1 Ubimax contribution of €3.6m 2 Ubimax contribution of €2.9m

Q&A

Thank you for your attention!
10 - 11 Feb Roadshow, Virtual (J.P. Morgan)
09 - 10 Mar UBS Technology One-on-One Virtual Conference
25 Mar Annual Report
04 May Q1 2021 Results

Appendix

Q4 / FY 2020 Preliminary Results (unaudited) - Investor Presentation23
Further expansion of TeamViewer’s global footprint
145 198
254
384
85
66
94322
495
Inside Enterprise Channel Total
2019 2020 2019 2020 2019 2020 2019 2020
56 69 26 61 14 14 96 144
49 54 16 42 9 12 74 108
34 49 9 13 8 9 51 71
Total 139 172 51 116 31 35 221 323
2019 2020
Marketing
Sales1
841
1,256
Tech Support 54
R&D
G&A
+49%
+57%
+51%
+37%
+42%
+54%
FTEs per function year end 20203 vs. 2019
AMS
EMEA
APAC
Sales representatives (FTEs)2 per region 20203 vs. 2019
+46%
1Includes quota carriers, management and support functions 2Includes quota carriers and management 32020 FTE figures include Ubimax

Q4 / FY 2020 Preliminary Results (unaudited) - Investor Presentation24
Q4 2020 reconciliation from management key metrics to IFRS
€mManagement view
adjusted P&LDeferredrevenue D&A
Other non-IFRS adjustments
Accounting viewIFRS P&L
Billings / Revenue 128.1 (7.2) 121.0
Cost of sales (9.6) / (7.5% of Billings) (7.7) (0.2) (17.5) / (14.5% of Revenue)
Gross profit contribution 118.5 / (92.5% of Billings) 103.5 / (85.6% of Revenue)
Sales (16.7) / (13.0% of Billings) (1.4) (7.1) (25.1) / (20.8% of Revenue)
Marketing (9.3) / (7.3% of Billings) (0.4) (1.6) (11.2) / (9.3% of Revenue)
R&D (10.7) / (8.4% of Billings) (1.5) (3.2) (15.4) / (12.7% of Revenue)
G&A (7.1) / (5.5% of Billings) (0.5) (5.0) (12.6) / (10.4% of Revenue)
Other1 (2.7) / (2.1% of Billings) - 1.9 (0.8) / (0.7% of Revenue)
Adj. EBITDA 72.1/ (56.3% of Billings)
D&A (ordinary only)2 (4.6)2
Adj. EBIT / Operating profit (EBIT) 67.5 / (52.7% of Billings) (7.2) (6.8)3 (15.1) 38.3 / (31.7% of Revenue)
D&A (total) 11.5
EBITDA 49.8 / (41.2% of Revenue)
1incl. other income/expenses and bad debt expenses of €3.8m2D&A excl. amortization intangible assets from PPA3amortization intangible assets from PPA

Q4 / FY 2020 Preliminary Results (unaudited) - Investor Presentation25
FY 2020 reconciliation from management key metrics to IFRS
€mManagement view
adjusted P&LDeferredrevenue D&A
Other non-IFRS adjustments
Accounting viewIFRS P&L
Billings / Revenue 460.3 (4.7) 455.6
Cost of sales (35.9) / (7.8% of Billings) (27.6) (0.6) (64.1) / (14.1% of Revenue)
Gross profit contribution 424.4 / (92.2% of Billings) 391.5 / (85.9% of Revenue)
Sales (58.1) / (12.6% of Billings) (5.0) (14.6) (77.7) / (17.1% of Revenue)
Marketing (31.1) / (6.8% of Billings) (1.3) (6.0) (38.5) / (8.4% of Revenue)
R&D (34.8) / (7.6)% of Billings) (5.2) (6.6) (46.6) / (10.2% of Revenue)
G&A (26.1) / (5.7% of Billings) (2.0) (26.9) (55.0) / (12.1% of Revenue)
Other1 (12.8) / (2.8% of Billings) 3.1 (9.7) / (2.1% of Revenue)
Adj. EBITDA 261.5 / (56.8% of Billings)
D&A (ordinary only)2 (16.3)2
Adj. EBIT / Operating profit (EBIT) 245.2 / (53.3% of Billings) (4.7) (24.8) 3 (51.6) 164.0 / (36.0% of Revenue)
D&A (total) 41.1
EBITDA 205.1 / (45.0% of Revenue)
1incl. other income/expenses and bad debt expenses of €14.6m2D&A excl. amortization intangible assets from PPA3amortization intangible assets from PPA

Q4 / FY 2020 Preliminary Results (unaudited) - Investor Presentation26
• Perpetual deferred revenue now largely released with €2.7m remaining on balance sheet (see next page)
• Unallocated deferred revenue mainly consists of undue billings not recognized as receivables under IFRS 15
Non-IFRS adjustments in EBITDA
€m Q4 20 Q4 19 FY20 FY19
Billings 128.1 100.6 460.3 324.9
Perpetual def. revenueRelease / (Addition)
6.5 28.7 46.2 124.5
Subscription def. revenueRelease / (Addition)
(13.9) (21.3) (48.5) (56.7)
Unallocated def. revenueRelease / (Addition)
0.2 (1.1) (2.3) (2.6)
Revenue 121.0 106.9 455.6 390.2
€m Q4 20 Q4 19 FY 20 FY19
Total IFRS 2 charges (14.8) (9.7) (48.9) (36.8)
TeamViewer LTIP (0.6) - (1.6) -
Ubimax share consideration (7.2) - (10.5) -
Share-based compensation by TLO (6.9) (9.7) (36.8) (36.8)
Other material items (2.3) (5.1) (5.7) (21.0)
Financing, M&A, transaction-related (0.8) (0.0) (1.8) (0.6)
IPO related - (0.8) 0.0 (10.8)
Other (1.5) (4.2) (3.9) (9.6)
USD hedge valuation gain/loss 1.9 - 3.0 -
Total (15.1) (14.8) (51.6) (57.9)
• TeamViewer cash-settled LTIP includes executive and key employee grants
• Ubimax share consideration recognized under IFRS 2 due to vesting condition with respect to continued employment of management
• Share-based compensation by TigerLux One (TLO) are fully funded by the selling shareholder in the IPO
Deferred revenue adjustments Other non-IFRS adjustments

Q4 / FY 2020 Preliminary Results (unaudited) - Investor Presentation27
Deferred revenue development
€m Q4 20 Q4 19 FY 20 FY 19
Perpetual deferred revenue (BoP) 9.2 77.5 48.9 173.4
(–) Release 6.5 28.6 46.2 125.5
(+) Addition 0.0 0.0 0.0 1.0
Perpetual deferred revenue (EoP) 2.7 48.9 2.7 48.9
Subscription deferred revenue (BoP) 198.6 142.7 164.0 107.2
(–) Release 114.2 80.5 411.8 267.5
(+) Addition 128.1 101.8 460.3 324.3
Subscription deferred revenue (EoP) 212.5 164.0 212.5 164.0
Total deferred revenue (BoP) 207.8 220.2 212.8 280.6
(–) Release 120.8 109.1 458.1 393.1
(+) Addition 128.1 101.7 460.4 325.3
Total deferred revenue (EoP) 215.1 212.8 215.1 212.8
Q4 / FY 2020 Preliminary Results (unaudited) - Investor Presentation28
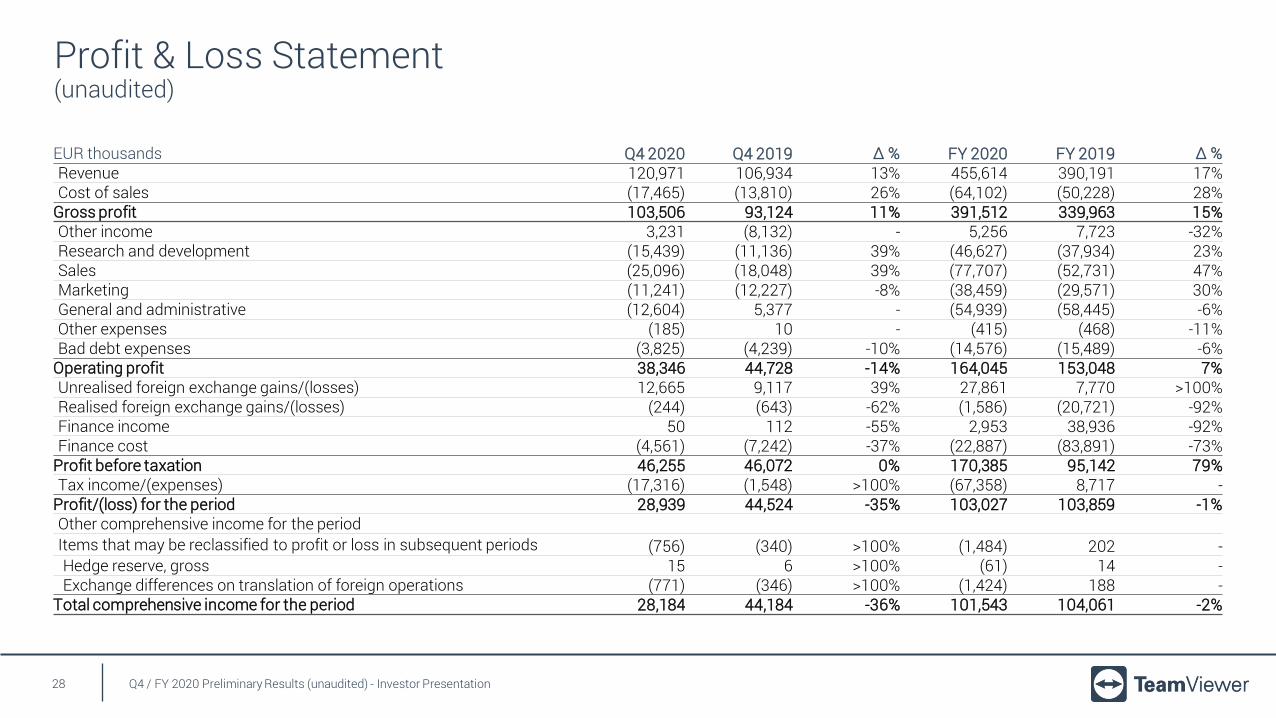
EUR thousands Q4 2020 Q4 2019 ∆ % FY 2020 FY 2019 ∆ % Revenue 120,971 106,934 13% 455,614 390,191 17%Cost of sales (17,465) (13,810) 26% (64,102) (50,228) 28%
Gross profit 103,506 93,124 11% 391,512 339,963 15%Other income 3,231 (8,132) - 5,256 7,723 -32%Research and development (15,439) (11,136) 39% (46,627) (37,934) 23%Sales (25,096) (18,048) 39% (77,707) (52,731) 47%Marketing (11,241) (12,227) -8% (38,459) (29,571) 30%General and administrative (12,604) 5,377 - (54,939) (58,445) -6%Other expenses (185) 10 - (415) (468) -11%Bad debt expenses (3,825) (4,239) -10% (14,576) (15,489) -6%
Operating profit 38,346 44,728 -14% 164,045 153,048 7%Unrealised foreign exchange gains/(losses) 12,665 9,117 39% 27,861 7,770 >100%Realised foreign exchange gains/(losses) (244) (643) -62% (1,586) (20,721) -92%Finance income 50 112 -55% 2,953 38,936 -92%Finance cost (4,561) (7,242) -37% (22,887) (83,891) -73%
Profit before taxation 46,255 46,072 0% 170,385 95,142 79%Tax income/(expenses) (17,316) (1,548) >100% (67,358) 8,717 -
Profit/(loss) for the period 28,939 44,524 -35% 103,027 103,859 -1%Other comprehensive income for the periodItems that may be reclassified to profit or loss in subsequent periods (756) (340) >100% (1,484) 202 -Hedge reserve, gross 15 6 >100% (61) 14 -Exchange differences on translation of foreign operations (771) (346) >100% (1,424) 188 -
Total comprehensive income for the period 28,184 44,184 -36% 101,543 104,061 -2%
Profit & Loss Statement(unaudited)

Q4 / FY 2020 Preliminary Results (unaudited) - Investor Presentation29
EUR thousands 31 December 2020 31 December 2019Non-current assetsGoodwill 646,793 590,445Intangible assets 255,330 235,831Property, plant and equipment 40,469 26,480Financial assets 4,516 4,424Other assets 857 1,740Deferred tax assets 159 6,266
Total non-current assets 948,124 865,187Current assetsTrade receivables 19,667 11,756Other assets 7,594 5,856Tax assets 52 4,972Financial assets 4,456 0Cash and cash equivalents 83,531 71,153
Total current assets 115,301 93,737Total assets 1,063,425 958,924
Balance Sheet(unaudited)

Q4 / FY 2020 Preliminary Results (unaudited) - Investor Presentation30
EUR thousands 31 December 2020 31 December 2019EquityIssued capital 201,071 200,000Capital reserve 366,898 320,661(Accumulated losses)/retained earnings (326,854) (429,881)Hedge reserve (61) 0Foreign currency translation reserve (343) 1,081
Total equity attributable to owners of the parent 240,711 91,861Non-current liabilitiesProvisions 433 235Financial liabilities 440,153 582,538Deferred revenue 361 2,572Deferred and other liabilities 1,614 0Deferred tax liabilities 29,186 308
Total non-current liabilities 471,747 585,652Current liabilitiesProvisions 2,225 3,284Financial liabilities 82,099 34,260Trade payables 8,304 9,069Deferred revenue 214,811 210,250Deferred and other liabilities 39,120 17,793Other financial liabilities 29 6,642Tax liabilities 4,378 114
Total current liabilities 350,966 281,411Total liabilities 822,714 867,063
Total equity and liabilities 1,063,425 958,924
Balance Sheet (cont’d)(unaudited)

Q4 / FY 2020 Preliminary Results (unaudited) - Investor Presentation31
EUR thousands Q4 2020 Q4 2019 FY 2020 FY 2019Cash flows from operating activities
Profit before taxation 46,255 46,072 170,385 95,142Depreciation, amortisation and impairment of non-current assets 11,455 9,346 41,096 36,442(Gain)/loss from the sale of property, plant and equipment (285) 13 (278) (5)Increase/(decrease) in provisions 890 1,501 753 2,170Non-operational foreign exchange (gains)/losses (13,199) (9,450) (30,541) 10,869
Expenses for share-based compensation - equity settled 14,115 9,742 47,308 36,830Net financial result 4,511 7,130 19,935 44,955Change in deferred revenue 7,349 (6,564) 2,233 (67,814)Changes in other net working capital and other 1,799 4,766 7,063 2,899Income tax paid (8,711) (2,633) (33,417) (17,879)
Net cash from operating activities 64,179 59,923 224,536 143,610Cash flows from investing activities
Capital expenditure for property, plant and equipment and intangible assets (3,387) (8,789) (26,168) (16,551)Proceeds from the sale of property, plant and equipment 0 (18) 23 0Payments for the acquisition of non-current financial assets 0 (4,326) (51) (4,326)Acquisition of subsidiaries 0 0 (84,053) 0
Net cash used in investing activities (3,387) (13,134) (110,249) (20,877)
Cash Flow Statement(unaudited)

Q4 / FY 2020 Preliminary Results (unaudited) - Investor Presentation32
EUR thousands Q4 2020 Q4 2019 FY 2020 FY 2019Cash flows from financing activities
Repayments of borrowings (23,845) (517,260) (62,832) (696,373)Proceeds from bank borrowings 0 536,296 0 610,313
Payments for the capital element of lease liabilities (1,505) 3 (4,863) (3,836)
Interest paid for borrowings and lease liabilities (3,234) (19,596) (28,071) (46,100)Proceeds/(payments) from the settlement of derivatives 0 (33) 0 (131)Proceeds/(payments) in equity 0 0 0 25
Net cash used in financing activities (28,584) (590) (95,766) (136,102)
Net change in cash and cash equivalents 32,209 46,199 18,521 (13,369)Net foreign exchange rate difference (1,468) (1,646) (6,082) 0Net change from cash risk provisioning (179) (99) (61) 815Internal combinations and transfers 0 0 0 3,768Cash and cash equivalents at beginning of period 52,969 26,698 71,153 79,939
Cash and cash equivalents at end of period 83,531 71,153 83,531 71,153
Cash Flow Statement (cont’d)(unaudited)