
Team Members: Iclal Sincer John Asafu-Adjaye Tien Pham · GTAP Training Project. Removal of Output...
22
GTAP Training Project Removal of Output Protection on North America Grains and Impacts on World Food Production Team Members: Iclal Sincer John Asafu-Adjaye Tien Pham
Transcript of Team Members: Iclal Sincer John Asafu-Adjaye Tien Pham · GTAP Training Project. Removal of Output...

GTAP Training Project
Removal of Output Protection on North America Grains and Impacts on World Food Production
Team Members:
Iclal Sincer
John Asafu-Adjaye
Tien Pham

MOTIVATION
• North America has protection on Grains

MOTIVATION (Cont’d)North America Grains export to ROW and Other Asia is large.
0
0.05
0.1
0.15
0.2
0.25
0.3
0.35
0.4
NAmerica WEurope CHN_TWN OthAsia ROW
Shar
e (%
)
Composition of Grain Exports from NAmerica to the World
• Grains output is an important input in Food Production.• Any changes to output protection of Grains in North America is likely to have impacts on Food Production in ROW and Other Asia regions.

MOTIVATION (Cont’d)
Our Project aims to quantify:Impacts of changes to output protection of Grains production in North America on World Food Production
Our technical purpose in this project:Simple Shock in order to understand GDyn mechanism
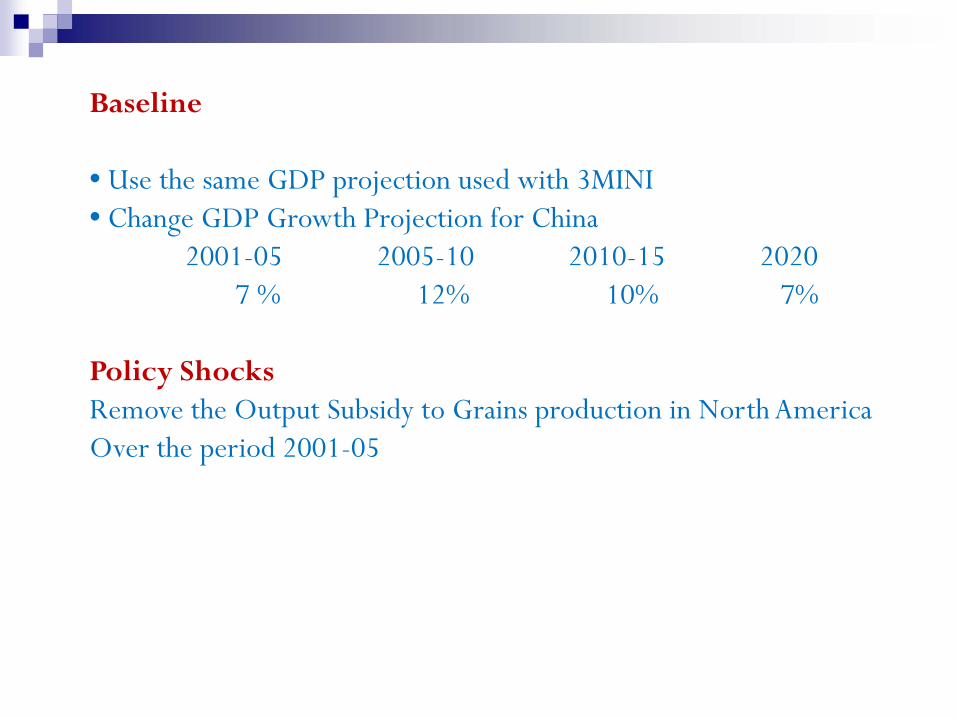
Baseline
• Use the same GDP projection used with 3MINI • Change GDP Growth Projection for China
2001-05 2005-10 2010-15 20207 % 12% 10% 7%
Policy ShocksRemove the Output Subsidy to Grains production in North AmericaOver the period 2001-05

Background
ps
pm
S1
S0
D
(all,i,PROD_COMM)(all,r,REG)ps(i,r) = to(i,r) + pm(i,r);
(all,i,PROD_COMM)(all,r,REG)pm(i,r) = ps(i,r) - to(i,r) ;
Note: our policy shock to(”Grains”, ”Namerica”) = -7.37096071

Results
-20
-15
-10
-5
0
5
10
1 2 3 4
Deviation results on Grains in North America
pm qxs qo
Results for Grains in North America over time (percentage point change)bs1b‐br1r‐2005 bs1b‐br1r‐2010 bs1b‐br1r‐2015 bs1b‐br1r‐2020
pm 6.0013 5.6297 5.4053 5.2823qxs ‐17.64 ‐16.87 ‐16.44 ‐16.26qo ‐6.57 ‐6.16 ‐5.75 ‐5.36

Results
pfe[*grains*] 2001‐05 2005‐10 2010‐15 2015‐20Land ‐10.48 ‐10.61 ‐10.47 ‐10.20UnSkLab ‐0.03 ‐0.03 ‐0.02 ‐0.02SkLab ‐0.02 ‐0.01 ‐0.01 ‐0.01Capital ‐0.03 ‐0.02 ‐0.01 ‐0.01NatRes ‐27.15 ‐26.18 ‐25.07 ‐23.92
qfe[*grains*] 2001‐05 2005‐10 2010‐15 2015‐20Land ‐4.8 ‐4.5 ‐4.5 ‐4.5UnSkLab ‐7.3 ‐7.0 ‐7.0 ‐7.0SkLab ‐7.3 ‐7.0 ‐7.0 ‐7.0Capital ‐7.3 ‐7.0 ‐7.0 ‐7.0NatRes 0.0 0.0 0.0 0.0
Results
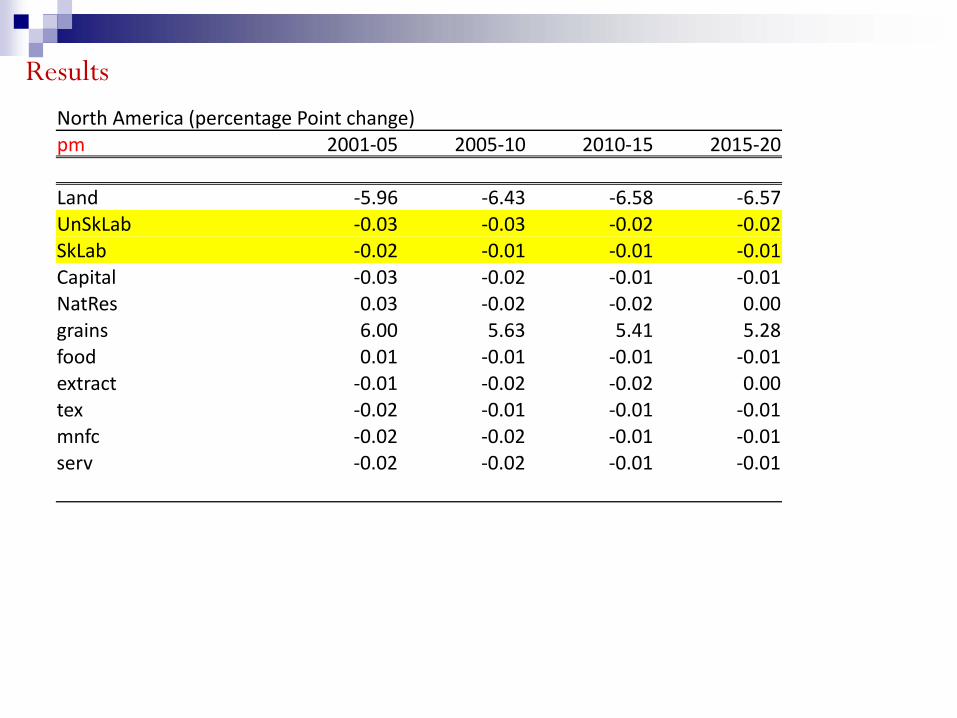
North America (percentage Point change)pm 2001‐05 2005‐10 2010‐15 2015‐20
Land ‐5.96 ‐6.43 ‐6.58 ‐6.57UnSkLab ‐0.03 ‐0.03 ‐0.02 ‐0.02SkLab ‐0.02 ‐0.01 ‐0.01 ‐0.01Capital ‐0.03 ‐0.02 ‐0.01 ‐0.01NatRes 0.03 ‐0.02 ‐0.02 0.00grains 6.00 5.63 5.41 5.28food 0.01 ‐0.01 ‐0.01 ‐0.01extract ‐0.01 ‐0.02 ‐0.02 0.00tex ‐0.02 ‐0.01 ‐0.01 ‐0.01mnfc ‐0.02 ‐0.02 ‐0.01 ‐0.01serv ‐0.02 ‐0.02 ‐0.01 ‐0.01
Results
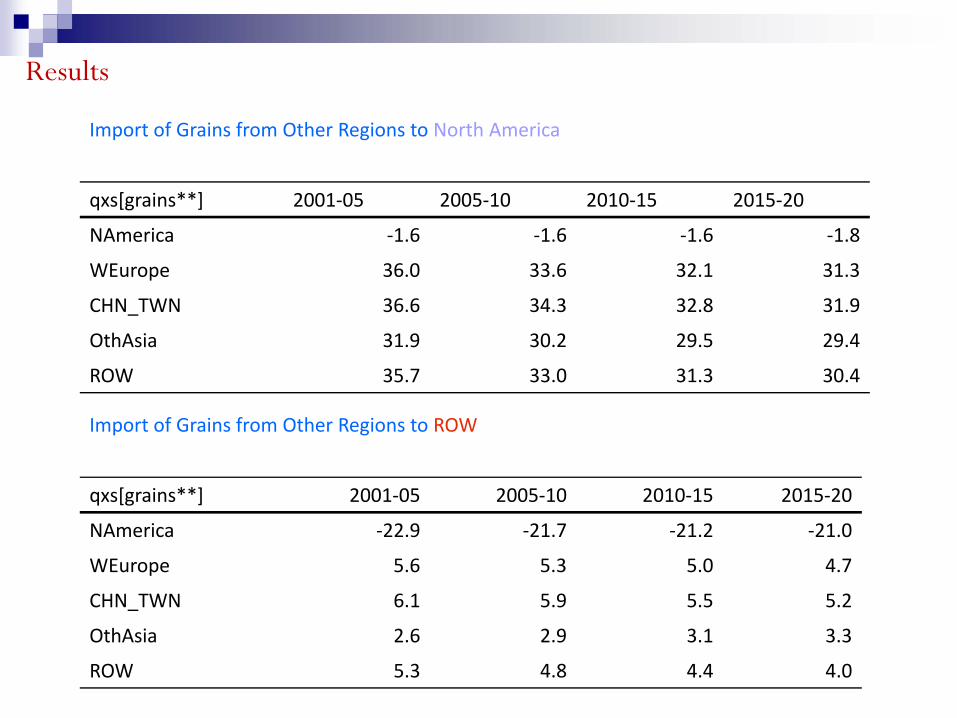
Import of Grains from Other Regions to North America
qxs[grains**] 2001‐05 2005‐10 2010‐15 2015‐20
NAmerica ‐1.6 ‐1.6 ‐1.6 ‐1.8
WEurope 36.0 33.6 32.1 31.3
CHN_TWN 36.6 34.3 32.8 31.9
OthAsia 31.9 30.2 29.5 29.4
ROW 35.7 33.0 31.3 30.4
Import of Grains from Other Regions to ROW
qxs[grains**] 2001‐05 2005‐10 2010‐15 2015‐20
NAmerica ‐22.9 ‐21.7 ‐21.2 ‐21.0
WEurope 5.6 5.3 5.0 4.7
CHN_TWN 6.1 5.9 5.5 5.2
OthAsia 2.6 2.9 3.1 3.3
ROW 5.3 4.8 4.4 4.0

Results
Import of Food from Other Regions to North America
qxs[food**] 2001‐05 2005‐10 2010‐15 2015‐20
NAmerica 0.15 0.16 0.14 0.12
WEurope ‐0.07 ‐0.11 ‐0.11 ‐0.10
CHN_TWN ‐0.14 ‐0.15 ‐0.15 ‐0.11
OthAsia ‐0.77 ‐0.68 ‐0.56 ‐0.41
ROW ‐0.34 ‐0.38 ‐0.38 ‐0.34
Import of Food from Other Regions to ROW
qxs[food**] 2001‐05 2005‐10 2010‐15 2015‐20
NAmerica 0.43 0.47 0.45 0.39
WEurope 0.21 0.21 0.20 0.18
CHN_TWN 0.15 0.17 0.17 0.17
OthAsia ‐0.45 ‐0.34 ‐0.23 ‐0.12
ROW ‐0.06 ‐0.07 ‐0.08 ‐0.07

ResultsOutput changes of Grains by regions over time
qo[grains*] 2001‐05 2005‐10 2010‐15 2015‐20
NAmerica ‐6.6 ‐6.2 ‐5.7 ‐5.4
WEurope 1.8 1.7 1.6 1.6
CHN_TWN 0.8 0.6 0.5 0.4
OthAsia 1.6 1.4 1.2 1.0
ROW 1.1 1.0 0.9 0.8
Output changes of Food by regions over time
qo[Food*] 2001‐05 2005‐10 2010‐15 2015‐20
NAmerica 0.03 0.04 0.05 0.04
WEurope 0.02 0.02 0.02 0.01
CHN_TWN ‐0.01 0.00 0.00 0.00
OthAsia ‐0.14 ‐0.12 ‐0.09 ‐0.06
ROW ‐0.03 ‐0.03 ‐0.04 ‐0.03

Results
Income 2001‐05 2005‐10 2010‐15 2015‐20
NAmerica ‐0.008 ‐0.005 ‐0.002 ‐0.001
WEurope 0.011 0.008 0.005 0.004
CHN_TWN 0.019 0.016 0.014 0.010
OthAsia 0.007 0.006 0.006 0.006
ROW 0.044 0.038 0.032 0.028
HH Final Consumption, Saving and Government Final Consumption
CD technology
Thus values of HH, SAV, GOV move in line with income decrease in North America.
As a results, aggregate of imports also declines in North America, and declinesmore than the reduction in Export from North America Trade Balance improvesslightly.
Overall, nominal GDP in North America declines.

Results
Nominal GDP vgdp 2001‐05 2005‐10 2010‐15 2015‐20
NAmerica ‐0.01 ‐0.01 ‐0.01 ‐0.01
WEurope 0.01 0.01 0.01 0.01
CHN_TWN 0.02 0.01 0.02 0.01
OthAsia 0.01 0.01 0.01 0.01
ROW 0.04 0.04 0.03 0.03
Real GDPqgdp 2001‐05 2005‐10 2010‐15 2015‐20
NAmerica 0.0045 0.0038 0.003 0.0024
WEurope ‐0.0017 0.0005 0.0014 0.0014
CHN_TWN ‐0.0031 ‐0.003 ‐0.001 0.0014
OthAsia ‐0.0097 ‐0.0087 ‐0.0075 ‐0.0058
ROW ‐0.004 ‐0.0012 0.0016 0.0038

Results
GDP price indexpgdp 2001‐05 2005‐10 2010‐15 2015‐20
NAmerica ‐0.0155 ‐0.0128 ‐0.0101 ‐0.0089
WEurope 0.0151 0.0104 0.0068 0.0049
CHN_TWN 0.0204 0.0179 0.016 0.0111
OthAsia 0.0167 0.0147 0.0134 0.0117
ROW 0.0469 0.0399 0.0332 0.027
Consumer Price Indexppriv 2001‐05 2005‐10 2010‐15 2015‐20
NAmerica ‐0.0155 ‐0.0131 ‐0.0105 ‐0.009
WEurope 0.0174 0.0127 0.0093 0.0074
CHN_TWN 0.0364 0.0298 0.0255 0.0203
OthAsia 0.0318 0.0271 0.0235 0.0197
ROW 0.0591 0.0529 0.0469 0.0402

Results
Impacts of the removal of Grains protection in North America on ROW and Other Asian countries
qo[Food*] 2001‐05 2005‐10 2010‐15 2015‐20
NAmerica 0.03 0.04 0.05 0.04
WEurope 0.02 0.02 0.02 0.01
CHN_TWN ‐0.01 0.00 0.00 0.00
OthAsia ‐0.14 ‐0.12 ‐0.09 ‐0.06
ROW ‐0.03 ‐0.03 ‐0.04 ‐0.03
Efficiency gain in North America is at the expense of ROW and Other Asian country regions
• Lower level of Food supply from domestic source• Higher prices

Results – Investment
-0.035
-0.03
-0.025
-0.02
-0.015
-0.01
-0.005
02005 2010 2015 2020
Evolution of pcgds, qcgds, and qk relative to baseline
pcgdsqcgdsqk

Results – Investment (Cont’d)
-0.009
-0.008
-0.007
-0.006
-0.005
-0.004
-0.003
-0.002
-0.001
02005 2010 2015 2020
Rates of return for NAmerica
rorgerorga

Results -Welfare
-20000
-15000
-10000
-5000
0
5000
10000
15000
20000
25000
NAmerica WEurope CHN_TWN OthAsia ROW
Welfare Changes

Conclusion
Impacts of the removal of Grains protection in North America on ROW and Other Asian countries:
Efficiency gain in North America is at the expense of ROW and OthAsia regions
• Lower level of Food supply from domestic source • Higher prices
but
Welfare improves in the ROW, particular in FOOD sector.How can we communicate with policy makers?
Over to you ………

Many thanks to GTAP staff for the training
Nice to meet you all here
Look forward to meeting you again.
Have a safe trip home.

Conclusions
CVXWD 1 NAmerica 2 WEurope 3 CHN_TWN 4 OthAsia 5 ROW Total1 NAmerica 0.197 0.054 0.079 0.28 0.391 12 WEurope 0.013 0.682 0.007 0.006 0.291 13 CHN_TWN 0.006 0.019 0.003 0.923 0.049 14 OthAsia 0.005 0.026 0.01 0.886 0.074 15 ROW 0.023 0.127 0.026 0.191 0.632 1
CVXWD 1 NAmerica 2 WEurope 3 CHN_TWN 4 OthAsia 5 ROW Total1 NAmerica 0.417 0.121 0.068 0.247 0.147 12 WEurope 0.069 0.73 0.011 0.05 0.141 13 CHN_TWN 0.123 0.133 0.013 0.601 0.13 14 OthAsia 0.169 0.138 0.1 0.402 0.191 15 ROW 0.141 0.327 0.05 0.144 0.338 1


![[pastel-00739959, v1] Des réactions multicomposants ...ucp.ensta-paristech.fr/DOC/theses/Pravin.pdf · I would like to take some time to express my sincer e thanks to Dr. Srinivas](https://static.fdocuments.us/doc/165x107/5ab096337f8b9a6b468b74cc/pastel-00739959-v1-des-ractions-multicomposants-ucpensta-would-like-to-take.jpg)