Team H Hasbro, Inc. - smf.business.uconn.edu · owns a broad portfolio of toys, games and...
38
Methodology Weight Price DCF 90% 107.13 $ EV/EBITDA 10% 103.61 $ Current Price 92.45 $ 1 Year Target Price 106.78 $ Upside Return 15.50% 2018 Dividend $2.52 Dividend Yield 2.36% Total Return 18.22% Valuation Date JAN 12th, 2018 Hasbro, Inc. DATE: January 12 th ,2018 TICKER: HAS RECOMMENDATION: BUY CURRENT PRICE: $92.45 TARGET PRICE: $107 INDUSTRY: Toys & Games EXECUTIVE SUMMARY: Hasbro is a multinational conglomerate, which owns a broad portfolio of toys, games and entertainment & license, including Nerf, Monopoly, Transformers, and My Little Pony, and consistently aims to create the world’s best play experience. Figure 1 Source: Bloomberg Figure 2 Source: Team Analysis Figure 3 Source: Team Analysis, Bloomberg Figure 5 Source: Team Analysis, Bloomberg Figure 4 1 Year Target Price Source: Bloomberg Better and worse case rage Closing Price Avg. Daliy Vol (mm) Shares O/S (mm) Market Cap ($mm) P/E Enterprise Value($mm) Market Date JAN 12th, 2018 $92.45 1.3 125 11,515 19.8x 13,556 1 HIGHLIGHTS Our recommendation is BUY with a 1-year target price of $107 per share, representing 18% total upside from the $92.45 closing price on January 12 th , 2018. Our valuation is based on a 90/10 mix of the Discounted Cash Flow Valuation and EV/EBITDA Comparable Valuation. Business Projections • Successful storytelling, primarily through movies, will continue to enhance sales. • Hasbro will maintain partnerships with major Intellectual Property (IP) owners such as Disney and Marvel and strengthen its market position by acquiring additional popular IPs. • Major markets will continue to grow for the next 7 years with YOY growth rates from 2.46% in 2018 to 0.94% in 2024. • By expanding global markets, Hasbro will execute its storytelling strategy through a broader base and will increase its sales accordingly. • Product diversification and brand awareness will help Hasbro maintain a sustainable business. Solid Fundamentals • High operating margins and EBITDA margin indicate effective corporate management and healthy operations. • High dividend growth rate shows confidence in Hasbro’s financial status and its willingness to reward its shareholders. We expect dividends to continue to grow at an average of 10% YOY for the next 7 years. • High EPS and ROE demonstrate Hasbro’s strong potential as a investment. Hasbro Future Price Forecast Fundamentals Industry Median Hasbro Investment Grade Business Investment Grade Revenue Growth 8% 7% Medium Storytelling Skill High Dividend Growth Rate 9% 12% High Corporate Strategy Medium EPS 1.61 4.64 High Product Diversification High Operating Magrin 10% 15% High Brand Awareness High EBITDA Margin 15% 18% High Management Team High ROE 20% 27% High IPs Maintenance High P/E 24.2 19.8 High Market Growth Medium Dividend Yield 2% 2.45% Medium Supply Chain Management Low Team H
Transcript of Team H Hasbro, Inc. - smf.business.uconn.edu · owns a broad portfolio of toys, games and...

Methodology Weight Price
DCF 90 10713$
EVEBITDA 10 10361$
Current Price 9245$
1 Year Target Price 10678$
Upside Return 1550
2018 Dividend $252
Dividend Yield 236
Total Return 1822
Valuation Date JAN 12th 2018
Hasbro IncDATE January 12th 2018 TICKER HAS RECOMMENDATION BUYCURRENT PRICE $9245 TARGET PRICE $107 INDUSTRY Toys amp Games
EXECUTIVE SUMMARY Hasbro is a multinational conglomerate whichowns a broad portfolio of toys games and entertainment amp licenseincluding Nerf Monopoly Transformers and My Little Pony andconsistently aims to create the worldrsquos best play experience
Figure 1
Source Bloomberg
Figure 2
Source Team Analysis
Figure 3
Source Team Analysis Bloomberg
Figure 5
Source Team Analysis Bloomberg
Figure 4
1 Year Target Price
Source Bloomberg
Better and worse case rage
Closing Price
Avg Daliy Vol (mm)
Shares OS (mm)
Market Cap ($mm)
PE
Enterprise Value($mm)
Market Date JAN 12th 2018
$9245
13
125
11515
198x
13556
1
HIGHLIGHTSOur recommendation is BUY with a 1-year target price of $107 per sharerepresenting 18 total upside from the $9245 closing price on January12th 2018 Our valuation is based on a 9010 mix of the Discounted CashFlow Valuation and EVEBITDA Comparable ValuationBusiness Projectionsbull Successful storytelling primarily through movies will continue to
enhance salesbull Hasbro will maintain partnerships with major Intellectual Property (IP)
owners such as Disney and Marvel and strengthen its market position byacquiring additional popular IPs
bull Major markets will continue to grow for the next 7 years with YOYgrowth rates from 246 in 2018 to 094 in 2024
bull By expanding global markets Hasbro will execute its storytelling strategythrough a broader base and will increase its sales accordingly
bull Product diversification and brand awareness will help Hasbro maintain asustainable business
Solid Fundamentalsbull High operating margins and EBITDA margin indicate effective corporate
management and healthy operationsbull High dividend growth rate shows confidence in Hasbrorsquos financial status
and its willingness to reward its shareholders We expect dividends tocontinue to grow at an average of 10 YOY for the next 7 years
bull High EPS and ROE demonstrate Hasbrorsquos strong potential as a investment
Hasbro Future Price Forecast
Fundamentals Industry Median Hasbro Investment Grade Business Investment Grade
Revenue Growth 8 7 Medium Storytelling Skill High
Dividend Growth Rate 9 12 High Corporate Strategy Medium
EPS 161 464 High Product Diversification High
Operating Magrin 10 15 High Brand Awareness High
EBITDA Margin 15 18 High Management Team High
ROE 20 27 High IPs Maintenance High
PE 242 198 High Market Growth Medium
Dividend Yield 2 245 Medium Supply Chain Management Low
Team H
BUSINESS DESCRIPTIONHasbro is a worldwide leader in childrens and familiesrsquo leisuretime entertainment products and services Hasbro is not limited to justgames it covers all types of entertainment ranging from toys and gamesto television movies and digital gaming Based on Franchise Brands andPartner Brands Hasbro offers a set of options covering a wide range ofaudiences including Nerf My Little Pony Transformers Play-DohMonopoly Magic The Gathering Marvel and Disney Princesses Withthe help of the Hasbro Studio and Allspark Pictures its self-financingco-financing film unit and Discovery Communications Hasbro deliversstorytelling products Through its high-standard of Corporate SocialResponsibility and philanthropic commitment Hasbro has devoted tomaking the world a better place for children and familiesHasbrorsquos international operations contributed 49 of net revenues in2016 growing from 39 in 2010 (Figure 7) In recent years the companyhas expanded its operations in the emerging markets of China RussiaBrazil Peru Colombia South Korea Romania and the Czech Republic
CORPORATE STRATEGYStorytellingHasbro supports its brands with storytelling leveraging and integratingtheir products with synergy and value created by stories In additionHasbro takes advantage of all the available platforms and mediaproviding a variety of digital experiences music publishing location-based entertainment and an impressive array of consumer productswithin a broad range of diverse categories For example after scanningthe barcode of My Little Pony consumer has the opportunity to interactwith digital forms of traditional games
Brand BlueprintSince 2009 Hasbro has applied Brand Blueprint as its core strategyHasbro gleans consumer insights and tells stories through immersiveentertainment experiences such as movies and TV series which becomean effective way of extending toy life cycles strengthening consumerloyalties and elevating brand awareness Then Hasbro uses its omni-channel retail partners to sell toys worldwide Moreover Hasbroacquired Backflip Studios in 2013 and created digital games from itsfranchise characters such as Transformers to leverage the digitizedtrend and capitalize on the opportunity integrating technologythroughout the engagement cycle
Expanding Our AudienceExpanding Our Audience serves as another core strategy Hasbrofocuses on ldquogrowing share of liferdquo by using different methods such asTV games music and theme parks to influence and expand its loyaltybase for all ages Through this strategy the company formed its ownunique culture which could be passed from generation to generation
CORPORATE MANAGEMENTThe Hasbro executive management team consists of 9 professionals(Figure 9) with an average of 8 years left on their contracts Eachexecutive has an average of 20 years experience within the company(See Appendix 28) Brian D Goldner the Chairman and CEO is the onlyexecutive serving on the board which suggests board independenceThe President has less than one year left on his contract Based on thehistory of the roles in Hasbrorsquos management team considering the priortwo CEOs both came from inside the company we do not anticipatemajor changes in the near future Approximately 45 of thecompensation of the top management team comes from stock andoptions (figure 10) offering incentive for better stock performance inthe future
Figure 6
Source Bloomberg
Figure 7
Source Bloomberg
Figure 8
Source Original
Figure 9
Figure 10
Source Bloomberg
Source Bloomberg
2
Brian D Goldner Chairman CEO
John A Frascotti President
Deborah M Thomas Executive VP CFO
Wiebe Tinga Executive VP CMO
Rudolph Johnson Executive VP CHO
Barbara Finigan Executive VP CLO
Duncan J Billing Executive VP CSO
Tom Courtney Executive VPGlobal Operations
Stephen Davis Executive VPCCO
Executive Officers
INDUSTRY OVERVIEWSGeneral TrendIn major markets that Hasbro covers traditional toys amp games had amarket size of $5509 billion in 2016 with a projection of $6310 billionin 2021 equivalent to a 275 YOY growth The total toys amp gamesindustry was $12676 billion in 2016 which is anticipated to expand to$16248 billion in 2021 509 YOY growth (Figure 13) The highergrowth is ascribed to the fast-developing digital games with a YOYgrowth of 675 from 2016 to 2021 We anticipate the traditional toysand games industry will continue to expand but the digital trend willgrow at a faster pace As the absolute leader in industry Hasbro is in astrong position to take advantage of the expansion in traditional toysand games (See Appendix 13)Consumer BehaviorWe focused on the US market since it generated 51 of Hasbrorsquosrevenue in 2016 Based on the Consumer Expenditure Survey from theBureau of Labor Statistics (Figure 14) the percentage of toyconsumption over annual expenditures falls in the range of 011 to035 among different age segments Although it represents a smallpercentage of personal income it indicates a steady growth in majorpopulation groups (population ages 25-34 and 35-44) Married coupleswith children from ages 0 to 17 the major consumers in the industryshowed an annual average spending of $385 in 2016 (Figure 15) Weexpect the future expenditure in toys will grow slightly along with anincrease in personal income especially with Hasbrorsquos Expanding OurAudience strategy which should help the company win a broaderaudience
CORPORATE GOVERNANCEHasbro has a Board of Directors of 12 members (Figure 11) in 5 differentcommittees Audit Compensation Executive Finance and GovernanceNominating amp Social Responsibility three more members than itscompetitor Mattel representing a more diversified and comprehensiveoutlook
$0
$50
$100
$150
$200
$250
Under 25years
25-34years
35-44years
45-54years
55-64years
65 yearsand older
65-74years
75 yearsand older
Spending on Toys Hobbies amp Playground Equipment
2013
2014
2015
2016
SHAREHOLDER STRUCTUREHasbro has 12456 million shares of common stock outstanding of whichInstitutional investors own 95 The top 5 holders are Vanguard Group(1044) BlackRock (864) Alan G Hassenfeld (665) Capital GroupCompany (496) and State Street Corp (386) Alan G Hassenfeldthe third biggest shareholder is the former chairman and current boardmember of Hasbro and the share under his name represents more thanhis personal holding According to Hasbro DEF 14A filed on April 4th2017 3844 of the holding belonged to Hassenfeld Family InitiativesLLC 52 holding was under Mr Hassenfeldrsquos name and 85 belongs toHasenfeld Foundation The shareholder structure is diversified with noshareholder holding more than 105 Although the insider holding(Figure 12) is higher compared with its competitor Mattel the trend hasbeen decreasing for the past few years (See appendix 23)SOCIAL RESPONSIBILITYHasbro aims to make safe toys to protect their workersrsquo rights andsafety to ensure materials are ethically sourced and to maintainenvironmental sustainability In 2016 Hasbro achieved 100 use ofrenewable energy realized carbon neutrality and launched sustainablepackaging principles Hasbro also works closely with regulatory bodies toprovide safer products For eight years Hasbro has not had a singleproduct recall In addition Hasbro provides a series of compliancetrainings to more than 5000 employees to help their employeesunderstand their rights In 2016 with volunteer service from employeesHasbro impacted 38 million children through its charitable programsand helped more than 225000 youths together with generationOn
$
$50
$100
$150
$200
$250
$300
$350
$400
$450
$500
Marriedcouple
only
Marriedcoupleoldestchild
under 6
Marriedcoupleoldestchild
6 to 17
Marriedcoupleoldest
child 18or older
Othermarriedcouple
Oneparentat least
one childunder 18
Singleperson
and otherconsumer
units
Spending by Composition of Consumer Unit
2013
2014
2015
2016
Figure 12
Source Bloomberg
Figure 11
Source Bloomberg
Figure 13
Source NPD
Source Bureau of Labor Statistics
Source Bureau of Labor Statistics
Figure 14
Figure 15
0
50000
100000
150000
200000
2010 2011 2012 2013 2014 2015 2016 2017 2018 2019 2020 2021
Total Toys amp Games Market Size
Traditional Toys and Games Video Games
3
Brian D Goldner Edward M Philip
Kenneth A Bronfin Linda K Zecher
Tracy A Leinbach Michael Burns
Alan G Hassenfeld Crispin H L Davis
Lisa Gersh Mary Beth Stone West
Richard S Stoddart Hope F Cochran
Board of Directors
-600
-400
-200
000
200
400
1990 1993 1996 1999 2002 2005 2008 2011 2014
Growth of Population from Age 0 to 14
United States European Union
Russian Federation China
Brazil
25
16
22
17
26
29
15
00
05
10
15
20
25
30
35
2010 2011 2012 2013 2014 2015 2016 2017 2018 2019
The US GDP Forecast
the US GDP Growth GDP Forecast from Federal Reserve
GDP Forecast from World Bank GDP Forecast from IMF
-10
-5
0
5
10
15
GDP Growth of Major International Markets
European Union Russian Federation
China Mexico
Brazil
0
5
10
15
20
25
0
1
2
3
4
5
6
7
8
9
Exchange Rate
Euro UK Pound
Canadian Dollar Hong Kong Dollar
Chinese Yuan Brazilian Real
Mexican Peso (RHS)
Figure 16
Source World Bank
Figure 17
Source Federal Reserve World Bank IMF
Figure 18
Source World Bank
Figure 19
Source Federal Reserve 4
Demographic ShiftEmerging markets have enjoyed more robust growth in 0-14 years oldpopulation (Figure 16) Even though majority of birth rates decreasedexcept for that in Russia population growth represents an opportunity forHasbro to grow its revenue Take China as an example due to the impactof the one-child policy the population between age 0-14 years olddecreased drastically in the 90s However after the termination of thepolicy the population from age 0-14 gradually increased With a higherpopulation of target customers in these markets the toys and gamesindustry should achieve more growth
International EconomyThe European economy has been stable for the past few years with aslight decrease recently With Brexit a bigger decrease is expected in thefuture The Russian economy has been suffering from the sagging crudeoil prices Combined with sanctions and the falling rubble the economyworsened further Latin America is facing corruption unremittingviolence and instabilities in its political system With three presidentialelections on the horizon in most the populous countries ColombiaMexico and Brazil in 2018 the future economy may become morevolatile The Chinese economy has been accelerating for a decade but itmay fall into the middle-income trap (Figure 18) We do not anticipate thiswill have an immediate effect but perhaps a more slowed growth in theChinese economy
Volatile Performance in Different BrandsEven though people have become more reliant on digital devices thedemand for traditional games and puzzles grew a 12 growth in 2016showing increased demand for face-to-face play experience (SeeAppendix 13) Although we predicted the revenue of the whole brandsportfolio the sub brands can also be volatile due to different populartrend and consumer taste shifts
MACRO ECONOMY PROJECTION
US EconomyUS economic growth remained strong in the third quarter of 2017realizing 3 growth On December 13th the Federal Reserve raised thebenchmark rate by 025 the third increase in 2017 signaling healthygrowth in the economy Economic projections from the Federal ReserveBoard members and Federal Reserve Bank presidents we expect theexpansion remain at or slow to 18 (Figure 17) in 2019 Moreoverforecasts from World Bank and International Monetary Fund also indicatea similar sentiment Consumer products toys and games may beadversely affected by the slowing GDP growth (See Appendix 14)
Exchange RateFrom January 2000 to December 2017 the majority of currencies inHasbrorsquos markets depreciated (Figure 19) except for the Hong KongDollar with only a slight depreciation of 047 and the Chinese Yuanwith an appreciation of 2726 With most of the suppliers located inChina the rising local currency put pressure on the costs of Hasbro But anappreciation in local currency would have the effect of boostingrepatriation in USD Therefore it will be a good opportunity to continue toexpand in the Chinese market As for other markets we expect lessfavorable exchange rates We anticipate there will be some loss due toexchange rates in other comprehensive income unless Hasbro adjusts thedistribution in the respective markets
Hasbro Third-Party Factory
China India Vietnam United States
Ireland Indonisia Japan Turkey
Figure 20
Source Hasbro Official Website
Figure 21
Source Team Analysis
Figure 22
Source Team Analysis
Figure 23
Source Team Analysis 5
HASBRO COMPETITIVE POSITIONThe toys amp games industry (Figure 21) is characterized by a strong rivalryamong existing competitors As one of the largest players in the USHasbro sustains an unyielding competitive position Even though strongcompetition exists in this industry consumers and suppliers have lessbargaining power due to exclusive IPs and excess number of suppliersrespectively In addition the threat from new entrants is low due to highcompetition and regulations and the high threat of the substitutes makesthis industry even less appealing (See Appendix 7)
HASBRO vs MATTELBoth companies overall have similar product lines For instance on themanufacturing side both produce most of the physical toys for movies andstory franchises such as Hasbrorsquos Star Wars and Transformers toys andMattelrsquos Jurassic Park and Batman vs Superman toys Moreover Mattelbegan to replicate Hasbrorsquos storytelling and entertainment success bypromoting and producing movies like Barbie which is scheduled to bereleased by August 2018 This shift in strategy will increase the productionof films targeting kids In 2017 the entertainment industry released 30childrens movies establishing a new record (See Appendix 19)Hasbrorsquos culture has been stable it involves a communal environment(Figure 22) where people are able to freely act and feel comfortable wheninteracting with their peers This culture has fostered more genuine andcollaborative relationships This approach will help Hasbro become moreproductive in the long term On the other hand Mattelrsquos culture has beenadversely effected by all the changes in its leadership team which hasproduced a lot of resentment and fragmentation within the departmentsand employees Many of the employees feel that they are being forced toadopt different cultures every time a reorganization occurs
HASBRO vs COMPETITORSIn the US toys amp games market Hasbro has three major competitorsMattel Lego and Jakks Pacific In comparing characteristics listed in Figure23 Lego has a leading advantage over the other three competitors Hasbrostruggles in managing efficiency due to overseas manufacturing andinadequate supply chain management In addition both Hasbro and LEGOhave absolute leading positions in their respective growth and profitabilitywhile others are weak in these aspects From our survey (See Appendix 8)
SUPPLIERS amp RETAILERSRetailersThe largest three retailers of Hasbro are Walmart Target and Toys ldquoRrdquo Uswhich contribute around 62 of the net revenues in the US and Canadaand 18 9 and 9 respectively in its global net revenues Due to thehigh concentration any issues to one of the major customers willsignificantly impact HasbroSuppliersBased on Hasbrorsquos Third-Party Factory List in 2016 the majority ofsuppliers are located in China (Figure 20) due to its cheaper labor costsBecause of the appreciation in local currency and increasing labor coststhe company will move 30 of the production in China to suppliers inother countries such as India and Indonesia The trend of ldquomoving to Indiardquohas already begun with several of Hasbrorsquos suppliers making moves
Mercenary
Soci
abili
ty
LOW
LOW
HIG
H
HIGHSolidarity
Networked Communal
Organizational Culture Matrix
Fragmented
Hasbro
Mattel
we see that Lego and Hasbro havethe 1 and 2 brand awarenessamong all toy manufacturers As oneof the leading players in the industryHasbro can use these advantages togenerate more profits compared toMattel and Jakks (See Appendix 17)
Assessment Profitability GrowthFinancial
Safety
Brand
AwarenessEfficiency
Employee
Satisfaction
Weighted
Average
Hasbro 4 3 4 4 1 4 335
Mattel 1 2 3 3 5 3 27
LEGO 5 5 5 5 4 5 485
Jakks 1 1 2 1 2 1 125
Weight 20 20 10 20 15 15 100
Figure 24
Source Team Analysis Bloomberg
Figure 25
Source Team Analysis Bloomberg
Figure 25
Source Bloomberg
Figure 26
Source Bloomberg
Figure 27
Source NPD Team Analysis
Figure 28
Source Team Analysis Bloomberg
Historical Target Price amp Actual Price Gap
6
MARKET PERSPECTIVE OF THE STOCKFrom historical data of the 1-year target price of analysts following Hasbrowe can see that these analysts have had a conservative perspective on theHasbro 12month target stock price (Figure 25) From 2014 to 2017 Theseanalysts averaged a 1-year target price of about 14 lower than the 1-yearactual price Today the 17 analysts issue an average target price of $10554(Figure 26) which is higher than the current price of $9245
DCF VALUATIONDCF valuation method consists of a two-stage growth model The first phaseis based on individual year to year forecasts up to 2024 and the second phaseis terminal value based on a long term growth of 263 Based on our DCFanalysis the estimated 1 year target price is $107 (See Appendix 4)
REVENUE GROWTH PROJECTIONWe found three main revenue drivers the Transformers movies and partnerbrand movies new IP acquisitions and Hasbrorsquos growth in major marketsWe anticipate revenue will keep growing for the next 7 years primarily due tothe following reasons 1) the release of future Transformers movies in 20192021 and 2023 and other partner movies such as Avengers Infinity War in2018 and Frozen 2 in 2019 2) acquisitions of new IPs similar to Frozen andBeyblade and 3) Hasbrorsquos major markets should see continuous positivegrowth of 246 in 2018 to 094 growth in 2024 (Figure 27) We believethat Hasbrorsquos major traditional toys amp games business will be negativelyimpacted by the strong digital game market growthWe calculated the final revenue (Figure 28) by adjusting the market growthrate in accordance to the movie releases and potential new IPs as shown indetail in Appendix 9
INVESTMENT SUMMARYOur recommendation is BUY with a 1-year target price of $107 per sharewhich is based on a 9010 mix of the Discounted Cash Flow Valuation andEVEBITDA Comparable ValuationRevenue DriversFirst successful storytelling through movies such as the Transformers and MyLittle Pony will help Hasbro boost brand awareness Second by acquiringnew IPs in the future similar to Hasbrorsquos past acquisitions of Yo-Kai WatchBeyblade and Frozen Hasbro will increase future revenue Third Hasbrorsquosmajor markets are expected to have continuous positive growth for the next7 years from 246 in 2018 to 094 in 2024 Lastly Hasbro is expanding inemerging markets In November 2016 Hasbro partnered with Tmall whichincreased Transformersrsquo YOY growth by 47 on a single day there ispotential for Hasbro to grow in other emerging marketsStock Price DriversBased on historic analysis Hasbrorsquos stock price is 53 correlated to itsrevenue In combination with our projections for Hasbrorsquos revenues for thenext 7 years we believe the stock price will rise in concert with revenueFurthermore we expect dividends will continue growing at an average of10 YOY for the next 7 years (Figure 25) driven by revenue growth andadditional benefits from tax-reform
Buys 5290 9
Holds 4710 8
Sells 000 0
Avg 12M Tgt Px 10554$
Current Price 9245$
Institutions Recommendations
Revenue Breakdown FY 2016 FY 2017 FY 2018 FY 2019 FY 2020 FY 2021 FY 2022 FY 2023 FY 2024
Revenue 5019822 537116 568183 617013 615860 657997 656823 675711 678776
Growth Rate 1287 700 578 859 -019 684 -018 288 045
Franchise Brands 2327668 255686 248016 262897 252381 265000 251750 261820 253965
Growth Rate 185 985 -300 600 -400 500 -500 400 -300
Partner Brands 141277 134015 140716 154787 147048 157341 155768 157325 162045
Growth Rate 2828 -514 500 1000 -500 700 -100 100 300
Hasbro Gaming 813433 97954 115585 133501 150856 166696 180031 189933 195631
Growth Rate 2282 2042 1800 1550 1300 1050 800 550 300
Emerging Brands 465951 49461 50203 51207 52488 54062 55954 58193 60811
Growth Rate 1693 615 150 200 250 300 350 400 450
Hasbros Major Market Growth Rate 287 246 243 217 232 207 126 094
Figure 29
Source Team Analysis Bloomberg
Figure 30
Source Team Analysis Bloomberg
Figure 31
Source Team Analysis Bloomberg
Revenue Breakdown FY 2014 FY 2015 FY 2016 FY 2017
Revenue 427721 444751 501982 537116
Growth rate 478 398 1287 700
Franchise Brands 234513 228541 232767 255686
Growth rate -255 185 985
Partner Brands 65406 110131 141277 134015
Growth rate 6838 2828 -514
Hasbro Gaming 64362 66232 81343 97954
Growth rate 291 2282 2042
Emerging Brands 63441 39847 46595 49461
Growth rate -3719 1693 615
Source Team Analysis
Figure 32
Figure 33
Source Team Analysis Bloomberg
FINANCIAL ANALYSIS
WACC amp LONG-TERM GROWTH RATE CALULATIONWe took the average of the cash paid for interest over long-term debt andthe companyrsquos bondsrsquo yields to calculate cost of debt We took the average ofthe CAPM and the Two-Stage Golden Growth Model to calculate the cost ofequity resulting in a WACC of 744 (Figure 30) We used the 10 yearTreasury Note yield as the risk free rate (255) market risk premium(545) data from Bloomberg and projected 2017 tax rateWe adopted three major resources to conduct the economic predictionsWorld Bank IMF and projections from the Federal Reserve Board membersand Federal Reserve Bank presidents We averaged the projections from thethree sources to get the projections for 2017 2018 2019 and calculated theweighted average based on the revenue breakdown in each area(Figure 31)(See Appendix 11)
DCF CALCULATIONWe used the Discounted Cash Flow Model to calculate free cash flow and theterminal growth rate to calculate terminal value We then added back cashsubtracted total debt to get the enterprise value and then divided by thenumber of basic shares outstanding as of 2017 to calculate the fair value ofHasbrorsquos stock price
CAPITAL EXPENDITURECapital expenditure increased in recent years because of Hasbrorsquos investmentin information systems as well as new office space for the Hasbroheadquarters Hasbro expects capital expenditures to be in the range of $130million to $160 million in 2017
COST OF GOODS SOLDWe expect COGS of Hasbro will increase by 136 (Figure 29) for 2 years andthen decrease by 032 from 2020 to 2024 The latter negative trend is dueto a decrease in plastic prices and a decrease in labor costs due to Hasbrorsquosplan to move 30 of production from China to India and other cheap laborcountries (See Appendix 10)
Revenue GrowthFrom 2007 to 2016 Hasbrorsquos revenue has grown steadily at a CAGR of 3(Figure 33) including three years of negative growth in 2010 2012 and 2013Though the 2008 financial recession effected many industries the toys ampgames industry seemed to be less effected indicated by both Hasbro andMattelrsquos steady revenue In 2007 Hasbro released the Transformers moviewhich had remarkable success and helped Hasbro increase its revenuesignificantly This franchise became the biggest revenue growth driver forHasbro For example in 2007 and 2009 The Transformers productsaccounted for 126 and 145 of consolidated net revenues respectivelyOther than the Transformers movies other partner brand movies such asJurassic Park and the Marvel movies also played important roles in therevenue growth During the last 9 years Hasbro worked with Beyblade Yo-Kai Watch and Disneyrsquos Frozen to generate significant revenue in 2011 2015and 2016 respectively (See Appendix 9) 7
COMPARABLE VALUATIONWe used EVEBITDA for the comparable valuation We chose industry peersbased on similarities of products and target customers (Figure 32) Some non-US toy companies and entertainment companies are included because theyeither indirectly compete with Hasbro or have similar strategies and businessmodels We also used benchmarks to identify similar candidates based onDebtEquity ratio EBITDA Margin and 5 year revenue growth Howeversince we view Mattel to be the only solid comparable we deemphasized theEVEBITDA comparable valuation and weighted the comparable valuation10 in calculating our final fair value Considering the comparable valuationwas based on interactive ratios between Hasbro and its industry peers itoffered insights about the industry and financial status of Hasbro (SeeAppendix 12)
CompanyAdjusted
EV
EBITDA
T12MEVEBITDA
Implied
Price
Median 550852 57137 964 $7201
Hasbro 1211031 99646 1215 $9211
Mattel 791931 48466 1634 $12560
Tomy 143064 18853 759 $5559
Bandai 550852 74605 738 $5395
Spin Master 441761 25523 1731 $13335
Alpha Group 314579 32600 965 $7208
Goldlok Toys 80568 3260 2471 $19260
Average 504827 43279 1359 $10361
Year 2018-2019 2020-2024
Freight -324 -100
Paper 011 010
Labor 867 -500
Plastics 300 000
Electronic Device -134 005
COGS Growth Rate 136 -032
Cost of Equity 785
2 - Stage Dividend Growth Model 720
CAPM 851
Cost of Debt 451
Average Bond Yield After Tax 279
Interes Over Long-Term Debt 622
Market Cap $mm 11515
Long-Term Debt $mm 18753
Tax Rate 2278
WACC 744
-50
0
50
100
150
2011 2012 2013 2014 2015 2016
Pay Out Ratio vs DividendFCF
Pay Out Ratio DividendFCF
Figure 34
Source Bloomberg
Figure 35
Source Bloomberg
Figure 36
Source Bloomberg
Figure 37
Source Bloomberg
Figure 38
Source Team Analysis Bloomberg
Operating MarginHasbrorsquos operating expenses consist of royalties product developmentadvertising amortization of intangibles program production costamortization and selling distribution and administration (Figure 34) Weexpect operating margins will slowly decrease in the future mainly due toincreasing royalties and COGS Hasbrorsquos largest IPs Marvel and Star Warswill end in 2018 Hasbro must renegotiate and we expect the royalties feeto increase (See Appendix 22) In the long run we expect operating marginswill be between 13 to 14 (Figure 35)
Dividend amp Stock BuybackUsually we analyze the payout ratio since dividend per share is a fixedamount However the common outstanding shares can be varied bydifferent operations such as stock buy back or issuance of options etcTherefore we introduced another way to look at the dividend policydividendFCF (Figure 36) FCF is cash after operations and capitalinvestment available to pay dividends The higher the ratio the less acompany retains for future use Although Hasbrorsquos pay out ratio oncepeaked at more than 70 dividendFCF consistently remains below 50(except for 2012 and 2014) which presents a safe level of dividends and agood retention rate for Hasbrorsquos future operations Moreover Hasbroconstantly buys back their shares which led to a decrease in its commonoutstanding shares We anticipate that future stock buybacks will continueand the dividend yield will continue to be raised
Key RatiosFrom the table (Figure 38) we can see that liquidity in the past has beenvery healthy and above the industry median Our forecast for futureliquidity is similarly healthy due to increasing revenue and stablebusinesses Profitability is also above the industry median due to thecompanyrsquos leading position in the industry and benefits from economies ofscale Hasbrorsquos Financial risk is low because it has a high interest coverageratio and stable future cash flows The payout ratio is expected to keepincreasing in the future due to high growth of dividends We believe atsome point in the future Hasbro will slow dividend growth to match therevenue growth and hence lower the payout ratio Hasbrorsquos cashconversion cycle is lower than industry median indicating improper supplychain management However the cash conversion cycle has continued todecrease since 2012 which indicates Hasbro is managing to become moreefficient (See Appendix 15)
Revenue Surprise amp Stock RelationFrom the chart (Figure 37) we can see that the quarterly revenue surpriserelative to consensus estimates (per Bloomberg) and the stock price has a53 correlation from 2014 to 2017 Consequently we believe that theHasbro stock price is strongly driven by revenue surprises
8
Liquidity Analysis FY 2012 FY 2013 FY 2014 FY 2015 FY 2016 Industry Median FY 2017 FY 2018 FY 2019 FY 2020 FY 2021 FY 2022 FY 2023 FY 2024
Cash Ratio 088 050 083 092 079 079 098 099 099 099 089 089 090 090
Current Ratio 261 182 253 269 199 195 221 222 223 223 220 220 221 221
Profitability Analysis
Operating Margin 1349 1144 1485 1556 1570 875 1494 1443 1374 1374 1370 1366 1361 1356
Return on Asset 795 656 931 977 1124 697 1002 1044 1018 1016 1078 1074 1075 1070
Return on Equity 2298 1795 2642 2888 3127 1359 2694 2784 2743 2745 2673 2668 2674 2660
Finacial Risk Analysis
Total Debt to Equity 108 081 120 100 091 049 088 088 089 089 070 070 070 070
Interest Coverage Ratio 606 442 682 713 809 756 743 728 729 909 907 909 906
Net Debt EBITDA 110 110 116 087 047 045 015 012 009 008 -005 -005 -007 -007
Other
Payout Ratio 5562 7288 5242 5081 4624 3396 4902 4919 5193 5642 5737 6207 6505 6962
Dividend Growth Rate 2000 1111 750 698 1087 1176 1053 1032 1007 980 952 924 896
Efficiency
Days Inventory Outstanding 7212 7233 7377 7858 7375 7375
Days Sales Outstanding 9366 9468 9311 9463 9201 5517
Days Payable Outstanding 3082 3614 4432 4796 5347 4009
Cash Conversion Cycle 13496 13087 12256 12525 11230 7425
Figure 41
Source Team Analysis
Figure 42
Source Team Analysis
PR
OB
ILIT
Y
LOW
MED
IUM
LOW
HIG
H
MEDIUM HIGH
IMPACT
MK1
MK2
M 3
F1F 2
MK4
OP4
OP3
OP2
OP1
OP5
0
200
400
600
800
1000
1200
$88 $90 $92 $94 $96 $99 $101 $103 $105 $107 $109 $111 $113 $115 $117 $120 $122 $124 $126 $128 $13 $132
Monte Carlo Simulation
Figure 39
Source Team Analysis
Target Price $107
Freq
uen
cy
Figure 40
Source Team Analysis
MONTE CARLO SIMULATIONWe used the Monte Carlo simulation to predict possible price changes andidentify the most sensitive variable for Hasbro in our assumptions Wetested the revenue growth rate long-term growth rate and discount rate inMonte Carlo Simulation The findings show that the price is effected most
SENSITIVITY AND SCENARIO ANALYSISWhile doing DCF analysis in addition to our base case we introduced twoother scenarios better case and worse case Better case includesacquiring new IPs twice in the next 7 years and revenues increasing fasterthan base case due to better than expected storytelling strategies In thisbetter case for example a new release of the Transformers movie wouldhave great success increasing the 1 year target price to $11694 (Bettercase does not include merger with Mattel) Worse case includes statusquo with no changes of IPs in the next 7 years and a lower growth rate for
MARKET RISKMK1 Macro Economy ChallengeWe expect Hasbro will be challenging doing business in Latin America TakeBrazil as an example although Hasbrorsquos revenue in Brazil grew 20 in Q42015 it faced challenges with macroeconomic factors and politicalinstability in 2017 Moving forward we are optimistic about the potentialin Latin America but expect more volatility As for Europe with the UKleaving the European Union the economy of the EU will be negativelyeffected which already decreased the sales of the UK and Germany in Q22017 We anticipate sales will continue to face challenges in this area Forthe Asia Pacific area China is the largest potential market Although theappreciation in local currency will benefit Hasbro stricter capital controlmay make the future repatriation more difficult bringing uncertainties inHasbrorsquos development in ChinaMK2 A Stronger US Dollar Can be ExpectedWe analyzed the data from June 11th 2008 to December 14th 2017 duringwhich the Federal Reserve changed its Policy Benchmark Rate five timesWith strong expectations that the Fed will continue to deal withforeseeable strong GDP growth and actively manage CPI a stronger USDwill be expected which will in turn have a negative impact on Hasbrorsquosoverseas businessMK3 Potential Threat from the Fast-Developing Digital TrendChildren are exposed to digital media at an earlier age which in turn hashelped digital games grow faster Hasbro must successfully execute astrategy that caters to the fast-developing trend and mitigate the risk
by changes in the long-term growth rate Weexpect the revenue growth rate and long-term growth rate will grow at a base casegrowth rate (See Appendix 16) and appliedrandom growth rates from a specific range tosimulate a range of stock prices After running10000 simulation paths the result indicates a4789 probability that the price of Hasbrowill be above $107 There is a 5020probability the price will be between $9245and $107 The probability of the price beinglower than $9245 (current price) is only191
revenue due to worse than expected storytellingstrategies decreasing the 1 year target price to$9507 (Figure 40) The sensitivity analysis showsthe price ranges from $9819 to $11887 (Figure41) by changing long-term growth rate (24-28) and WACC (71-77)
9
10713 710 720 730 744 750 760 770
280 11887 11614 11354 11011 10867 10638 10419
270 11674 11412 11161 10831 10692 10471 10260
263 11534 11279 11035 10713 10577 10362 10155
250 11275 11033 10800 10493 1036348 10158 9960
240 11089 10855 10631 10334 10209 10010 9819
Long-
Term
Growth
Rate
WACC
Share Price(Base Case) 10713$
Share Price(Better Case) 11694$
Share Price(Worse Case) 9507$
Hasbro 1 Year Target Price
000
050
100
150
90
100
110
120
130
140
USD Broad Index vs Federal PolicyBenchmark Rate
USD Broad Index Federal Policy Benchmark Rate
050
150
250
350
1990 1993 1996 1999 2002 2005 2008 2011 2014
Birth Rate
United States European Union
Russian Federation China
Brazil Mexico
0
1
2
3
4
5
6
7
8
1960 1965 1970 1975 1980 1985 1990 1995 2000 2005 2010 2015
Fertility Rate (Births Per Woman)
United States European Union
Russian Federation China
Brazil Mexico
Figure 43
Source Bureau of Labor Statistics
Figure 44
Source Bureau of Labor Statistics
Figure 45
Source Federal Reserve World Bank IMF
Figure 46
Source Bloomberg
10
MK4 Demographic ShiftWomen are having fewer children and some developed economies are facinglow birth rates (Figure 43 Figure 44) which raise concerns of maintaining thepopulation level The birth rate in the US has declined every year since 2007The shift in demographics may cause slower end-user market growth
FINANCIAL amp CREDIT RISKFI1 Interest RateWith the interest rate increased three times in 2017 (Figure 45) and projectedto increase another three times in 2018 we can expect that financing andrefinancing costs will be higher (See Appendix 13)FI2 Bankruptcy of Toys ldquoRrdquo UsToys ldquoRrdquo Us accounts for 9 of Hasbrorsquos net revenue globally The Toys ldquoRrdquo Usbankruptcy is a potential risk to Hasbro as we anticipate more allowance fordoubtful accounts and less accounts receivable due to the uncertainty of ToysldquoRrdquo Us future Also it may complicate the retail channels of Hasbro since ToyldquoRrdquo Us has a strong US presence
OPERATIONAL RISKOP1 Hard to Provide New Loyal BrandsIt is hard for Hasbro to consistently deliver new brand stories AlthoughHasbro has spent tremendous capital on its storytelling strategy lately thecompany has found it challenging to create new unique trademarks whichhistorically have been the core of its salesOP2 Remain Average Level in Catering to E-CommerceE-commerce represents only 15 of its total revenue which is the same as theaverage level in the industry If Hasbro cannot stand out from the crowdother competitors may take advantage of the trendOP3 Revenues Heavily Rely on MediaThe success or failure of blockbuster movies or TV can significantly impact thesales volume and revenue in turn If the Transformers movies do not meetexpectations not only cannot they boost sales but also cost Hasbro in initialinvestmentsOP4 Fail to Maintain Partnership with IP OwnersDue to the dependency on successful stories maintaining good relationshipswith major IP owners is essential Hasbro will pay a high price if it loseslicenses from IP owners such as Disney or MarvelOP5 Potential Financial Challenges in Emerging MarketsIn Q1 2016 some retailers in emerging markets met with difficulties andincurred bad debt Moving forward using a more active strategy whenentering emerging markets Hasbro may face the same risk due to unfamiliarbusiness environments and macroeconomic conditions
MERGERS amp ACQUISITIONSIn November 2017 Hasbro offered its major rival Mattel a takeover plan andgot an immediate rejection It was not the first time that Hasbro proposed tomerge with Mattel (two other proposals in 1996 and late 2015 respectively)Based on our analysis we believe the possibility of MampA is low (See Appendix20) But Hasbro had a successful MampA history It conducted 21 deals (Figure 46)in the past with 10 financed fully in cash one with partly cash and partly debtand 10 remain undisclosed The target companies fit in three major industriesCyclical Consumer Goods amp Services Technology and Communications In thepast three MampA deals two belonged to Communication and one belonged toTechnology which may indicate Hasbrorsquos interest in growing its digitalfootprint We also interviewed two experts Lutz Muller the President ofKlosters Trading Corporation and top expert in the industry who published athorough article of the MampA between Hasbro and Mattel on Seeking Alphaand Professor Hillary Greene Zephaniah Swift Professor of Law at UConnSchool of law and a visiting scholar at Harvard Law School who is an expert inantitrust They both offer great insights about the case and valuablesuggestions for our research (See Appendix 21)
Compnay Type Total Value (mil) Total Number
Communication $700 2
Consumer Cycl $70389 6
Others $69538 8
Technology $26645 5
Total $167272 21
Historical MampA Information
Company Type
APPENDIX 1 GLOSSARY
FRANCHISE BRANDSTransformers A brand based on robots with human shapes that turn into different machinesNerf A toy gun that shoots form soft bulletsMy Little Pony An entertainment franchise based on storytelling This franchise also has physical and virtual toys thataccompany the storiesLittlest Pet Shop A franchise based on animated television series Monopoly A board game where the playersrsquo objective is to own all the properties and all the money availableMagic The Gathering A game where players battle against each other by using cards that represent creatures withpowers and Magics
PARTNER BRANDSMarvel A comic series based on well-known superheroes including Spider-Man Wolverine the Hulk Thor Iron ManCaptain America X-Men the Guardians of the Galaxy and the Fantastic FourFrozen An animated musical fantasy movie produced by Disney including characters of Elsa Anna and OlafDisney Princess Disney animated film characters of the franchise are Snow White Cinderella Aurora Ariel andBelleYo-Kai Watch A Japanese popular mixed-media franchise of role-playing video games created and developed byLevel-5 The franchise has also become a popular anime television seriesStar Wars An epic space opera media franchise centered on a film series created by George LucasBeyblade A Japanese manga series written and illustrated by Takao Aoki focused on a group of kids who form teamsand battle one another using Beyblades
HASBRO GAMING BRANDSTaboo A popular party game that involves filling in the blank with interesting word choicesJenga A game where players take turns removing one block at a time from a tower constructed of 54 blocksScrabble A game in which two to four players score points by placing tiles bearing a single letter onto a boardSpeak OUT A game that players try to say different phrases while wearing a mouthpiecePie Face A game involves two players revolving around the gag of getting a pie in the faceDungeons amp Dragons A fantasy tabletop role-playing game
EMERGING BRANDSPlayskool Educational toys and games for children including Mr Potato Head Tonka Alphie Weebles ElefunSesame Street toys and GlowormBaby Alive A baby doll that eats drinks wets and in some cases messes all with a movable mouthFurby An American electronic robotic toy released in 1998 It resembles a hamster or owl-like creature and wentthrough a period of being a must-have toy following its holiday season launch with continual sales until 2000GI Joe A line of action figures representing four of the branches of the US armed forces with the Action SoldierAction Sailor Action Pilot Action Marine and the Action NurseHanazuki An animated childrens web show made in conjunction with a line of Hanazuki toysFurReal Robotic toys range from guinea pigs to dinosaurs coming in many sizes some are able to be held in a childshand and others are able to be ridden by a child
1011
APPENDIX 2 BALANCE SHEET
Source Team Analysis Bloomberg
ASSUMPTIONSbull There will be no huge MampA in the nest 7 yearsbull Hasbro will not issue new bonds to retire the prior debt that matures in 2021bull Allowance for doubtful account increased in 2017 due to filing of Chapter 11 of Toy ldquoRrdquo Us and decreased to
previous level as uncertainty subsidesbull Hasbro will continue to buyback its stock in the futurebull Hasbro will not issue new shares in the near futurebull The dollarrsquos appreciation will have a slight negative impact in the near future
12
$mm FY 2012 FY 2013 FY 2014 FY 2015 FY 2016 FY 2017 FY 2018 FY 2019 FY 2020 FY 2021 FY 2022 FY 2023 FY 2024
Cash and Equivalents 84970 68245 89317 97675 128229 173229 183248 197007 196638 180392 180018 186048 187027
Operating Current Assets 167810 181701 182593 190375 196212 216297 228808 248471 248007 264976 264503 272109 273343
Property Plant amp Equipment - Net 23041 23626 23749 23753 26740 26205 25681 25167 24664 24171 23929 23809 23571
Other Intangible Assets 41666 37600 32453 28081 24595 219 194 173 153 136 121 108 96
Goodwill 47493 59432 59344 59270 57056 56596 55908 55228 54557 53894 53239 52592 51953
Other Noncurrent Assets 69519 71523 65759 74409 77986 80121 82314 84568 86883 89261 91705 94216 96795
Allowance For Doubtful Accounts 1960 1900 1590 1490 1680 3390 1724 1665 1587 1659 1637 1627 1641
Total Assets 432539 440227 451624 472072 509137 570912 593656 626035 624499 624665 623868 637910 640612
Operating Current Liability 73607 92656 82245 90008 109556 129182 136654 148398 148120 158255 157972 162515 163252
Financial Debt 162079 139662 181238 171168 172097 187530 195001 205636 205132 175186 174963 178901 179659
Other Noncurrent Liabilities 46115 35130 38892 40488 38939 41880 39323 39721 40061 39304 39826 39943 39875
Total Liabilities 281801 267448 302375 301665 320593 358592 370977 393756 393313 372745 372761 381359 382786
MinorityNon Controlling Int (Stckhldrs Eqty) - 4545 4273 4017 2270 - - - - - - - -
Common Stock 10485 10485 10485 10485 10485 10485 10485 10485 10485 10485 10485 10485 10485
Additional Paid In Capital 65594 73418 80627 89363 98542 107763 117847 128875 140935 154124 168547 184319 201567
Treasury Stock (Amount) (253565) (255473) (298007) (304090) (318168) (334240) (351123) (368859) (387491) (407064) (427626) (449227) (471919)
Accumulated Other Comprehensive Income (7231) (3414) (9545) (14600) (19457) (22952) (26649) (30663) (34670) (38952) (43225) (47622) (52038)
Retained Earnings (Accumulated Deficit) 335455 343218 363007 385232 414872 451264 472119 492442 501928 533327 542927 558596 569732
Par Value 050 050 050 050 050 050 050 050 050 050 050 050 050
Shares Issued 20969 20969 20969 20969 20969 20969 20969 20969 20969 20969 20969 20969 20969
Total Shareholders Equity 150738 172779 149249 170407 188544 212321 222679 232280 231186 251919 251107 256551 257827
Total Liabilities and Shareholders Equity 432539 440227 451624 472072 509137 570912 593656 626035 624499 624665 623868 637910 640612
$mm FY 2012 FY 2013 FY 2014 FY 2015 FY 2016 FY 2017 FY 2018 FY 2019 FY 2020 FY 2021 FY 2022 FY 2023 FY 2024
Cash and Equivalents 1964 1550 1978 2069 2519 3034 3087 3147 3149 2888 2886 2917 2920
Operating Current Assets 3880 4127 4043 4033 3854 3789 3854 3969 3971 4242 4240 4266 4267
Property Plant amp Equipment - Net 533 537 526 503 525 459 433 402 395 387 384 373 368
Other Intangible Assets 963 854 719 595 483 383 327 276 246 218 194 169 149
Goodwill 1098 1350 1314 1256 1121 991 942 882 874 863 853 824 811
Other Noncurrent Assets 1607 1625 1456 1576 1532 1403 1387 1351 1391 1429 1470 1477 1511
Allowance For Doubtful Accounts 045 043 035 032 033 059 029 027 025 027 026 026 026
Total Assets 10000 10000 10000 10000 10000 10000 10000 10000 10000 10000 10000 10000 10000
Operating Current Liability 2612 3464 2720 2984 3417 3602 3684 3769 3766 4246 4238 4261 4265
Financial Debt 5752 5222 5994 5674 5368 5230 5256 5222 5215 4700 4694 4691 4693
Other Noncurrent Liabilities 1636 1314 1286 1342 1215 1168 1060 1009 1019 1054 1068 1047 1042
Total Liabilities 10000 10000 10000 10000 10000 10000 10000 10000 10000 10000 10000 10000 10000
MinorityNon Controlling Int (Stckhldrs Eqty) 000 263 286 236 120 000 000 000 000 000 000 000 000
Common Stock 696 607 702 615 556 494 471 451 454 416 418 409 407
Additional Paid In Capital 4352 4249 5402 5244 5226 5075 5292 5548 6096 6118 6712 7184 7818
Treasury Stock (Amount) -16822 -14786 -19967 -17845 -16875 -15742 -15768 -15880 -16761 -16159 -17030 -17510 -18304
Accumulated Other Comprehensive Income -480 -198 -640 -857 -1032 -1081 -1197 -1320 -1500 -1546 -1721 -1856 -2018
Retained Earnings (Accumulated Deficit) 22254 19865 24322 22607 22004 21254 21202 21200 21711 21171 21621 21773 22097
Par Value 003 003 003 003 003 002 002 002 002 002 002 002 002
Shares Issued 1391 1214 1405 1231 1112 988 942 903 907 832 835 817 813
Total Shareholders Equity 10000 10000 10000 10000 10000 10000 10000 10000 10000 10000 10000 10000 10000
APPENDIX 3 INCOME STATEMENT
Source Team Analysis Bloomberg
$(mm) FY 2012 FY 2013 FY 2014 FY 2015 FY 2016 FY 2017 FY 2018 FY 2019 FY 2020 FY 2021 FY 2022 FY 2023 FY 2024
Revenue 100 100 100 100 100 100 100 100 100 100 100 100 100
Revenue growth - - - - - - - - - - - - -
Cost of Goods Sold 4089 4098 3971 3771 3796 3936 3989 4044 4031 4018 4006 3993 3980
Royalties 739 830 714 853 816 780 800 820 840 861 883 905 928
Product development 492 509 520 546 531 500 504 508 512 516 520 524 528
Advertising 1033 975 983 920 930 935 934 935 935 936 937 938 939
Amortization of intangibles 124 192 123 098 070 060 050 040 035 030 025 020 015
Program production cost amortization 102 117 110 095 072 062 057 052 047 042 037 032 027
Selling distribution and administration 2072 2135 2094 2160 2213 2233 2223 2228 2225 2227 2226 2226 2226
Operating Income (Loss) 1349 1144 1485 1556 1570 1494 1443 1374 1374 1370 1366 1361 1356
Net Income GAAP 822 701 972 1016 1098 1065 1091 1033 1030 1024 1020 1015 1010
$(mm) FY 2012 FY 2013 FY 2014 FY 2015 FY 2016 FY 2017 FY 2018 FY 2019 FY 2020 FY 2021 FY 2022 FY 2023 FY 2024
Revenue 408900 408220 427720 444750 501980 537116 568183 617013 615860 657997 656823 675711 678776
Revenue growth -459 -017 478 398 1287 700 578 859 -019 684 -018 288 045
Cost of Goods Sold 167200 167290 169840 167700 190550 211407 226674 249498 248248 264397 263094 269807 270177
COGS as Revenue 4089 4098 3971 3771 3796 3936 3989 4044 4031 4018 4006 3993 3980
Gross Profit 241700 240930 257880 277050 311430 325709 341510 367515 367612 393600 393729 405904 408599
- Operating Expenses 186522 194216 194346 207854 232630 245462 259517 282754 282969 303473 303983 313907 316525
Royalties 30207 33892 30532 37925 40952 41895 45432 50576 51750 56679 58000 61167 62988
Product development 20120 20759 22256 24294 26638 26856 28636 31344 31532 33953 34155 35407 35839
Advertising 42224 39810 42026 40939 46894 50220 53068 57691 57583 61589 61544 63382 63737
Amortization of intangibles 5057 7819 5271 4372 3476 3223 2841 2468 2156 1974 1642 1351 1018
Program production cost amortization 4180 4769 4709 4245 3593 3330 3239 3208 2895 2764 2430 2162 1833
Selling distribution and administration 84735 87168 89554 96080 111077 119938 126301 137467 137054 146515 146212 150438 151110
Operating Income (Loss) 55178 46714 63534 69196 78800 80247 81993 84761 84643 90127 89746 91997 92074
Operating margin 1349 1144 1485 1556 1570 1494 1443 1374 1374 1370 1366 1361 1356
- Non-Operating (Income) Loss 984 1153 954 88 956 6170 6584 7211 7259 7822 7874 8168 8272
Non-Operating (Income) Losssales 241 282 223 198 190 115 116 117 118 119 120 121 122
Pretax Income 45338 35184 53994 60396 69240 74077 75409 77549 77384 82305 81872 83829 83802
- Income Tax Expense (Benefit) 1174 679 1267 157 1593 1687 1342 1384 1392 1496 1488 1523 1523
Tax rate 2589 1930 2347 2600 2301 2278 1780 1785 1799 1817 1817 1817 1817
Income (Loss) from Cont Ops 33598 28394 41324 44696 53310 57204 61988 63709 63460 67348 66994 68595 68573
- Minority Interest 0 -23 -26 -5 -182 00 00 00 00 00 00 00 00
Net Income GAAP 33598 28624 41584 45196 55130 57204 61988 63709 63460 67348 66994 68595 68573
Basic Weighted Avg Shares 1301 1302 1284 125 1253 1245 1225 1205 1185 1165 1145 1125 1105
Basic EPS GAAP 258 220 324 362 440 459 506 529 536 578 585 610 621
ASSUMPTIONSbull Revenue will grow in the next 7 years due to the release of new movies new IP acquisitions and Hasbrorsquos
major marketsrsquo growthbull COGS will increase due to plastic and labor cost increases from 2018 - 2019 and slightly decrease from 2020 to
2024bull Operating expense will increase mainly due to increasing royalties and COGSbull Tax rate will decrease due to the new tax billbull Shares outstanding will decrease due to stock buybackbull EPS will increase due to stock buyback and revenue and earning increase
13
APPENDIX 4 DISCOUNTED CASH FLOW VALUATION
Source Team Analysis Bloomberg
We used the Discounted Cash Flow Model to calculate free cash flow asNet Income + Depreciation amp Amortization ndash Change in Working Capital ndash Capital Expense + Net Interest after taxand terminal value using long-term growth rate We added back cash and subtracted total debt to get the equityvalue and divided by the number of basic shares outstanding to calculate the fair value of Hasbrorsquos stock Wecalculated capital expenditure by change in Net PPampE+ depreciation Capital expenditure increased in recent yearsbecause of Hasbrorsquos investment in information systems and new office for its headquarters Hasbro also expectscapital expenditures to be in the range of $1300 million to $1600 million Forecasts of capital expenditure is basedon information from Q3 2017
14
$(mm) FY 2010 FY 2011 FY 2012 FY 2013 FY 2014 FY 2015 FY 2016 FY 2017 FY 2018 FY 2019 FY 2020 FY 2021 FY 2022 FY 2023 FY 2024
Net Income 39776 38536 33598 28624 41584 45196 55130 57204 61988 63709 63460 67348 66994 68595 68573
Depreciation amp Amortization 14630 16040 15030 18100 15790 15540 15450 15682 15917 16156 16398 16644 16744 16844 16944
Working Capital 82022 87379 94203 89045 100348 100366 86656 87115 92154 100074 99887 106721 106531 109594 110091
Change in Wworking Capital 5357 6824 -5158 11303 018 -13711 459 5039 7920 -187 6834 -190 3063 497
Capex -11260 -9940 -12010 -11203 -11339 -14202 -16734 -14618 -15226 -17330 -14658 -17947 -15636 -17141 -16383
Net Interest expense 7293 9105 9396 9061 10676 9311 8853 9646 10031 10578 10552 9011 9000 9202 9241
Add Back Net Interest After Taxes 5713 7214 6963 7312 8170 6890 6816 7449 8245 8690 8653 7374 7364 7530 7562
FCF 46492 36757 47991 42903 53405 74373 65258 65885 63305 74040 66585 75657 72765 76198
WACC 744
Long-term Growth Rate 263
Year FY 2010 FY 2011 FY 2012 FY 2013 FY 2014 10477 FY 2016 FY 2017 FY 2018 FY 2019 FY 2020 FY 2021 FY 2022 FY 2023 FY 2024
FCF 46492 36757 47991 42903 53405 74373 65258 65885 63305 74040 66585 75657 72765 762
Terminal Value 16269
Total 46492 36757 47991 42903 53405 74373 65258 65885 63305 74040 66585 75657 72765 17031
Enterprise Value 13566
Add Back Initial Cash 1732
Asset value 15298
Subtract Initial Debt 1875
Imputed Equity Value 13423 10713 710 720 730 744 750 760 770
Divide by Shares Outstanding 125 280 11887 11614 11354 11011 10867 10638 10419
Share Value(Base case) 10713 270 11674 11412 11161 10831 10692 10471 10260
Share value(Better Cae) 11841 263 11534 11279 11035 10713 10577 10362 10155
Share Value(Worse case) 9411 250 11275 11033 10800 10493 1036348 10158 9960
Current market value per share 9245 240 11089 10855 10631 10334 10209 10010 9819
Long-
Term
Growth
Rate
WACC
SENSITIVITY
BETTER CASE REVENUE
WORSE CASE REVENUE
BASE CASE REVENUE
APPENDIX 5 SCENARIO ANALYSIS
Source Team Analysis
ASSUMPTIONSbull Franchise Brands revenue will be lumpy increase sharply in the years with a new Transformers moviebull Partner Brands revenue will increase in the years that have partner brand movie releases and new IP dealsbull Hasbro Gaming revenue will increase but the rate at which it will increase will slow down due to the impact of
the digital gaming trendbull Emerging Brands will slowly improve due to continues investment in products and brands innovationbull Hasbrorsquos major marketsrsquo will increase due to growth in traditional toys amp games industry
ASSUMPTIONSbull Franchise Brands revenue will increase faster than the base case due to better than expected storytelling
strategiesbull Partner Brands revenue will increase faster than the base case due to precise capturing of consumersrsquo tastes and
acquisition of more new IPsbull Hasbro Gaming revenue will be supported by stronger demand for face to face play experiencebull Emerging Brands will increase due to successful investment and catering to the popular trendsbull Hasbrorsquos major marketsrsquo growth will remain the same as in base case
ASSUMPTIONSbull Franchise Brands revenue will increase slower than the base case due to inadequate execution of strategiesbull Partner Brands revenue will increase slower than base case due to no new IP acquisitionbull Hasbro Gaming revenue will increase but will have a larger negative impact from the digital gaming trendbull Emerging Brands will increase slower than expected due to inefficient investment and unmeet consumersrsquo tastebull Hasbrorsquos major marketsrsquo growth will remain the same in base case
15
Revenue Breakdown FY 2017 FY 2018 FY 2019 FY 2020 FY 2021 FY 2022 FY 2023 FY 2024
Revenue 537116 568183 617013 615860 657997 656823 675711 678776
Growth Rate 700 578 859 -019 684 -018 288 045
Franchise Brands 255686 24802 26290 25238 26500 25175 26182 25397
Growth Rate 985 -3 6 -4 5 -5 4 -3
Partner Brands 134015 14072 15479 14705 15734 15577 15733 16205
Growth Rate -514 5 10 -5 7 -1 1 3
Hasbro Gaming 97954 11559 13350 15086 16670 18003 18993 19563
Growth Rate 2042 18 16 13 11 8 6 3
Emerging Brands 49461 5020 5121 5249 5406 5595 5819 6081
Growth Rate 615 150 200 250 300 350 400 450
Hasbros Major Market Growth Rate 287 246 243 217 232 207 126 094
Bace Case
Revenue Breakdown FY 2017 FY 2018 FY 2019 FY 2020 FY 2021 FY 2022 FY 2023 FY 2024
Revenue 537116 576169 639807 654623 716589 734610 792943 818555
Growth Rate 700 727 1104 232 947 251 794 323
Franchise Brands 255686 25313 27338 26791 28667 27807 29475 29180
Growth Rate 985 -100 800 -200 700 -300 600 -100
Partner Brands 134015 14340 16060 15579 16981 17150 19380 20349
Growth Rate -514 700 1200 -300 900 100 1300 500
Hasbro Gaming 97954 11559 13870 16298 18742 21085 23193 24933
Growth Rate 2042 18 200 175 150 125 100 75
Emerging Brands 49461 5020 5196 5404 5647 5929 6256 6631
Growth Rate 615 150 3500 4000 4500 5000 5500 6000
Hasbros Major Market Growth Rate 287 246 243 217 232 207 126 094
Better Case
Revenue Breakdown FY 2017 FY 2018 FY 2019 FY 2020 FY 2021 FY 2022 FY 2023 FY 2024
Revenue 537116 558190 594964 582080 596070 583416 589011 579741
Growth Rate 700 392 659 -217 240 -212 096 -157
Franchise Brands 255686 24290 25262 23746 24458 22746 23201 22041
Growth Rate 985 -500 400 -600 300 -700 200 -500
Partner Brands 134015 13804 14908 13864 13171 12776 12648 12775
Growth Rate -514 300 800 -700 -500 -300 -100 100
Hasbro Gaming 97954 11363 12897 14315 15532 16464 17040 17211
Growth Rate 2042 1600 1350 1100 850 600 350 100
Emerging Brands 49461 5020 5020 5045 5096 5172 5276 5408
Growth Rate 615 150 000 050 100 150 200 250
Hasbros Major Market Growth Rate 287 246 243 217 232 207 126 094
Worse Case
bull Fast-developing digital games may become substitutes
for traditional toys
bull Increasing options may intensify the competition in the
market
bull Uncontrollable seasonality in critical sales seasons due to
consumersrsquo behaviors
bull Fierce competition in storytelling strategy (eg Japanese
comics)
bull Increasing labor cost in China where most suppliers are
located
bull Regulatory changes and macroeconomic challenges
globally
APPENDIX 6 SWOT ANALYSIS
W
TO
S
SWOT
bull One of the largest and most recognized companies in
the toys amp games industry globally
bull Strong sales growth (464 compounded annual
growth in the past five years)
bull Exclusive license with well-known IP owners such as
Marvel and Disney
bull Comprehensive product portfolio including games
toys movies and TV series
bull High consumer loyalty and long product life cycles
thanks to storytelling strategy
bull Global presence operational efficiencies involve
increasing sales while decreasing cost
bull Strong penetration in emerging markets (Russia Brazil
and China)
bull Highly concentrated in 3 retailers accounting 64 of
the US sales
bull Encounter difficulties in creating new and unique
brands
bull Heavily rely on existing brands such as Transformers
and Nerf
bull Too big to nimbly respond to the market changes
bull Low percentage of sales in e-commerce accounting for
only 15 of the total sales
bull Integrate the digital trend into the every engagement
experience
bull Create new brands by executing storytelling strategy
bull Partner with e-commerce to elevate sales
bull Partner or create new toys incorporating local culture
(eg acquire IPs of famous Japanese comic stories and
manufacture characters and other toys)
16
APPENDIX 7 PORTER FIVE FORCES ANALYSIS
5 Very High
4 High
3 Medium
2 Low
1 Very Low
LEGEND
Threat of New Entrants ndash Low The threat of new entrants in the toys amp games industry is low Expansion of the digital gamesmarket has brought a lot of small digital game making companies to the industry which have taken market share from HasbroFor example in 2014 Blizzard Company launched Hearthstone (A digital card game similar to the Magic The gathering) whichnow has over $20M revenue per month However the traditional toys market has always been competitive highly consolidatedand always required high-economic-scale for generating profits Accordingly the barriers to entry remain relatively highCompanies in this industry enjoy high brand loyalty because consumers love exclusive characters such as Barbie Transformersand Monopoly which makes it more difficult for new companies to enter Moreover due to the high safety awareness oftraditional toys companies manufacturing processes require non-toxic materials with stricter regulations which not onlyincrease cost but also raise the barriers to entry In rare cases a company may enter the industry by capturing niche market thathas not been occupied by other companies
Bargaining Power of Buyers ndash Low The Bargaining Power of Buyers in the toys amp games industry is low Large retail stores
such as Toys ldquoRrdquo Us Walmart and Target are direct buyers in this industry The bargaining power of direct buyers is low because
there are so many different distribution channels for companies in the industry For example if Walmart refuses to sell Hasbro
products due to high price Hasbro has the ability to keep the same price to every other retailer who desires the product For the
end consumer the bargaining power is low due to exclusive characters belonging to only certain companies Even if prices are
high consumers will not find other companies selling the same characters and have no choice but to accept the price This is
why Toys ldquoRrdquo Us performed well in the past holiday season even during their Chapter 11 bankruptcy process Finally Hasbro will
eventually find new homes for its products even if certain retailers disappear
Bargaining Power of Suppliers ndash Low Hasbro outsources all of its production to third-party suppliers mainly located in
China Since China has a surplus of factories pricing remains competitive in order to get orders These suppliers do not have
much bargaining power with Hasbro Also there are more competitors located in countries with lower labor costs such as India
and Indonesia Considering the increasing labor costs in China Hasbro plan to move 30 of the production from China
Threat of Substitutes ndash Very high The threat for substitute products in this industry is strong and foreseeable Toys amp games
are goods used for a variety of purposes such as entertainment and relaxation People have abundant ways to entertain
themselves and relax themselves Instead of buying Transformers and Marvel heroes consumers may choose to play outdoors or
play other digital games Since there are varieties of entertainment besides toys and games the threat of being substituted in
this industry is very high Some kids prefer digital games over traditional toys making traditional toy making companies face
difficulties if they cannot adapt to the fast-developing digital trend
Rivalry Among Existing Competitors ndash High Rivalry among existing competitors is high due to the highly concentrated
distribution in the industry and limited growth in the future Although each company has its own consumer groups and exclusive
characters the slow growth and increasing number of new characters may lower the profitability and intensify competition
among the existing players
17
APPENDIX 8 SURVEY ANALYSIS
Where Do You Buy Toys
22
21
37
17
0
5
10
15
20
25
30
35
Jan Feb Mar Apr May Jun Jul Aug Sep Oct Nov Dec
When Do You Buy Toys
Lego 1875 1
Hasbro 679 2
Mattel 661 3
Others 298 4
Jakks 179 5
Brand Awareness Weigted Average
We designed a proprietary survey to gauge brand awareness and gain insights on consumer behaviors in the toyindustry We received 116 results (it varied according to different questions) that further supported our analysis
Brand Awareness We mixed several famous toys from different brands such as Hasbro Mattel Lego Jakks andothers and asked respondents to order three items by their interest and awareness We then calculated theweighted average of each brand and analyzed the brand awareness based on the result Since the respondentsconsisted of different age stratification it was easily observed that Lego Barbie and Play-Doh impressed differentgenerations
Digital Games vs Traditional Toys When faced with the question ldquoWhat do your kids cousins nephews nieces andgrandkids typically play withrdquo surprisingly 74 selected traditional toys 16 chose video games while only 10answered tablets Although digital games may offer different play experiences traditional toys are critical inchildhood which we anticipate only modest change in the future
Purchase places Amazon has become the preferred channel to purchase toys It echoed our analysis that if Hasbrocan grow its sales through ecommerce and stand out among its peers they may get more advantage and expandtheir potential market share by capturing increasing group of customers who prefer online shopping
Purchasing and Seasonality Our findings indicated that most sales are concentrated in November December andJanuary with percentages of 14 29 12 respectively which indicates the strong seasonality in the industryAlthough some toys can be popular throughout the year 82 of parents expressed that they would wait until aspecial occasion or holiday season to buy toys for their children
18
GROWTH PROJECTIONWe observed that each Transformers movie release increased revenue of Boyrsquos sector over 60 in 2007 33 in2011 20 in 2014 We also observed that revenue of Boyrsquos sector decreased dramatically in the years without arelease of a Transformers movie For example in years 2010 2012 and 2013 the revenue of Boyrsquos sector decreased7 13 and 21 respectively We believe that the first Transformers movie significantly increased consumerawareness and helped Hasbro increase total revenue The follow-up movies had a smaller impact on the revenueand this impact will further reduce in the future due to competition of other Superhero movies such as DC moviesand Marvel movies Moreover audiences may lose loyalty to Transformers movies as time goes on So we anticipatethat the future release of Transformers movies expected in 2019 2021 and 2023 would have less impact on therevenue In 2011 2015 and 2016 Hasbro acquired new IPs such as Beyblade Yo-Kai Watch and Frozen which helpedHasbro increase revenue In 2011 Beyblade accounted for 111 of the total net revenue In 2016 Frozen helpedHasbro increase Girlrsquos sector revenue by 50 Understanding these historic patterns we expect that Hasbro toacquire new IPs to generate revenue in the forecast period
MARKET PROJECTIONWe believe that Hasbrorsquos major traditional toys amp games business will be negatively impacted by the strong digitalgames market growth We project that Hasbrorsquos major markets will have a downward trend in growth rate from297 in 2017 to 094 growth rate in 2024 We calculated Hasbrorsquos major market growth rate by taking theweighted average of each of Hasbrorsquos lines of businesses in different areas such as Asia Pacific US and Canada andLatin America and the traditional toys amp games growth rate in those markets The results indicate that Hasbrorsquosmajor market will keep growing in the future but the growth rate will slow The final revenue projection is as shownbelow
APPENDIX 9 REVENUE GROWTH PROJECTIONFY 2007 FY 2008 FY 2009 FY 2010 FY 2011 FY 2012 FY 2013 FY 2014 FY 2015 FY 2016
Revenue 38376 40215 40679 40022 42856 40890 40822 42772 44475 50198
Growth rate 479 115 -162 708 -459 -017 478 398 1287
Boysrsquo Toys 10240 10833 14710 13449 18215 15770 12376 14840 17759 18496
Growth rate 579 3578 -857 3544 -1342 -2152 1990 1967 415
Games and Puzzles 13236 13154 13409 12938 11670 11921 13112 12598 12765 13871
Growth rate -062 194 -351 -980 215 999 -392 133 866
Girlsrsquo Toys 6973 7905 7908 8304 7414 7923 10017 10226 7982 11939
Growth rate 1337 004 500 -1072 687 2643 209 -2194 4956
Preschool Toys 4349 4807 4514 5325 5530 5276 5316 5108 5968 5892
Growth rate 1053 -609 1796 385 -459 077 -391 1683 -127
Other (Licensing) 1056 814 139 06 27 mdash mdash mdash mdash mdash
Growth rate -2295 -8296 -9550 33189 mdash mdash mdash mdash mdash
Source Team Analysis NPD
19
Region FY 2016 FY 2017 FY 2018 FY 2019 FY 2020 FY 2021 FY 2022 FY 2023 FY 2024
USCanada 348 215 145 138 091 134 100 -050 -100
EU 275 290 239 208 184 147 117 087 057
Asia Pacific 493 548 584 595 596 590 548 501 453
Latin America -398 334 366 397 394 391 386 381 374
EampL 500 500 500 500 500 500 500 500
Revenue Break 2016 2017 2018 2019 2020 2021 2022 2023 2024
US 51 5050 5000 4950 4900 4850 4800 4750 4700
EU 28 2740 2680 2620 2560 2500 2440 2380 2320
Asia Pacific 7 770 840 910 980 1050 1120 1190 1260
Latin America 9 940 980 1020 1060 1100 1140 1180 1220
EampL 5 500 500 500 500 500 500 500 500
Total 100 10000 10000 10000 10000 10000 10000 10000 10000
Weighted average 287 246 243 217 232 207 126 094
Traditional Toys Market Growth Rate
Revenue Breakdown FY 2016 FY 2017 FY 2018 FY 2019 FY 2020 FY 2021 FY 2022 FY 2023 FY 2024
Revenue 5019822 537116 568183 617013 615860 657997 656823 675711 678776
Growth Rate 1287 700 578 859 -019 684 -018 288 045
Franchise Brands 2327668 255686 248016 262897 252381 265000 251750 261820 253965
Growth Rate 185 985 -300 600 -400 500 -500 400 -300
Partner Brands 141277 134015 140716 154787 147048 157341 155768 157325 162045
Growth Rate 2828 -514 500 1000 -500 700 -100 100 300
Hasbro Gaming 813433 97954 115585 133501 150856 166696 180031 189933 195631
Growth Rate 2282 2042 1800 1550 1300 1050 800 550 300
Emerging Brands 465951 49461 50203 51207 52488 54062 55954 58193 60811
Growth Rate 1693 615 150 200 250 300 350 400 450
Hasbros Major Market Growth Rate 287 246 243 217 232 207 126 094
Source Team Analysis Bloomberg
Source statisticscom
Source plasticsnewscom
Source FRED
APPENDIX 10 COGS ANALYSIS
Source Bloomberg
Source Bloomberg
Year 2018-2019 2020-2024
Freight -324 -100
Paper 011 010
Labor 867 -500
Plastics 300 000
Electronic Device -134 005
COGS Growth Rate 136 -032
We recognize the main factors in cost of goods sold include 2 major components freight and product costsAccording to our research we believe paper plastic labor and electronic devices are the four biggest materialsHasbrorsquos suppliers needs Plastics are the main materials which contribute 45 of cost Paper freight labor andelectronic devices contribute 30 10 5 10 respectively According to Hasbrorsquos supplier list most suppliers arebased in China Therefore the material price data we used were of Chinese market data
FREIGHTSince the majority of Hasbrorsquos suppliers are located inChina the China Export Container Rate was used as theocean freight cost Due to demand slowdown andsteady supply growth the freight price has beendecreasing these past few years This trend shouldcontinue for the next two years and then startdecreasing with a slower rate of 1PAPERThe toys amp games industry is using wood pulp formanufacturing The price of Bleached Hardwood KraftPulp (BHKP) is stable because of strong production Sincethere are few external factors that can adversely affectproduction the paper price should be stable in next fewyears
LABORChinese labor costs have been increasing significantly forthe past few years Hasbro has suffered and tried tomitigate the risk by moving 30 of the production fromChina Thatrsquos why we used 839 of labor growth in2018 and 2019 instead of the historical wage growthrate of 1239 Since Hasbro will move to other low costcountries its labor costs should decrease Therefore weexpect the labor costs will decrease from 2020 to 2024
PLASTICPlastic prices dropped significantly in 2011 because ofoverinvestment in production We expect the market tostabilize and prices to normalize within 5 years The priceof plastics has bottomed out right now but we expectthe price will increase at rate of 3 in 2018 and 2019and then become stable
ELECTRONIC DEVICEThe semiconductors technology has become more andmore mature Therefore the price should slowly dropover time We calculated the average annual growthfrom 2012 to 2017 We believe in the long run the pricechange will follow this trend and decrease annually in2018-2019 at 134 and become stable in 2020-2024
20
BETAWe calculated Hasbrorsquos Beta based on 5 yearrsquos daily returns of Hasbro and SampP 500 Index From the result we canobserve that R-square is 0188 Beta(Slope) is 0853 t-Stat is high with a low P-value which means Hasbro has lowcorrelation with the market and less volatilitysensitivity to the benchmark
WACCWe took the average of cash paid for interest over long-term debt in the last 7 years and the most recently issuedbonds after tax yields to calculate cost of debt
We took the average of CAPM and the two-stage golden growth model to calculate cost of equity In the CAPMmodel we used Beta from our previous calculation and a market premium of 800 (from Bloomberg) and the 10year treasury bond yield as the risk free rate
We applied 2016rsquos debt from the 10-K and valuation datersquo market capitalization to calculate the final WACC resultingin a WACC of 744
APPENDIX 11 BETAWACC AND LONG-TERM GOWTH RATE
Multiple R 0434
R Square 0188
Adjusted R Square 0188
Regression Statistics Coefficients Standard Error t Stat P-value
Intercept 000043 000038 1148 0251
SampP 085275 004994 17074 602926E-59
Coupon Maturity Date Offer Date Offering Amt ($mm) Yield after tax 315 May-15-2021 May-08-2014 3000 333 35 Sep-15-2027 Sep-08-2017 5000 220 51 May-15-2044 May-08-2014 3000 284
Average 279
United States Europe Asia Pacific Latin America EampL
Revenue Breakdown 4500 2100 1500 1400 5
Long-Term GDP Growth 18 12 6 3 5
Weighted Average 263
LONG-TERM GROWTH RATEWe adopted three major projections from World Bank IMF and Federal Reserve Board members and FederalReserve Bank presidents to predict the future economy but only used the latter source for the US economy Weaveraged the numbers from each source to get the economic outlook for 2017 2018 and 2019We then integrated the projection with the revenue breakdown of Hasbro in 2016 and adjusted it based on our ownassumptions In the long term our projections of weights are 45 21 15 14 and 5 for US European UnionAsia Pacific Latin America and Entertainment amp Licensing On one hand we expect Hasbro will have more potentialin emerging markets Also we expect Latin America will achieve higher growth due to higher projections for itseconomic growth Therefore we increased the weight of Asia Pacific and Latin America to 15 and 14 respectivelyOn the other hand we anticipate the revenue in EU will decrease due to the political impact of Brexit and long-sagging retail and consumption in toys industry and adjusted the weight to 21 accordingly For the US marketwith strong growth in emerging markets and steady consumer behavior and revenue trends domestically we projectthe revenue distribution decreasing to 45 As a result we calculated the weighted average growth rate of eachgeographic sector and got a long-term growth rate of 263
21
Beta b 08528
Risk-Free Ratef 255
Expected Market Return 800
Cost of Equity 720
CAPM Model Current Dividend 228
Growth Rate g1 12
Growth Rate g2 5
Number of Short Growth Years 7
Share price 9245
Cost of equity 851
Two- Stage Golden Growth Model
Source Team Analysis Bloomberg
APPENDIX 12 EVEBITDA MULTIPLE ANALYSIS
COMPARABLE VALUATIONWe used EVEBITDA (Enterprise Value Earnings before Interest Tax Depreciation Amortization) for thecomparable valuation After getting EBITDA from the Income Statement (EBIT + Depreciation and Amortization) wecalculated Enterprise Value (EV) by the following formula EV = Market capital + Preferred Equity + Total Debt ndash Cashamp EquivalentWe chose industry peers based on product and target customer similarities then compared three major ratios 5-yrRevenue Growth Operating Leverage (EBITDA Margin) and Debt to Equity Ratio to eliminate the incomparablecompanies But the results may be limited for the following reasons First the US toy industry is small with only alimited number of companies comparable to Hasbro Second we introduced foreign companies since they have somesimilarities to Hasbro Bandai Namco a Japanese entertainment company operates in the same industry as Hasbrobut in the Japanese markets However they do share the same target customers children and teenagers It is alsoworth mentioning that we first included companies such as Brunswick Harley-Davison and Polaris since they also sellconsumer products as well But due to big differences in the products and target customers we removed them fromthe final peer group list
Consequently choosing a company in a different region with different products has some shortcomings makingcomparable valuation less precise than the DCF model Therefore we only weighted the EVEBITDA comparablevaluation as 10 of our final valuation The results do offer great insights into the value of the stock since it is basedon the value of its industry peers For example Hasbro has the highest EBITDA margin tied with Alpha Group whofocused on animation in China The whole industry is less leveraged by debt except for Tomy Although Hasbro grewfaster than its domestic peers the company grew slower than its foreign peers
Hasbro has an EVEBITDA of 1215 which is lower than its main competitor Mattelrsquos multiple of 1634 and also lowerthan its peerrsquos average multiple which is 1359 We used the peer average ratio to calculate the implied stock priceThe implied price of Hasbro using the peer average EVEBITDA is $10361 which is higher than current price of$9245
Company NameAdjusted
EV
EBITDA
T12MEVEBITDA
Implied
Price
Median 550852 57137 964 $7201
Hasbro 1211031 99646 1215 $9211
Mattel 791931 48466 1634 $12560
Tomy 143064 18853 759 $5559
Bandai 550852 74605 738 $5395
Spin Master 441761 25523 1731 $13335
Alpha Group 314579 32600 965 $7208
Goldlok Toys 80568 3260 2471 $19260
Average 504827 43279 1359 $10361
Company Name DebtEquity EBITDA Margin5 Year Average
Revenue Growth
Median 39 14 3
Hasbro 100 19 3
Mattel 80 14 -3
Tomy 200 7 -2
Bandai 1 12 6
Spin Master 32 13 27
Alpha Group 39 19 27
Goldlok Toys 5 15 3
Shares
Outstanding 1245
EV 13200
EBITDA 996
Cash 1732
Minority 0
Total Debt 1882
Market Cap 11515
Hasbro 12 Month TTM Data
22Source Bloomberg
GENERAL TREND OF THE INDUSTRY ndash TRADITIONAL TOYS and GAMES vs VIDEO GAMES
We analyzed the major markets that Hasbro covers and presented the trend of Traditional Toys and Games vs VideoGames in Asia Pacific (China and India) USA and Canada European Union (United Kingdom Germany France andRussia) Latin America (Brazil Mexico and Argentina) It is worth mentioning that although Hasbro does not have astrong presence in Asia Pacific we do expect it will strategically focus on those markets due to their greater potentialAs for the general trend in the industry traditional toys and games have been growing for the past 7 years and willcontinue to expand in the future at a steady pace However since video games develop faster these days they havebecome a major competitor for traditional toys and games and may evolve to become major substitutes in thefuture The weighted percentage of traditional toys and games is projected to decrease from 510 in 2010 to 388in 2021 Therefore it is critical for Hasbro to cater to the digital trend otherwise it may lose significantly in the nearfutureVOLATILE PERFORMANCE IN SUBGROUPTraditional Toys and Games can be further categorized into more subgroups and each group may have differentperformances each year since the trend in this industry is so volatile As of October 2017 toy industry sales in the USreached $1195 billion in total since January growing 3 compared to the same period in 2016 GamesPuzzles havebeen outperforming for the past few years indicating a trend in demand for more face-to-face play experiences Toycompanies can attract a broader customer base by offering sociable items that cannot only attract children but alsoadult customers
In comparison to its direct competitor Mattel Hasbro has several advantages in certain areas but also somedisadvantages For Games Action Figures and Outdoor amp Sports Hasbro has absolute advantages It is worthmentioning that Hasbro has been producing the most games in the market which realized the most growth in thepast years We anticipate that Hasbro will continue to strengthen its advantage in the industry and remain relativelystable in its market size of other less favorable categories
5097 5071 5015 4789 4515 4418 4346 4216 4102 4024 3934 3883
0
10
20
30
40
50
60
0
50000
100000
150000
200000
2010 2011 2012 2013 2014 2015 2016 2017 2018 2019 2020 2021
Total Toys amp Games Market Size
Traditional Toys and Games Video Games Precentage of Traditional ToysTraditional Toys and Games in Total
-1000 -500 000 500 1000 1500
Grand Total
All Other Toys
Plush
GamesPuzzles
Dolls
Vehicles
Youth Electronics
Outdoor amp Sports Toys
InfantToddlerPreschool Toys
Arts amp Crafts
Action Figures amp Accessories
Building Sets
Percent Changes of Retail in the US from Jan to Oct 2017vs Same Period in 2016
APPENDIX 13 INDUSTRY PROJECTION
Source NPD
Source The Toy Association
Source Wall Street Journal
23
US SECTOR
As we observe from Figure 1 after the unprecedented Quantitative Easing turned the tide in the financial crisis theUS GDP never fell out of the 15 - 3 range From the quarterly GDP in Figure 2 although the annual growth ofGDP decreased slightly in 2016 the economic growth remained strong in the third quarter of 2017 realizing 3 ingrowth exceeding analysts expectations The Federal Reserve officially raised the benchmark rate by 025 onDecember 13th the third increase in 2017 signaling a healthy growth in the economy but poteintially resulting in amoderating economy in the futureCONSUMER CONFIDENCE
From the Consumer Sentiment Index we observe a high willingness to spend and strong confidence in the economywhich again strengthened our judgement about the US economy On the other hand the personal consumptionexpenditure decreased recently which may potentially impact Hasbrorsquos business in the US market
The US INTEREST RATEOn December 16th 2008 the Federal Reserve adjusted the interest rate to 025 and left it at this level untilDecember 16th 2015 Moving forward we believe the Fed will continue to raise the interest rates to deal with therising CPI In line with the expectations for 2017 the Federal reserve raised the benchmark three times on March16th June 15th December 13th Based on FOMC participantsrsquo assessments of appropriate monetary policy thepreponderance policy rate will be 2 - 225 225 - 325 275 - 3 in 2018 2019 and 2020 respectively andremain 3 in long run
400
-090
460
520
200
320
270
160
050060
220
280
180
120
310300
-200
-100
000
100
200
300
400
500
600
Quarterly Gross Domestic Product (GDP) Growth
-28
25
16
22
17
2629
15
-400
-300
-200
-100
000
100
200
300
400
2009 2010 2011 2012 2013 2014 2015 2016
Annual Gross Domestic Product (GDP) Growth
-060
-040
-020
000
020
040
060
080
-1500
-1000
-500
000
500
1000
1500
Feb
-09
May
-09
Au
g-09
No
v-09
Feb
-10
May
-10
Au
g-10
No
v-10
Feb
-11
May
-11
Au
g-11
No
v-11
Feb
-12
May
-12
Au
g-12
No
v-12
Feb
-13
May
-13
Au
g-13
No
v-13
Feb
-14
May
-14
Au
g-14
No
v-14
Feb
-15
May
-15
Au
g-15
No
v-15
Feb
-16
May
-16
Au
g-16
No
v-16
Feb
-17
May
-17
Au
g-17
Growth of Index of Consumer Sentiment vs Personal Consumption Expenditure
Consumer Sentiment Index PCE(RHS)
APPENDIX 14 ECONOMY PROJECTION
Source Economic projections of Federal Reserve Board members and Federal Reserve Bank presidents
Source BEASource BEA
Source BEA Surveys of Consumers from University of Michigan
24
LIQUIDITY AND FINACIAL RISK ANALYSISEven though Hasbro has acquired companies several times in the past the past 5-year cash ratio and quick ratio ofHasbro still indicates it has a strong liquidity profile From the table we can see that in the last five years Cash ratioCurrent ratio and Quick ratio have always been above the industry median indicating that Hasbro has strongliquidity Even though these three ratios have a deceasing trend current ratio changed from 261 in 2012 to 199 in2016 we believe that global companies like Hasbro may bring a portion of their overseas capital back to the US dueto the tax-reform resulting in an increase of liquidity for Hasbro in the future Cash ratio will increase due toincreasing revenues in the future but in 2021 the cash ratio will decrease due to payment of debt Overall Hasbrowill be able to keep these three ratios above the industry median for the next several years Other than strongliquidity Hasbro also has a very solid capital structure Hasbrorsquos Debt to Equity ratio changed from 107 in 2012 to091 in 2016 indicating that debt has decreased Hasbro also has over 8x interest coverage ratio indicating that thecompany has strong debt management ability A decreasing net debt EBITDA 109 in 2012 to 046 in 2016illustrates the companyrsquos ability to meet its interest payments and debt obligations is increasing
PROFITABILITY ANALYSISHasbrorsquos ROE has been increasing over the last 5 years from 25 in 2012 to 32 in 2016 increasing 6 annually inthe last 5 years After splitting ROE into 5 elements we observed that the operating margin played the mostimportant role in the ROE increasing Operating margin increased from 1335 in 2012 to 157 in 2015 whichindicates Hasbro did a great job on saving management costs From the comparable table we can observe thatHasbrorsquos main competitor Mattel has much lower ROE approximately 137 mainly due to lower operatingmargins Mattelrsquos operating margin was only 92 in 2016 which is significantly lower than Hasbrorsquos 157 andindustry median 136 Hasbro has much more potential for higher profitability than Mattel
CASH CONVERSION CYCLEHasbro has longer cash conversion cycles which means it will take a longer time to convert resources to cash flowHasbrorsquos cash conversion cycle has a decreasing trend from 134 in 2012 to 112 in 2016 This is due to an increase indays payable outstanding from 308 in 2012 to 535 in 2015 meaning Hasbro has more time to pay suppliersCompared to the cash conversion cycle of the industry median of 742 Hasbrorsquos is 1123 showing Hasbrorsquos lessefficient than other industry peers such as that of Mattel 692 This indicates that Hasbro may be weak in supplychain management This is a potential risk for Hasbro that may adversely affect itrsquos future revenue The decreasingtrend does show that Hasbro is putting in effort to lower its cash conversion cycle
APPENDIX 15 KEY FINANCIALS
Hasbro Mattel
Tax Burden 080 078
Interest Burden 088 079
Operating Margin 1574 952
Asset Turnover 102 084
Financial Leverage 278 270
ROE 3115 1321
ROE Decomposition 2016
2012 2013 2014 2015 2016
Tax Burden 074 081 077 075 080
Interest Burden 083 077 085 086 088
Operating Margin 1332 1121 1480 1576 1574
Asset Turnover 097 094 096 096 102
Financial Leverage 289 274 284 296 278
ROE 2304 1807 2651 2887 3115
Hasbro ROE Decomposition
Hasbro 2012 2013 2014 2015 2016 Industry Median
Days Inventory Outstanding 7212 7233 7377 7858 7375 7375
Days Sales Outstanding 9366 9468 9311 9463 9201 5517
Days Payable Outstanding 3082 3614 4432 4796 5347 4009
Cash Conversion Cycle 13496 13087 12256 12525 11230 7425
Hasbro Mattel Industry median
Days Inventory Outstanding 7375 7575 7375
Days Sales Outstanding 9201 758 5517
Days Payable Outstanding 5347 8227 4009
Cash Conversion Cycle 11230 6928 7425
Source Team Analysis Bloomberg
Liquidity Analysis FY 2012 FY 2013 FY 2014 FY 2015 FY 2016 Industry Median FY 2017 FY 2018 FY 2019 FY 2020 FY 2021 FY 2022 FY 2023 FY 2024
Cash Ratio 088 050 083 092 079 079 098 099 099 099 089 089 090 090
Current Ratio 261 182 253 269 199 195 221 222 223 223 220 220 221 221
Finacial Risk Analysis
Total Debt to Equity 108 081 120 100 091 049 088 088 089 089 070 070 070 070
Interest Coverage Ratio 606 442 682 713 809 756 743 728 729 909 907 909 906
Net Debt EBITDA 110 110 116 087 047 045 015 012 009 008 -005 -005 -007 -007
Profitability Analysis FY 2012 FY 2013 FY 2014 FY 2015 FY 2016 Industry Median FY 2017 FY 2018 FY 2019 FY 2020 FY 2021 FY 2022 FY 2023 FY 2024
Operating Margin 1349 1144 1485 1556 1570 875 1494 1443 1374 1374 1370 1366 1361 1356
Return on Asset 795 656 931 977 1124 697 1002 1044 1018 1016 1078 1074 1075 1070
Return on Equity 2298 1795 2642 2888 3127 1359 2694 2784 2743 2745 2673 2668 2674 2660
25
APPENDIX 16 MONTE CARLO SIMULATION
0
200
400
600
800
1000
1200
$88 $90 $92 $94 $96 $99 $101 $103 $105 $107 $109 $111 $113 $115 $117 $120 $122 $124 $126 $128 $13 $132
FREQ
UA
NC
Y
PRICE
Monte Carlo Simulation
Target Price $107
Source Team Analysis
We used the Monte Carlo simulation to predict the possible price change and identify the most sensitivevariable for Hasbro in our assumption We tested 1) revenue growth rate 2) long-term cash flow growth rateand 3) the discount rate The model proved that the price is most affected by the long-term growth rateCombined with our assumption that revenue and free cash flow will grow in the long-term we applied randomgrowth rates from a specific range to simulate a range of stock prices After running 10000 simulation pathsthe result indicates a 4789 probability that the price of Hasbro will be above $107 There is a 5020probability the price will be between $9245 and $107 The probability of the price being lower than $9245(current price) is only 191
VARIABLE ASSUMPTION
26
Trials 10000
Base $10439
Mean $10685
Median $10646
Standard Deviation 811
Skewness 022
Kurtosis -053
Minimum $8799
25 Percentile $10078
75 Percentile $11257
Maximum $13023
Simulation Statistics
Variable Worse Case Base Case Better Case
2018 Revenue Growth Rate -500 578 727
2019 Revenue Growth Rate -500 859 1104
2020 Revenue Growth Rate -500 -019 232
2021 Revenue Growth Rate -500 684 947
2022 Revenue Growth Rate -500 -018 251
2023 Revenue Growth Rate -500 288 794
2024 Revenue Growth Rate -500 045 323
Long-term Growth Rate 200 263 300
WACC 900 744 600
APPENDIX 17 HASBRO vs OTHER COMPETITORS
Source Team Analysis Bloomberg Glassdoor
We analyzed the major competitors in 6 different aspects and used a weighted average score to rank them These 6aspects include profitability growth financial safety brand awareness efficiency and employee satisfaction Weassessed profitability by operating margin and ROE Growth by the 5-year revenue growth financial safety by marketcapital DE ratio and current ratio brand awareness by result from our survey efficiency by cash conversion cycleemployee satisfaction by Glassdoor review score We measure these elements from very strong (5 score) to veryweak (1 score) For example since LEGO has the highest operating margin of 328 and ROE of 4709 it receivedthe highest score of 5 in profitability Furthermore Mattel has the lowest 5-year revenue growth rate of -237therefore received the lowest score of 1 We used the weighted average of these aspects to calculate the final scoreWe weighted these aspects from the most important to least important which profitability growth and brandawareness are 20 efficiency and employee satisfaction are 15 and financial safety is 10 Taking the weightedaverage for all scores resulted in Hasbro (335) Mattel (27) LEGO (485) and Jakks (125) The result shows thatHasbro and LEGO have an advantage and leading positions in the competitive environment
27
Very Strong 5
Strong 4
Medium 3
Weak 2
Very weak 1
Legend
Company
NameMarket Cap
5 Year
Revenue
Growth Rate
Operating
MarginROE
Cash
Conversion
Cycle
DE ratio Current ratioGlassdoor
Score
Awareness
From
Survey
Hasbro 115B 321 1570 3115 1123 091 199 38 2
Mattel 53B -237 950 1321 6928 089 195 33 3
LEGO NA 1516 3281 4709 8428 004 199 37 1
Jakks 6747M 084 240 087 10562 151 294 27 4
Assessment Profitability GrowthFinancial
Safety
Brand
AwarenessEfficiency
Employee
Satisfaction
Weighted
Average
Hasbro 4 3 4 4 1 4 335
Mattel 1 2 3 3 5 3 27
LEGO 5 5 5 5 4 5 485
Jakks 1 1 2 1 2 1 125
Weight 20 20 10 20 15 15 100
APPENDIX 18 TAX REFORM
The new tax reform is the biggest tax reduction bill in the last 30 years The major change is the reduction ofcorporate tax from 35 to 20 The existing corporate tax rates are 25 in Europe and China and 30 in JapanApparently the new corporate tax rate will make the US become a low-tax country from once being the highest-taxcountry The tax reduction will help US companies increase net income further increase the stock price and pricesof other financial assets Stock price of Hasbro of course will also benefit from it Moreover the tax reform will alsohelp US companies with a global presence such to increase their competenceIt is worth mentioning that the reform will make another big change providing incentives for US companies torepatriate cash by paying only a 155 one-time tax Even though there is $26 trillion in cash outside the US we donot expect most companies to bring back this capital Non-financial US companies studied by Moodyrsquos hoarded$184 trillion in cash outside the US at the end of 2016 Thatrsquos up 11 from 2015 and nearly two and a half timesthe 2008 levels The reason these companies donrsquot invest in the US economy is that the US productivity growth isonly 12 the worst growth rate throughout US history after World War II Lacking investment opportunities andlow productivity may discourage companies to repatriateSince most of Hasbrorsquos cash and cash equivalent remain overseas it may bring part of the capital back to the US fornew investment opportunities Though it is also likely that they may use the money to boost stock performance suchas paying more dividends and buying back moreFurthermore in the short term the reduction in tax from working-class families will create more disposable incomewhich will boost the US economy and increase sales especially in consumer products But for the long-run the taxon working-class families will eventually increase since the government has to find a way to fill the gap betweengovernment expenses and taxable income We believe that will hurt sales of consumer products in the long term
28
Source Bureau of Labor Statistics
Hasbro and Mattel seem to be alike sharing similar game categories and product lines But if we deep into themthey are two very different companies These two companiesrsquo revenue has been steadily increasing from 2010 to2014 But from 2014 to the present Hasbrorsquos revenue has been consistently increasing and we project the trend willlast for the next 7 years On the other hand Mattelrsquos revenue has been decreasing since 2014 and eventually caughtup by Hasbro in 2017 The improper management led to a decrease in Mattelrsquos revenue which further endangertheir cash generating abilities making them cut dividend to almost 13 of the previous level (from $038 to $015) IfMattel cannot turn it around it will continue to dwindle in the industry If stock price of Mattel stock hits $15 it mayeven trigger the MampA between Hasbro and Mattel
Target consumersHasbro and Mattel have different target consumers Hasbro has a much more broadened age range that coversalmost all age segments With products enjoyed by younger customers such as Transformers toys Marvel actionfigures Nerf and products for adults such as Monopoly and Magic The Gathering Hasbro seized customers withdifferent ages and preferences Moreover with strategies such as Brand Blueprint and Expanding Our AudienceHasbro increases the brand awareness through comprehensive media such as movies all-age toys amusement parksand music constantly attracting all-age consumers On the other hand most of Mattelrsquos products such as BarbieWheels Fisher-Price and American Girl only cover consumers with an age from 0 to 7
Storytelling StrategiesHasbro started investing in the Transformers movie in 2007 and has been producing 5 other Franchise Brand moviesincluding Transformers and My Little Pony These movies helped Hasbro to boost its revenues significantly Incomparison Mattel has not yet release any of its own brand movies even though they are scheduled to releaseBarbie and Monster High in 2018 By securing the first-mover-advantage Hasbro can elevate its eco system by tellingmore stories and creating more characters
Partnership MaintenanceHasbro adapted to the trend and acquired only famous IP such as Marvel Star Wars Disney Frozen and Yo-KaiWatch These IPs have high brand awareness gained by frequent and high quality movies release these days On thecontrary Mattel only acquired DC Comic and Jurassic Park IPs that did not do a better job than Hasbrorsquos IPs
Company CultureHasbro has been communal which enables people to act and feel more comfortable when interacting with theirpeers allowing them to be more genuine and more collaboratively oriented This approach will help to increase thesynergy within Hasbro benefiting productivity in the long term On the other hand Mattelrsquos culture has beeneffected as a consequence of shifts in its leadership team which aroused resentments and fragmentation amongdepartments and employees
APPENDIX 19 HASBRO vs MATTEL ANALYSIS
020406080
100120
10
12
01
2
41
20
13
10
12
01
3
41
20
14
10
12
01
4
41
20
15
10
12
01
5
41
20
16
10
12
01
6
41
20
17
10
12
01
7
Stock Performance
Hasbro Stock Price Mattel Stock Price
29
Source Bloomberg Source Bloomberg
APPENDIX 20 MERGERS amp ACQUISITIONS
= $300mm
We think the merger between Hasbro and Mattel will likely not happen for the following reasonsResistance from Management of MattelMattel hired a new CEO in February 2017 who in turn hired a new CFO and CTO If the merger goes through newhires in senior management risk losing their positions They will fight the merger for job security Also since the newmanagement recently joined the company we assume they want to prove themselves by doing everything in theirpower to turn the company around They wouldnrsquot want to simply accept the merger and lose the opportunity toprove their valueShareholder ConcernsMattelrsquos shareholders are not satisfied with the current stock performance One year ago their price was over $30per share They are unlikely to accept a deal valued at their depressed stock price and Hasbro is unlikely to offer aprice close to Mattelrsquos stock price from one year agoMattel is supposed to be owed $135 million in accounts receivable before Toy ldquoRrdquo Usrsquos Chapter 11 filing HoweverToys ldquoRrdquo Usrsquos bankruptcy will expose them to possible loss due to uncertainty in recovery of accounts receivableMattel is also facing a lawsuit by MGA Entertainment who claimed $1 billion compensation to settle the case Basedon the history MGA has a good chance to win which will materially affect Mattelrsquos next yearrsquos earningsConsequently Hasbrorsquos shareholders will not like such risks and will calculate all factors in the valuation of themergerObstacles from DisneyDisney opposed any move from Hasbro if it reduced Disneyrsquos leverage over its main licenses of IPs Theyrsquove opposedmergers twice in the past The first was when Hasbro offered to acquire DreamWorks Disney threated to cancel thetransfer of the Princess license to Hasbro if it continued to process the MampA The same happened when Hasbrooffered to acquire Lions Gate If Hasbro merges with Mattel it will jeopardize Disneyrsquos bargaining power Therefore itis likely that Disney will do whatever it can to stop the mergerRetailers Maintain Bargaining PowerThe three largest customers of Hasbro are Walmart Target and Toy ldquoRrdquo Us They want to leverage in bargainingpower In order to do so they want their inventory diversified with different vendors instead of being monopolizedby Hasbro They can level the playing field by inviting other toy manufactures to put more products on the shelvesand reduce Hasbrorsquos shelf space and position As a result retailers will not be in favor of Hasbrorsquos offer to merge withMattelAntitrust IssuesThis horizontal integration always requires approval from Federal Trade Commission and European Union Europeancompanies will likely oppose the merger If the case has to be appealed to the European Court of Justice it will takeyears to see the final results
Hasbro conducted 21 MampAs in its history with half the cases fully financed by cash half undisclosed and one paid bycash and debt Since 2000 Hasbro changed from acquiring Cyclical Consumer Goods amp Services companies toTechnology and Communication targets The recent case of Backflip in 2013 is a good example showing that Hasbro isactively riding on the digital trend and catering to the increasing needs of digital games We anticipate the futureMampA trend will not change since technology will play a vital role in the toys amp games industry 30
Source Bloomberg
APPENDIX 21 TWO INTERVIEWS FOR MERGER WITH MATTEL
INTERVIEW WITH MR LUTZ MULLEROn January 26th we Skype interviewed Mr Lutz Muller President of Klosters Trading Corporation for his point ofview regarding the potential MampA case between Hasbro and Mattel and key aspects to consider for our research Theinsight from this interview elevated our analysis based on the followingConcerns From European Trade CommissionHasbrorsquos potential acquisition of Mattel could face problems with the European Trade Commission especially in theacquisitions of Barbie American Girl Monsters High and DC Comics which could represent a monopoly in that sectorHowever Hasbro could let go of these brands which overall are worth $168B and continue with the acquisition ofthe rest of the business for $49B This should not affect Mattelrsquos potential in any major way as Fisher Price would bea very attractive brand for HasbroGap Between the Bid Price and Offer PriceBased on Hasbrorsquos past interest in Mattel Mattelrsquos investors could expect a price of $25 for Mattel stock in anacquisition But Mattelrsquos stock has taken a hit because of ongoing lawsuits and improper operations If Mattels stocklanguishes around $15-$18 per share the possibility of an acquisition would increaseBiography for Mr Lutz Mullerbull During 1984 ndash 1987 Mr Lutz served as CEO for DKSH [formerly Diethelm + Keller] USA After brokering a deal
with Walmart for toys with new concept toys he successfully turned around DKSH[formerly Diethelm + Keller] USA and became the Activity Kit Category we know today
bull From 1987 up until now Mr Lutz served as President for Klosters Trading Corporation a consulting companyfounded by him which provides services for financial entities in sales and marketing
31
INTERVIEW WITH HILLARY GREENEOn January 24th we interviewed Professor Greene in person at the UConn School of Law With the benefit ofProfessor Greenelsquos insights and looking at the toy industry broadly we donrsquot believe a Hasbro-Mattel merger wouldbe unduly disruptive However looking at the toy segment that is narrowly focused on the entertainment industry aHasbro-Mattel could be disruptive We also expanded our analysis in other directions
Direct Comparisons Based on ExperiencePast Mergers and the effects on the industry should be considered Overall past merges have been well accepted byFederal Trade Commission (FTC)Market Shares and Concentration Should be ConsideredMarket concentration is one of the most influential aspects when evaluating mergers FTC would usually use theHerfindhal-Hirschman Index (HHI) to classify the markets into Non-Concentrated Markets (HHIlt1500) and HighlyConcentrated Markets (HHIgt2500) We assume the HHI of the industry should be lower than 1500Merger Effect on Reducing CompetitionWe shall also considered the effect of the merger specifically whether competition will decrease after the mergerthis indicates the possibility of forming monopoly In this case we foresee a risk of lowering the competition in theindustryDisruptive Role of a Merging PartyConsidering the power of each company individually non of them can play the role of maverick But due tointeraction and synergy the merger can completely change the situation making Hasbro the maverick Disney couldargue that there would be a monopoly in the manufacturing of movies related toys protecting itself from a toymanufacturing powerhouse in the industry Hence we do see a risk that related companies or studios like Disneycould block the mergerBiography for Professor Greenebull Visiting scholar at Harvard Law School and was previously a visiting scholar at UC Berkeleyrsquos School of Law and
School of Engineeringbull Executive committee member as Chair Elect of the American Association of Law Schoolrsquos Antitrust and Trade
Regulation Section and as a contributing editor to the Antitrust Law Journalrsquos editorial board
APPENDIX 22 INTELLECTUAL PROPERTIES
APPENDIX 23 INSIDER HOLDINGS
IPs Expiration Period
Marvel 2020
Star Wars 2020
Frozen The new license issued in 2016
Trolls The new license issued in 2016
Disney Princess The new license issued in 2016
Beyblade Burst re-launch in 2016
Sesame street 2021
Yo-Kai Watch Launch in 2016
Descendants Launch in 20142015
Jurassic Park Lost in 2017
Hasbrorsquos current contract with Marvel and Star Wars will end in 2020 Hasbro also secured new licenses issued in2016 for three brands Frozen Disney Princess and Trolls and relaunched Beyblade Burst in the same year Its licenseof Sesame Street wonrsquot expire until 2021 Hasbro launched Yo-Kai Watch in 2016 and Descendants in 20142015 In2017 Hasbro lost Jurassic Park IP to its competitor Mattel Hasbro needs to renegotiate with these IPs in the futurewhich may increase royalties due to increasing competition
Other than the new insider shareholders who get shares because of acquisitions management of Hasbro have beenselling their holdings over past year The insider holdings decreased from 9 in May 2017 to 769 in December2017 Alan G Hassenfeld the former chairman and CEO of Hasbro and the 3rd biggest shareholder has beengradually selling shares under his name Most insidersrsquo shares sold were from him in 2017 in which he sold morethan one million shares in February and almost another one million shares latter in July and August Considering he isnot on the management team Hassenfeldrsquos insider selling is not a concern He might sell for his own personalpurposes such as benefits for trustee of his family trust or used for Hassenfeld Foundation It is also worthmentioning that Goldener D Brian the CEO of Hasbro increased his holding by more than 300000 shares by the endof 2017 which accounts for 025 of total shares outstanding of Hasbro Insiders still hold 769 of total sharesoutstanding which is a good sign in a large company like Hasbro In contrast Mattelrsquos insiders only hold 035 of thetotal share outstanding
32Source Team Analysis Bloomberg
APPENDIX 24 MOVIE IMPACT
In 2007 Hasbro released the first Transformers movie series which brought significant impact to Hasbro
Transformers products sales Revenue of the Boyrsquos sector increased over 60 (from $575841 to $1235462) from
2006 to 2007 and Transformers products accounted for 126 of the consolidated net revenue in 2007
In 2009 Hasbro released Transformers Revenge of the Fallen and its partner Marvel released X-Men Origins
Wolverine Revenue of the Boyrsquos sector increased over 9 and Transformers products accounted for 145 of the
consolidated net revenue in 2009
In 2010 Hasbrorsquos partner Marvel released Iron Man 2 however no individual Marvel products accounted more
than 10 of the consolidated net revenue in 2010 Revenue of the Boyrsquos sector decreased 7
In 2011 Hasbro released Transformers Dark of the Moon and Hasbrorsquos partner Marvel released Thor X-Men First
Class and Captain America The First Avenger Revenue of the Boyrsquos sector increased over 33 in 2011 Beyblade
premiered on Cartoon Network in June 2010 which also helped increase of the sales of Beyblade products
Transformers and Beyblade products accounted for 113 and 111 of consolidated net revenues respectively
In 2012 Hasbrorsquos partner Marvel released The Avengers and The Amazing Spider-Man but no individual Marvel
products accounted for over 10 of the consolidated net revenue in 2012 Revenue of the Boyrsquos sector decreased
over 13
In 2013 Hasbrorsquos partner Marvel released Iron Man 3 The Wolverine and Thor The Dark World No individual
Marvel product accounted for more than 10 of consolidated net revenues and revenue of the boyrsquos sector
decreased over 21 while revenue of the Girlrsquos sector increased over 26 due primarily to higher net revenues from
My Little Pony Furby (Hasbro released updated Furby with LCD eyes and a mobile app for the holiday season in
2012) and Nerf Rebelle products
In 2014 Hasbro released Transformers Age of Extinction and My Little Pony Equestria Girls - Rainbow Rocks and
Hasbrorsquos partner Marvel released Captain America The Winter Soldier The Amazing Spider-Man 2 X-Men Days of
Future Past and Guardians of the Galaxy Revenue of the Boyrsquos sector increased over 19 in 2014 Transformers
Nerf and Marvel products were the major contributors to the increase in revenue
In 2015 Hasbrorsquos partner Marvel released Avengers Age of Ultron and Ant-Man and Universal Studios released
Jurassic World Nerf and Hasbrorsquos partner Jurassic World Marvel and Star Wars contributed to higher net revenue
while Transformers contributed less
In 2016 Hasbrorsquos partners Lucas and Marvel released Rogue One A Star Wars Story Captain America Civil War X-
Men Apocalypse and Doctor Strange Revenue of the Boyrsquos sector increased 4 in 2016 Nerf and Yo-Kai Watch
contributed to higher net revenue Revenue of the Girlrsquos sector increased 50 in 2016 with higher net revenue from
Hasbrorsquos line of Disney Princesses and Disney Frozen
In 2017 Hasbro released Transformers The Last Knight and My Little Pony The Movie Hasbrorsquos partners Marvel
and Lucas released Logan Guardians of the Galaxy Vol 2 Spider-Man Homecoming Thor Ragnarok and Star Wars
The Last Jedi We project revenue of the boyrsquos sector will increase around 9
In 2018 Hasbrorsquos partner Marvel is scheduled to release Avengers Infinity War
In 2019 Hasbro is scheduled to release Transformers and Hasbrorsquos partners Marvel and Disney is scheduled to
release Captain America Avengers 4 Frozen 2
In 2020 Hasbrorsquos partner Marvel is scheduled to release Untitled Marvel Movie
In 2021 Hasbro is scheduled to release Transformers
In 2023 Hasbro is scheduled to release Transformers
33
Transformers Movies Release Year 2007 2009 2011 2014 2017
Boys Sector Revenue Growth64 939 3317 1990 900
Transformers Products Account for
The Net Revenue 1260 1450 1130 NA NA
Source Hasbro 10-k filing Bloomberg IMDB
APPENDIX 25 HASBRO RELATED MOVIES TIMELINE
Spider-Man 3 Transformers
IMDB 62 IMDB 70
Iron Man Hulk
IMDB 79 IMDB 68
Star Wars
IMDB 80
Transformers
IMDB 60
X-Men Origin
IMDB 67
2007 2008 2009
2010
Iron Man 2
IMDB 70
Transformers
IMDB 63
Ghost Rider
IMDB 43
Captain America
IMDB 69
X-Men
IMDB 78
Thor
IMDB 70
2011
Frozen
IMDB 75
Thor
IMDB 70
The Wolverine
IMDB 67
Iron Man 3
IMDB 72
Spider-Man
IMDB 70
The Avengers
IMDB 81
2012 2013
2014
Fantastic Four
IMDB 43
Ant-Man
IMDB 73
Avengers
IMDB 74
Jurassic World
IMDB 70
Guardians of the Galaxy
IMDB 81
X-Men
IMDB 80
Spider-Man 2
IMDB 67
Transformers
IMDB 57
Captain America
IMDB 78
2015
2016
2017
Doctor Strange
IMDB 79
X-Men
IMDB 70
Captain America
IMDB 79
Deadpool
IMDB 80
Rogue One
IMDB 78
Guardians of the Galaxy
IMDB 52
Thor
IMDB 81
Spider-Man
IMDB 76
Transformers
IMDB 78
Logan
IMDB 81 IMDB 63
Star Wars
IMDB 75
My Little Pony
34Source IMDB
APPENDIX 26 HASBRO VALUATION IF MERGES WITH MATTEL
RESULTFrom the result we expect that if this MampA goes through Hasbro will have fair value of $13151 the best case inour valuation
WACC 670
Long-term FCF growth 263
Year FY 2011 FY 2012 FY 2013 FY 2014 FY 2015 FY 2016 FY 2017 FY 2018 FY 2019 FY 2020 FY 2021 FY 2022 FY 2023 FY 2024
FCF 46492 36757 47991 42903 53405 74373 53015 78343 81422 98163 97105 113015 117452 128773
Terminal Value 32488
Total 46492 36757 47991 42903 53405 74373 53015 78343 81422 98163 97105 113015 117452 33776
Enterprise Value 26071
Add Back Initial Cash 1913
Asset value 27985
Subtract Initial Debt 11545
Imputed Equity Value 16439
Divide by Shares Outstanding 125
Share value 13151
Current market value per share 9245
35
ASSUMPTIONSbull Due to Hasbrorsquos advantage in storytelling strategies the synergies created with the merger will increase
Mattelrsquos revenue by 5 each year for the next 8 yearsbull Mattel expenses will decease 5 each year for the next 8 years after MampA goes through due to Hasbrorsquos
better management skills and synergy in supply chain managementbull WACC will decrease from 744 to 67 due to Hasbrolsquos issuance of debt to pay Mattel increasing debt will
decrease WACCbull Hasbro will pay Mattel 30 premium of its market capitalization to acquire the company which is around
$68Bbull In order to acquire Mattel Hasbro will issue new debt of $68Bbull FCF from Hasbro will stay the same before the MampAbull MampA will happen in 2018
Source Team Analysis Bloomberg
APPENDIX 27 HISTORIAL STOCK PERFORMANCE amp DRIVERS
1
1
23
4 5 6
7
89
2
3
4
5
6
7
8
9
1
1
36
Date RevenueGap from Revenue
ExpectationEPS
Gap from EPS
Expectation
292015 $13B (+16) $30M 122 001
4202015 $7135M(+5) $5323M 021 013
282016 $147B(+131) $100M 139 009
4182016 $8312M(+165) $5409M 038 014
10172016 $168B(+14) $110M 203 029
262017 $163B(+109) $130M 164 037
4242017 $8497M(+22) $2765M 043 005
7242017 $97251(+106) 973 053 007
10232017 $179B(+65) $10M 205 011
11112017 Hasbro Approaches Mattel for Toy Mega MergerBeat consensus estimation from analysts
Miss consensus estimation from analysts
STOCK PRICE vs FANDAMENTAL
STOCK PRICE DRIVEN BY EARNING REPORTS
Campany Name Mattel
Years 2012 2013 2014 2015 2016 2017 2018 EST 20170930 TTM 20170930 TTM
Stock Price 354 542 551 676 782 909 1070 976
MVE ($M) 45529 71294 69162 84387 97548 113249 - 121653 57008
TEV ($M) 53240 78890 78781 92138 102162 119624 - 128028 83885
Sales ($M) 40890 40822 42772 44475 50198 53712 56818 52436 51055
EBITDA ($M) 5518 4671 6354 6919 7880 8025 8199 10519 4847
NI ($M) 3360 2862 4159 4518 5514 5720 6199 6070 -5804
Total Assets ($M) 43254 44023 45321 47207 50914 57091 59366 55446 61997
BVE ($M) 15074 17278 15084 17041 18854 21232 22268 19563 14397
TEVSales 13 19 18 21 20 22 - 24 16
TEVEBITDA 96 169 124 133 130 149 - 122 173
MVENI 136 249 166 187 177 198 - 200 -98
TEVTotal Assets 12 18 17 20 20 21 - 23 14
MVEBVE 30 41 46 50 52 53 - 62 40
Hasbro
Source Team Analysis Bloomberg
APPENDIX 28 MANAGEMENT TEAM INFORMATION
37Source Team Analysis Bloomberg
ChairmanCEO Hasbro Inc 22017-PRESENT
ChairmanPresidentCEO Hasbro Inc 52015-22017
PresidentCEO Hasbro Inc 52008-52015
Chief Operating Officer Hasbro Inc 12006-52008
President US Toys Segment Hasbro Inc 2003-12006
President US Toys Hasbro Inc 2001-2003
Senior VP amp Gen Mgr US Toys Hasbro Inc 82000-2001
Senior Exec VPCOO Tiger Electronic Inc (became part of Hasbro in 1998) 32000-82000
President Hasbro Inc 22017-PRESENT
President Hasbro Brands Hasbro Inc 102014-22017
Exec VPChief Marketing Ofcr Hasbro Inc 32013-102014
Senior VPChief Marketing Ofcr Hasbro Inc 12008-32013
Exec VPCFO Hasbro Inc 32013-PRESENT
Senior VPCFO Hasbro Inc 52009-32013
Senior VPHead Corp Finance Hasbro Inc 2008-52009
Senior VPController Hasbro Inc 2003-2008
VPAssistant Controller Hasbro Inc 1998-2003
Exec VPChief Commercial Ofcr Hasbro Inc 22013-PRESENT
PresidentNorth America Hasbro Inc 12012-22013
PresidentLatin America Hasbro Inc 12007-122011
Marketing Depts in Netherlands Hasbro Inc 1987-UNKNOWN
Exec VPChief Human Resources Officer 32017-PRESENT
Human Resources 1997-PRESENT
Frito-Lay Co FORMER
Ecolab Inc FORMER
Exec VPChief Legal OfcrSecy Hasbro Inc 2014-PRESENT
Senior VPChief Legal OfcrSecy Hasbro Inc 122010-2014
VP Litigation amp Employment Hasbro Inc 2006-122010
Managing Attorney 1995-2003
Senior Attorney 1993-1995
Attorney 1991-1993
Exec VPChief Strategy Officer Hasbro Inc 22017-PRESENT
Exec VPChief Global Ops amp Bus Dev Ofcr Hasbro Inc 2014-22017
Exec VPGlobal Ops amp Bus Dev Hasbro Inc 102014-UNKNOWN
Exec VPChief Dev Ofcr Hasbro Inc 32013-102014
Senior VPChief Dev Ofcr Hasbro Inc 82008-32013
Chief Mktg OfcrUS TOY Group Hasbro Inc 2004-2008
Gen MgrBIG Kids Hasbro Inc 2002-2004
Exec VPChief Global Ops Hasbro Inc 22017-PRESENT
Assistant Controller - Games Hasbro Inc 1992 - UNKNOWN
Exec VPChief Content Officer 32017-PRESENT
President Hasbro Studios TV development and production division of Hasbro Inc 92009-32017
Brian D Goldner
Mr Goldner served as executive producer and played vital role in the success of 2007 Transformer film which ushered Hasbro to character-based
multimedia company He served as board member of Hasbro from 2008 and became Chairman in 2015 He also served Gap Inc as board member in
Compensation and Development and Molson Coors Brewing Co as borard member in Compensation and Human Resources
Tom Courtney
Being a 31-year veteran at Hasbro Wiebe served different roles in a variaty of toy industry associations and non-profit organizations globally Based on his
cross countries experience he also serves as Advisory Board Member of Northeastern Universityrsquos Center for Emerging Markets
Rudolph Johnson
Rudolph is another senior veteran serving Hasbro 21 years during which he held responsibility in global human resource management organizational and
leadership development and performance management etc He also served as Chairperson of the Hasbro Childrens Hospital Gala Committee from 2010
to 2014 He became the borad memeber of United Way of Rhode Island Inc from 102014
Barbara Finigan
As a 19-year veteran of Hasbro Ms Barbara helped establish Hasbros employment product safety and compliance practices and exerted her
professionalism helping Hasbro operates smoothly in global legal environment She has been a Director of Toy Industry Association Inc since May 2016
Duncan J Billing
Mr Duncan has been leading the product development worldwide and execute the IP strategy aiming to develop an innovative and integrated IP and
product development strategy He played a vital role in managing successful brands such as Star Wars Trivial Pursuit and Ghostbusters He also served as a
board member of Dle Inc from 82006
With his vast experiences serving different companies such as Reebok and Corus Entertainment Mr Frascotti elevated Hasbrorsquos world-class portfolio of
brand He became board member of Corus Entertainment Inc from 12016 to present
John A Frascotti
Deborah M Thomas
Before joining Hasbro Deborah worked at KPMG Peat Marwick LLP With the CPA title and her nearly 20 years serving at Hasbro she is the savvy of
financial status of Hasbro She also served Rhode Island Airport Corp as board member and Seaworld Entertainment Inc as board member since 112013
Wiebe Tinga
Stephen Davis
During his 25-year service at Hasbro Mr Thomas he is responsible for vendor relationships product outsourcing product safty and quality supply chain
management etc He led the successful turn around and the sale of Hasbros games manufacturing operations in Massachusetts and Ireland
In his role Mr Davis is in charge of the lifeline of Hasbro stroytelling of famous brands including GI Joe Transformers Romper Room Trivial Pursuit
Scrabble My Little Pony and Tonka Also he has been working on developing the new kid-friendly content for potential new product He served as Co-
Chairman at National Association of Television Program Executives
(1)Movies TV and Celebrities (nd) Retrieved January 12 2018 from httpwwwimdbcom(2)Cowan D (2015 August 12) Blizzards Hearthstone rakes in more than $20 million a month Retrieved January 1 2018 from httpswwwdigitaltrendscomgaminghearthstone-earning-20-million-monthly(3) Moodys US corporate cash pile grows to $184 trillion (2017 July 18) Retrieved January 2 2018 from httpswwwmoodyscomresearchMoodys-US-corporate-cash-pile-grows-to-184-trillion-led--PR_369922(4)SEC (2017 February 05) Retrieved January 2 2018 from httpswwwsecgov(5) Annual Report (2016 March 01) Retrieved January 3 2018 from httpswwwlegocomen-usaboutuslego-groupannual-report(6) Productivity Growth by Major Sector 1947-2016 Bar Chart (nd) Retrieved January 4 2018 from httpswwwblsgovlpcprodybarhtm(7) Bowman J (2017 July 24) Why Hasbro Inc Stock Dropped Today Retrieved January 25 2018 fromhttpswwwfoolcominvesting20170724why-hasbro-inc-stock-dropped-todayaspx(8) HAS Earnings - Hasbro Inc (nd) Retrieved January 25 2018 from httpsseekingalphacomsymbolHASearnings(9) McKenna B (2017 October 23) Hasbro Posts Solid Third-Quarter Revenue Growth but Its Holiday Quarter Outlook Sends Shares Tumbling Retrieved January 25 2018 from httpswwwfoolcominvesting20171023hasbro-posts-solid-third-quarter-revenue-growth-buaspx(10) Lutz Muller Special situations Marketplace Business Intel On Toys (2017 November 25) Why The MattelHasbro Merger Will In All Likelihood Not Happen Retrieved January 25 2018 from httpsseekingalphacomarticle4127585-mattel-hasbro-merger-will-likelihood-happen(11) Spangler T (2013 July 22) Hasbro Extends Disney Pact for Marvel Star Wars Toys and Games Retrieved January 25 2018 fromhttpvarietycom2013biznewshasbro-extends-disney-pact-for-marvel-star-wars-toys-and-games-1200566115(12) Press A (2009 December 07) Hasbro wins 10-year deal for Sesame Street toys Retrieved January 25 2018 from httpsnypostcom20091207hasbro-wins-10-year-deal-for-sesame-street-toys(13) Hasbro Dolls Up for Descendents (nd) Retrieved January 25 2018 from httpwwwlicensemagcomlicense-globalhasbro-dolls-descendents(14) Dailymailcom K R (2015 December 31) How Hasbro rescued Disneys princesses from Mattel Toymaker wins lucrative business worth $500MILLION from arch rival after Barbie designer took them for granted Retrieved January 25 2018 from httpwwwdailymailcouknewsarticle-3380652How-Hasbro-stole-march-Mattel-win-500-million-Disney-princess-doll-contracthtml(15) World Bank (2017 June) Global Economic Prospects Retrieved November 6 2017 from httpwwwworldbankorgenpublicationglobal-economic-prospects(16)IMF (2017 October) World Economic Outlook Seeking Sustainable Growth Retrieved November 6 2017 from httpswwwimforgenPublicationsWEOIssues20170919world-economic-outlook-october-2017(17)FOMC (2017 September 20) Economic projections of Federal Reserve Board members and Federal Reserve Bank presidents under their individual assessments of projected appropriate monetary policy Retrieved November 6 2017 from httpswwwfederalreservegovmonetarypolicyfiles fomcprojtabl20170920pdf(18)The Toy Association (nd) US Sales Data January to October 2017 Retrieved December 16 2017 from httpwwwtoyassociationorgtaresearchdatau-s-sales-datatoysresearch-and-datadataus-sales-dataaspx(19)NPD (2017 November) Diverging Demographics Determining the Future of Traditional Toys Retrieved December 21 2017 from httpswwwnpdcom(20)Ziobro P (2017 November 14) What a Combined Hasbro-Mattel Could Mean for the Toy Industry Retrieved December 21 2017 from httpswwwwsjcomarticleswhat-a-combined-hasbro-mattel-could-mean-for-the-toy-industry-1510655405(21) All products require an annual contract Prices do not include sales tax (New York residents only) (nd) China average yearly wages in manufacturing 2016 | Statistic Retrieved January 12 2018 from httpswwwstatistacomstatistics743509china-average-yearly-wages-in-manufacturing(22) Resin Pricing - Commodity Thermoplastics (nd) Retrieved January 12 2018 from httpwwwplasticsnewscomresincommodity-thermoplasticshistorical-pricinggrade=13107057CVol1(23) Import Price Index Semiconductor and other electronic component manufacturing for Industrialized Countries (2018 January 10) Retrieved January 12 2018 from httpsfredstlouisfedorgseriesCOINDUSZ3344
APPENDIX 29 REFERENCE
38

000
050
100
150
90
100
110
120
130
140
USD Broad Index vs Federal PolicyBenchmark Rate
USD Broad Index Federal Policy Benchmark Rate
050
150
250
350
1990 1993 1996 1999 2002 2005 2008 2011 2014
Birth Rate
United States European Union
Russian Federation China
Brazil Mexico
0
1
2
3
4
5
6
7
8
1960 1965 1970 1975 1980 1985 1990 1995 2000 2005 2010 2015
Fertility Rate (Births Per Woman)
United States European Union
Russian Federation China
Brazil Mexico
Figure 43
Source Bureau of Labor Statistics
Figure 44
Source Bureau of Labor Statistics
Figure 45
Source Federal Reserve World Bank IMF
Figure 46
Source Bloomberg
10
MK4 Demographic ShiftWomen are having fewer children and some developed economies are facinglow birth rates (Figure 43 Figure 44) which raise concerns of maintaining thepopulation level The birth rate in the US has declined every year since 2007The shift in demographics may cause slower end-user market growth
FINANCIAL amp CREDIT RISKFI1 Interest RateWith the interest rate increased three times in 2017 (Figure 45) and projectedto increase another three times in 2018 we can expect that financing andrefinancing costs will be higher (See Appendix 13)FI2 Bankruptcy of Toys ldquoRrdquo UsToys ldquoRrdquo Us accounts for 9 of Hasbrorsquos net revenue globally The Toys ldquoRrdquo Usbankruptcy is a potential risk to Hasbro as we anticipate more allowance fordoubtful accounts and less accounts receivable due to the uncertainty of ToysldquoRrdquo Us future Also it may complicate the retail channels of Hasbro since ToyldquoRrdquo Us has a strong US presence
OPERATIONAL RISKOP1 Hard to Provide New Loyal BrandsIt is hard for Hasbro to consistently deliver new brand stories AlthoughHasbro has spent tremendous capital on its storytelling strategy lately thecompany has found it challenging to create new unique trademarks whichhistorically have been the core of its salesOP2 Remain Average Level in Catering to E-CommerceE-commerce represents only 15 of its total revenue which is the same as theaverage level in the industry If Hasbro cannot stand out from the crowdother competitors may take advantage of the trendOP3 Revenues Heavily Rely on MediaThe success or failure of blockbuster movies or TV can significantly impact thesales volume and revenue in turn If the Transformers movies do not meetexpectations not only cannot they boost sales but also cost Hasbro in initialinvestmentsOP4 Fail to Maintain Partnership with IP OwnersDue to the dependency on successful stories maintaining good relationshipswith major IP owners is essential Hasbro will pay a high price if it loseslicenses from IP owners such as Disney or MarvelOP5 Potential Financial Challenges in Emerging MarketsIn Q1 2016 some retailers in emerging markets met with difficulties andincurred bad debt Moving forward using a more active strategy whenentering emerging markets Hasbro may face the same risk due to unfamiliarbusiness environments and macroeconomic conditions
MERGERS amp ACQUISITIONSIn November 2017 Hasbro offered its major rival Mattel a takeover plan andgot an immediate rejection It was not the first time that Hasbro proposed tomerge with Mattel (two other proposals in 1996 and late 2015 respectively)Based on our analysis we believe the possibility of MampA is low (See Appendix20) But Hasbro had a successful MampA history It conducted 21 deals (Figure 46)in the past with 10 financed fully in cash one with partly cash and partly debtand 10 remain undisclosed The target companies fit in three major industriesCyclical Consumer Goods amp Services Technology and Communications In thepast three MampA deals two belonged to Communication and one belonged toTechnology which may indicate Hasbrorsquos interest in growing its digitalfootprint We also interviewed two experts Lutz Muller the President ofKlosters Trading Corporation and top expert in the industry who published athorough article of the MampA between Hasbro and Mattel on Seeking Alphaand Professor Hillary Greene Zephaniah Swift Professor of Law at UConnSchool of law and a visiting scholar at Harvard Law School who is an expert inantitrust They both offer great insights about the case and valuablesuggestions for our research (See Appendix 21)
Compnay Type Total Value (mil) Total Number
Communication $700 2
Consumer Cycl $70389 6
Others $69538 8
Technology $26645 5
Total $167272 21
Historical MampA Information
Company Type
APPENDIX 1 GLOSSARY
FRANCHISE BRANDSTransformers A brand based on robots with human shapes that turn into different machinesNerf A toy gun that shoots form soft bulletsMy Little Pony An entertainment franchise based on storytelling This franchise also has physical and virtual toys thataccompany the storiesLittlest Pet Shop A franchise based on animated television series Monopoly A board game where the playersrsquo objective is to own all the properties and all the money availableMagic The Gathering A game where players battle against each other by using cards that represent creatures withpowers and Magics
PARTNER BRANDSMarvel A comic series based on well-known superheroes including Spider-Man Wolverine the Hulk Thor Iron ManCaptain America X-Men the Guardians of the Galaxy and the Fantastic FourFrozen An animated musical fantasy movie produced by Disney including characters of Elsa Anna and OlafDisney Princess Disney animated film characters of the franchise are Snow White Cinderella Aurora Ariel andBelleYo-Kai Watch A Japanese popular mixed-media franchise of role-playing video games created and developed byLevel-5 The franchise has also become a popular anime television seriesStar Wars An epic space opera media franchise centered on a film series created by George LucasBeyblade A Japanese manga series written and illustrated by Takao Aoki focused on a group of kids who form teamsand battle one another using Beyblades
HASBRO GAMING BRANDSTaboo A popular party game that involves filling in the blank with interesting word choicesJenga A game where players take turns removing one block at a time from a tower constructed of 54 blocksScrabble A game in which two to four players score points by placing tiles bearing a single letter onto a boardSpeak OUT A game that players try to say different phrases while wearing a mouthpiecePie Face A game involves two players revolving around the gag of getting a pie in the faceDungeons amp Dragons A fantasy tabletop role-playing game
EMERGING BRANDSPlayskool Educational toys and games for children including Mr Potato Head Tonka Alphie Weebles ElefunSesame Street toys and GlowormBaby Alive A baby doll that eats drinks wets and in some cases messes all with a movable mouthFurby An American electronic robotic toy released in 1998 It resembles a hamster or owl-like creature and wentthrough a period of being a must-have toy following its holiday season launch with continual sales until 2000GI Joe A line of action figures representing four of the branches of the US armed forces with the Action SoldierAction Sailor Action Pilot Action Marine and the Action NurseHanazuki An animated childrens web show made in conjunction with a line of Hanazuki toysFurReal Robotic toys range from guinea pigs to dinosaurs coming in many sizes some are able to be held in a childshand and others are able to be ridden by a child
1011
APPENDIX 2 BALANCE SHEET
Source Team Analysis Bloomberg
ASSUMPTIONSbull There will be no huge MampA in the nest 7 yearsbull Hasbro will not issue new bonds to retire the prior debt that matures in 2021bull Allowance for doubtful account increased in 2017 due to filing of Chapter 11 of Toy ldquoRrdquo Us and decreased to
previous level as uncertainty subsidesbull Hasbro will continue to buyback its stock in the futurebull Hasbro will not issue new shares in the near futurebull The dollarrsquos appreciation will have a slight negative impact in the near future
12
$mm FY 2012 FY 2013 FY 2014 FY 2015 FY 2016 FY 2017 FY 2018 FY 2019 FY 2020 FY 2021 FY 2022 FY 2023 FY 2024
Cash and Equivalents 84970 68245 89317 97675 128229 173229 183248 197007 196638 180392 180018 186048 187027
Operating Current Assets 167810 181701 182593 190375 196212 216297 228808 248471 248007 264976 264503 272109 273343
Property Plant amp Equipment - Net 23041 23626 23749 23753 26740 26205 25681 25167 24664 24171 23929 23809 23571
Other Intangible Assets 41666 37600 32453 28081 24595 219 194 173 153 136 121 108 96
Goodwill 47493 59432 59344 59270 57056 56596 55908 55228 54557 53894 53239 52592 51953
Other Noncurrent Assets 69519 71523 65759 74409 77986 80121 82314 84568 86883 89261 91705 94216 96795
Allowance For Doubtful Accounts 1960 1900 1590 1490 1680 3390 1724 1665 1587 1659 1637 1627 1641
Total Assets 432539 440227 451624 472072 509137 570912 593656 626035 624499 624665 623868 637910 640612
Operating Current Liability 73607 92656 82245 90008 109556 129182 136654 148398 148120 158255 157972 162515 163252
Financial Debt 162079 139662 181238 171168 172097 187530 195001 205636 205132 175186 174963 178901 179659
Other Noncurrent Liabilities 46115 35130 38892 40488 38939 41880 39323 39721 40061 39304 39826 39943 39875
Total Liabilities 281801 267448 302375 301665 320593 358592 370977 393756 393313 372745 372761 381359 382786
MinorityNon Controlling Int (Stckhldrs Eqty) - 4545 4273 4017 2270 - - - - - - - -
Common Stock 10485 10485 10485 10485 10485 10485 10485 10485 10485 10485 10485 10485 10485
Additional Paid In Capital 65594 73418 80627 89363 98542 107763 117847 128875 140935 154124 168547 184319 201567
Treasury Stock (Amount) (253565) (255473) (298007) (304090) (318168) (334240) (351123) (368859) (387491) (407064) (427626) (449227) (471919)
Accumulated Other Comprehensive Income (7231) (3414) (9545) (14600) (19457) (22952) (26649) (30663) (34670) (38952) (43225) (47622) (52038)
Retained Earnings (Accumulated Deficit) 335455 343218 363007 385232 414872 451264 472119 492442 501928 533327 542927 558596 569732
Par Value 050 050 050 050 050 050 050 050 050 050 050 050 050
Shares Issued 20969 20969 20969 20969 20969 20969 20969 20969 20969 20969 20969 20969 20969
Total Shareholders Equity 150738 172779 149249 170407 188544 212321 222679 232280 231186 251919 251107 256551 257827
Total Liabilities and Shareholders Equity 432539 440227 451624 472072 509137 570912 593656 626035 624499 624665 623868 637910 640612
$mm FY 2012 FY 2013 FY 2014 FY 2015 FY 2016 FY 2017 FY 2018 FY 2019 FY 2020 FY 2021 FY 2022 FY 2023 FY 2024
Cash and Equivalents 1964 1550 1978 2069 2519 3034 3087 3147 3149 2888 2886 2917 2920
Operating Current Assets 3880 4127 4043 4033 3854 3789 3854 3969 3971 4242 4240 4266 4267
Property Plant amp Equipment - Net 533 537 526 503 525 459 433 402 395 387 384 373 368
Other Intangible Assets 963 854 719 595 483 383 327 276 246 218 194 169 149
Goodwill 1098 1350 1314 1256 1121 991 942 882 874 863 853 824 811
Other Noncurrent Assets 1607 1625 1456 1576 1532 1403 1387 1351 1391 1429 1470 1477 1511
Allowance For Doubtful Accounts 045 043 035 032 033 059 029 027 025 027 026 026 026
Total Assets 10000 10000 10000 10000 10000 10000 10000 10000 10000 10000 10000 10000 10000
Operating Current Liability 2612 3464 2720 2984 3417 3602 3684 3769 3766 4246 4238 4261 4265
Financial Debt 5752 5222 5994 5674 5368 5230 5256 5222 5215 4700 4694 4691 4693
Other Noncurrent Liabilities 1636 1314 1286 1342 1215 1168 1060 1009 1019 1054 1068 1047 1042
Total Liabilities 10000 10000 10000 10000 10000 10000 10000 10000 10000 10000 10000 10000 10000
MinorityNon Controlling Int (Stckhldrs Eqty) 000 263 286 236 120 000 000 000 000 000 000 000 000
Common Stock 696 607 702 615 556 494 471 451 454 416 418 409 407
Additional Paid In Capital 4352 4249 5402 5244 5226 5075 5292 5548 6096 6118 6712 7184 7818
Treasury Stock (Amount) -16822 -14786 -19967 -17845 -16875 -15742 -15768 -15880 -16761 -16159 -17030 -17510 -18304
Accumulated Other Comprehensive Income -480 -198 -640 -857 -1032 -1081 -1197 -1320 -1500 -1546 -1721 -1856 -2018
Retained Earnings (Accumulated Deficit) 22254 19865 24322 22607 22004 21254 21202 21200 21711 21171 21621 21773 22097
Par Value 003 003 003 003 003 002 002 002 002 002 002 002 002
Shares Issued 1391 1214 1405 1231 1112 988 942 903 907 832 835 817 813
Total Shareholders Equity 10000 10000 10000 10000 10000 10000 10000 10000 10000 10000 10000 10000 10000
APPENDIX 3 INCOME STATEMENT
Source Team Analysis Bloomberg
$(mm) FY 2012 FY 2013 FY 2014 FY 2015 FY 2016 FY 2017 FY 2018 FY 2019 FY 2020 FY 2021 FY 2022 FY 2023 FY 2024
Revenue 100 100 100 100 100 100 100 100 100 100 100 100 100
Revenue growth - - - - - - - - - - - - -
Cost of Goods Sold 4089 4098 3971 3771 3796 3936 3989 4044 4031 4018 4006 3993 3980
Royalties 739 830 714 853 816 780 800 820 840 861 883 905 928
Product development 492 509 520 546 531 500 504 508 512 516 520 524 528
Advertising 1033 975 983 920 930 935 934 935 935 936 937 938 939
Amortization of intangibles 124 192 123 098 070 060 050 040 035 030 025 020 015
Program production cost amortization 102 117 110 095 072 062 057 052 047 042 037 032 027
Selling distribution and administration 2072 2135 2094 2160 2213 2233 2223 2228 2225 2227 2226 2226 2226
Operating Income (Loss) 1349 1144 1485 1556 1570 1494 1443 1374 1374 1370 1366 1361 1356
Net Income GAAP 822 701 972 1016 1098 1065 1091 1033 1030 1024 1020 1015 1010
$(mm) FY 2012 FY 2013 FY 2014 FY 2015 FY 2016 FY 2017 FY 2018 FY 2019 FY 2020 FY 2021 FY 2022 FY 2023 FY 2024
Revenue 408900 408220 427720 444750 501980 537116 568183 617013 615860 657997 656823 675711 678776
Revenue growth -459 -017 478 398 1287 700 578 859 -019 684 -018 288 045
Cost of Goods Sold 167200 167290 169840 167700 190550 211407 226674 249498 248248 264397 263094 269807 270177
COGS as Revenue 4089 4098 3971 3771 3796 3936 3989 4044 4031 4018 4006 3993 3980
Gross Profit 241700 240930 257880 277050 311430 325709 341510 367515 367612 393600 393729 405904 408599
- Operating Expenses 186522 194216 194346 207854 232630 245462 259517 282754 282969 303473 303983 313907 316525
Royalties 30207 33892 30532 37925 40952 41895 45432 50576 51750 56679 58000 61167 62988
Product development 20120 20759 22256 24294 26638 26856 28636 31344 31532 33953 34155 35407 35839
Advertising 42224 39810 42026 40939 46894 50220 53068 57691 57583 61589 61544 63382 63737
Amortization of intangibles 5057 7819 5271 4372 3476 3223 2841 2468 2156 1974 1642 1351 1018
Program production cost amortization 4180 4769 4709 4245 3593 3330 3239 3208 2895 2764 2430 2162 1833
Selling distribution and administration 84735 87168 89554 96080 111077 119938 126301 137467 137054 146515 146212 150438 151110
Operating Income (Loss) 55178 46714 63534 69196 78800 80247 81993 84761 84643 90127 89746 91997 92074
Operating margin 1349 1144 1485 1556 1570 1494 1443 1374 1374 1370 1366 1361 1356
- Non-Operating (Income) Loss 984 1153 954 88 956 6170 6584 7211 7259 7822 7874 8168 8272
Non-Operating (Income) Losssales 241 282 223 198 190 115 116 117 118 119 120 121 122
Pretax Income 45338 35184 53994 60396 69240 74077 75409 77549 77384 82305 81872 83829 83802
- Income Tax Expense (Benefit) 1174 679 1267 157 1593 1687 1342 1384 1392 1496 1488 1523 1523
Tax rate 2589 1930 2347 2600 2301 2278 1780 1785 1799 1817 1817 1817 1817
Income (Loss) from Cont Ops 33598 28394 41324 44696 53310 57204 61988 63709 63460 67348 66994 68595 68573
- Minority Interest 0 -23 -26 -5 -182 00 00 00 00 00 00 00 00
Net Income GAAP 33598 28624 41584 45196 55130 57204 61988 63709 63460 67348 66994 68595 68573
Basic Weighted Avg Shares 1301 1302 1284 125 1253 1245 1225 1205 1185 1165 1145 1125 1105
Basic EPS GAAP 258 220 324 362 440 459 506 529 536 578 585 610 621
ASSUMPTIONSbull Revenue will grow in the next 7 years due to the release of new movies new IP acquisitions and Hasbrorsquos
major marketsrsquo growthbull COGS will increase due to plastic and labor cost increases from 2018 - 2019 and slightly decrease from 2020 to
2024bull Operating expense will increase mainly due to increasing royalties and COGSbull Tax rate will decrease due to the new tax billbull Shares outstanding will decrease due to stock buybackbull EPS will increase due to stock buyback and revenue and earning increase
13
APPENDIX 4 DISCOUNTED CASH FLOW VALUATION
Source Team Analysis Bloomberg
We used the Discounted Cash Flow Model to calculate free cash flow asNet Income + Depreciation amp Amortization ndash Change in Working Capital ndash Capital Expense + Net Interest after taxand terminal value using long-term growth rate We added back cash and subtracted total debt to get the equityvalue and divided by the number of basic shares outstanding to calculate the fair value of Hasbrorsquos stock Wecalculated capital expenditure by change in Net PPampE+ depreciation Capital expenditure increased in recent yearsbecause of Hasbrorsquos investment in information systems and new office for its headquarters Hasbro also expectscapital expenditures to be in the range of $1300 million to $1600 million Forecasts of capital expenditure is basedon information from Q3 2017
14
$(mm) FY 2010 FY 2011 FY 2012 FY 2013 FY 2014 FY 2015 FY 2016 FY 2017 FY 2018 FY 2019 FY 2020 FY 2021 FY 2022 FY 2023 FY 2024
Net Income 39776 38536 33598 28624 41584 45196 55130 57204 61988 63709 63460 67348 66994 68595 68573
Depreciation amp Amortization 14630 16040 15030 18100 15790 15540 15450 15682 15917 16156 16398 16644 16744 16844 16944
Working Capital 82022 87379 94203 89045 100348 100366 86656 87115 92154 100074 99887 106721 106531 109594 110091
Change in Wworking Capital 5357 6824 -5158 11303 018 -13711 459 5039 7920 -187 6834 -190 3063 497
Capex -11260 -9940 -12010 -11203 -11339 -14202 -16734 -14618 -15226 -17330 -14658 -17947 -15636 -17141 -16383
Net Interest expense 7293 9105 9396 9061 10676 9311 8853 9646 10031 10578 10552 9011 9000 9202 9241
Add Back Net Interest After Taxes 5713 7214 6963 7312 8170 6890 6816 7449 8245 8690 8653 7374 7364 7530 7562
FCF 46492 36757 47991 42903 53405 74373 65258 65885 63305 74040 66585 75657 72765 76198
WACC 744
Long-term Growth Rate 263
Year FY 2010 FY 2011 FY 2012 FY 2013 FY 2014 10477 FY 2016 FY 2017 FY 2018 FY 2019 FY 2020 FY 2021 FY 2022 FY 2023 FY 2024
FCF 46492 36757 47991 42903 53405 74373 65258 65885 63305 74040 66585 75657 72765 762
Terminal Value 16269
Total 46492 36757 47991 42903 53405 74373 65258 65885 63305 74040 66585 75657 72765 17031
Enterprise Value 13566
Add Back Initial Cash 1732
Asset value 15298
Subtract Initial Debt 1875
Imputed Equity Value 13423 10713 710 720 730 744 750 760 770
Divide by Shares Outstanding 125 280 11887 11614 11354 11011 10867 10638 10419
Share Value(Base case) 10713 270 11674 11412 11161 10831 10692 10471 10260
Share value(Better Cae) 11841 263 11534 11279 11035 10713 10577 10362 10155
Share Value(Worse case) 9411 250 11275 11033 10800 10493 1036348 10158 9960
Current market value per share 9245 240 11089 10855 10631 10334 10209 10010 9819
Long-
Term
Growth
Rate
WACC
SENSITIVITY
BETTER CASE REVENUE
WORSE CASE REVENUE
BASE CASE REVENUE
APPENDIX 5 SCENARIO ANALYSIS
Source Team Analysis
ASSUMPTIONSbull Franchise Brands revenue will be lumpy increase sharply in the years with a new Transformers moviebull Partner Brands revenue will increase in the years that have partner brand movie releases and new IP dealsbull Hasbro Gaming revenue will increase but the rate at which it will increase will slow down due to the impact of
the digital gaming trendbull Emerging Brands will slowly improve due to continues investment in products and brands innovationbull Hasbrorsquos major marketsrsquo will increase due to growth in traditional toys amp games industry
ASSUMPTIONSbull Franchise Brands revenue will increase faster than the base case due to better than expected storytelling
strategiesbull Partner Brands revenue will increase faster than the base case due to precise capturing of consumersrsquo tastes and
acquisition of more new IPsbull Hasbro Gaming revenue will be supported by stronger demand for face to face play experiencebull Emerging Brands will increase due to successful investment and catering to the popular trendsbull Hasbrorsquos major marketsrsquo growth will remain the same as in base case
ASSUMPTIONSbull Franchise Brands revenue will increase slower than the base case due to inadequate execution of strategiesbull Partner Brands revenue will increase slower than base case due to no new IP acquisitionbull Hasbro Gaming revenue will increase but will have a larger negative impact from the digital gaming trendbull Emerging Brands will increase slower than expected due to inefficient investment and unmeet consumersrsquo tastebull Hasbrorsquos major marketsrsquo growth will remain the same in base case
15
Revenue Breakdown FY 2017 FY 2018 FY 2019 FY 2020 FY 2021 FY 2022 FY 2023 FY 2024
Revenue 537116 568183 617013 615860 657997 656823 675711 678776
Growth Rate 700 578 859 -019 684 -018 288 045
Franchise Brands 255686 24802 26290 25238 26500 25175 26182 25397
Growth Rate 985 -3 6 -4 5 -5 4 -3
Partner Brands 134015 14072 15479 14705 15734 15577 15733 16205
Growth Rate -514 5 10 -5 7 -1 1 3
Hasbro Gaming 97954 11559 13350 15086 16670 18003 18993 19563
Growth Rate 2042 18 16 13 11 8 6 3
Emerging Brands 49461 5020 5121 5249 5406 5595 5819 6081
Growth Rate 615 150 200 250 300 350 400 450
Hasbros Major Market Growth Rate 287 246 243 217 232 207 126 094
Bace Case
Revenue Breakdown FY 2017 FY 2018 FY 2019 FY 2020 FY 2021 FY 2022 FY 2023 FY 2024
Revenue 537116 576169 639807 654623 716589 734610 792943 818555
Growth Rate 700 727 1104 232 947 251 794 323
Franchise Brands 255686 25313 27338 26791 28667 27807 29475 29180
Growth Rate 985 -100 800 -200 700 -300 600 -100
Partner Brands 134015 14340 16060 15579 16981 17150 19380 20349
Growth Rate -514 700 1200 -300 900 100 1300 500
Hasbro Gaming 97954 11559 13870 16298 18742 21085 23193 24933
Growth Rate 2042 18 200 175 150 125 100 75
Emerging Brands 49461 5020 5196 5404 5647 5929 6256 6631
Growth Rate 615 150 3500 4000 4500 5000 5500 6000
Hasbros Major Market Growth Rate 287 246 243 217 232 207 126 094
Better Case
Revenue Breakdown FY 2017 FY 2018 FY 2019 FY 2020 FY 2021 FY 2022 FY 2023 FY 2024
Revenue 537116 558190 594964 582080 596070 583416 589011 579741
Growth Rate 700 392 659 -217 240 -212 096 -157
Franchise Brands 255686 24290 25262 23746 24458 22746 23201 22041
Growth Rate 985 -500 400 -600 300 -700 200 -500
Partner Brands 134015 13804 14908 13864 13171 12776 12648 12775
Growth Rate -514 300 800 -700 -500 -300 -100 100
Hasbro Gaming 97954 11363 12897 14315 15532 16464 17040 17211
Growth Rate 2042 1600 1350 1100 850 600 350 100
Emerging Brands 49461 5020 5020 5045 5096 5172 5276 5408
Growth Rate 615 150 000 050 100 150 200 250
Hasbros Major Market Growth Rate 287 246 243 217 232 207 126 094
Worse Case
bull Fast-developing digital games may become substitutes
for traditional toys
bull Increasing options may intensify the competition in the
market
bull Uncontrollable seasonality in critical sales seasons due to
consumersrsquo behaviors
bull Fierce competition in storytelling strategy (eg Japanese
comics)
bull Increasing labor cost in China where most suppliers are
located
bull Regulatory changes and macroeconomic challenges
globally
APPENDIX 6 SWOT ANALYSIS
W
TO
S
SWOT
bull One of the largest and most recognized companies in
the toys amp games industry globally
bull Strong sales growth (464 compounded annual
growth in the past five years)
bull Exclusive license with well-known IP owners such as
Marvel and Disney
bull Comprehensive product portfolio including games
toys movies and TV series
bull High consumer loyalty and long product life cycles
thanks to storytelling strategy
bull Global presence operational efficiencies involve
increasing sales while decreasing cost
bull Strong penetration in emerging markets (Russia Brazil
and China)
bull Highly concentrated in 3 retailers accounting 64 of
the US sales
bull Encounter difficulties in creating new and unique
brands
bull Heavily rely on existing brands such as Transformers
and Nerf
bull Too big to nimbly respond to the market changes
bull Low percentage of sales in e-commerce accounting for
only 15 of the total sales
bull Integrate the digital trend into the every engagement
experience
bull Create new brands by executing storytelling strategy
bull Partner with e-commerce to elevate sales
bull Partner or create new toys incorporating local culture
(eg acquire IPs of famous Japanese comic stories and
manufacture characters and other toys)
16
APPENDIX 7 PORTER FIVE FORCES ANALYSIS
5 Very High
4 High
3 Medium
2 Low
1 Very Low
LEGEND
Threat of New Entrants ndash Low The threat of new entrants in the toys amp games industry is low Expansion of the digital gamesmarket has brought a lot of small digital game making companies to the industry which have taken market share from HasbroFor example in 2014 Blizzard Company launched Hearthstone (A digital card game similar to the Magic The gathering) whichnow has over $20M revenue per month However the traditional toys market has always been competitive highly consolidatedand always required high-economic-scale for generating profits Accordingly the barriers to entry remain relatively highCompanies in this industry enjoy high brand loyalty because consumers love exclusive characters such as Barbie Transformersand Monopoly which makes it more difficult for new companies to enter Moreover due to the high safety awareness oftraditional toys companies manufacturing processes require non-toxic materials with stricter regulations which not onlyincrease cost but also raise the barriers to entry In rare cases a company may enter the industry by capturing niche market thathas not been occupied by other companies
Bargaining Power of Buyers ndash Low The Bargaining Power of Buyers in the toys amp games industry is low Large retail stores
such as Toys ldquoRrdquo Us Walmart and Target are direct buyers in this industry The bargaining power of direct buyers is low because
there are so many different distribution channels for companies in the industry For example if Walmart refuses to sell Hasbro
products due to high price Hasbro has the ability to keep the same price to every other retailer who desires the product For the
end consumer the bargaining power is low due to exclusive characters belonging to only certain companies Even if prices are
high consumers will not find other companies selling the same characters and have no choice but to accept the price This is
why Toys ldquoRrdquo Us performed well in the past holiday season even during their Chapter 11 bankruptcy process Finally Hasbro will
eventually find new homes for its products even if certain retailers disappear
Bargaining Power of Suppliers ndash Low Hasbro outsources all of its production to third-party suppliers mainly located in
China Since China has a surplus of factories pricing remains competitive in order to get orders These suppliers do not have
much bargaining power with Hasbro Also there are more competitors located in countries with lower labor costs such as India
and Indonesia Considering the increasing labor costs in China Hasbro plan to move 30 of the production from China
Threat of Substitutes ndash Very high The threat for substitute products in this industry is strong and foreseeable Toys amp games
are goods used for a variety of purposes such as entertainment and relaxation People have abundant ways to entertain
themselves and relax themselves Instead of buying Transformers and Marvel heroes consumers may choose to play outdoors or
play other digital games Since there are varieties of entertainment besides toys and games the threat of being substituted in
this industry is very high Some kids prefer digital games over traditional toys making traditional toy making companies face
difficulties if they cannot adapt to the fast-developing digital trend
Rivalry Among Existing Competitors ndash High Rivalry among existing competitors is high due to the highly concentrated
distribution in the industry and limited growth in the future Although each company has its own consumer groups and exclusive
characters the slow growth and increasing number of new characters may lower the profitability and intensify competition
among the existing players
17
APPENDIX 8 SURVEY ANALYSIS
Where Do You Buy Toys
22
21
37
17
0
5
10
15
20
25
30
35
Jan Feb Mar Apr May Jun Jul Aug Sep Oct Nov Dec
When Do You Buy Toys
Lego 1875 1
Hasbro 679 2
Mattel 661 3
Others 298 4
Jakks 179 5
Brand Awareness Weigted Average
We designed a proprietary survey to gauge brand awareness and gain insights on consumer behaviors in the toyindustry We received 116 results (it varied according to different questions) that further supported our analysis
Brand Awareness We mixed several famous toys from different brands such as Hasbro Mattel Lego Jakks andothers and asked respondents to order three items by their interest and awareness We then calculated theweighted average of each brand and analyzed the brand awareness based on the result Since the respondentsconsisted of different age stratification it was easily observed that Lego Barbie and Play-Doh impressed differentgenerations
Digital Games vs Traditional Toys When faced with the question ldquoWhat do your kids cousins nephews nieces andgrandkids typically play withrdquo surprisingly 74 selected traditional toys 16 chose video games while only 10answered tablets Although digital games may offer different play experiences traditional toys are critical inchildhood which we anticipate only modest change in the future
Purchase places Amazon has become the preferred channel to purchase toys It echoed our analysis that if Hasbrocan grow its sales through ecommerce and stand out among its peers they may get more advantage and expandtheir potential market share by capturing increasing group of customers who prefer online shopping
Purchasing and Seasonality Our findings indicated that most sales are concentrated in November December andJanuary with percentages of 14 29 12 respectively which indicates the strong seasonality in the industryAlthough some toys can be popular throughout the year 82 of parents expressed that they would wait until aspecial occasion or holiday season to buy toys for their children
18
GROWTH PROJECTIONWe observed that each Transformers movie release increased revenue of Boyrsquos sector over 60 in 2007 33 in2011 20 in 2014 We also observed that revenue of Boyrsquos sector decreased dramatically in the years without arelease of a Transformers movie For example in years 2010 2012 and 2013 the revenue of Boyrsquos sector decreased7 13 and 21 respectively We believe that the first Transformers movie significantly increased consumerawareness and helped Hasbro increase total revenue The follow-up movies had a smaller impact on the revenueand this impact will further reduce in the future due to competition of other Superhero movies such as DC moviesand Marvel movies Moreover audiences may lose loyalty to Transformers movies as time goes on So we anticipatethat the future release of Transformers movies expected in 2019 2021 and 2023 would have less impact on therevenue In 2011 2015 and 2016 Hasbro acquired new IPs such as Beyblade Yo-Kai Watch and Frozen which helpedHasbro increase revenue In 2011 Beyblade accounted for 111 of the total net revenue In 2016 Frozen helpedHasbro increase Girlrsquos sector revenue by 50 Understanding these historic patterns we expect that Hasbro toacquire new IPs to generate revenue in the forecast period
MARKET PROJECTIONWe believe that Hasbrorsquos major traditional toys amp games business will be negatively impacted by the strong digitalgames market growth We project that Hasbrorsquos major markets will have a downward trend in growth rate from297 in 2017 to 094 growth rate in 2024 We calculated Hasbrorsquos major market growth rate by taking theweighted average of each of Hasbrorsquos lines of businesses in different areas such as Asia Pacific US and Canada andLatin America and the traditional toys amp games growth rate in those markets The results indicate that Hasbrorsquosmajor market will keep growing in the future but the growth rate will slow The final revenue projection is as shownbelow
APPENDIX 9 REVENUE GROWTH PROJECTIONFY 2007 FY 2008 FY 2009 FY 2010 FY 2011 FY 2012 FY 2013 FY 2014 FY 2015 FY 2016
Revenue 38376 40215 40679 40022 42856 40890 40822 42772 44475 50198
Growth rate 479 115 -162 708 -459 -017 478 398 1287
Boysrsquo Toys 10240 10833 14710 13449 18215 15770 12376 14840 17759 18496
Growth rate 579 3578 -857 3544 -1342 -2152 1990 1967 415
Games and Puzzles 13236 13154 13409 12938 11670 11921 13112 12598 12765 13871
Growth rate -062 194 -351 -980 215 999 -392 133 866
Girlsrsquo Toys 6973 7905 7908 8304 7414 7923 10017 10226 7982 11939
Growth rate 1337 004 500 -1072 687 2643 209 -2194 4956
Preschool Toys 4349 4807 4514 5325 5530 5276 5316 5108 5968 5892
Growth rate 1053 -609 1796 385 -459 077 -391 1683 -127
Other (Licensing) 1056 814 139 06 27 mdash mdash mdash mdash mdash
Growth rate -2295 -8296 -9550 33189 mdash mdash mdash mdash mdash
Source Team Analysis NPD
19
Region FY 2016 FY 2017 FY 2018 FY 2019 FY 2020 FY 2021 FY 2022 FY 2023 FY 2024
USCanada 348 215 145 138 091 134 100 -050 -100
EU 275 290 239 208 184 147 117 087 057
Asia Pacific 493 548 584 595 596 590 548 501 453
Latin America -398 334 366 397 394 391 386 381 374
EampL 500 500 500 500 500 500 500 500
Revenue Break 2016 2017 2018 2019 2020 2021 2022 2023 2024
US 51 5050 5000 4950 4900 4850 4800 4750 4700
EU 28 2740 2680 2620 2560 2500 2440 2380 2320
Asia Pacific 7 770 840 910 980 1050 1120 1190 1260
Latin America 9 940 980 1020 1060 1100 1140 1180 1220
EampL 5 500 500 500 500 500 500 500 500
Total 100 10000 10000 10000 10000 10000 10000 10000 10000
Weighted average 287 246 243 217 232 207 126 094
Traditional Toys Market Growth Rate
Revenue Breakdown FY 2016 FY 2017 FY 2018 FY 2019 FY 2020 FY 2021 FY 2022 FY 2023 FY 2024
Revenue 5019822 537116 568183 617013 615860 657997 656823 675711 678776
Growth Rate 1287 700 578 859 -019 684 -018 288 045
Franchise Brands 2327668 255686 248016 262897 252381 265000 251750 261820 253965
Growth Rate 185 985 -300 600 -400 500 -500 400 -300
Partner Brands 141277 134015 140716 154787 147048 157341 155768 157325 162045
Growth Rate 2828 -514 500 1000 -500 700 -100 100 300
Hasbro Gaming 813433 97954 115585 133501 150856 166696 180031 189933 195631
Growth Rate 2282 2042 1800 1550 1300 1050 800 550 300
Emerging Brands 465951 49461 50203 51207 52488 54062 55954 58193 60811
Growth Rate 1693 615 150 200 250 300 350 400 450
Hasbros Major Market Growth Rate 287 246 243 217 232 207 126 094
Source Team Analysis Bloomberg
Source statisticscom
Source plasticsnewscom
Source FRED
APPENDIX 10 COGS ANALYSIS
Source Bloomberg
Source Bloomberg
Year 2018-2019 2020-2024
Freight -324 -100
Paper 011 010
Labor 867 -500
Plastics 300 000
Electronic Device -134 005
COGS Growth Rate 136 -032
We recognize the main factors in cost of goods sold include 2 major components freight and product costsAccording to our research we believe paper plastic labor and electronic devices are the four biggest materialsHasbrorsquos suppliers needs Plastics are the main materials which contribute 45 of cost Paper freight labor andelectronic devices contribute 30 10 5 10 respectively According to Hasbrorsquos supplier list most suppliers arebased in China Therefore the material price data we used were of Chinese market data
FREIGHTSince the majority of Hasbrorsquos suppliers are located inChina the China Export Container Rate was used as theocean freight cost Due to demand slowdown andsteady supply growth the freight price has beendecreasing these past few years This trend shouldcontinue for the next two years and then startdecreasing with a slower rate of 1PAPERThe toys amp games industry is using wood pulp formanufacturing The price of Bleached Hardwood KraftPulp (BHKP) is stable because of strong production Sincethere are few external factors that can adversely affectproduction the paper price should be stable in next fewyears
LABORChinese labor costs have been increasing significantly forthe past few years Hasbro has suffered and tried tomitigate the risk by moving 30 of the production fromChina Thatrsquos why we used 839 of labor growth in2018 and 2019 instead of the historical wage growthrate of 1239 Since Hasbro will move to other low costcountries its labor costs should decrease Therefore weexpect the labor costs will decrease from 2020 to 2024
PLASTICPlastic prices dropped significantly in 2011 because ofoverinvestment in production We expect the market tostabilize and prices to normalize within 5 years The priceof plastics has bottomed out right now but we expectthe price will increase at rate of 3 in 2018 and 2019and then become stable
ELECTRONIC DEVICEThe semiconductors technology has become more andmore mature Therefore the price should slowly dropover time We calculated the average annual growthfrom 2012 to 2017 We believe in the long run the pricechange will follow this trend and decrease annually in2018-2019 at 134 and become stable in 2020-2024
20
BETAWe calculated Hasbrorsquos Beta based on 5 yearrsquos daily returns of Hasbro and SampP 500 Index From the result we canobserve that R-square is 0188 Beta(Slope) is 0853 t-Stat is high with a low P-value which means Hasbro has lowcorrelation with the market and less volatilitysensitivity to the benchmark
WACCWe took the average of cash paid for interest over long-term debt in the last 7 years and the most recently issuedbonds after tax yields to calculate cost of debt
We took the average of CAPM and the two-stage golden growth model to calculate cost of equity In the CAPMmodel we used Beta from our previous calculation and a market premium of 800 (from Bloomberg) and the 10year treasury bond yield as the risk free rate
We applied 2016rsquos debt from the 10-K and valuation datersquo market capitalization to calculate the final WACC resultingin a WACC of 744
APPENDIX 11 BETAWACC AND LONG-TERM GOWTH RATE
Multiple R 0434
R Square 0188
Adjusted R Square 0188
Regression Statistics Coefficients Standard Error t Stat P-value
Intercept 000043 000038 1148 0251
SampP 085275 004994 17074 602926E-59
Coupon Maturity Date Offer Date Offering Amt ($mm) Yield after tax 315 May-15-2021 May-08-2014 3000 333 35 Sep-15-2027 Sep-08-2017 5000 220 51 May-15-2044 May-08-2014 3000 284
Average 279
United States Europe Asia Pacific Latin America EampL
Revenue Breakdown 4500 2100 1500 1400 5
Long-Term GDP Growth 18 12 6 3 5
Weighted Average 263
LONG-TERM GROWTH RATEWe adopted three major projections from World Bank IMF and Federal Reserve Board members and FederalReserve Bank presidents to predict the future economy but only used the latter source for the US economy Weaveraged the numbers from each source to get the economic outlook for 2017 2018 and 2019We then integrated the projection with the revenue breakdown of Hasbro in 2016 and adjusted it based on our ownassumptions In the long term our projections of weights are 45 21 15 14 and 5 for US European UnionAsia Pacific Latin America and Entertainment amp Licensing On one hand we expect Hasbro will have more potentialin emerging markets Also we expect Latin America will achieve higher growth due to higher projections for itseconomic growth Therefore we increased the weight of Asia Pacific and Latin America to 15 and 14 respectivelyOn the other hand we anticipate the revenue in EU will decrease due to the political impact of Brexit and long-sagging retail and consumption in toys industry and adjusted the weight to 21 accordingly For the US marketwith strong growth in emerging markets and steady consumer behavior and revenue trends domestically we projectthe revenue distribution decreasing to 45 As a result we calculated the weighted average growth rate of eachgeographic sector and got a long-term growth rate of 263
21
Beta b 08528
Risk-Free Ratef 255
Expected Market Return 800
Cost of Equity 720
CAPM Model Current Dividend 228
Growth Rate g1 12
Growth Rate g2 5
Number of Short Growth Years 7
Share price 9245
Cost of equity 851
Two- Stage Golden Growth Model
Source Team Analysis Bloomberg
APPENDIX 12 EVEBITDA MULTIPLE ANALYSIS
COMPARABLE VALUATIONWe used EVEBITDA (Enterprise Value Earnings before Interest Tax Depreciation Amortization) for thecomparable valuation After getting EBITDA from the Income Statement (EBIT + Depreciation and Amortization) wecalculated Enterprise Value (EV) by the following formula EV = Market capital + Preferred Equity + Total Debt ndash Cashamp EquivalentWe chose industry peers based on product and target customer similarities then compared three major ratios 5-yrRevenue Growth Operating Leverage (EBITDA Margin) and Debt to Equity Ratio to eliminate the incomparablecompanies But the results may be limited for the following reasons First the US toy industry is small with only alimited number of companies comparable to Hasbro Second we introduced foreign companies since they have somesimilarities to Hasbro Bandai Namco a Japanese entertainment company operates in the same industry as Hasbrobut in the Japanese markets However they do share the same target customers children and teenagers It is alsoworth mentioning that we first included companies such as Brunswick Harley-Davison and Polaris since they also sellconsumer products as well But due to big differences in the products and target customers we removed them fromthe final peer group list
Consequently choosing a company in a different region with different products has some shortcomings makingcomparable valuation less precise than the DCF model Therefore we only weighted the EVEBITDA comparablevaluation as 10 of our final valuation The results do offer great insights into the value of the stock since it is basedon the value of its industry peers For example Hasbro has the highest EBITDA margin tied with Alpha Group whofocused on animation in China The whole industry is less leveraged by debt except for Tomy Although Hasbro grewfaster than its domestic peers the company grew slower than its foreign peers
Hasbro has an EVEBITDA of 1215 which is lower than its main competitor Mattelrsquos multiple of 1634 and also lowerthan its peerrsquos average multiple which is 1359 We used the peer average ratio to calculate the implied stock priceThe implied price of Hasbro using the peer average EVEBITDA is $10361 which is higher than current price of$9245
Company NameAdjusted
EV
EBITDA
T12MEVEBITDA
Implied
Price
Median 550852 57137 964 $7201
Hasbro 1211031 99646 1215 $9211
Mattel 791931 48466 1634 $12560
Tomy 143064 18853 759 $5559
Bandai 550852 74605 738 $5395
Spin Master 441761 25523 1731 $13335
Alpha Group 314579 32600 965 $7208
Goldlok Toys 80568 3260 2471 $19260
Average 504827 43279 1359 $10361
Company Name DebtEquity EBITDA Margin5 Year Average
Revenue Growth
Median 39 14 3
Hasbro 100 19 3
Mattel 80 14 -3
Tomy 200 7 -2
Bandai 1 12 6
Spin Master 32 13 27
Alpha Group 39 19 27
Goldlok Toys 5 15 3
Shares
Outstanding 1245
EV 13200
EBITDA 996
Cash 1732
Minority 0
Total Debt 1882
Market Cap 11515
Hasbro 12 Month TTM Data
22Source Bloomberg
GENERAL TREND OF THE INDUSTRY ndash TRADITIONAL TOYS and GAMES vs VIDEO GAMES
We analyzed the major markets that Hasbro covers and presented the trend of Traditional Toys and Games vs VideoGames in Asia Pacific (China and India) USA and Canada European Union (United Kingdom Germany France andRussia) Latin America (Brazil Mexico and Argentina) It is worth mentioning that although Hasbro does not have astrong presence in Asia Pacific we do expect it will strategically focus on those markets due to their greater potentialAs for the general trend in the industry traditional toys and games have been growing for the past 7 years and willcontinue to expand in the future at a steady pace However since video games develop faster these days they havebecome a major competitor for traditional toys and games and may evolve to become major substitutes in thefuture The weighted percentage of traditional toys and games is projected to decrease from 510 in 2010 to 388in 2021 Therefore it is critical for Hasbro to cater to the digital trend otherwise it may lose significantly in the nearfutureVOLATILE PERFORMANCE IN SUBGROUPTraditional Toys and Games can be further categorized into more subgroups and each group may have differentperformances each year since the trend in this industry is so volatile As of October 2017 toy industry sales in the USreached $1195 billion in total since January growing 3 compared to the same period in 2016 GamesPuzzles havebeen outperforming for the past few years indicating a trend in demand for more face-to-face play experiences Toycompanies can attract a broader customer base by offering sociable items that cannot only attract children but alsoadult customers
In comparison to its direct competitor Mattel Hasbro has several advantages in certain areas but also somedisadvantages For Games Action Figures and Outdoor amp Sports Hasbro has absolute advantages It is worthmentioning that Hasbro has been producing the most games in the market which realized the most growth in thepast years We anticipate that Hasbro will continue to strengthen its advantage in the industry and remain relativelystable in its market size of other less favorable categories
5097 5071 5015 4789 4515 4418 4346 4216 4102 4024 3934 3883
0
10
20
30
40
50
60
0
50000
100000
150000
200000
2010 2011 2012 2013 2014 2015 2016 2017 2018 2019 2020 2021
Total Toys amp Games Market Size
Traditional Toys and Games Video Games Precentage of Traditional ToysTraditional Toys and Games in Total
-1000 -500 000 500 1000 1500
Grand Total
All Other Toys
Plush
GamesPuzzles
Dolls
Vehicles
Youth Electronics
Outdoor amp Sports Toys
InfantToddlerPreschool Toys
Arts amp Crafts
Action Figures amp Accessories
Building Sets
Percent Changes of Retail in the US from Jan to Oct 2017vs Same Period in 2016
APPENDIX 13 INDUSTRY PROJECTION
Source NPD
Source The Toy Association
Source Wall Street Journal
23
US SECTOR
As we observe from Figure 1 after the unprecedented Quantitative Easing turned the tide in the financial crisis theUS GDP never fell out of the 15 - 3 range From the quarterly GDP in Figure 2 although the annual growth ofGDP decreased slightly in 2016 the economic growth remained strong in the third quarter of 2017 realizing 3 ingrowth exceeding analysts expectations The Federal Reserve officially raised the benchmark rate by 025 onDecember 13th the third increase in 2017 signaling a healthy growth in the economy but poteintially resulting in amoderating economy in the futureCONSUMER CONFIDENCE
From the Consumer Sentiment Index we observe a high willingness to spend and strong confidence in the economywhich again strengthened our judgement about the US economy On the other hand the personal consumptionexpenditure decreased recently which may potentially impact Hasbrorsquos business in the US market
The US INTEREST RATEOn December 16th 2008 the Federal Reserve adjusted the interest rate to 025 and left it at this level untilDecember 16th 2015 Moving forward we believe the Fed will continue to raise the interest rates to deal with therising CPI In line with the expectations for 2017 the Federal reserve raised the benchmark three times on March16th June 15th December 13th Based on FOMC participantsrsquo assessments of appropriate monetary policy thepreponderance policy rate will be 2 - 225 225 - 325 275 - 3 in 2018 2019 and 2020 respectively andremain 3 in long run
400
-090
460
520
200
320
270
160
050060
220
280
180
120
310300
-200
-100
000
100
200
300
400
500
600
Quarterly Gross Domestic Product (GDP) Growth
-28
25
16
22
17
2629
15
-400
-300
-200
-100
000
100
200
300
400
2009 2010 2011 2012 2013 2014 2015 2016
Annual Gross Domestic Product (GDP) Growth
-060
-040
-020
000
020
040
060
080
-1500
-1000
-500
000
500
1000
1500
Feb
-09
May
-09
Au
g-09
No
v-09
Feb
-10
May
-10
Au
g-10
No
v-10
Feb
-11
May
-11
Au
g-11
No
v-11
Feb
-12
May
-12
Au
g-12
No
v-12
Feb
-13
May
-13
Au
g-13
No
v-13
Feb
-14
May
-14
Au
g-14
No
v-14
Feb
-15
May
-15
Au
g-15
No
v-15
Feb
-16
May
-16
Au
g-16
No
v-16
Feb
-17
May
-17
Au
g-17
Growth of Index of Consumer Sentiment vs Personal Consumption Expenditure
Consumer Sentiment Index PCE(RHS)
APPENDIX 14 ECONOMY PROJECTION
Source Economic projections of Federal Reserve Board members and Federal Reserve Bank presidents
Source BEASource BEA
Source BEA Surveys of Consumers from University of Michigan
24
LIQUIDITY AND FINACIAL RISK ANALYSISEven though Hasbro has acquired companies several times in the past the past 5-year cash ratio and quick ratio ofHasbro still indicates it has a strong liquidity profile From the table we can see that in the last five years Cash ratioCurrent ratio and Quick ratio have always been above the industry median indicating that Hasbro has strongliquidity Even though these three ratios have a deceasing trend current ratio changed from 261 in 2012 to 199 in2016 we believe that global companies like Hasbro may bring a portion of their overseas capital back to the US dueto the tax-reform resulting in an increase of liquidity for Hasbro in the future Cash ratio will increase due toincreasing revenues in the future but in 2021 the cash ratio will decrease due to payment of debt Overall Hasbrowill be able to keep these three ratios above the industry median for the next several years Other than strongliquidity Hasbro also has a very solid capital structure Hasbrorsquos Debt to Equity ratio changed from 107 in 2012 to091 in 2016 indicating that debt has decreased Hasbro also has over 8x interest coverage ratio indicating that thecompany has strong debt management ability A decreasing net debt EBITDA 109 in 2012 to 046 in 2016illustrates the companyrsquos ability to meet its interest payments and debt obligations is increasing
PROFITABILITY ANALYSISHasbrorsquos ROE has been increasing over the last 5 years from 25 in 2012 to 32 in 2016 increasing 6 annually inthe last 5 years After splitting ROE into 5 elements we observed that the operating margin played the mostimportant role in the ROE increasing Operating margin increased from 1335 in 2012 to 157 in 2015 whichindicates Hasbro did a great job on saving management costs From the comparable table we can observe thatHasbrorsquos main competitor Mattel has much lower ROE approximately 137 mainly due to lower operatingmargins Mattelrsquos operating margin was only 92 in 2016 which is significantly lower than Hasbrorsquos 157 andindustry median 136 Hasbro has much more potential for higher profitability than Mattel
CASH CONVERSION CYCLEHasbro has longer cash conversion cycles which means it will take a longer time to convert resources to cash flowHasbrorsquos cash conversion cycle has a decreasing trend from 134 in 2012 to 112 in 2016 This is due to an increase indays payable outstanding from 308 in 2012 to 535 in 2015 meaning Hasbro has more time to pay suppliersCompared to the cash conversion cycle of the industry median of 742 Hasbrorsquos is 1123 showing Hasbrorsquos lessefficient than other industry peers such as that of Mattel 692 This indicates that Hasbro may be weak in supplychain management This is a potential risk for Hasbro that may adversely affect itrsquos future revenue The decreasingtrend does show that Hasbro is putting in effort to lower its cash conversion cycle
APPENDIX 15 KEY FINANCIALS
Hasbro Mattel
Tax Burden 080 078
Interest Burden 088 079
Operating Margin 1574 952
Asset Turnover 102 084
Financial Leverage 278 270
ROE 3115 1321
ROE Decomposition 2016
2012 2013 2014 2015 2016
Tax Burden 074 081 077 075 080
Interest Burden 083 077 085 086 088
Operating Margin 1332 1121 1480 1576 1574
Asset Turnover 097 094 096 096 102
Financial Leverage 289 274 284 296 278
ROE 2304 1807 2651 2887 3115
Hasbro ROE Decomposition
Hasbro 2012 2013 2014 2015 2016 Industry Median
Days Inventory Outstanding 7212 7233 7377 7858 7375 7375
Days Sales Outstanding 9366 9468 9311 9463 9201 5517
Days Payable Outstanding 3082 3614 4432 4796 5347 4009
Cash Conversion Cycle 13496 13087 12256 12525 11230 7425
Hasbro Mattel Industry median
Days Inventory Outstanding 7375 7575 7375
Days Sales Outstanding 9201 758 5517
Days Payable Outstanding 5347 8227 4009
Cash Conversion Cycle 11230 6928 7425
Source Team Analysis Bloomberg
Liquidity Analysis FY 2012 FY 2013 FY 2014 FY 2015 FY 2016 Industry Median FY 2017 FY 2018 FY 2019 FY 2020 FY 2021 FY 2022 FY 2023 FY 2024
Cash Ratio 088 050 083 092 079 079 098 099 099 099 089 089 090 090
Current Ratio 261 182 253 269 199 195 221 222 223 223 220 220 221 221
Finacial Risk Analysis
Total Debt to Equity 108 081 120 100 091 049 088 088 089 089 070 070 070 070
Interest Coverage Ratio 606 442 682 713 809 756 743 728 729 909 907 909 906
Net Debt EBITDA 110 110 116 087 047 045 015 012 009 008 -005 -005 -007 -007
Profitability Analysis FY 2012 FY 2013 FY 2014 FY 2015 FY 2016 Industry Median FY 2017 FY 2018 FY 2019 FY 2020 FY 2021 FY 2022 FY 2023 FY 2024
Operating Margin 1349 1144 1485 1556 1570 875 1494 1443 1374 1374 1370 1366 1361 1356
Return on Asset 795 656 931 977 1124 697 1002 1044 1018 1016 1078 1074 1075 1070
Return on Equity 2298 1795 2642 2888 3127 1359 2694 2784 2743 2745 2673 2668 2674 2660
25
APPENDIX 16 MONTE CARLO SIMULATION
0
200
400
600
800
1000
1200
$88 $90 $92 $94 $96 $99 $101 $103 $105 $107 $109 $111 $113 $115 $117 $120 $122 $124 $126 $128 $13 $132
FREQ
UA
NC
Y
PRICE
Monte Carlo Simulation
Target Price $107
Source Team Analysis
We used the Monte Carlo simulation to predict the possible price change and identify the most sensitivevariable for Hasbro in our assumption We tested 1) revenue growth rate 2) long-term cash flow growth rateand 3) the discount rate The model proved that the price is most affected by the long-term growth rateCombined with our assumption that revenue and free cash flow will grow in the long-term we applied randomgrowth rates from a specific range to simulate a range of stock prices After running 10000 simulation pathsthe result indicates a 4789 probability that the price of Hasbro will be above $107 There is a 5020probability the price will be between $9245 and $107 The probability of the price being lower than $9245(current price) is only 191
VARIABLE ASSUMPTION
26
Trials 10000
Base $10439
Mean $10685
Median $10646
Standard Deviation 811
Skewness 022
Kurtosis -053
Minimum $8799
25 Percentile $10078
75 Percentile $11257
Maximum $13023
Simulation Statistics
Variable Worse Case Base Case Better Case
2018 Revenue Growth Rate -500 578 727
2019 Revenue Growth Rate -500 859 1104
2020 Revenue Growth Rate -500 -019 232
2021 Revenue Growth Rate -500 684 947
2022 Revenue Growth Rate -500 -018 251
2023 Revenue Growth Rate -500 288 794
2024 Revenue Growth Rate -500 045 323
Long-term Growth Rate 200 263 300
WACC 900 744 600
APPENDIX 17 HASBRO vs OTHER COMPETITORS
Source Team Analysis Bloomberg Glassdoor
We analyzed the major competitors in 6 different aspects and used a weighted average score to rank them These 6aspects include profitability growth financial safety brand awareness efficiency and employee satisfaction Weassessed profitability by operating margin and ROE Growth by the 5-year revenue growth financial safety by marketcapital DE ratio and current ratio brand awareness by result from our survey efficiency by cash conversion cycleemployee satisfaction by Glassdoor review score We measure these elements from very strong (5 score) to veryweak (1 score) For example since LEGO has the highest operating margin of 328 and ROE of 4709 it receivedthe highest score of 5 in profitability Furthermore Mattel has the lowest 5-year revenue growth rate of -237therefore received the lowest score of 1 We used the weighted average of these aspects to calculate the final scoreWe weighted these aspects from the most important to least important which profitability growth and brandawareness are 20 efficiency and employee satisfaction are 15 and financial safety is 10 Taking the weightedaverage for all scores resulted in Hasbro (335) Mattel (27) LEGO (485) and Jakks (125) The result shows thatHasbro and LEGO have an advantage and leading positions in the competitive environment
27
Very Strong 5
Strong 4
Medium 3
Weak 2
Very weak 1
Legend
Company
NameMarket Cap
5 Year
Revenue
Growth Rate
Operating
MarginROE
Cash
Conversion
Cycle
DE ratio Current ratioGlassdoor
Score
Awareness
From
Survey
Hasbro 115B 321 1570 3115 1123 091 199 38 2
Mattel 53B -237 950 1321 6928 089 195 33 3
LEGO NA 1516 3281 4709 8428 004 199 37 1
Jakks 6747M 084 240 087 10562 151 294 27 4
Assessment Profitability GrowthFinancial
Safety
Brand
AwarenessEfficiency
Employee
Satisfaction
Weighted
Average
Hasbro 4 3 4 4 1 4 335
Mattel 1 2 3 3 5 3 27
LEGO 5 5 5 5 4 5 485
Jakks 1 1 2 1 2 1 125
Weight 20 20 10 20 15 15 100
APPENDIX 18 TAX REFORM
The new tax reform is the biggest tax reduction bill in the last 30 years The major change is the reduction ofcorporate tax from 35 to 20 The existing corporate tax rates are 25 in Europe and China and 30 in JapanApparently the new corporate tax rate will make the US become a low-tax country from once being the highest-taxcountry The tax reduction will help US companies increase net income further increase the stock price and pricesof other financial assets Stock price of Hasbro of course will also benefit from it Moreover the tax reform will alsohelp US companies with a global presence such to increase their competenceIt is worth mentioning that the reform will make another big change providing incentives for US companies torepatriate cash by paying only a 155 one-time tax Even though there is $26 trillion in cash outside the US we donot expect most companies to bring back this capital Non-financial US companies studied by Moodyrsquos hoarded$184 trillion in cash outside the US at the end of 2016 Thatrsquos up 11 from 2015 and nearly two and a half timesthe 2008 levels The reason these companies donrsquot invest in the US economy is that the US productivity growth isonly 12 the worst growth rate throughout US history after World War II Lacking investment opportunities andlow productivity may discourage companies to repatriateSince most of Hasbrorsquos cash and cash equivalent remain overseas it may bring part of the capital back to the US fornew investment opportunities Though it is also likely that they may use the money to boost stock performance suchas paying more dividends and buying back moreFurthermore in the short term the reduction in tax from working-class families will create more disposable incomewhich will boost the US economy and increase sales especially in consumer products But for the long-run the taxon working-class families will eventually increase since the government has to find a way to fill the gap betweengovernment expenses and taxable income We believe that will hurt sales of consumer products in the long term
28
Source Bureau of Labor Statistics
Hasbro and Mattel seem to be alike sharing similar game categories and product lines But if we deep into themthey are two very different companies These two companiesrsquo revenue has been steadily increasing from 2010 to2014 But from 2014 to the present Hasbrorsquos revenue has been consistently increasing and we project the trend willlast for the next 7 years On the other hand Mattelrsquos revenue has been decreasing since 2014 and eventually caughtup by Hasbro in 2017 The improper management led to a decrease in Mattelrsquos revenue which further endangertheir cash generating abilities making them cut dividend to almost 13 of the previous level (from $038 to $015) IfMattel cannot turn it around it will continue to dwindle in the industry If stock price of Mattel stock hits $15 it mayeven trigger the MampA between Hasbro and Mattel
Target consumersHasbro and Mattel have different target consumers Hasbro has a much more broadened age range that coversalmost all age segments With products enjoyed by younger customers such as Transformers toys Marvel actionfigures Nerf and products for adults such as Monopoly and Magic The Gathering Hasbro seized customers withdifferent ages and preferences Moreover with strategies such as Brand Blueprint and Expanding Our AudienceHasbro increases the brand awareness through comprehensive media such as movies all-age toys amusement parksand music constantly attracting all-age consumers On the other hand most of Mattelrsquos products such as BarbieWheels Fisher-Price and American Girl only cover consumers with an age from 0 to 7
Storytelling StrategiesHasbro started investing in the Transformers movie in 2007 and has been producing 5 other Franchise Brand moviesincluding Transformers and My Little Pony These movies helped Hasbro to boost its revenues significantly Incomparison Mattel has not yet release any of its own brand movies even though they are scheduled to releaseBarbie and Monster High in 2018 By securing the first-mover-advantage Hasbro can elevate its eco system by tellingmore stories and creating more characters
Partnership MaintenanceHasbro adapted to the trend and acquired only famous IP such as Marvel Star Wars Disney Frozen and Yo-KaiWatch These IPs have high brand awareness gained by frequent and high quality movies release these days On thecontrary Mattel only acquired DC Comic and Jurassic Park IPs that did not do a better job than Hasbrorsquos IPs
Company CultureHasbro has been communal which enables people to act and feel more comfortable when interacting with theirpeers allowing them to be more genuine and more collaboratively oriented This approach will help to increase thesynergy within Hasbro benefiting productivity in the long term On the other hand Mattelrsquos culture has beeneffected as a consequence of shifts in its leadership team which aroused resentments and fragmentation amongdepartments and employees
APPENDIX 19 HASBRO vs MATTEL ANALYSIS
020406080
100120
10
12
01
2
41
20
13
10
12
01
3
41
20
14
10
12
01
4
41
20
15
10
12
01
5
41
20
16
10
12
01
6
41
20
17
10
12
01
7
Stock Performance
Hasbro Stock Price Mattel Stock Price
29
Source Bloomberg Source Bloomberg
APPENDIX 20 MERGERS amp ACQUISITIONS
= $300mm
We think the merger between Hasbro and Mattel will likely not happen for the following reasonsResistance from Management of MattelMattel hired a new CEO in February 2017 who in turn hired a new CFO and CTO If the merger goes through newhires in senior management risk losing their positions They will fight the merger for job security Also since the newmanagement recently joined the company we assume they want to prove themselves by doing everything in theirpower to turn the company around They wouldnrsquot want to simply accept the merger and lose the opportunity toprove their valueShareholder ConcernsMattelrsquos shareholders are not satisfied with the current stock performance One year ago their price was over $30per share They are unlikely to accept a deal valued at their depressed stock price and Hasbro is unlikely to offer aprice close to Mattelrsquos stock price from one year agoMattel is supposed to be owed $135 million in accounts receivable before Toy ldquoRrdquo Usrsquos Chapter 11 filing HoweverToys ldquoRrdquo Usrsquos bankruptcy will expose them to possible loss due to uncertainty in recovery of accounts receivableMattel is also facing a lawsuit by MGA Entertainment who claimed $1 billion compensation to settle the case Basedon the history MGA has a good chance to win which will materially affect Mattelrsquos next yearrsquos earningsConsequently Hasbrorsquos shareholders will not like such risks and will calculate all factors in the valuation of themergerObstacles from DisneyDisney opposed any move from Hasbro if it reduced Disneyrsquos leverage over its main licenses of IPs Theyrsquove opposedmergers twice in the past The first was when Hasbro offered to acquire DreamWorks Disney threated to cancel thetransfer of the Princess license to Hasbro if it continued to process the MampA The same happened when Hasbrooffered to acquire Lions Gate If Hasbro merges with Mattel it will jeopardize Disneyrsquos bargaining power Therefore itis likely that Disney will do whatever it can to stop the mergerRetailers Maintain Bargaining PowerThe three largest customers of Hasbro are Walmart Target and Toy ldquoRrdquo Us They want to leverage in bargainingpower In order to do so they want their inventory diversified with different vendors instead of being monopolizedby Hasbro They can level the playing field by inviting other toy manufactures to put more products on the shelvesand reduce Hasbrorsquos shelf space and position As a result retailers will not be in favor of Hasbrorsquos offer to merge withMattelAntitrust IssuesThis horizontal integration always requires approval from Federal Trade Commission and European Union Europeancompanies will likely oppose the merger If the case has to be appealed to the European Court of Justice it will takeyears to see the final results
Hasbro conducted 21 MampAs in its history with half the cases fully financed by cash half undisclosed and one paid bycash and debt Since 2000 Hasbro changed from acquiring Cyclical Consumer Goods amp Services companies toTechnology and Communication targets The recent case of Backflip in 2013 is a good example showing that Hasbro isactively riding on the digital trend and catering to the increasing needs of digital games We anticipate the futureMampA trend will not change since technology will play a vital role in the toys amp games industry 30
Source Bloomberg
APPENDIX 21 TWO INTERVIEWS FOR MERGER WITH MATTEL
INTERVIEW WITH MR LUTZ MULLEROn January 26th we Skype interviewed Mr Lutz Muller President of Klosters Trading Corporation for his point ofview regarding the potential MampA case between Hasbro and Mattel and key aspects to consider for our research Theinsight from this interview elevated our analysis based on the followingConcerns From European Trade CommissionHasbrorsquos potential acquisition of Mattel could face problems with the European Trade Commission especially in theacquisitions of Barbie American Girl Monsters High and DC Comics which could represent a monopoly in that sectorHowever Hasbro could let go of these brands which overall are worth $168B and continue with the acquisition ofthe rest of the business for $49B This should not affect Mattelrsquos potential in any major way as Fisher Price would bea very attractive brand for HasbroGap Between the Bid Price and Offer PriceBased on Hasbrorsquos past interest in Mattel Mattelrsquos investors could expect a price of $25 for Mattel stock in anacquisition But Mattelrsquos stock has taken a hit because of ongoing lawsuits and improper operations If Mattels stocklanguishes around $15-$18 per share the possibility of an acquisition would increaseBiography for Mr Lutz Mullerbull During 1984 ndash 1987 Mr Lutz served as CEO for DKSH [formerly Diethelm + Keller] USA After brokering a deal
with Walmart for toys with new concept toys he successfully turned around DKSH[formerly Diethelm + Keller] USA and became the Activity Kit Category we know today
bull From 1987 up until now Mr Lutz served as President for Klosters Trading Corporation a consulting companyfounded by him which provides services for financial entities in sales and marketing
31
INTERVIEW WITH HILLARY GREENEOn January 24th we interviewed Professor Greene in person at the UConn School of Law With the benefit ofProfessor Greenelsquos insights and looking at the toy industry broadly we donrsquot believe a Hasbro-Mattel merger wouldbe unduly disruptive However looking at the toy segment that is narrowly focused on the entertainment industry aHasbro-Mattel could be disruptive We also expanded our analysis in other directions
Direct Comparisons Based on ExperiencePast Mergers and the effects on the industry should be considered Overall past merges have been well accepted byFederal Trade Commission (FTC)Market Shares and Concentration Should be ConsideredMarket concentration is one of the most influential aspects when evaluating mergers FTC would usually use theHerfindhal-Hirschman Index (HHI) to classify the markets into Non-Concentrated Markets (HHIlt1500) and HighlyConcentrated Markets (HHIgt2500) We assume the HHI of the industry should be lower than 1500Merger Effect on Reducing CompetitionWe shall also considered the effect of the merger specifically whether competition will decrease after the mergerthis indicates the possibility of forming monopoly In this case we foresee a risk of lowering the competition in theindustryDisruptive Role of a Merging PartyConsidering the power of each company individually non of them can play the role of maverick But due tointeraction and synergy the merger can completely change the situation making Hasbro the maverick Disney couldargue that there would be a monopoly in the manufacturing of movies related toys protecting itself from a toymanufacturing powerhouse in the industry Hence we do see a risk that related companies or studios like Disneycould block the mergerBiography for Professor Greenebull Visiting scholar at Harvard Law School and was previously a visiting scholar at UC Berkeleyrsquos School of Law and
School of Engineeringbull Executive committee member as Chair Elect of the American Association of Law Schoolrsquos Antitrust and Trade
Regulation Section and as a contributing editor to the Antitrust Law Journalrsquos editorial board
APPENDIX 22 INTELLECTUAL PROPERTIES
APPENDIX 23 INSIDER HOLDINGS
IPs Expiration Period
Marvel 2020
Star Wars 2020
Frozen The new license issued in 2016
Trolls The new license issued in 2016
Disney Princess The new license issued in 2016
Beyblade Burst re-launch in 2016
Sesame street 2021
Yo-Kai Watch Launch in 2016
Descendants Launch in 20142015
Jurassic Park Lost in 2017
Hasbrorsquos current contract with Marvel and Star Wars will end in 2020 Hasbro also secured new licenses issued in2016 for three brands Frozen Disney Princess and Trolls and relaunched Beyblade Burst in the same year Its licenseof Sesame Street wonrsquot expire until 2021 Hasbro launched Yo-Kai Watch in 2016 and Descendants in 20142015 In2017 Hasbro lost Jurassic Park IP to its competitor Mattel Hasbro needs to renegotiate with these IPs in the futurewhich may increase royalties due to increasing competition
Other than the new insider shareholders who get shares because of acquisitions management of Hasbro have beenselling their holdings over past year The insider holdings decreased from 9 in May 2017 to 769 in December2017 Alan G Hassenfeld the former chairman and CEO of Hasbro and the 3rd biggest shareholder has beengradually selling shares under his name Most insidersrsquo shares sold were from him in 2017 in which he sold morethan one million shares in February and almost another one million shares latter in July and August Considering he isnot on the management team Hassenfeldrsquos insider selling is not a concern He might sell for his own personalpurposes such as benefits for trustee of his family trust or used for Hassenfeld Foundation It is also worthmentioning that Goldener D Brian the CEO of Hasbro increased his holding by more than 300000 shares by the endof 2017 which accounts for 025 of total shares outstanding of Hasbro Insiders still hold 769 of total sharesoutstanding which is a good sign in a large company like Hasbro In contrast Mattelrsquos insiders only hold 035 of thetotal share outstanding
32Source Team Analysis Bloomberg
APPENDIX 24 MOVIE IMPACT
In 2007 Hasbro released the first Transformers movie series which brought significant impact to Hasbro
Transformers products sales Revenue of the Boyrsquos sector increased over 60 (from $575841 to $1235462) from
2006 to 2007 and Transformers products accounted for 126 of the consolidated net revenue in 2007
In 2009 Hasbro released Transformers Revenge of the Fallen and its partner Marvel released X-Men Origins
Wolverine Revenue of the Boyrsquos sector increased over 9 and Transformers products accounted for 145 of the
consolidated net revenue in 2009
In 2010 Hasbrorsquos partner Marvel released Iron Man 2 however no individual Marvel products accounted more
than 10 of the consolidated net revenue in 2010 Revenue of the Boyrsquos sector decreased 7
In 2011 Hasbro released Transformers Dark of the Moon and Hasbrorsquos partner Marvel released Thor X-Men First
Class and Captain America The First Avenger Revenue of the Boyrsquos sector increased over 33 in 2011 Beyblade
premiered on Cartoon Network in June 2010 which also helped increase of the sales of Beyblade products
Transformers and Beyblade products accounted for 113 and 111 of consolidated net revenues respectively
In 2012 Hasbrorsquos partner Marvel released The Avengers and The Amazing Spider-Man but no individual Marvel
products accounted for over 10 of the consolidated net revenue in 2012 Revenue of the Boyrsquos sector decreased
over 13
In 2013 Hasbrorsquos partner Marvel released Iron Man 3 The Wolverine and Thor The Dark World No individual
Marvel product accounted for more than 10 of consolidated net revenues and revenue of the boyrsquos sector
decreased over 21 while revenue of the Girlrsquos sector increased over 26 due primarily to higher net revenues from
My Little Pony Furby (Hasbro released updated Furby with LCD eyes and a mobile app for the holiday season in
2012) and Nerf Rebelle products
In 2014 Hasbro released Transformers Age of Extinction and My Little Pony Equestria Girls - Rainbow Rocks and
Hasbrorsquos partner Marvel released Captain America The Winter Soldier The Amazing Spider-Man 2 X-Men Days of
Future Past and Guardians of the Galaxy Revenue of the Boyrsquos sector increased over 19 in 2014 Transformers
Nerf and Marvel products were the major contributors to the increase in revenue
In 2015 Hasbrorsquos partner Marvel released Avengers Age of Ultron and Ant-Man and Universal Studios released
Jurassic World Nerf and Hasbrorsquos partner Jurassic World Marvel and Star Wars contributed to higher net revenue
while Transformers contributed less
In 2016 Hasbrorsquos partners Lucas and Marvel released Rogue One A Star Wars Story Captain America Civil War X-
Men Apocalypse and Doctor Strange Revenue of the Boyrsquos sector increased 4 in 2016 Nerf and Yo-Kai Watch
contributed to higher net revenue Revenue of the Girlrsquos sector increased 50 in 2016 with higher net revenue from
Hasbrorsquos line of Disney Princesses and Disney Frozen
In 2017 Hasbro released Transformers The Last Knight and My Little Pony The Movie Hasbrorsquos partners Marvel
and Lucas released Logan Guardians of the Galaxy Vol 2 Spider-Man Homecoming Thor Ragnarok and Star Wars
The Last Jedi We project revenue of the boyrsquos sector will increase around 9
In 2018 Hasbrorsquos partner Marvel is scheduled to release Avengers Infinity War
In 2019 Hasbro is scheduled to release Transformers and Hasbrorsquos partners Marvel and Disney is scheduled to
release Captain America Avengers 4 Frozen 2
In 2020 Hasbrorsquos partner Marvel is scheduled to release Untitled Marvel Movie
In 2021 Hasbro is scheduled to release Transformers
In 2023 Hasbro is scheduled to release Transformers
33
Transformers Movies Release Year 2007 2009 2011 2014 2017
Boys Sector Revenue Growth64 939 3317 1990 900
Transformers Products Account for
The Net Revenue 1260 1450 1130 NA NA
Source Hasbro 10-k filing Bloomberg IMDB
APPENDIX 25 HASBRO RELATED MOVIES TIMELINE
Spider-Man 3 Transformers
IMDB 62 IMDB 70
Iron Man Hulk
IMDB 79 IMDB 68
Star Wars
IMDB 80
Transformers
IMDB 60
X-Men Origin
IMDB 67
2007 2008 2009
2010
Iron Man 2
IMDB 70
Transformers
IMDB 63
Ghost Rider
IMDB 43
Captain America
IMDB 69
X-Men
IMDB 78
Thor
IMDB 70
2011
Frozen
IMDB 75
Thor
IMDB 70
The Wolverine
IMDB 67
Iron Man 3
IMDB 72
Spider-Man
IMDB 70
The Avengers
IMDB 81
2012 2013
2014
Fantastic Four
IMDB 43
Ant-Man
IMDB 73
Avengers
IMDB 74
Jurassic World
IMDB 70
Guardians of the Galaxy
IMDB 81
X-Men
IMDB 80
Spider-Man 2
IMDB 67
Transformers
IMDB 57
Captain America
IMDB 78
2015
2016
2017
Doctor Strange
IMDB 79
X-Men
IMDB 70
Captain America
IMDB 79
Deadpool
IMDB 80
Rogue One
IMDB 78
Guardians of the Galaxy
IMDB 52
Thor
IMDB 81
Spider-Man
IMDB 76
Transformers
IMDB 78
Logan
IMDB 81 IMDB 63
Star Wars
IMDB 75
My Little Pony
34Source IMDB
APPENDIX 26 HASBRO VALUATION IF MERGES WITH MATTEL
RESULTFrom the result we expect that if this MampA goes through Hasbro will have fair value of $13151 the best case inour valuation
WACC 670
Long-term FCF growth 263
Year FY 2011 FY 2012 FY 2013 FY 2014 FY 2015 FY 2016 FY 2017 FY 2018 FY 2019 FY 2020 FY 2021 FY 2022 FY 2023 FY 2024
FCF 46492 36757 47991 42903 53405 74373 53015 78343 81422 98163 97105 113015 117452 128773
Terminal Value 32488
Total 46492 36757 47991 42903 53405 74373 53015 78343 81422 98163 97105 113015 117452 33776
Enterprise Value 26071
Add Back Initial Cash 1913
Asset value 27985
Subtract Initial Debt 11545
Imputed Equity Value 16439
Divide by Shares Outstanding 125
Share value 13151
Current market value per share 9245
35
ASSUMPTIONSbull Due to Hasbrorsquos advantage in storytelling strategies the synergies created with the merger will increase
Mattelrsquos revenue by 5 each year for the next 8 yearsbull Mattel expenses will decease 5 each year for the next 8 years after MampA goes through due to Hasbrorsquos
better management skills and synergy in supply chain managementbull WACC will decrease from 744 to 67 due to Hasbrolsquos issuance of debt to pay Mattel increasing debt will
decrease WACCbull Hasbro will pay Mattel 30 premium of its market capitalization to acquire the company which is around
$68Bbull In order to acquire Mattel Hasbro will issue new debt of $68Bbull FCF from Hasbro will stay the same before the MampAbull MampA will happen in 2018
Source Team Analysis Bloomberg
APPENDIX 27 HISTORIAL STOCK PERFORMANCE amp DRIVERS
1
1
23
4 5 6
7
89
2
3
4
5
6
7
8
9
1
1
36
Date RevenueGap from Revenue
ExpectationEPS
Gap from EPS
Expectation
292015 $13B (+16) $30M 122 001
4202015 $7135M(+5) $5323M 021 013
282016 $147B(+131) $100M 139 009
4182016 $8312M(+165) $5409M 038 014
10172016 $168B(+14) $110M 203 029
262017 $163B(+109) $130M 164 037
4242017 $8497M(+22) $2765M 043 005
7242017 $97251(+106) 973 053 007
10232017 $179B(+65) $10M 205 011
11112017 Hasbro Approaches Mattel for Toy Mega MergerBeat consensus estimation from analysts
Miss consensus estimation from analysts
STOCK PRICE vs FANDAMENTAL
STOCK PRICE DRIVEN BY EARNING REPORTS
Campany Name Mattel
Years 2012 2013 2014 2015 2016 2017 2018 EST 20170930 TTM 20170930 TTM
Stock Price 354 542 551 676 782 909 1070 976
MVE ($M) 45529 71294 69162 84387 97548 113249 - 121653 57008
TEV ($M) 53240 78890 78781 92138 102162 119624 - 128028 83885
Sales ($M) 40890 40822 42772 44475 50198 53712 56818 52436 51055
EBITDA ($M) 5518 4671 6354 6919 7880 8025 8199 10519 4847
NI ($M) 3360 2862 4159 4518 5514 5720 6199 6070 -5804
Total Assets ($M) 43254 44023 45321 47207 50914 57091 59366 55446 61997
BVE ($M) 15074 17278 15084 17041 18854 21232 22268 19563 14397
TEVSales 13 19 18 21 20 22 - 24 16
TEVEBITDA 96 169 124 133 130 149 - 122 173
MVENI 136 249 166 187 177 198 - 200 -98
TEVTotal Assets 12 18 17 20 20 21 - 23 14
MVEBVE 30 41 46 50 52 53 - 62 40
Hasbro
Source Team Analysis Bloomberg
APPENDIX 28 MANAGEMENT TEAM INFORMATION
37Source Team Analysis Bloomberg
ChairmanCEO Hasbro Inc 22017-PRESENT
ChairmanPresidentCEO Hasbro Inc 52015-22017
PresidentCEO Hasbro Inc 52008-52015
Chief Operating Officer Hasbro Inc 12006-52008
President US Toys Segment Hasbro Inc 2003-12006
President US Toys Hasbro Inc 2001-2003
Senior VP amp Gen Mgr US Toys Hasbro Inc 82000-2001
Senior Exec VPCOO Tiger Electronic Inc (became part of Hasbro in 1998) 32000-82000
President Hasbro Inc 22017-PRESENT
President Hasbro Brands Hasbro Inc 102014-22017
Exec VPChief Marketing Ofcr Hasbro Inc 32013-102014
Senior VPChief Marketing Ofcr Hasbro Inc 12008-32013
Exec VPCFO Hasbro Inc 32013-PRESENT
Senior VPCFO Hasbro Inc 52009-32013
Senior VPHead Corp Finance Hasbro Inc 2008-52009
Senior VPController Hasbro Inc 2003-2008
VPAssistant Controller Hasbro Inc 1998-2003
Exec VPChief Commercial Ofcr Hasbro Inc 22013-PRESENT
PresidentNorth America Hasbro Inc 12012-22013
PresidentLatin America Hasbro Inc 12007-122011
Marketing Depts in Netherlands Hasbro Inc 1987-UNKNOWN
Exec VPChief Human Resources Officer 32017-PRESENT
Human Resources 1997-PRESENT
Frito-Lay Co FORMER
Ecolab Inc FORMER
Exec VPChief Legal OfcrSecy Hasbro Inc 2014-PRESENT
Senior VPChief Legal OfcrSecy Hasbro Inc 122010-2014
VP Litigation amp Employment Hasbro Inc 2006-122010
Managing Attorney 1995-2003
Senior Attorney 1993-1995
Attorney 1991-1993
Exec VPChief Strategy Officer Hasbro Inc 22017-PRESENT
Exec VPChief Global Ops amp Bus Dev Ofcr Hasbro Inc 2014-22017
Exec VPGlobal Ops amp Bus Dev Hasbro Inc 102014-UNKNOWN
Exec VPChief Dev Ofcr Hasbro Inc 32013-102014
Senior VPChief Dev Ofcr Hasbro Inc 82008-32013
Chief Mktg OfcrUS TOY Group Hasbro Inc 2004-2008
Gen MgrBIG Kids Hasbro Inc 2002-2004
Exec VPChief Global Ops Hasbro Inc 22017-PRESENT
Assistant Controller - Games Hasbro Inc 1992 - UNKNOWN
Exec VPChief Content Officer 32017-PRESENT
President Hasbro Studios TV development and production division of Hasbro Inc 92009-32017
Brian D Goldner
Mr Goldner served as executive producer and played vital role in the success of 2007 Transformer film which ushered Hasbro to character-based
multimedia company He served as board member of Hasbro from 2008 and became Chairman in 2015 He also served Gap Inc as board member in
Compensation and Development and Molson Coors Brewing Co as borard member in Compensation and Human Resources
Tom Courtney
Being a 31-year veteran at Hasbro Wiebe served different roles in a variaty of toy industry associations and non-profit organizations globally Based on his
cross countries experience he also serves as Advisory Board Member of Northeastern Universityrsquos Center for Emerging Markets
Rudolph Johnson
Rudolph is another senior veteran serving Hasbro 21 years during which he held responsibility in global human resource management organizational and
leadership development and performance management etc He also served as Chairperson of the Hasbro Childrens Hospital Gala Committee from 2010
to 2014 He became the borad memeber of United Way of Rhode Island Inc from 102014
Barbara Finigan
As a 19-year veteran of Hasbro Ms Barbara helped establish Hasbros employment product safety and compliance practices and exerted her
professionalism helping Hasbro operates smoothly in global legal environment She has been a Director of Toy Industry Association Inc since May 2016
Duncan J Billing
Mr Duncan has been leading the product development worldwide and execute the IP strategy aiming to develop an innovative and integrated IP and
product development strategy He played a vital role in managing successful brands such as Star Wars Trivial Pursuit and Ghostbusters He also served as a
board member of Dle Inc from 82006
With his vast experiences serving different companies such as Reebok and Corus Entertainment Mr Frascotti elevated Hasbrorsquos world-class portfolio of
brand He became board member of Corus Entertainment Inc from 12016 to present
John A Frascotti
Deborah M Thomas
Before joining Hasbro Deborah worked at KPMG Peat Marwick LLP With the CPA title and her nearly 20 years serving at Hasbro she is the savvy of
financial status of Hasbro She also served Rhode Island Airport Corp as board member and Seaworld Entertainment Inc as board member since 112013
Wiebe Tinga
Stephen Davis
During his 25-year service at Hasbro Mr Thomas he is responsible for vendor relationships product outsourcing product safty and quality supply chain
management etc He led the successful turn around and the sale of Hasbros games manufacturing operations in Massachusetts and Ireland
In his role Mr Davis is in charge of the lifeline of Hasbro stroytelling of famous brands including GI Joe Transformers Romper Room Trivial Pursuit
Scrabble My Little Pony and Tonka Also he has been working on developing the new kid-friendly content for potential new product He served as Co-
Chairman at National Association of Television Program Executives
(1)Movies TV and Celebrities (nd) Retrieved January 12 2018 from httpwwwimdbcom(2)Cowan D (2015 August 12) Blizzards Hearthstone rakes in more than $20 million a month Retrieved January 1 2018 from httpswwwdigitaltrendscomgaminghearthstone-earning-20-million-monthly(3) Moodys US corporate cash pile grows to $184 trillion (2017 July 18) Retrieved January 2 2018 from httpswwwmoodyscomresearchMoodys-US-corporate-cash-pile-grows-to-184-trillion-led--PR_369922(4)SEC (2017 February 05) Retrieved January 2 2018 from httpswwwsecgov(5) Annual Report (2016 March 01) Retrieved January 3 2018 from httpswwwlegocomen-usaboutuslego-groupannual-report(6) Productivity Growth by Major Sector 1947-2016 Bar Chart (nd) Retrieved January 4 2018 from httpswwwblsgovlpcprodybarhtm(7) Bowman J (2017 July 24) Why Hasbro Inc Stock Dropped Today Retrieved January 25 2018 fromhttpswwwfoolcominvesting20170724why-hasbro-inc-stock-dropped-todayaspx(8) HAS Earnings - Hasbro Inc (nd) Retrieved January 25 2018 from httpsseekingalphacomsymbolHASearnings(9) McKenna B (2017 October 23) Hasbro Posts Solid Third-Quarter Revenue Growth but Its Holiday Quarter Outlook Sends Shares Tumbling Retrieved January 25 2018 from httpswwwfoolcominvesting20171023hasbro-posts-solid-third-quarter-revenue-growth-buaspx(10) Lutz Muller Special situations Marketplace Business Intel On Toys (2017 November 25) Why The MattelHasbro Merger Will In All Likelihood Not Happen Retrieved January 25 2018 from httpsseekingalphacomarticle4127585-mattel-hasbro-merger-will-likelihood-happen(11) Spangler T (2013 July 22) Hasbro Extends Disney Pact for Marvel Star Wars Toys and Games Retrieved January 25 2018 fromhttpvarietycom2013biznewshasbro-extends-disney-pact-for-marvel-star-wars-toys-and-games-1200566115(12) Press A (2009 December 07) Hasbro wins 10-year deal for Sesame Street toys Retrieved January 25 2018 from httpsnypostcom20091207hasbro-wins-10-year-deal-for-sesame-street-toys(13) Hasbro Dolls Up for Descendents (nd) Retrieved January 25 2018 from httpwwwlicensemagcomlicense-globalhasbro-dolls-descendents(14) Dailymailcom K R (2015 December 31) How Hasbro rescued Disneys princesses from Mattel Toymaker wins lucrative business worth $500MILLION from arch rival after Barbie designer took them for granted Retrieved January 25 2018 from httpwwwdailymailcouknewsarticle-3380652How-Hasbro-stole-march-Mattel-win-500-million-Disney-princess-doll-contracthtml(15) World Bank (2017 June) Global Economic Prospects Retrieved November 6 2017 from httpwwwworldbankorgenpublicationglobal-economic-prospects(16)IMF (2017 October) World Economic Outlook Seeking Sustainable Growth Retrieved November 6 2017 from httpswwwimforgenPublicationsWEOIssues20170919world-economic-outlook-october-2017(17)FOMC (2017 September 20) Economic projections of Federal Reserve Board members and Federal Reserve Bank presidents under their individual assessments of projected appropriate monetary policy Retrieved November 6 2017 from httpswwwfederalreservegovmonetarypolicyfiles fomcprojtabl20170920pdf(18)The Toy Association (nd) US Sales Data January to October 2017 Retrieved December 16 2017 from httpwwwtoyassociationorgtaresearchdatau-s-sales-datatoysresearch-and-datadataus-sales-dataaspx(19)NPD (2017 November) Diverging Demographics Determining the Future of Traditional Toys Retrieved December 21 2017 from httpswwwnpdcom(20)Ziobro P (2017 November 14) What a Combined Hasbro-Mattel Could Mean for the Toy Industry Retrieved December 21 2017 from httpswwwwsjcomarticleswhat-a-combined-hasbro-mattel-could-mean-for-the-toy-industry-1510655405(21) All products require an annual contract Prices do not include sales tax (New York residents only) (nd) China average yearly wages in manufacturing 2016 | Statistic Retrieved January 12 2018 from httpswwwstatistacomstatistics743509china-average-yearly-wages-in-manufacturing(22) Resin Pricing - Commodity Thermoplastics (nd) Retrieved January 12 2018 from httpwwwplasticsnewscomresincommodity-thermoplasticshistorical-pricinggrade=13107057CVol1(23) Import Price Index Semiconductor and other electronic component manufacturing for Industrialized Countries (2018 January 10) Retrieved January 12 2018 from httpsfredstlouisfedorgseriesCOINDUSZ3344
APPENDIX 29 REFERENCE
38
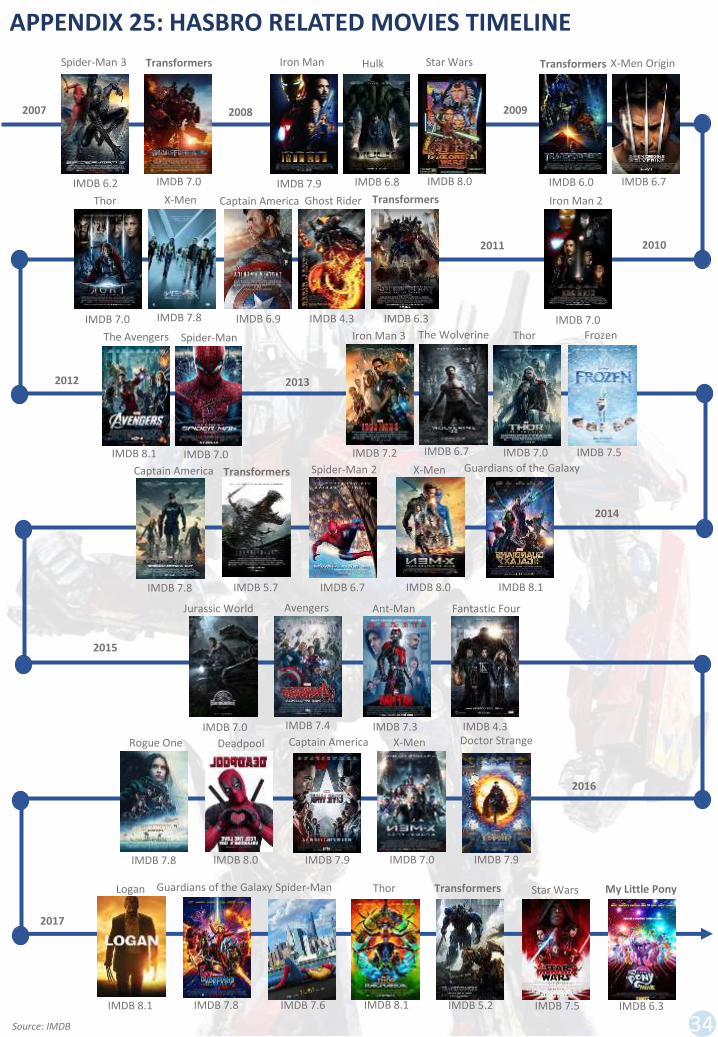