Teaching Statistical Concepts with Activities, Data, and Technology Beth L. Chance and Allan J....
130
Teaching Statistical Concepts with Activities, Data, and Technology Beth L. Chance and Allan J. Rossman Dept of Statistics, Cal Poly – San Luis Obispo
-
Upload
louis-hamilton -
Category
Documents
-
view
215 -
download
1
Transcript of Teaching Statistical Concepts with Activities, Data, and Technology Beth L. Chance and Allan J....

Teaching Statistical Concepts with Activities, Data, and Technology
Beth L. Chance and Allan J. Rossman
Dept of Statistics, Cal Poly – San Luis Obispo

Goals
Acquaint you with recent recommendations and ideas for teaching introductory statistics Including some very “modern” approaches On top of some issues we consider essential
Provide specific examples and activities that you might plug into your courses
Point you toward online and print resources that might be helpful
APSA Conference, Sept 2010 2

Schedule
Introductions Opening Activity Activity Sessions
Data Collection Data Analysis
<< lunch>> Randomness Statistical Inference
Resources and Assessment Q&A, Wrap-Up
APSA Conference, Sept 2010 3
Requests
Participate in activities 23 of them!
We’ll skip/highlight some Play role of student
Good student, not disruptive student!
Feel free to interject comments, questions
APSA Conference, Sept 2010 4
GAISE
Emphasize statistical literacy and develop statistical thinking
Use real data Stress conceptual understanding rather than mere
knowledge of procedures Foster active learning in the classroom Use technology for developing conceptual
understanding and analyzing data Use assessments to improve and evaluate student
learningwww.amstat.org/education/gaiseAPSA Conference, Sept 2010 5

Opening Activity
Naughty or nice? (Nature, 2007) Videos:
http://www.yale.edu/infantlab/socialevaluation/Helper-Hinderer.html
Flip 16 coins, one for each infant, to decide which toy you want to play with (heads=helper)
Coin Tossing Applet: http://www.rossmanchance.com/applets
APSA Conference, Sept 2010 6
3S Strategy
Statistic Simulate
“Could have been” distribution of data for each repetition (under null model)
“What if” distribution of statistics across repetitions (under null model)
Strength of evidence Reject vs. plausible
APSA Conference, Sept 2010 7

Summary
Use real data/scientific studies Emphasize the process of statistical investigation
Stress conceptual understanding Idea of p-value on day 1/in one day!
Foster active learning You are a dot on the board
Use technology Could this have happened “by chance alone”? What if only 10 infants had picked the helper?
APSA Conference, Sept 2010 8

Data Collection Activities: Activity 2: Sampling Words Circle 10 representative words in the
passage Record the number of letters in each word Calculate the mean number of letters in your
sample Dotplot of results…
APSA Conference, Sept 2010 9

Sampling Words
The population mean of all 268 words is 4.295 letters
How many sample means were too high? Why do you think so many sample means are
too high?
APSA Conference, Sept 2010 10

Sampling Words
“Tactile” simulation Ask students to use computer or random number
table to take simple random samples Determine the sample mean in each sample Compare the distributions
APSA Conference, Sept 2010 11
Sampling Words
Java applet www.rossmanchance.com/applets/ Select “Sampling words” applet Select individual sample of 5 words Repeat Select 98 more samples of size 5 Explore the effect of sample size Explore the effect of population size
APSA Conference, Sept 2010 12

Morals: Selecting a Sample
Random Sampling eliminates human selection bias so the sample will be fair and unbiased/representative of the population.
While increasing the sample size improves precision, this does not decrease bias.
APSA Conference, Sept 2010 13

Activity 3: Night Lights and Near-Sightedness Quinn, Shin, Maguire, and Stone (1999) 479 children Did your child use a night light (or room light
or neither) before age 2? Eyesight: Hyperopia (far-sighted),
emmetropia (normal) or myopia (near-sighted)?
APSA Conference, Sept 2010 14
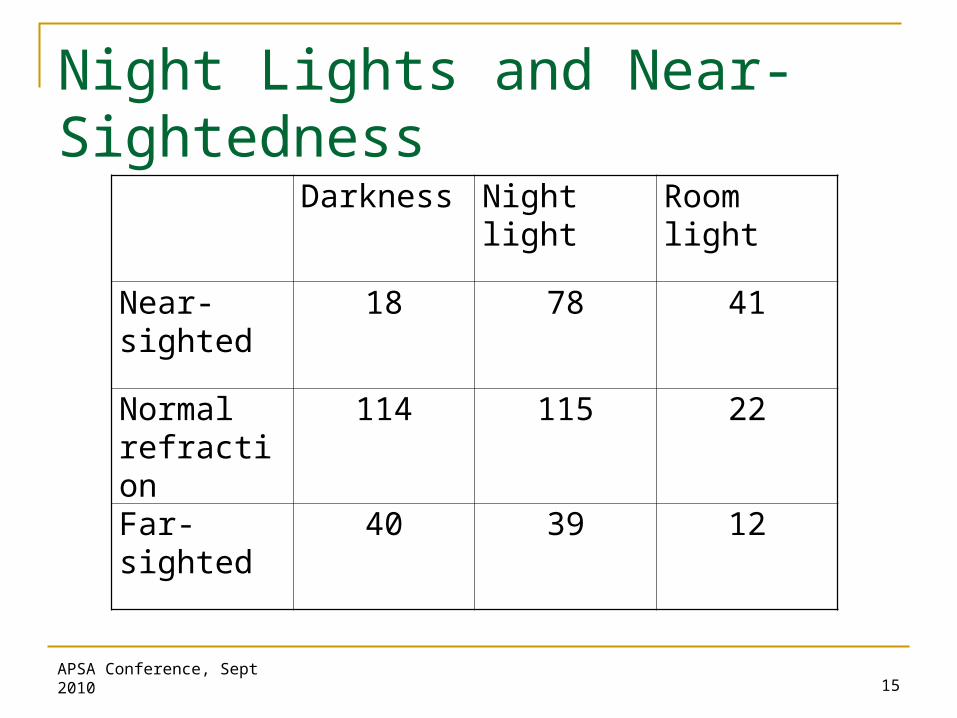
Night Lights and Near-Sightedness
Darkness Night light Room light
Near-sighted
18 78 41
Normal refraction
114 115 22
Far-sighted
40 39 12
APSA Conference, Sept 2010 15
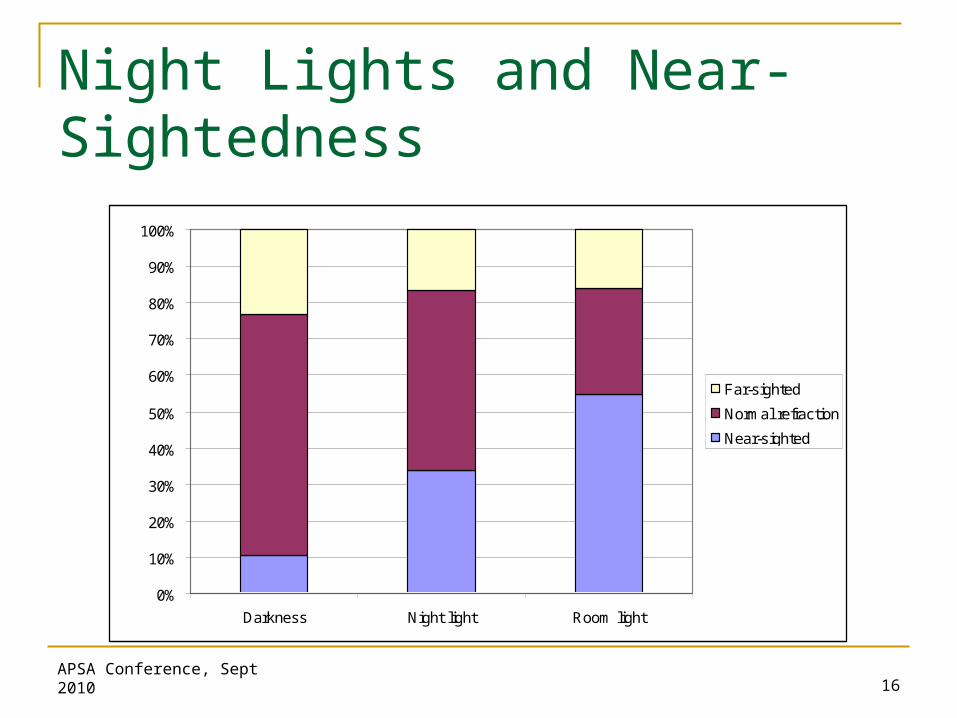
Night Lights and Near-Sightedness
APSA Conference, Sept 2010 16
0%
10%
20%
30%
40%
50%
60%
70%
80%
90%
100%
Darkness Night light Room light
Far-sighted
Normal refraction
Near-sighted

Morals: Confounding
Students can tell you that association is not the same as causation!
Need practice clearly describing how confounding variable Is linked to both explanatory and response
variables Provides an alternative explanation for observed
association
APSA Conference, Sept 2010 17
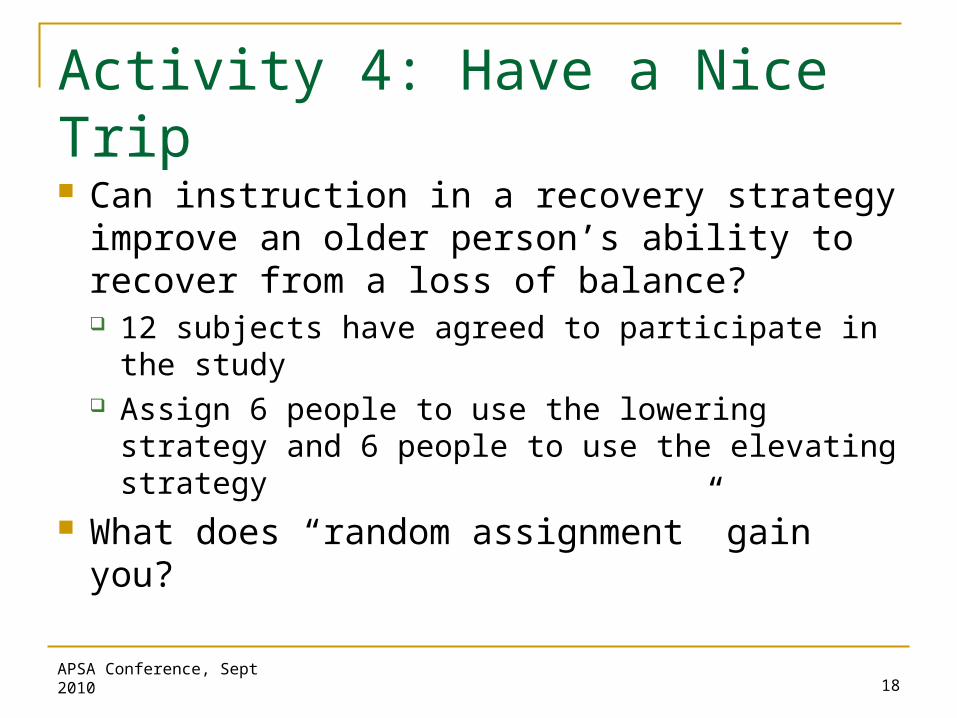
Activity 4: Have a Nice Trip
Can instruction in a recovery strategy improve an older person’s ability to recover from a loss of balance? 12 subjects have agreed to participate in the
study Assign 6 people to use the lowering strategy and
6 people to use the elevating strategy What does “random assignment” gain you?
APSA Conference, Sept 2010 18

Have a Nice Trip
Randomizing subjects applet How do the two groups compare?
APSA Conference, Sept 2010 19

Morals
Goal of random assignment is to be willing to consider the treatment groups equivalent prior to the imposition of the treatment(s).
This allows us to eliminate all potential confounding variables as a plausible explanation for any significant differences in the response variable after the treatments are imposed.
APSA Conference, Sept 2010 20

Activity 5: Cursive Writing
Does using cursive writing cause students to score better on the SAT essay?
APSA Conference, Sept 2010 21

Morals: Scope of Conclusions
Allocation of units to groups
By random assignment No random assignment
Selection of units
Random sampling
A random sample is selected from one population; units are then randomly assigned to different treatment groups
Random samples are selected from existing distinct populations Inferences to
populations can be drawn
Not random sampling
A groups of study units is found; units are then randomly assigned to treatment groups
Collections of available units from distinct groups are examined
Cause and effect conclusions can be drawn
The Statistical Sleuth, Ramsey and Schafer
APSA Conference, Sept 2010 22
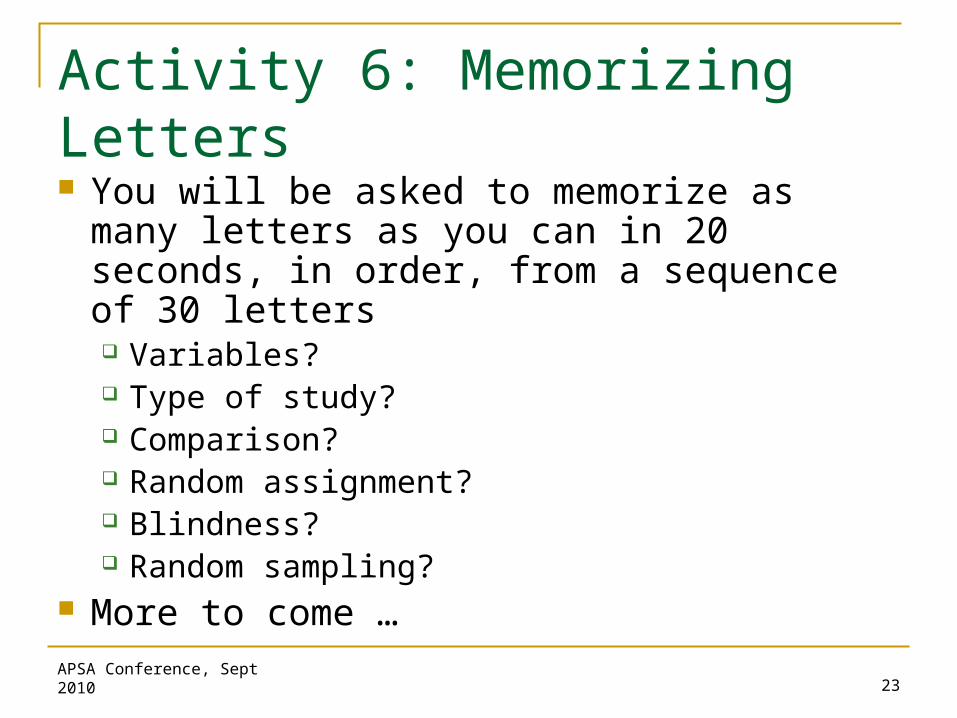
Activity 6: Memorizing Letters You will be asked to memorize as many
letters as you can in 20 seconds, in order, from a sequence of 30 letters Variables? Type of study? Comparison? Random assignment? Blindness? Random sampling?
More to come …APSA Conference, Sept 2010 23
Morals: Data Collection
Quick, simple experimental data collection Highlighting critical aspects of effective study
design Can return to the data several times in the
course
APSA Conference, Sept 2010 24
Data Analysis ActivitiesActivity 7: Matching Variables to Graphs Which dotplot belongs to which variable?
Justify your answer
APSA Conference, Sept 2010 25
Morals: Graph-sense
Learn to justify opinions Consistency, completeness
Appreciate variability Be able to find and explain patterns in the data
APSA Conference, Sept 2010 26

Activity 8: Rower Weights
2008 Men’s Olympic Rowing Team
APSA Conference, Sept 2010 27

Rower Weights
APSA Conference, Sept 2010 28
Mean Median
Full Data Set 197.96 205.00
Without Coxswain 201.17 207.00
Without Coxswain or 209.65 209.00
lightweight rowers
With heaviest at 249 210.65 209.00
With heaviest at 429 219.70 209.00
Resistance....

Morals: Rower Weights
Think about the context
“Data are numbers with a context” -Moore Know what your numerical summary is
measuring Investigate causes for unusual observations
Anticipate shape
APSA Conference, Sept 2010 29

Activity 9: Cancer Pamphlets
Researchers in Philadelphia investigated whether pamphlets containing information for cancer patients are written at a level that the cancer patients can comprehend
APSA Conference, Sept 2010 30

Cancer Pamphlets
0
0.05
0.1
0.15
0.2
0.25
0.3
unde
r 3 3 4 5 6 7 8 9
10 11 12
abov
e 12
level
prop
orti
on
patientspamphlets
APSA Conference, Sept 2010 31
Morals: Importance of Graphs Look at the data
Think about the question
Numerical summaries don’t tell the whole story “median isn’t the message” - Gould
APSA Conference, Sept 2010 32
Activity 10: Draft Lottery
Draft numbers (1-366) were assigned to birthdates in the 1970 draft lottery
Find your draft number Any 225s?
APSA Conference, Sept 2010 33
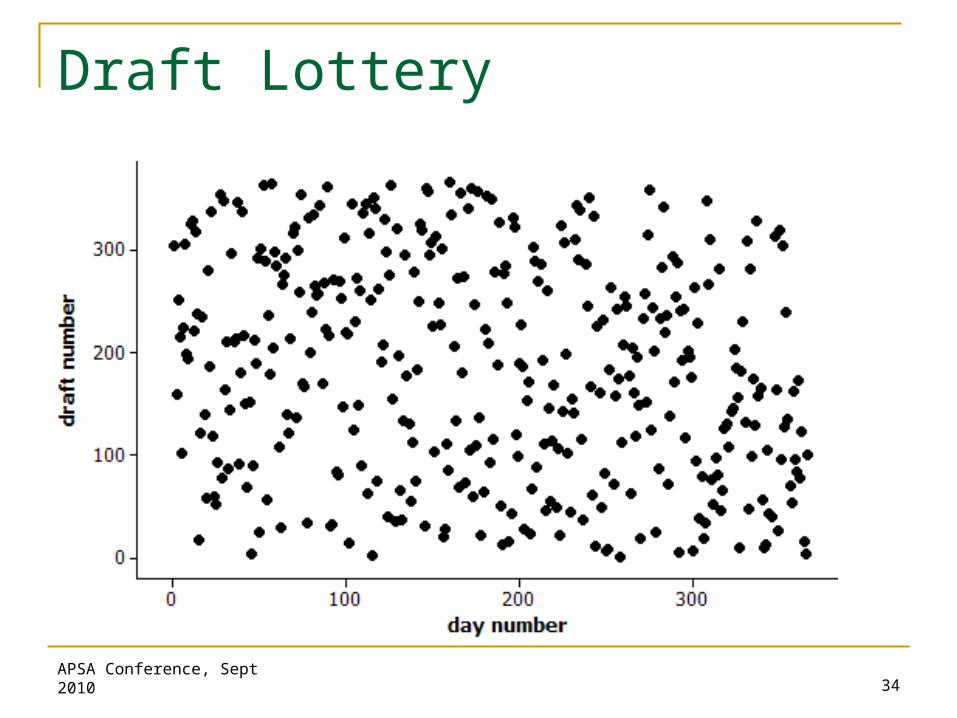
Draft Lottery
APSA Conference, Sept 2010 34

month median
January 211.0
February 210.0
March 256.0
April 225.0
May 226.0
June 207.5
month median
July 188.0
August 145.0
September 168.0
October 201.0
November 131.5
December 100.0
Draft Lottery
APSA Conference, Sept 2010 35
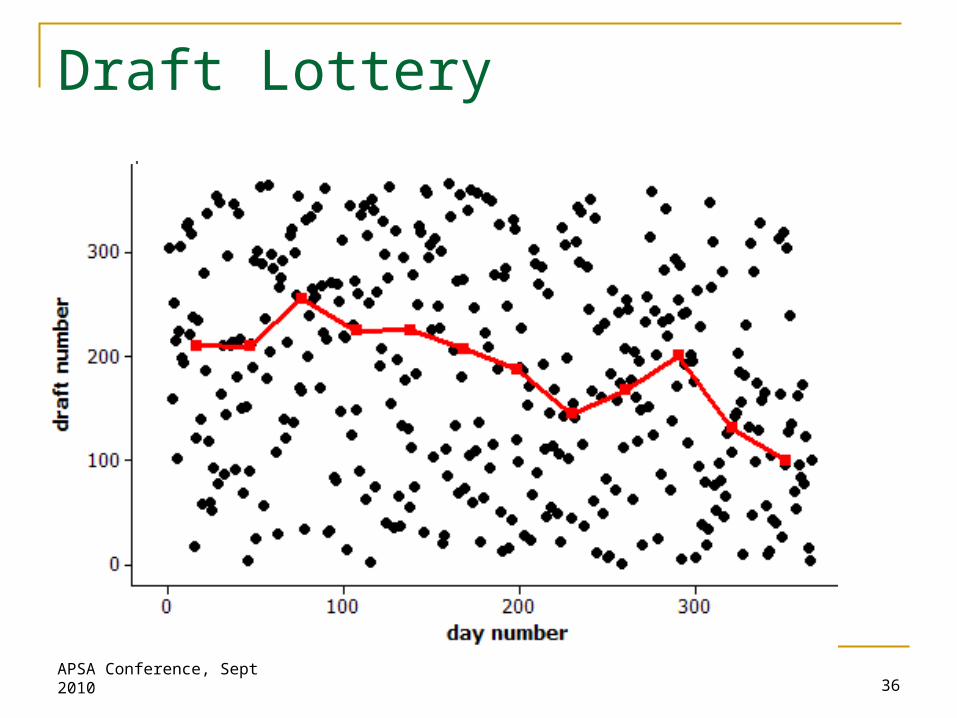
Draft Lottery
APSA Conference, Sept 2010 36

Morals: Statistics matters!
Summaries can illuminate Randomization can be difficult
APSA Conference, Sept 2010 37

Activity 11:Televisions and Life Expectancy Is there an association between the two
variables?
So sending televisions to countries with lower life expectancies would cause their inhabitants to live longer?
r = .743
APSA Conference, Sept 2010 38
Morals: Confounding
Don’t jump to conclusions from observational studies
The association is real but consider carefully the interpretation of graph and wording of conclusions (and headlines)
APSA Conference, Sept 2010 39
Activity 6 Revisited (Memorizing Letters) Produce, interpret graphical displays to
compare performance of two groups Does research hypothesis appear to be
supported? Any unusual features in distributions?
APSA Conference, Sept 2010 40

Lunch!
Questions? Write down and submit any questions you have
thus far on the statistical or pedagogical content…
APSA Conference, Sept 2010 41
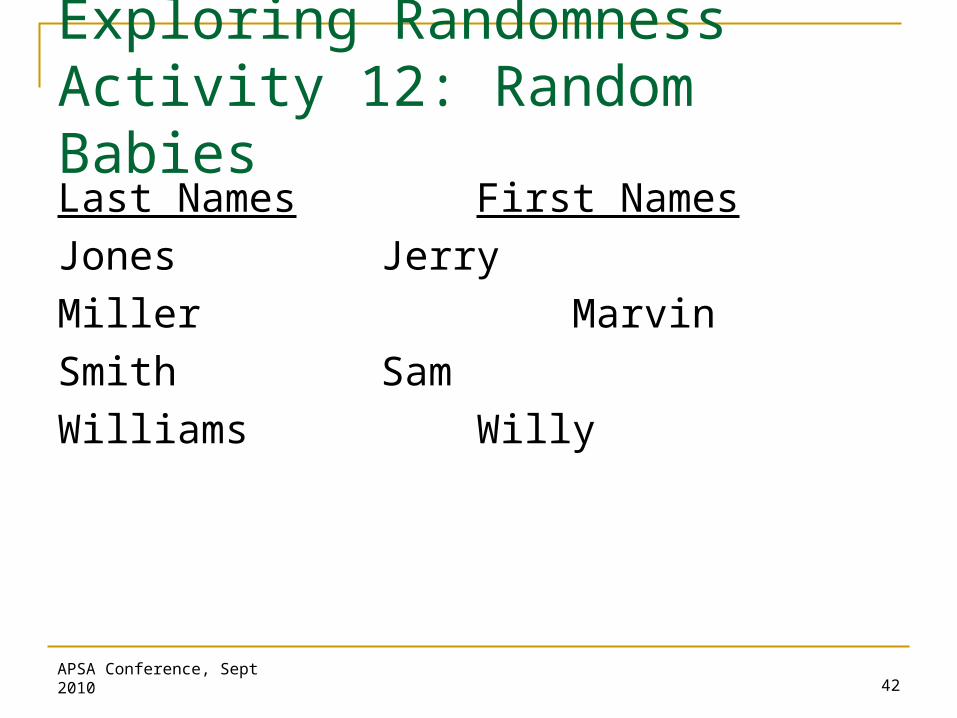
Exploring RandomnessActivity 12: Random Babies Last Names First Names
Jones Jerry
Miller Marvin
Smith Sam
Williams Willy
APSA Conference, Sept 2010 42

Random Babies
Last Names First Names
Jones Marvin
Miller
Smith
Williams
APSA Conference, Sept 2010 43
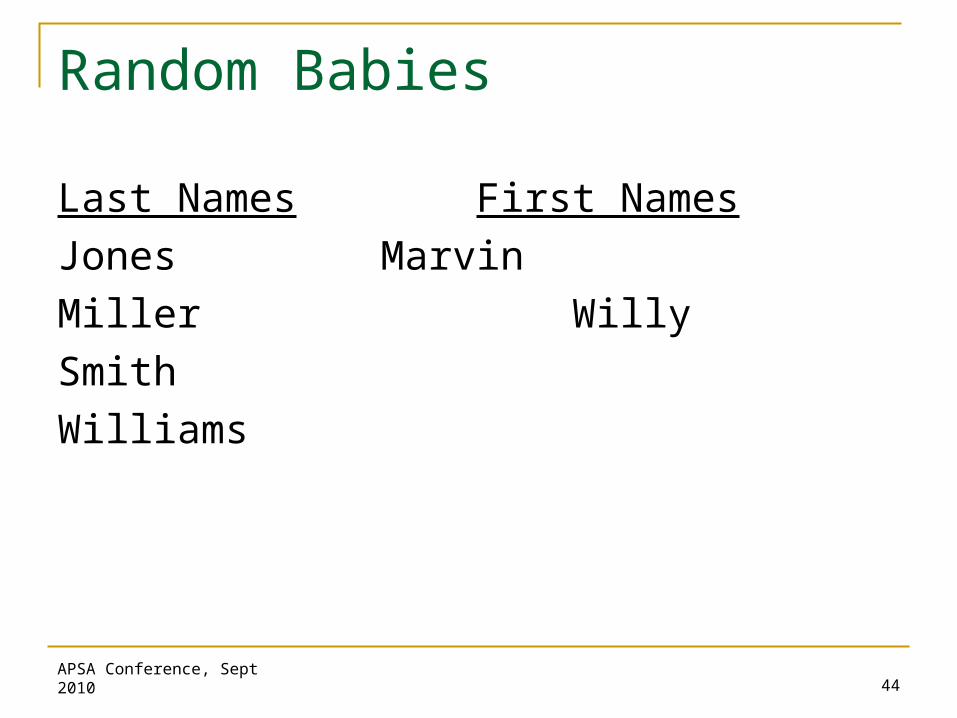
Random Babies
Last Names First Names
Jones Marvin
Miller Willy
Smith
Williams
APSA Conference, Sept 2010 44
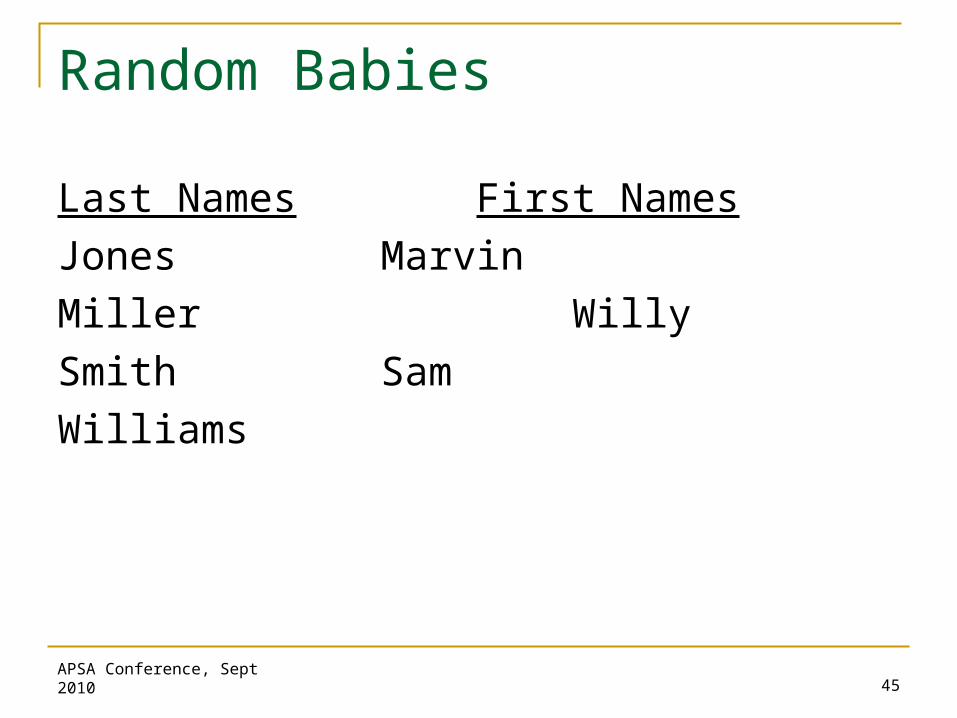
Random Babies
Last Names First Names
Jones Marvin
Miller Willy
Smith Sam
Williams
APSA Conference, Sept 2010 45
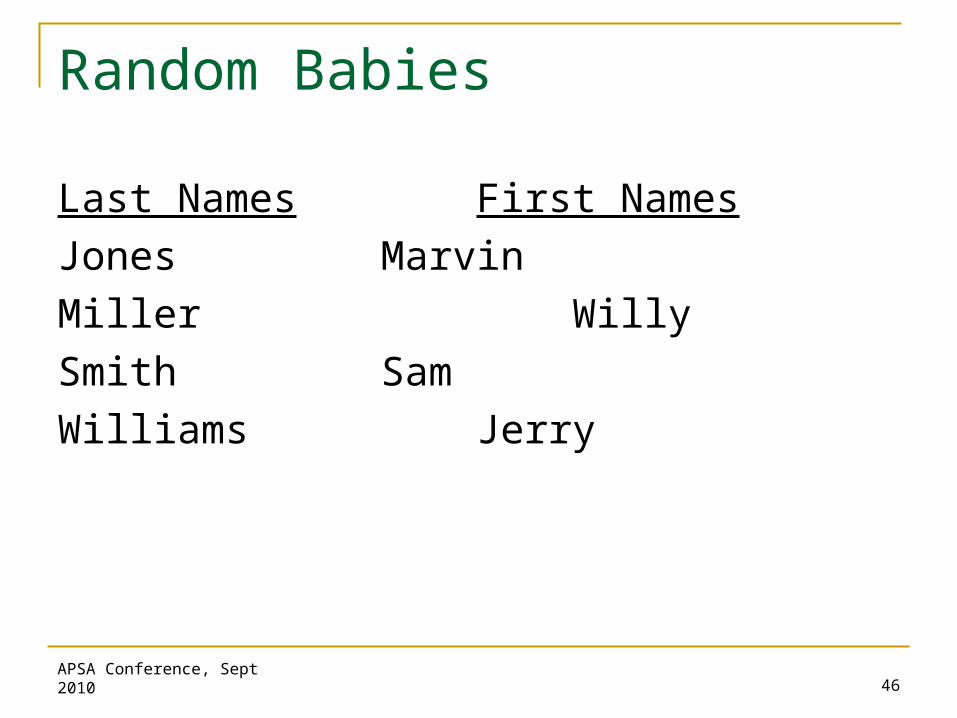
Last Names First Names
Jones Marvin
Miller Willy
Smith Sam
Williams Jerry
Random Babies
APSA Conference, Sept 2010 46

Last Names First Names
Jones Marvin
Miller Willy
Smith Sam 1 match
Williams Jerry
Random Babies
APSA Conference, Sept 2010 47

Random Babies
Long-run relative frequency Applet: www.rossmanchance.com/applets/ “Random Babies”
APSA Conference, Sept 2010 48

Random Babies: Mathematical Analysis
1234 1243 1324 1342 1423 1432
2134 2143 2314 2341 2413 2431
3124 3142 3214 3241 3412 3421
4123 4132 4213 4231 4312 4321
APSA Conference, Sept 2010 49
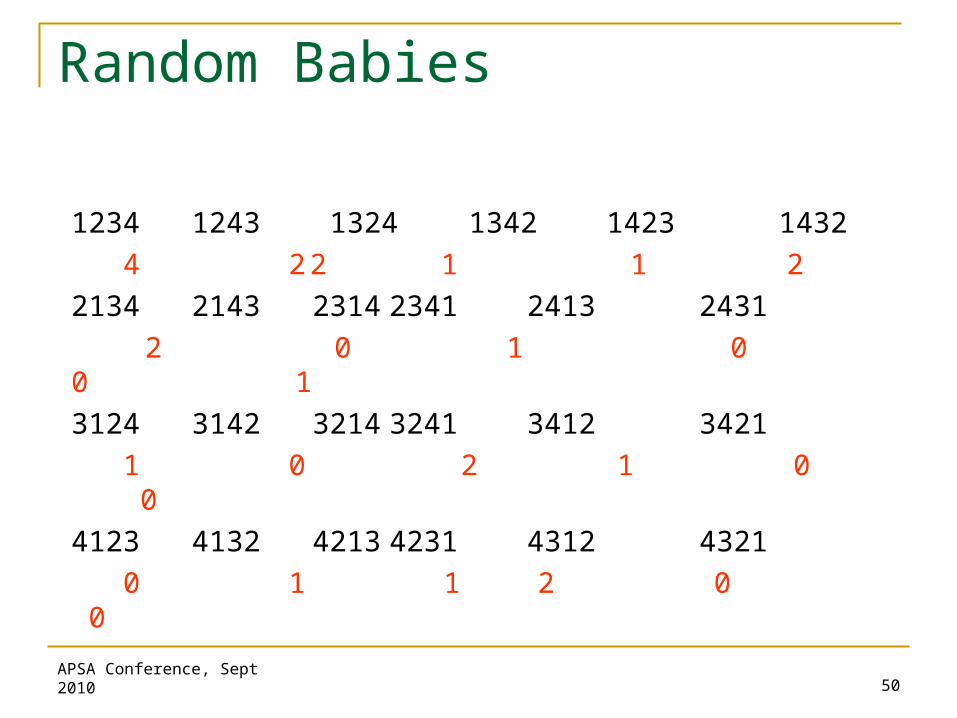
Random Babies
1234 1243 1324 1342 1423 1432
4 2 2 1 1 2
2134 2143 2314 2341 2413 2431
2 0 1 0 0 1
3124 3142 3214 3241 3412 3421
1 0 2 1 0 0
4123 4132 4213 4231 4312 4321
0 1 1 2 0 0
APSA Conference, Sept 2010 50
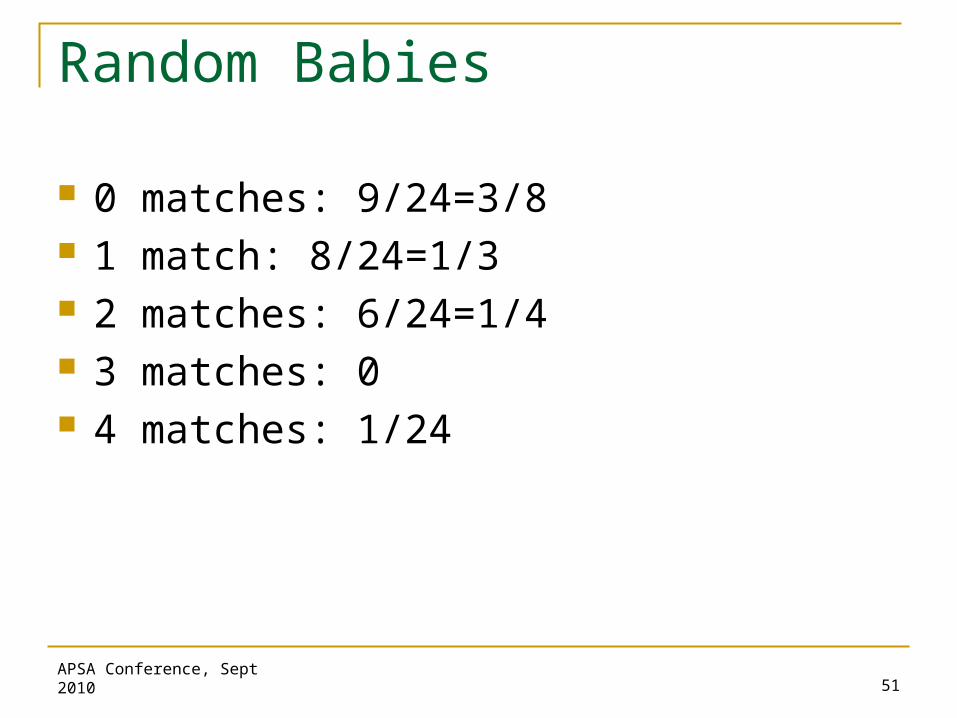
0 matches: 9/24=3/8 1 match: 8/24=1/3 2 matches: 6/24=1/4 3 matches: 0 4 matches: 1/24
Random Babies
APSA Conference, Sept 2010 51

Goal: Interpretation in terms of long-run relative frequency, average value 30% chance of rain…
First simulate, then do theoretical analysis Able to list sample space Short cuts when are actually equally likely
Simple, fun applications of basic probability
Morals: Treatment of Probability
APSA Conference, Sept 2010 52

ELISA test used to screen blood for the AIDS virus Sensitivity: P(+|AIDS)=.977 Specificity: P(-|no AIDS)=.926 Base rate: P(AIDS)=.005
Find P(AIDS|+) Initial guess? Bayes’ theorem? Construct a two-way table for hypothetical population
Activity 13: AIDS Testing
APSA Conference, Sept 2010 53

Positive Negative TotalAIDSNo AIDSTotal 1,000,000
AIDS Testing
APSA Conference, Sept 2010 54

Positive Negative TotalAIDS 5,000No AIDS 995,000Total 1,000,000
AIDS Testing
APSA Conference, Sept 2010 55

Positive Negative TotalAIDS 4885 115 5,000No AIDS 995,000Total 1,000,000
AIDS Testing
APSA Conference, Sept 2010 56
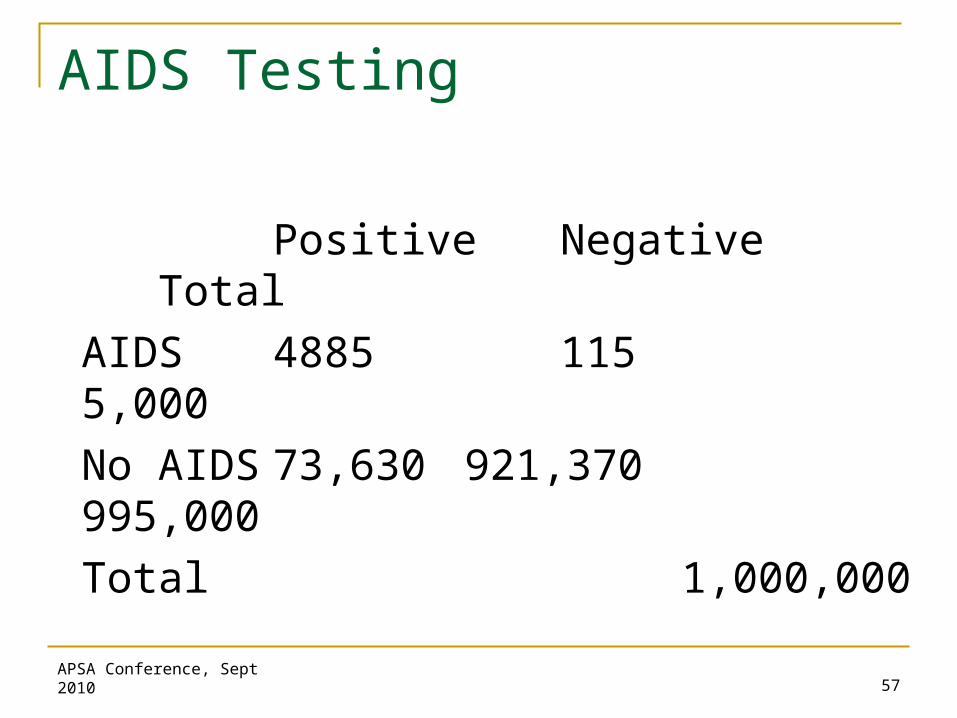
Positive Negative TotalAIDS 4885 115 5,000No AIDS 73,630 921,370 995,000Total 1,000,000
AIDS Testing
APSA Conference, Sept 2010 57
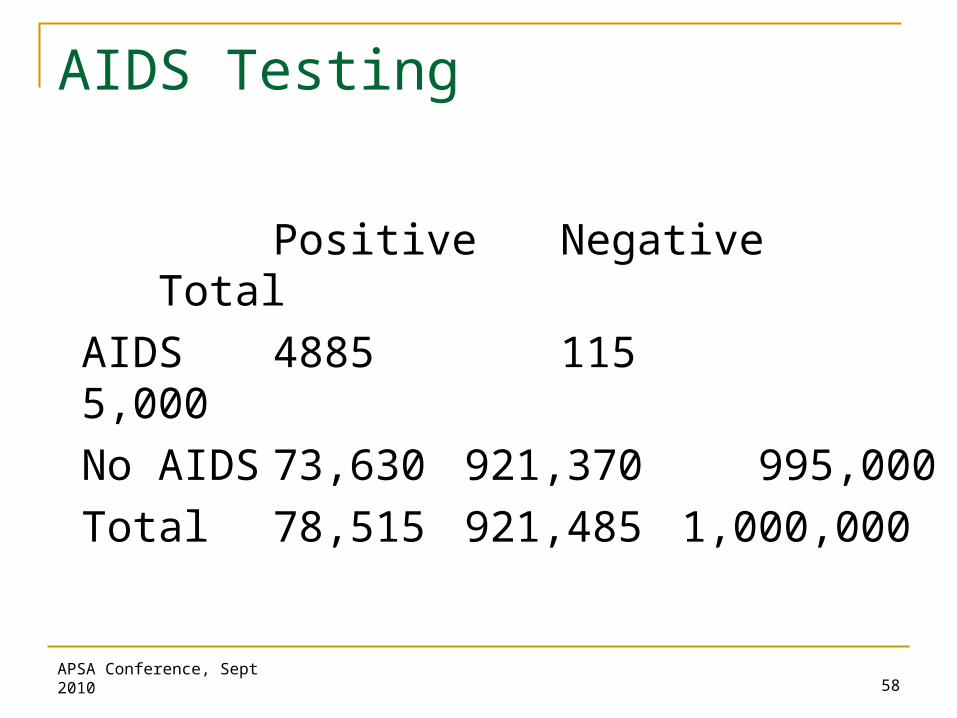
Positive Negative TotalAIDS 4885 115 5,000No AIDS 73,630 921,370 995,000Total 78,515 921,485 1,000,000
AIDS Testing
APSA Conference, Sept 2010 58
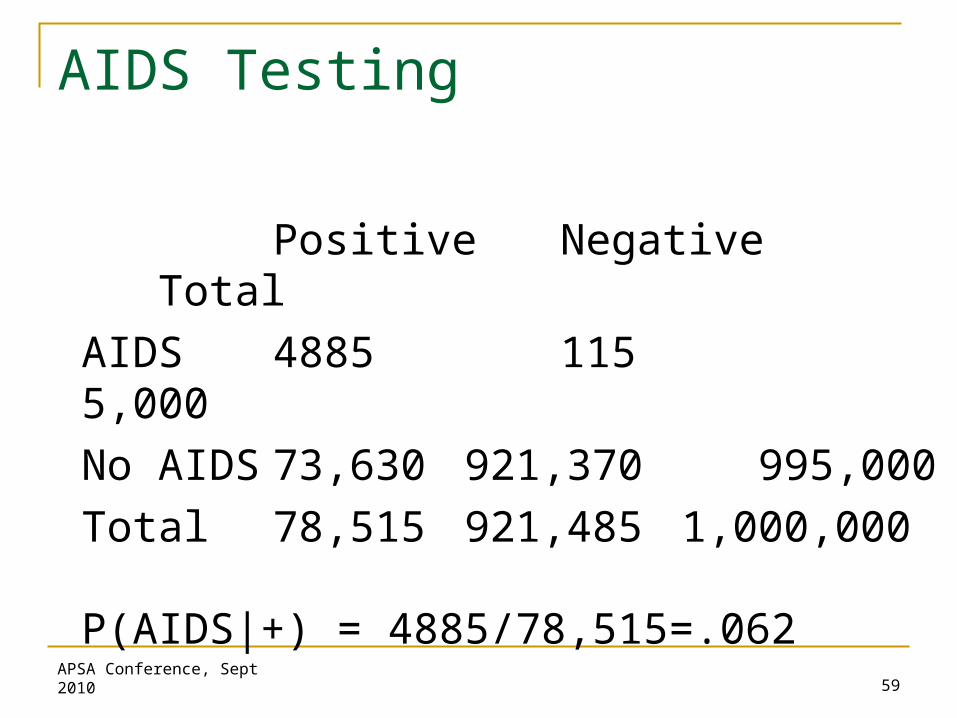
Positive Negative TotalAIDS 4885 115 5,000No AIDS 73,630 921,370 995,000Total 78,515 921,485 1,000,000
P(AIDS|+) = 4885/78,515=.062
AIDS Testing
APSA Conference, Sept 2010 59
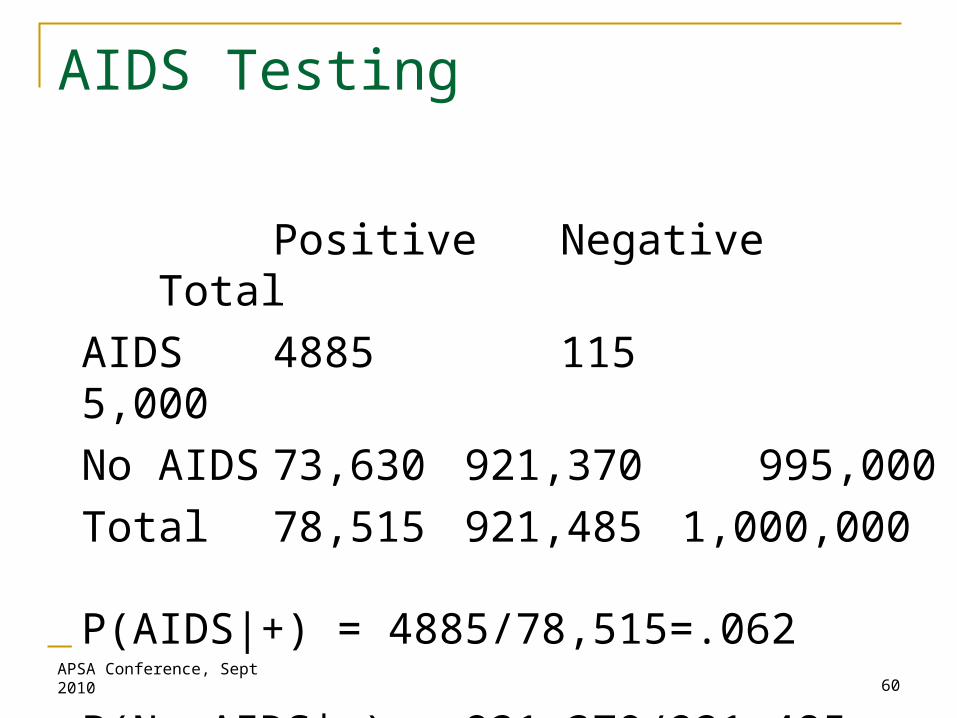
Positive Negative TotalAIDS 4885 115 5,000No AIDS 73,630 921,370 995,000Total 78,515 921,485 1,000,000
P(AIDS|+) = 4885/78,515=.062
P(No AIDS|-) = 921,370/921,485 =.999875
AIDS Testing
APSA Conference, Sept 2010 60

Intuition about conditional probability can be very faulty Confront misconception head-on
Conditional probability can be explored through two-way tables Treatment of formal probability can be minimized
Morals: Surprise Students!
APSA Conference, Sept 2010 61

Activity 14: Reese’s Pieces
APSA Conference, Sept 2010 62
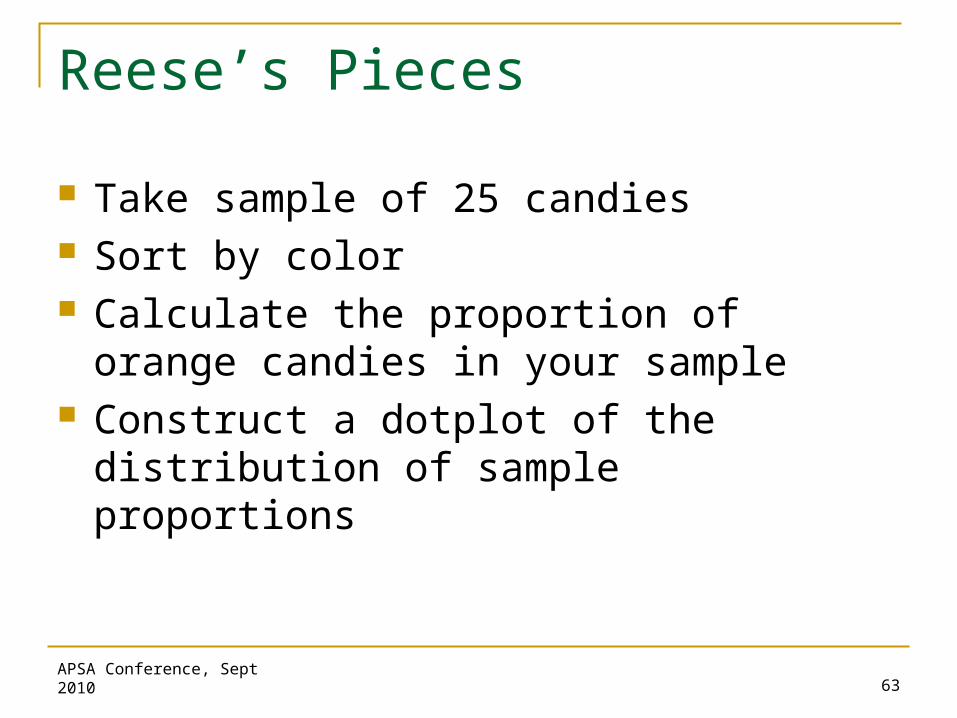
Take sample of 25 candies Sort by color Calculate the proportion of orange candies in
your sample Construct a dotplot of the distribution of
sample proportions
Reese’s Pieces
APSA Conference, Sept 2010 63

Turn over to technology Reeses Pieces applet
(www.rossmanchance.com/applets/)
Reese’s Pieces
APSA Conference, Sept 2010 64

Study randomness to develop intuition for statistical ideas Not probability for its own sake
Always precede technology simulations with physical ones
Apply more than derive formulas
Morals: Sampling Distributions
APSA Conference, Sept 2010 65

Left Front Right Front
Left Rear Right Rear
Activity 15: Which Tire?
APSA Conference, Sept 2010 66
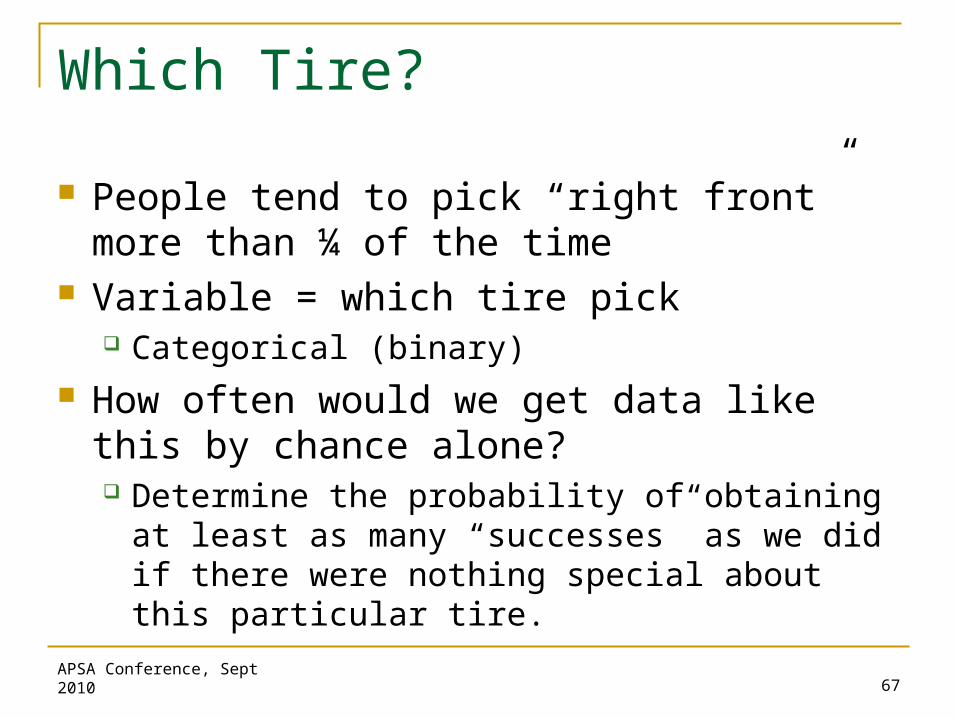
People tend to pick “right front” more than ¼ of the time
Variable = which tire pick Categorical (binary)
How often would we get data like this by chance alone? Determine the probability of obtaining at least as
many “successes” as we did if there were nothing special about this particular tire.
Which Tire?
APSA Conference, Sept 2010 67

Let = proportion of all … who pick right front H0: = .25
Ha: > .25 Test statistic z = p-value = Pr(Z>z)
How does this depend on n? Test of Significance Calculator
n/)75(.25.
25.32.
Which Tire?
APSA Conference, Sept 2010 68
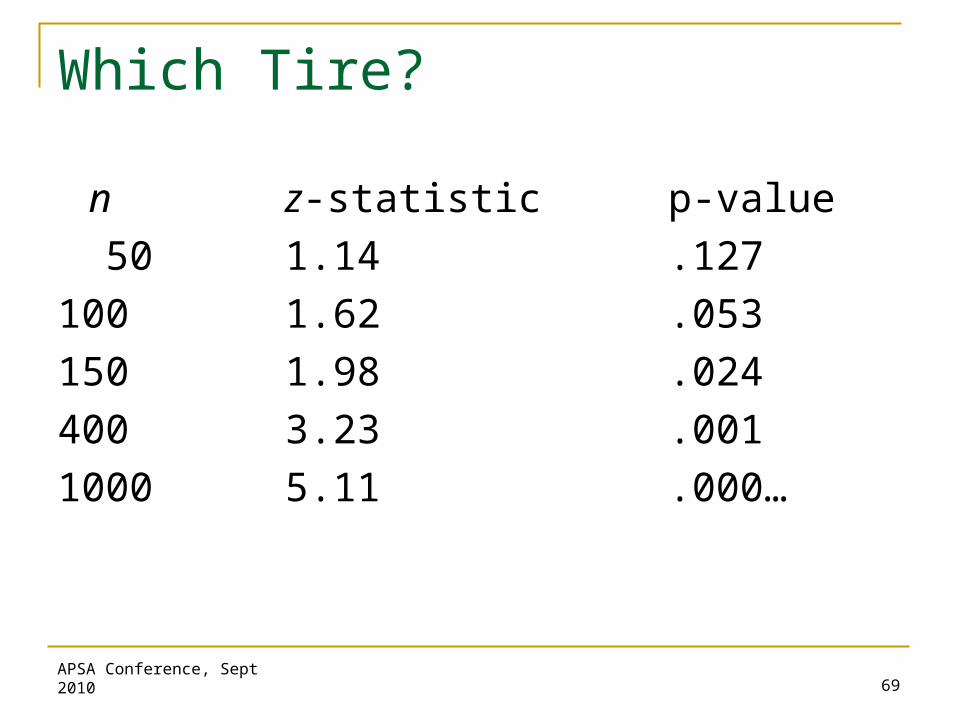
n z-statistic p-value
50 1.14 .127
100 1.62 .053
150 1.98 .024
400 3.23 .001
1000 5.11 .000…
Which Tire?
APSA Conference, Sept 2010 69
Fun simple data collection Effect of sample size
hard to establish result with small samples Never “accept” null hypothesis
Morals: Formal Statistical Inference
APSA Conference, Sept 2010 70

Activity 16: Kissing the Right Way Biopsychology observational study
Güntürkün (2003) recorded the direction turned by kissing couples to see if there was also a right-sided dominance.
APSA Conference, Sept 2010 71

Kissing the Right Way
Is 1/2 a plausible value for the probability a kissing couple turns right?Coin Tossing applet
Is 2/3 a plausible value for the probability a kissing couple turns right? Is the observed result in the tail of the “what if”
distribution?
APSA Conference, Sept 2010 72
Kissing the Right Way
Determine the plausible values for the probability a kissing couple turns right…
The values that produce an approximate p-value greater than .05 are not rejected and are therefore considered plausible values of the parameter. The interval of plausible values is sometimes called a confidence interval for the parameter.
APSA Conference, Sept 2010 73
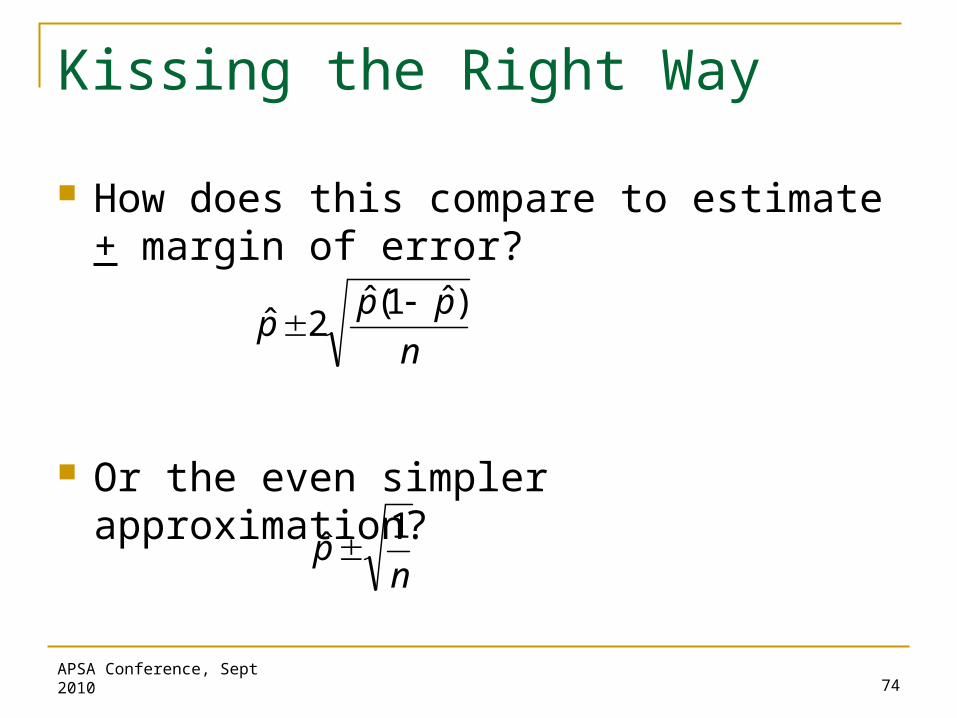
Kissing the Right Way
How does this compare to estimate + margin of error?
Or the even simpler approximation?
APSA Conference, Sept 2010 74
n
ppp
)ˆ1(ˆ2ˆ
np
1ˆ
Morals: Kissing the Right Way Interval estimation as (more?) important as
significance Confidence interval as set of plausible (not
rejected) values Interpretation of margin-of-error
APSA Conference, Sept 2010 75
Activity 17: Reese’s Pieces Revisited Calculate 95% confidence interval for from
your sample proportion of orange Does everyone have same interval? Does every interval necessarily capture ? What proportion of class intervals would you
expect? Simulating Confidence Intervals applet
What percentage of intervals succeed? Change confidence level, sample size
APSA Conference, Sept 2010 76

Morals: Reese’s Pieces Revisited Interpretation of confidence level
In terms of long-run results from taking many samples
Effects of confidence level, sample size on confidence interval
APSA Conference, Sept 2010 77
7878
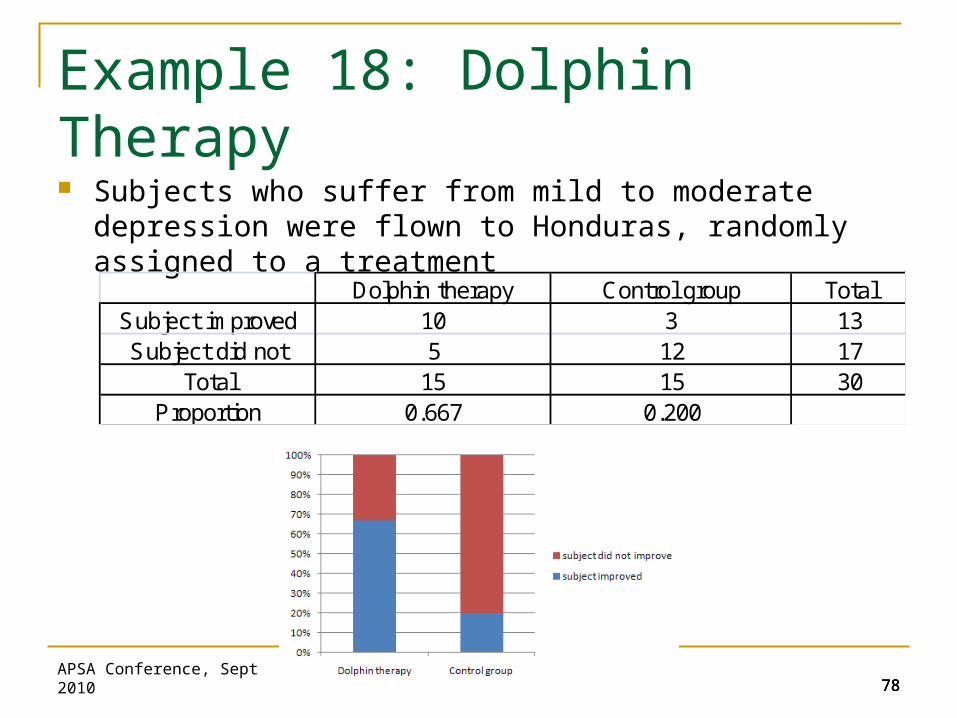
Example 18: Dolphin Therapy Subjects who suffer from mild to moderate depression were
flown to Honduras, randomly assigned to a treatment
Dolphin therapy Control group TotalSubject improved 10 3 13Subject did not 5 12 17
Total 15 15 30Proportion 0.667 0.200
APSA Conference, Sept 2010 78

Dolphin Therapy
Is dolphin therapy more effective than control? Core question of inference:
Is such an extreme difference unlikely to occur by chance (random assignment) alone (if there were no treatment effect)?
APSA Conference, Sept 2010 79
8080
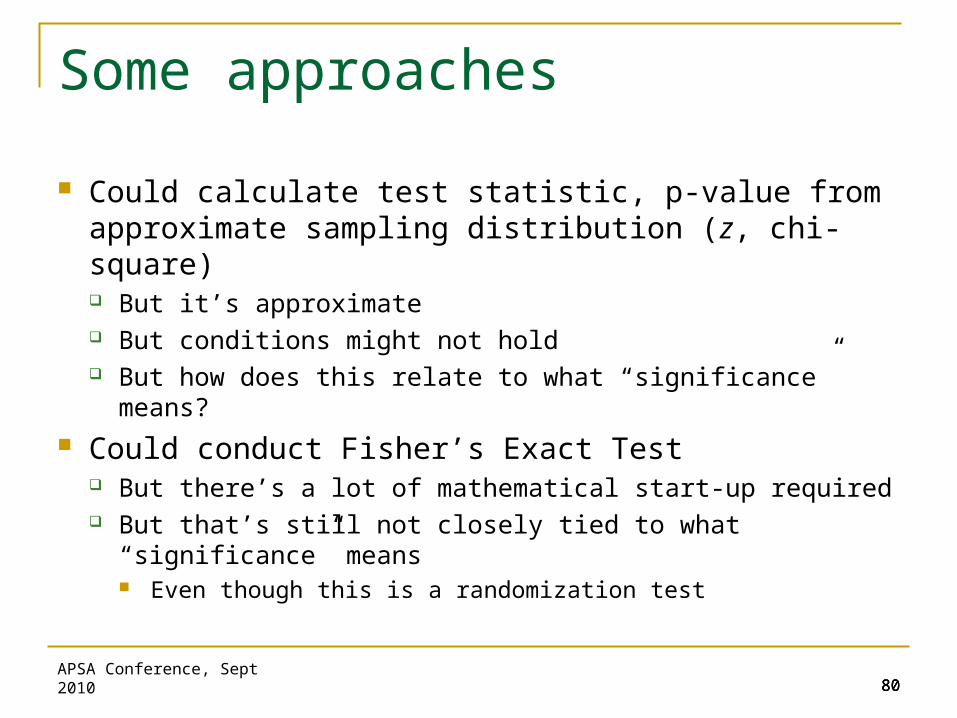
Some approaches
Could calculate test statistic, p-value from approximate sampling distribution (z, chi-square) But it’s approximate But conditions might not hold But how does this relate to what “significance” means?
Could conduct Fisher’s Exact Test But there’s a lot of mathematical start-up required But that’s still not closely tied to what “significance” means
Even though this is a randomization test
APSA Conference, Sept 2010 80

8181
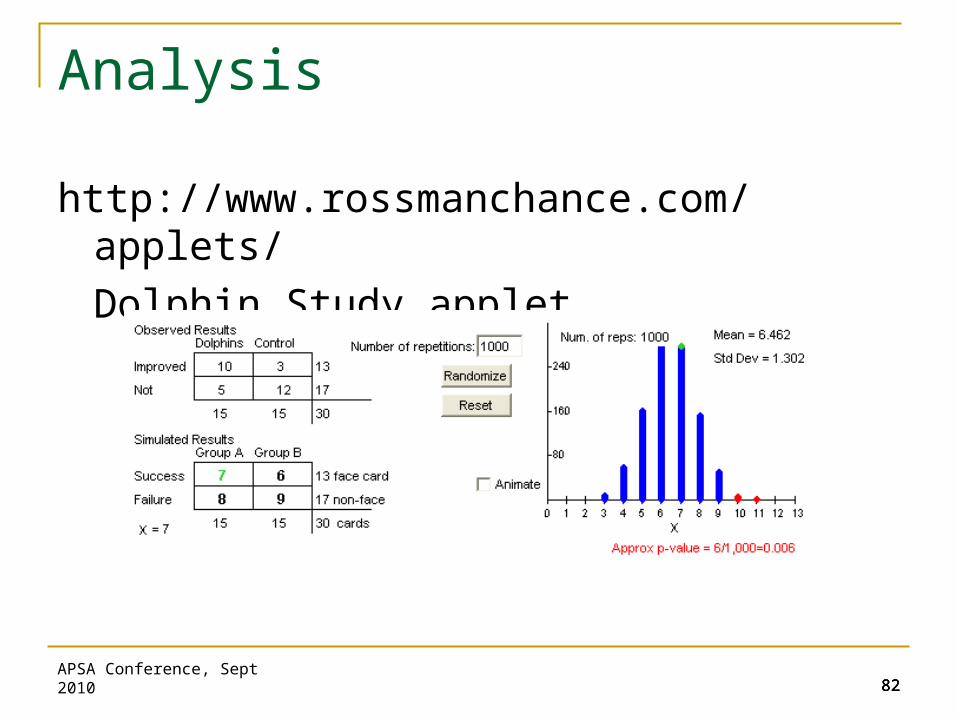
3S Approach
Simulate random assignment process many times, see how often such an extreme result occurs Assume no treatment effect (null model) Re-randomize 30 subjects to two groups (using cards)
Assuming 13 improvers, 17 non-improvers regardless Determine number of improvers in dolphin group
Or, equivalently, difference in improvement proportions Repeat large number of times (turn to computer) Ask whether observed result is in tail of what if distribution
Indicating saw a surprising result under null model Providing evidence that dolphin therapy is more effective
APSA Conference, Sept 2010 81
8282
Analysis
http://www.rossmanchance.com/applets/
Dolphin Study applet
APSA Conference, Sept 2010 82

8383
Conclusion
Experimental result is statistically significant And what is the logic behind that?
Observed result very unlikely to occur by chance (random assignment) alone (if dolphin therapy was not effective)
APSA Conference, Sept 2010 83
Morals
Re-emphasize meaning of significance and p-value Use of randomness in study
Focus on statistical process, scope of conclusions
APSA Conference, Sept 2010 84

8585
Activity 19: Sleep Deprivation Does sleep deprivation have harmful effects
on cognitive functioning three days later? 21 subjects; random assignment
Core question of inference: Is such an extreme difference unlikely to occur by
chance (random assignment) alone (if there were no treatment effect)?
improvement
sleep c
onditio
n
4032241680-8-16
deprived
unrestricted
APSA Conference, Sept 2010 85

8686
Sleep Deprivation
Simulate randomization process many times under null model, see how often such an extreme result (difference in group medians or means) occurs
Start with tactile simulation using index cards Write each “score” on a card Shuffle the cards Randomly deal out 11 for deprived group, 10 for unrestricted
group Calculate difference in group medians (or means) Repeat many times (Randomization Tests applet)
APSA Conference, Sept 2010 86

Sleep Deprivation
Conclusion: Fairly strong evidence that sleep deprivation produces lower improvements, on average, even three days later Justification: Experimental results as extreme as
those in the actual study would be quite unlikely to occur by chance alone, if there were no effect of the sleep deprivation
APSA Conference, Sept 2010 87
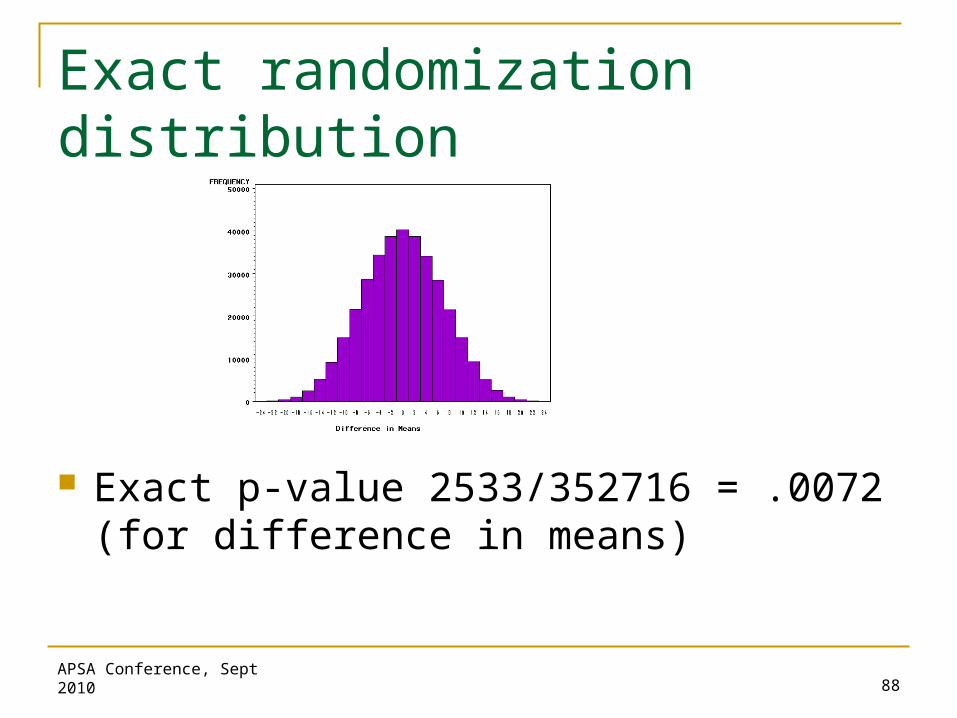
Exact randomization distribution
Exact p-value 2533/352716 = .0072 (for difference in means)
APSA Conference, Sept 2010 88

Morals: Randomizations Tests Emphasizes core logic of inference
Takes advantage of modern computing power Easy to generalize to other statistics
APSA Conference, Sept 2010 89

Activity 6 Revisited (Memorizing Letters) Conduct randomization test to assess
strength of evidence in support of research hypothesis Enter data into applet
Summarize conclusion and reasoning process behind it
Does non-significant result indicate that grouping of letters has no effect?
APSA Conference, Sept 2010 90
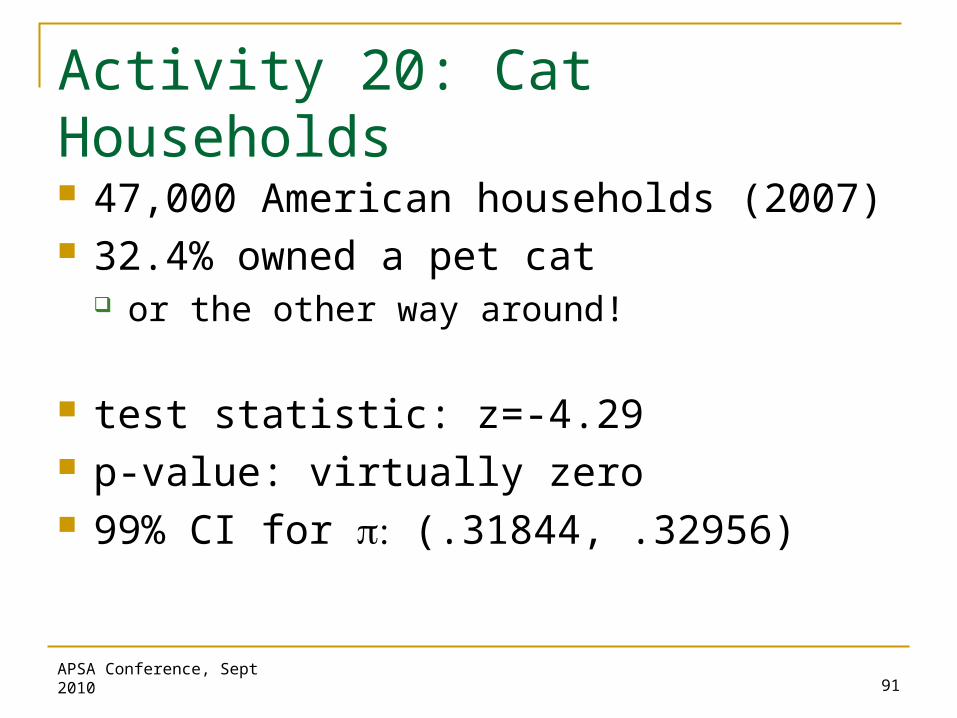
Activity 20: Cat Households
47,000 American households (2007) 32.4% owned a pet cat
or the other way around!
test statistic: z=-4.29 p-value: virtually zero 99% CI for (.31844, .32956)
APSA Conference, Sept 2010 91
Morals: Limits of statistical significance Statistical significance is not practical
significance Especially with large sample sizes
Accompany significant tests with confidence intervals whenever possible
APSA Conference, Sept 2010 92

Activity 21: Female Senators
17 women, 83 men in 2010
95% CI for :
= .170 + .074
= (.096, .244)
APSA Conference, Sept 2010 93

Always consider sampling procedure Randomness is key assumption Garbage in, garbage out
Inference is not always appropriate! Sample = population here
Morals: Limitations of Inference
APSA Conference, Sept 2010 94

Activity 22: Game Show Prices Sample of 208 prizes from The Price is Right Examine a histogram 99% confidence interval for the mean Technical conditions? What percentage of the prizes fall in this
interval? Why is this not close to 99%?
APSA Conference, Sept 2010 95

Morals: Cautions/Limitations
Prediction intervals vs. confidence intervals
Constant attention to what the “it” is
APSA Conference, Sept 2010 96

Activity 23: Government Spending 2004 General Social Survey: Is there an
association between American adults’ opinion on federal government spending on the environment and political inclinations?
APSA Conference, Sept 2010 97
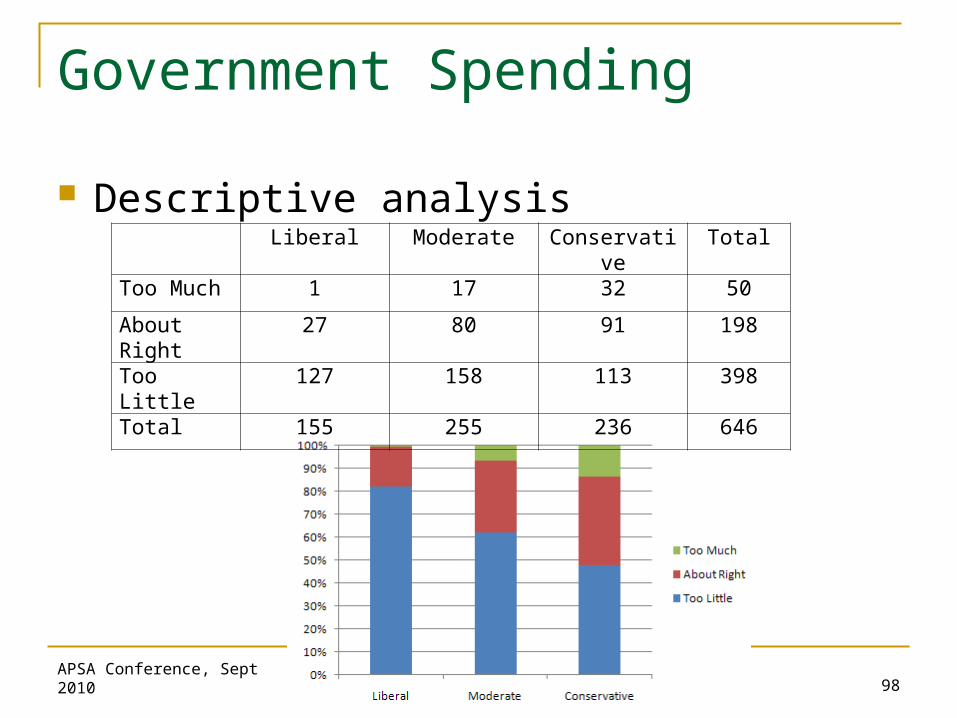
Government Spending
Descriptive analysis
APSA Conference, Sept 2010 98
Liberal Moderate Conservative
Total
Too Much 1 17 32 50About Right
27 80 91 198
Too Little 127 158 113 398Total 155 255 236 646

Government Spending
Inferential analysis – 3S approach1. Chi-square statistic
2. Simulate sampling distribution of chi-square test statistic under null hypothesis of no association Randomly mix up political inclinations, determine “could
have been” table Repeat many times and examine “what if” distribution of
chi-square values under null hypothesis
APSA Conference, Sept 2010 99
Government Spending
3. Strength of evidence Is observed chi-square value in tail of distribution?
Summarize: What conclusions should be drawn? Very statistically significant Not cause and effect Ok to generalize to adult Americans
APSA Conference, Sept 2010 100

Government Spending
What about federal spending on the space program?
APSA Conference, Sept 2010 101
More or less evidence of association?Larger or smaller p-value?

General Advice
Emphasize the process of statistical investigations, from posing questions to collecting data to analyzing data to drawing inferences to communicating findings
Use simulation, both tactile and technology-based, to explore concepts of inference and randomness
Draw connections between how data are collected (e.g., random assignment, random sampling) and scope of conclusions to be drawn (e.g., causation, generalizability)
Use real data from genuine studies, as well as data collected on students themselves
Present important studies (e.g., draft lottery) and frivolous ones (e.g., flat tires) and especially studies of issues that are directly relevant to students (e.g., sleep deprivation)
APSA Conference, Sept 2010 102

General Advice (cont.)
Lead students to “discover” and tell you important principles (e.g., association does not imply causation)
Keep in mind the research question when analyzing data Graphical displays can be very useful Summary statistics (measures of center and spread) are helpful
but don’t tell whole story; consider entire distribution Develop graph-sense, number-sense by always thinking about
context Use technology to reduce the burden of rote calculations, both
for analyzing data and exploring concepts Emphasize cautions and limitations with regard to inference
procedures
APSA Conference, Sept 2010 103
Implementation Suggestions Take control of the course Collect data from students Encourage predictions from students Allow students to discover/tell you findings Precede technology simulations with tactile Promote collaborative learning Provide lots of feedback Follow activities with related assessments Intermix lectures with activities Don’t underestimate ability of activities to teach materials Have fun!
APSA Conference, Sept 2010 104

Suggestion #1
Take control of the course Not “control” in usual sense of standing at front
dispensing information But still need to establish structure, inspire
confidence that activities, self-discovery will work Be pro-active in approaching students
Don’t wait for students to ask questions of you Ask them to defend their answers Be encouraging
Instructor as facilitator/manager
APSA Conference, Sept 2010 105

Suggestion #2
Collect data from students Leads them to personally identify with data,
analysis; gives them ownership Collect anonymously Can do out-of-class E.g., matching variables to graphs
APSA Conference, Sept 2010 106

Suggestion #3
Encourage predictions from students Fine (better…) to guess wrong, but important to
take stake in some position Directly confront common misconceptions
Have to “convince” them they are wrong (e.g., Gettysburg address) before they will change their way of thinking
E.g., AIDS Testing
APSA Conference, Sept 2010 107
Suggestion #4
Allow students to discover, tell you findings E.g., Televisions and life expectancy
“I hear, I forget. I see, I remember. I do, I understand.” -- Chinese proverb
APSA Conference, Sept 2010 108
Suggestion #5
Precede technology simulations with tactile/ concrete/hands-on simulations Enables students to understand process being
simulated Prevents technology from coming across as
mysterious “black box” E.g., Gettysburg Address (actual before applet)
APSA Conference, Sept 2010 109

Suggestion #6
Promote collaborative learning Students can learn from each other
Better yet from “arguing” with each other
Students bring different background knowledge E.g., Matching variables to graphs
APSA Conference, Sept 2010 110

Suggestion #7
Provide lots of feedback Danger of “discovering” wrong things Provide access to “model” answers after the fact
Could write “answers” on board Could lead discussion/debriefing afterward
APSA Conference, Sept 2010 111

Suggestion #8
Follow activities with related assessments Or could be perceived as “fun and games” only
Require summary paragraphs in their own words Clarify early (e.g., quizzes) that they will be responsible
for the knowledge Assessments encourage students to grasp
concept Can also help them to understand concept
E.g., fill in the blank p-value interpretation
APSA Conference, Sept 2010 112
Suggestion #9
Inter-mix lectures with activities One approach: Lecture on a topic after students
have performed activity Students better able to process, learn from lecture
having grappled with issues themselves first Another approach: Engage in activities toward
end of class period Often hard to re-capture students’ attention afterward
Need frequent variety
APSA Conference, Sept 2010 113
Suggestion #10
Do not under-estimate ability of activities to “teach” material No dichotomy between “content” and “activities” Some activities address many ideas
E.g. “Gettysburg Address” activity Population vs. sample, parameter vs. statistic Bias, variability, precision Random sampling, effect of sample/population size Sampling variability, sampling distribution, Central Limit
Theorem (consequences and applicability)
APSA Conference, Sept 2010 114

Suggestion #11
Have fun!
APSA Conference, Sept 2010 115

Assessment Advice
Two sample final exams Carefully match the course goals Be cognizant of any review materials you have given the students Use real data and genuine studies Provide students with guidance for how long they should spend per
problem Use multiple parts to one context but aim for independent parts (if a
student cannot answer part (a) they may still be able to answer part (b)) Use open-ended questions requiring written explanation Aim for at least 50% conceptual questions rather than pure calculation
questions (Occasionally) Expect students to think, integrate, apply beyond what
they have learned.
Sample guidelines for student projects
APSA Conference, Sept 2010 116
Promoting Student Progress
Document and enhance student learning Element of instruction Interactive feedback loop
Diagnostic with indicators for change Throughout the course To student and instructor Encourage self-evaluation
Multiple indicators
APSA Conference, Sept 2010 117

Student Projects
Best way to demonstrate to students the practice of statistics
Experience the fine points of research Experience the “messiness” of data From beginning to end
Formulation and Explanation Constant Reference
statweb.calpoly.edu/bchance/stat217/projects.html
APSA Conference, Sept 2010 118

Resources
www.causeweb.org
APSA Conference, Sept 2010 119
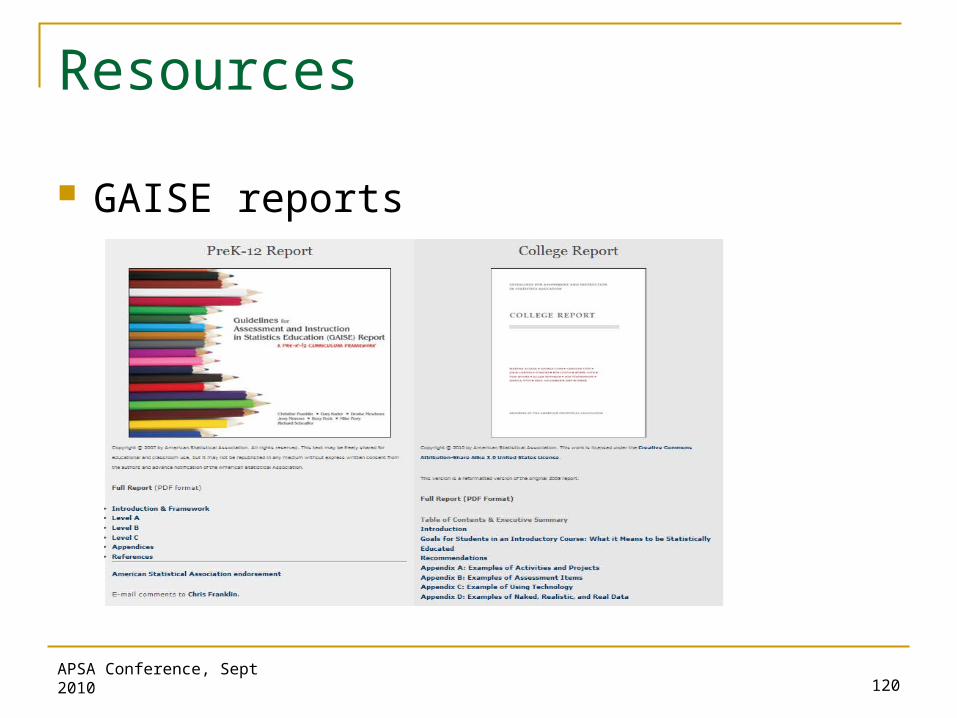
Resources
GAISE reports
APSA Conference, Sept 2010 120

Resources
TeachingWithData.org
APSA Conference, Sept 2010 121
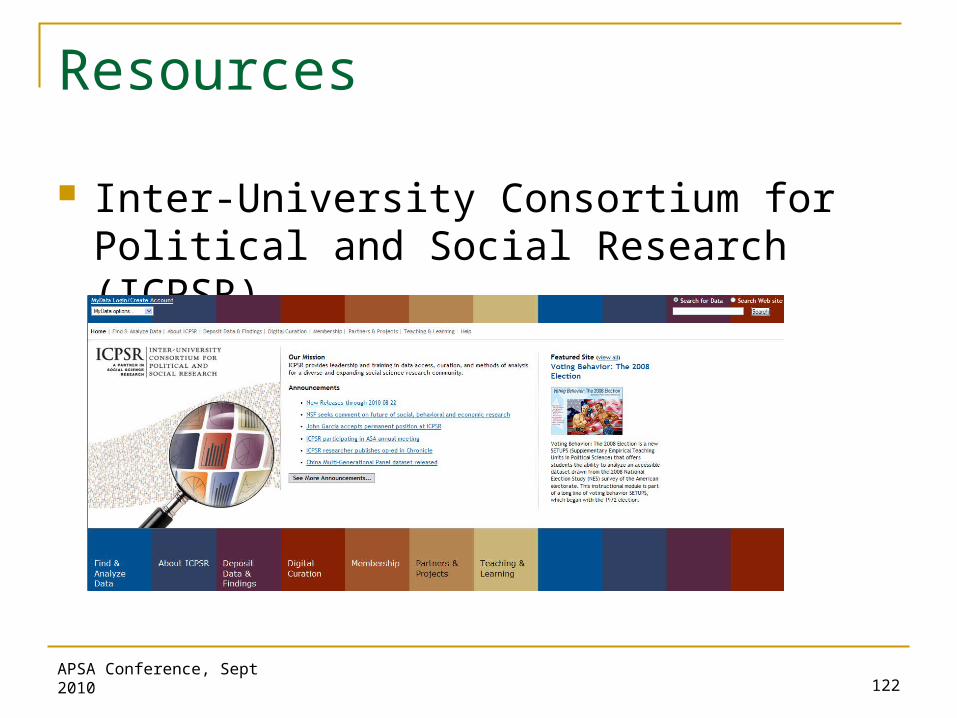
Resources
Inter-University Consortium for Political and Social Research (ICPSR)
APSA Conference, Sept 2010 122

Resources
www.rossmanchance.com/applets/ http://statweb.calpoly.edu/csi/
APSA Conference, Sept 2010 123

Resources
https://app.gen.umn.edu/artist/
APSA Conference, Sept 2010 124
Resources
http://lib.stat.cmu.edu/DASL/ www.amstat.org/publications/jse/ /jse_data_archive.html
APSA Conference, Sept 2010 125
Background Readings
Guidelines for teaching introductory statistics Reflections on what distinguishes statistical
content and statistical thinking Educational research findings and
suggestions related to teaching statistics Collections of resources and ideas for
teaching statistics Suggestions and resources for assessing
student learning in statisticsAPSA Conference, Sept 2010 126

Thanks very much!
Questions, comments?
[email protected] [email protected]
APSA Conference, Sept 2010 127

My Syllabus Briefly
W1: Collecting Data W2: Graphical/Numerical W3: Normal Project 1 W4: Exam 1 Project 2 W5: Probability W6: Sampling Distributions W7: Inference W8: Inference
APSA Conference, Sept 2010 128
My Syllabus Briefly
W9: Two Samples W10: Exam II Project 3 W11: Two variables W12: Inference for Regression W13: Two-way Tables Project 4 W14: ANOVA W15: Presentations
APSA Conference, Sept 2010 129

Non-simulation approach
Exact randomization distribution Hypergeometric distribution Fisher’s Exact Test p-value =
= .0127 0.30
0.25
0.20
0.15
0.10
0.05
0.00
X
Pro
bability
10
0.0127
3
Distribution PlotHypergeometric, N=30, M=13, n=15
15
30
2
17
13
13
3
17
12
13
4
17
11
13
5
17
10
13
APSA Conference, Sept 2010 130