Teaching R Business Statistics and Statistical...
24
Teaching R Business Statistics and Statistical Computing SLIDE 1 Teaching R
Transcript of Teaching R Business Statistics and Statistical...

Teaching RBusiness Statistics andStatistical Computing
SLIDE 1 Teaching R

WU Vienna - Involved Persons
Kurt Hornik
R Core Developer, ISI Highly Cited Researcher
Ronald Hochreiter
Business Informatics
Teaching: Statistics and Finance (Bachelor), Finance (Master)
Christoph Waldhauser
Political Science
Teaching: Statistics (Bachelor, Post Graduate (Social Science))
SLIDE 2 Teaching R
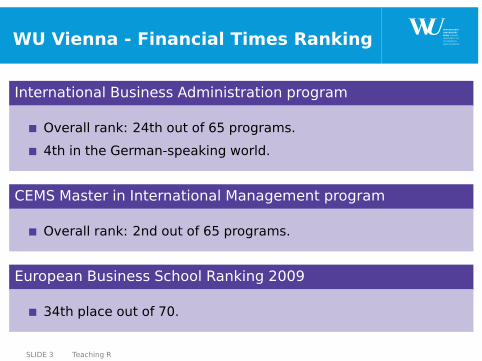
WU Vienna - Financial Times Ranking
International Business Administration program
Overall rank: 24th out of 65 programs.
4th in the German-speaking world.
CEMS Master in International Management program
Overall rank: 2nd out of 65 programs.
European Business School Ranking 2009
34th place out of 70.
SLIDE 3 Teaching R

WU Vienna
Students (Spring 2010)
Total students 26,065 (49% women).
International students 6,272 (24% of total).
Incoming exchange students: approx. 1000 per year.
Outgoing exchange students: approx. 900 per year.
Faculty and Staff (2009 in full-time equivalents)
Total faculty 620 (39% women).
Administrative staff 413 (70% women).
SLIDE 4 Teaching R

WU Vienna
Resources
Budget (2009) EUR 110 million, Premises 137,000 m2
Library stock 819,000 books
221 Partner universities, 10 International Summer Universities
130 Courses in English per semester
Certifications
PIM member since 1989
CEMS member since 1990
EQUIS 2007, renewed 2010
SLIDE 5 Teaching R

Business Statistics
Contents at WU (undergraduate level)
Descriptive Statistics
Hypothesis Testing (including Permutation Test)
Regression, ANOVA (uni- and multi-variate)
Model Selection
Time Series Analysis, Stochastic Processes
Problems
Only one lecture, 2 hours, just 4 ECTS points!
Prepare students for finance, economics, marketing, . . .
SLIDE 6 Teaching R

R Examination Package
A quick glance at the package
Package exams on CRAN (free, open-source).
Automatic exam generation.
Integrated facilities for correction.
Minimization of of time from design of exam to execution,correction, and publishing results.
Implementation at WU
Individual exams for each and every student.
Results are published online (web interface) within 4-24 hoursafter the exam.
SLIDE 7 Teaching R
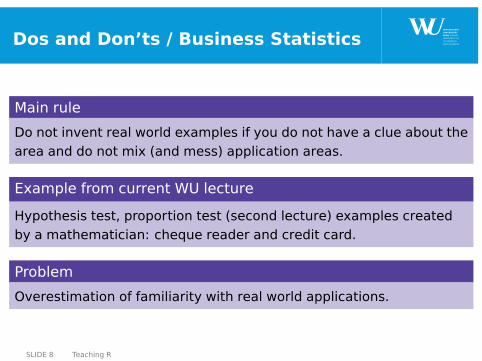
Dos and Don’ts / Business Statistics
Main rule
Do not invent real world examples if you do not have a clue about thearea and do not mix (and mess) application areas.
Example from current WU lecture
Hypothesis test, proportion test (second lecture) examples createdby a mathematician: cheque reader and credit card.
Problem
Overestimation of familiarity with real world applications.
SLIDE 8 Teaching R
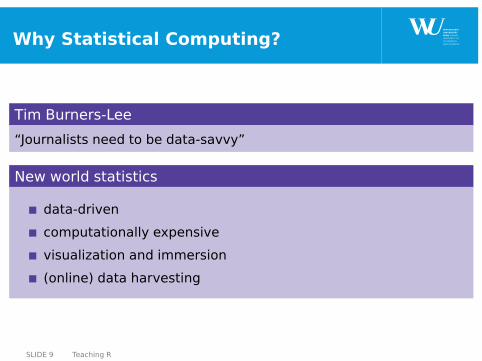
Why Statistical Computing?
Tim Burners-Lee
“Journalists need to be data-savvy”
New world statistics
data-driven
computationally expensive
visualization and immersion
(online) data harvesting
SLIDE 9 Teaching R

Why R?
Advantages of R
Free Software
State of the art
low cost
no license hassle
rather low level
very transparent
excellent community for support
SLIDE 10 Teaching R
General Considerations
Lasswell’s formula
Who teaches what in which channel to whom with what effect?
SLIDE 11 Teaching R
General Considerations
Lasswell’s formula
Who teaches what in which channel to whom with what effect?
SLIDE 11 Teaching R

General Considerations
Lasswell’s formula
Who teaches what in which channel to whom with what effect?
Who? Qualified faculty
Industry experience with R
Experience in teaching software
Qualification programmes
SLIDE 11 Teaching R
General Considerations
Lasswell’s formula
Who teaches what in which channel to whom with what effect?
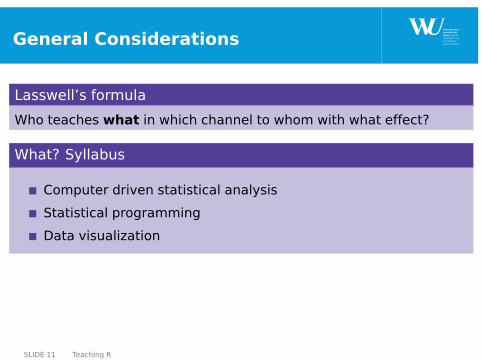
What? Syllabus
Computer driven statistical analysis
Statistical programming
Data visualization
SLIDE 11 Teaching R

General Considerations
Lasswell’s formula
Who teaches what in which channel to whom with what effect?
Which channel? Infrastructure
FLOSS comes at no cost
Hardware needs to be provided
Computer labs at WU available 24/7 to students
SLIDE 11 Teaching R
General Considerations
Lasswell’s formula
Who teaches what in which channel to whom with what effect?
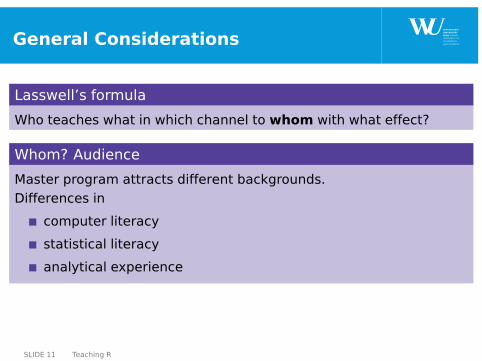
Whom? Audience
Master program attracts different backgrounds.Differences in
computer literacy
statistical literacy
analytical experience
SLIDE 11 Teaching R
General Considerations
Lasswell’s formula
Who teaches what in which channel to whom with what effect?
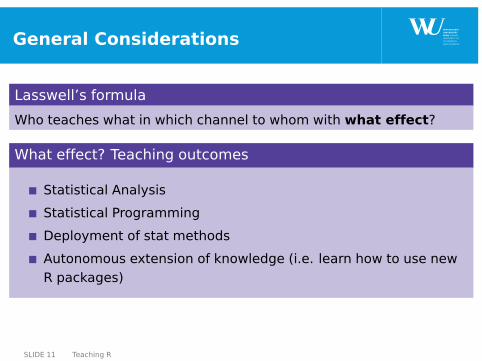
What effect? Teaching outcomes
Statistical Analysis
Statistical Programming
Deployment of stat methods
Autonomous extension of knowledge (i.e. learn how to use newR packages)
SLIDE 11 Teaching R

Smoothening Out Differences
Starting point
heterogenous group of students
On the way
online & self-study materials
small group tutorials
peer tutoring
End point
homogeneous performances of entire group
SLIDE 12 Teaching R

Smoothening Out Differences
Starting point
heterogenous group of students
On the way
online & self-study materials
small group tutorials
peer tutoring
End point
homogeneous performances of entire group
SLIDE 12 Teaching R
Smoothening Out Differences
Starting point
heterogenous group of students
On the way
online & self-study materials
small group tutorials
peer tutoring
End point
homogeneous performances of entire group
SLIDE 12 Teaching R

Partial Immersion
Learning statistics is like learning a language
Language learning
steep learning curve
mixes theory & application
exposure maximizes results
Statistics learning
mediated with GUIs
interactive usage of R
early start with R exposure
Solution: Partial immersion
is a technique in which students are early on and repeatedly exposedto a new language. Content is provided in both the old and the newlanguage.
SLIDE 13 Teaching R

Quality Control
Quality indicators
drop-out rate
PhD scholarships awarded
. . .
Student feedback
qualitative focus group discussions
quantitative survey
SLIDE 14 Teaching R