
Teachers’ Training, Class Size and Students’ Outcomes ... · 1 Teachers’ Training, Class Size...
40
1 Teachers’ Training, Class Size and Students’ Outcomes: Evidence from Third Grade Classes in France Pascal Bressoux*, Francis Kramarz** and Corinne Prost*** Preliminary February 2005 Abstract This paper studies the impact of different teacher and class characteristics on third graders’ outcomes. It uses a feature of the French system in which some novice teachers start their jobs before receiving any training. Three categories of teachers are included in the sample: experienced teachers, trained novice teachers and untrained novice teachers. We find that trained and untrained novice teachers are assigned to similar classes, whereas experienced teachers have better students located in better environments. Hence, in order to match similar students and classes, we focus on pupils with novice teachers and discard those with experienced teachers. In addition, we show that the same sample can be used to estimate the causal effect of class size on students’ outcomes. Our findings are: (1) the effect of teachers’ training is substantial in mathematics; in reading, the effect is significant only in classes with a low proportion of low-achieving students; (2) teachers’ education background has a significant impact since untrained teachers who majored in sciences at university compensate for their lack of training, they have the same effect as trained teachers; (3) the effect of class size is substantial and significant, class size affects similarly all students within a class, but the effect is larger in those classes with a high proportion of low-achieving students. * Université de Grenoble ** CREST, CEPR, IZA *** CREST, EHESS Paris-Jourdan, Cornell University
Transcript of Teachers’ Training, Class Size and Students’ Outcomes ... · 1 Teachers’ Training, Class Size...

1
Teachers’ Training, Class Size and Students’ Outcomes:
Evidence from Third Grade Classes in France
Pascal Bressoux*, Francis Kramarz** and Corinne Prost***
Preliminary
February 2005
Abstract
This paper studies the impact of different teacher and class characteristics on third
graders’ outcomes. It uses a feature of the French system in which some novice teachers
start their jobs before receiving any training. Three categories of teachers are included in
the sample: experienced teachers, trained novice teachers and untrained novice teachers.
We find that trained and untrained novice teachers are assigned to similar classes,
whereas experienced teachers have better students located in better environments. Hence,
in order to match similar students and classes, we focus on pupils with novice teachers
and discard those with experienced teachers. In addition, we show that the same sample
can be used to estimate the causal effect of class size on students’ outcomes. Our findings
are: (1) the effect of teachers’ training is substantial in mathematics; in reading, the effect
is significant only in classes with a low proportion of low-achieving students; (2)
teachers’ education background has a significant impact since untrained teachers who
majored in sciences at university compensate for their lack of training, they have the
same effect as trained teachers; (3) the effect of class size is substantial and significant,
class size affects similarly all students within a class, but the effect is larger in those
classes with a high proportion of low-achieving students.
* Université de Grenoble
** CREST, CEPR, IZA
*** CREST, EHESS Paris-Jourdan, Cornell University

2
Introduction
The literature on the effects of class size on student learning is huge. Yet there is no
consensus on the impact of class size and the debate is still impassioned. Some
economists, who do not believe much that smaller class size can improve students’
performance, or who find that it is a very costly policy, argue that other policies besides
class size reduction, such as improving teacher quality, are more important.
Understanding the relationship between teachers’ characteristics and students’
achievement is obviously of prime importance in the analysis of the education system.
Research on this topic has often focused on specific characteristics such as teachers’
diplomas, experience and salaries. Few studies have specified the impact of teacher in-
service training in developed countries. Angrist and Lavy (2001) present an evaluation of
the effect of in-service teacher training in Jerusalem schools. They find that the causal
effect of the program on pupils’ test scores is significantly positive. The cost-
effectiveness analysis suggests that teacher training may provide a less costly means of
improving pupil achievement scores than reducing class size or adding school hours.
In France, most studies on teachers have looked at teaching practices, and little empirical
work has examined the consequences of teachers’ training on students’ outcomes.
Bressoux (1996) partly fills this gap. In order to study the effect of teachers’ training and
experience on third-grade pupil achievement, he uses a specific survey on third grade
students and teachers in 1991, with a quasi-experimental design. This data source
includes three types of teachers: untrained novice teachers, trained novice teachers,
experienced teachers. Bressoux finds that training improves students’ scores in
mathematics. Experience seems also to have a positive impact on pupil achievement.
Importantly though, the experiment used in the above study is not randomized. The ideal
situation would involve the random assignment of pupils to the different types of
teachers. In fact, Bressoux (1996) shows that classes differ according to the status,
3
experienced, trained novice or untrained novice, of the teacher. Hence, in the absence of
random assignment, Bressoux estimates the impact of training using regressions
controlling for numerous variables. The estimated effect is the causal one if no
unobserved student or class characteristic is correlated with the teacher’s type and with
the student’s test scores. Otherwise, estimates are potentially biased.
This paper uses the same data, but relies on a methodology that takes care of the non-
randomized design. The idea comes from the specificity of experienced teachers. The fact
that the allocation of classes is not random is virtually only due to experienced teachers,
who can choose their schools, and who often choose advantaged zones. But, in principle
and in the data, trained and untrained novice teachers are assigned to almost similar
classes. So our paper uses the fact that, when excluding experienced teachers, we are
faced with a quasi-randomized design. We check the robustness of this feature using
different estimation methods, both conditional and unconditional on other observed
variables.
The data used here are very rich. The unit of observation is the student, a very important
element for this kind of analysis (see Summers and Wolfe, 1977). Multiple students’
characteristics are collected. Furthermore, all students within a third-grade class are
included in the sample. This gives us an opportunity to control for class effects. In
addition, teachers also provide a lot of information on their personal characteristics, their
teaching practices, as well as characteristics of their classes and their schools. Moreover,
students’ achievement is extremely precisely measured by detailed test scores at the
beginning and at the end of the year.
A first aim of this paper is to check that Bressoux’s findings on training – better trained
teachers induce higher students’ outcomes – are robust. To perform this task, we use
more recent statistical methods, controlling for the endogenous allocation of classes. The
estimation is made excluding experienced teachers, in order to estimate the causal effect
of training of novice teachers on pupils. Particular attention is given to heterogeneous
effects. A second goal is to see if some particular characteristics of the teachers, such as
4
their university background (which was not used in Bressoux (1996)), have any impact
on their students’ outcomes. This paper also examines other class characteristics, more
particularly class size. Indeed, when excluding experienced teachers, it appears that class
size is not correlated with pupils’ initial test scores. There is no sign of a relation between
class sizes and class mean initial achievement or class socio-economic background. Thus,
it seems that no selection bias in class size allocation is present when the sample is
restricted to novice teachers. Consequently, we use similar methods to assess the effect of
class size as were used to estimate the effect of training effect.
The findings on the training effect are very close to those found by Bressoux (1996): the
training of novice teachers promotes students’ learning in mathematics. The method
allows also the estimation of heterogeneous effects. We find that in reading, the training
effect is significant only in classes with a low proportion of low-achieving students.
We also find that teachers’ education background has a significant impact since untrained
teachers who majored in sciences at university have the same effect as trained teachers. It
seems that their past studies help them to compensate for the lack of training.
The estimated impact of class size implies that reducing class size has a positive and
substantial effect on third-graders. These results are close to the findings of Piketty
(2004) on the effect of the size of French second-grade classes. Yet, in our paper, the
effect appears to be similar for students within the classes. However, it is much larger in
classes with a high proportion of initially low-achieving pupils.
The paper is organized as follows. Following a description of the data in Section I,
Section II describes the statistical model and the empirical tests. Section III reports the
main estimation results and Section IV concludes.
5
I. Data and descriptive statistics
The data come from a survey conducted by the French Ministry of Education. They cover
a sample of classes of third-graders (8 years old) and their teachers. The quasi-
experimental design is due to a feature of the system of teachers’ training in France. This
characteristic implies that some novice teachers start their job before any training.
In France, except for a subset of private schools, teachers are civil-servants recruited and
paid by the State. After having passed a competitive examination, primary school
teachers are trained in specific schools. At the beginning of the 1990’s, these schools
were called ‘écoles normales’. France was, and still is, geographically divided into
administrative ‘départements’ and there was an ‘école normale’ in each ‘département’.1
Novice teachers are recruited among students who have passed a competitive
examination for entering an ‘école normale’. The number of slots is limited and
determined each year at the central level, using forecasts for teachers’ positions. All
applicants are ranked according to their grades in this examination. The students ranked
first enter the ‘école normale’ and are trained during two years. Students who are ranked
just after the last admitted candidate on this primary list are assigned and ranked within a
waiting list. In September, students who have finished their training at the ‘école
normale’ are assigned to classes not chosen by experienced teachers. But, most often,
many job slots remain vacant, because of a greater number of pupils or a greater number
of absent teachers than expected two years before. Thus, in October, some students in the
waiting list are assigned to these vacant slots. Hence, these persons have to teach a class
for an entire school year without receiving any training. They enter the ‘école normale’
the year after.
The survey was conducted in the school year 1991-1992. The sample included explicitly
three categories of teachers: untrained novice teachers, trained novice teachers and
1 The training schools are now called university teacher training institutes ‘Instituts Universitaires de Formation des Maitres (IUFM)’ and belong to a region (a region includes several departments).

6
experienced teachers. The sample covered third-grade students and their teachers in 12
‘départements’. The teachers were teaching in third grade classes or in multi-grade
classes including third graders. In the 12 ‘départements’ selected, all novice teachers
were surveyed while experienced teachers were chosen randomly. Finally, the survey
covered 3,842 students and 198 teachers. The numbers of teachers within each category
were not perfectly balanced: there were 96 experienced teachers, 66 trained novice
teachers and 36 untrained novice teachers (see table 1).2
The information about the students is comprehensive: parents’ occupations, sex, month of
birth, nationality (French or not), number of years spent in a pre-elementary school,
repeated classes (see the statistics in table 2). In addition, two sets of scores are available
in the data. In France, there is national testing of all pupils just at the beginning of the
third grade, both in reading and mathematics. The reading tests comprise grammar,
vocabulary, spelling and reading comprehension per se. The mathematics tests comprise
arithmetic, geometry and problem-solving. For this specific survey, covered pupils have
also been tested at the end of the school year in both subjects, using a design similar to
that prevailing in the entry tests. For each of the two subjects, initial and final scores are
standardized (mean=100, standard error=15).
In addition, teachers had to answer a questionnaire on their personal characteristics, on
their teaching practices and on the characteristics of their classes and their schools. The
main variables used in the following are the field of specialization of the teacher during
his/her studies at the university (sciences, unknown, other), the class size, the fact that the
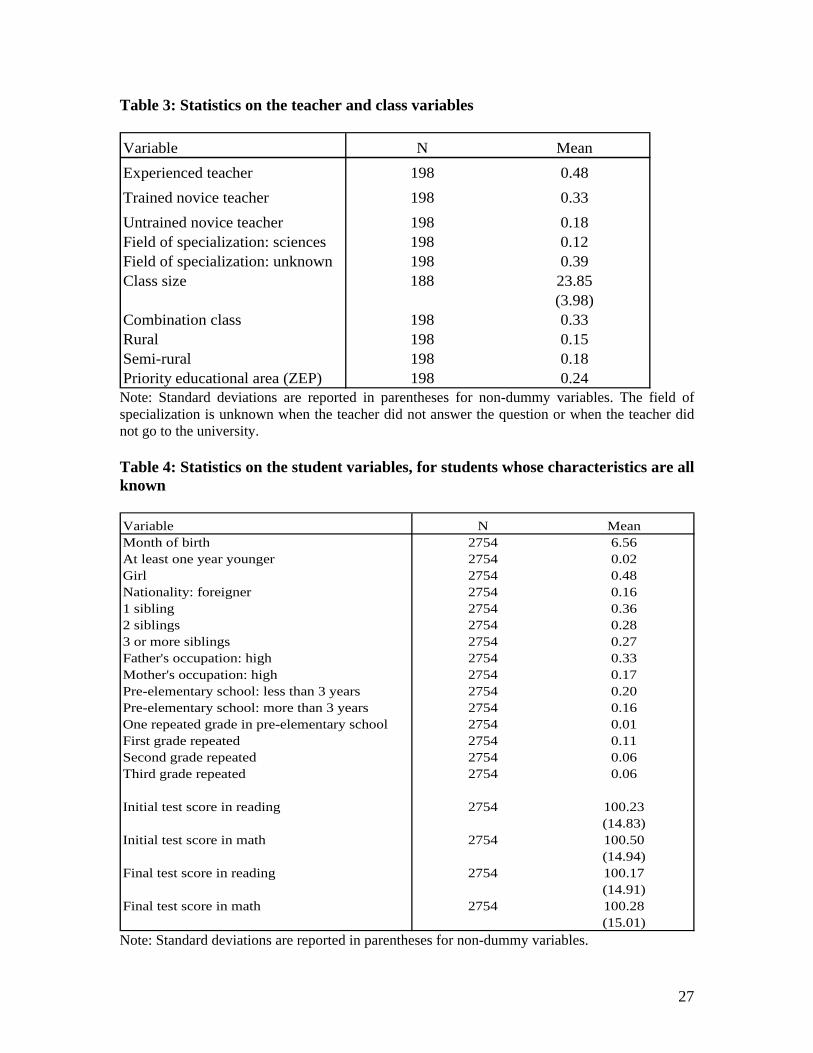
class is or not a combination class mixing students across grades, the category of the area
of the school (rural, semi-rural, urban), and the priority status (see the statistics in table
3). The mean of the class sizes is 23.8 students per class, with a standard deviation of 4.0.
By comparison with data on all elementary schools, Piketty (2004) finds that the average
class size in the primary schools (first grade to fifth grade) is close to 23.3 in the school
year 1991-1992.
2 These statistics are slightly different from the ones in Bressoux (1996) because the matching of student data and teacher data has been made a bit differently.

7
Unfortunately, the scores are not available for all the students. This attrition comes from
two reasons. First, some students were not in class when the tests were conducted.
Second, for some classes, all the scores are missing. The scores of reading tests are not
known for 808 students, including 9 entire classes, and the scores of math tests are not
known for 615 students, including 4 entire classes. The class size also is not known for all
classes: for 10 classes, the class size is unknown and can not be approximated by the
number of students of the sample, because these classes mix students of different grades.
Nevertheless, this attrition should not induce any bias: tables 4 and 5, compared to tables
2 and 3, show that the characteristics of the students whose scores and class size are
known do not significantly differ from those of all the students. It seems that the absence
of information on the scores or the class sizes have random origins.
The data do not come from an experimental design. In fact, the assignment of the
different types of teachers to the classes is not randomized. Indeed, the system of job
assignment depends on the teachers’ choices. When the choices of different teachers are
the same, the final assignments depend on the years of experience and on a mark given
by the administration, this mark being well correlated with the years of teaching
experience. Hence, as they accumulate experience, teachers are able to choose the
schools they want, and mostly go from disadvantaged schools to advantaged ones. On the
contrary, novice teachers go to schools that have not been chosen by experienced
teachers, or where there are free job slots because some experienced teachers retired or
are absent for the year.
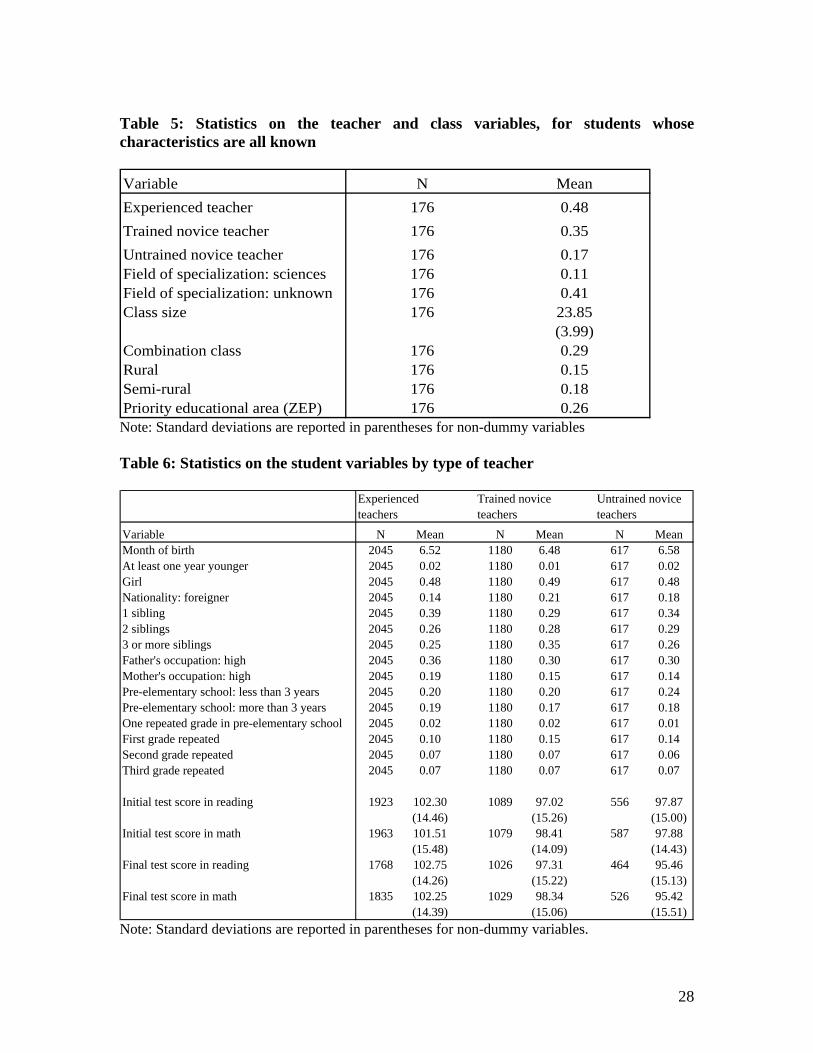
The data show that the aggregate characteristics of pupils vary with teachers’ types (see
tables 6 and 7). Indeed, experienced teachers have on average better classes. In these
classes, compared to those with novice teachers, initial scores are higher, the share of
non-French pupils is lower, children have fewer siblings, fathers and mothers have more
often a high occupation and students less often repeated the first grade. In addition, the

8
class sizes are on average larger, and the schools are less often in a priority educational
area.
The classes with trained novice teachers and those with untrained novice teachers are
more alike. Nevertheless, the trained novice teachers are more often in urban areas and in
priority zones than the untrained novice teachers.
There is a potential source of bias due to the fact that the trained novice teachers may
have had better rankings at the entrance examination at the ‘école normale’ than the
untrained novice teachers. If the examination measures the initial teaching abilities (a fact
that should be proved), this bias could imply that the trained novice teachers are better
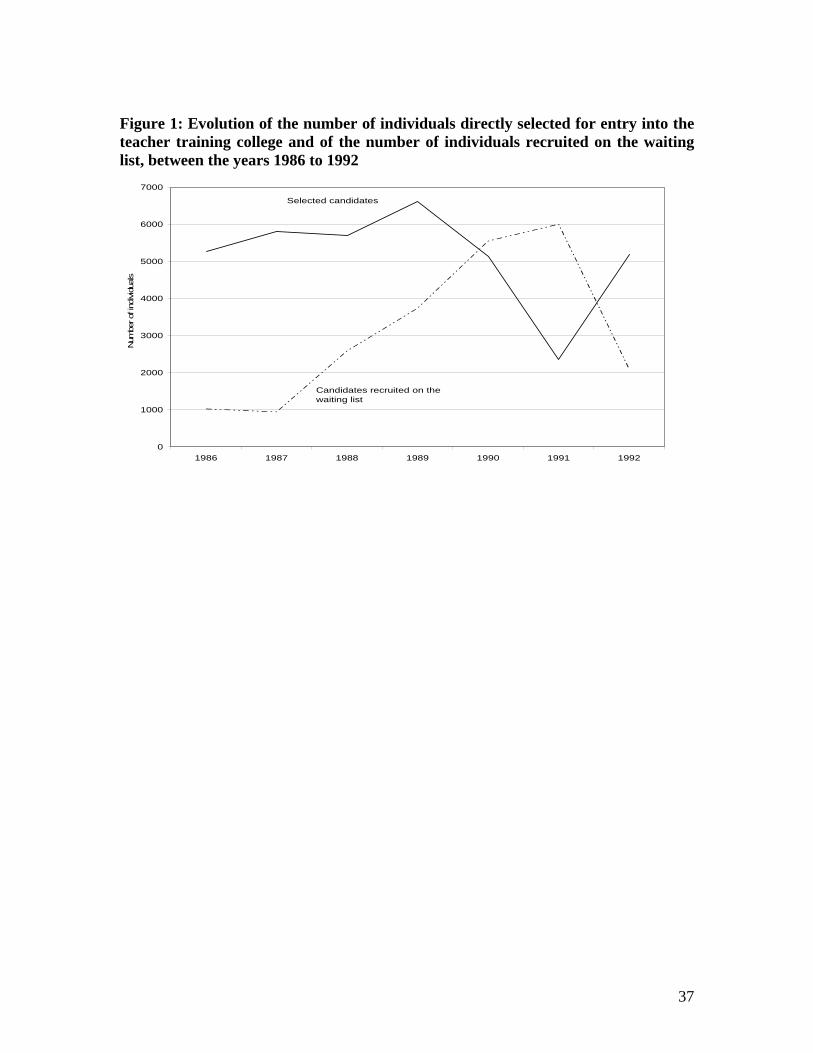
able to teach than the untrained novice teachers. Fortunately (for us), the survey has been
conducted during the school year 1991-1992, which is an atypical year, as can be seen in
figure 1. Indeed, in 1991, the number of students selected for entry into the teacher
training centers was very small. So the surveyed untrained novice teachers, who had
taken the entrance examination in 1991, had very good rankings and would have been
selected for entry had they competed for the examination during another year, and
especially during the year 1989, when the surveyed trained novice teachers had passed
their entrance examination. So the selection bias is likely to be weak.
II. Statistical method
The non-randomized assignment of the three types of teachers can also be observed
through a regression of initial test scores on student and teacher characteristics. If the
coefficients of the dummy variables for the types of the teacher are significant, it means
that the assignment is non-randomized since the students have not been exposed to these
teachers’ teaching yet.
The regression is estimated on all the students. It includes random class effects, in order
to take account of the correlation between students within classes. Indeed, class variables

9
may be not sufficient to control for these correlations. So, it is important to incorporate
class effects: without them, the standard deviations could be underestimated. It would be
the case with OLS estimation (see Moulton (1986)). However, Moulton stresses the
problem of the precision of coefficient estimates, but he also shows that the coefficients
may be different when the estimation incorporates random class effects without imposing
the absence of correlation between these effects and the other covariates. Indeed, this
kind of estimation results in substantial gain in efficiency. Throughout this paper, class
effects are estimated through mixed models (see Robinson (1991)). These models allow a
general specification of class effects, fixed effects being only a specific case of this
specification. Identification of class effects uses more information than for “classic” fixed
effects: it uses the variance of the class effects instead of only the mean, thanks to a more
general prior distribution (see appendix A).
The results of the regression of initial test scores on teacher type are detailed in table 8
(without any other covariates) and table 9 (including student and class characteristics).
They confirm that experienced teachers teach in better classes. Table 8 reports that the
correlation between student initial scores and the dummy variable for the teacher
experience is significant, in reading and in mathematics as well. These two correlations
remain significant, even when controlling for student characteristics. On the contrary, it
seems that classes with untrained novice teachers and classes with trained novice teachers
are not different in terms of initial achievement, since the correlations between initial
scores and the dummy of the teacher training are not significant, with or without other
controls. Thus it seems that there is no selection of trained teachers, so that the classes of
such teachers appear similar to those of untrained teachers according to pupils’ initial
achievement.
This idea is checked with the same regression of initial scores, but with the sub-sample of
the pupils having novice teachers. The results are given in table 10 (without any other
control) and in table 11 (including student and class characteristics). The coefficient of
the training dummy is never significant.
10
Bressoux (1996) assumes that the selection bias of experienced teachers can be controlled
with the observed variables, including initial test scores. The causal interpretation of the
coefficients related to the type of teacher relies on the assumption that no selection bias
comes from unobserved variables.
This paper takes care of the non-randomized design in order to assess the robustness of
the teachers’ training effect found in Bressoux (1996). The idea is that trained and
untrained novice teachers are randomly assigned to classes, at least according to our
observed variables. Hence we have chosen to estimate the training effect on the sub-
sample of novice teachers. In the spirit of matching classes to classes, either taught by
trained or untrained novice teachers, we focus on pupils with novice teachers and discard
those with experienced teachers. It means that we manage to have a sample of similar
students, some have trained novice teachers and constitute the treatment group, and some
have untrained novice teachers and constitute the control group. Thus we can expect that
no bias perturbs the coefficients in the estimation and that the coefficient of the treatment
estimates the causal effect. The idea is close to the one in Angrist and Lavy (2001). In
this paper, they observe that the pupils have initially lower score in the treatment group
than in the control group. As they would like pupils in the control group to be comparable
to pupils in the treatment group, they match individual pupils on the basis of their initial
test scores, by dividing test scores into quartiles and comparing treatment and control
scores in each quartile. Here, we restrict the sample in order to have similar pupils in the
treatment and control group. But, on the contrary to Angrist and Lavy, we keep a
regression strategy, in order to control for the other covariates, and more specifically to
control for class effects. We will see that these controls are important.
Thus, we will be able to estimate the effect of training on achievement using this specific
sample. Nevertheless, we will have to keep in mind this restriction while interpreting the
results: what we estimate is the effect of a trained novice teacher on pupils’ achievement,
compared to the effect of an untrained novice teacher, and not compared to all other kinds
of teachers.
11
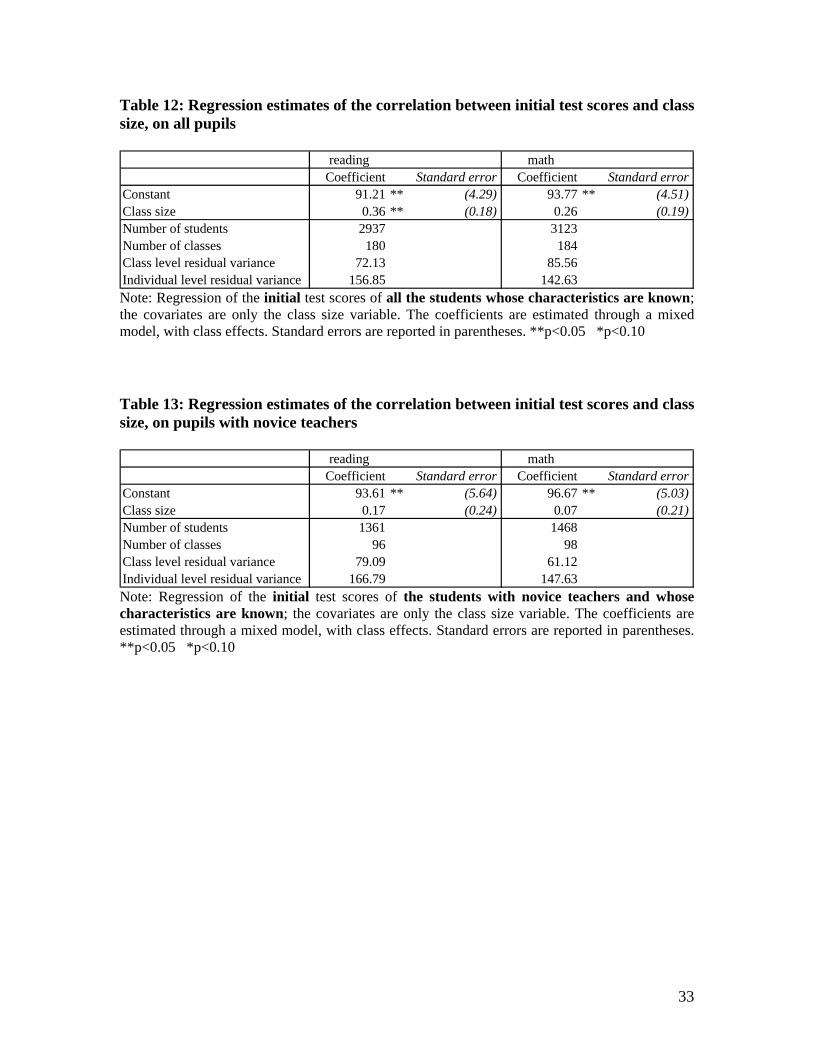
In the meantime, we will keep this strategy to estimate the class size effect. Indeed, table
12 reports that the correlation between initial scores in reading and class size is positive
and significant when all pupils are included in the regression. When adding other
covariates (in table 9), this correlation remains significant and positive, even if it is less
significant. On the contrary, tables 11 and 13 report that even without any other control,
class size is no more correlated with initial scores when the sample is reduced to the
students with novice teachers.
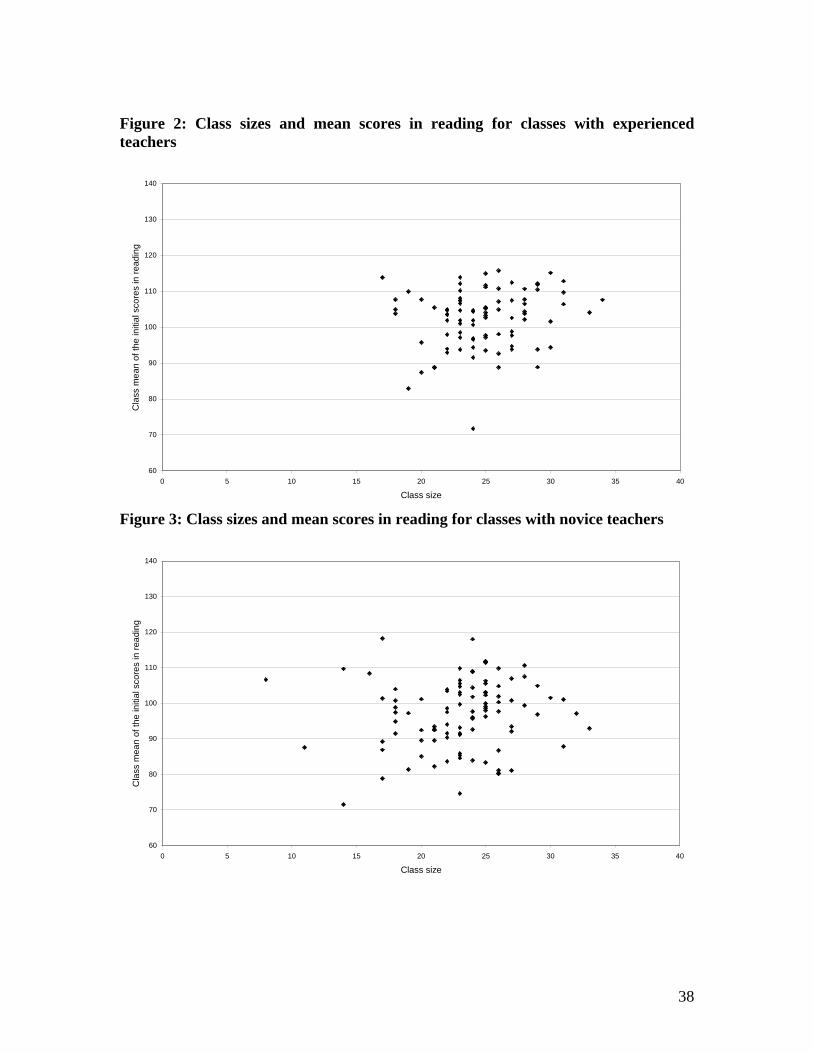
Figures 2 and 3 present these results. These figures show the link between class sizes and
class means of initial test scores in reading. The classes with experienced teachers are
presented in figure 2 while figure 3 presents the classes with novice teachers. It is clear
that all experience teachers teach high achieving classes whereas the scores of the classes
with novice teachers are much more dispersed. Also, experienced teachers more often
have larger classes. At last, the positive correlation between class size and scores can be
seen in figure 2 with experienced teachers, even if it is not obvious, and it appears in
figure 3 that there is no more correlation for the classes with novice teachers.
The idea that class size can be positively correlated with the student achievement is well
known: the education system is often organized in order to support less advantaged pupils
by gathering them in small classes whereas more advantaged students are assigned to
larger classes. Hence the differences in class sizes are often in relation to students’
socioeconomic background and scores. The selection bias in the relationship between test
scores and class size can be generated within schools as well as between schools. This
selection bias is one reason why causal effects of class size can be difficult to measure.
There are several reasons explaining why, in France, the selection could be weak for third
grade classes. First, the system of attribution of teachers is centralized, and is not
supposed to make any difference between schools in terms of resources. The only official
exception is the policy of priority area zones (ZEP, ‘zones d’éducation prioritaires’). The
ZEP policy is a program implemented in 1982, which gives more resources to
disadvantaged schools (for a description and an assessment of this program on sixth and

12
seventh graders, see Benabou, Kramarz, Prost (2003)). According to our data, the classes
in the ZEP have on average 23.2 students per class, whereas the mean class size in the
non priority zones is 24.13.
The other case where it is known that some schools have smaller classes than the other
schools is the one of rural schools: because of small enrollments, these schools have often
small classes, even if they often organize combination classes by mixing students of
different grades in a class. Yet the conclusion in terms of selection is not clear since, as
we will comment on this later, pupils in rural schools have better achievement at the
beginning of the third grade (but improve less during the year).
Nevertheless, there may be selection within schools. This selection is possible in large
schools, when there are several third grade classes. Yet we will see that when the
enrollment exceeds 30 students, it does not always entail a new third grade class, but
sometimes some third graders are assigned to a class with students of other grades. To
facilitate this assignment, the school may choose good pupils to go to this combination
class, so that students who stay in the larger class are not necessarily the better ones.
The organization of a selection needs large schools. Since experienced teachers are much
more often in urban areas, where schools are bigger, this may explain why the selection
on initial scores can be observed for classes with experienced teachers and not for novice
teachers. On the contrary, it seems that pupils with novice teachers are not assigned to
classes with different sizes according to their abilities.
Finally, we will estimate the class effect on the sample excluding experienced teachers.
As the correlation between class size and observed initial scores is significant on the
whole sample, we suspect that there may also be a selection on unobserved variables,
which could disturb the estimation of the causal effect of class size. On the contrary, the
3 The priority zones are more often in urban areas, where classes are larger than in rural areas. So the effective reduction in class size in ZEP schools could be larger than the one given by the raw difference of the two means. A regression of the class size on the dummy variable for ZEP schools, controlling for the rural areas and the combination classes, give a class size smaller of 1.5 students in priority zones.

13
correlation between class size and initial scores is not significant with the sub-sample of
pupils with novice teachers. Hence we assume that the “traditional” bias selection is
expurgated. Finally, to check the robustness of our findings, we will also estimate the
class size effect on all the students, using instrumental variables.
III. Results
A. Global effects
The results of the estimation of the effects of teacher and class characteristics on pupil
achievement are detailed in table 14. It is a regression of final scores on initial scores and
student, teacher and class characteristics. The estimation includes class effects and is
estimated on the sub-sample of students with novice teachers.
The data include a lot of information about the teachers and their teaching practices. They
include in particular the diploma, the subject studied at university, the number of hours
per week used for teaching reading or mathematics, the number of hours asked for
homework per week, the practice of organizing the class in groups, and how these groups
are chosen.
All these variables have been tested in the regression of final test scores on initial scores,
student and class characteristics. When the variables on the number of hours per week
used for teaching reading or mathematics, the number of hours asked for homework per
week, the practice of organizing the class in groups, and how these groups are chosen are
added, the coefficients on these variables are not significant. The small number of classes
in the sample may prevent from identifying these effects that may be non linear.
Therefore, these variables are not included in the final estimation.
The only teacher characteristic that is used is the subject studied at university. More
precisely, dummy variables are included for teachers having majored in sciences at
14
university (12% of novice teachers) and for teachers having majored in a discipline not
reported in the survey (roughly 14% of novice teachers). The reference group therefore
comprises those teachers who majored in humanities (often French or another language,
sociology, psychology, history). Novice teachers are all endowed with similar diplomas
since it is compulsory to have a diploma equivalent to two years university to enter an
‘école normale’. This was not the case in the past, and among experienced teachers, only
a few went to university.
The regressions of final test scores include class characteristics. Some class
characteristics can be calculated using the means of individual characteristics. We built
class variables such as the share in the class of students with advantaged parents as
measured by occupations, the share of girls, the share of non-French students and the
share of students who repeated at least one grade. These variables are calculated for each
student, excluding his/her own characteristics in the calculation of the means. None of
these variables give significant coefficients. They are not included in the regressions
presented in this paper. This confirms the difficulty in estimating peer effects without a
clean experimental design.
On the contrary, means and standard deviations of initial test scores per class have
significant correlations with final scores. For the regression of final scores in reading, the
included variables are the class means and standard deviation of initial scores in reading.
Likewise, the means and standard deviation included in the regression of scores in
mathematics are calculated on initial scores in mathematics. These means are also
calculated for each student, excluding his/her own characteristics. Table 14 reports the
effects of class characteristics on final test scores, and coefficients of means and standard
deviations of initial test scores have negative impacts on pupil improvement, meaning
that students have better results in a homogenous class and when the average
achievement is not too high.
The estimated impact of training is not significant on reading achievement but it is
significant and large on mathematics achievement: students gain more than 3 points on

15
their final scores when their teacher has been trained. This effect is substantial; it is one
fifth of the standard deviation of the final scores. These results are close to the findings in
Bressoux (1996).4 They are also close to the raw differences of the means: as can be seen
in table 6, students with untrained novice teachers have similar initial scores than students
with trained novice teachers; yet, they improve much less during the year. The raw
differences-in-differences estimator gives an effect of 2.7 in reading, and 2.4 in
mathematics. Incorporating student and class characteristics show that the effect is larger
in mathematics, since it is close to 3.4. On the contrary, the effect is much weaker in
reading, since it is close to 1.3 and is not significant. The estimation of the regression
without class effects would have drawn to a significant effect equal to 2.6. Hence
incorporating random class effects shows that the coefficient is weaker and non
significant.
The teachers’ educational background has also a substantial impact. The finding is that
teachers who majored in sciences improve their pupils’ mathematics achievements more
than other teachers do. These teachers are either trained or untrained. The effect is not
significantly different for these two kinds of teachers, and not significantly different from
the training effect. Hence, even though the training effect is substantial in mathematics
achievements, teachers who have not been trained, but who have studied mathematics or
sciences when they were at university, compensate for this lack of training. Nevertheless,
the sample is small and this result is weak.
The teachers whose fields of specialization are unknown seem to improve their students’
achievements, the effect being very significant in reading and slightly less significant in
mathematics. This group of teachers comprises some individuals who did not report this
information, potentially because of multiple fields of specialization, as well as some
teachers who did not go to university. Indeed, very few people were entitled to take the
examination for entering an ‘école normale’ without having studied at university; this
was particularly the case of mothers of three or more children.
4 In Bressoux (1996), the effect of teacher training is estimated at 0.72, non significant, on reading scores, and 3.37, significant, on mathematics scores.
16
Nevertheless, it is worth noting that the repartition of teacher among classes according to
their field of specialization is not random. The correlations between initial test scores and
teacher dummy variables for fields of specialization are significant for the initial
mathematic achievement (table 11). Hence, even if the regression of final score control
for initial scores, estimates may be affected by selection bias since these teachers appear
to be assigned to better classes.
Class size has also a significant impact on students’ outcomes. The impact is quite similar
in reading and in mathematics. For test scores in reading, the estimated effect is -0.33
while it is evaluated at -0.36 for mathematics achievement. This impact is substantial:
reducing the class size by 10 students increases the final test scores of 3 to 4 percentage
points. This is nearly the same impact as the one obtained for teachers’ training.
This impact seems to be robust to the problem of combination classes. Indeed, the
regression is estimated with a sample including multiple-grade classes. In the case of a
combination class, the class size is then the size of the entire class, and not the number of
third-graders. Yet the dummy for multiple-grade classes is not significant5. Likewise,
results are similar when excluding these combination classes.
The coefficients of the other class characteristics are also of interest. Students in rural
schools increase their achievements much less than the other students. However, as can
be seen in table 11, their initial scores are higher. These results are consistent with
Brizard (1995) and Thaurel-Richard (1995): pupils in rural schools have better scores at
the beginning of their third-grade, but then they tend to improve less.
Students in ZEP schools improve less during the year than other students do.
Nevertheless, they have lower scores even at the beginning of the school year. So it is
difficult to conclude that it is a causal effect.
5 This result is consistent with Oeuvrard (1995).
17
B. Heterogeneous effects
We then estimate heterogeneous training and class size effects. To estimate the effects on
heterogeneous students, the methodology chosen is to split training and class size
variables into different kinds of students, in the same regression. Indeed, it is important to
keep controlling for class effects. The results appear different when students are divided
in sub-groups according to their initial achievements, and the estimations are made
separately on each sub-group. This methodology allows us to estimate the effect on some
kinds of students within the classes. In addition, we estimate the effects on heterogeneous
classes. Thus we will be able to interpret more precisely some results on heterogeneous
effects. Indeed, some papers find that the class size effect is larger for low achieving
students. We will see that this can be explain by the fact that these low achieving students
are more often in disadvantaged classes; but class size affects similarly all students within
a class.
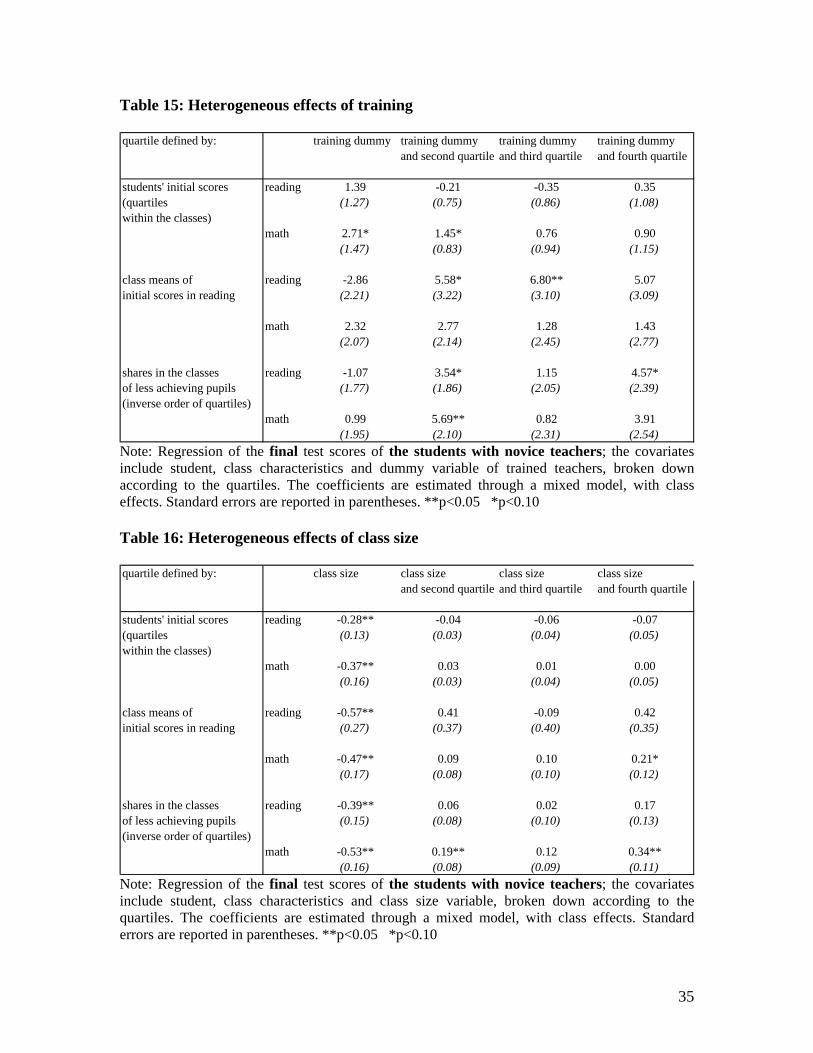
Tables 15 and 16 present the results for the regression of final test scores including
heterogeneous effects. These effects are measured by breaking down the dummy variable
for trained teachers or the class size variable according to the quartiles.
To estimate the heterogeneous effects on pupils, the quartiles are defined by students’
initial scores and are measured within the classes. No significant training effects appear
for scores in reading. For scores in mathematics, the training effect is maximum for the
students of the second quartile: it is close to 4.2 points. For the other students, the effect
is equal to 2.7, it may be larger for the more achieving students, but the difference is not
significant.
No heterogeneity of the class size effect appears, for scores in reading and for scores in
mathematics. So it seems that within the classes, class size affect similarly all students.
18
The two other ways of defining the quartiles have been chosen to identify different kinds
of classes. The first quartiles are the one estimated on the class means of initial scores in
reading. The second quartiles are calculated on the share in the classes of less achieving
pupils, these less achieving pupils being identified by the first quartile of students
according to their initial score in French.
The decomposition reveals significant effects of training on scores in reading for some
kinds of classes. These classes are those whose score means are the highest or whose
share of less achieving students is the lowest. More precisely, the effect of training is not
significant for the less advantaged classes, but it is often significant for the other classes.
So the training seems to help teachers to be better able to teach reading, except when they
face a class where the mean achievement is low.
For the pupils’ achievement in mathematics, the results are less clear. It seems that the
results are close to the ones in reading, when we consider the quartiles defined by the
share in the classes of less achieving pupils. Once again, the training is no help for less
advantaged classes. The training effect is very substantial and significant for the second
quartile and is substantial, but not significant, for the fourth quartile.
On the contrary, the class size effect appears much more substantial for less advantaged
classes and decreases when the “quality” of the class increases. Indeed, all the
coefficients for the class size are strongly negative, between 0.4 and 0.6, but the
coefficients for the second, third and fourth quartiles are positive, meaning that the effect
is much more substantial for the first quartile. Yet these positive coefficients are not all
significant. The clearer results are for the scores in mathematics, with the quartiles
defined by the share of less achieving pupils. We can see that for the first quartile, the
coefficient is equal to -0.5, it is between -0.3 and -0.4 for the second and third quartile,
and it is equal to -0.2 for the fourth quartile.
This heterogeneity is confirmed by table 17, which reports the results of the estimation of
class size effect for all schools and for ZEP schools alone, estimated in the same

19
regression. The coefficients are significant only for ZEP schools and are very substantial:
-0.6 in reading and -1.1 in mathematics. This finding confirms recent results obtained by
Piketty (2004) who also finds substantial impacts of class size in ZEP school, albeit
marginally significant because of the small number of students in ZEP schools in his
sample.
These results show that the students in ZEP schools and in disadvantaged classes in
general are more sensitive to class size as a group than the other groups of students. It
may come from problems of behavior in class, the probability of a troublemaker among
students of a class being larger in these schools.
Some papers find heterogeneous effects of the class size among students: in general, the
results are that less achieving pupils are more affected by the class size. As less achieving
pupils are often in less achieving classes, these results are in fact heterogeneous effects
among classes, and not among heterogeneous effects on students within the classes.
C. Instrumental variables for the class size effect
The effect of third-grade class size, as estimated in this paper, stands between -0.3 and -
0.4 percentage point of final test scores. Piketty (2004), on second-grade class size, finds
an impact of -0.4 to -0.5 percentage point. He applies a methodology developed in
Angrist and Lavy (1999). His method is based on the following specificity of French
class openings: when second-grade enrollment goes beyond 30, another class is opened in
most cases. Hence, the two new classes have an average size of 15 pupils. Piketty uses
this discontinuity as an instrumental variable. He finds that a reduction in class size
would induce a significant and substantial increase in mathematics and reading scores,
and that the effect is larger for low achieving students.
20
In our data, we find similar specificities as those observed by Piketty (2004) (see figure
4).6 There are often two classes when the number of third-graders in the school is greater
than 30. Yet there are some classes gathering 34 pupils. And the link between class size
and enrollment is complicated by the existence of combination classes. When the
enrollment goes just beyond 30 students, the schools do not open another third-grade
class, but instead, assign some third-graders to classes with students of other grades.
When we exclude combination classes, there is less diversity in class sizes. Figure 5
shows the link between the enrollment of third graders and the class sizes. Yet when there
are two classes, these classes have often different sizes; it could then be a source of bias if
the sizes are determined according to the socio-economic background or the achievement
of the students.
To check the robustness of our class size effects estimated on the novice teachers, we use
instrumental variables on the whole sample. The instrument is based upon the enrollment
of third-graders in the school when we exclude combination classes. In order to work
with all classes, the instrument is also based upon the numbers of third-graders and
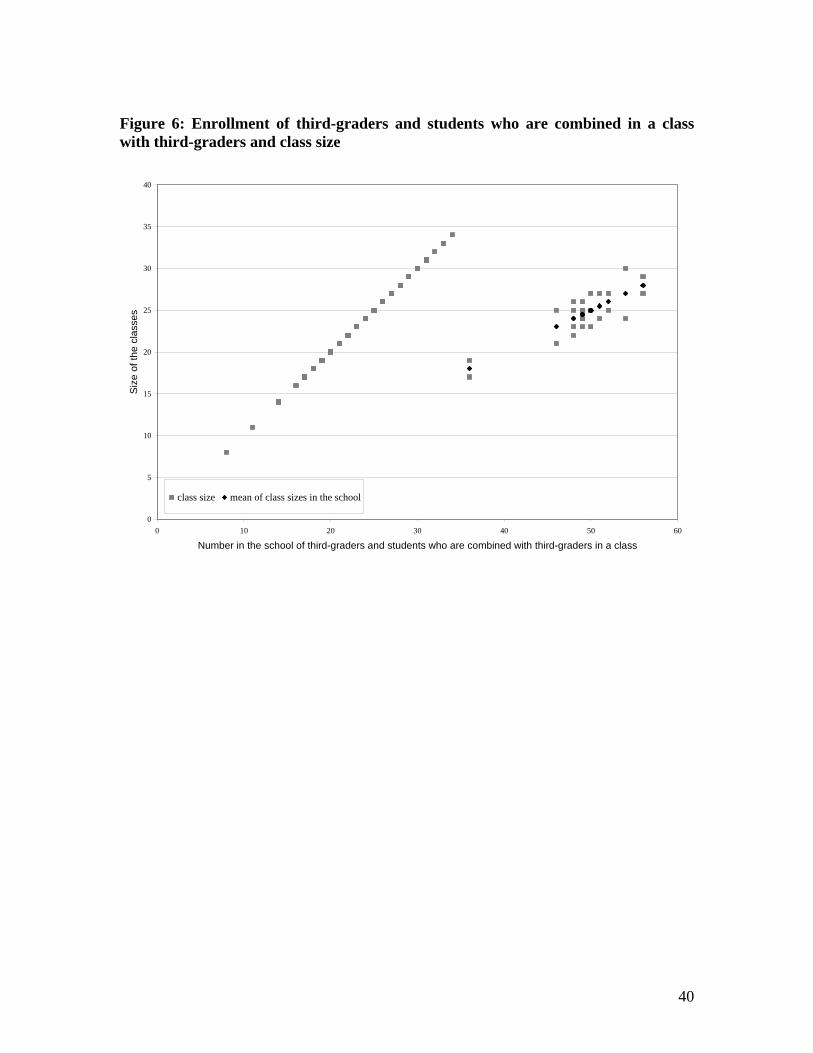
students who are in a class with third-graders (see figure 6). In all cases, the instrumental
variable is the mean of the class sizes in the school: the sizes of the third-grade classes in
the first case and those of all classes with third-graders in the second case. This
instrument takes care of the selection bias which exists when schools organize classes so
that small classes gather low achieving students and high achieving students are assigned
to larger classes.
As can be seen on figures 5 and 6, the instrumental variable is very close to the actual
class size. Indeed, in our data, we identify few schools with more than one third-grade
class. And when there are two classes, the sizes of these two classes are not very
different. Hence the findings are easy to foresee: the results estimated with the
instrumental variable are very close to the OLS results.
6 On the contrary to Piketty (2004), Figure 4 shows all classes, including combination classes. In addition, the classes are third-grade classes and not second-grade classes. At last, our data are less reliable than those used by Piketty because we do not always observe all third-grade classes in schools.
21
The idea in Angrist and Lavy (1999) is to use the discontinuity of the class size resulting
from the creation of several classes when the enrollment goes beyond some level,
assuming that this discontinuity is exogenous. One way of using this discontinuity is to
estimate the class effect only when the enrollment is close to the “breaking point”. We
use this method by estimating our instrumented regression for school where the
enrollment is close to 34 students, the “breaking point” according to our data. We have
chosen to restrict the sample to enrollments between 29 and 40 or between 24 and 45.
The coefficients are then much more substantial, even if they are not always significant
(see table 18).
All these results confirm the size of the effect: class size effect is between -0.3 and -0.5
percentage point of the final test scores.
IV. Conclusions
Thanks to the use of other statistical methods, this paper confirms the finding of teachers’
training effect found in Bressoux (1996). The data used have a quasi-experimental
design; the French system is such that some novice teachers teach before being trained.
The effect of teachers’ training is substantial: final test scores in mathematics of students
with a trained teacher are greater by 3 percentage points than the scores they would have
had if their teachers had not been trained. The estimation of heterogeneous effects shows
that the training effect on reading achievement is significant in the classes with a low
share of less achieving students.
The importance of teachers’ training is confirmed by the effect of teachers’ educational
background. Teachers who majored in sciences at university improve their students’
outcomes in mathematics. This impact is the same for trained and untrained teachers. It
22
means that for the untrained, past scientific studies compensate for the lack of training in
mathematics.
The effect of class size is shown to be significant and negative: a smaller class size
improves student achievement. The impact is evaluated between -0.3 and -0.5 percentage
points. Hence, training teachers is equivalent to reducing class size by 10 students, in
terms of final test scores in mathematics. It is worth noting that this equivalence is true on
average. But the effects vary according to the characteristics of the classes. The effect of
class size is even more beneficial in classes with a high share of low achieving students;
these students would benefit most from a decrease in class size. The effect is particularly
large for classes in priority education areas. On the contrary, it seems that this type of
classes do not benefit from the training of their teachers.
23
References Angrist Joshua D., Lavy Victor (1999), “Using Maimonides’ Rule to Estimate the Effect of Class Size on Scholastic Achievement”, Quarterly Journal of Economics, Vol. 114, No 2, pp. 533-574 Angrist Joshua D., Lavy Victor (2001), “Does Teacher Training Affect Pupil Learning? Evidence from Matched Comparisons in Jerusalem Public Schools”, Journal of Labor Economics, Vol. 19, No 2, pp. 343-369 Benabou Roland, Kramarz Francis, Prost Corinne (2003), “Zones d’éducation prioritaire : quels moyens pour quels résultats ? Une évaluation sur la période 1982-1992”, CREST Working Paper, No 38 Bressoux Pascal (1996), “The Effects of Teachers’ Training on Pupils’ Achievement: the Case of Elementary Schools in France”, School Effectiveness and School Improvement, Vol. 7, No 3, pp. 252-279 Brizard Agnes (1995), “Écoles rurales, écoles urbaines : performance des élèves en français et en mathématiques”, Éducation et Formations, Vol. 43, pp.105-111 Hanushek Eric A. (1997), “Assessing the Effects of School Resources on Student Performance: an Update”, Educational Evaluation and Policy Analysis, Vol. 19, No 2, pp. 141-164 Hanushek Eric A., John F. Kain, Steven G. Rivkin (2005), “Teachers, Schools, and Academic Achievement”, Econometrica, forthcoming Hoxby Caroline M. (2000), “The Effects of Class Size on Student Achievement: New Evidence from Population Variation”, Quarterly Journal of Economics, Vol. 115, No 4, pp. 1239-1285 Krueger Alan B. (1999), “Experimental Estimates of Educational Production Functions”, Quarterly Journal of Economics, Vol. 114, No 2, pp. 497-532 Krueger Alan B. (2000), “Economic Considerations and Class Size”, Economic Journal, Vol. 113, pp. 34-63 Lazear Edward P. (2001), “Educational Production”, Quarterly Journal of Economics, Vol. 116, No 3, pp. 777-803 Moulton Brent R. (1986), “Random Group Effects and the Precision of Regression Estimates”, Journal of Econometrics, Vol. 32, No 3, pp.385-397
24
Oeuvrard Françoise (1995), “Les performances en français et en mathematiques des écoles à classe unique”, Éducation et Formations, Vol. 43, pp.113-116 Piketty Thomas (2004), “L’impact de la taille des classes et de la ségrégation sociale sur la réussite scolaire dans les écoles françaises : une estimation à partir du panel primaire 1997”, mimeo Robinson Geoff K. (1991), “That BLUP is a Good Thing: the Estimation of Random Effects”, Statistical Science, Vol. 6, Issue 1, pp. 15-32 Summers Anita, Wolfe Barbara (1977), “Do Schools Make a Difference?”, American Economic Review, Vol. 67, No 4, pp. 639-652 Thaurel-Richard Michèle (1995), “Les progrès des élèves au CE2 en milieu rural”, Éducation et Formations, Vol. 43, pp.117-123 Woessman Ludger, West Martin R (2002), “Class-Size Effects in School Systems Around the World: Evidence from Between-Grade Variation in TIMSS”, IZA Discussion Paper No 485

25
Appendix A: Class effects estimated with mixed models The mixed model is written:
εγβ ++= ZXY where γ and ε are Gaussian:
⎥⎦
⎤⎢⎣
⎡=⎥
⎦
⎤⎢⎣
⎡00
εγ
E and ⎥⎦
⎤⎢⎣
⎡=⎥
⎦
⎤⎢⎣
⎡R
GVar
00
εγ
The endogenous variable Y is explained with covariates X multiplied by fixed-effects parameters β and with covariates Z multiplied by random-effects parametersγ . For estimating class effects, the matrix Z is composed of class dummies. The vector γ is then a vector of random class effects. We assume that variance matrices G and R are diagonal: IG 2
1σ= and IR 2σ= . G diagonal means that the random effects are uncorrelated. G and R can be estimated by the method of restricted/residual maximum likelihood (REML). Coefficients are then determined with Henderson’s mixed model equations:
⎥⎦
⎤⎢⎣
⎡=⎥
⎦
⎤⎢⎣
⎡⎥⎦
⎤⎢⎣
⎡
+ −
−
−−−
−−
YRZYRX
GZRZXRZZRXXRX
1
1
111
11
ˆ'
ˆ'ˆ
ˆˆˆ'ˆ'
ˆ'ˆ'γβ
Thus, if the eigenvalues of G ∞→ , then 0ˆ 1 →−G , and the system is identical to the one of the estimation of fixed effects.

26
Appendix B: Tables and figures Table 1: Number of students and classes according to the type of the teacher
Number of teachers Number of pupilsExperienced teachers 96 2045Trained novice teachers 66 1180Untrained novice teachers 36 617Total 198 3842 Table 2: Statistics on the student variables Variable N MeanMonth of birth 3842 6.52At least one year younger 3842 0.02Girl 3842 0.48Nationality: foreigner 3842 0.171 sibling 3842 0.352 siblings 3842 0.273 or more siblings 3842 0.28Father's occupation: high 3842 0.33Mother's occupation: high 3842 0.17Pre-elementary school: less than 3 years 3842 0.21Pre-elementary school: more than 3 years 3842 0.18One repeated grade in pre-elementary school 3842 0.02First grade repeated 3842 0.12Second grade repeated 3842 0.07Third grade repeated 3842 0.07
Initial test score in reading 3568 100.00(15.00)
Initial test score in math 3629 100.00(15.00)
Final test score in reading 3258 100.00(15.00)
Final test score in math 3390 100.00(15.00)
Note: Standard deviations are reported in parentheses for non-dummy variables. High occupation corresponds to self-employed worker, executive, teacher, professor, technician, and foreman.
27
Table 3: Statistics on the teacher and class variables Variable N MeanExperienced teacher 198 0.48Trained novice teacher 198 0.33Untrained novice teacher 198 0.18Field of specialization: sciences 198 0.12Field of specialization: unknown 198 0.39Class size 188 23.85
(3.98)Combination class 198 0.33Rural 198 0.15Semi-rural 198 0.18Priority educational area (ZEP) 198 0.24 Note: Standard deviations are reported in parentheses for non-dummy variables. The field of specialization is unknown when the teacher did not answer the question or when the teacher did not go to the university. Table 4: Statistics on the student variables, for students whose characteristics are all known Variable N MeanMonth of birth 2754 6.56At least one year younger 2754 0.02Girl 2754 0.48Nationality: foreigner 2754 0.161 sibling 2754 0.362 siblings 2754 0.283 or more siblings 2754 0.27Father's occupation: high 2754 0.33Mother's occupation: high 2754 0.17Pre-elementary school: less than 3 years 2754 0.20Pre-elementary school: more than 3 years 2754 0.16One repeated grade in pre-elementary school 2754 0.01First grade repeated 2754 0.11Second grade repeated 2754 0.06Third grade repeated 2754 0.06
Initial test score in reading 2754 100.23(14.83)
Initial test score in math 2754 100.50(14.94)
Final test score in reading 2754 100.17(14.91)
Final test score in math 2754 100.28(15.01)
Note: Standard deviations are reported in parentheses for non-dummy variables.
28
Table 5: Statistics on the teacher and class variables, for students whose characteristics are all known Variable N MeanExperienced teacher 176 0.48Trained novice teacher 176 0.35Untrained novice teacher 176 0.17Field of specialization: sciences 176 0.11Field of specialization: unknown 176 0.41Class size 176 23.85
(3.99)Combination class 176 0.29Rural 176 0.15Semi-rural 176 0.18Priority educational area (ZEP) 176 0.26 Note: Standard deviations are reported in parentheses for non-dummy variables Table 6: Statistics on the student variables by type of teacher
Experienced Trained novice Untrained novice teachers teachers teachers
Variable N Mean N Mean N MeanMonth of birth 2045 6.52 1180 6.48 617 6.58At least one year younger 2045 0.02 1180 0.01 617 0.02Girl 2045 0.48 1180 0.49 617 0.48Nationality: foreigner 2045 0.14 1180 0.21 617 0.181 sibling 2045 0.39 1180 0.29 617 0.342 siblings 2045 0.26 1180 0.28 617 0.293 or more siblings 2045 0.25 1180 0.35 617 0.26Father's occupation: high 2045 0.36 1180 0.30 617 0.30Mother's occupation: high 2045 0.19 1180 0.15 617 0.14Pre-elementary school: less than 3 years 2045 0.20 1180 0.20 617 0.24Pre-elementary school: more than 3 years 2045 0.19 1180 0.17 617 0.18One repeated grade in pre-elementary school 2045 0.02 1180 0.02 617 0.01First grade repeated 2045 0.10 1180 0.15 617 0.14Second grade repeated 2045 0.07 1180 0.07 617 0.06Third grade repeated 2045 0.07 1180 0.07 617 0.07
Initial test score in reading 1923 102.30 1089 97.02 556 97.87(14.46) (15.26) (15.00)
Initial test score in math 1963 101.51 1079 98.41 587 97.88(15.48) (14.09) (14.43)
Final test score in reading 1768 102.75 1026 97.31 464 95.46(14.26) (15.22) (15.13)
Final test score in math 1835 102.25 1029 98.34 526 95.42(14.39) (15.06) (15.51)
Note: Standard deviations are reported in parentheses for non-dummy variables.

29
Table 7: Statistics on the teacher and class variables by type of teacher
Experienced Trained novice Untrained novice teachers teachers teachers
Variable N Mean N Mean N MeanField of specialization: sciences 96 0.09 66 0.15 36 0.11Field of specialization: unknown 96 0.67 66 0.12 36 0.17Class size 86 24.79 66 22.79 36 23.53
(3.48) (3.96) (4.65)Combination class 96 0.26 66 0.36 36 0.47Rural 96 0.13 66 0.11 36 0.31Semi-rural 96 0.15 66 0.18 36 0.28Priority educational area (ZEP) 96 0.19 66 0.32 36 0.25 Note: Standard deviations are reported in parentheses for non-dummy variables. Table 8: Regression estimates of the correlation between initial test scores and teacher type
reading mathCoefficient Standard error Coefficient Standard error
Constant 98.41 ** (1.63) 98.65 ** (1.66)Experienced teacher 4.07 ** (1.90) 3.22 * (1.96)Trained novice teacher -1.27 (1.98) -0.54 (2.06)Number of students 2937 3123Number of classes 180 184Class level residual variance 68.02 83.87Individual level residual variance 156.88 142.62 Note: Regression of the initial test scores of all the students whose characteristics are known; the covariates are only the dummy variable for the type of the teacher. The coefficients are estimated through a mixed model, with class effects. Standard errors are reported in parentheses. **p<0.05 *p<0.10

30
Table 9: Regression estimates of the correlation between teacher and class characteristics and initial test scores
reading math
Coefficient Standard error Coefficient Standard errorConstant 95.94 ** (3.99) 96.47 ** (4.86)Pupil characteristics:Month of birth -0.36 ** (0.07) -0.39 ** (0.06)At least one year younger 4.91 ** (1.65) 2.22 (1.58)Girl 3.16 ** (0.43) -0.61 (0.41)Nationality: foreigner -4.14 ** (0.69) -2.56 ** (0.66)1 sibling -0.96 (0.77) -0.96 (0.75)2 siblings -1.57 * (0.80) -1.41 * (0.78)3 or more siblings -4.36 ** (0.86) -3.29 ** (0.83)Father's occupation: high 3.18 ** (0.52) 3.83 ** (0.50)Mother's occupation: high 3.21 ** (0.63) 3.56 ** (0.61)Pre-elementary school: less than 3 years -1.50 ** (0.64) -1.00 (0.62)Pre-elementary school: more than 3 years -0.15 (0.72) 1.01 (0.69)One repeated grade in pre-elementary school -3.98 ** (1.96) -6.07 ** (1.83)First grade repeated -7.04 ** (0.70) -4.67 ** (0.67)Second grade repeated -3.64 ** (0.89) -1.10 (0.86)Third grade repeated -6.78 ** (0.90) -5.13 ** (0.86)Class characteristics: Experienced teacher 3.71 ** (1.52) 3.05 * (1.82)Trained novice teacher 0.42 (1.57) 1.06 (1.88)Class size 0.25 * (0.14) 0.22 (0.17)Combination class 1.68 (1.33) 0.79 (1.61)Rural 0.91 (1.72) 4.17 * (2.14)Semi-rural 1.07 (1.43) 1.52 (1.76)Priority educational area (ZEP) -4.67 ** (1.30) -2.40 (1.59)Number of students 2937 3123Number of classes 180 184Class level residual variance 36.78 64.42Individual level residual variance 127.18 124.22 Note: Regression of the initial test scores of all the students; the covariates include student and class characteristics. The coefficients are estimated through a mixed model, with class effects. Standard errors are reported in parentheses. **p<0.05 *p<0.10

31
Table 10: Regression estimates of the correlation between initial test scores and teacher type, on pupils with novice teachers
reading mathCoefficient Standard error Coefficient Standard error
Constant 98.42 ** (1.75) 98.61 ** (1.46)Trained novice teacher -1.29 (2.12) -0.45 (1.81)Number of students 1361 1468Number of classes 96 98Class level residual variance 79.30 61.12Individual level residual variance 166.78 147.64 Note: Regression of the initial test scores of the students with novice teachers and whose characteristics are known; the covariates are only the dummy variable for the type of the teacher. The coefficients are estimated through a mixed model, with class effects. Standard errors are reported in parentheses. **p<0.05 *p<0.10

32
Table 11: Regression estimates of the correlation between teacher and class characteristics on initial test scores, on pupils with novice teachers
reading math
Coefficient Standard error Coefficient Standard errorConstant 95.92 ** (5.92) 97.10 ** (5.18)Pupil characteristics:Month of birth -0.34 ** (0.10) -0.46 ** (0.09)At least one year younger 3.14 (2.69) 2.48 (2.59)Girl 3.34 ** (0.67) -0.81 (0.62)Nationality: foreigner -2.96 ** (1.02) -1.62 * (0.94)1 sibling -0.71 (1.24) -1.22 (1.17)2 siblings -1.54 (1.27) -1.53 (1.20)3 or more siblings -4.77 ** (1.34) -3.85 ** (1.26)Father's occupation: high 2.67 ** (0.82) 3.75 ** (0.78)Mother's occupation: high 3.88 ** (1.03) 4.12 ** (0.99)Pre-elementary school: less than 3 years -0.44 (0.98) -0.03 (0.91)Pre-elementary school: more than 3 years 0.07 (1.23) 1.46 (1.10)One repeated grade in pre-elementary school -2.25 (3.07) -2.48 (2.66)First grade repeated -5.60 ** (1.00) -2.89 ** (0.93)Second grade repeated -3.21 ** (1.43) -0.60 (1.29)Third grade repeated -6.52 ** (1.53) -3.38 ** (1.34)Class characteristics: Trained novice teacher 0.36 (1.84) 1.59 (1.53)Field of specialization: sciences 3.63 (2.44) 3.58 * (2.14)Field of specialization: unknown 1.77 (2.41) 3.55 * (2.08)Class size 0.20 (0.21) 0.15 (0.18)Combination class -0.22 (2.13) -0.79 (1.79)Rural 2.25 (3.06) 5.04 * (2.63)Semi-rural 1.07 (2.30) 2.95 (1.89)Priority educational area (ZEP) -4.57 ** (2.02) -2.73 (1.70)Number of students 1361 1468Number of classes 96 98Class level residual variance 48.65 35.16Individual level residual variance 142.80 133.94 Note: Regression of the initial test scores of the students with novice teachers; the covariates include student and class characteristics. The coefficients are estimated through a mixed model, with class effects. Standard errors are reported in parentheses. **p<0.05 *p<0.10
33
Table 12: Regression estimates of the correlation between initial test scores and class size, on all pupils
reading mathCoefficient Standard error Coefficient Standard error
Constant 91.21 ** (4.29) 93.77 ** (4.51)Class size 0.36 ** (0.18) 0.26 (0.19)Number of students 2937 3123Number of classes 180 184Class level residual variance 72.13 85.56Individual level residual variance 156.85 142.63 Note: Regression of the initial test scores of all the students whose characteristics are known; the covariates are only the class size variable. The coefficients are estimated through a mixed model, with class effects. Standard errors are reported in parentheses. **p<0.05 *p<0.10 Table 13: Regression estimates of the correlation between initial test scores and class size, on pupils with novice teachers
reading mathCoefficient Standard error Coefficient Standard error
Constant 93.61 ** (5.64) 96.67 ** (5.03)Class size 0.17 (0.24) 0.07 (0.21)Number of students 1361 1468Number of classes 96 98Class level residual variance 79.09 61.12Individual level residual variance 166.79 147.63 Note: Regression of the initial test scores of the students with novice teachers and whose characteristics are known; the covariates are only the class size variable. The coefficients are estimated through a mixed model, with class effects. Standard errors are reported in parentheses. **p<0.05 *p<0.10

34
Table 14: Estimated effects of teacher and class characteristics on final test scores
reading math
Coefficient Standard error Coefficient Standard errorConstant 52.85 ** (7.24) 58.75 ** (9.91)Pupil characteristics:Month of birth 0.09 (0.06) 0.06 (0.07)At least one year younger 4.27 ** (1.70) 3.73 ** (1.89)Girl 2.27 ** (0.43) -0.79 * (0.45)Nationality: foreigner 0.39 (0.65) 1.20 * (0.69)1 sibling -0.64 (0.78) -0.59 (0.85)2 siblings 0.17 (0.80) -0.19 (0.87)3 or more siblings -0.05 (0.85) 0.35 (0.92)Father's occupation: high 1.51 ** (0.52) 0.13 (0.57)Mother's occupation: high 0.81 (0.65) 1.21 * (0.72)Pre-elementary school: less than 3 years -0.34 (0.62) -0.64 (0.67)Pre-elementary school: more than 3 years 1.26 (0.78) 0.03 (0.81)One repeated grade in pre-elementary school -6.41 ** (1.94) -3.89 ** (1.94)First grade repeated -5.43 ** (0.64) -3.84 ** (0.68)Second grade repeated -3.86 ** (0.90) -2.37 ** (0.94)Third grade repeated -2.14 ** (0.97) -3.01 ** (0.98)Initial test score 0.76 ** (0.02) 0.79 ** (0.02)Teacher characteristics:Trained novice teacher 1.33 (1.14) 3.44 ** (1.35)Field of specialization: sciences -0.04 (1.53) 3.37 * (1.84)Field of specialization: unknown 4.68 ** (1.49) 3.09 * (1.79)Class and school characteristics: Class size -0.33 ** (0.13) -0.36 ** (0.15)Combination class 0.86 (1.33) 0.98 (1.56)Mean of initial scores in the class -0.21 ** (0.06) -0.24 ** (0.08)Standard deviation of initial scores in the class -0.29 * (0.17) -0.62 ** (0.23)Rural -2.51 (1.89) -5.00 ** (2.26)Semi-rural -1.41 (1.44) 0.35 (1.68)Priority educational area (ZEP) -2.07 (1.33) -3.58 ** (1.49)Number of students 1361 1468Number of classes 96 98Class level residual variance 18.00 27.07Individual level residual variance 56.93 70.50 Note: Regression of the final test scores of the students with novice teachers; the covariates include student and class characteristics (including initial test scores), together with teacher characteristics. The coefficients are estimated through a mixed model, with class effects. Standard errors are reported in parentheses. **p<0.05 *p<0.10
35
Table 15: Heterogeneous effects of training quartile defined by: training dummy training dummy training dummy training dummy
and second quartile and third quartile and fourth quartile
students' initial scores reading 1.39 -0.21 -0.35 0.35(quartiles (1.27) (0.75) (0.86) (1.08)within the classes)
math 2.71* 1.45* 0.76 0.90(1.47) (0.83) (0.94) (1.15)
class means of reading -2.86 5.58* 6.80** 5.07initial scores in reading (2.21) (3.22) (3.10) (3.09)
math 2.32 2.77 1.28 1.43(2.07) (2.14) (2.45) (2.77)
shares in the classes reading -1.07 3.54* 1.15 4.57*of less achieving pupils (1.77) (1.86) (2.05) (2.39)(inverse order of quartiles)
math 0.99 5.69** 0.82 3.91(1.95) (2.10) (2.31) (2.54)
Note: Regression of the final test scores of the students with novice teachers; the covariates include student, class characteristics and dummy variable of trained teachers, broken down according to the quartiles. The coefficients are estimated through a mixed model, with class effects. Standard errors are reported in parentheses. **p<0.05 *p<0.10 Table 16: Heterogeneous effects of class size quartile defined by: class size class size class size class size
and second quartile and third quartile and fourth quartile
students' initial scores reading -0.28** -0.04 -0.06 -0.07(quartiles (0.13) (0.03) (0.04) (0.05)within the classes)
math -0.37** 0.03 0.01 0.00(0.16) (0.03) (0.04) (0.05)
class means of reading -0.57** 0.41 -0.09 0.42initial scores in reading (0.27) (0.37) (0.40) (0.35)
math -0.47** 0.09 0.10 0.21*(0.17) (0.08) (0.10) (0.12)
shares in the classes reading -0.39** 0.06 0.02 0.17of less achieving pupils (0.15) (0.08) (0.10) (0.13)(inverse order of quartiles)
math -0.53** 0.19** 0.12 0.34**(0.16) (0.08) (0.09) (0.11)
Note: Regression of the final test scores of the students with novice teachers; the covariates include student, class characteristics and class size variable, broken down according to the quartiles. The coefficients are estimated through a mixed model, with class effects. Standard errors are reported in parentheses. **p<0.05 *p<0.10

36
Table 17: Effect of class size in the ZEP schools and in the other schools
class size class sizeand ZEP school
reading -0.21 -0.58*(0.14) (0.32)
math -0.14 -1.06**(0.16) (0.36)
Note: Regression of the final test scores of the students with novice teachers; the covariates include student, class characteristics and class size variable, broken down according to ZEP schools and other schools. The coefficients are estimated through a mixed model, with class effects. Standard errors are reported in parentheses. **p<0.05 *p<0.10 Table 18: Effect of class size estimated with or without instrumental variable
All classesOLS IV IV (29-40) IV (24-45)
reading -0.36** -0.39** -0.18 -0.44**(0.10) (0.10) (0.49) (0.22)
math -0.43** -0.44** -0.84* -0.67**(0.12) (0.12) (0.45) (0.23)
Without combination classesOLS IV IV (29-40) IV (24-45)
reading -0.35** -0.36** -0.24 -0.32(0.12) (0.12) (0.33) 0.20
math -0.49** -0.50** -0.80* -0.54**(0.14) (0.14) (0.43) (0.21)
Note: Regression of the final test scores of all the students; the covariates include student, class characteristics and instrumented variable of class size. The two last columns correspond to the estimation on the sub-samples restricted to some sizes of the enrollment. The coefficients are estimated through a mixed model, with class effects. Standard errors are reported in parentheses. **p<0.05 *p<0.10
37
Figure 1: Evolution of the number of individuals directly selected for entry into the teacher training college and of the number of individuals recruited on the waiting list, between the years 1986 to 1992
0
1000
2000
3000
4000
5000
6000
7000
1986 1987 1988 1989 1990 1991 1992
Num
ber o
f ind
ivid
uals
Selected candidates
Candidates recruited on the waiting list
38
Figure 2: Class sizes and mean scores in reading for classes with experienced teachers
60
70
80
90
100
110
120
130
140
0 5 10 15 20 25 30 35 40
Class size
Cla
ss m
ean
of th
e in
itial
sco
res
in re
adin
g
Figure 3: Class sizes and mean scores in reading for classes with novice teachers
60
70
80
90
100
110
120
130
140
0 5 10 15 20 25 30 35 40
Class size
Cla
ss m
ean
of th
e in
itial
sco
res
in re
adin
g

39
Figure 4: Enrollment and number of third-graders per class
0
5
10
15
20
25
30
35
40
0 10 20 30 40 50 60
Number of third-graders in the schools
Num
ber o
f thi
rd-g
rade
rs p
er c
lass
class sizemean of class sizes in the schoolcombination class
Figure 5: Enrollment and class size for third-graders, excluding combination classes
0
5
10
15
20
25
30
35
40
0 10 20 30 40 50 60
Number of third-graders in the school
Siz
e of
the
third
gra
de c
lass
es
class size mean of class sizes in the school
40
Figure 6: Enrollment of third-graders and students who are combined in a class with third-graders and class size
0
5
10
15
20
25
30
35
40
0 10 20 30 40 50 60
Number in the school of third-graders and students who are combined with third-graders in a class
Siz
e of
the
clas
ses
class size mean of class sizes in the school