Teacher Retention and Turnover Research - National ... About this research 1 Key findings and...
17
Teacher Retention and Turnover Research Research Update 3 Is the Grass Greener Beyond Teaching?
Transcript of Teacher Retention and Turnover Research - National ... About this research 1 Key findings and...
Teacher Retention and Turnover Research
Research Update 3
Is the Grass Greener Beyond Teaching?
Teacher Retention and Turnover Research
Research Update 3: Is the Grass Greener Beyond Teaching?
Susan Bamford Jack Worth Published in December 2017 By the National Foundation for Educational Research, The Mere, Upton Park, Slough, Berkshire SL1 2DQ www.nfer.ac.uk © 2017 National Foundation for Educational Research Registered Charity No. 313392 ISBN: 978-1-911039-66-2 How to cite this publication: Bamford, S. and Worth, J. (2017). Teacher Retention and Turnover Research. Research Update 3: Is the Grass Greener Beyond Teaching? Slough: NFER.
Contents
About this research 1
Key findings and conclusions 3
Why explore teacher retention using Understanding Society survey data? 4
Where do teachers go when they leave? 5
What happens to job satisfaction when teachers leave? 8
What next for this research? 9
Appendix 10
References 12

Teacher Retention and Turnover Research. Research Update 3: Is the Grass Greener Beyond Teaching? 1
About this research Where do teachers go when they leave the profession and how do their circumstances change after leaving? In this Research Update we present evidence on teachers’ motivations to leave the profession. Using Understanding Society survey data, we analyse the destinations of leavers, and explore how their working hours, pay, job satisfaction and well-being change after they leave the profession. We find that a large proportion of teachers remain working in the education sector. We also find that teachers who leave the profession for another job see their working hours and earnings fall while their job satisfaction increases. This evidence suggests that teachers’ decisions about whether to leave the profession are not primarily motivated by pay differentials, but are strongly influenced by teachers wanting to change their working hours and improve job satisfaction. This Research Update is the fourth publication in a series that is a major new research project by the National Foundation for Educational Research (NFER), which is funded by a grant from the Nuffield Foundation. The project aims to gain a deeper understanding of the dynamics within the teacher workforce in England. The study will inform policy makers and system leaders to help formulate effective responses to this complex issue and meet the challenge of increasing demand for teachers. We have already published some evidence-based outputs, which provide insights about where policy interventions and practice might usefully focus. The first two Research Updates presented differences in teacher retention rates by the subject they teach and explored teacher redeployment within and across multi-academy trusts, while our recent Interim Report explored factors associated with teacher retention and turnover and offered recommendations for policymakers on how to improve retention.
National Foundation for Educational Research NFER is a leading independent provider of rigorous research and insights in education, working to create an excellent education for all children and young people. We are a not-for-profit organisation and our robust and innovative research, assessments and other services are widely known and used by key decision-makers. Any surplus generated is reinvested in projects to support our charitable purpose.
Nuffield Foundation The Nuffield Foundation is an endowed charitable trust that aims to improve social wellbeing in the widest sense. It funds research and innovation in education and social policy and also works to build capacity in education, science and social science research. The Nuffield Foundation has funded this project, but the views expressed are those of the authors and not necessarily those of the Foundation. More information is available at www.nuffieldfoundation.org.
Teacher Retention and Turnover Research. Research Update 3: Is the Grass Greener Beyond Teaching? 2
What happens to teachers who leave the profession after they leave? What can their destinations tell us about how schools and policymakers might better retain teachers? We use data from the Understanding Society survey to track teachers for several years after they leave. Our analysis shows that, on average, teachers’ pay does not increase after they leave, suggesting leavers are not primarily motivated by increased pay. Instead, leavers appear to be more motivated by improved job satisfaction, reduced working hours and more opportunities for flexible working.
Teacher Retention and Turnover Research. Research Update 3: Is the Grass Greener Beyond Teaching? 3
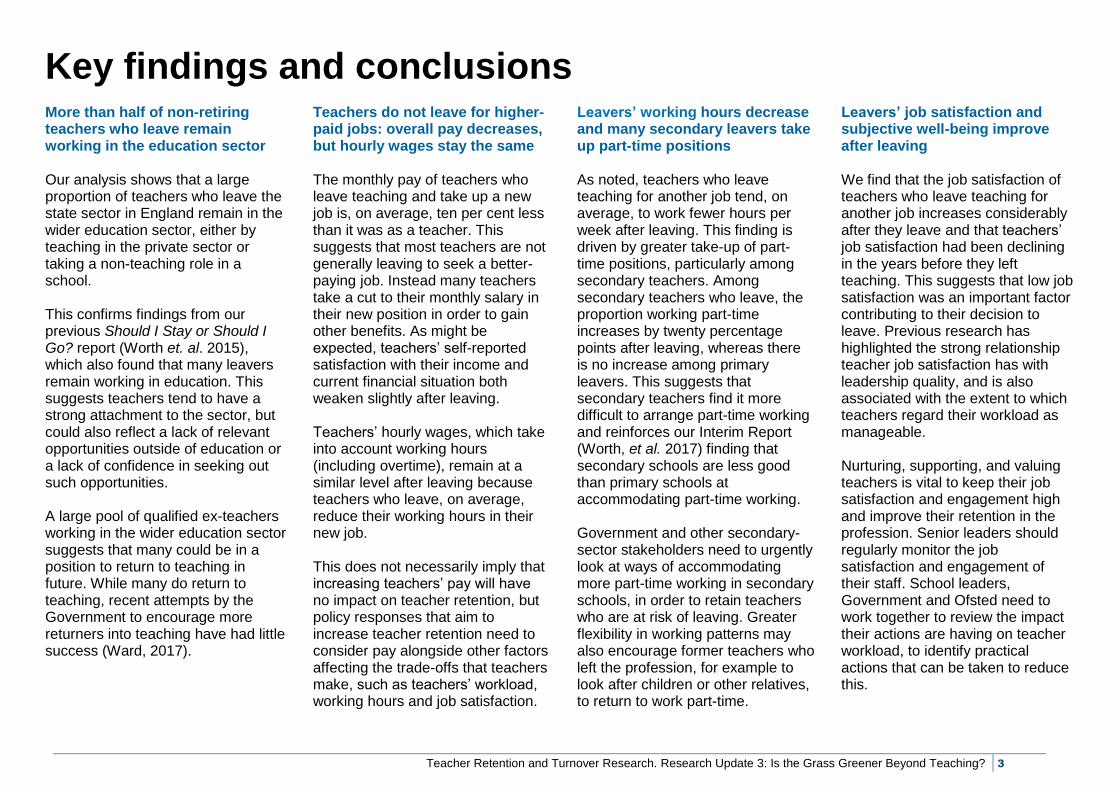
Key findings and conclusions More than half of non-retiring teachers who leave remain working in the education sector Our analysis shows that a large proportion of teachers who leave the state sector in England remain in the wider education sector, either by teaching in the private sector or taking a non-teaching role in a school. This confirms findings from our previous Should I Stay or Should I Go? report (Worth et. al. 2015), which also found that many leavers remain working in education. This suggests teachers tend to have a strong attachment to the sector, but could also reflect a lack of relevant opportunities outside of education or a lack of confidence in seeking out such opportunities. A large pool of qualified ex-teachers working in the wider education sector suggests that many could be in a position to return to teaching in future. While many do return to teaching, recent attempts by the Government to encourage more returners into teaching have had little success (Ward, 2017).
Teachers do not leave for higher-paid jobs: overall pay decreases, but hourly wages stay the same The monthly pay of teachers who leave teaching and take up a new job is, on average, ten per cent less than it was as a teacher. This suggests that most teachers are not generally leaving to seek a better-paying job. Instead many teachers take a cut to their monthly salary in their new position in order to gain other benefits. As might be expected, teachers’ self-reported satisfaction with their income and current financial situation both weaken slightly after leaving. Teachers’ hourly wages, which take into account working hours (including overtime), remain at a similar level after leaving because teachers who leave, on average, reduce their working hours in their new job. This does not necessarily imply that increasing teachers’ pay will have no impact on teacher retention, but policy responses that aim to increase teacher retention need to consider pay alongside other factors affecting the trade-offs that teachers make, such as teachers’ workload, working hours and job satisfaction.
Leavers’ working hours decrease and many secondary leavers take up part-time positions As noted, teachers who leave teaching for another job tend, on average, to work fewer hours per week after leaving. This finding is driven by greater take-up of part-time positions, particularly among secondary teachers. Among secondary teachers who leave, the proportion working part-time increases by twenty percentage points after leaving, whereas there is no increase among primary leavers. This suggests that secondary teachers find it more difficult to arrange part-time working and reinforces our Interim Report (Worth, et al. 2017) finding that secondary schools are less good than primary schools at accommodating part-time working. Government and other secondary-sector stakeholders need to urgently look at ways of accommodating more part-time working in secondary schools, in order to retain teachers who are at risk of leaving. Greater flexibility in working patterns may also encourage former teachers who left the profession, for example to look after children or other relatives, to return to work part-time.
Leavers’ job satisfaction and subjective well-being improve after leaving We find that the job satisfaction of teachers who leave teaching for another job increases considerably after they leave and that teachers’ job satisfaction had been declining in the years before they left teaching. This suggests that low job satisfaction was an important factor contributing to their decision to leave. Previous research has highlighted the strong relationship teacher job satisfaction has with leadership quality, and is also associated with the extent to which teachers regard their workload as manageable. Nurturing, supporting, and valuing teachers is vital to keep their job satisfaction and engagement high and improve their retention in the profession. Senior leaders should regularly monitor the job satisfaction and engagement of their staff. School leaders, Government and Ofsted need to work together to review the impact their actions are having on teacher workload, to identify practical actions that can be taken to reduce this.
Teacher Retention and Turnover Research. Research Update 3: Is the Grass Greener Beyond Teaching? 4
Why explore teacher retention using Understanding Society survey data?
Introduction
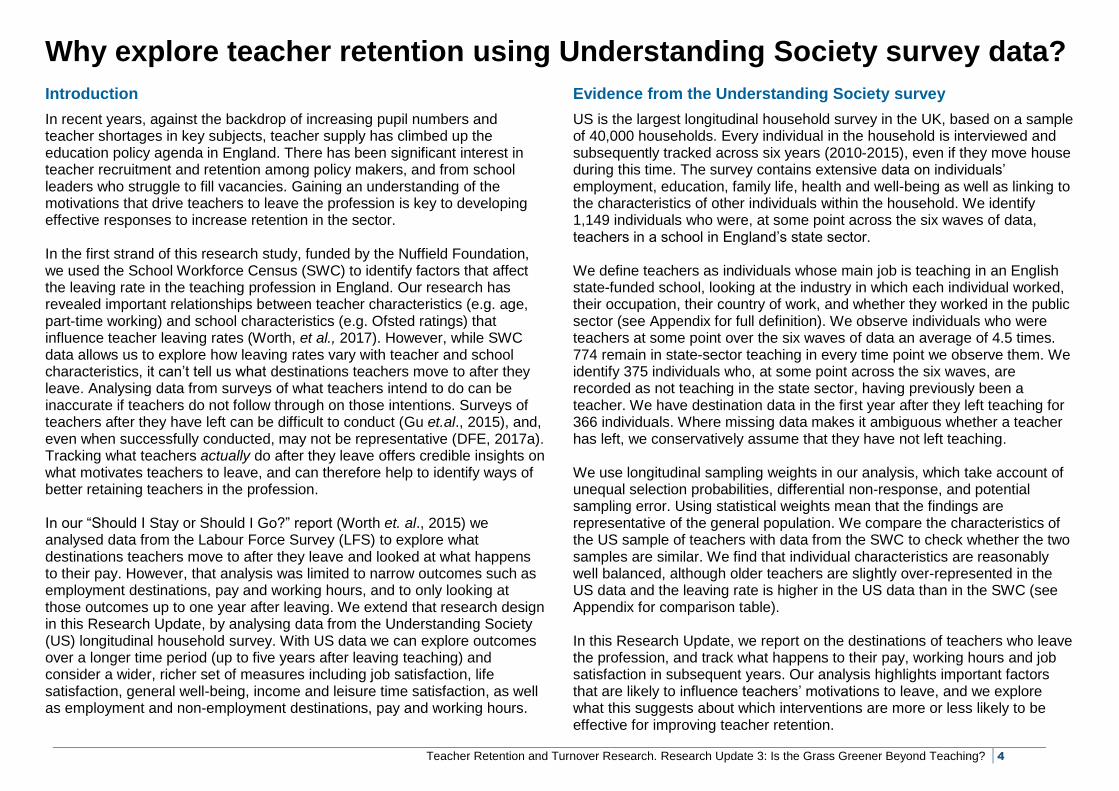
In recent years, against the backdrop of increasing pupil numbers and teacher shortages in key subjects, teacher supply has climbed up the education policy agenda in England. There has been significant interest in teacher recruitment and retention among policy makers, and from school leaders who struggle to fill vacancies. Gaining an understanding of the motivations that drive teachers to leave the profession is key to developing effective responses to increase retention in the sector. In the first strand of this research study, funded by the Nuffield Foundation, we used the School Workforce Census (SWC) to identify factors that affect the leaving rate in the teaching profession in England. Our research has revealed important relationships between teacher characteristics (e.g. age, part-time working) and school characteristics (e.g. Ofsted ratings) that influence teacher leaving rates (Worth, et al., 2017). However, while SWC data allows us to explore how leaving rates vary with teacher and school characteristics, it can’t tell us what destinations teachers move to after they leave. Analysing data from surveys of what teachers intend to do can be inaccurate if teachers do not follow through on those intentions. Surveys of teachers after they have left can be difficult to conduct (Gu et.al., 2015), and, even when successfully conducted, may not be representative (DFE, 2017a). Tracking what teachers actually do after they leave offers credible insights on what motivates teachers to leave, and can therefore help to identify ways of better retaining teachers in the profession. In our “Should I Stay or Should I Go?” report (Worth et. al., 2015) we analysed data from the Labour Force Survey (LFS) to explore what destinations teachers move to after they leave and looked at what happens to their pay. However, that analysis was limited to narrow outcomes such as employment destinations, pay and working hours, and to only looking at those outcomes up to one year after leaving. We extend that research design in this Research Update, by analysing data from the Understanding Society (US) longitudinal household survey. With US data we can explore outcomes over a longer time period (up to five years after leaving teaching) and consider a wider, richer set of measures including job satisfaction, life satisfaction, general well-being, income and leisure time satisfaction, as well as employment and non-employment destinations, pay and working hours.
Evidence from the Understanding Society survey
US is the largest longitudinal household survey in the UK, based on a sample of 40,000 households. Every individual in the household is interviewed and subsequently tracked across six years (2010-2015), even if they move house during this time. The survey contains extensive data on individuals’ employment, education, family life, health and well-being as well as linking to the characteristics of other individuals within the household. We identify 1,149 individuals who were, at some point across the six waves of data, teachers in a school in England’s state sector. We define teachers as individuals whose main job is teaching in an English state-funded school, looking at the industry in which each individual worked, their occupation, their country of work, and whether they worked in the public sector (see Appendix for full definition). We observe individuals who were teachers at some point over the six waves of data an average of 4.5 times. 774 remain in state-sector teaching in every time point we observe them. We identify 375 individuals who, at some point across the six waves, are recorded as not teaching in the state sector, having previously been a teacher. We have destination data in the first year after they left teaching for 366 individuals. Where missing data makes it ambiguous whether a teacher has left, we conservatively assume that they have not left teaching. We use longitudinal sampling weights in our analysis, which take account of unequal selection probabilities, differential non-response, and potential sampling error. Using statistical weights mean that the findings are representative of the general population. We compare the characteristics of the US sample of teachers with data from the SWC to check whether the two samples are similar. We find that individual characteristics are reasonably well balanced, although older teachers are slightly over-represented in the US data and the leaving rate is higher in the US data than in the SWC (see Appendix for comparison table). In this Research Update, we report on the destinations of teachers who leave the profession, and track what happens to their pay, working hours and job satisfaction in subsequent years. Our analysis highlights important factors that are likely to influence teachers’ motivations to leave, and we explore what this suggests about which interventions are more or less likely to be effective for improving teacher retention.
Teacher Retention and Turnover Research. Research Update 3: Is the Grass Greener Beyond Teaching? 5
Where do teachers go when they leave?
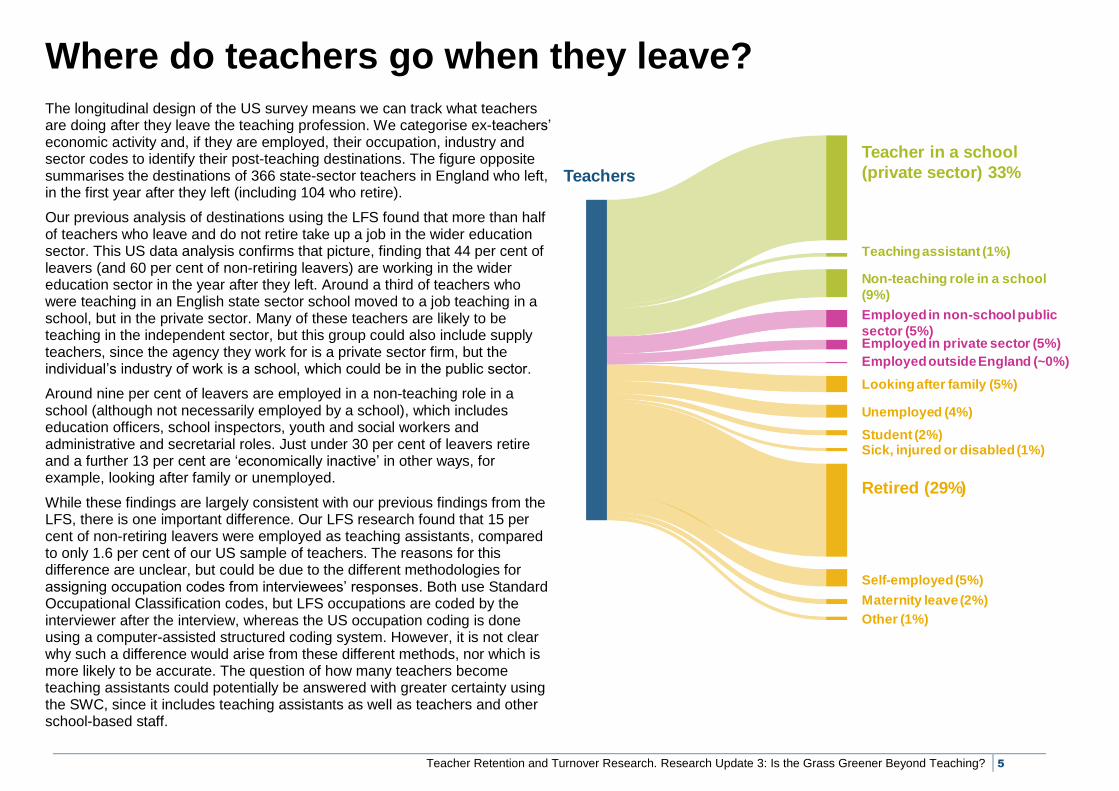
The longitudinal design of the US survey means we can track what teachers are doing after they leave the teaching profession. We categorise ex-teachers’ economic activity and, if they are employed, their occupation, industry and sector codes to identify their post-teaching destinations. The figure opposite summarises the destinations of 366 state-sector teachers in England who left, in the first year after they left (including 104 who retire).
Our previous analysis of destinations using the LFS found that more than half of teachers who leave and do not retire take up a job in the wider education sector. This US data analysis confirms that picture, finding that 44 per cent of leavers (and 60 per cent of non-retiring leavers) are working in the wider education sector in the year after they left. Around a third of teachers who were teaching in an English state sector school moved to a job teaching in a school, but in the private sector. Many of these teachers are likely to be teaching in the independent sector, but this group could also include supply teachers, since the agency they work for is a private sector firm, but the individual’s industry of work is a school, which could be in the public sector.
Around nine per cent of leavers are employed in a non-teaching role in a school (although not necessarily employed by a school), which includes education officers, school inspectors, youth and social workers and administrative and secretarial roles. Just under 30 per cent of leavers retire and a further 13 per cent are ‘economically inactive’ in other ways, for example, looking after family or unemployed.
While these findings are largely consistent with our previous findings from the LFS, there is one important difference. Our LFS research found that 15 per cent of non-retiring leavers were employed as teaching assistants, compared to only 1.6 per cent of our US sample of teachers. The reasons for this difference are unclear, but could be due to the different methodologies for assigning occupation codes from interviewees’ responses. Both use Standard Occupational Classification codes, but LFS occupations are coded by the interviewer after the interview, whereas the US occupation coding is done using a computer-assisted structured coding system. However, it is not clear why such a difference would arise from these different methods, nor which is more likely to be accurate. The question of how many teachers become teaching assistants could potentially be answered with greater certainty using the SWC, since it includes teaching assistants as well as teachers and other school-based staff.
Teachers
Teacher in a school
(private sector) 33%
Teaching assistant (1%)
Non-teaching role in a school
(9%)
Employed in non-school public
sector (5%)Employed in private sector (5%)
Employed outside England (~0%)
Looking after family (5%)
Unemployed (4%)
Student (2%)Sick, injured or disabled (1%)
Retired (29%)
Self-employed (5%)
Maternity leave (2%)
Other (1%)
Teacher Retention and Turnover Research. Research Update 3: Is the Grass Greener Beyond Teaching? 6
What happens to teachers’ pay after they leave teaching? Teachers’ pay falls by around ten per cent after leaving the profession
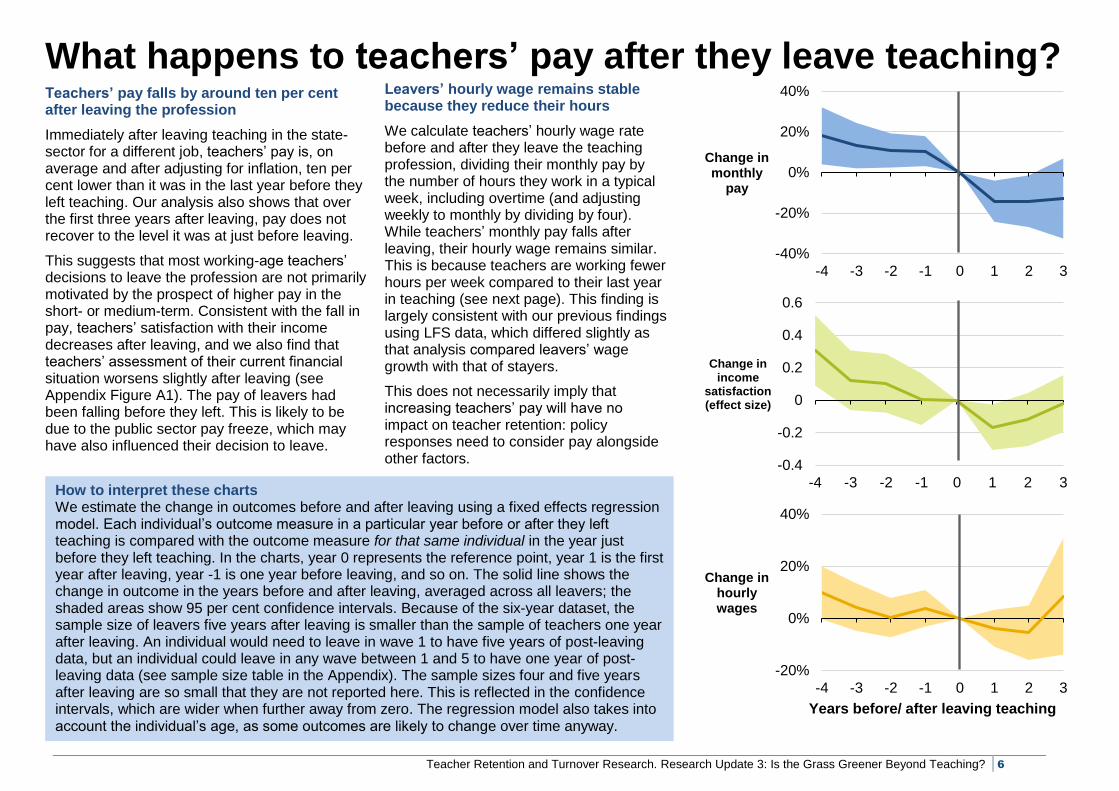
Immediately after leaving teaching in the state-sector for a different job, teachers’ pay is, on average and after adjusting for inflation, ten per cent lower than it was in the last year before they left teaching. Our analysis also shows that over the first three years after leaving, pay does not recover to the level it was at just before leaving.
This suggests that most working-age teachers’ decisions to leave the profession are not primarily motivated by the prospect of higher pay in the short- or medium-term. Consistent with the fall in pay, teachers’ satisfaction with their income decreases after leaving, and we also find that teachers’ assessment of their current financial situation worsens slightly after leaving (see Appendix Figure A1). The pay of leavers had been falling before they left. This is likely to be due to the public sector pay freeze, which may have also influenced their decision to leave.
Leavers’ hourly wage remains stable because they reduce their hours
We calculate teachers’ hourly wage rate before and after they leave the teaching profession, dividing their monthly pay by the number of hours they work in a typical week, including overtime (and adjusting weekly to monthly by dividing by four). While teachers’ monthly pay falls after leaving, their hourly wage remains similar. This is because teachers are working fewer hours per week compared to their last year in teaching (see next page). This finding is largely consistent with our previous findings using LFS data, which differed slightly as that analysis compared leavers’ wage growth with that of stayers.
This does not necessarily imply that increasing teachers’ pay will have no impact on teacher retention: policy responses need to consider pay alongside other factors.
-40%
-20%
0%
20%
40%
-4 -3 -2 -1 0 1 2 3
Change in monthly
pay
-0.4
-0.2
0
0.2
0.4
0.6
-4 -3 -2 -1 0 1 2 3
Change in income
satisfaction (effect size)
-20%
0%
20%
40%
-4 -3 -2 -1 0 1 2 3
Change in hourly wages
Years before/ after leaving teaching
How to interpret these charts We estimate the change in outcomes before and after leaving using a fixed effects regression model. Each individual’s outcome measure in a particular year before or after they left teaching is compared with the outcome measure for that same individual in the year just before they left teaching. In the charts, year 0 represents the reference point, year 1 is the first year after leaving, year -1 is one year before leaving, and so on. The solid line shows the change in outcome in the years before and after leaving, averaged across all leavers; the shaded areas show 95 per cent confidence intervals. Because of the six-year dataset, the sample size of leavers five years after leaving is smaller than the sample of teachers one year after leaving. An individual would need to leave in wave 1 to have five years of post-leaving data, but an individual could leave in any wave between 1 and 5 to have one year of post-leaving data (see sample size table in the Appendix). The sample sizes four and five years after leaving are so small that they are not reported here. This is reflected in the confidence intervals, which are wider when further away from zero. The regression model also takes into account the individual’s age, as some outcomes are likely to change over time anyway.

Teacher Retention and Turnover Research. Research Update 3: Is the Grass Greener Beyond Teaching? 7
Teachers reduce their working hours after leaving the profession After leaving the profession for a new job, teachers work fewer hours
On average, full-time state-sector teachers in the US survey report working 48 hours in a usual week (including overtime). This is lower than the average 57 working hours reported for full-time teachers in the 2016 Teacher Workload Survey (DfE, 2017b), but the same as those reported in the OECD TALIS survey (Sellen, 2016). All three sources confirm that teachers are working longer hours than implied by their statutory
hours of around 32.5 hours per week1.
We find that teachers’ weekly working hours drop, on average, by 12 per cent in the year after leaving and remain below the level they were at just before leaving for at least three years. However, there is no significant change in weekly working hours among teachers who work full-time before and after leaving teaching. The finding is driven by more teachers taking-up part-time work after leaving teaching.
Many secondary teachers who leave seek out opportunities to work part-time
Overall, the proportion of teachers working part-time increases by ten percentage points after teachers leave. Splitting this analysis between primary and secondary teachers shows that this change is driven entirely by teachers in the secondary sector, where the percentage working part-time increases by 20 percentage points after leaving.
1 1265 hours over 195 days, in a typical five-day working week (DfE, 2017c).
Our Interim Report (Worth et. al., 2017) highlighted that primary schools seem better able, or more willing, to accommodate part-time teaching than secondary schools. These new findings from US survey data reinforce that conclusion, suggesting that the lack of flexible working opportunities in secondary schools mean that some teachers have to leave teaching in order to work part-time. This adds further evidence to our recommendation that the government and other secondary-sector stakeholders need to urgently look at ways of accommodating more part-time working in secondary schools.
Leavers are more satisfied with their leisure time
Consistent with the finding that, on average, teachers who leave teaching reduce their working hours, teachers’ reported satisfaction with their amount of leisure time increases considerably after leaving (see Appendix Figure A3). Our analysis suggests that teachers’ working hours and work-life balance are important factors in teacher retention. Teacher workload, a key driver of longer working hours, is often cited in surveys of ex-teachers as a main reason for leaving the profession (DFE, 2017a). School leaders, Government and Ofsted need to work together to review the impact their actions have on teacher workload and identify practical actions that can be taken to reduce this in order to improve teacher retention at school- and system-levels.
-60%
-40%
-20%
0%
20%
40%
-4 -3 -2 -1 0 1 2 3
Change in weekly
working hours
-40%
-20%
0%
20%
40%
-4 -3 -2 -1 0 1 2 3
Change in part-time
(percentage points)
Primary teachers only
-20%
0%
20%
40%
-4 -3 -2 -1 0 1 2 3
Change in part-time
(percentage points)
Years before/ after leaving teaching
Secondary teachers only
Teacher Retention and Turnover Research. Research Update 3: Is the Grass Greener Beyond Teaching? 8
What happens to job satisfaction when teachers leave? Teachers who leave are more satisfied in their new job
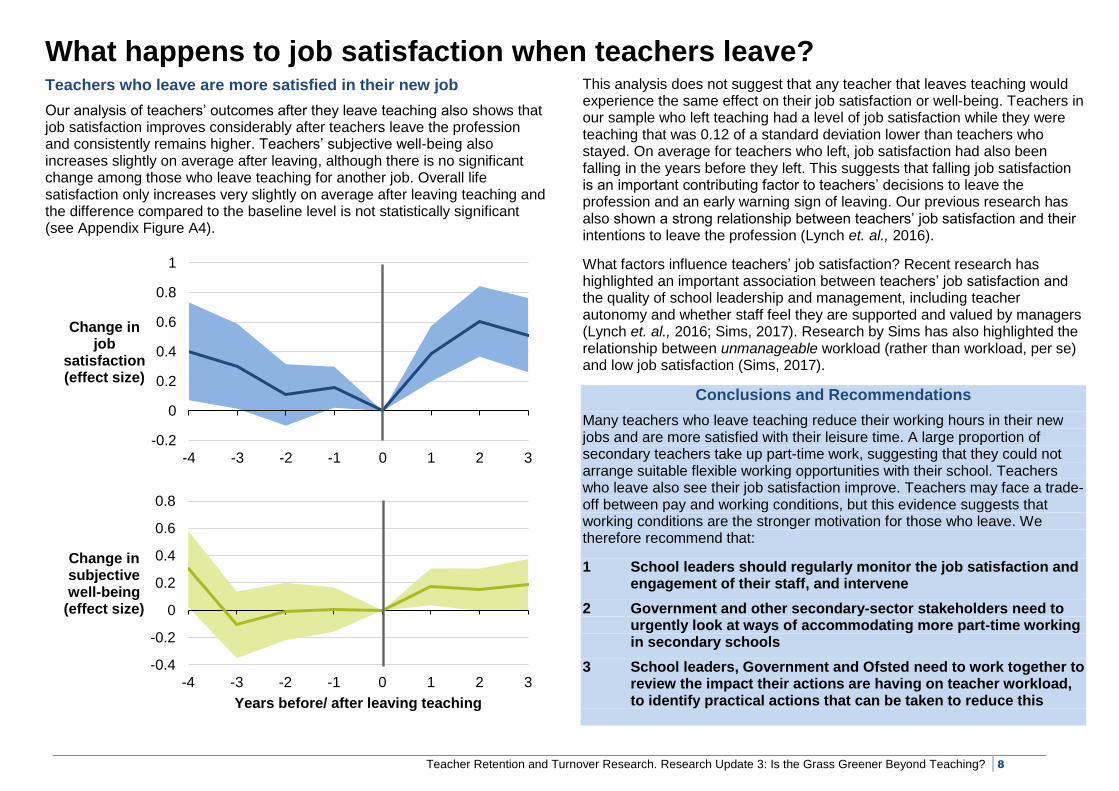
Our analysis of teachers’ outcomes after they leave teaching also shows that job satisfaction improves considerably after teachers leave the profession and consistently remains higher. Teachers’ subjective well-being also increases slightly on average after leaving, although there is no significant change among those who leave teaching for another job. Overall life satisfaction only increases very slightly on average after leaving teaching and the difference compared to the baseline level is not statistically significant (see Appendix Figure A4).
This analysis does not suggest that any teacher that leaves teaching would experience the same effect on their job satisfaction or well-being. Teachers in our sample who left teaching had a level of job satisfaction while they were teaching that was 0.12 of a standard deviation lower than teachers who stayed. On average for teachers who left, job satisfaction had also been falling in the years before they left. This suggests that falling job satisfaction is an important contributing factor to teachers’ decisions to leave the profession and an early warning sign of leaving. Our previous research has also shown a strong relationship between teachers’ job satisfaction and their intentions to leave the profession (Lynch et. al., 2016).
What factors influence teachers’ job satisfaction? Recent research has highlighted an important association between teachers’ job satisfaction and the quality of school leadership and management, including teacher autonomy and whether staff feel they are supported and valued by managers (Lynch et. al., 2016; Sims, 2017). Research by Sims has also highlighted the relationship between unmanageable workload (rather than workload, per se) and low job satisfaction (Sims, 2017).
Conclusions and Recommendations
Many teachers who leave teaching reduce their working hours in their new jobs and are more satisfied with their leisure time. A large proportion of secondary teachers take up part-time work, suggesting that they could not arrange suitable flexible working opportunities with their school. Teachers who leave also see their job satisfaction improve. Teachers may face a trade-off between pay and working conditions, but this evidence suggests that working conditions are the stronger motivation for those who leave. We therefore recommend that:
1 School leaders should regularly monitor the job satisfaction and engagement of their staff, and intervene
2 Government and other secondary-sector stakeholders need to urgently look at ways of accommodating more part-time working in secondary schools
3 School leaders, Government and Ofsted need to work together to review the impact their actions are having on teacher workload, to identify practical actions that can be taken to reduce this
-0.2
0
0.2
0.4
0.6
0.8
1
-4 -3 -2 -1 0 1 2 3
Change in job
satisfaction (effect size)
-0.4
-0.2
0
0.2
0.4
0.6
0.8
-4 -3 -2 -1 0 1 2 3
Change in subjective well-being
(effect size)
Years before/ after leaving teaching
Teacher Retention and Turnover Research. Research Update 3: Is the Grass Greener Beyond Teaching? 9
What next for this research?
Diagnostic analysis of teacher retention and turnover patterns on the workforce
This research project aims to gain a deeper understanding of the dynamics within the teacher workforce in England. The study will inform policy makers and system leaders to help formulate effective responses to this complex issue and meet the challenge of increasing demand for teachers. The research project is divided in to two stages, which will each explore different aspects of the teacher labour market.
Teacher workforce dynamics in the school sector In the first stage of the project we analysed data from the School Workforce Census to determine the key factors associated with teachers leaving the profession and moving within the sector in England. The Interim Report was published in October 2017.
Teacher labour market behaviour and comparisons with other professions We are now in the second stage of the project and are undertaking new statistical analysis using data from the Understanding Society survey to examine the external and personal factors that are associated with teacher labour market behaviour. Using data analysis and stakeholder interviews, we will draw comparisons between teaching and other public sector professions, particularly nursing and policing. Further publications and a final report will be published in spring 2018. Find out more about this project and sign up to receive reports when they are available at: www.nfer.ac.uk/research/teaching-workforce-dynamics/ This project is being funded by the Nuffield Foundation, but the views expressed are those of the authors and not necessarily those of the Foundation.
Teacher Retention and Turnover Research. Research Update 3: Is the Grass Greener Beyond Teaching? 10
Appendix Definition of a teacher in Understanding Society
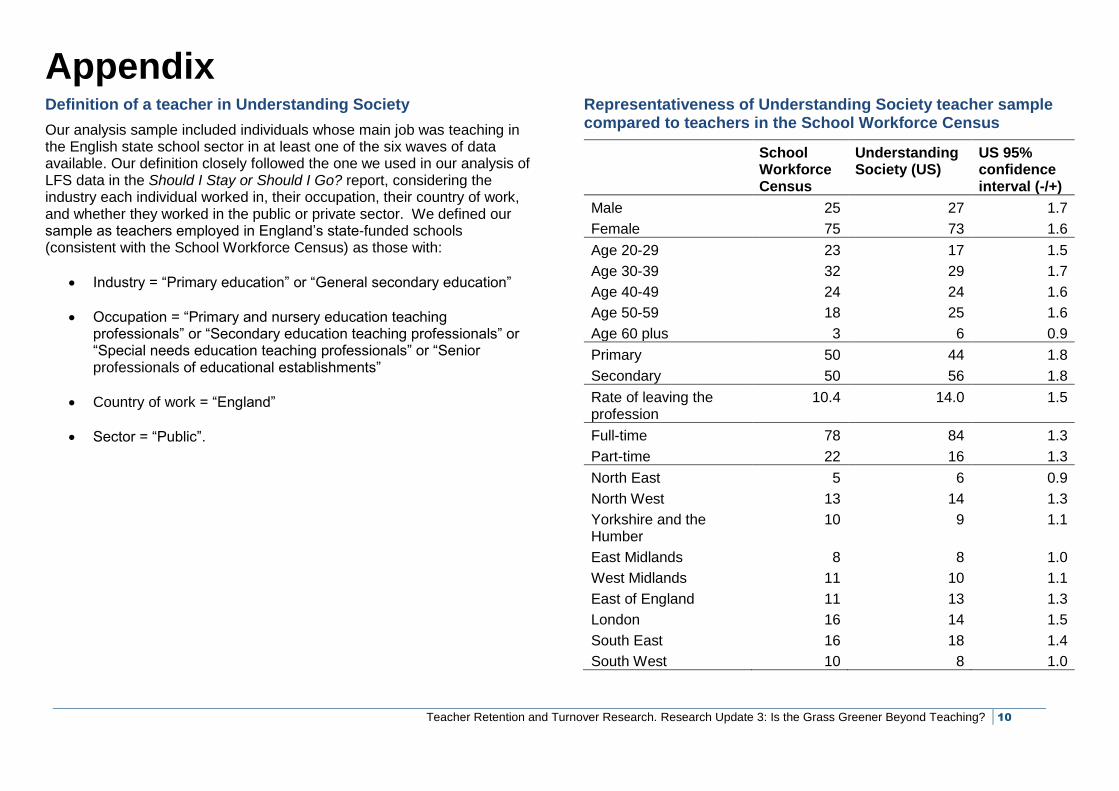
Our analysis sample included individuals whose main job was teaching in the English state school sector in at least one of the six waves of data available. Our definition closely followed the one we used in our analysis of LFS data in the Should I Stay or Should I Go? report, considering the industry each individual worked in, their occupation, their country of work, and whether they worked in the public or private sector. We defined our sample as teachers employed in England’s state-funded schools (consistent with the School Workforce Census) as those with:
Industry = “Primary education” or “General secondary education”
Occupation = “Primary and nursery education teaching professionals” or “Secondary education teaching professionals” or “Special needs education teaching professionals” or “Senior professionals of educational establishments”
Country of work = “England”
Sector = “Public”.
Representativeness of Understanding Society teacher sample compared to teachers in the School Workforce Census
School Workforce Census
Understanding Society (US)
US 95% confidence interval (-/+)
Male 25 27 1.7
Female 75 73 1.6
Age 20-29 23 17 1.5
Age 30-39 32 29 1.7
Age 40-49 24 24 1.6
Age 50-59 18 25 1.6
Age 60 plus 3 6 0.9
Primary 50 44 1.8
Secondary 50 56 1.8
Rate of leaving the profession
10.4 14.0 1.5
Full-time 78 84 1.3
Part-time 22 16 1.3
North East 5 6 0.9
North West 13 14 1.3
Yorkshire and the Humber
10 9 1.1
East Midlands 8 8 1.0
West Midlands 11 10 1.1
East of England 11 13 1.3
London 16 14 1.5
South East 16 18 1.4
South West 10 8 1.0
Teacher Retention and Turnover Research. Research Update 3: Is the Grass Greener Beyond Teaching? 11
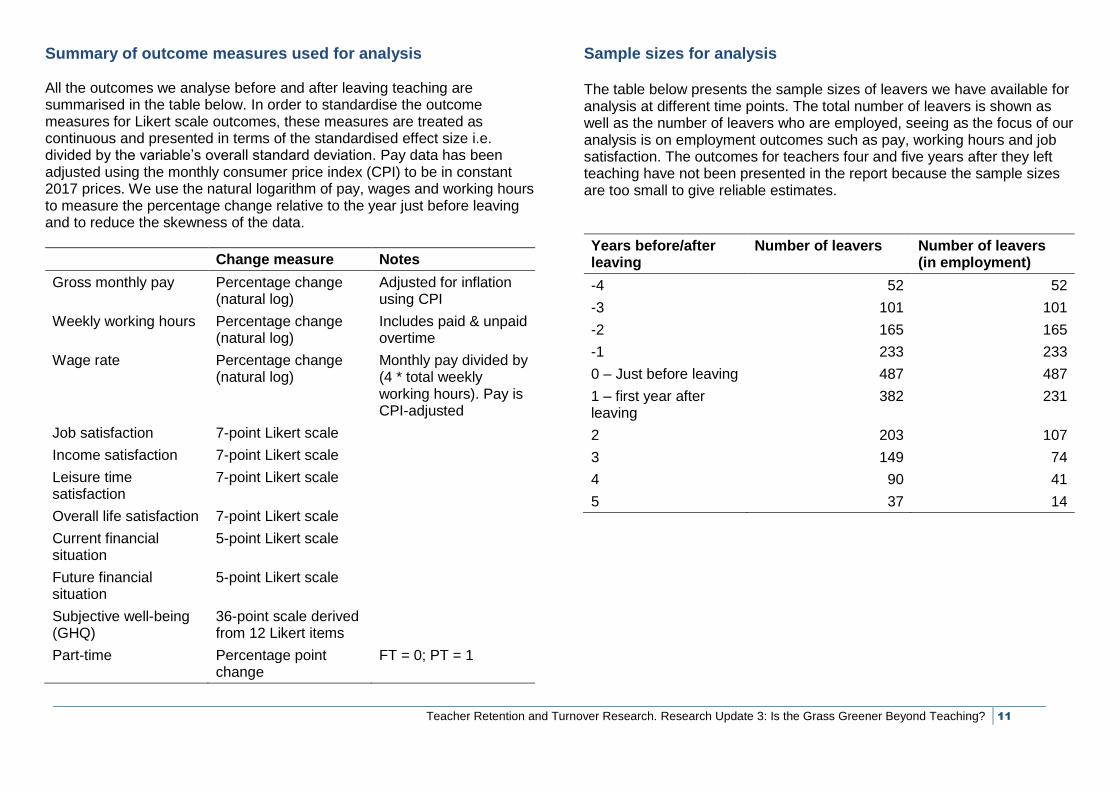
Summary of outcome measures used for analysis All the outcomes we analyse before and after leaving teaching are summarised in the table below. In order to standardise the outcome measures for Likert scale outcomes, these measures are treated as continuous and presented in terms of the standardised effect size i.e. divided by the variable’s overall standard deviation. Pay data has been adjusted using the monthly consumer price index (CPI) to be in constant 2017 prices. We use the natural logarithm of pay, wages and working hours to measure the percentage change relative to the year just before leaving and to reduce the skewness of the data.
Change measure Notes
Gross monthly pay Percentage change (natural log)
Adjusted for inflation using CPI
Weekly working hours Percentage change (natural log)
Includes paid & unpaid overtime
Wage rate Percentage change (natural log)
Monthly pay divided by (4 * total weekly working hours). Pay is CPI-adjusted
Job satisfaction 7-point Likert scale
Income satisfaction 7-point Likert scale
Leisure time satisfaction
7-point Likert scale
Overall life satisfaction 7-point Likert scale
Current financial situation
5-point Likert scale
Future financial situation
5-point Likert scale
Subjective well-being (GHQ)
36-point scale derived from 12 Likert items
Part-time Percentage point change
FT = 0; PT = 1
Sample sizes for analysis The table below presents the sample sizes of leavers we have available for analysis at different time points. The total number of leavers is shown as well as the number of leavers who are employed, seeing as the focus of our analysis is on employment outcomes such as pay, working hours and job satisfaction. The outcomes for teachers four and five years after they left teaching have not been presented in the report because the sample sizes are too small to give reliable estimates.
Years before/after leaving
Number of leavers Number of leavers (in employment)
-4 52 52
-3 101 101
-2 165 165
-1 233 233
0 – Just before leaving 487 487
1 – first year after leaving
382 231
2 203 107
3 149 74
4 90 41
5 37 14

Teacher Retention and Turnover Research. Research Update 3: Is the Grass Greener Beyond Teaching? 12
Figures for additional outcomes Figure A1 Current financial situation before and after leaving teaching
Figure A2 Future financial situation before and after leaving teaching
Figure A3 Satisfaction with amount of leisure time before and after leaving teaching
Figure A4 Overall life satisfaction before and after leaving teaching
-0.6
-0.4
-0.2
0.0
0.2
0.4
0.6
-4 -3 -2 -1 0 1 2 3
Change in current
financial situation
(effect size)
-0.6
-0.4
-0.2
0.0
0.2
0.4
-4 -3 -2 -1 0 1 2 3
Change in future
financial situation
(effect size)
Years before/ after leaving teaching
-0.2
0
0.2
0.4
0.6
0.8
-4 -3 -2 -1 0 1 2 3
Change in leisure time satisfaction (effect size)
-0.4
-0.2
0
0.2
0.4
0.6
0.8
-4 -3 -2 -1 0 1 2 3
Change in overall life
satisfaction (effect size)
Years before/ after leaving teaching

Teacher Retention and Turnover Research. Research Update 3: Is the Grass Greener Beyond Teaching? 13
ReferencesDepartment for Education (2017a). Teachers Analysis Compendium 2: Analysis of School and Teacher Level Factors Relating To Teacher Supply. London: DfE [online]. Available: https://www.gov.uk/government/statistics/teachers-analysis-compendium-2 [21 November, 2017].
Department for Education (2017b). Teacher Workload Survey 2016. London: DfE [online]. Available: https://www.gov.uk/government/publications/teacher-workload-survey-2016 [21 November, 2017].
Department for Education (2017c). School Teachers’ Pay and Conditions Document 2017 and Guidance on School Teachers’ Pay and Conditions. London: DfE [online]. Available: https://www.gov.uk/government/publications/school-teachers-pay-and-conditions [21 November, 2017].
Gu, Q., Day, C., Lamb, H., Leithwood, K., Sammons, P., Neat, S., Armstrong, P. and Hagger-Vaughan, L. (2015). Why Teachers Leave and Return: Report on The Feasibility Study. London: DfE [online]. Available: https://www.gov.uk/government/publications/why-teachers-leave-and-return-feasibility-study [21 November, 2017].
Lynch, S., Worth, J., Bamford, S. and Wespieser, K. (2016). Engaging Teachers: NFER Analysis of Teacher Retention. Slough: NFER [online]. Available: https://www.nfer.ac.uk/publications/LFSB01 [21 November, 2017].
Sellen, P. (2016). Teacher Workload and Professional Development in England’s Secondary Schools: Insights from TALIS. London: EPI [online]. Available: https://epi.org.uk/wp-content/uploads/2016/10/TeacherWorkload_EPI.pdf [21 November, 2017].
Sims, S. (2017). TALIS 2013: Working Conditions, Teacher Job Satisfaction and Retention. London: DfE [online]. Available: http://dera.ioe.ac.uk/30448/1/TALIS_2013_Evidence_on_Working_Conditions_Teacher_Job_Satisfaction_and_Retention_Nov_2017.pdf [21 November, 2017].
University of Essex. Institute for Social and Economic Research, NatCen Social Research, Kantar Public. (2016). Understanding Society: Waves 1-6, 2009-2015. [data collection]. 8th Edition. UK Data Service. SN: 6614. [online]. Available: http://doi.org/10.5255/UKDA-SN-6614-9 [21 November, 2017].
Ward, H. (2017). More Than £500K To Bring 49 Teachers Back To The Profession. London: TES [online]. Available: https://www.tes.com/news/school-news/breaking-news/exclusive-more-ps500k-bring-49-teachers-back-profession [21 November, 2017].
Worth, J., Bamford, S. and Durbin, B. (2015). Should I Stay or Should I Go? NFER Analysis of Teachers Joining and Leaving the Profession. Slough: NFER [online]. Available: https://www.nfer.ac.uk/publications/LFSA01/ [21 November, 2017].
Worth, J., De Lazzari, G., and Hillary, J. (2017). Teacher Retention and Turnover Research: Interim Report. Slough: NFER [online]. Available: https://www.nfer.ac.uk/publications/NUFS03/ [21 November, 2017].
Teacher Retention and Turnover Research. Research Update 3: Is the Grass Greener Beyond Teaching? 14
Public
NFER ref. NUFS ISBN. 978-1-911039-66-2