Teacher Job Satisfaction as Related to Student Performance ...
145
Lindenwood University Lindenwood University Digital Commons@Lindenwood University Digital Commons@Lindenwood University Dissertations Theses & Dissertations Summer 6-2017 Teacher Job Satisfaction as Related to Student Performance on Teacher Job Satisfaction as Related to Student Performance on State-Mandated Testing State-Mandated Testing James Douglas Crawford Lindenwood University Follow this and additional works at: https://digitalcommons.lindenwood.edu/dissertations Part of the Educational Assessment, Evaluation, and Research Commons Recommended Citation Recommended Citation Crawford, James Douglas, "Teacher Job Satisfaction as Related to Student Performance on State- Mandated Testing" (2017). Dissertations. 173. https://digitalcommons.lindenwood.edu/dissertations/173 This Dissertation is brought to you for free and open access by the Theses & Dissertations at Digital Commons@Lindenwood University. It has been accepted for inclusion in Dissertations by an authorized administrator of Digital Commons@Lindenwood University. For more information, please contact [email protected].
Transcript of Teacher Job Satisfaction as Related to Student Performance ...
Lindenwood University Lindenwood University
Digital Commons@Lindenwood University Digital Commons@Lindenwood University
Dissertations Theses & Dissertations
Summer 6-2017
Teacher Job Satisfaction as Related to Student Performance on Teacher Job Satisfaction as Related to Student Performance on
State-Mandated Testing State-Mandated Testing
James Douglas Crawford Lindenwood University
Follow this and additional works at: https://digitalcommons.lindenwood.edu/dissertations
Part of the Educational Assessment, Evaluation, and Research Commons
Recommended Citation Recommended Citation Crawford, James Douglas, "Teacher Job Satisfaction as Related to Student Performance on State-Mandated Testing" (2017). Dissertations. 173. https://digitalcommons.lindenwood.edu/dissertations/173
This Dissertation is brought to you for free and open access by the Theses & Dissertations at Digital Commons@Lindenwood University. It has been accepted for inclusion in Dissertations by an authorized administrator of Digital Commons@Lindenwood University. For more information, please contact [email protected].

Teacher Job Satisfaction as Related
to Student Performance on
State-Mandated Testing
by
James Douglas Crawford
June 2017
A Dissertation submitted to the Education Faculty of Lindenwood University in
partial fulfillment of the requirements for the degree of
Doctor of Education
School of Education

Teacher Job Satisfaction as Related
to Student Performance on
State-Mandated Testing
by
James Douglas Crawford
This Dissertation has been approved as partial fulfillment
of the requirements for the degree of
Doctor of Education
Lindenwood University, School of Education
Date
Date
Date
nsen, Dissertation Chair

Declaration of Originality
I do hereby declare and attest to the fact that this is an original study based solely upon
my own scholarly work at Lindenwood University and that I have not submitted it for
any other college or university course or degree.
Full Legal Name: James Douglas Crawford

ii
Acknowledgements
I would like to sincerely thank my Dissertation Chair, Dr. Shelly Fransen; her
commitment to my research was unprecedented. She was there with me through the
entire research project to help me grow as an educator and a researcher, and her advice
was professional and encouraging. I would also like to express gratitude to Dr. Sherry
DeVore for the direction she gave me throughout this process. Dr. Shannon Snow also
deserves my thanks as a committee member and as my superintendent. Her support and
encouragement for me has gone above and beyond what I expected.
I would like to thank the administration and staff of Southwest Missouri
Conference schools for participating in this research project. I would also like to thank
all of the elementary staff and administration at Stockton R-1 Schools who were
genuinely supportive of my goal to become a doctoral graduate.
A special thanks goes to my mom and dad, who have been there for me
throughout all of my life, both personally and professionally. Finally, I would like to
thank my beautiful wife, who has made many sacrifices throughout this process. I have
spent many long nights away from home while she was there to cook dinner, help our
children with school work, and tuck-in our toddler many nights. She encouraged me
when I did not have the ambition to work and pushed me through. Her support and
prayers have encouraged me through this entire process.

iii
Abstract
The growing demand placed upon educators has taken a toll on the profession (Walker,
2014). Teacher burnout, stress, and unhappiness may be predestined unless
administrators recognize how to prevent these from happening (Elias, 2012). The intent
of this quantitative study was to survey teachers in southwest Missouri to determine their
level of job satisfaction as it relates to student performance on state-mandated
assessments. The survey included items designed to collect data on overall level of
teacher job satisfaction in relation to demographic areas of age range, gender, level of
education, years of teaching experience, subject areas taught, and salary range. The first
research question was designed to determine the correlation between high school teacher
job satisfaction and high school student achievement. Based on this research, there was a
relationship between teacher job satisfaction and Missouri Performance Index scores.
The second research question was designed to determine the correlation between teacher
job satisfaction and years of experience, salary, age, level of education, and gender.
Based on the data collected, there was a correlation between teacher job satisfaction and
years of experience and between teacher job satisfaction and the age of the educator.
However, there was no correlation between teacher job satisfaction and level of
education, nor between teacher job satisfaction and gender. Research question three was
posed to determine if there was a difference in teacher job satisfaction between those
teachers required to administer end-of-course (EOC) exams and teachers who were not
required to administer EOC exams. The research determined there was no difference in
job satisfaction between the two groups.

iv
Table of Contents Abstract …………………………………………………………………………………..iii
List of Tables …………………………………………………...……………………….vii
List of Figures …………………………………………………………………………..viii
Chapter One: Introduction ………………………………………………………………..1
Background of the Study ………………………………………………………....2
Theoretical Framework …………………………………………………………...3
Statement of the Problem …………………………………………………………5
Purpose of the Study ……………………………………………………………...6
Research Questions and Hypotheses……………………………………...7
Significance of Study……………………………………………………………...8
Definition of Key Terms ……………………………………….………..………..8
Limitations and Assumptions …………………………………….………………9
Summary ……………………………………………………………………...…10
Chapter Two: Review of Literature …………………………………………………..…12
Theoretical Framework.…………………..……….……………………………..12
General Job Dissatisfaction………………………………………………………15
Job Satisfaction and Job Performance.…………………………………………..19
Testing……………………………………………………………………………22
Administrative Support…………………………………………………………..23
Key Factors in Teacher Job Satisfaction…………………………………………26
Student Behavior…………………………………………………………………28
School Atmosphere and Workplace Conditions…………………………………30

v
Teacher Self-Efficacy……………………………………………………………32
Salary and Benefits………………………………………………………………34
Teacher Age and Gender………………………………………………………...35
School/Class Size………………………………………………………………...37
Summary ………………………………………………………………………...38
Chapter Three: Methodology ……………………………………………………………41
Problem and Purpose Overview …………………………………………………41
Research Questions and Hypotheses ……………………………………42
Research Design …………………………………………………………………43
Ethical Considerations…………………………………………………………...43
Population and Sample ...………………………………………………………..44
Instrumentation ……………………………………………………………...…..45
Data Collection ……………………………………………………………..…...46
Data Analysis …………………………………………………………….…..….46
Summary ……………………………………………………………….………..48
Chapter Four: Analysis of Data ………………………………………………….…...…51
Teacher Demographic Information….…………………………………………...52
Research Question One………………………………….……………………….55
Research Question Two………………………………………………………….66
Research Question Three………………………………………………………...76
Summary ………………………………………………………………….……..78
Chapter Five: Summary and Conclusions ………………………………………………80

vi
Findings …………………………………………………………………………81
Conclusions …………………………………………………………………......82
Implications for Practice ……………………………………………………...…85
Recommendations for Future Research …………………………………..……..93
Summary …………………………………………………………………...……95
Appendix A ………………………………………………………….………………....101
Appendix B ……………………………………………………………….……………103
Appendix C……………………………………………………………………………..104
Appendix D……………………………………………………………………………..106
Appendix E……………………………………………………………………………..108
Appendix F……………………………………………………………………………..110
References ……………………………………………………………………………..111
Vita …………………………………………………………………………………….133

vii
List of Tables
Table 1. Herzberg’s Motivation-Hygiene Theory Factors Impacting Job Attitudes……..17
Table 2. Percentage of Teachers by Age………………………………………………….......53
Table 3. Percentage of Teachers by Gender…………………………………………………..53
Table 4. Percentage of Teachers by Level of Education……………………………………..54
Table 5. Percentage of Teachers by Years of Experience……………………………………54
Table 6. Central Tendency Data for Teacher Job Satisfaction…………………………......77

viii
List of Figures
Figure 1. Job satisfaction scores for survey statement one……………………………...56
Figure 2. Job satisfaction scores for survey statement two……………………………...57
Figure 3. Job satisfaction scores for survey statement three ……………………………58
Figure 4. Job satisfaction scores for survey statement four……………………………..59
Figure 5. Job satisfaction scores for survey statement five……………………………...60
Figure 6. Job satisfaction scores for survey statement six……………………………….61
Figure 7. Job satisfaction scores for survey statement seven……………………………62
Figure 8. Job satisfaction scores for survey statement eight…………………………….63
Figure 9. Total job satisfaction scores for teachers participating in the survey…………64
Figure 10. Scatterplot of correlation between teacher job satisfaction scores and
Missouri Performance Index scores………………………………………….66
Figure 11. 3D view of the contingency table for teacher job satisfaction and years of
experience ……………………………………………………………..…….67
Figure 12. Average teacher job satisfaction score by years of experience………………68
Figure 13. 3D view of the contingency table for teacher job satisfaction and salary……69
Figure 14. Average teacher job satisfaction scores by salary……………………………70
Figure 15. 3D view of the contingency table for teacher job satisfaction and age………71
Figure 16. Average teacher job satisfaction scores by age………………………………72
Figure 17. 3D view of the contingency table for teacher job satisfaction and level of
education……………………………………………………………………..73
Figure 18. Average teacher job satisfaction scores by level of education………………74

ix
Figure 19. 3D view of contingency table for teacher job satisfaction and gender………75
Figure 20. Average teacher job satisfaction scores by gender…………………………..76

Chapter One: Introduction
Student test scores and teacher job satisfaction continue to be a focal point of
many educators across the country (Walker, 2014). Specifically, Missouri educators have
increased pressures placed upon them because state and federal funding is directly tied to
student performance (Singer, Lloyd, & Stanley, 2015). As a result, all educators continue
to explore strategies to increase student performance (Walker, 2014). This has a direct
impact on the stresses and pressures placed upon teachers and students (Chamundeswari,
2013). As these pressures mount, teacher job satisfaction becomes a clear concern, along
with student performance (Chamundeswari, 2013).
According to Wang (2013), “Teachers’ self-efficacy is an important predictor of
adjustment in teachers with respect to burnout, job satisfaction, and intentions to quit” (p.
80). Furthermore, Wang (2013) determined, “The higher the level of teachers’ beliefs
that they are capable of engaging their students, using various instructional strategies, and
managing the classrooms, the higher their level of their job satisfaction and lower the
possibility of burnout and quitting” (p. 80). A teacher’s ability to engage students is a
major predictor of teacher job satisfaction (Wang, 2013).
Markow, Macia, and Lee (2013) stated, “Teachers are widely acknowledged as
the most important school-related factor influencing student achievement. Second only
to families, they may have the greatest influence on young lives and aspirations” (p. 41).
The theoretical background and methodology of this research allowed the investigator to
determine if there is a correlation between teacher job satisfaction and student
achievement. Age, gender, and student performance were all areas of focus. Data were

2
collected to determine if teacher job satisfaction has a direct impact on student
performance.
In this chapter, a background of the study, theoretical framework, and statement
of the problem are presented. An explanation of the purpose of the study, research
questions, definitions of key terms, and limitations and assumptions are also offered.
Chapter One concludes with a summary and a description of highlights to come in
subsequent chapters.
Background of the Study
Teacher satisfaction may impact student achievement; therefore, administrators
may be able to improve student achievement by improving teacher satisfaction (DuFour
& Mattos, 2013). Retention of teachers may also be impacted by improving teacher
satisfaction (DuFour & Mattos, 2013). Markow et al. (2013) acknowledged, “It is
important to note that the expertise and experience of teachers as well as their time and
attention, morale, and innovation, are all important resources for the success of students,
principals and schools” (p. 41). Improvement in teacher satisfaction may persuade
teachers to stay on the job and prevent students from being left in the hands of
underqualified or less-experienced teachers (OECD, 2016). Education is challenged by
high teacher turnover rates (Morello, 2014). Teacher attrition and retention are directly
related to job satisfaction and intrinsic variables (Perrachione, Petersen, & Rosser, 2008).
The intended purpose of this study was to determine if teacher job satisfaction has
an impact on student academic achievement. Wang (2013) found, “When teachers had a
stronger belief that they could motivate their students in the learning process, they tended
3
to be more satisfied with their job, less willing to leave the teaching profession, and had
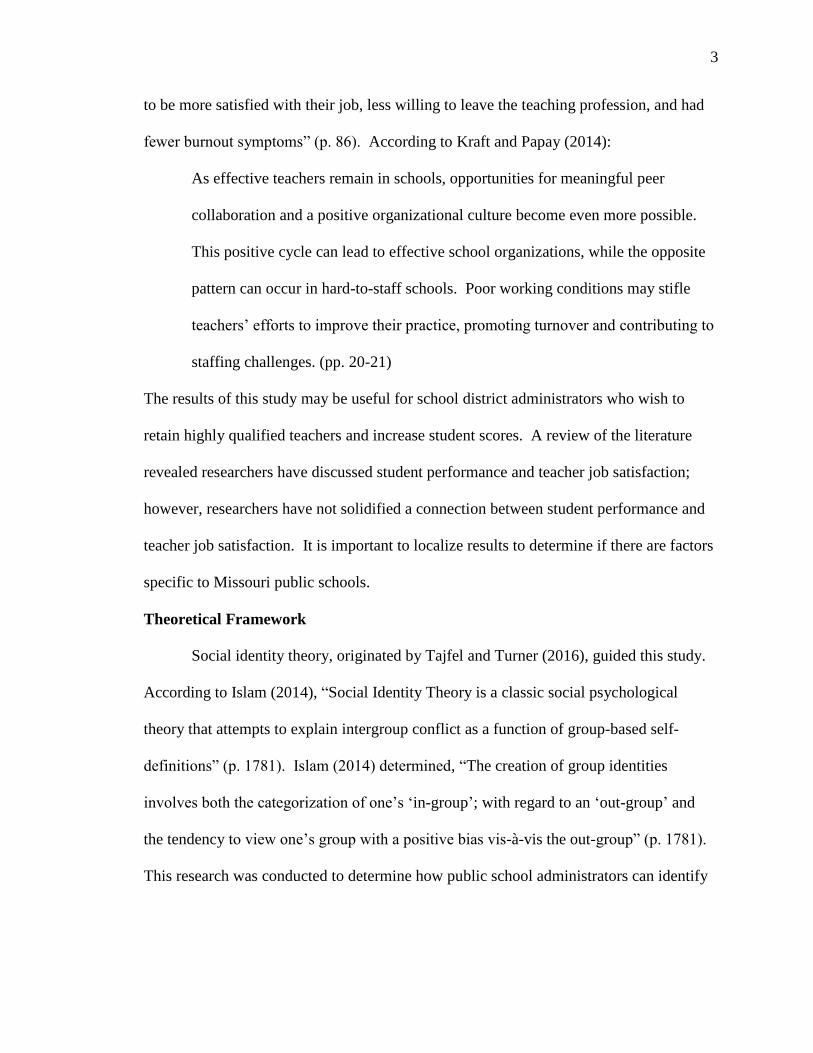
fewer burnout symptoms” (p. 86). According to Kraft and Papay (2014):
As effective teachers remain in schools, opportunities for meaningful peer
collaboration and a positive organizational culture become even more possible.
This positive cycle can lead to effective school organizations, while the opposite
pattern can occur in hard-to-staff schools. Poor working conditions may stifle
teachers’ efforts to improve their practice, promoting turnover and contributing to
staffing challenges. (pp. 20-21)
The results of this study may be useful for school district administrators who wish to
retain highly qualified teachers and increase student scores. A review of the literature
revealed researchers have discussed student performance and teacher job satisfaction;
however, researchers have not solidified a connection between student performance and
teacher job satisfaction. It is important to localize results to determine if there are factors
specific to Missouri public schools.
Theoretical Framework
Social identity theory, originated by Tajfel and Turner (2016), guided this study.
According to Islam (2014), “Social Identity Theory is a classic social psychological
theory that attempts to explain intergroup conflict as a function of group-based self-
definitions” (p. 1781). Islam (2014) determined, “The creation of group identities
involves both the categorization of one’s ‘in-group’; with regard to an ‘out-group’ and
the tendency to view one’s group with a positive bias vis-à-vis the out-group” (p. 1781).
This research was conducted to determine how public school administrators can identify
4
with staff to help improve teacher job satisfaction. Ideally, the improvement of teacher
job satisfaction will increase student performance on state-mandated testing.
Tajfel and Turner (2016) stated, “Social identity theory proposes that a person’s
sense of who they are depends on the groups to which they belong” (p. 115). Islam
(2014) recognized:
Cognitive grouping involves ‘judgmental accentuation’ where cognitive
categories lead to the increased salience of distinguishing features between
categories, exaggerating category differences. Applied to social groups, this
principle could be used to explain biased and exaggerated perceptions of
difference between groups. (p. 1781)
Furthermore:
Tajfel and Turner’s social identity theory explains that part of a person’s concept
of self comes from the groups to which that person belongs. An individual does
not just have a personal selfhood, but multiple selves and identities associated
with their affiliated groups. (“Social Identity Theory,” 2016, para. 4)
Ashforth and Mael (1989) researched a deeper understanding of social identity theory.
Ashforth and Mael (1989) surmised people are inclined to categorize themselves and
others into a range of different social categories, such as membership in organizations,
religious affiliation, age, and gender.
Islam (2014) discovered, “Because social identity effects are based on protection
and enhancement of self-concepts, threat to the self-concept would intuitively be related
to the strongest identity effects” (p. 1781). Organizational psychologists have found

5
social identity very useful in creating a focus on organizational commitment and
organizational identification (Ashforth & Mael, 1989). Social psychology has been
impacted by social identity theory (“Social Identity Theory,” 2017). Social identity
theory has been investigated in various fields and different surroundings (“Social Identity
Theory,” 2017). It is inclusive of “prejudice, stereotyping, negotiation and language use.
The theory has also implications on the way people deal with social and organizational
change” (“Social Identity Theory,” 2017, para. 6). Islam (2014) confirmed, “Several
laboratory and field studies have empirically confirmed that when groups pose a threat to
one another, the effects of identification increase” (p. 1781). For this reason, negative
depictions of one group by another group can cause competition between the groups
(Islam, 2014).
Statement of the Problem
According to Markow et al. (2013), “In the classroom, teachers have developed as
coaches of learning rather than as simply transmitters of knowledge” (p. 41). Teachers
have become mentors to new educators and transfer a wealth of knowledge in areas such
as instruction, professional development, and curriculum (Markow et al., 2013). Dickens
(2010) suggested further study in this area in order to “provide information to narrow the
findings of teacher job satisfaction to more distinct groups of individuals” (p. 149). This
study involved data collection in the areas of teacher gender, subjects taught, years of
experience, teacher age range, and student grade level.
Markow et al. (2013) suggested:
6
In the context of additional challenges for leading schools toward greater
improvement, the continuing decline in teacher morale identifies itself as an
urgent priority. During a time when expectations and standards are increasing
for effective teaching and learning, teacher morale is yet another declining
resource, one that is associated with schools with diminished budgets and other
resources, fewer students meeting standards and fewer colleagues highly rated for
how well they are doing their job. Teacher leadership emerges as a potential
resource for translating big challenges into opportunities, served by hybrid roles
for teachers as leaders and as a method for addressing professional growth and
satisfaction. (p. 51)
When teachers experience a high level of job satisfaction, morale is improved and student
learning increases (Markow et al., 2013). Pendino (2012) recommended analyzing
survey responses from teachers in different subject areas and with different years of
experience. Wang (2013) suggested using professional development in such a way that
teachers would have the opportunity to reflect not only on “how to teach and how to
better regulate their students’ behaviours, but more importantly, how to better motivate
their students” (p. 87). Further study will help researchers determine more specific
findings to connect teacher job satisfaction to student performance.
Purpose of the Study
The purpose of this study was to determine if there is a connection between
teacher job satisfaction and student test scores. Teachers in a southwest Missouri
conference were surveyed. Survey results were categorized based upon teacher

7
demographic information or teacher job satisfaction data. Data were then collected from
the Missouri Department of Elementary and Secondary Education (MODESE) (2017).
With new regulations placed upon teachers daily, it is difficult to maintain positive
morale (Ravitch, 2016). Testing anxieties appear to be growing with the increased
national emphasis on uniform testing (American Test Anxieties Association, 2017).
Research questions and hypotheses. The following research questions guided
the study:
1. What is the correlation between high school teacher job satisfaction and high
school student achievement?
H10: There is no correlation between high school teacher job satisfaction and high
school student achievement.
H1a: There is a correlation between high school teacher job satisfaction and high
school student achievement.
2. What is the correlation between teacher job satisfaction and years of
experience, salary, age, level of education, and gender?
H20: There is no correlation between teacher job satisfaction and years of
experience, salary, age, level of education, and gender.
H2a: There is a correlation between teacher job satisfaction and years of
experience, salary, age, level of education, and gender.
3. What is the difference in job satisfaction between teachers who are required to
administer end-of-course (EOC) exams and those who are not required to administer end-
of-of-course exams?

8
H30: There is no significant difference in job satisfaction between teachers who
are required to administer end-of-course (EOC) exams and those who are not required to
administer end-of-of-course exams.
H3a: There is a significant difference in job satisfaction between teachers who are
required to administer end-of-course (EOC) exams and those who are not required to
administer end-of-of-course exams.
Significance of Study
This research may support those faced with the daunting task of educating
students in the future under specific guidelines. Gu (2016) suggested, “More
demographic data could be included in the research to explore the relationship between
other teacher characteristics and job satisfaction, such as teaching subject, gender, and
education background” (p. 16). To date, there is little research showing a direct
correlation between teacher job satisfaction and student achievement.
McNeill (2016) suggested further research in the area of the impact of teacher
demographics on job satisfaction. In this current study, educator demographics were
collected through a survey to determine if a correlation exists between teacher job
satisfaction and years of service, salary, age, and gender to answer research question two.
Teacher job satisfaction data and end-of-course exam data for Algebra I and English II
from corresponding schools were used to answer research questions one and three.
Definition of Key Terms
For the purposes of this study, the following terms are defined:

9
Job satisfaction. Job satisfaction is a worker’s attitude toward all aspects of
work and the work environment (Bin, 2015).
Student achievement. Student achievement is quantified as the percentage of
students scoring Advanced, Proficient, Basic, and Below Basic as measured by the
Missouri end-of-course exam (Missouri Department of Elementary and Secondary
Education [MODESE], 2014).
Limitations and Assumptions
The following limitations were identified in this study:
Sample demographics. Teachers and students affiliated with only one southwest
Missouri conference participated in this study. The participants were from schools of
similar size and demographics. Additional factors that may influence teacher job
satisfaction and student performance on state-mandated assessments might be present for
participants of other demographics.
Sample size. The small sample size is a limitation in comparison with the total
number of Missouri public school districts.
Instrument. The survey was created by the researcher.
Timeframe. Due to the fact the Missouri end-of-course exam contents have
varied over the years, Missouri Performance Index scores from multiple years may not
generate valid or comparable results.
The following assumptions were accepted:
1. The responses of the participants were offered honestly and without bias.
2. District administration of state-wide assessments followed testing protocol.

10
3. The Missouri end-of-course exam is a measure of student achievement.
Summary
This quantitative study was guided by social identity theory. Social identity
theory “is an individual-based perception of what defines the ‘us’ associated with
any internalized group membership. This can be distinguished from the notion of
personal identity which refers to self-knowledge that derives from the individual’s unique
attributes” (“Social Identity Theory,” 2017, para. 2).
Chapter One included the background information and an historical basis for the
research. The theoretical framework was presented and a relationship to the study was
developed. The statement of the problem and purpose of the study were identified. The
study was focused on three research questions and corresponding hypotheses, which were
also introduced in Chapter One. Key terms were defined, and limitations and
assumptions were detailed.
Chapter Two includes a review of the literature and a more thorough investigation
of the theoretical framework for the research. Different studies are introduced to shed
light on both job dissatisfaction and job satisfaction and how job performance is affected
by each. The role of both high-stakes testing and administrative support are examined.
Furthermore, the key factors affecting teacher job satisfaction are reviewed, and the role
student behavior plays is investigated. Finally, teacher self-efficacy is discussed along
with salary/benefits, teacher age and gender, and class size.
In Chapter Three, the methodology used in this quantitative study is described.
An overview of the problem and purpose of the study is presented. Descriptions of the

11
population and sample are provided, as well as the instrumentation and analysis process.
Chapter Four presents the results of the study, and Chapter Five includes conclusions and
recommendations based on the results and data analysis.
12
Chapter Two: Review of Literature
In order to achieve school objectives, administrators must be willing to help
individual staff members reach the highest possible level of achievement and
performance (Cordeiro & Cunningham, 2012). Researchers Webb and Norton (2013)
suggested the quality of education programs in large part depends upon (1) the quality of
human resources within the system; (2) the extent productive human relationships are
realized; and (3) the development, motivation, and utilization of existing human qualities.
Administrators should hire high-quality people and keep them motivated through
fulfilling relationships so quality educational programs can be developed (Webb &
Norton, 2013).
For the purpose of this research, the literature review is focused on factors
affecting job satisfaction and how job satisfaction relates to student performance and
achievement. Factors influencing teacher job satisfaction such as administrative support,
student behavior, school atmosphere, parental support, teacher autonomy, grade level
taught, age of teacher, experience, teacher efficacy, workplace conditions, salary, and
benefits are discussed in this chapter.
Theoretical Framework
Social identity theory, as interpreted by Sarbin (2013), is outlined in a three-
dimensional model. The reader must first distinguish between ascribed and achieved
status (Neeley, 2013). Ascribed status such as birth, age, and gender is given, while
achieved status is earned through an election, promotion, or appointment (Brown,
Richardson, Hargrove, & Thomas, 2016). Governmental organizations, military

13
establishments, and churches provide an idea of who one is and where one fits (Sarbin,
2013). People do not have the ability to choose whether they can obtain an ascribed
status or achieved status (Neeley, 2013).
Sarbin (2013) proposed a second dimension of value or valuation. Feedback,
whether negative, neutral, or positive, determines this dimension (Sarbin, 2013). School
administrators and their choices determine if achieved status is valued as negative or
positive (Seligman & Csikszentmihalyi, 2014). At times, the performance may be
determined as neutral (Sarbin, 2013). The third dimension is defined by how involved a
person is or was in the role (Sarbin, 2013). Sarbin (2013) referred to the fact a mother
has acquired status and must retain this status constantly.
Teachers in today’s society have mainly an attained status (Sarbin, 2013). A
person chooses his or her career and gains attained status (Barrick, Mount, & Li, 2013).
Teachers may change to achieved status based on their choices, which can lead to a richer
learning environment (Nilson, 2016). If a choice is made and perceived as negative by a
community, it may be interpreted as disrespect (Sarbin, 2013). The difference in grade
level also determines the type of role a teacher may play (Dana & Yendol-Hoppey,
2014). The teacher who works with young students may reward with a hug, while the
teacher who works with older children may reward with grades (Sarbin, 2013).
Acceptable grades do not have the impact on younger students they do on older students
(Brophy, 2013).
Students and teacher come to a compromise to build the relationship needed to be
successful (Sarbin, 2013). The teacher’s styles and differences also have in impact on the

14
esteem of the students (Schmeck, 2013). Sarbin (2013) believed lack of student success
is not solely based on a student having a learning disability. Instead, Sarbin (2013)
asserted lack of success, whether in remedial classes or regular education classes, is
dependent on the relationship between the teacher and the student. The reaction of the
teacher is what determines the success of each student (Burden, 2016).
Illeris (2014) detailed personal identity. Work, family, nationality, religion, and
work identities are all a part of the individual (Illeris, 2014). Adults who are stable have
an established identity (Steijn, 2014). According to Illeris (2014):
In adulthood, when a relatively stable identity has been developed, motivation
becomes a quite central issue in relation to possibilities of changes in the identity.
The type and strength of the motivation involved is crucial: Adults do not
transform elements of their identity if they do not have serious reasons for doing
so. These reasons may be internal, external, or both, but analytically, the
important thing is that transformations imply strong motivation and cannot be
expected to occur without such motivation. (p. 159)
While keeping teachers in mind, adults do not change their identities unless the
motivation is important to them (Bridges & Bridges, 2017). Teachers and their
supervisors are aware of this either unconsciously or consciously; a teacher uses this
knowledge to motivate students, and a supervisor uses this to motivate staff (Illeris,
2014).
Creating motivation instead of finding motivation is often a mistake made by both
teachers and administrators (Pinder, 2014). Motivation that is powerful enough to change

15
learning must be genuinely engrained in a person; it cannot simply be created or imposed
(Illeris, 2014). Illeris (2014) stated, “It is important to be aware that all learning, and
especially more demanding learning, very often will have to overcome learning barriers
in the form of defense or resistance” (p. 159). This is challenging, and in order for a
transformation of identity to occur, the change must be so strong it can be justified and
worth the energy (Illeris, 2014). Illeris (2014) also stated:
An especially strong part of this defense system is identity defense, which
protects us against too much transformative learning. This must be accepted,
understood, and respected – and again, the way to deal with this is not to employ
some cunning methods and activities but rather to try to detect whether the
learners actually have any serious interest in the intended transformations and, if
so, where these interests are subjectively rooted and how they can be addressed.
(p. 160)
Learners naturally protect themselves from becoming overwhelmed or unstable due to
constant changes, and teachers help them to overcome this by explaining how working
together can create change (Oakes, Lipton, Anderson, & Stillman, 2015). Identity does
not stand alone; rather, identity encompasses cognitive, emotional, social, and
environmental learning (Illeris, 2014).
General Job Dissatisfaction
Markow et al. (2013) found, “Teacher satisfaction has declined 23 percentage
points since 2008, from 62% to 39% very satisfied, including five percentage points since
last year, to the lowest level in 25 years” (p. 6). However, other than the aforementioned

16
study by Markow et al. (2013), very few studies have focused specifically on teacher job
satisfaction (Barlow, 2015). Markow et al. (2013) found:
Half (51%) of teachers report feeling under great stress several days a week,
an increase of 15 percentage points over 36% of teachers reporting that level
in 1985.
Less satisfied teachers are more likely than very satisfied teachers to be in
schools where budgets declined in the last 12 months (61% vs. 47%) and to
identify maintaining an adequate supply of effective teachers (58% vs. 43%)
and creating and maintaining an academically rigorous learning environment
(66% vs. 56%) as challenging or very challenging for school leaders.
Less satisfied teachers are more likely to be located in schools that had
declines in professional development (21% vs. 14%) and in time for
collaboration with other teachers (29% vs. 16%) in the last 12 months.
Nearly all teachers (97%) give high ratings to other teachers in their schools.
(p. 6)
Herzberg (1966) studied job satisfaction specifically and indicated job satisfaction and
job dissatisfaction are two separate factors. Workers find job satisfaction based on the
kind of work performed and the achievement they receive; workers experience job
dissatisfaction based on the circumstances affecting the work being performed (Herzberg,
1966). Addressing sources of dissatisfaction does not necessarily increase job
satisfaction (Herzberg, 1966). Herzberg (2003) determined there are six key factors that
influence job satisfaction (see Table 1).

17
Table 1
Herzberg’s Motivation-Hygiene Theory Factors Impacting Job Attitudes
Intrinsic Motivators
(Satisfaction)
Hygiene Factors
(Dissatisfaction)
Achievement
Recognition
Work itself
Responsibility
Advancement
Growth
Company policy and
administration
Supervision
Relationship with supervisor
Work conditions
Salary
Relationship with peers
Personal life
Relationship with subordinates
Status
Security
Note. Adapted from “One More Time: How Do You Motivate Employees?” by F.
Herzberg, 2003, Harvard Business Review, 81(1), pp. 87-96.
Several factors have been identified that indicate job satisfaction or the
contradictory concept of job dissatisfaction (Stello, 2011). Dissatisfaction was described
by Herzberg (1966) as the result of circumstances in which work is conducted. Sources
of dissatisfaction were labeled by Herzberg (1966), and he suggested if they are
addressed and corrected, the amount of job dissatisfaction is reduced. Additional

18
researchers elaborated sources as intrinsic and extrinsic factors with the latter being the
best predictor for job dissatisfaction (Mafini & Dlodlo, 2014).
Weiss (as cited in Riza, Ganzach, & Liu, 2015) indicated employee experiences at
work, over time, can form job outlooks such as work satisfaction or work dissatisfaction.
The setting where a teacher practices his/her craft does not impact dissatisfaction, but
other factors play a bigger role (Webster, McNeish, Scott, Maynard, & Haywood, 2012).
Professional fatigue can cause negative outcomes for schools, schoolchildren, culture,
and educators (Bitsadze & Japaridze, 2014). Teachers who experience weariness depend
on structure and routine (Bitsadze & Japaridze, 2014). Ward (2015) stated:
A slew of policies and technologies promising to dramatically revolutionize
teaching and education over the past decade has not only failed to produce desired
results, it has also led to a decline in teacher morale, with large numbers leaving
the profession. (para. 1)
A pleased, happy, and hardworking worker is the biggest asset of any institute (Pragya &
Sandeep, 2015). Effective human resource management and the creation of a positive
work atmosphere or culture effects not only the performance of a worker and the
organization but similarly affects the growth and development of the entire economy
(Cummings & Worley, 2014).
Organizational psychology, as well as the physical, mental, and social settings
where staff work together, all play a role in the effectiveness of the organization and any
increase in productivity (Jain & Kaur, 2014). The goal in creating job satisfaction is to
form a setting which ensures ease of effort and removes all causes of frustration,

19
apprehension, and worry (London, 2014). If the environment is pleasant, weariness and
boredom are minimized and work performance can be maximized (Jain & Kaur, 2014).
Work environment may be divided into three broad components: Physical
Environment, Mental Environment, and Social Environment (Frumkin, 2016). The
Physical Environment consists of noise, amenities, climate, and structures of the facilities
(Jain & Kaur, 2014). The Mental Environment consists of boredom, fatigue, monotony,
the behavior of colleagues, and the behavior of the supervisor (Jain & Kaur, 2014). The
Social Environment consists of the general behavior of the employees and how they are
expected to act (Jain & Kaur, 2014).
Job Satisfaction and Job Performance
Research involving Chinese employees indicated a caring climate predicts a
number of significant organizational results like job satisfaction, organizational
commitment, and job performance (Fu & Deshpande, 2014). The impact of a caring
climate is both direct and indirect (Labrague, McEnroe-Petitte, Papathanasiou, Edet, &
Arulappan, 2015). Fu and Deshpande (2014) undoubtedly reinforced the need for
Chinese organizations to use different approaches to creating a caring climate.
A caring climate is based on a genuine interest in the well-being of others in the
company (Labrague et al., 2015). Further research confirmed the positive, direct
influence of job satisfaction on employees’ organizational obligation and indirect
influence on job performance (Fu & Deshpande, 2014). Fu and Deshpande (2014)
supported the understanding it is meaningful for organizations to create strategies to
increase job satisfaction.
20
The approaches in China will be more successful when employees are conscious
the organization cares for them (Fu & Deshpande, 2014). Employees are more dedicated
to their organization and perform better if they feel they have shared values with an
employer who displays concern for them (Reijseger, Peeters, Taris, & Schaufeli, 2016).
Concerned climate perceptions are not changed by age, schooling, sex, type of job, or
experience at work; however, organizational commitment has a substantial direct
influence on the job performance of Chinese employees (Fu & Deshpande, 2014).
Bakotić (2016) noted job satisfaction is an exceptionally complex notion
subjective to different factors. More precisely, a group of elements that often have
intermingled impact (Bakotić, 2016). Job satisfaction more strongly governs
organizational performance than organizational performance governs job satisfaction
(Bakotić, 2016).
The majority of job satisfaction factors impact organizational performance (Fu &
Deshpande, 2014). Organizational success is something employees generally have no
chance to concretely realize or to directly benefit from, because successful businesses are
not required to give personnel any supplementary benefits arising from success of the
organization (Bakotić, 2016). Workers often receive identical wages and benefits,
regardless of how fruitful a company is (Okun, 2015). Bakotić (2016) made a substantial
contribution to research on the connection between job satisfaction and organizational
performance.
Javed, Balouch, and Hassan (2014) defined job satisfaction as “how content or
satisfied employees are with their jobs” (p. 121). Job loyalty and job satisfaction were

21
found to have a significant positive association (Mowday, Porter, & Steers, 2013).
Workplace environment was determined to have a significant impact on job satisfaction,
and job satisfaction also had a significant negative relationship to employees with the
intention of leaving the workplace (Javed et al., 2014).
Employees who feel empowered have a significant positive association with job
satisfaction (Lamm, Tosti-Kharas, & King, 2015). However, there is no connection
between employees with the intention to leave the workplace and employees who feel
empowered (Javed et al., 2014). Furthermore, Javed et al. (2014) found job satisfaction
has a direct correlation to job performance.
Managers who stress transparency, balanced processing, self-awareness, and
elevated ethical standards increase perceptions of empowerment for employees, which in
turn increases performance and job satisfaction (Wong & Laschinger, 2013). Leroy et al.
(2012) surmised employees who show their true selves in their place of employment are
more probable to feel their work-related performance resonates with who they truly are.
Work atmospheres that offer open access to materials, resources, backing, and
opportunities for learning and growth both empower and allow workers to accomplish
their work (Wong & Laschinger, 2013). Leaders who are not as likely to engage in ego-
defensive actions and instead put their real selves into play are more likely to fulfill an
employee’s basic needs (Leroy et al., 2012).
True and genuine leadership also makes it more probable workers will feel they
are the controllers of their work-related behaviors through the gratification of
rudimentary needs (Leroy et al., 2012). Genuine behavior on the part of employees is

22
more likely to be positively related to simple need satisfaction when those actions are
supported by genuine leader behaviors (Fullan, 2014). True leader behavior has been
shown to be synergistic, in that the mixture of genuine leadership and genuine employees
is related with advanced levels of basic need satisfaction (Leroy et al., 2012). The
fulfillment of these needs fosters motivation engrained within a core and stable sense of
self (Fullan, 2014). Transformational leadership allows leaders to transform followers
into leaders, and genuine leadership creates a framework in which employees can be true
to self (Ogbonnaya & Nielsen, 2016). By focusing on genuine employees per se,
researchers have shown preliminary insights into the distinctive processes whereby
genuine leadership relates to employee outcomes (Leroy et al., 2012).
Testing
According to Markow et al. (2013), principals put more emphasis on test data
than do teachers. Teachers focus more on the classroom experience (Markow et al.,
2013). Markow et al. (2013) concluded:
Principals are most likely to say that it is very important that a principal uses data
about student performance to improve instruction (85%) and has the ability to
lead the development of strong teaching capacity across the school (84%) in order
to be an effective school leader. In contrast, teachers are most likely to say that
having been a classroom teacher is very important (79%). Substantially fewer
teachers than principals indicate that it is very important that a principal uses data
about student performance to improve instruction in order to be an effective
leader (53% vs. 85%). Teachers are also less likely than principals to rate the

23
ability to lead the development of strong teaching capacity across the school as
very important (69% vs. 84%). (p. 25)
This emerging discrepancy between teachers and principals may be caused by the lack of
teaching experience of building principals (Simon & Johnson, 2015).
Most teachers and principals report students do not perform at or above grade
level in mathematics or communication arts (Bernhardt, 2003). Markow et al. (2013)
deduced, “Student performance at or above grade level varies widely based on school
resources and demographic characteristics” (p. 61). Markow et al. (2013) also found,
“Fewer educators in high-needs schools report that students perform at grade level” (p.
61). Finally, Markow et al. (2013) concluded, “Teachers and principals in schools where
the educators are doing an excellent job and have high morale are also more likely to
report higher levels of student performance” (p. 61). Educators with high job satisfaction
are more likely to report students are performing at a proficient or advanced level than
educators with low job satisfaction (Zee & Koomen, 2016).
Administrative Support
School leaders must be prepared to address the predictable questions and needs of
staff (DuFour & DuFour, 2013). School staff look for clarity on how they engage at
work (Earley & Porritt, 2014). The administrator must provide leadership about the
nature of the work, why it is important, how progress will be measured, strategies to
ensure success, confidence staff are doing the right work, and ways to avoid mistakes
(Hopkins, 2015). According to Markow et al. (2013):

24
Most principals say that their responsibilities today have changed compared to
five years ago and that the job has increased in complexity. Seven in 10 (69%)
principals disagree with the statement that a school principal’s responsibilities
today are very similar to his or her responsibilities five years ago. In schools
where most students are not performing at or above grade level in English
language arts and math, principals are more likely to hold this view than
principals in schools where most students are performing at or above grade level
(76% vs. 65%). (p. 23)
Furthermore, most principals feel the complexity of the job has become almost more than
they can handle (Seligman & Csikszentmihalyi, 2014)
Teachers can profit from systematic time together for staff-to-staff learning that
does not include planning specific instruction (Davis, 2015). Davis (2015) construed:
Yet, often overlooked in gauging the impact of expanded-time schools on student
learning is the equally beneficial effect that a longer day and year has on teachers.
Within an expanded schedule, teachers typically have many more collaboration
and professional-learning opportunities built into their workday. As teachers
work together to strengthen their teaching skills, they also can augment
instructional practice dramatically, and thus make their time with students even
more valuable. (para. 5)
National Staff Development Council Executive Director Dennis Sparks suggested 10% of
the school budget and 25% of teachers’ time should be used for professional learning
(Cordeiro & Cunningham, 2012).

25
Professional development is most effective when it relates to the interest and prior
knowledge of the learner, allows the learner to make a contribution, and makes the
learner feel he or she is an important part of something larger (Moon, 2013). According
to Cordeiro and Cunningham (2012), “Effective programs are ongoing, collaborative,
collegial and highly connected to what teachers are doing in their classrooms” (p. 317).
Providing professional development opportunities that embed these characteristics not
only makes learning effective for teachers, but also can increase teacher job satisfaction
(Hopkins, 2014).
Specifically, teachers are interested in developing and improving pedagogical
skills and classroom management strategies (Hopkins, 2015). The American Educational
Research Association cited seven out of eight studies indicated a positive correlation
between professional development and student achievement (Cordeiro & Cunningham,
2012). This correlation between professional development and student achievement ties
in with the idea of teacher empowerment (Harris et al., 2013).
Administrators can also provide support in other ways such as employee
assistance and wellness programs (Centers for Disease Control, 2013). Not only does
this type of support encourage job satisfaction, it is also a smart alternative, as it is less
expensive to provide help to good employees than it is to replace them (Cordeiro &
Cunningham, 2012). According to Cordeiro and Cunningham (2012), statistics indicate a
significant decrease in medical care costs and employee absenteeism as a result of
wellness programs. Individuals are searching for a purpose in their work that resonates
with who they are, is filling, and is appealing (Cormier, 2016). Therefore, from a social

26
identity theory perspective, organization-based self-esteem likely mediates the
relationship between organizational commitment and status judgments (Tajfel & Turner,
2016).
Key Factors in Teacher Job Satisfaction
According to Thibodeaux, Labat, Lee, and Labat (2015), teacher observation data
indicate more pressure is placed on subject areas tested by the state than on areas that are
not state-tested. Teachers feel this pressure, also (Thibodeaux et al., 2015). In regard to
intention, most teachers specify their plan is to continue in the teaching profession for the
upcoming school year (Thibodeaux et al., 2015). Incidentally, in Thibodeaux et al.’s
(2015) study, most teachers questioned were teachers who did not administer state-
measured subject-area exams. When considering teacher job satisfaction, the majority of
teachers responded the weight of high-stakes testing leads to teachers leaving the
profession (Thibodeaux et al., 2015).
Principals are usually supportive of new teachers through mentoring (Thibodeaux
et al., 2015). Teachers acknowledged to Thibodeaux et al. (2015) they found teaching at
their current grade levels gratifying and an intrinsic motivator. According to the data
collected by Thibodeaux et al. (2015), teachers seem to be more driven by the yearning to
achieve goals than they are to obtain rewards. There is a significant variance in principal
leadership styles and actions based on teachers’ intent to continue in the teaching
occupation (Thibodeaux et al., 2015). Findings have indicated principal leadership plays
a crucial role in the retention of teachers; therefore, administrators should be mindful of

27
how their leadership styles and actions impact the teachers they lead (Thibodeaux et al.,
2015).
Thibodeaux et al. (2015) showed there is no statistically noteworthy difference
between state-measured and non-state-measured subject-area teachers when exploring
teacher job satisfaction. Findings specified both non-state-measured teachers and state-
measured subject-area teachers expressed comparable perceptions with regard to job
satisfaction and their desire to remain in the teaching profession (Thibodeaux et al.,
2015). A substantial relationship exists between teacher job satisfaction, teacher morale,
and teacher mentoring programs and the desire to stay in the teaching profession
(Thibodeaux et al., 2015). Teachers have stated they continue in education due to student
success, satisfaction in their subject area, and the art of teaching (Thibodeaux et al.,
2015).
A lack of administrative backing, high teacher caseloads, and student discipline
are the three prominent reasons teachers leave the profession (Thibodeaux et al., 2015).
Teachers depend heavily on administrative backing to provide an atmosphere where they
experience a high level of job satisfaction (Kelly & Northrop, 2015). Most teachers exit
the profession for personal reasons and a lack of job satisfaction (Struyven &
Vanthournout, 2014). Teachers feel overwhelmed in completing their daily tasks to the
extent they are prepared to exit the teaching profession completely (Thibodeaux et al.,
2015). The primary reason people surveyed became teachers was for love of students
and teaching (Danielewicz, 2014).

28
The most bothersome areas inherent in the teaching profession are student
discipline, paperwork, and burdens of state testing (Thibodeaux et al., 2015). Teachers
feel as if student discipline limits the effectiveness of their teaching due to the numerous
behavioral concerns they often encounter (Gregory, Clawson, Davis, & Gerewitz, 2016).
Teachers believe if they can focus primarily on teaching and not as much on required
paperwork, they will be more effective (Thibodeaux et al., 2015). The pressure of state
testing is frequently noted as a factor that bothers teachers (Cuenca, 2014). Teachers feel
policymakers make decisions that affect educators, and teachers are concerned about the
many mandates placed on them (Thibodeaux et al., 2015). Teachers also feel as if there
is pressure to fulfill duties that sometime seem unattainable due to these mandates
(Cuenca, 2014).
Principal leadership styles and behaviors have an impact on teachers’ intent to
continue in the teaching profession, and there is a significant connection between teacher
job satisfaction and teacher mentoring on teachers’ desire to remain in the profession
(Thibodeaux et al., 2015). Principal leadership has the strongest weight on whether
teachers will continue in the teaching profession (Simon & Johnson, 2015). Thibodeaux
et al. (2015) found teacher mentoring and teacher job satisfaction have the smallest
impact on teachers’ desire to remain in the profession.
Student Behavior
Researchers must examine the lack of satisfactory preparation for dealing with
learning and behavior difficulties teachers encounter in the classroom (Elias, 2012).
Educators who feel a sense of achievement do not break down (Wang, Hall, & Rahimi,

29
2015). Difficult student behavior plays a crucial role in teacher burnout and satisfaction,
and this factor is related to teacher preparation (Cherniss, 2016). Schoolchildren who
lack the skill and/or enthusiasm to acquire what the educator is trying to teach them make
it difficult for teachers to attain the sense of success so important for any professional
(Elias, 2012). Teacher breakdown can be avoided as teachers improve classroom
management skills and expand supports when they do experience difficult behaviors
(Furrer, Skinner, & Pitzer, 2014).
The most effective classroom teachers accomplish more for students on a day-to-
day basis than merely teaching a rigid set of math or reading skills (Ladd & Sorensen,
2016). If at all possible, these educators promote discipline, character, interest, and a
plethora of other competencies referred to as non-cognitive skills (Arthur, Kristjánsson,
Harrison, Sanderse, & Wright, 2016). Researchers have recognized non-cognitive
competences in youth strongly influence academic achievement, employment, earnings,
careers, substance abuse, and antisocial behavior in adulthood (Ladd & Sorensen, 2016).
Student behaviors may be dependent in part on a student’s home, or the student may
imitate important facets of learned motivation, willpower, and self-control (Powell,
Honey, & Symbaluk, 2016).
More proficient teachers create more positive outcomes, which greatly reinforces
the argument administrators should develop and retain experienced teachers (Ladd &
Sorensen, 2016). As individual teachers improve and become experienced in student
discipline, they grow into more effective teachers (Ladd & Sorensen, 2016). Test scores
increase as educators influence students to improve other desired behaviors, such as

30
attending and participating in class or reading for pleasure outside of school (Ladd &
Sorensen, 2016). Educators are more productive in cultivating positive behaviors in
students upon acquiring more experience in the field (Breeman et al., 2015).
School Atmosphere and Workplace Conditions
Characteristics of work environment are identified in four different areas (Jain &
Kaur, 2014). Apparent and open communication addresses personnel who feel they are
suitable in the organization (Jain & Kaur, 2014). It is vital for employees to intentionally
believe in the organization’s philosophy, mission, and values (Campbell & Tawadey,
2016).
Stability of work-life is the next characteristic (Jain & Haur, 2014). Jain and Haur
(2014) speculated there had to be some sort of stability between work and private life,
and this in turn would create a sense of balance and expand job satisfaction among staff
(Jain & Kaur, 2014). The impartiality of personnel indicates employees want to be fairly
rewarded based upon their performance (Campbell & Tawadey, 2016).
Consistency is the final characteristic and is related to predictability (Handford &
Leithwood, 2013). According to Jain and Kaur (2014), staff want to know how their
administrators will respond in a given situation. Consistency is one of the single-most
effective standards leaders must create in an organization (Handford & Leithwood,
2013).
There are numerous factors within the workplace that can generate undesirable
organizational and extra-organizational concerns which often end up damaging
psychological and physical well-being of the entities (Dhanda, 2016). The first are issues

31
limited to the parts of the job and the roles constituents play (Dhanda, 2016). According
to Dhanda (2016):
The first are factors that are limited to the constituents of the job role… Factors
such as workload (either overload or underload), extreme work pace (time
pressures), meaningless jobs, low work authority, external turbulences (such as
noise and congestion) and toxic work structures are few instances that can damage
physical and mental well-being of employees employed in such unfortunate
workplace atmosphere. (p. 478)
Situations like the aforementioned can contribute to poor physical and mental well-being
of personnel (Dhanda, 2016).
Administrators hampered with complex responsibilities and without appropriate
specification about the roles they are to play are more vulnerable to stress (Daresh &
Alexander, 2015). Employees who are required to answer numerous demands of their
supervisors and of others within the organization suffer advanced levels of stress
(Bélanger et al., 2016). In such cases, role indistinctness and role conflicts lead
individuals to role stress (Dhanda, 2016).
According to Richards, Levesque-Bristol, and Templin (2014), a situation
wherein the workers’ role is indistinct or is not appropriately perceived can be defined as
role ambiguity. Role ambiguity was defined by Kahn et al. (as cited in Dhanda, 2016) as
the degree to which pure information does not compare to the beliefs associated with a
role. Conflicting roles take place when demands and expectations of those in the
profession are incompatible and contrasting (Ackfeldt & Malhotra, 2013).

32
Teacher Self-Efficacy
Skaalvik and Skaalvik (2014) determined, “When studied separately, research
shows that both teacher self-efficacy and teacher autonomy are associated with adaptive
motivational and emotional outcomes” (p. 68). Bandura (as cited in Skaalvik & Skaalvik,
2014) defined self-efficacy as “people’s judgments of their capabilities to organize and
execute courses of action required to attain designated types of performances” (p. 391).
Bong and Skaalvik (2003) asserted efficacy findings are not general judgments of skills
and capabilities, but judgments of what a person can do with the numerous skills and
capabilities one possesses.
Self-efficacy is consequently often denoted as mastery expectations and self-
perceived capability (Lu, 2016). In accordance with this conceptualization, Skaalvik and
Skaalvik (2014) defined teacher self-efficacy as individual teachers’ beliefs about their
own abilities to plan, organize, and carry out activities required to attain given
educational goals. Examples of teacher self-efficacy include teachers’ expectations to
involve all schoolchildren in educational activities, to control discipline, or to explain an
arithmetic problem so even low-achieving students comprehend (Zee & Koomen, 2016).
Network centrality may be an indicator of teachers’ obligation to students (De
Jong, Moolenaar, Osagie, & Phielix, 2016). The more an educator is asked for his or her
opinion, the more the teacher is committed to improve a student’s education (Hopkins,
2014). This suggests the significance of fostering advice seeking and feedback among
teachers; relationally oriented procedures attend to the social side of policy, above and
beyond focusing on teachers’ knowledge and expertise (De Jong et al., 2016).

33
Close networks support feelings of obligation to the school, which may reduce
staff turnover (Mowday et al., 2013). By promoting supportive rapport among teachers,
schools can gain teacher commitment to the school society and may be better able to keep
teachers inspired and devoted to improving the school (De Jong et al., 2016). Mowday et
al. (2013) believed “that the strongest or most predictable behavioral outcome of
employee commitment should be reduced turnover” (p. 38). Teachers who are
committed to their positions are also committed to working toward the goals of the
district (Mowday et al., 2013).
Self-efficacy research has revealed female prospective educators’ beliefs about
their own abilities in classroom management are greater than the beliefs of male
prospective teachers (Sivri & Balci, 2015). The difference in male and female
management could be grounded in the opinion female educators are more protective,
stick to ground rules of the classroom, and are more determined to control unruly
behaviors (Sivri & Balci, 2015). There is a link between potential teachers’ opinions of
their abilities in classroom management and the outcomes of their classroom practices
(Ryan, Kuusinen, & Bedoya-Skoog, 2015). In other words, classroom management
efficacy and classroom management outcome expectations are directly correlated (Sivri
& Balci, 2015). As prospective teachers’ opinions about their efficacy in the
management of the classroom increase, so will their hopes in the effectiveness of
classroom management application (Evertson & Weinstein, 2013).

34
Salary and Benefits
Miller (2014) concluded 60% of employees rated compensation or pay very
important, and 36% ranked it important, making it the number one contributor to overall
worker job satisfaction. The base rate of pay was rated as very important by 53% of
employees, but 63% were satisfied with it (Miller, 2014). Merit pay was very important
to 43% of employees, while 45% were merely satisfied with it (Miller, 2014).
Mertler (2016) found, “24% of teachers in the study at hand indicated that, if
provided with the opportunity again, they would not choose a career as a teacher; another
45% indicated that they were not sure if they would or not” (p. 43). Mertler (2016) also
found the number one reason teachers would potentially leave the field would be for a
better salary. However, the most disconcerting data were the 45% of teachers who
indicated if they had to make the decision again, they might not have chosen education
(Mertler, 2016).
Miller (2014) established several factors play into what makes work enjoyable
and meaningful. A competitive salary is a strong factor when it comes to employee
satisfaction (Miller, 2014). An online survey of 600 participants directed by the Society
for Human Resource Management (2016) revealed overall benefits were more vital to
employee job satisfaction than actual compensation in 2014 (Ruhe, 2015). Results from
a meta-analysis conducted by Judge, Piccolo, Podsakoff, Shaw, and Rich (2010)
indicated the association between salary and job satisfaction is very weak. According to
this research, satisfaction with pay is mostly autonomous of authentic salary (Judge et al.,
2010).

35
Other studies on librarians revealed there is a relationship between employee
payment and job satisfaction, as 66.75% of those involved in the study confirmed they
were pleased with the pay they received (Odunlade, 2012). Compensation does play an
important role in the employment and preservation of librarians (Odunlade, 2012).
Though librarians in academic libraries have enjoyed significant increases in salaries,
there is still room for improvement (Odunlade, 2012). Within studies of multiple
occupations, level of pay demonstrates a positive, yet modest, relationship to job and pay
satisfaction (Judge et al., 2010). There is little correlation between average pay and the
average level of job or pay satisfaction (Judge et al., 2010).
Teacher Age and Gender
Students instructed by teachers between the ages of 21 and 34 accomplished an
advanced grade compared to students with teachers of 49 years of age and older
(Alufohai, 2015). Alufohai (2015) also found, learners educated by instructors between
the ages of 36 and 48 obtained higher scores than those with teachers 21 to 34 years of
age and 49 and older. It can be concluded, educator age has a considerable influence on
academic performance (Alufohai, 2015).
However, educator gender does not significantly impact student academic growth
(Alufohai, 2015). Reilly, Dhingra, and Boduszek (2014) determined “no significant
differences in job satisfaction, self-efficacy, self-esteem and perceived stress between
male and female primary school teachers” (p. 10). Alufohai (2015) discovered as
teachers get older, they come to be more cynical and advance a psychological state of
exhaustion, disparagement, and incompetence. In most circumstances, this is due to poor

36
compensation after many years of employment; however, if compensation is enhanced,
negative attitudes may be reversed (Gupta, 2014).
Students rate male teachers as more effective than female teachers, no matter the
age (MacNell, Driscoll, & Hunt, 2015). Of the education strategies, explaining concepts
perhaps serves as the clearest sign of effective teaching (Joye & Wilson, 2015). It is clear
student perceptions favor male instructors (MacNell et al., 2015).
According to Joye and Wilson (2015), in part, younger female teachers earn
higher evaluations of appeal and rapport than older female teachers. This difference was
not observed between younger and older male teachers (Joye & Wilson, 2015). Younger
female teachers did not inspire higher grades (Joye & Wilson, 2015).
Students expect male teachers to be effective; however, they expect female
teachers to spend time building supportive relationships with students (Joye & Wilson,
2015). Kierstead, D’Agostino, and Dill (as cited in Joye & Wilson, 2015) stated male
teachers are perceived as more positive if they demonstrate competence. Moreover,
female teachers have to prove both skill and warmth to obtain a positive perception
(Kierstead et al., as cited in Joye & Wilson, 2015).
A teacher’s age, gender, qualifications, and professional knowledge did not have a
noteworthy outcome on academic achievement in secondary schools in Nyandarua
County (Kimani, Njagi, & Kara, 2013). However, Kimani et al. (2013) determined a
teacher’s job group and workload affect academic growth. The regularity of issuing
assignments, guaranteeing students finish assignments, and appropriate marking of
assignments have a significant impact on academic achievement (Kimani et al., 2013).

37
Setting performance targets for students was also proven to be statistically significant in
foretelling academic achievement (DuFour & Marzano, 2015). Teacher background
characteristics and instructional practices do make a difference in the academic
achievement of students (Kimani et al., 2013).
School/Class Size
Schanzenbach (2014) stated, “Public education has experienced major
transformations in the last 30 years with the rise in high stakes testing, accountability, and
charter schools, as well as the current shift toward Common Core Standards” (p. 1).
During these changes, there are those who have claimed “that class size does not matter”
(Schanzenbach, 2014, p. 1). According to Schanzenbach (2014), these critics are
incorrect and the size of classes does matter.
Learners are more successful academically and educators are more productive in
smaller classroom settings (National Council of Teachers of English, 2015). Classes with
fewer students are more effective at increasing achievement levels of both minority and
low-income minority students (Schanzenbach, 2014). Class size is a significant factor in
student success and can be directly affected through reform or policy (Schanzenbach,
2014). Assuming all other variables stay the same, increasing class sizes will impair
student success (Baker, Farrie, & Sciarra, 2016).
Increasing the number of students in a class could hurt not only a student’s testing
potential in the short term, but also the student’s success in the long term as a participant
in human capital development (Strauss, 2014). Financial savings due to increased class
sizes will more than likely result in more extensively shared costs, both educationally and
38
socially, in the future (Schanzenbach, 2014). Both minority and low-income students
reap the benefits of smaller class sizes, while increasing the number of students in a
classroom is likely more detrimental to this demographic of students (Mathis, 2017).
Lawmakers should carefully consider the effectiveness of class-size policy
compared to other potential uses of funds (Schanzenbach, 2014). Although placing fewer
students in classrooms has an obvious cost, it may prove to save money in the long run
(Mathis, 2017). Schanzenbach (2014) discovered, “Small increases in average class sizes
can mask large class-size increases in some districts and schools” (p. 8). The importance
of class size as a factor of student achievement can be directly changed or influenced by
reform (Higgins, 2014).
Summary
School administrators must do all they can to help staff achieve their highest
levels of performance possible (Cordeiro & Cunningham, 2012). Teachers have
purposely chosen their career (Sarbin, 2013). Job satisfaction will help keep teachers in
the field based upon the kind of work they perform and the achievements they experience
daily (Herzberg, 1966).
The work environment is broken into three areas: Physical Environment, Mental
Environment, and Social Environment (Jain & Kaur, 2014). Creating a genuine culture
of caring is imperative to cultivate a positive work environment (Fu & Deshpande, 2014).
Markow et al. (2013) determined, “Teacher leadership emerges as a potential resource for
translating big challenges into opportunities, served by hybrid roles for teachers as
leaders and as a method for addressing professional growth and satisfaction” (p. 51).

39
Working to strengthen this culture and bonding job satisfaction with organization
performance are crucial (Bakotić, 2016).
Employees who are satisfied in their jobs are loyal to their workplaces, and this
loyalty creates a positive work environment (Javed et al., 2014). Leaders must support
staff, control workload, and help control student discipline (Thibodeaux et al., 2015).
Giving employees access to materials, resources, support, and future learning
opportunities will empower them and create increased student performance and job
satisfaction (Wong & Laschinger, 2013).
Leaders must be clear in their expectations and must assure educators the work is
productive and worthwhile (Thibodeaux et al., 2015). Leaders need to show correlations
between the work of teachers and student growth (Cordeiro & Cunningham, 2012). The
pressures of high-stakes testing will not seem as daunting and staff will not burn out if
teachers see the validity in their work (Thibodeaux et al., 2015).
An effective teacher must not only teach grade-level content, he or she must teach
character, enforce discipline, create interest, and remain at a high level of self-satisfaction
(Ladd & Sorensen, 2016). Recognizing the factors that can damage an organization will
help to retain the mission and value of a school (Dhanda, 2016). Teachers will begin to
believe in what they do and believe all children can learn (Skaalvik & Skaalvik, 2014).
Teacher pay and benefits do help to improve satisfaction; however, compensation
is not the primary reason a teacher has job satisfaction (Judge et al., 2010). Class size
(Schanzenbach, 2014), age and gender (Alufohai, 2015), and general job satisfaction

40
(Herzberg, 1966) are all important factors in determining teacher job satisfaction as it
relates to student performance on state-mandated testing.
A review of literature was included in Chapter Two. The theoretical framework
was developed. Several topics were included detailing both job dissatisfaction and job
satisfaction in relation to teacher demographics.
Chapter Three includes an overview of the methodology for this quantitative
study. The problem and purpose are presented, and the research questions are
reintroduced. The research design is thoroughly detailed, and the instrumentation, data
collection, and data analysis are explained.
Chapter Four includes a thorough explanation of all data collected. The survey
questions and Likert-type statements are reviewed. Various tables and figures are used to
illustrate data analysis. The research questions are presented alongside the corresponding
data gathered.
Chapter Five includes a presentation of the findings and conclusions drawn from
this research. Each research question is answered and the hypotheses are either rejected
or not rejected. Suggestions for implications for practice are provided. Finally,
recommendations for further research are detailed.

41
Chapter Three: Methodology
This chapter includes an examination of the research design and methodology
used to identify the correlation between teacher job satisfaction and student performance
on state-mandated testing. The purpose of this chapter is to detail the specific processes
and procedures used to draw these connections. This chapter presents the problem and
purpose of the quantitative study. A review of the research questions and hypotheses is
presented. The research design is detailed, along with a discussion of the ethical
considerations of the study. The population and sample are defined. A survey containing
both demographic questions about the participants and eight Likert-type statements about
teacher job satisfaction is introduced as instrumentation for the study. Finally, a thorough
description of the data collection process is presented, and the procedure for data analysis
is described.
Problem and Purpose Overview
Teachers are given the great responsibility to educate youth (National Education
Association [NEA], 2011). With new regulations introduced daily, it is difficult to
maintain positive teacher morale (NEA, 2011). Strong educational leadership and high
teacher satisfaction levels are important factors in achieving high-quality learning for
students (Markow et al., 2013). The emphasis on state-mandated testing, reporting
guidelines, administrator demands, and demands from parents create a high-stress
environment (American Test Anxieties Association, 2017). This quantitative study was
designed to determine if there is a correlation between teacher job satisfaction and state-
mandated testing results.

42
Research questions and hypotheses. The following research questions guided
this study:
1. What is the correlation between high school teacher job satisfaction and high
school student achievement?
H10: There is no correlation between high school teacher job satisfaction and high
school student achievement.
H1a: There is a correlation between high school teacher job satisfaction and high
school student achievement.
2. What is the correlation between teacher job satisfaction and years of
experience, salary, age, level of education, and gender?
H20: There is no correlation between teacher job satisfaction and years of
experience, salary, age, level of education, and gender.
H2a: There is a correlation between teacher job satisfaction and years of
experience, salary, age, level of education, and gender.
3. What is the difference in job satisfaction between teachers who are required to
administer end-of-course (EOC) exams and those who are not required to administer end-
of-of-course exams?
H30: There is no significant difference in job satisfaction between teachers who
are required to administer end-of-course (EOC) exams and those who are not required to
administer end-of-of-course exams.

43
H3a: There is a significant difference in job satisfaction between teachers who are
required to administer end-of-course (EOC) exams and those who are not required to
administer end-of-of-course exams.
Research Design
Creswell (2014) stated correlational research can be defined as “procedures in
quantitative research in which investigators measure the degree of association between
two or more variables using the statistical procedure of correlational analysis” (p. 21).
Quantitative analysis of results from a Likert-type statement Google survey (see
Appendix A) administered to high school teachers from a southwest Missouri school
conference was performed. End-of-course data for Algebra I, English II, Biology, and
Government was gathered from the MODESE website for the 2013-2014, 2014-2015,
and 2015-2016 school years for the corresponding districts.
Ethical Considerations
According to Fraenkel, Wallen, and Hyun (2015), “Once the data in a study have
been collected, researchers should make sure that no one else (other than perhaps a few
key research assistants) has access to the data” (p. 64). Furthermore, “All subjects should
be assured that any data collected from or about them will be held in confidence”
(Fraenkel et al., 2015, p. 64). In order to ensure anonymity, an email (see Appendix B)
was sent to high school principals who then forwarded the email to teachers on their staff.
The email included an explanation of the study, the informed consent form (see Appendix
C), and an anonymous Google link to the survey.
44
Participants were given the opportunity to participate of their own free will.
Electronic survey response data were stored in a password-protected computer in a
locked space. Hard copies of the data were stored in a locked filing cabinet.
No names were gathered, and emails were not attached to survey results in order
to keep the participants anonymous. The primary investigator gathered the survey results
directly from a Google password-protected account. All data were secured; no
identifiable information was included in the study. Both electronic and hard copies of
data will be securely stored for three years and then destroyed.
Population and Sample
According to Fraenkel et al. (2015), “The first task in selecting a sample is to
define the population of interest (p. 93). Fraenkel et al. (2015) reiterated, “The
population, in other words, is the group of interest to the researcher, the group to whom
the researcher would like to generalize the results of the study” (p. 93). The population
for this study included all public high schools from a southwest Missouri conference.
Fraenkel et al. (2015) stated, “One of the most important steps in the research
process is the selection of the sample of individuals who will participate (be observed or
questioned). Sampling refers to the process of selecting these individuals” (p. 92).
Fraenkel et al. (2015) listed numerous categories of sampling; however, a purposive
sample was selected for this study. Purposive sampling was selected because the groups
had unique characteristics which allowed a detailed examination of the research questions
(Bryman, 2012).

45
Fraenkel et al. (2015) confirmed when using a purposive sample, researchers must
“use their judgment to select a sample that they believe, based on prior information, will
provide the data they need” (p. 101). However, Fraenkel et al. (2015) warned the major
disadvantage of purposive sampling is that the researcher’s judgment may be in error – he
or she may not be correct in estimating the representativeness of a sample or their
expertise regarding the information needed” (p. 101). A purposive sampling of 69 high
school teachers from five school districts participated in this study. Algebra I, English II,
Biology, and Government end-of-course Map Performance Index scores for the
corresponding districts were gathered from the MODESE (2017) website for the 2013-
2014, 2014-2015, and 2015-2016 school years.
Instrumentation
Teachers from participating districts were asked to complete a Google survey
designed to elicit teacher demographic information and perceptions of job satisfaction.
Fraenkel et al. (2015) acknowledged, “The major purpose of surveys is to describe the
characteristics of a population. In essence what researchers want to find out is how the
members of a population distribute themselves on one or more variables” (p. 391). The
survey consisted of eight Likert-type statements along with a series of questions to
determine demographics.
Survey questions were field-tested by a sample group of public school teachers in
order to ensure validity and reliability. Fraenkel et al. (2015) addressed issues that can be
revealed and corrected through field-testing questions such as “ambiguities, poorly
worded questions, questions that are not understood, and unclear choices; it can also

46
indicate whether the instructions to the respondents are clear” (p. 401). The survey was
generated through Google forms, and a seven-point scale was utilized with 1 representing
strongly disagree and 7 representing strongly agree. Boone and Boone (2012) stated:
A Likert scale is composed of a series of four or more Likert-type items that are
combined into a single composite score/variable during the data analysis process.
Combined, the items are used to provide a quantitative measure of a character or
personality trait. Typically, the researcher is only interested in the composite
score that represents the character/personality trait. (p. 2)
According to Boone and Boone (2012), standard deviations and mode are the
recommended descriptive statistics used for interval scale items. The secondary student
data for this study were collected from the MODESE (2017) website for each of the
participating districts.
Data Collection
Upon approval of the Lindenwood University Institutional Review Board (see
Appendix D), district superintendents were contacted by email (see Appendix E) to
obtain permission to conduct research in their districts. After permission was granted
(see Appendix F), each high school principal was emailed an electronic copy of the
informed consent and a link to the survey through email. The Google survey was
generated, and an email was sent to each teacher including a copy of the informed
consent form and the survey link. Participants indicated their consent by completing the
survey. Secondary data were collected from the MODESE (2017) website.

47
Data Analysis
School districts in Missouri from the same conference affiliation were identified
and selected. Schools with a Map Performance Index of 0.0% were omitted based on the
lack of statistical data. The participants were not disaggregated by student population,
race, gender, or ethnicity. The end-of-course Map Performance Index scores in Algebra
I, English II, Biology, and Government were gathered for the participating schools from
the MODESE (2017) website.
The survey included a series of questions designed to collect data needed to
acquire information to determine teacher job satisfaction. The research sample included
both rural and urban districts. End-of-course exam data were collected for the 2013-
2014, 2014-2015, and 2015-2016 school years.
The ratings of the eight statements for each participant regarding teacher
satisfaction were totaled for a teacher satisfaction score from 0 to 56. A Chi-square test
of independence was performed to examine the relation between job satisfaction and five
other independent variables. Those variables included years of experience, salary, age,
gender, and level of education. According to Garczynski (2016), “Chi-square is a
statistical test that tests for existence of a relationship between two variables. This test
can be used with nominal, ordinal, or scale variables, so it is a very versatile test” (para.
1). Furthermore, the sample size of 69 is greater than 40 and therefore is sufficient to
perform a Chi-square analysis (Sigma Centre, 2017).

48
A Chi-square statistic was computed and then compared to a contingency table to
determine the correlation between teacher job satisfaction and years of experience, salary,
age, level of education, and gender. According to Stockburger (2017):
Frequency tables of two variables presented simultaneously are called
contingency tables. Contingency tables are constructed by listing all the levels of
one variable as rows in a table and the levels of the other variables as columns,
then finding the joint or cell frequency for each cell. The cell frequencies are then
summed across both rows and columns. (para. 3)
After a Chi-square statistic was calculated and a contingency table was created for each
of the demographics, a determination of significance was used to answer each portion of
research question two.
The end-of-course Map Performance Index scores for each participating district
were then compared to teacher job satisfaction scores. A Chi-square test of independence
was also used to determine the relationship between the three-year average district Map
Performance Index scores for the 2013-2014, 2014-2015, and 2015-2016 school years
and teacher job satisfaction scores. A scatterplot graph was generated and a line of best
fit drawn to determine if a linear correlation existed between the two variables for each
sample population (Bluman, 2015). A p value of <.05 indicated significance for this
study.
Finally, an independent sample t-test was performed to analyze the difference, if
any, in the job satisfaction scores of teachers who are required to administer end-of-
course exams and those who are not. This statistical analysis was selected because it

49
compares two means (Statistics Solutions, 2016). The dependent variable for the t-test
was job satisfaction and the independent variable was administration of end-of-course
exams.
Summary
According to Markow et al. (2013), “Teachers today play a key part in the
leadership of their schools” (p. 4). Most teachers are not only involved in traditional
teaching roles, but also find themselves serving as department chairs, acting as mentors
for young teachers, or taking on various other leadership responsibilities (Markow et al.,
2013). Furthermore, Markow et al. (2013) found:
These teacher leaders are more likely than others to feel that an effective principal
should be able to develop a strong teaching capacity across a school, share
leadership with teachers and other staff, and evaluate teachers using multiple
measures. Few teachers want to become principals, but half are interested in
hybrid, part-time classroom teaching combined with other roles in their school or
district. (p. 4)
This study included examination of these aspects of teacher responsibilities and the effect
they have on teacher job satisfaction.
Chapter Three provided a detailed description of the methodology of the study.
An overview of the problem and purpose and a review of the research questions were
provided. The research design was described, and the instrumentation, data collection,
and data analysis were detailed. A description of the statistical tests used for this study
was introduced. An explanation of contingency tables and Chi-square statistics, which
50
were used to answer research question one, were included. Scatterplot graphs were used
with Chi-square analysis to answer research question two. Also included was an
explanation of a t-test, used to answer research question three.
Chapter Four includes the results of the study. Tables and figures are included to
better present the data. Teacher demographics are analyzed and correlated with teacher
job satisfaction. A determination of the difference in job satisfaction between teachers
required to administer the end-of course exams and those teachers not required to
administer the end-of-course exams is presented.
Chapter Five offers a discussion of the findings and conclusions from the data
collected. The relationship of findings with the theoretical framework that guided this
study and the literature review is identified. The implications of the study are detailed.
Finally, recommendations for further research are provided offering future suggestions to
enhance this area of study.

51
Chapter Four: Analysis of Data
The purpose of this study was to determine if there is a connection between
teacher job satisfaction and student test scores. With new regulations placed upon
teachers daily, it is difficult to maintain positive morale (Ravitch, 2016). Testing
anxieties appear to be growing with the increased national emphasis on uniform testing
(American Test Anxieties Association, 2017).
Data were collected in the areas of teacher gender, subjects taught, years of
experience, teacher age range, and student grade level. During a time when expectations
and standards are increasing for effective teaching and learning, teacher morale is a
declining resource (Markow et al., 2013). Schools with diminished budgets and
resources, fewer students meeting standards, and fewer colleagues highly rated for how
well they are doing their jobs are all factors associated with this phenomenon (Markow et
al., 2013). When educators experience a high level of job fulfillment, morale is enhanced
and student knowledge increases (Markow et al., 2013). Pendino (2012) recommended
analyzing survey responses from teachers in different subject areas and with different
years of experience.
A survey instrument was part of the research and elicited demographic data used
to determine independent variables. School district superintendents from a southwest
Missouri conference were contacted to obtain permission to conduct research in their
districts. After permission was granted, each high school principal was emailed an
electronic copy of the informed consent and a link to the survey through email. The
Google survey was generated, and an email was sent to each teacher including a copy of

52
the informed consent form and the survey link. Participants indicated their consent by
completing the survey.
Secondary data were collected from the MODESE (2017) website. The
population for this study included all public high schools in Missouri. A purposive
sampling of 69 high school teachers from five school districts was selected for this study.
Algebra I, English II, Biology, and Government end-of-course Map Performance Index
scores for the corresponding districts were gathered from the MODESE (2017) website
for the 2013-2014, 2014-2015, and 2015-2016 school years.
Teacher Demographic Information
Teacher demographic data were collected through the survey. Participants were
asked to provide demographic information in regard to age, gender, level of education,
years of experience, and subjects taught. The following series of tables displays
demographic data for each category.
Age. Participants were asked to select one of four age categories. These included
under 30 years of age, 31-40 years of age, 41-50 years of age, and over 50 years of age.
Forty-six percent of the teachers who administered the end-of-course exam were between
41 and 50 years of age. Only 21% of the teachers who were not required to administer
the end-of-course exam were between 41 and 50 years of age (see Table 2).

53
Table 2
Percentage of Teachers by Age
Teaching Assignment Under 30 31-40 41-50 Over 50
Administer EOCs 8% 23% 46% 23%
Do Not Administer EOCs 30% 32% 21% 16%
Note. n = 69.
Gender. Of the 69 participants, there were 53 females, 15 males, and one
participant who did not answer this question. The same percentage (77%) of female
teachers were required to administer the end-of-course exam as the percentage (77%) of
those not required to administer the end-of course exam (see Table 3).
Table 3
Percentage of Teachers by Gender
Teaching Assignment Female Male No Response
Administer EOCs 77% 15% 8%
Do Not Administer EOCs 77% 23% 0%
Note. n = 69.
Level of education. Level of education was divided into four common
categories. Those categories included bachelor’s degree, master’s degree, specialist
degree, and doctoral degree. The highest percentage of teachers who administered end-
of-course exams had earned their master’s degree (69%). Fifty-five percent of teachers

54
who did not administer the end-of-course exams had earned their master’s degree. Only
one participant had earned a doctoral degree (see Table 4).
Table 4
Percentage of Teachers by Level of Education
Teaching Assignment Bachelor’s Master’s Specialist Doctorate
Administer EOCs 23% 69% 0% 8%
Do Not Administer EOCS 39% 55% 5% 0%
Note. n = 69.
Years of experience. The participants were classified into four different groups
based upon years of experience. The categories were 1-3 years, 4-6 years, 7-10 years,
and 11+ years of teaching experience. The highest percentage of participants
acknowledged they had taught for 11+ years. Seventy-seven percent of the teachers who
administer the end-of-course exam responded they had taught for 11+ years. Only 48%
of the participants who were not required to administer the end-of-course exams had
taught 11+ years (see Table 5).
Table 5
Percentage of Teachers by Years of Experience
Teaching Assignment 1-3 4-6 7-10 11+ Years
Administer EOCs 15% 0% 8% 77%
Do Not Administer EOCs 20% 18% 14% 48%
Note. n = 69.

55
Research Question One
Research question one was developed to determine the correlation between high
school teacher job satisfaction and high school student achievement. In order to collect
data in regard to research question one, it was necessary to determine teacher job
satisfaction. This was accomplished by creating a series of eight Likert-type statements.
Participating teachers were asked to assign a score of one to seven on each. The
following statements were used:
1. I am generally satisfied with being a teacher as a profession.
2. I plan to remain in this position.
3. I plan to remain in this school.
4. I plan to remain in this profession.
5. The school administration’s behavior toward me is supportive and
encouraging.
6. I feel there is a great deal of collaboration among staff members.
7. Collaboration with my peers is a priority in my school.
8. The duties I perform beyond my contract time have a positive effect on my
job.
Each of the participant’s scores were then added together and the sum was designated as
that participant’s job satisfaction score. Fifty-six was the highest score possible, and zero
was the lowest. Sixty-nine teachers participated in the survey.

56
Survey statement one asked respondents to measure on a scale of 1-7 (1- strongly
disagree to 7- strongly agree) if they were generally satisfied with being a teacher as a
profession. Twenty-nine teachers responded by marking a six on the seven-point scale.
Two teachers marked one, two teachers marked two, and two teachers marked three on
this same statement. Overall, the majority of teachers, 59 out of the 69 surveyed, marked
five, six, or seven (see Figure 1).
Figure 1. Job satisfaction scores for survey statement one.
2 2 2
4
12
29
18
0
5
10
15
20
25
30
35
1 2 3 4 5 6 7
Nu
mb
er
of
Teac
he
rs
Job Satisfaction Score
Strongly disagree Strongly agree

57
Survey statement two asked teachers to rate their plans to remain in their current
positions, using the same seven-point scale. The majority of teachers, 48 out of 68 (one
teacher did not respond to this statement) marked either a six or a seven, signaling they
were fairly positive they were going to remain in their current positions (see Figure 2).
Figure 2. Job satisfaction scores for survey statement two.
Survey statement three asked teachers to rate the statement, “I plan to remain in
this school,” using the same seven-point scale. The majority of teachers, 45 out of 69,
marked either a six or a seven, signaling they were fairly positive they were going to
6
1
4 45
20
28
0
5
10
15
20
25
30
1 2 3 4 5 6 7
Nu
mb
er o
f T
each
ers
Job Satisfaction Score
Number of Teachers
Strongly disagree Strongly agree

58
remain at their current schools. Ten participants responded by marking a one, signifying
they were highly likely move to a different school (see Figure 3).
Figure 3. Job satisfaction scores for survey statement three.
Survey statement four asked teachers to rate their plans to remain in the
profession, using the same seven-point scale. The majority of teachers, 54 out of 69,
marked either a six or a seven, signaling they were positive they were going to remain in
the teaching profession. Only three participants marked a one, and only three participants
10
32 2
7
14
31
0
5
10
15
20
25
30
35
1 2 3 4 5 6 7
Nu
mb
er
of
Teac
he
rs
Teacher Satisfaction Score
Number of Teachers
Strongly disagree Strongly agree

59
marked a three, with no participants marking a two. Most teachers felt positive they
would remain in the teaching profession (see Figure 4).
Figure 4. Job satisfaction scores for survey statement four.
Survey statement five asked teachers to rate the school administration’s behavior,
in terms of being supportive and encouraging, using the same seven-point scale. The
majority of teachers, 45 out of 69, marked either a six or a seven, signaling they felt
positive the school administration’s behavior toward them was supportive and
encouraging. Only two participants marked a one, and only two participants marked a
3
0
3 3
6
23
31
0
5
10
15
20
25
30
35
1 2 3 4 5 6 7
Nu
mb
er o
f T
each
ers
Job Satisfaction Score
Number of Teachers
Strongly disagree Strongly agree

60
two, signifying they did not feel the school administration was supportive and
encouraging (see Figure 5).
Figure 5. Job satisfaction scores for survey statement five.
Survey statement six asked teachers to rate the statement, “I feel there is a great
deal of collaboration among staff members,” using the same seven-point scale. The
majority of teachers, 50 out of 69, marked either a five, six, or seven, signaling they felt
positive there was a great deal of collaboration among staff members. Only one
2 2
65
9
17
28
0
5
10
15
20
25
30
1 2 3 4 5 6 7
Nu
mb
er o
f T
each
ers
Job Satisfaction Score
Number of Teachers
Strongly disagree Strongly agree

61
participant marked a one, and four participants marked a four, signifying they did not feel
there was a great deal of collaboration among staff members (see Figure 6).
Figure 6. Job satisfaction scores for survey statement six.
Survey statement seven asked teachers to rate the statement, “Collaboration with
my peers is a priority in my school,” using the same seven-point scale. The majority of
teachers, 50 out of 69, marked either a five, six, or seven, signaling they felt positive
collaboration with their peers was a priority in their school. No participants marked a
one, and only three participants marked a two, signifying they did not feel collaboration
with their peers was a priority in their school (see Figure 7).
1
4
8 8
22
14 14
0
5
10
15
20
25
1 2 3 4 5 6 7
Nu
mb
er o
f T
each
ers
Job Satisfaction Score
Number of Teachers
Strongly disagree Strongly agree
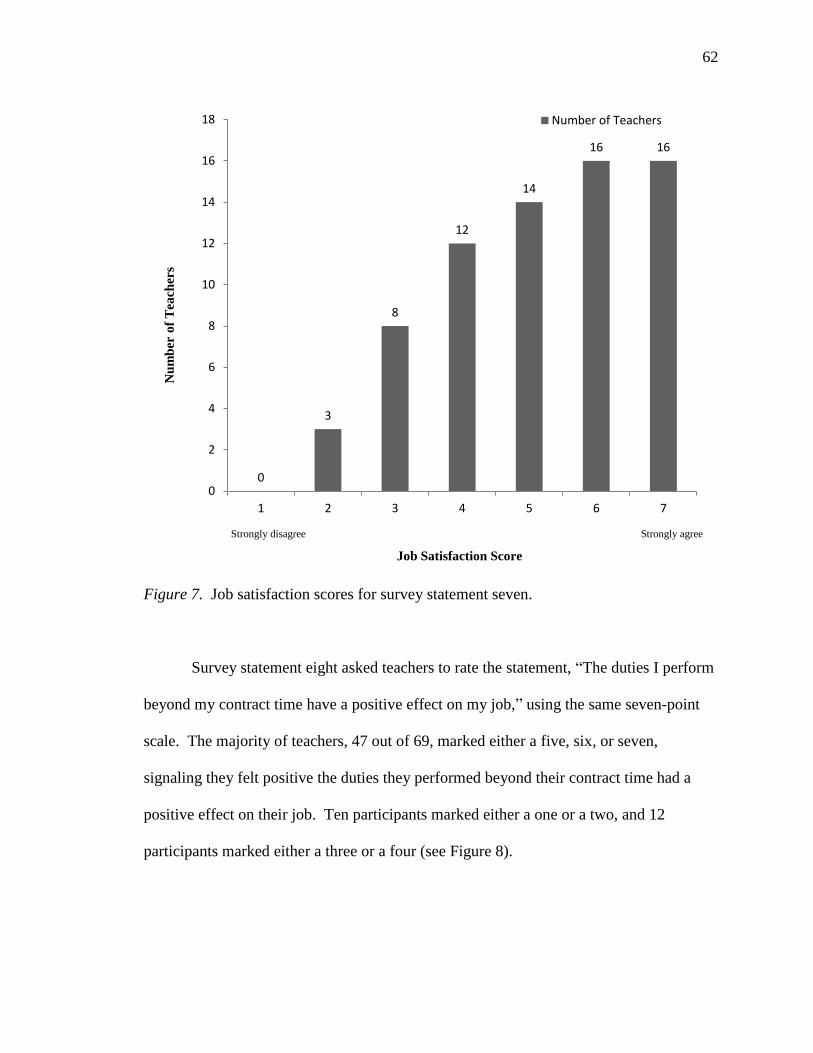
62
Figure 7. Job satisfaction scores for survey statement seven.
Survey statement eight asked teachers to rate the statement, “The duties I perform
beyond my contract time have a positive effect on my job,” using the same seven-point
scale. The majority of teachers, 47 out of 69, marked either a five, six, or seven,
signaling they felt positive the duties they performed beyond their contract time had a
positive effect on their job. Ten participants marked either a one or a two, and 12
participants marked either a three or a four (see Figure 8).
0
3
8
12
14
16 16
0
2
4
6
8
10
12
14
16
18
1 2 3 4 5 6 7
Nu
mb
er o
f T
each
ers
Job Satisfaction Score
Number of Teachers
Strongly disagree Strongly agree

63
Figure 8. Job satisfaction scores for survey statement eight.
Total teacher job satisfaction scores from participants showed the majority of
teachers indicated a high level of job satisfaction. Twenty-four of 69 participants scored
in the 50-56 range, and 25 respondents scored in the 40-49 point range (see Figure 9).
6
4
5
7
13
18
16
0
2
4
6
8
10
12
14
16
18
20
1 2 3 4 5 6 7
Nu
mb
er o
f T
each
ers
Job Satisfaction Score
Number of Teachers
Strongly disagree Strongly agree

64
Figure 9. Total job satisfaction scores for teachers participating in the survey. The
highest possible score was 56, while the lowest possible score was zero. The lowest
score indicated by a participant was 11.
After teacher job satisfaction scores were collected and analyzed, high school
student achievement was calculated using district Missouri Performance Index scores for
corresponding districts. According to the MODESE (2014):
The MAP Performance Index (MPI) is used to develop scores within the Status
and Progress metrics and to set academic achievement targets for LEA, school
4
6
10
2524
0
5
10
15
20
25
30
11-19 20-29 30-39 40-49 50-56
Nu
mb
er o
f T
each
ers
Job Satisfaction Score
Number of Teachers

65
and student group achievement. Student performance on tests administered
through the MAP is reported in terms of four (4) achievement levels (Below
Basic, Basic, Proficient and Advanced) that describe a pathway to proficiency.
The MPI is a single composite number that represents the MAP assessment
performance of every student by awarding points to each student based on the
four (4) achievement levels. The points for all students in the LEA, school or
student group in a subject area are summed together, divided by the number of
students in the group being measured and then multiplied by 100 rounded to the
tenth. The result is the MPI for that group and subject. All assessment results
from a single accountability year and for a single subject/content area are
combined when generating the LEA, school, or student group MPI. (p. 15)
The Missouri Performance Index data were collected from the MODESE (2017).
End-of-course Missouri Performance Index scores were gathered for the 2013-
2014, 2014-2015, and 2015-2016 school years. The end-of-course exam scores gathered
were from Algebra I, Biology, English II, and Government. The scores were then
correlated with the teacher job satisfaction scores from corresponding districts.
A positive trend line was drawn indicating the correlation coefficient of 0.1463.
The null hypothesis (H10) was rejected, and the alternative hypothesis (H1a) was
supported. There was a relationship between teacher job satisfaction and Missouri
Performance Index scores (see Figure 10).

66
Figure 10. Scatterplot of correlation between teacher job satisfaction scores and
Missouri Performance Index scores. The line represents the trend line of the data for the
equation y = 0.0501 x + 24.081.
Research Question Two
Research question two was developed to determine the correlation between
teacher job satisfaction and years of experience, salary, age, level of education, and
gender. Data from teacher job satisfaction were correlated with years of experience. A
contingency table was created. For this analysis, years of experience were divided into
four categories: 1-3 years, 4-6 years, 7-10 years, and 11+ years of experience. A Chi-
square test was performed to determine the p-value. A p-value of 0.577 was calculated,
y = 0.0501x + 24.081R² = 0.0203
0
10
20
30
40
50
60
0 50 100 150 200 250 300 350 400 450 500
Tea
cher
Jo
b S
ati
sfa
ctio
n S
core
s
Missouri Performance Index Scores

67
which is greater than .05. Therefore, the null hypothesis was rejected, and the alternative
hypothesis was supported. There was a correlation between teacher job satisfaction and
years of experience.
Figure 11. 3D view of the contingency table for teacher job satisfaction and years of
experience. Each bar represents the number of respondents for each teacher job
satisfaction score by years of experience.
The average teacher job satisfaction score was then calculated for each of the four
categories for years of experience. The participants who stated they taught 7-10 years
11
+ y
ear
s1
-37
-10 4-6
0
1
2
3
4
5
161719242527282931333536383940 41 42 43 45 46 47 48 49 50 51 52 53 54 55 56
Yearsof Experience
Nu
mb
er
of
Re
spo
nd
en
ts
Teacher Job Satisfaction Scores
11 + years 1-3 7-10 4-6
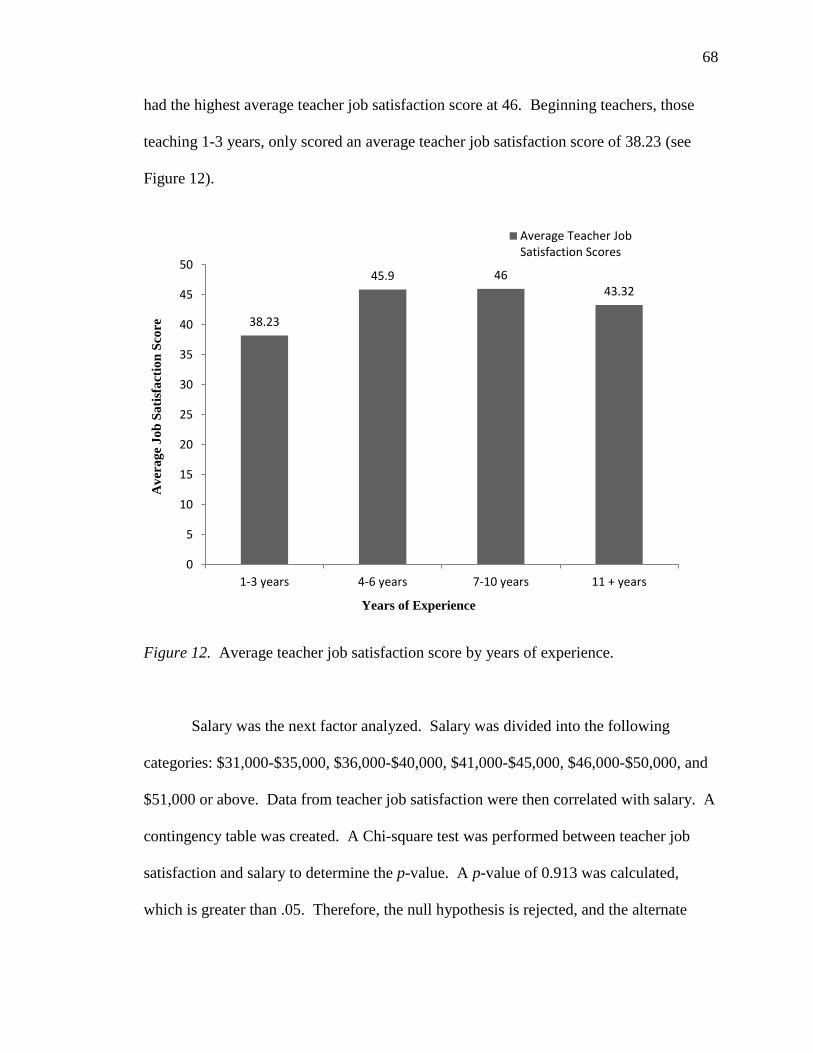
68
had the highest average teacher job satisfaction score at 46. Beginning teachers, those
teaching 1-3 years, only scored an average teacher job satisfaction score of 38.23 (see
Figure 12).
Figure 12. Average teacher job satisfaction score by years of experience.
Salary was the next factor analyzed. Salary was divided into the following
categories: $31,000-$35,000, $36,000-$40,000, $41,000-$45,000, $46,000-$50,000, and
$51,000 or above. Data from teacher job satisfaction were then correlated with salary. A
contingency table was created. A Chi-square test was performed between teacher job
satisfaction and salary to determine the p-value. A p-value of 0.913 was calculated,
which is greater than .05. Therefore, the null hypothesis is rejected, and the alternate
38.23
45.9 4643.32
0
5
10
15
20
25
30
35
40
45
50
1-3 years 4-6 years 7-10 years 11 + years
Av
era
ge
Jo
b S
ati
sfa
ctio
n S
core
Years of Experience
Average Teacher JobSatisfaction Scores

69
hypothesis is not rejected. There is a correlation between teacher job satisfaction and
salary (see Figure 13).
Figure 13. 3D view of the contingency table for teacher job satisfaction and salary. Each
bar represents the number of respondents for each teacher job satisfaction score by salary.
The average teacher job satisfaction score was then calculated for each of the six
categories for salary. The participants earning the most, $51,000 or above, indicated the
0
1
2
3
4
1617192425272829313335363839404142 43 45 46 47 48 49 50 51 52 53 54 55 56
$3
1,0
00
-$
35
,00
0$
36
,00
0 -
$4
0,0
00
$4
1,0
00
-$
45
,00
0$
46
,00
0 -
$5
0,0
00
$5
1,0
00
or
abo
ve
Nu
mb
er
of
Re
spo
nd
en
ts
Teacher Job Satisfaction Scores
$31,000 - $35,000 $36,000 - $40,000 $41,000 - $45,000
$46,000 - $50,000 $51,000 or above
Salary
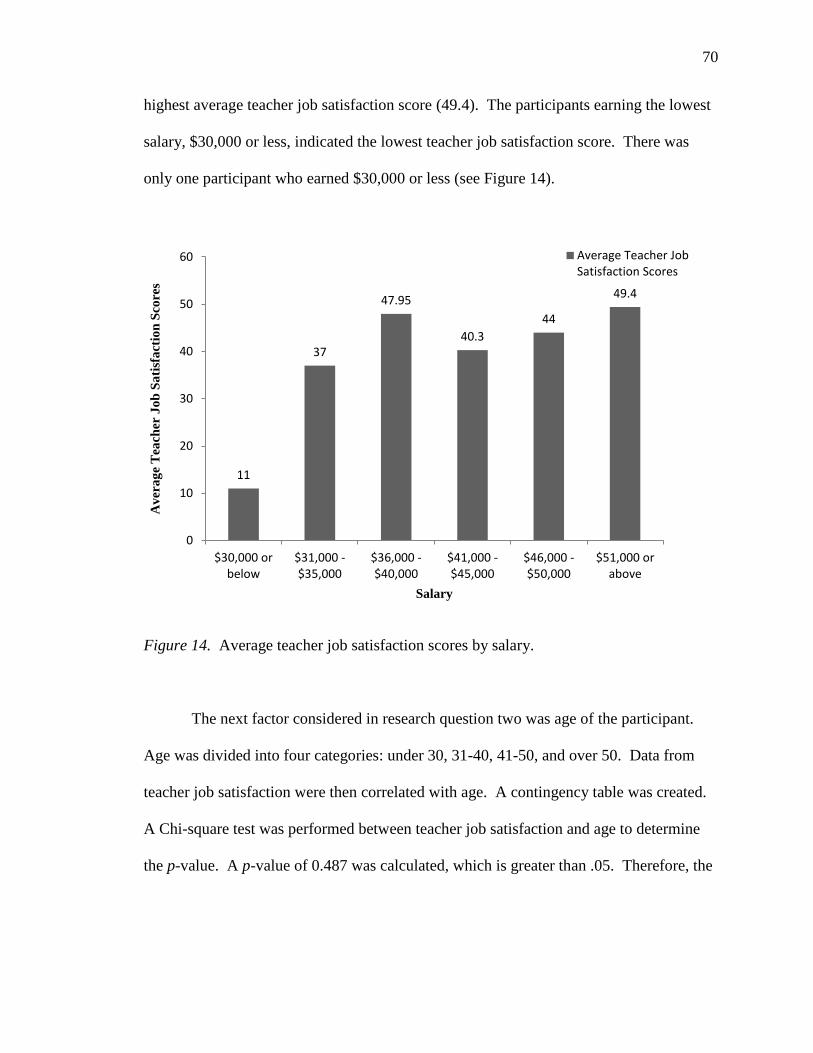
70
highest average teacher job satisfaction score (49.4). The participants earning the lowest
salary, $30,000 or less, indicated the lowest teacher job satisfaction score. There was
only one participant who earned $30,000 or less (see Figure 14).
Figure 14. Average teacher job satisfaction scores by salary.
The next factor considered in research question two was age of the participant.
Age was divided into four categories: under 30, 31-40, 41-50, and over 50. Data from
teacher job satisfaction were then correlated with age. A contingency table was created.
A Chi-square test was performed between teacher job satisfaction and age to determine
the p-value. A p-value of 0.487 was calculated, which is greater than .05. Therefore, the
11
37
47.95
40.3
44
49.4
0
10
20
30
40
50
60
$30,000 orbelow
$31,000 -$35,000
$36,000 -$40,000
$41,000 -$45,000
$46,000 -$50,000
$51,000 orabove
Av
era
ge
Tea
cher
Jo
b S
ati
sfa
ctio
n S
core
s
Salary
Average Teacher JobSatisfaction Scores

71
null hypothesis is rejected, and the alternate hypothesis is not rejected. There is a
correlation between teacher job satisfaction and age (see Figure 15).
Figure 15. 3D view of the contingency table for teacher job satisfaction and age. Each
bar represents the number of respondents for each teacher job satisfaction score by age.
The average teacher job satisfaction score was then calculated for each of the four
categories for age. The participants in the 31-40 age range had the highest average
41
-50
31
-40
un
de
r 3
0o
ver
50
0
1
2
3
4
5
1617192425272829313335363839 40 41 42 43 45 46 47 48 49 50 51 52 53 54 55 56
Age
Nu
mb
er
of
Re
spo
nd
en
ts
Teacher Job Satisfaction Scores
41-50 31-40 under 30 over 50

72
teacher job satisfaction score (45.43). The participants in the 50 and older age range
scored the lowest teacher job satisfaction score (see Figure 16).
Figure 16. Average teacher job satisfaction scores by age.
Level of education was divided into the following categories: Bachelor’s,
Master’s, Specialist, and Doctorate. Data from teacher job satisfaction were then
correlated with level of education. A contingency table was created. A Chi-square test
was performed between teacher job satisfaction and level of education to determine the p-
41.44
45.43
43.39
41
38
39
40
41
42
43
44
45
46
under 30 31-40 41-50 over 50
Av
era
ge
Tea
cher
Jo
b S
ati
sfa
ctio
n S
core
s
Age
Average Teacher JobSatisfaction Scores

73
value. A p-value of 0.028 was calculated, which is less than .05. Therefore, the null
hypothesis is not rejected. There is no correlation between teacher job satisfaction and
level of education (see Figure 17).
Figure 17. 3D view of the contingency table for teacher job satisfaction and level of
education. Each bar represents the number of respondents for each teacher job
satisfaction score by Level of Education.
Bac
he
lors
Mas
ters
Spe
cial
ist
Do
cto
rate
0
1
2
3
4
5
16171924252728293133 35 36 38 39 40 41 42 43 45 46 47 48 49 50 51 52 53 54 55 56
Level ofEducation
Nu
mb
er
of
Re
spo
nd
en
ts
Teacher Job Satisfaction Score
Bachelors Masters Specialist Doctorate

74
The average teacher job satisfaction score was then calculated for each of the four
categories for level of education. There was only participant with a doctorate degree.
This category had the highest average teacher job satisfaction score (47). The lowest
average teacher job satisfaction score was from those participants with only a bachelor’s
degree (39.92) (see Figure 18).
Figure 18. Average teacher job satisfaction scores by level of education.
The final factor analyzed was whether there was a correlation between teacher job
satisfaction and gender. Data from teacher job satisfaction were correlated with gender.
39.92
44.845.33
47
36
38
40
42
44
46
48
Bachelors Masters Specialist Doctorate
Av
era
ge
Tea
cher
Jo
b S
ati
sfa
ctio
n S
core
s
Level of Education
Average Teacher JobSatisfaction Scores

75
A contingency table was created. A Chi-square test was performed between teacher job
satisfaction and gender to determine the p-value. A p-value of 0.000 was calculated,
which is less than .05. Therefore, the null hypothesis is not rejected. There is no
correlation between teacher job satisfaction and gender (see Figure 19).
Figure 19. 3D view of contingency table for teacher job satisfaction and gender. Each
bar represents the number of respondents for each teacher job satisfaction score by
gender.
0
1
2
3
4
5
6
1617192425272829313335 36 38 39 40 41 42 43 45 46 47 48 49 50 51 52 53 54 55 56
Fem
ale
Mal
eN
o R
esp
on
se
Nu
mb
er
of
Re
spn
de
nts
Teacher Job Satisfaction Scores
female male no answer
Gender

76
The average teacher job satisfaction score was then calculated for gender. There
was one participant who chose not to respond to this question. The female participants
averaged a higher teacher job satisfaction score than the males. The average teacher job
satisfaction score for females was 44.38, while the male average teacher job satisfaction
score was 38.27 (see Figure 20).
Figure 20. Average teacher job satisfaction scores by gender.
44.38
38.27
47
0
5
10
15
20
25
30
35
40
45
50
Female Male No Answer
Ave
rage
Te
ach
er
Job
Sat
isfa
ctio
n S
core
s
Gender
Average Teacher JobSatisfaction Scores
77
Research Question Three
Research question three was developed to determine the difference in job
satisfaction between teachers who are required to administer end-of-course exams and
those who are not. Participants were divided into two categories, those who administered
end-of-course exams and those who did not. According to Bluman (2015), “A t test is
used to test the difference between means when the two samples are independent and
when the samples are taken from two normally or approximately normally distributed
populations” (p. 480). Bluman (2015) also stated, “Samples are independent samples
when they are not related. Also it will be assumed that the variances are not equal” (p.
480). Furthermore, t tests were created to evaluate small samples (de Winter, 2013).
First, the overall teacher job satisfaction scores were calculated. The level for
significance for this assessment was 0.05, which leaves a less than 5% probability of the
results being due to chance (Garczynski, 2016). This resulted in the critical value of
; t values must be greater than 2.110 to reject the null hypothesis. The obtained
t statistic was -0.58, which did not fall in the critical region; therefore, the null hypothesis
was not rejected. There was no difference between the two groups.
However, variance, which signifies the level of spread among scores, was 146.26
for teachers administering end-of-course exams and only 111.45 for those not required to
administer the exam (Bluman, 2015). This indicates teacher job satisfaction scores had a
larger deviation (see Table 6) among those required to administer the test than those not
required to administer EOCs.

78
Table 6
Central Tendency Data for Teacher Job Satisfaction
Teaching Assignment Mean Median Standard Deviation
Administer EOCs 41.38 47 12.09
Do Not Administer EOCS 43.5 45 10.56
Note. n = 56.
Summary
Teacher job satisfaction and student performance on state-mandated testing are
both vital components in the world of education (Chamundeswari, 2013). Teacher job
satisfaction is related to intrinsic motivating factors (Herzberg, 2003). Herzberg (2003)
established “that motivators were the primary cause of satisfaction, and hygiene factors
the primary cause of unhappiness on the job” (p. 7). Furthermore, Herzberg (2003)
concluded:
Not all jobs can be enriched, nor do all jobs need to be enriched. If only a small
percentage of the time and money that is now devoted to hygiene, however, were
given to job enrichment efforts, the return in human satisfaction and economic
gain would be one of the largest dividends that industry and society have ever
reaped through their efforts at better personnel management. (p. 7)
The increased demands placed upon teachers have created a high-stress work
environment (Orange, 2014). The importance of student performance is what drives
districts to make decisions, hold teachers accountable, and hold students accountable (“11
Ways to Improve,” 2014).

79
Chapter Four included an explanation of how teacher demographic data were
collected. A series of tables were used to present the teacher demographic data collected
through the survey. An explanation was also included for how teacher job satisfaction
scores were determined. Figures were used to illustrate the responses of participants to
eight Likert-type statements which determined teacher job satisfaction. A Chi-square
analysis was performed to answer research question two. Finally, a t test was performed
to answer research question three.
The findings and conclusions are presented in Chapter Five. The three research
questions are answered. Several areas of educator demographics in a specific southwest
Missouri conference were used to determine research results.
An overall conclusion was determined based on data collected from the survey
completed by a total of 69 educators. In Chapter Five, the findings are examined and
supported by the earlier findings from the literary review in Chapter Two. Implications
for practice are discussed to help support administrators as they grapple with the
struggles of teacher satisfaction and student performance on state-mandated testing.
Recommendations for future research are provided to strengthen the efforts, practices,
and philosophies of students, teachers, and administrators.

80
Chapter Five: Summary and Conclusions
The purpose of this study was to determine the connection between teacher job
satisfaction and student test scores. This study was guided by social identity theory,
originated by Tajfel and Turner (2016). Sixty-nine public school teachers were surveyed
to determine if there is a connection between teacher job satisfaction and student test
scores. Previous studies have implicated when staff have a high level of job satisfaction,
student learning increases, as well as morale (Markow et al., 2013).
Several areas of demographic data were collected from educators who taught in a
specific southwest Missouri conference. The demographic data collected included age,
gender, level of education, years of experience, subject areas taught, and salary. Within
the survey, all educators were asked to respond to eight statements. They were asked to
rate these statements on a 1-7 scale, one indicating strongly disagree and seven indicating
strongly agree. Educators were asked to rate the following:
1. I am generally satisfied with being a teacher as a profession.
2. I plan to remain in this position.
3. I plan to remain in this school.
4. I plan to remain in this profession.
5. The school administration’s behavior toward me is supportive and
encouraging.
6. I feel there is a great deal of collaboration among staff members.
7. Collaboration with my peers is a priority in my school.

81
8. The duties I perform beyond my contract time have a positive effect on my
job.
Data were collected to determine the influence of all factors involved in teacher and
employee satisfaction, along with the impacts of teacher job satisfaction on student
achievement. A thorough review of literature was provided including valuable research
and knowledge about general job satisfaction, job satisfaction and job performance,
testing, administrative support, key factors in teacher job satisfaction, student behavior,
school atmosphere and workplace conditions, teacher self-efficacy, salary and benefits,
teacher age and gender, and school/class size.
Findings
There were a total of three research questions tested in this research project.
The first research question was designed to determine the correlation between high
school teacher job satisfaction and high school student achievement. The alternative
hypothesis was not rejected in light of the findings. There is a relationship between
teacher job satisfaction and Missouri Performance Index scores.
The second research question was designed to determine the correlation between
teacher job satisfaction and years of experience, salary, age, level of education, and
gender. A Chi-square test was performed to determine the p-value of each demographic.
Based on the data collected from the survey of educators, there is a correlation between
teacher job satisfaction and years of experience.
The second demographic area was salary and benefits. The data gathered
supported the alternate hypothesis there is a correlation between teacher job satisfaction

82
and the salary of educators. The alternate hypothesis was also supported in regard to age
of the educator. There is a correlation between teacher job satisfaction and educator age.
However, based on the survey of educators, there is no correlation between teacher job
satisfaction and the level of education held by the educator, nor is there a correlation
between teacher job satisfaction and the gender of the educator. The null hypothesis was
not rejected for both of these demographics.
The final purpose of the overall study was to determine if a difference existed in
teacher job satisfaction between teachers who are required to administer end-of-course
exams and those who are not required to administer end-of-course exams. As mentioned
in Chapter Four, the obtained t value was -0.58, which did not fall in the critical region;
therefore, the null hypothesis was not rejected. However, teacher job satisfaction scores
did have a larger deviation among those required to administer the end-of-course exam
than those not required to administer the end-of-course exam.
Conclusions
There was a direct connection between teacher job satisfaction and Missouri
Performance Index scores. In order to attain school goals, administrators must be
prepared to help individual educators obtain the highest possible level of success and
performance (Cordeiro & Cunningham, 2012). Based on previous research and data
collected from the survey, it is believed creating teachers who are satisfied in their jobs
will improve student test scores on state-mandated testing.
This study resulted in data indicating there is a correlation between teacher job
satisfaction and years of experience. More capable teachers produce more positive

83
results, which significantly reinforces the dispute administrators should develop and keep
experienced teachers (Ladd & Sorensen, 2016). As individual staff members improve
and become skilled in student discipline, they develop into more effective teachers;
student performance improves as these educators inspire students to increase other
behaviors, such as attendance, classroom participation, and the desire to read for pleasure
(Ladd & Sorensen, 2016). Teachers are more productive in facilitating desired behaviors
in students as educators become more experienced in their specific field (Ladd &
Sorensen, 2016).
There were also indications that there is a connection between teacher job
satisfaction and salary. Mertler (2016) found, “24% of teachers showed that, if given the
opportunity again, they would not have chosen education as a career and another 45%
indicated that they were not sure if they would or not” (p. 43). Mertler (2016) also
asserted the main reason teachers would possibly leave education would be for a better
salary.
There was a correlation between teacher job satisfaction and age in this study.
Students taught by teachers between 21 and 34 years of age demonstrated an advanced
achievement level compared to students who had teachers over the age of 49, while
students who were instructed by teachers between 36 and 48 years of age attained higher
scores than those with teachers from 21 to 34 years of age and 49 years and older
(Alufohai, 2015). Alufohai (2015) conducted research and determined as teachers get
older, they inherently become more cynical and enter into a psychological state of
fatigue, become more critical, and ultimately show a level of incompetency. In most

84
situations, this is directed toward poor compensation after many long years of
employment; however, if a teacher’s salary is increased, destructive attitudes can be
averted (Alufohai, 2015).
There was no correlation between teacher job satisfaction and level of education
in this study. Demographics such as teacher’s age, gender, qualifications, and
professional knowledge do not have a significant outcome on student academic
achievement in secondary schools in Nyandarua County (Kimani et al., 2013). However,
Kimani et al. (2013) determined a teacher’s job group and assignment dramatically affect
academic growth. Consistently issuing homework, assuring students complete
assignments, and appropriately grading assignments have a substantial impact on
students’ academic achievement (Kimani et al., 2013).
There was no correlation between teacher job satisfaction and teacher gender in
this study. Previous researchers concluded educator age has a considerable influence on
academic performance in English (Alufohai, 2015). However, the gender of a teacher
does not show a significant impact on student academic growth (Alufohai, 2015).
Despite the fact that teacher job satisfaction scores had a larger deviation among
those required to administer the EOC than those that were not required to administer the
EOC. This study determined there was no significant difference between the two
demographics. According to Markow et al. (2013), building administrators place more of
an emphasis on test data than teachers do. Teachers tend to focus more on the overall
classroom experiences of students (Markow et al., 2013). Administrators inherently
85
place more pressure on those teachers who are directly instructing students who will take
a state-mandated test (Markow et al., 2013).
Connections of this study are supported by the social identity theory. A teacher,
just by choosing his/her career, has entered an attained status (Sarbin, 2013).
Understanding how this status affects teachers is important in promoting teacher job
satisfaction (Illeris, 2014). As educators develop and become competent or incompetent,
they may bounce between attained status and achieved status (Sarbin, 2013). A building-
level administrator can play a huge role in guiding or facilitating teachers through this
process. As teachers work through conflict among themselves and the community, their
feelings of satisfaction will improve or lessen (Sarbin, 2013).
The same is true when teachers work through struggles in the classroom (Sarbin,
2013). This looks different depending on the age of students (Sarbin, 2013). Teachers
who work with younger students may be very content with a hug after an exhausting day
in the classroom, while teachers of older students may be gratified by students
performing better in the classroom or on specific skills (Sarbin, 2013). Fostering a
relationship with students is similar vertically no matter what grade levels are taught
(Sarbin, 2013). Given all of this, teachers will not change unless they see or feel a
significant purpose in what they are doing (Illeris, 2014). An administrator cannot create
motivation in staff members; teachers must find their own motivation (Illeris, 2014).
Implications for Practice
This research was designed to support those faced with the daunting task of
educating students in the future under specific guidelines. While looking at previous
86
literature, McNeill (2016) suggested further research in the area of the impact of teacher
demographics on job satisfaction. After collecting and analyzing the data to respond to
the three research questions, the following implications were suggested.
Create an overall climate that promotes teacher job satisfaction. This study
showed there was a connection between teacher job satisfaction and student achievement.
Therefore, students, teachers, and administrators must realize the factors that play into
teacher job satisfaction and overall student performance (Stello, 2011). Administrators
must recognize the effects of different demographics on teacher job satisfaction (Fu &
Deshpande, 2014). Knowing how each factor of demographics plays into the overall
level of teacher job satisfaction and how students perform based on these roles will help
improve teacher job satisfaction and student performance on state-mandated testing (Fu
& Deshpande, 2014).
Previous research by Fu and Deshpande (2014) indicated the overall climate of a
building must be examined; the administrator needs to assess the current climate. Survey
question five in this research dealt directly with climate. Results of this study showed the
majority of teachers ranked this area highly. A connection can be made that a high level
of satisfaction in this area results in higher student test scores on state-mandated tests.
Sarbin (2013) concluded administrators help determine whether a teacher will reach the
achieved status.
Collaboration. Data collected in this research showed the highest level of
uncertainty when it comes to a teacher’s satisfaction is teacher collaboration. Staff must
feel collaboration is a priority in their building (Markow et al., 2013). Creating a

87
collaborative culture can be very difficult and time-consuming; however, Kraft and Papay
(2014) determined effective teachers stay in schools due to meaningful collaboration.
There are several things that can be done to help this process. Establishing group goals,
while keeping in mind the size of a group, will help to create a positive collaborative
atmosphere (Clifford, 2016). Administrators must create an environment of trust by
dealing with emotional issues immediately and doing so before moving on to other things
(Clifford, 2016).
Becoming a Professional Learning Community allows districts to incorporate
team-building activities in planning meetings (Provini, 2017). Professional Learning
Communities allow for the creation of a common vision, mission, and goals supported by
all staff (Mireles, 2015). Creating a Professional Learning Community can help to
develop ownership and establish boundaries with groups (Mireles, 2015). Professional
development centered around conflict resolution can give teachers the tools to work
through conflict (Provini, 2017).
Collaboration is not an internal action that only occurs in the school setting; all
stakeholders must be involved. To increase collaboration between the community and
school, steps must be taken to involve community members in the process (Rabadi,
2014). It is helpful to work with local businessmen and women when possible to ensure
families have access to resources (Epstein et al., 2009; Ohio Department of Education,
2017). Administrators and teachers can also help to build collaboration by listening to
students and allowing students to help in the decision-making process (Rabadi, 2014).
88
Recognize if teachers are happy with what they are doing. According to this
current study, there are some teachers who are not satisfied in their current roles.
However, there are many who are satisfied and wish to remain in the teaching profession.
While staff members may be talented teachers, they may not be content in the grade level
or with the subject they are currently teaching. The administrator’s job is to recognize
this in observation and conversation and to look for signs of burnout. According to
research presented in The Perspectives of Irreplaceable Teachers (Jacob, Carroll, & Cho,
2013):
Many respondents cited burnout as a major concern, and told us that teaching at
an elite level can be physically and emotionally exhausting. Twenty-two percent
talked about an excessive workload, lack of time or exhaustion in their description
of what they like least about teaching (the most popular response), and about 60
percent said they can’t see themselves maintaining the amount of energy and time
they devote to their job over the long run. Forty percent said they work more than
60 hours a week, and when we asked for an adjective to describe how they feel
when they are teaching, one of the most popular answers was “tired.” (p. 18)
Administrators cannot always move a teacher to another teaching position. This research
revealed 70% of the teachers surveyed were happy with their current positions in their
districts. Administrators must find ways to challenge staff in what they are currently
doing and help staff to embrace what and who they are as teachers (Prather, 2015).
Allowing teachers the opportunity to become experts in their own classrooms and placing
them in leadership roles can build upon their expertise (Prather, 2015).
89
The theoretical framework of this study supports this thought when understanding
the social identity of teachers. Teachers have an attained status once they are successful
in their content areas (Sarbin, 2013). Administrators need to encourage teachers to be
reflective of their instructional process (Prather, 2015). Administrators need teachers to
become leaders in areas such as instruction, policy, and association (Center for Teaching
Quality, 2014)
Administrators must be supportive, and more importantly, teachers must
feel supported. This research showed administrative support is demonstrated in many
ways. The Society for Human Resource Management (2016) stated support from
administration in areas such as classroom discipline, professional development,
individual staff family needs, teacher ideas, and teacher incentives helps build teacher job
satisfaction. Giving staff the opportunities to reward and support one another and
encouraging staff to feel comfortable with making important decisions are also vital
(Pautler, n.d.). Administrators must be open and honest with staff about how they, as
administrators, feel (Meador, 2013). It is also helpful to provide snacks, drinks, and
chocolate, encouraging teachers to give feedback and embracing their thoughts and ideas
(Meador, 2013).
The majority of staff recognize and feel extracurricular duties have a positive
effect on their jobs. Administrators recognize they cannot be everywhere and do
everything; they must ask for help. Based on the data collected in this research, teachers
see the benefits in extra-curricular activities when it comes to students. Teachers need to
convey enthusiasm for their profession (Gatens, 2014).

90
Teachers believe being involved in extra-curricular activities is directly related to
the academic achievement of students (Kirsch, 2013). Being involved in these activities
will build connections that support what teachers are doing in the classroom during the
school day (Gatens, 2014). While staff are taking the time to attend these activities, they
must make sure students see them having fun (Gatens, 2014). Kirsch (2014) stated:
Generally, students who participate in extracurricular activities benefit
academically. Students, school administration, teachers, and parents all need to
be aware of the effects that participation in extracurricular activities have on the
academic performance of students. Furthermore, they also need to be aware of
the specific extracurricular activities available to them and the effects of each
specific activity on performance. Not every child will benefit from or be impaired
in the same manner that studies revealed concerning extracurricular activities.
Each student performs at his or her own level of ability and one cannot expect
excessive amounts of academic abilities from a child solely because he or she is
actively involved in several extracurricular activities. (p. 25)
Staff must try to seek out the children who may be struggling in the classroom and
understand that while not every child may profit from an extracurricular experience,
many will (Kirsch, 2014).
Teachers are satisfied when students score well on state-mandated testing.
This research has revealed teachers do gain satisfaction when their students are successful
on state testing. The theoretical framework of this research, social identity theory, shows
support for the success of teachers when they have reached an achieved status.

91
Successful test scores on state-mandated tests will help to accomplish the achieved status
desired by the classroom teacher (Sarbin, 2013).
State-mandated testing places many burdens on teachers (Walker, 2014).
Teachers surveyed feel testing creates too much pressure, has a negative impact on the
classroom, is time wasted, punishes teachers, and has a negative impact on teacher
morale (Walker, 2014). Administration, staff, parents, and students should contact their
local and state representatives to discuss concerns about the impact of testing on teachers,
students, and parents (Long, 2014).
Data show the more years a teacher has the less they are satisfied in their job.
The data collected in this study revealed the more years a teacher has in the profession,
the less satisfied they are. There are many things administrators can look at to help
resolve this issue. Gray and Taie (2015) discussed many issues school districts can
address in this area. Teacher salary and guidance by administration in the form of
mentors are the two main areas of support that can be offered (Fensterwald, 2015).
Salary and benefits have an impact on teacher job satisfaction. Muguongo,
Muguna, and Muriithi (2015) determined teachers who have a higher salary base have a
higher level of teacher job satisfaction. School boards and superintendents need to do
what they can to stay up with inflation and the cost of living, because compensation is
one of the main motivators for teachers (Muguongo et al., 2015). Muguongo et al. (2015)
stated:
The study further concludes that insurance cover greatly affects job satisfaction
among teachers. It was deduced that they are greatly satisfied with medical

92
insurance. The bonuses only affect the job satisfaction of teachers slightly. The
performance bonus makes teachers care more about teaching well, pay incentives
motivate them and pay incentives schemes’ objectives are achievable. The study
finally concludes that the nonfinancial compensation that affect the teacher’s
satisfaction include psychic rewards (acknowledgement of teaching competence),
reasonable work load and administrative support. (p. 57)
Working conditions and environments are worsening across the nation (Nyamubi, 2017).
Resources, competitive salaries, and workplace conditions must be enhanced to help
support teacher job satisfaction (Nyamubi, 2017).
Gender has no effect on job satisfaction. As administrators think about the
hiring process, they need to realize an unhappy staff will not be changed by increasing
the number of males or females on staff. While this has no effect on teacher job
satisfaction, male and females may offer different perspectives to students and may be
able to relate differently to individual students (Ferlazzo, 2013).
Administrators should understand what factors have an effect on teacher job
satisfaction. This researcher surveyed teachers on specific questions about teacher job
satisfaction. A strong collaborative culture, administrator support, and involving staff in
extra-curricular activities with students have an overall positive impact on teacher job
satisfaction.
Teacher turnover rates and teacher retention are crucial to school districts (Simon
& Johnson, 2015). Teachers with strong academic backgrounds have tendencies to move
to school districts that pay more and have better student achievement (Simon & Johnson,
93
2015). Teacher self-efficacy and teacher autonomy can predict student engagement,
teacher job satisfaction, and teacher burnout (Skaalvik & Skaalvik, 2014).
Poor working conditions and low salary also have an effect on teacher job
satisfaction (Nyagaya, 2015). The working conditions of staff also have direct connection
to teacher job satisfaction (Nyagaya, 2015). A connection can also be found with the size
of the school. Teachers who work in larger school districts have less job satisfaction than
those who work in smaller school districts (Song & Mustafa, 2015). Applying this
research along with prior research may help administrators promote teacher job
satisfaction at higher levels in order to improve student achievement.
Recommendations for Future Research
There are really no boundaries or limitations on the areas or types of future
research in the field of teacher job satisfaction as it relates to student performance on
state-mandated testing. For future research, one recommendation would be to
disaggregate data from specific school districts to determine how leadership has a
connection to teacher job satisfaction. The surveyed sample was not disaggregated in a
way to compare types of administrative leadership with teacher job satisfaction. By
doing so, data could be collected directly related to the perception of whether or not the
administration’s behavior is supportive and encouraging.
The timing of this survey could have skewed the outcome. Administering this
survey to the same educators at the beginning of the school year versus the end of the
school year may indicate different results. Teacher job satisfaction early in the school

94
year might be different than teacher job satisfaction as the stresses and pressures of state-
mandated testing are in full swing during the spring semester.
A researcher could add a qualitative component to this study. Qualitative
research is intended to attain a deeper understanding of a precise group or occurrence,
rather than a basic report of a large sample of teachers (Silverman, 2016). Teacher,
administrative, and even student perceptions on teacher job satisfaction and the role it
plays in student achievement could be invaluable.
Along those same lines, interviewing teachers instead of having them complete a
survey could allow the participants to provide greater detail on the subject. This might
elicit different results when asking participants to answer questions in person versus
completing them online with no face-to-face accountability. False conclusions can
sometimes be drawn when a survey participant answers a question online (Davies &
Hughes, 2014). Face-to-face interviews allow participants to expand on answers and to
provide deeper details on the subject matter.
This research only involved a survey of classroom teachers. Further research
involving surveys and interviews of building-level administrators may be useful in
gathering information based on different perceptions between these two groups.
Perceptions of the community in regard to teacher job satisfaction and its effect on
student achievement were not a part of this research. Future researchers could interview
patrons and other stakeholders. This may help to build a stronger understanding of the
culture and climate of a school district and the effect school culture has on the
community.

95
Given the data collected, further research could be conducted with those in higher
education. Surveying teachers by asking questions about what colleges could do to better
prepare educators might result in useful data.
Summary
The overarching purpose of this study was to determine the connection between
teacher job satisfaction and student performance on state-mandated testing. To
accomplish that goal, it was necessary to look at several factors. The first was to define
job satisfaction. Related to that effort, it became necessary to survey teachers and to gain
demographic information from those teachers. It was also necessary to gather student
data from state-mandated testing results.
The background for this study revolved around improving student achievement
and improving teacher satisfaction. Focusing on these two areas will help administrators
in both of these areas (DuFour & Mattos, 2013). The review of literature revealed
current research was lacking in the connection between student performance and teacher
job satisfaction.
An understanding of the social identity theory, developed by Tajfel and Turner
(2016) in 1979, is relevant when working through the understanding of how teachers are
satisfied in their jobs. How individuals fit into groups makes a difference in helping to
create teacher job satisfaction and improvement in student test scores (Tajfel and Turner,
2016). People subconsciously identify themselves with certain groups and create a sense
of belonging (Ashforth & Mael, 1989). When groups of people compete with one
another, it is detrimental to the success of an organization (Ashforth & Mael, 1989).

96
This research was designed to help with the realization there may be an impact on
student test scores in relation to teacher job satisfaction. Improved morale and high
levels of job satisfaction should in turn create improved student learning (Markow et al.,
2013). A survey was developed and emailed to the faculty members of school districts
affiliated with a southwest Missouri conference. Prior to doing this, each district-level
superintendent was contacted to gain permission to survey his/her staff. State-mandated
testing data were collected from the MODESE (2017).
There were three research questions involved with this study. The first was
designed to determine if there is a correlation between high school teacher job
satisfaction and high school student achievement. The second question was designed to
determine if there is a correlation between job satisfaction and five teacher demographic
areas. Finally, the third question was designed to determine if there is a difference in job
satisfaction between teachers who are required to administer an end-of-course state
assessment and those who are not.
The researcher defined job satisfaction as a worker’s attitude toward all aspects of
work and the work environment (Bin, 2015). Student achievement was explained using
proficiency levels created by the MODESE (2014). The Missouri Performance Index
scores were collected, and each performance level was assigned a number. Below basic
was one point, basic was two points, proficient was three points, and advanced was four
points (MODESE, 2014).
Within this study, limitations were identified. Only one conference in southwest
Missouri was surveyed. This represents a small percentage of the total population of
97
teachers and students in Missouri. Another limitation was the changing of the state-
mandated test; Missouri changed the assessment in the three-year window data were
collected.
Several areas of literature were reviewed while preparing for this research, with
general job dissatisfaction being one. Since 2008, there has been a decline in teacher job
satisfaction (Markow et al., 2013). The only recent research found on teacher job
satisfaction prior to this study was by Markow et al. in 2013. Prior to Markow et al.’s
(2013) research, Herzberg (1966) studied job satisfaction. Workplace environment plays
a significant role in job satisfaction (Fu & Deshpande, 2014).
Literature in regard to required testing and administrative support was also
reviewed. Markow et al. (2013) stated teachers are more concerned with classroom
experiences, and administrators are concerned with student test data. Administrators
must provide support for their staff (DuFour & DuFour, 2013). An emphasis on testing is
putting pressure on teachers, and this is one reason teachers are leaving the profession
(Thibodeaux et al., 2015). Large class sizes, student discipline issues, and lack of
administrative support are the three main reasons teachers leave the profession altogether
(Thibodeaux et al., 2015). Teacher self-efficacy helps teachers feel connected and
committed to the profession (De Jong et al., 2016).
Several demographic areas were researched as well. An understanding of salary
and benefits, teacher age, teacher gender, school size, and class size was necessary for
this research. These areas may or may not have an impact on teacher job satisfaction and
student performance on state-mandated testing.

98
This quantitative study involved collection of survey data from teachers employed
in schools located in a southwest Missouri conference as well as student test data from
the MODESE (2017). The schools surveyed were both rural and urban. There were a
total of 69 participants in the survey.
The specific dates of state-mandated testing were between 2013 and 2016, and the
specific tested areas were Algebra I, English II, Biology, and Government. A Chi-square
statistical test was used to answer research questions one and two, and a t-test was
performed to answer research question three. A Chi-square test is a statistical test that
determines the existence of a relationship between two variables (Garczynski, 2016). A
t-test is used to examine two means (Statistics Solutions, 2016). All respondents were
asked to rate their levels of satisfaction based on eight statements.
Research question one was developed to determine the correlation between high
school teacher job satisfaction and high school student achievement. A correlation was
shown, and the null hypothesis was rejected. There is a relationship between teacher job
satisfaction and Missouri Performance Index scores.
Research question two was developed to determine if there is a correlation
between teacher job satisfaction and years of experience, salary, age, level of education,
and gender. A correlation between teacher job satisfaction and years of experience,
salary, and age was indicated. Data did not indicate a correlation between teacher job
satisfaction and the teacher’s gender or level of education.
Research question three was developed to determine the difference in job
satisfaction between teachers who are required to administer an end-of-course exam and

99
those who are not required to. The data collected indicated there is a larger deviation in
teacher job satisfaction among those required to administer the test than those not
required to administer the EOC. However, the t test determined there is no difference in
job satisfaction between teachers who are required to administer the EOC exam and those
that are not.
Administrators can learn from this research and create a higher level of teacher
job satisfaction as well as improve student performance on state-mandated testing. This
researcher suggests the following:
1. Create an overall climate that promotes teacher job satisfaction.
2. Build a collaborative culture.
3. Recognize if teachers are happy with what they are doing.
4. Realize teachers are generally satisfied with teaching as a profession.
5. Support staff.
6. Recognize the importance of getting staff involved with students and extra-
curricular activities.
7. Understand teachers are satisfied when students score well on state-mandated
tests.
8. Realize the more years of experience a teacher has, the less satisfied they are.
9. Support increased salaries and benefits for staff.
10. Promote furthering teacher education.
11. Realize hiring a variety of different genders will not affect job satisfaction.
12. Recognize the pressures placed on staff who administer a state-mandated test.

100
13. Look at the research and have an understanding of the factors that play a role
in job satisfaction.
In conclusion, there are numerous strategies that can be employed by school districts to
increase teacher job satisfaction and in turn increase student achievement. It is important
for administrators to be aware of teacher demographics and the effect they may have on
both teacher job satisfaction and student performance.
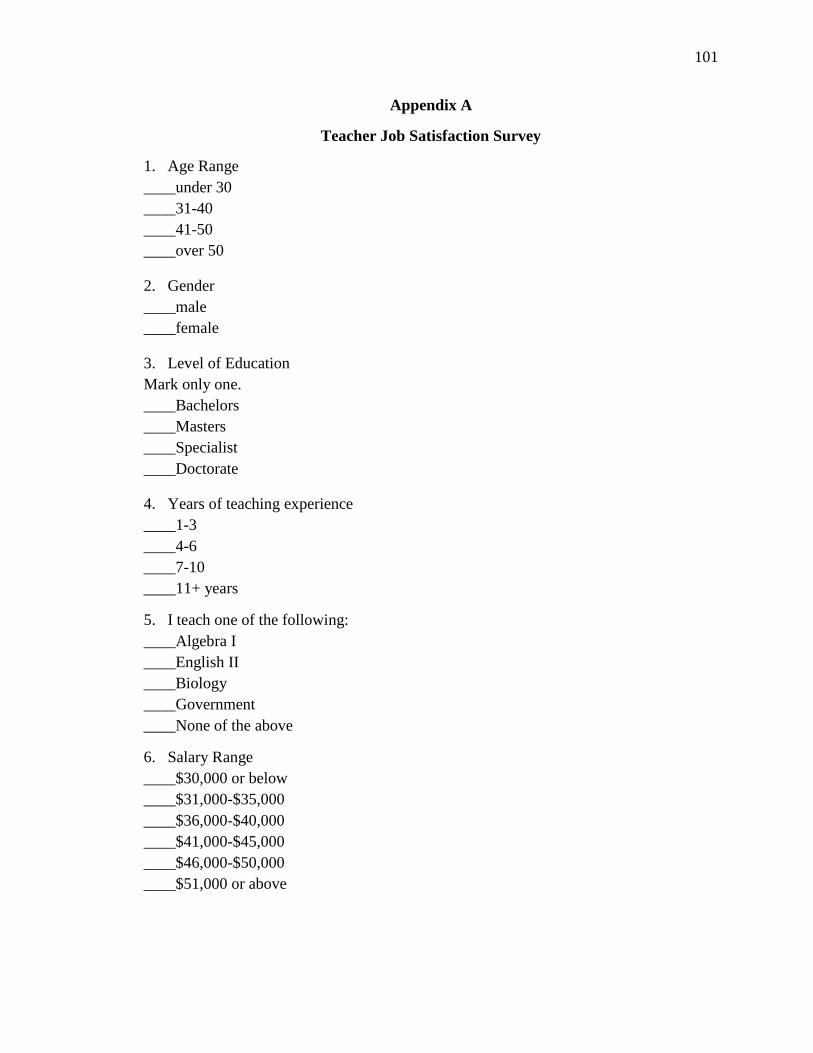
101
Appendix A
Teacher Job Satisfaction Survey
1. Age Range
____under 30
____31-40
____41-50
____over 50
2. Gender
____male
____female
3. Level of Education
Mark only one.
____Bachelors
____Masters
____Specialist
____Doctorate
4. Years of teaching experience
____1-3
____4-6
____7-10
____11+ years
5. I teach one of the following:
____Algebra I
____English II
____Biology
____Government
____None of the above
6. Salary Range
____$30,000 or below
____$31,000-$35,000
____$36,000-$40,000
____$41,000-$45,000
____$46,000-$50,000
____$51,000 or above

102
Mark only one oval for each question.
1. I am generally satisfied with being a teacher as a profession.
1 2 3 4 5 6 7
Strongly Disagree O O O O O O O Strongly Agree
2. I plan to remain in this position.
1 2 3 4 5 6 7
Strongly Disagree O O O O O O O Strongly Agree
3. I plan to remain in this school.
1 2 3 4 5 6 7
Strongly Disagree O O O O O O O Strongly Agree
4. I plan to remain in this profession.
1 2 3 4 5 6 7
Strongly Disagree O O O O O O O Strongly Agree
5. The school administration’s behavior toward me is supportive and encouraging.
1 2 3 4 5 6 7
Strongly Disagree O O O O O O O Strongly Agree
6. I feel there is a great deal of collaboration among staff members.
1 2 3 4 5 6 7
Strongly Disagree O O O O O O O Strongly Agree
7. Collaboration with my peers is a priority in my school.
1 2 3 4 5 6 7
Strongly Disagree O O O O O O O Strongly Agree
8. The duties I perform beyond my contract time have a positive effect on my job.
1 2 3 4 5 6 7
Strongly Disagree O O O O O O O Strongly Agree

103
Appendix B
Teacher Participant,
My name is Doug Crawford, and I am a Doctoral Student with Lindenwood University. I
am in the process of gathering information for my research project. The title of the
project is, Teacher Job Satisfaction As Related to Student Performance on State-
Mandated Testing. I have permission from your superintendent to use your information
in this research project. The survey will only take five minutes and will help greatly in
my project. An informed consent is attached that provides you protection. Please click
on the survey link below to complete the survey.
Thank you for your help in my project.
Doug Crawford
TEACHER JOB SATISFACTION SURVEY

104
Appendix C
INFORMED CONSENT FOR PARTICIPATION IN RESEARCH ACTIVITIES
Teacher job satisfaction as it relates to student performance on state-mandated testing
Principal Investigator _James D. Crawford___ Telephone: 417-955-2510 E-mail: [email protected]
Participant___________________ Contact info ________________________
1. You are invited to participate in a research study conducted by James D. Crawford
under the guidance of Dr. Shelly Fransen. The purpose of this research is to
determine the impact teacher job satisfaction has on student performance on state-
mandated testing.
2. a) Your participation will involve completing an anonymous survey.
b) The amount of time involved in your participation will be approximately 10
minutes.
Four Missouri school districts, with 25 teachers surveyed from each, will be involved
in this research.
3. There are no anticipated risks associated with this research.
4. There is no possible benefit to you from participating in this research. 5. Your participation is voluntary and you may choose not to participate in this research
study or to withdraw your consent at any time. You may choose not to answer any
questions that you do not want to answer. You will NOT be penalized in any way
should you choose not to participate or to withdraw.
6. We will do everything we can to protect your privacy. As part of this effort, your
identity will not be revealed in any publication or presentation that may result from
this study, and the information collected will remain in the possession of the
investigator in a safe location.
7. If you have any questions or concerns regarding this study, or if any problems arise,
you may call the Investigator, Doug Crawford, at 417-955-2510 or the Supervising

105
Faculty, Dr. Shelly Fransen, at 417-337-0040. You may also ask questions of or state
concerns regarding your participation to the Lindenwood Institutional Review Board
(IRB) through contacting Dr. Marilyn Abbott, Provost, at [email protected]
or 636-949-4912.
I have read this consent form and have been given the opportunity to ask
questions. I will also be given a copy of this consent form for my records. I
consent to my participation in the research described above by completing
the survey.

106
Appendix D
DATE: April 29, 2016 TO: James Crawford
FROM: Lindenwood University Institutional Review Board STUDY TITLE: [877823-1] Teacher Job Satisfaction as it Relates to Student
Performance on State Mandated Testing
IRB REFERENCE #:
SUBMISSION TYPE: New Project ACTION: APPROVED
APPROVAL DATE: April 29, 2016
EXPIRATION DATE: April 29, 2017
REVIEW TYPE: Expedited Review Thank you for your submission of New Project materials for this research project.
Lindenwood University Institutional Review Board has APPROVED your submission.
This approval is based on an appropriate risk/benefit ratio and a study design wherein
the risks have been minimized. All research must be conducted in accordance with this
approved submission.
This submission has received Expedited Review based on the applicable federal regulation. Please remember that informed consent is a process beginning with a description of
the study and insurance of participant understanding followed by a signed consent
form. Informed consent must continue throughout the study via a dialogue between
the researcher and research participant. Federal regulations require each participant
receive a copy of the signed consent document.
Please note that any revision to previously approved materials must be approved by
this office prior to initiation. Please use the appropriate revision forms for this
procedure.
All SERIOUS and UNEXPECTED adverse events must be reported to this office.
Please use the appropriate adverse event forms for this procedure. All FDA and
sponsor reporting requirements should also be followed.

107
All NON-COMPLIANCE issues or COMPLAINTS regarding this project must be reported
promptly to the IRB.
This project has been determined to be a Minimal Risk project. Based on the risks, this
project requires continuing review by this committee on an annual basis. Please use the
completion/amendment form for this procedure. Your documentation for continuing
review must be received with sufficient time for review and continued approval before
the expiration date of April 29, 2017.
Please note that all research records must be retained for a minimum of three years.

108
Appendix E
March 21, 2016
Mr. John Collins
213 W McCabe St,
Strafford, MO
65757
Mr. Collins,
Re: Permission to obtain and use MLC High School Teacher emails in order to conduct a
Research Study on Teacher Job Satisfaction as it Relates to Student Performance on
State-Mandated Testing
Dear Mr. Collins,
I am writing to request permission to obtain and use a list of MLC High School teacher
email addresses. I am currently enrolled at Lindenwood University in St. Charles, MO,
and am in the process of writing my dissertation for a doctoral degree in Educational
Administration. The study is titled, Teacher Job Satisfaction as it Relates to Student
Performance on State-Mandated Testing.
The intended purpose of this study is to determine if teacher job satisfaction has an
impact on student academic achievement. This study may be useful for school district
administrators to help increase student scores and retain highly qualified teachers. A
review of the literature reveals researchers have discussed student performance and
teacher job satisfaction; however, researchers have not created a connection between the
differences in performance of schools based on teacher job satisfaction. A direct
connection between the variables is not a possibility. The desire is to localize the results
to determine if there are factors specific to Missouri public schools.
Teachers in the MLC Conference will be identified and surveyed electronically regarding
teacher job satisfaction. Results will be collected electronically, and all participants will
remain anonymous.
If approval is given, MLC superintendents will be contacted via email after contact
information is collected from DESE. The superintendents will be informed of the
research, and a survey link will be attached to the email. Through the link, the
superintendents will agree to participate in the research and will answer the survey
questions. No one will be forced to participate. The survey will be anonymous. No cost

109
will be incurred other than the 5-10 minutes the survey will take. Participants will be
asked about their subject levels, years of experience, salary, gender, and overall job
satisfaction.
Approval to conduct this study will be greatly appreciated. Please do not hesitate to
contact me with any questions or concerns about participation at 417-955-2510 or
[email protected]. You may also contact Dr. Shelly Fransen at 417-337-0040 or
[email protected]. A copy of this letter and your written consent should be
retained by you for future reference.
Thanks you for your consideration,
Doug Crawford
Doctoral Candidate

110
Appendix F
Permission Letter
I, John Collins, grant permission for Doug Crawford to obtain email addresses from MLC
High School teachers in order to study teacher job satisfaction as it relates to student
performance on state-mandated testing. By signing this permission form, I understand
that the following safeguards are in place to protect the participants:
1. I may withdraw my consent at any time without penalty.
2. The identity of the participants will remain confidential and anonymous in the
dissertation or any future publications of this study.
I have read the information above, and any questions that I have posed have been
answered to my satisfaction. Permission, as explained, is granted.
_______________
Superintendent Date

111
References
Ackfeldt, A. L., & Malhotra, N. (2013). Revisiting the role stress-commitment
relationship: Can managerial interventions help? European Journal of
Marketing, 47(3/4), 353-374.
Alufohai, P. J. (2015). Influence of teachers’ age, marital status, and gender on students’
academic achievement. Asian Journal of Educational Research, 3(4), 60-66.
American Psychological Association. (2010). Publication manual of the American
Psychological Association (6th ed.). Lancaster, PA: Author.
American Test Anxieties Association. (2017). Is it serious? Retrieved from
http://amtaa.org/is-it-serious/
Arthur, J., Kristjánsson, K., Harrison, T., Sanderse, W., & Wright, D. (2016). Teaching
character and virtue in schools. Abingdon, UK: Routledge.
Ashforth, B. E., & Mael, F. (1989). Social identity theory and the organization. Academy
of Management Review, 14(1), 20-39.
Baker, B. D., Farrie, D., & Sciarra, D. G. (2016). Mind the gap: 20 years of progress and
retrenchment in school funding and achievement gaps. ETS Research Report
Series, 2016(1), 1-37.
Bakotić, D. (2016). Relationship between job satisfaction and organisational
performance. Ekonomska Istraživanja, 29(1), 118-130.
Barlow, J. (2015). Relationship of teacher perception of principal leadership practices
and job satisfaction in the Southeast Region of the Association of Christian
Schools International (Doctoral dissertation, Liberty University). Retrieved from

112
http://digital commons.liberty.edu/cgi/viewcontent.cgi?article=2127
&context=doctoral
Barrick, M. R., Mount, M. K., & Li, N. (2013). The theory of purposeful work behavior:
The role of personality, higher-order goals, and job characteristics. Academy of
Management Review, 38(1), 132-153.
Bélanger, J. J., Pierro, A., Barbieri, B., De Carlo, N. A., Falco, A., & Kruglanski, A. W.
(2016). One size doesn’t fit all: The influence of supervisors’ power tactics and
subordinates’ need for cognitive closure on burnout and stress. European Journal
of Work and Organizational Psychology, 25(2), 287-300.
Bernhardt, V. L. (2003). Using data to improve student learning in elementary schools.
New York, NY: Eye on Education.
Bin, A. S. (2015). The relationship between job satisfaction, job performance and
employee engagement: An explorative study. Issues in Business Management and
Economics, 4(1), 1-8. Retrieved from http://journalissues.org/wp-content
/uploads/2016/01/Abdulwahab.pdf
Bitsadze, M., & Japaridze, M. (2014). Personal and social aspects of teacher burnout in
Georgia. Problems of Education in the 21st Century, 59, 7-14. Retrieved from
http://eprints.iliauni.edu.ge/usr/share/eprints3/data/4961/1/457-1420361738.pdf
Bluman, A. (2015). Elementary statistics: A step by step approach (9th ed.). New York,
NY: McGraw-Hill.
Bong, M., & Skaalvik, E. M. (2003). Academic self-concept and self-efficacy: How
different are they really? Educational Psychology Review, 15(1), 1-40.

113
Boone, H. N., & Boone, D. A. (2012). Analyzing Likert data. Journal of Extension,
50(2), 1-5.
Breeman, L. D., Wubbels, T., Van Lier, P. A. C., Verhulst, F. C., van der Ende, J., Maras,
A., …Tick, N. T. (2015). Teacher characteristics, social classroom relationships,
and children’s social, emotional, and behavioral classroom adjustment in special
education. Journal of School Psychology, 53(1), 87-103.
Bridges, W., & Bridges, S. (2017). Managing transitions, 25th anniversary edition:
Making the most of change. Philadelphia, PA: Da Capo Press.
Brophy, J. E. (2013). Motivating students to learn. Abingdon, UK: Routledge.
Brown, T. H., Richardson, L. J., Hargrove, T. W., & Thomas, C. S. (2016). Using
multiple-hierarchy stratification and life course approaches to understand health
inequalities: The intersecting consequences of race, gender, SES, and age. Journal
of Health and Social Behavior, 57(2), 200-222.
Bryman, A. (2012). Social research methods (4th ed.). Oxford, UK: Oxford University
Press.
Burden, P. (2016). Classroom management: Creating a successful K-12 learning
community. Hoboken, NJ: John Wiley & Sons.
Campbell, A., & Tawadey, K. (2016). Mission and business philosophy. Amsterdam:
Elsevier.
Center for Teaching Quality, National Board for Professional Teaching Standards, and
the National Education Association. (2014). The teacher leadership competencies.
Retrieved from http://www.nbpts.org/sites/default/files/

114
teacher_leadership_competencies_final.pdf
Centers for Disease Control. (2013). Make a difference at your school (Chronic Disease
Paper 31). Retrieved from http://digitalcommons.hsc.unt.edu/disease/31
Chamundeswari, S. (2013). Job satisfaction and performance of school teachers.
International Journal of Academic Research in Business and Social Sciences,
3(5), 420.
Cherniss, C. (2016). Beyond burnout: Helping teachers, nurses, therapists and lawyers
recover from stress and disillusionment. Abingdon, UK: Routledge.
Clifford, M. (2016, July 1). Collaborative learning tips and strategies for teachers [Web
log post]. Retrieved from http://www.teachthought.com/pedagogy/20-
collaborative-learning-tips-and-strategies/
Cordeiro, P. A., & Cunningham, W. G. (2012). Educational leadership: A bridge to
improved practice (5th ed.). New York, NY: Pearson Higher Ed.
Cormier, G. (2016). Getting to the heart of it: Commitment at work (Master’s thesis,
University of Pennsylvania). Retrieved from http://repository.upenn.edu/cgi/
viewcontent.cgi?article=1100&context=mapp_capstone
Creswell, J. W. (2014). Educational research: Planning, conducting and evaluating
quantitative and qualitative research (5th ed.). Harlow, Essex: Pearson.
Cuenca, A. (2014). Negotiating accountability during student teaching: The influence of
an inquiry-based student teaching seminar. Teaching Education, 25(1), 24-42.
Cummings, T. G., & Worley, C. G. (2014). Organization development and change.
Boston, MA: Cengage Learning.

115
Dana, N. F., & Yendol-Hoppey, D. (2014). The reflective educator’s guide to classroom
research: Learning to teach and teaching to learn through practitioner inquiry.
Thousand Oaks, CA: Corwin Press.
Danielewicz, J. (2014). Teaching selves: Identity, pedagogy, and teacher education.
Albany, NY: SUNY Press.
Daresh, J. C., & Alexander, L. (2015). Beginning the principalship: A practical guide for
new school leaders. Thousand Oaks, CA: Corwin Press.
Davies, M. B., & Hughes, N. (2014). Doing a successful research project: Using
qualitative or quantitative methods. Basingstoke, UK: Palgrave Macmillan.
Davis, J. (2015). Give teachers time to collaborate. Education Week, 35(4), 26-27.
De Jong, K. J., Moolenaar, N. M., Osagie, E., & Phielix, C. (2016). Conexiones de valor:
Una perspectiva del capital social sobre las redes sociales de profesores, el
compromiso y la autoeficacia. Pedagogía Social Revista Interuniversitaria, (28),
71-84.
de Winter, J. C. (2013). Using the student’s t-test with extremely small sample
sizes. Practical Assessment, Research & Evaluation, 18(10), 1-12.
Dhanda, K. (2016). A review on job stress: Concept, causes and remedy. Global
Journal for Research Analysis, 5(11), 478-481.
Dickens, K. (2010). Factors influencing teacher job satisfaction and their alignment with
current district practices in a suburban school district (Doctoral dissertation,
Lindenwood University). Retrieved from http://pqdtopen.proquest.com/
doc/853648956.html?FMT=AI

116
DuFour, R., & DuFour, R. (2013). Learning by doing: A handbook for Professional
Learning Communities at Work TM. Bloomington, IN: Solution Tree Press.
DuFour, R., & Marzano, R. J. (2015). Leaders of learning: How district, school, and
classroom leaders improve student achievement. Bloomington, IN: Solution Tree
Press.
DuFour, R., & Mattos, M. (2013). Improve schools? Educational Leadership, 70(7), 34-
40.
Earley, P., & Porritt, V. (2014). Evaluating the impact of professional development: The
need for a student-focused approach. Professional Development in Education,
40(1), 112-129.
11 ways to improve school communications and community engagement. (2014). The
Glossary of Education Reform. Retrieved from http://edglossary.org/school-
communications/
Elias, M. (2012, May 23). Teacher burnout: What are the warning signs? [Web log post].
Retrieved from https://www.edutopia.org/blog/teacher-burnout-warning-signs-
maurice-elias
Epstein, J., Sanders, M., Sheldon, S., Simon, B., Salinas, K., Jansorn, N., …Williams, K.
(2009). School, family, and community partnerships: Your handbook for action
(3rd ed.). Thousand Oaks, CA: Corwin Press.
Evertson, C. M., & Weinstein, C. S. (Eds.). (2013). Handbook of classroom management:
Research, practice, and contemporary issues. Abingdon, UK: Routledge.

117
Fensterwald, J. (2015, July 16). Half of new teachers quit profession in 5 years? Not true,
new study says. EdSource. Retrieved from https://edsource.org/2015/half-of-new-
teachers-quit-profession-in-5-years-not-true-new-study-says/83054
Ferlazzo, L. (2013, December 7). Response: Wondering ‘how gender influences a
teacher’s struggles & successes’[Blog post]. Retrieved from
http://blogs.edweek.org/teachers/classroom_qa_with_larry_ferlazzo/2013/12/resp
onse_wondering_how_gender_influences_a_teachers_struggles_successes.html
Fraenkel, J. R., Wallen, N. E., & Hyun, H. H. (2015). How to design and evaluate
research in education (9th ed.). New York, NY: McGraw-Hill.
Frumkin, H. (2016). Environmental health: From global to local. Hoboken, NJ: John
Wiley & Sons.
Fu, W., & Deshpande, S. P. (2014). The impact of caring climate, job satisfaction, and
organizational commitment on job performance of employees in a Chinese
insurance company. Journal of Business Ethics, 124(2), 339-349.
Fullan, M. (2014). Leading in a culture of change: Personal action guide and workbook.
Hoboken, NJ: John Wiley & Sons.
Furrer, C., Skinner, E., & Pitzer, J. (2014). The influence of teacher and peer
relationships on students’ classroom engagement and everyday motivational
resilience. National Society for the Study of Education, 113(1), 101-123.
Garczynski, J. (2016). Chi-square test in SPSS (PASW) [Reference notes]. Baltimore,
MD: Towson University. Retrieved from

118
https://www.researchgate.net/file.PostFileLoader.html?id...assetKey...
chisquare%20(1).pdf
Gatens, B. (2014, November 6). Why teachers should value extracurricular activities
[Web log post]. Retrieved from http://education.cu-portland.edu/blog/principals-
office/why-teachers-should-value-extracurricular-activities/
Gray, L., & Taie, S. (2015). Public school teacher attrition and mobility in the first five
years: Results from the first through fifth waves of the 2007-08 beginning teacher
longitudinal study (NCES 2015-337). Washington, DC: National Center for
Education Statistics. Retrieved from http://files.eric.ed.gov/fulltext/ED556348.pdf
Gregory, A., Clawson, K., Davis, A., & Gerewitz, J. (2016). The promise of restorative
practices to transform teacher-student relationships and achieve equity in school
discipline. Journal of Educational and Psychological Consultation, 26(4), 325-
353.
Gu, X. (2016). Teacher job satisfaction in public schools: The relation to the years of
teaching experience (Master’s thesis, Buffalo State College). Retrieved from
http://digitalcommons.buffalostate.edu/cgi/viewcontent.cgi?
article=1000&context=elmed_theses
Gupta, M. (2014). Employees’ satisfaction towards monetary compensation practices.
Global Journal of Finance and Management, 6(8), 757-764.
Handford, V., & Leithwood, K. (2013). Why teachers trust school leaders. Journal of
Educational Administration, 51(2), 194-212.
Harris, A., Day, C., Hopkins, D., Hadfield, M., Hargreaves, A., & Chapman, C. (2013).

119
Effective leadership for school improvement. Abingdon, UK: Routledge.
Herzberg, F. (1966). Work and the nature of man. New York, NY: Crowell Company.
Herzberg, F. (2003). One more time: How do you motivate employees? Harvard
Business Review, 81(1), 87-96.
Higgins, J. (2014, October 28). Does class size matter? Research reveals surprises. The
Seattle Times. Retrieved from http://www.seattletimes.com/seattle-
news/education/does-class-size-matter-research-reveals-surprises/
Hopkins, D. (2014). A teacher’s guide to classroom research. London, UK: McGraw-Hill
Education (UK).
Hopkins, D. (2015). Improving the quality of education for all: A handbook of staff
development activities. Abingdon, UK: Routledge.
Illeris, K. (2014). Transformative learning and identity. Journal of Transformative
Education, 12(2), 148-163. doi:10.1177/1541344614548423
Improve yourself as a leader: Engaged employees. (2013, March 8). Retrieved from
http://www.meador.com/2013/03/08/stafffing-agencies-in-pasadena-tx-improve-
yourself-as-a-leader-engaged-employees/
Islam, G. (2014). Social identity theory. In T. Thomas (Ed.), Encyclopedia of critical
psychology (pp. 1781-1783). New York, NY: Springer New York.
Jacob, A., Carroll, K., & Cho, J. (2013). Perspectives of irreplaceable teachers: What
America’s best teachers think about teaching. New York, NY: The New Teacher
Project. Retrieved from
https://tntp.org/assets/documents/TNTP_Perspectives_2013.pdf
120
Jain, R., & Kaur, S. (2014). Impact of work environment on job satisfaction.
International Journal of Scientific and Research Publications, 4(1), 1-8.
Retrieved from http://citeseerx.ist.psu.edu/viewdoc/download?doi=
10.1.1.429.3175&rep=rep1&type=pdf#page=548
Javed, M., Balouch, R., & Hassan, F. (2014). Determinants of job satisfaction and its
impact on employee performance and turnover intentions. International Journal
of Learning and Development, 4(2), 120-140.
Joye, S., & Wilson, J. H. (2015). Professor age and gender affect student perceptions and
grades. Journal of the Scholarship of Teaching and Learning, 15(4), 126-138.
Judge, T. A., Piccolo, R. F., Podsakoff, N. P., Shaw, J. C., & Rich, B. L. (2010). The
relationship between pay and job satisfaction: A meta-analysis of the
literature. Journal of Vocational Behavior, 77(2), 157-167.
Kelly, S., & Northrop, L. (2015). Early career outcomes for the “best and the brightest:”
Selectivity, satisfaction, and attrition in the beginning teacher longitudinal
survey. American Educational Research Journal, 52(4), 624-656.
Kimani, G. N., Njagi, L. W., & Kara, A. M. (2013). Teacher factors influencing
students’ academic achievement in secondary schools. International Journal of
Education and Research, 1(3), 1-14.
Kirsch, S. (2013). Are teachers promoting extracurricular activities to low-achieving
students? (Master’s thesis proposal, State University of New York). Retrieved
from https://dspace.sunyconnect.suny.edu/bitstream/handle/1951/64574/Stephen_
Kirsch_Masters_Project_May2014.pdf?sequence=1

121
Kraft, M. A., & Papay, J. P. (2014). Can professional environments in schools promote
teacher development? Explaining heterogeneity in returns to teaching
experience. Educational Evaluation and Policy Analysis, 36(4), 476-500.
Labrague, L. J., McEnroe‐Petitte, D. M., Papathanasiou, I. V., Edet, O. B., & Arulappan,
J. (2015). Impact of instructors’ caring on students’ perceptions of their own
caring behaviors. Journal of Nursing Scholarship, 47(4), 338-346.
Ladd, H. F., & Sorensen, L. C. (2016). Returns to teacher experience: Student
achievement and motivation in middle school (Working paper 112). Washington,
DC: National Center for Analysis of Longitudinal Data in Education Research.
Retrieved from http://www.caldercenter.org/sites/default/files/WP%
20112%20Update_0.pdf
Lamm, E., Tosti-Kharas, J., & King, C. E. (2015). Empowering employee sustainability:
Perceived organizational support toward the environment. Journal of Business
Ethics, 128(1), 207-220.
Leroy, H., Dierynck, B., Anseel, F., Simons, T., Halbesleben, J. R., McCaughey, D., …
Sels, L. (2012). Behavioral integrity for safety, priority of safety, psychological
safety, and patient safety: A team-level study. Journal of Applied Psychology,
97(6), 1273.
London, M. (2014). Career barriers: How people experience, overcome, and avoid
failure. Abingdon, UK: Psychology Press.

122
Long, C. (2014, June 17). The high-stakes testing culture: How we got here, how we get
out. NEA Today. Retrieved from http://neatoday.org/2014/06/17/the-high-stakes-
testing-culture-how-we-got-here-how-we-get-out/
Lu, P. H. (2016). Self-regulated learning in college students’ work volition: The
mediating effects of self-efficacy, and self-perceived employability (Doctoral
dissertation, La Sierra University). Retrieved from ProQuest Dissertations and
Theses database. (UMI No. 10143754)
MacNell, L., Driscoll, A., & Hunt, A. N. (2015). What’s in a name: Exposing gender bias
in student ratings of teaching. Innovative Higher Education, 40(4), 291-303.
Mafini, C., & Dlodlo, N. (2014). The relationship between extrinsic motivation, job
satisfaction and life satisfaction amongst employees in a public organisation. SA
Journal of Industrial Psychology, 40(1), 1-12. Retrieved from http://www.
scielo.org.za/scielo.php? pid=S2071-07632014000100007&script=sci_
arttext&tlng=pt
Markow, D., Macia, L., & Lee, H. (2013). The MetLife survey of the American teacher:
Challenges for school leadership. New York, NY: Metropolitan Life Insurance
Company. Retrieved from https://www.metlife.com/assets/cao/foundation/
MetLife-Teacher-Survey-2012.pdf
Mathis, W. J. (2017). The effectiveness of class size reduction. The Education Digest,
82(5), 60.

123
McNeill, K. M. (2016). A study of factors that impact middle school teacher job
satisfaction (Doctoral dissertation, University of Nevada-Reno). Retrieved from
http://pqdtopen.proquest.com/doc/1808215567.html?FMT=AI
Mertler, C. A. (2016). Should I stay or should I go? Understanding teacher motivation,
job satisfaction, and perceptions of retention among Arizona teachers.
International Research in Higher Education, 1(2), 34.
Miller, S. (2014). Why pay is driving employee satisfaction. Retrieved from
https://www.shrm.org/resourcesandtools/hr-topics/compensation/pages/pay-
drives-satisfaction.aspx
Mireles, E. (2015, October 2). First steps in forming a professional learning community
[Web log post]. Retrieved from http://inservice.ascd.org/first-steps-in-forming-a-
professional-learning-community/
Missouri Department of Elementary and Secondary Education. (2014). Comprehensive
guide to the Missouri school improvement program. Retrieved from
https://dese.mo.gov/sites/default/files/MSIP-5-comprehensive-guide.pdf
Missouri Department of Elementary and Secondary Education. (2017). Missouri
comprehensive data system. Retrieved from https://mcds.dese.mo.gov/guide
dinquiry/MSIP5%20Annual%20Performance%20Report%20APR/MSIP5%20An
nual%20Performance%20Report%20(APR).aspx
Moon, J. A. (2013). Reflection in learning and professional development: Theory and
practice. Abingdon, UK: Routledge.

124
Morello, R. (2014, July 17). Study: Teacher turnover is higher than ever [Web log post].
Retrieved from http://indianapublicmedia.org/stateimpact/2014/07/17/study-
teacher-turnover-higher/
Mowday, R. T., Porter, L. W., & Steers, R. M. (2013). Employee-organization linkages:
The psychology of commitment, absenteeism, and turnover. Cambridge, MA:
Academic Press.
Muguongo, M. M, Muguna, T. A., & Muriithi, D. K. (2015). Effects of compensation on
job satisfaction among secondary school teachers in Maara Sub-County of
Tharaka Nithi County, Kenya. Journal of Human Resource Management, 3(6),
47-59.
Nyagaya, P. A. (2015). Factors influencing teachers’ level of job satisfaction in public
primary schools in Kayole Division, Embakasi Sub County, Kenya (Doctoral
dissertation, University of Nairobi). Retrieved from
http://erepository.uonbi.ac.ke/bitstream/handle/
11295/90863/Nyagaya_Factors%20influencing%20teachers%20%20level%20of
%20job%20satisfaction%20in%20public%20primary%20schools%20in%20Kayo
le%20Division,%20Embakasi%20Sub%20County,%20Kenya.pdf?sequence=1
National Council of Teachers of English. (2015). Why class size matters today.
Retrieved from http://www.ncte.org/positions/statements/why-class-size-matters
National Education Association (NEA). (2011). C.A.R.E.: Strategies for closing the
achievement gaps. Retrieved from http://www.nea.org/assets/docs/CARE
guide2011.pdf

125
Neeley, T. B. (2013). Language matters: Status loss and achieved status distinctions in
global organizations. Organization Science, 24(2), 476-497.
Nilson, L. B. (2016). Teaching at its best: A research-based resource for college
instructors. Hoboken, NJ: John Wiley & Sons.
Nyamubi, G. J. (2017). Determinants of secondary school teachers’ job satisfaction in
Tanzania. Education Research International, 2017, 1-7.
doi:10.1155/2017/7282614
Oakes, J., Lipton, M., Anderson, L., & Stillman, J. (2015). Teaching to change the world.
Abingdon, UK: Routledge.
Odunlade, R. O. (2012). Managing employee compensation and benefits for job
satisfaction in libraries and information centres in Nigeria (Paper 714). Library
Philosophy and Practice (e-journal). Retrieved from http://digitalcommons.
unl.edu/cgi/viewcontent.cgi?article=1788&context=libphilprac
OECD. (2016). Education at a glance 2016: OECD indicators. Paris: OECD Publishing.
Retrieved from http://www.keepeek.com/Digital-Asset-Management/oecd/
education/education-at-a-glance-2016_eag-2016-en#page3
Ogbonnaya, C. N., & Nielsen, K. (2016). Transformational leadership, high performance
work practices, and an effective organization. Academy of Management
Proceedings, 2016(1), 11152.
Ohio Department of Education. (2017). Parent and family involvement policy provides
guidance to local school boards. Retrieved from http://education.ohio.gov/
Topics/Other-Resources/Family-and-Community-Engagement/Getting-Parents-

126
Involved/Parent-and-Family-Involvement-Policy-Provides-Guid
Okun, A. M. (2015). Equality and efficiency: The big tradeoff. Washington, DC:
Brookings Institution Press.
Orange, A. (2014). What they left behind: A case study of teachers’ experiences with
school improvement at Evergreen Elementary School. The Qualitative Report,
19(37), 1.
Pautler, R. (n.d.). 10 Tips for keeping your teachers motivated. Retrieved from
https://talk.chalk.com/10-tips-keeping-teachers-motivated/
Pendino, B. (2012). Investigating staff morale in an elementary school setting (Doctoral
dissertation, Lindenwood University). Retrieved from http://pqdtopen.
proquest.com/doc/921920355.html?FMT=AI
Perrachione, B. A., Petersen, G. J., & Rosser, V. J. (2008). Why do they stay?
Elementary teachers’ perceptions of job satisfaction and retention. The
Professional Educator, 32(2), 1.
Pinder, C. C. (2014). Work motivation in organizational behavior. Abingdon, UK:
Psychology Press.
Powell, R. A., Honey, P. L., & Symbaluk, D. G. (2016). Introduction to learning and
behavior. Boston, MA: Cengage Learning.
Pragya, S., & Sandeep, M. (2015). Job satisfaction: A comparative study of private and
public sector banks. Advances in Management, 8(4), 12.
Prather, L. (2015, April 27). How to be a teacher leader [Web log post]. Retrieved from
https://www.teachingquality.org/content/blogs/liz-prather/how-be-teacher-leader

127
Provini, C. (2017, April 11). Best practices for professional learning communities.
Education World. Retrieved from http://www.educationworld.com/a_ admin/best-
practices-for-professional-learning-communities.shtml
Rabadi, S. (2014, May 1). 19 proven tips for getting parents involved at school [Web log
post]. Retrieved from https://www.edutopia.org/groups/classroom-
management/783266
Ravitch, D. (2016). The death and life of the great American school system: How testing
and choice are undermining education. New York, NY: Basic Books.
Reijseger, G., Peeters, M. C., Taris, T. W., & Schaufeli, W. B. (2016). From motivation
to activation: Why engaged workers are better performers. Journal of Business
and Psychology, 32(2), 117-130.
Reilly, E., Dhingra, K., & Boduszek, D. (2014). Teachers’ self-efficacy beliefs, self-
esteem, and job stress as determinants of job satisfaction. International Journal of
Educational Management, 28(4), 365-378.
Richards, K. A. R., Levesque-Bristol, C., & Templin, T. J. (2014). Initial validation of the
teacher/coach role conflict scale. Measurement in Physical Education and
Exercise Science, 18(4), 259-272.
Riza, S. D., Ganzach, Y., & Liu, Y. (2015). Time and job satisfaction: A longitudinal
study of the differential roles of age and tenure. Journal of Management.
Retrieved from http://eprints.lse.ac.uk/64664/1/__lse.ac.uk_storage_
128
LIBRARY_Secondary_libfile_shared_repository_Content_Dobrow%20Riza,%20
S_Time%20and%20job%20satisfaction_Riza_Time%20and%20job%20satisfacti
on_2015.pdf
Ruhe, N. (2015, July 1). Report: For employee job satisfaction, healthcare benefits take
priority over salary. MedCity News. Retrieved from http://medcitynews.com/
2015/07/healthcare-benefits-are-taking-precedence-over-salary-in-terms-of-
employee-job-satisfaction/
Ryan, A. M., Kuusinen, C. M., & Bedoya-Skoog, A. (2015). Managing peer relations: A
dimension of teacher self-efficacy that varies between elementary and middle
school teachers and is associated with observed classroom quality. Contemporary
Educational Psychology, 41, 147-156.
Sarbin, T. (2013). Cross-age tutoring and social identity. In V. Allen (Ed.), Children as
teachers: Theory and research on tutoring (pp. 27-40). New York, NY: Academic
Press.
Schanzenbach, D. W. (2014). Does class size matter? Boulder, CO: National Education
Policy Center. Retrieved from http://nepc.colorado.edu/files/pb_-_class_size.pdf
Schmeck, R. R. (Ed.). (2013). Learning strategies and learning styles. New York, NY:
Springer Science & Business Media.
Seligman, M. E., & Csikszentmihalyi, M. (2014). Positive psychology: An introduction.
American Psychologist, 55(1), 5-14.

129
Sigma Centre for Excellence in Mathematics & Statistics Support. (2017). Statistical
analysis 5: Chi-squared test for 2-way tables. Retrieved from
http://www.statstutor.ac.uk/resources/uploaded/coventrychisquared.pdf
Silverman, D. (2016). Qualitative research (4th ed.). Thousand Oaks, CA: SAGE
Publishing Ltd.
Simon, N. S., & Johnson, S. M. (2015). Teacher turnover in high-poverty schools: What
we know and can do. Teachers College Record, 117(3), 1-36.
Singer, D., Lloyd, T., & Stanley, K. (2015, October 5). Funding Missouri’s public
schools comes down to one not-so-simple formula [Web log post]. Retrieved from
http://www.welivehere.show/posts/2016/3/29/funding-missouris-public-schools-
comes-down-to-one-not-so-simple-formula
Sivri, H., & Balci, E. (2015). Pre-service teachers’ classroom management self-efficacy
beliefs. International Online Journal of Educational Sciences, 7(4), 37-50.
Retrieved from http://www.iojes.net/userfiles/Article/IOJES_1882.pdf
Skaalvik, E. M., & Skaalvik, S. (2014). Teacher self-efficacy and perceived autonomy:
Relations with teacher engagement, job satisfaction, and emotional exhaustion.
Psychological Reports, 114(1), 68-77. Retrieved from
http://journals.sagepub.com/doi/pdf/10.2466/14.02.PR0.114k14w0
Social identity theory. (2016). Learning Theories. Retrieved from https://www.learning-
theories.com/social-identity-theory-tajfel-turner.html?
Social identity theory: Cognitive and motivational basis of intergroup differentiation.
(2017). In University of Twente. Retrieved from

130
https://www.utwente.nl/en/bms/communication-theories/sorted-by-
cluster/Interpersonal%20Communication%20and%20Relations/Social_Identity_T
heory/
Society for Human Resource Management (SHRM). (2016). Employee job satisfaction
and engagement: Revitalizing a changing workforce. Alexandria, VA: SHRM.
Retrieved from https://www.shrm.org/hr-today/trends-and-forecasting/research-
and-surveys/Documents/2016-Employee-Job-Satisfaction-and-Engagement-
Report.pdf
Song, S., & Mustafa, M. (2015). Factors impacting on teachers’ job satisfaction related to
science teaching: A mixed methods study. Science Education International, 26(3),
358-375.
Statistics Solutions. (2016). Conduct and interpret an independent sample t-test.
Retrieved from http://www.statisticssolutions.com/independent-sample-t-test/
Steijn, W. M. (2014). A developmental perspective regarding the behaviour of
adolescents, young adults, and adults on social network sites. Cyberpsychology:
Journal of Psychosocial Research on Cyberspace, 8(2). Retrieved from
http://www.cyberpsychology.eu/view.php?cisloclanku=2014050502
Stello, C. M. (2011). Herzberg’s two-factor theory of job satisfaction: An integrative
literature review. Unpublished paper presented at the 2011 Student Research
Conference, University of Minnesota, Minneapolis, MN. Retrieved from
http://www.cehd.umn.edu/olpd/research/studentconf/2011/stelloherzberg.pdf
Stockburger, D. (2017). Chi-square and tests of contingency tables. Retrieved from

131
http://www.psychstat.missouristate.edu/introbook/sbk28m.htm
Strauss, V. (2014, February 24). Class size matters a lot, research shows [Web log post].
Retrieved from https://www.washingtonpost.com/news/answer-
sheet/wp/2014/02/24/class-size-matters-a-lot-research-
shows/?utm_term=.91ce55fc3340
Struyven, K., & Vanthournout, G. (2014). Teachers’ exit decisions: An investigation into
the reasons why newly qualified teachers fail to enter the teaching profession or
why those who do enter do not continue teaching. Teaching and Teacher
Education, 43, 37-45.
Tajfel, H., & Turner, J. (2016). Social identity theory. In Learning theories in plain
English (Vol. 1) (pp. 115-116). Retrieved from https://www.learning-
theories.com/wp-content
/uploads/2015/12/LearningTheorieseBookv.9JFreePreview.pdf
Thibodeaux, A. K., Labat, M. B., Lee, D. E., & Labat, C. A. (2015). The effects of
leadership and high-stakes testing on teacher retention. Academy of Educational
Leadership Journal, 19(1), 227.
Walker, T. (2014, November 2). NEA survey: Nearly half of teachers consider leaving
profession due to standardized testing. NEA Today. Retrieved from
http://neatoday.org/2014/11/02/nea-survey-nearly-half-of-teachers-consider-
leaving-profession-due-to-standardized-testing-2/

132
Wang, H. (2013). Effects of self-efficacy and attributions (Master’s thesis, McGill
University). Retrieved from http://digitool.library.mcgill.ca/webclient/Stream
Gate?folder_id=0&dvs=1489257770593~851
Wang, H., Hall, N. C., & Rahimi, S. (2015). Self-efficacy and causal attributions in
teachers: Effects on burnout, job satisfaction, illness, and quitting intentions.
Teaching and Teacher Education, 47, 120-130.
Ward, S. (2015, April 10). Why has teacher morale plummeted? [Web log post].
Retrieved from http://www.newsweek.com/why-has-teacher-morale-plummeted-
321447
Webb, L., & Norton, M. (2013). Human resources administration: Personnel issues and
needs in education (6th ed.). Upper Saddle River, NJ: Prentice-Hall.
Webster, A., McNeish, D., Scott, S., Maynard, L., & Haywood, S. (2012). What
influences teachers to change their practice? A rapid research review (Short
Policy Report No. 12/07). Bristol, UK: Centre for Understanding Behaviour
Change. Retrieved from http://www.bristol.ac.uk/medialibrary/
sites/cubec/migrated/documents/pr7.pdf
Wong, C. A., & Laschinger, H. K. (2013). Authentic leadership, performance, and job
satisfaction: The mediating role of empowerment. Journal of Advanced
Nursing, 69(4), 947-959.
Zee, M., & Koomen, H. M. (2016). Teacher self-efficacy and its effects on classroom
processes, student academic adjustment, and teacher well-being: A synthesis of 40
years of research. Review of Educational Research, 86(4), 981-1015.
133
Vita
James Douglas Crawford was born in Osceola, Arkansas, on December 19, 1973.
He attended grade school and high school all in the same location. After finishing high
school, he attended College of the Ozarks. Immediately following graduation, he took
his first teaching job and quickly started to doubt if education was where he wanted to
spend the rest of his days. After three short years in education, he left the field to go into
retail management. His love for students and changing lives quickly took him back into
the education field.
During his tenure, James has played many roles. He has taught K-8 physical
education, 5-8 science, high school at-risk students, and elementary students, and has
served in administration K-12. During his time in education, he has slowly been earning
several degrees to better himself. He earned a Master’s Degree in 2007 and a Specialist
Degree in 2012.