TEACHER EMPLOYMENT AND DEPLOYMENT IN INDONESIA...
83
Opportunities for Equity, Efficiency and Quality Improvement i TEACHER EMPLOYMENT AND DEPLOYMENT IN INDONESIA OPPORTUNITIES FOR EQUITY, EFFICIENCY AND QUALITY IMPROVEMENT 45622 Public Disclosure Authorized Public Disclosure Authorized Public Disclosure Authorized Public Disclosure Authorized Public Disclosure Authorized Public Disclosure Authorized Public Disclosure Authorized Public Disclosure Authorized
Transcript of TEACHER EMPLOYMENT AND DEPLOYMENT IN INDONESIA...
Opportunities for Equity, Efficiency and Quality Improvement i
TEACHER EMPLOYMENT AND DEPLOYMENT IN INDONESIA
OPPORTUNITIES FOR EQUITY, EFFICIENCY AND QUALITY IMPROVEMENT
45622P
ublic
Dis
clos
ure
Aut
horiz
edP
ublic
Dis
clos
ure
Aut
horiz
edP
ublic
Dis
clos
ure
Aut
horiz
edP
ublic
Dis
clos
ure
Aut
horiz
edP
ublic
Dis
clos
ure
Aut
horiz
edP
ublic
Dis
clos
ure
Aut
horiz
edP
ublic
Dis
clos
ure
Aut
horiz
edP
ublic
Dis
clos
ure
Aut
horiz
ed
ii Teacher Employment and Deployment In Indonesia

Opportunities for Equity, Efficiency and Quality Improvement iii
ACKNOWLEDGMENTS
This report was prepared by a World Bank team in cooperation with a team from the Indonesian Ministry of National Education.
The study was led by a core Government team headed by Fasli Jalal, PhD (Director General for Quality Improvement of Teacher and Education Personnel, QITEP, also known by it’s Indonesian acronym, PMPTK) and Hendarman, PhD (PMPTK staff). The team involved in the study included Yukon Putra, Mardhatillah Mardjohan, M. Machin Ervan, Yuli R. Feizal, Yufiarti, Yendri Wirdha, Yayan Trisakti, Baby Purnomo, Juliansja and Ahmad Riswan. The Government team contributed greatly in conducting the survey, analysis, gathering of policy information and in dissemination of the results. Post-survey contributions - including the heading of a follow-up pilot on teacher employment and deployment - were received by Sumarna Surapranata, PhD.
World Bank members responsible for the preparation of the study and report included Mae Chu Chang (Lead Educator and Task Team Leader) and Susiana Iskandar (Senior Education Specialist). The main authors of the report are Ralph Rawlinson (Teacher Management Specialist), Andy Ragatz (Education Specialist, EASHD) and John Evans (Education Planning Specialist).
Members from various Indonesian universities assisted in the survey and produced district reports, including: DR. A.A. Istri Ngurah Marhaeni (IKIP Singaraja), DR. Meini Sondang Sumbawati (Universitas Negeri Surabaya), Sugirin Ph. D. (Universitas Negeri Yogyakarta), DR. Jasruddin (Universitas Negeri Makasar), DR. Max G. Ruindungan (Universitas Negeri Manado), DR. Mardjohan, M.Pd.Kons (Universitas Negeri Padang), DR. Djoko Saryono, M.Pd. (Universitas Negeri Malang), DR. Bunyamin (Universitas Pendidikan Indonesia), DR. Totok Sumaryanto F., M.Pd. (Universitas Negeri Semarang), DR. Sarson Pomalato (Universitas Negeri Gorontalo), Drs. Zulkifli Simatupang, M.Pd. (Universitas Negeri Medan), DR. Ilza Mayuni (Universitas Negeri Jakarta)
This study benefited greatly from inputs by Jups Kluyskens and Muhammad Firdaus in the area of civil service reform and Walter McMahon in the area of education finance, as well as from technical advice by Vicente Paqueo (Indonesia Country Sector Coordinator, Human Development), Dandan Chen (Senior Economist), F. Halsey Rogers (Senior Economist) and Menno Pradhan (Senior Education Economist). Editing by Ifran Kortschak also contributed to its enhancement.
The results of the study were presented by Hendarman, PhD at the East Asia & Pacific Region workshop, Developing and Managing Teachers for Better Education Outcomes, in Beijing, China in July 2007 where additional useful comments were received by an expert panel consisting of Louis Benveniste (Country Sector Coordinator, Thailand), Neil Baumgart (Professor Emeritus, University of West Sidney) and Kai-Ming Cheng (University of Hong Kong).
The study was prepared by the Human Development Sector Unit of the East Asia and the Pacific Region, headed by Emmanuel Y. Jimenez (Sector Director). Christopher Thomas (Education Sector Manager) contributed with valuable comments and quality assurance.
Although there were many contributions from various people, the findings, interpretations and conclusions of this paper are the responsibility of the authors and should not be attributed in any manner to the World Bank, to its affiliated organizations, to members of its Board of Executive Directors or to the countries they represent

iv Teacher Employment and Deployment In Indonesia
TABLE OF CONTENTS Acknowledgments................................................................................................................................... i 1. Executive Summary............................................................................................................................ 1 2. Context of the Study ........................................................................................................................... 5 3. Profile of the Indonesian Education System ..................................................................................... 7 4. Survey Analysis – Highlighting Efficiency, Equity and Quality Issues .............................................. 9
Summary of key variables ................................................................................................................. 9 Correlations ..................................................................................................................................... 10 Student-Teacher Ratio (STRs)......................................................................................................... 12 Distribution: The under and oversupply of teachers...................................................................... 16 Perceptions of teacher supply ........................................................................................................ 18 Teaching hours ................................................................................................................................ 21 Teacher type..................................................................................................................................... 23 Teacher Education Level ................................................................................................................. 25 Analysis summary ........................................................................................................................... 26
5. Major Employment and Deployment Issues ................................................................................... 27 Distribution: uneven distribution of teachers................................................................................ 27 Remote schools: inequities for remote schools............................................................................ 27 Workload: generally low workload, with great variation............................................................... 28 Excess: overall excess of staff ....................................................................................................... 28 Remuneration: relatively low remuneration, with wide variation in allowances......................... 29 Teacher quality: concern about teacher competencies................................................................ 29
6. Policy Responses to Major Issues ................................................................................................... 31 Distribution: uneven distribution of teachers................................................................................ 31 Remote schools: inequities for remote schools............................................................................ 32 Workloads: too low, too much variation ........................................................................................ 32 Excess: overall excess of staff ....................................................................................................... 33 Remuneration: relatively low remuneration, with wide variation in allowances......................... 33 Teacher quality: concern about quality of teacher competencies................................................ 34
7. Policy Recommendations Related to Issues................................................................................... 35 8. Feasibility Considerations................................................................................................................ 40
Status of policies ............................................................................................................................. 40 Governance provisions .................................................................................................................... 41 Organization structures and system capacity ................................................................................ 41 Service in remote schools ............................................................................................................... 42 Teacher demand and supply ........................................................................................................... 43 Potential for corruption ................................................................................................................... 43 Pilot study ........................................................................................................................................ 44 Required resources ......................................................................................................................... 44
9. Resource Implications ..................................................................................................................... 45 Teacher Law..................................................................................................................................... 45 Policy recommendations from this Study ...................................................................................... 47 Cost effectiveness associated with changing deployment policies............................................... 47 Summary.......................................................................................................................................... 49
10. Conclusion ...................................................................................................................................... 50 Bibliography.......................................................................................................................................... 52
Opportunities for Equity, Efficiency and Quality Improvement v
Annex A: Study Methodology ............................................................................................................... 53 Annex B: Education Sector Data.......................................................................................................... 55 Annex C: Survey Results by Public vs. Private Schools...................................................................... 56 Annex D: Matrix of Correlations for School and Teacher Variables .................................................. 57 Annex E: Examples and Case Studies................................................................................................ 58 Annex F: International Trends Relating to Teacher Employment and Deployment......................... 65 Annex G: Civil Service and Teacher Management .............................................................................. 69 Annex H: Related Considerations........................................................................................................ 73 List of Figures Figure 1 Summary of Primary and Junior Secondary School Correlations ...................................... 11 Figure 2 Cross-Country Comparison of Student-Teacher Ratios...................................................... 12 Figure 3 Junior Secondary School Student-Teacher Ratio by District .............................................. 13 Figure 4 Junior Secondary School Student-Teacher Ratio by District .............................................. 13 Figure 5 Primary School Student-Teacher Ratio by Urban-Rural-Remote ...................................... 14 Figure 6 Junior Secondary School Student-Teacher Ratio by Urban-Rural-Remote....................... 14 Figure 7 Primary School Student-Teacher Ratio and School Size .................................................... 15 Figure 8 Junior Secondary School Student-Teacher Ratio and School Size..................................... 15 Figure 9 Primary School Over or Undersupply by Location based on Current Entitlement............. 16 Figure 10 Primary School Over or Undersupply based on Current Entitlement............................... 17 Figure 11 Primary School Over or Undersupply based on Recommended Entitlement................... 17 Figure 12 Comparison of Student-Teacher Ratios by School Size Based on Various Formulas ..... 18 Figure 13 Primary School - Using Current Entitlement Formula...................................................... 19 Figure 14 Primary School - Based on Recommended Entitlement Formula ................................... 20 Figure 15 Junior Secondary School - Estimated Over or Undersupply ............................................ 20 Figure 16 Primary School: Teacher’s Average Teaching Hours vs. STR .......................................... 21 Figure 17 Junior Secondary: Teacher’s Average Teaching Hours vs. STR ....................................... 22 Figure 18 Junior Secondary Assigned Hours vs. Actual Hours Worked............................................ 23 Figure 19 Junior Secondary Level Assigned Hours vs. Actual Hours Worked.................................. 23 Figure 20 Primary School Percentage of Teacher Types by Urban-Rural-Remote.......................... 24 Figure 21 Junior Secondary Teacher Status by Urban-Rural-Remote ............................................. 24 Figure 22 National Education Levels by School Type ......................................................................... 25 Figure 23 Matrix of Correlations for School and Teacher Variables.................................................. 57 List of Tables Table 1 Summary of Survey Data for Key Variables by Location ....................................................... 10 Table 2 Primary School: Average Hours and Pct. Below Minimum................................................... 21 Table 3 Junior Secondary School: Average Hours and Pct. Below Minimum.................................. 22 Table 4 Requirements for Education Level before New Teacher Law .............................................. 25 Table 5 Survey Sample Education Levels of Primary School Teachers by Location......................... 26 Table 6 Cost of Upgrading Primary and Junior Secondary Teachers, 2007-2011............................. 45 Table 7 Cost of Incentives for Primary and Jr. Sec. Teachers in Special Areas ............................... 46 Table 8 Factors Linked to STR – recommended policies................................................................... 47 Table 9 Comparative Costs Based on Different STR Options............................................................. 48 Table 10 Survey Sample....................................................................................................................... 54 Table 11 Education Sector Data by Various Breakdowns................................................................... 55 Table 12 Summary of Key Variables by Public vs. Private Schools.................................................... 56


Opportunities for Equity, Efficiency and Quality Improvement 1
1. EXECUTIVE SUMMARY The effective management of Indonesia’s teaching force is of crucial importance to the development of the country’s educational system.
The morale and commitment of teachers depends to a large extent on the ways in which their recruitment, initial training, posting, in-service training, transfer, promotion, appraisal, and professional and administrative supervision are managed. Effective teacher management can lead to a competent, motivated, high quality teaching service.
Effective teacher management is also critical from a financial perspective. In the context of budgetary constraints, it is not realistic for Indonesia to aim at further expansion and a more equitable provision of education services irrespective of cost. Making sure that the teaching staff available are allocated and used in the most efficient way and that additional staff requirements are met in a cost-effective manner has become a high priority. At the same time, equitable staff allocation across all schools is essential.
With more than 2.6 million teachers in Indonesia1, the task of teacher management involves significant challenges. As part of the process of decentralization and the devolution of the national government’s areas of authority and responsibility in 2001, the responsibility for most matters related to the employment and deployment of teachers was transferred from the national to the district level. As a result of this devolution, a number of issues need to be addressed. In 2005, the Directorate General for Quality Improvement of Teacher and Education Personnel, with support from the World Bank, the Government of the Netherlands and AusAID, initiated a study on teacher management, the focus of which was on teacher employment and deployment in primary and junior secondary schools.
The study aimed to investigate the policies and practices governing teacher employment and deployment in such schools. The major issues investigated included the distribution of teachers, the staffing of remote schools, teachers’ workloads, the overall supply of teachers, teacher remuneration and teacher quality. A highly participatory case-study approach was used and included a field survey of 385 schools (276 primary, 70 junior secondary and 39 senior secondary) in 12 sampled districts/municipalities. In addition, a two-day workshop, involving representatives from all participating districts, was held to analyze the survey results and to determine policy implications.
Major Findings
The evidence provided by the data from the districts, together with the inputs and discussion at a follow-up workshop to discuss findings of the survey, identifies six major issues relating to teacher employment and deployment:
1 MoNE data from Balitbang, 2004

2 Teacher Employment and Deployment In Indonesia
1. Uneven distribution of teachers: The district data show that there are marked inequities in the deployment of teachers both across schools and districts. Some 68% of urban and 52% of rural primary schools have an excess of teachers, while 66% of remote schools have a deficit. The imbalance between urban and remote areas is not as marked in junior secondary schools. Overall, some 81% of junior secondary schools have an excess, while 13% have a deficit.2 There are also reported mismatches in regard to subject needs in schools compared with teacher expertise, particularly in English, sport and religion. Notwithstanding the question of excess and deficit of teachers in schools (point 4 below), it is clear that there is an uneven distribution of teachers across both schools and districts.
2. Inequities for remote schools: The district data indicate that there are acute shortages of staff in the majority of remote schools, with 93% claiming that they had a deficit.3 Although there is a requirement for teachers, as civil servants, to serve where they are posted, the policy is clearly not being consistently implemented. As a result of the deficits in the remote areas, some teachers have excessive workloads. These factors ultimately have an adverse impact the students. The deficit of teachers in remote areas has been explained in terms of resistance to postings in such areas due to lack of adequate housing; poor transport; domestic responsibilities; concerns about the isolation from family and friends; and the generally poor services and facilities in remote areas.
3. Teachers’ Low Workloads: There is great variation in the actual workloads of teachers. The district data show that almost half the primary teachers were reported to have a workload of less than the minimum of 18 hours per week. Amongst junior secondary teachers, some 44% work less than 18 hours.4 A major factor contributing to workload inequities is that specialist teachers, particularly those teaching sport and religious studies in smaller primary schools, may not have enough classes for a full teaching load. Similarly, most junior secondary teachers teach only one subject, which restricts flexibility in staff allocation and increases staffing requirements.
4. Excessive Staffing Levels: National educational policy stipulates that, after a school is given its minimum teacher entitlement, a student-teacher ratio (STR) in primary schools of 40:1 and in junior secondary schools of 28:1 is to be applied. These ratios are unrealistically high and are well in excess of comparable international STRs. In fact, the actual ratios found in Indonesian schools indicate that the policy is not being applied. The survey sample data show that the actual STR is 19.0 for primary schools and 15.6 for junior secondary schools.5 Available national data show ratios of 21:1 for primary schools and 14:1 for junior secondary schools.6 By comparison, the average STR amongst Asia/Pacific countries is approximately 31:1 for primary schools and 25:1 for junior secondary schools.7 Given the relatively low STRs and the relatively low workload noted above, it is reasonable to conclude that actual staffing levels in Indonesian primary and junior secondary schools are excessive.
2 Teacher Employment and Deployment survey, 2005 3 Ibid 4 Ibid 5 Ibid 6 MoNE data from Balitbang, 2004
7 Edstats online query database; note that the results for Indonesia in the Edstats database are in fact similar to the national data from Balitbang, so comparison of Indonesia data to international data appears valid.

Opportunities for Equity, Efficiency and Quality Improvement 3
5. Low Remuneration: It is generally acknowledged that teacher salaries are low compared with other civil servants with similar qualifications. Allowances paid to teachers vary greatly, depending on local circumstances. The field data show that only 36% of primary teachers and 52% of junior secondary teachers receive district allowances. Only 14% of primary teachers and 45% of junior secondary teachers receive a school level incentive. Unsurprisingly, inequities are most apparent in districts and/or school communities that do not have sufficient financial resources to pay allowances, rather than in better off district and/or communities. Anecdotal evidence suggests that the generally low level of remuneration affects teacher motivation, attendance, and performance, and that it is not uncommon for teachers to take a second job to make ends meet. The new Teacher Law is designed to address issues of remuneration, but in the context of quality where teachers are also expected to improve their skills and qualifications and meet minimum working hours in order to receive the remuneration. As increases in allowances will have significant nation-wide budgetary implications, the importance of efficiencies in teacher management have become even more critical.
6. The Quality of Teachers: Although the sample field study did not focus on the collection of specific data on the quality of teaching and learning nor on teacher competencies, these issues were raised extensively at the workshop to discuss the survey results. Apart from the generally low level of quality inputs (e.g. textbooks and teaching/learning materials), the factors above probably result in sub-optimal performance on the part of both teachers and students. The Teacher Law is partly intended to address issues related to teacher qualifications and certification, linking these to remuneration.
Policy Recommendations
Based on the findings of the Study, a total of 42 policies have been formulated. To address the six major issues summarized above. The reform of systems of teacher employment and deployment should be based on the following two broad policy thrusts:
Introducing system-wide equity in resource allocation by moving to a students – per - teacher school staffing entitlement and in so doing improving efficiency; and
Implementing policies that deploy teachers according to school needs, to improve equity, access and quality of education.
For ease of reference and follow-up, the recommendations have been grouped to align with likely administrative responsibilities:
Teacher recruitment, appointment, salaries and allowances; Classification of schools, Teacher posting, transfer and attendance; Teacher progression and promotion; Staffing of schools, Class size, including multigrade classes; Teaching workload; Teaching subjects; Student-staff ratios; Teacher housing in remote areas; and School mergers.
It is envisaged that through implementation of the recommended policies, Indonesia’s education system will achieve a more equitable and efficient distribution, which will improve both access and

4 Teacher Employment and Deployment In Indonesia
quality while also achieving significant financial savings. This study estimates that current teaching levels are 21% above optimal levels and that improved efficiencies could result in savings in salary costs in the vicinity of 5.8 trillion Rupiah per annum.8
In order for policies to be implemented effectively, all interested parties must be aware of and take into account the context and realities of the situation. Feasibility issues and activities relating to implementing the recommended policies from a government perspective include:
Status of current policies; Governance provisions; Organization and management structures; Capacity and systems; Service in remote schools; Teacher demand and supply; Potential for corruption; and Required resources.
In recognition of the magnitude of the challenges involved in reforming systems of teacher employment and deployment nation-wide, the report has identifies a suite (25) of the recommended polices for trial in a number of selected districts.
Conclusion
The importance of addressing the issues related to the employment and deployment of teachers cannot be overstated. The proposed initiatives have significant implications for improving equity and efficiency and are vital for achieving improved access to and an improved quality of Indonesia’s school system.
8 Study team estimates. See Section 0 for calculations
Opportunities for Equity, Efficiency and Quality Improvement 5
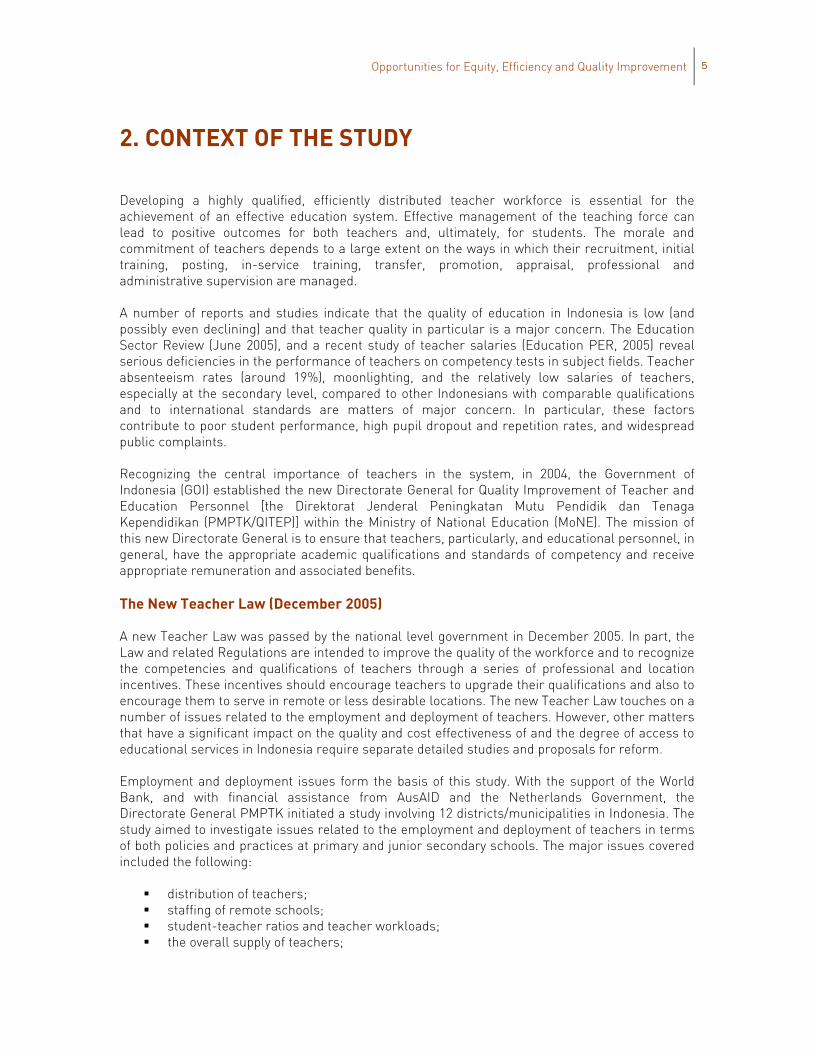
2. CONTEXT OF THE STUDY
Developing a highly qualified, efficiently distributed teacher workforce is essential for the achievement of an effective education system. Effective management of the teaching force can lead to positive outcomes for both teachers and, ultimately, for students. The morale and commitment of teachers depends to a large extent on the ways in which their recruitment, initial training, posting, in-service training, transfer, promotion, appraisal, professional and administrative supervision are managed.
A number of reports and studies indicate that the quality of education in Indonesia is low (and possibly even declining) and that teacher quality in particular is a major concern. The Education Sector Review (June 2005), and a recent study of teacher salaries (Education PER, 2005) reveal serious deficiencies in the performance of teachers on competency tests in subject fields. Teacher absenteeism rates (around 19%), moonlighting, and the relatively low salaries of teachers, especially at the secondary level, compared to other Indonesians with comparable qualifications and to international standards are matters of major concern. In particular, these factors contribute to poor student performance, high pupil dropout and repetition rates, and widespread public complaints.
Recognizing the central importance of teachers in the system, in 2004, the Government of Indonesia (GOI) established the new Directorate General for Quality Improvement of Teacher and Education Personnel [the Direktorat Jenderal Peningkatan Mutu Pendidik dan Tenaga Kependidikan (PMPTK/QITEP)] within the Ministry of National Education (MoNE). The mission of this new Directorate General is to ensure that teachers, particularly, and educational personnel, in general, have the appropriate academic qualifications and standards of competency and receive appropriate remuneration and associated benefits.
The New Teacher Law (December 2005)
A new Teacher Law was passed by the national level government in December 2005. In part, the Law and related Regulations are intended to improve the quality of the workforce and to recognize the competencies and qualifications of teachers through a series of professional and location incentives. These incentives should encourage teachers to upgrade their qualifications and also to encourage them to serve in remote or less desirable locations. The new Teacher Law touches on a number of issues related to the employment and deployment of teachers. However, other matters that have a significant impact on the quality and cost effectiveness of and the degree of access to educational services in Indonesia require separate detailed studies and proposals for reform.
Employment and deployment issues form the basis of this study. With the support of the World Bank, and with financial assistance from AusAID and the Netherlands Government, the Directorate General PMPTK initiated a study involving 12 districts/municipalities in Indonesia. The study aimed to investigate issues related to the employment and deployment of teachers in terms of both policies and practices at primary and junior secondary schools. The major issues covered included the following:
distribution of teachers; staffing of remote schools; student-teacher ratios and teacher workloads; the overall supply of teachers;

6 Teacher Employment and Deployment In Indonesia
teacher remuneration; and teacher quality.
A participative approach to the study was chosen for several reasons. A study across 12 districts has the advantage not only of obtaining first hand, accurate data from the field, but can also build on local knowledge and insights into issues related to the employment and deployment of teachers facing educational administrators at the school and district levels. District representatives included high level education officials from MoNE, civil service officials and university personnel – three sectors that are each critical in their own right to the design of sound policy reform. The partnership with university personnel added to the intellectual rigor of the study and also gave the universities an opportunity to focus on practical issues. The involvement of civil service personnel provided a valuable wider perspective.

Opportunities for Equity, Efficiency and Quality Improvement 7
3. PROFILE OF THE INDONESIAN EDUCATION SYSTEM
The Indonesian school system is immense and diverse. It comprises schools operated and managed under the auspices of the Ministry of National Education (MoNE) and the Ministry of Religious Affairs (MoRA), as well as private institutions. Unless otherwise indicated, the summary below focuses on primary and junior secondary schools within the public education sector9.
The schools
Throughout Indonesia, including MoNE, MoRA and private schools, there are more than 167,000 primary schools, 34,000 junior secondary schools and 17,000 senior secondary schools spread across some 440 districts and municipalities. The districts/municipalities themselves vary dramatically in terms of size, with populations ranging from 10,000 to 4.15 million. Per capita consumption ranges from Rp 1.0 M to Rp 7.6 M (approximately US$110 to US$835) per month10. The number of pupils at schools ranges from less than 45 at very small primary schools to more than 1000 at large junior secondary schools. Schools are not generally classified as urban, rural or remote. However, some schools are extremely isolated from Jakarta and/or their district centre and their remote location creates problems in terms of teacher employment and deployment. Unfortunately, no standard national definition of what constitutes a ‘remote location’ currently exists that allows for the quantitative analysis of this factor.
The students
There are currently approximately 29 million primary school students, 9.5 million junior secondary students and 5.9 million senior secondary students throughout Indonesia. At both the primary and junior secondary levels, approximately 49% are female while at the senior secondary level approximately 47% are female. Enrolments decline gradually from grade 1 to grade 6 and then drop dramatically upon entry to junior secondary education. Overall repetition rates for primary students are high at 3.8% per year. A matter for concern is that much of this repetition occurs at grade 1 level. The average annual drop out rate for primary students is 2.96%. Using the grade 1 student cohort from the 1998 school year as an example, some 73% of the cohort actually completed grade 6 and only 52% proceeded to year 1 junior secondary.11 Census data indicate that primary school enrolments are expected to decline very slightly over the next ten years. In the junior secondary sector, without significant changes to accessibility, enrolments are predicted to increase only slightly over the next decade.
9 With the exception of salaries data, the data are drawn from Statistik Persekolahan 2003/2004 SMP and SD and Profile Pendidik Dan Tenaga Kependidikan Di Indoneisa 2004. As national salary data were not readily available, the calculations have been based the sample schools in 12 districts. 10 Based on 2004 results of Indonesia’s annual household survey, Susenas. Consumption is a proxy for income. 11 Mone Balitbang Educational Statistics in Brief, 2004/2005, page 24
8 Teacher Employment and Deployment In Indonesia
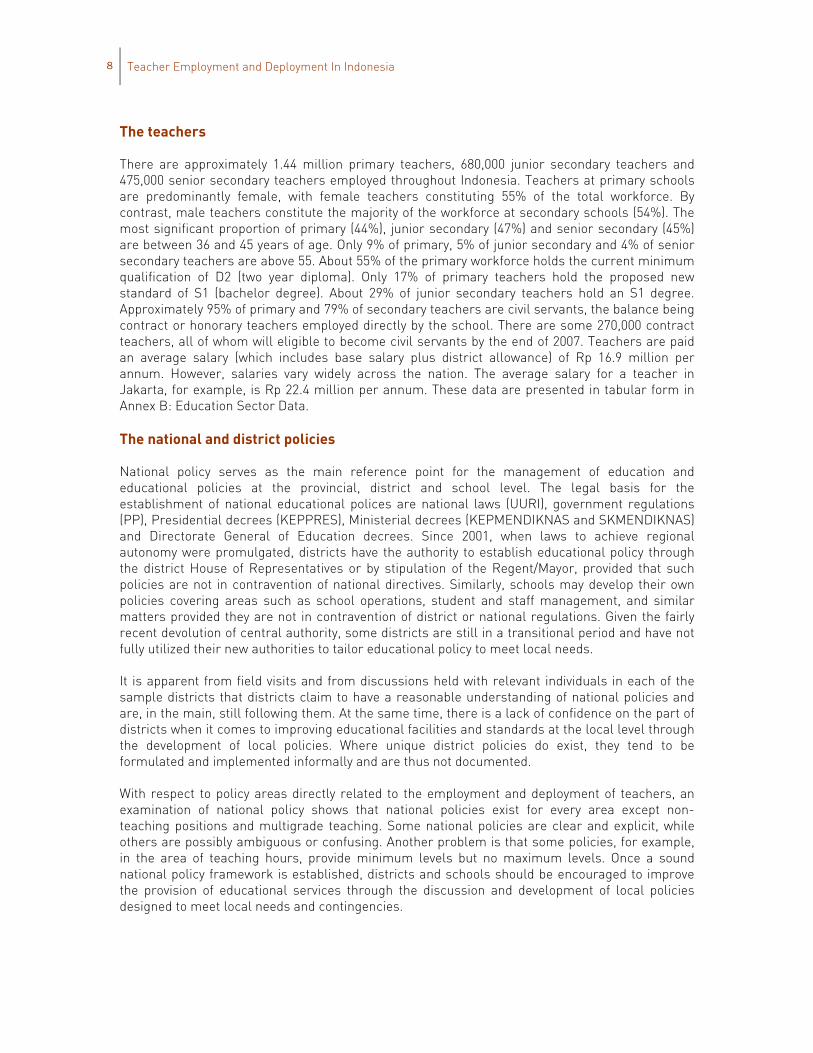
The teachers
There are approximately 1.44 million primary teachers, 680,000 junior secondary teachers and 475,000 senior secondary teachers employed throughout Indonesia. Teachers at primary schools are predominantly female, with female teachers constituting 55% of the total workforce. By contrast, male teachers constitute the majority of the workforce at secondary schools (54%). The most significant proportion of primary (44%), junior secondary (47%) and senior secondary (45%) are between 36 and 45 years of age. Only 9% of primary, 5% of junior secondary and 4% of senior secondary teachers are above 55. About 55% of the primary workforce holds the current minimum qualification of D2 (two year diploma). Only 17% of primary teachers hold the proposed new standard of S1 (bachelor degree). About 29% of junior secondary teachers hold an S1 degree. Approximately 95% of primary and 79% of secondary teachers are civil servants, the balance being contract or honorary teachers employed directly by the school. There are some 270,000 contract teachers, all of whom will eligible to become civil servants by the end of 2007. Teachers are paid an average salary (which includes base salary plus district allowance) of Rp 16.9 million per annum. However, salaries vary widely across the nation. The average salary for a teacher in Jakarta, for example, is Rp 22.4 million per annum. These data are presented in tabular form in Annex B: Education Sector Data.
The national and district policies
National policy serves as the main reference point for the management of education and educational policies at the provincial, district and school level. The legal basis for the establishment of national educational polices are national laws (UURI), government regulations (PP), Presidential decrees (KEPPRES), Ministerial decrees (KEPMENDIKNAS and SKMENDIKNAS) and Directorate General of Education decrees. Since 2001, when laws to achieve regional autonomy were promulgated, districts have the authority to establish educational policy through the district House of Representatives or by stipulation of the Regent/Mayor, provided that such policies are not in contravention of national directives. Similarly, schools may develop their own policies covering areas such as school operations, student and staff management, and similar matters provided they are not in contravention of district or national regulations. Given the fairly recent devolution of central authority, some districts are still in a transitional period and have not fully utilized their new authorities to tailor educational policy to meet local needs.
It is apparent from field visits and from discussions held with relevant individuals in each of the sample districts that districts claim to have a reasonable understanding of national policies and are, in the main, still following them. At the same time, there is a lack of confidence on the part of districts when it comes to improving educational facilities and standards at the local level through the development of local policies. Where unique district policies do exist, they tend to be formulated and implemented informally and are thus not documented.
With respect to policy areas directly related to the employment and deployment of teachers, an examination of national policy shows that national policies exist for every area except non-teaching positions and multigrade teaching. Some national policies are clear and explicit, while others are possibly ambiguous or confusing. Another problem is that some policies, for example, in the area of teaching hours, provide minimum levels but no maximum levels. Once a sound national policy framework is established, districts and schools should be encouraged to improve the provision of educational services through the discussion and development of local policies designed to meet local needs and contingencies.
Opportunities for Equity, Efficiency and Quality Improvement 9
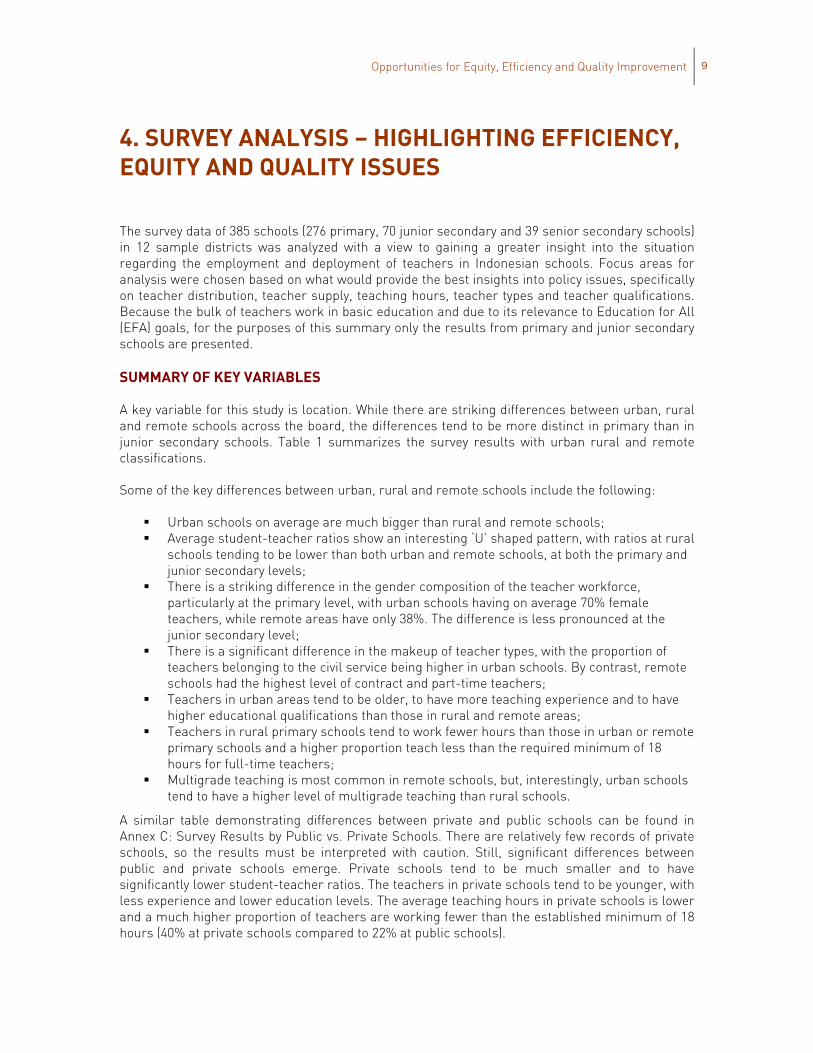
4. SURVEY ANALYSIS – HIGHLIGHTING EFFICIENCY, EQUITY AND QUALITY ISSUES The survey data of 385 schools (276 primary, 70 junior secondary and 39 senior secondary schools) in 12 sample districts was analyzed with a view to gaining a greater insight into the situation regarding the employment and deployment of teachers in Indonesian schools. Focus areas for analysis were chosen based on what would provide the best insights into policy issues, specifically on teacher distribution, teacher supply, teaching hours, teacher types and teacher qualifications. Because the bulk of teachers work in basic education and due to its relevance to Education for All (EFA) goals, for the purposes of this summary only the results from primary and junior secondary schools are presented.
SUMMARY OF KEY VARIABLES
A key variable for this study is location. While there are striking differences between urban, rural and remote schools across the board, the differences tend to be more distinct in primary than in junior secondary schools. Table 1 summarizes the survey results with urban rural and remote classifications.
Some of the key differences between urban, rural and remote schools include the following:
Urban schools on average are much bigger than rural and remote schools; Average student-teacher ratios show an interesting ‘U’ shaped pattern, with ratios at rural
schools tending to be lower than both urban and remote schools, at both the primary and junior secondary levels;
There is a striking difference in the gender composition of the teacher workforce, particularly at the primary level, with urban schools having on average 70% female teachers, while remote areas have only 38%. The difference is less pronounced at the junior secondary level;
There is a significant difference in the makeup of teacher types, with the proportion of teachers belonging to the civil service being higher in urban schools. By contrast, remote schools had the highest level of contract and part-time teachers;
Teachers in urban areas tend to be older, to have more teaching experience and to have higher educational qualifications than those in rural and remote areas;
Teachers in rural primary schools tend to work fewer hours than those in urban or remote primary schools and a higher proportion teach less than the required minimum of 18 hours for full-time teachers;
Multigrade teaching is most common in remote schools, but, interestingly, urban schools tend to have a higher level of multigrade teaching than rural schools.
A similar table demonstrating differences between private and public schools can be found in Annex C: Survey Results by Public vs. Private Schools. There are relatively few records of private schools, so the results must be interpreted with caution. Still, significant differences between public and private schools emerge. Private schools tend to be much smaller and to have significantly lower student-teacher ratios. The teachers in private schools tend to be younger, with less experience and lower education levels. The average teaching hours in private schools is lower and a much higher proportion of teachers are working fewer than the established minimum of 18 hours (40% at private schools compared to 22% at public schools).
10 Teacher Employment and Deployment In Indonesia
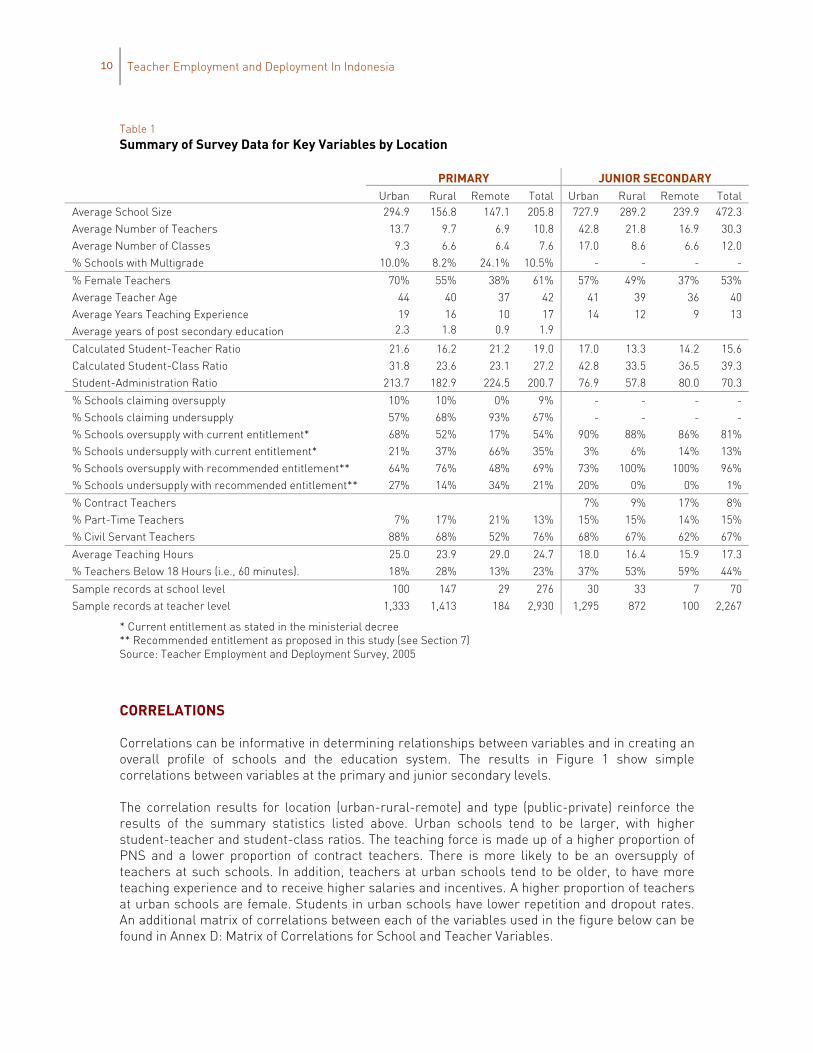
Table 1 Summary of Survey Data for Key Variables by Location
PRIMARY JUNIOR SECONDARY Urban Rural Remote Total Urban Rural Remote TotalAverage School Size 294.9 156.8 147.1 205.8 727.9 289.2 239.9 472.3Average Number of Teachers 13.7 9.7 6.9 10.8 42.8 21.8 16.9 30.3Average Number of Classes 9.3 6.6 6.4 7.6 17.0 8.6 6.6 12.0% Schools with Multigrade 10.0% 8.2% 24.1% 10.5% - - - -
% Female Teachers 70% 55% 38% 61% 57% 49% 37% 53%Average Teacher Age 44 40 37 42 41 39 36 40Average Years Teaching Experience 19 16 10 17 14 12 9 13Average years of post secondary education 2.3 1.8 0.9 1.9
Calculated Student-Teacher Ratio 21.6 16.2 21.2 19.0 17.0 13.3 14.2 15.6Calculated Student-Class Ratio 31.8 23.6 23.1 27.2 42.8 33.5 36.5 39.3Student-Administration Ratio 213.7 182.9 224.5 200.7 76.9 57.8 80.0 70.3
% Schools claiming oversupply 10% 10% 0% 9% - - - -% Schools claiming undersupply 57% 68% 93% 67% - - - -% Schools oversupply with current entitlement* 68% 52% 17% 54% 90% 88% 86% 81%% Schools undersupply with current entitlement* 21% 37% 66% 35% 3% 6% 14% 13%% Schools oversupply with recommended entitlement** 64% 76% 48% 69% 73% 100% 100% 96%% Schools undersupply with recommended entitlement** 27% 14% 34% 21% 20% 0% 0% 1%
% Contract Teachers 7% 9% 17% 8%% Part-Time Teachers 7% 17% 21% 13% 15% 15% 14% 15%% Civil Servant Teachers 88% 68% 52% 76% 68% 67% 62% 67%
Average Teaching Hours 25.0 23.9 29.0 24.7 18.0 16.4 15.9 17.3% Teachers Below 18 Hours (i.e., 60 minutes). 18% 28% 13% 23% 37% 53% 59% 44%
Sample records at school level 100 147 29 276 30 33 7 70Sample records at teacher level 1,333 1,413 184 2,930 1,295 872 100 2,267
* Current entitlement as stated in the ministerial decree ** Recommended entitlement as proposed in this study (see Section 7) Source: Teacher Employment and Deployment Survey, 2005
CORRELATIONS
Correlations can be informative in determining relationships between variables and in creating an overall profile of schools and the education system. The results in Figure 1 show simple correlations between variables at the primary and junior secondary levels.
The correlation results for location (urban-rural-remote) and type (public-private) reinforce the results of the summary statistics listed above. Urban schools tend to be larger, with higher student-teacher and student-class ratios. The teaching force is made up of a higher proportion of PNS and a lower proportion of contract teachers. There is more likely to be an oversupply of teachers at such schools. In addition, teachers at urban schools tend to be older, to have more teaching experience and to receive higher salaries and incentives. A higher proportion of teachers at urban schools are female. Students in urban schools have lower repetition and dropout rates. An additional matrix of correlations between each of the variables used in the figure below can be found in Annex D: Matrix of Correlations for School and Teacher Variables.

Opportunities for Equity, Efficiency and Quality Improvement 11
Remote schools also show distinct characteristics, which typically highlight the deficiencies of these schools. They tend to be smaller, but with higher student-teacher ratios and significantly higher dropout and repetition rates. The teacher profile is typically that of younger, less-experienced teachers, who work longer hours and receive lower pay and incentives.
Some other correlations of interest include: bigger schools have higher student-teacher ratios; contract teachers tend to be employed in schools with an undersupply (which indicates that contract teachers are being used to fill gaps); and in oversupplied schools, the teaching hours are lower and salaries also tend to be lower, although school incentives are higher.
While similar patterns could be found at both primary and junior secondary schools, the correlations tend to be less statistically significant for junior secondary schools. In large part, this is due to the fact that the study involved 276 primary schools, but only 70 junior secondary schools: with less data available, it is harder to achieve statistically significant results.
Figure 1 Summary of Primary and Junior Secondary School Correlations
PRIMARY SCHOOLS JUNIOR SECONDARY SCHOOLS
URBAN REMOTE LOCATION** PRIVATE URBAN REMOTE LOCATION** PRIVATE
School SizeStudent-Teacher RatioStudent-Class RatioPublic-PrivatePct. PNS TeachersPct. Contract TeachersMultigrade ClassOversupplyRepetition RateDropout RateTeaching HoursTeaching ExperienceAgeSalaryDistrict IncentiveSchool IncentiveFemale TeacherTeacher Education Level
** LOCATION = 1 if urban, 2 if rural, 3 if remote so a positive correlation indicates thatthe variable of interest tends to increase when moving from urban to rural to remote
Highly positive correlation (statistically significant to 0.1%)Strong Positive Correlation (statistically significant to 1%)Positive correlation (statistically significant to 5%)Correlation not statistically significantNegative correlation (statistically significant to 5%)Strong negative correlation (statistically significant to 1%)Highly negative correlation (statistically significant to 0.1%)
Source: Teacher Employment and Deployment Survey, 2005
12 Teacher Employment and Deployment In Indonesia
STUDENT-TEACHER RATIO (STRS)
Student-teacher ratios are often used to measure the quality and efficiency of an educational system, although the correlations are not necessarily linear. A high STR can be an indicator of poor quality because students are not given as much individual attention. A low STR, on the other hand, can be an indicator of inefficiency and can result in a significant burden on an education system, given that teacher salaries typically comprise a high proportion of an overall education budget.
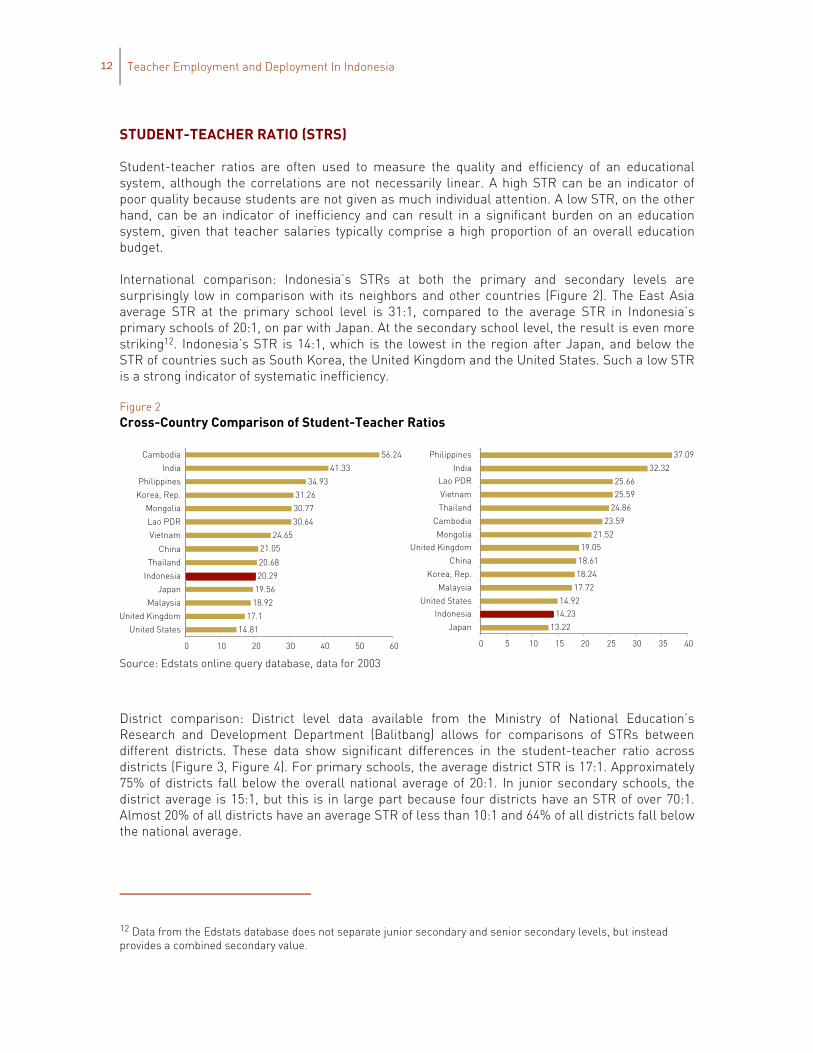
International comparison: Indonesia’s STRs at both the primary and secondary levels are surprisingly low in comparison with its neighbors and other countries (Figure 2). The East Asia average STR at the primary school level is 31:1, compared to the average STR in Indonesia’s primary schools of 20:1, on par with Japan. At the secondary school level, the result is even more striking12. Indonesia’s STR is 14:1, which is the lowest in the region after Japan, and below the STR of countries such as South Korea, the United Kingdom and the United States. Such a low STR is a strong indicator of systematic inefficiency.
Figure 2 Cross-Country Comparison of Student-Teacher Ratios
14.81
17.1
18.92
19.56
20.29
20.68
21.05
24.65
30.64
30.77
31.26
34.93
41.33
56.24
0 10 20 30 40 50 60
United States
United Kingdom
Malaysia
Japan
Indonesia
Thailand
China
Vietnam
Lao PDR
Mongolia
Korea, Rep.
Philippines
India
Cambodia
13.22
14.2314.92
17.72
18.24
18.61
19.0521.52
23.59
24.86
25.5925.66
32.32
37.09
0 5 10 15 20 25 30 35 40
Japan
IndonesiaUnited States
Malaysia
Korea, Rep.
China
United KingdomMongolia
Cambodia
Thailand
Vietnam
Lao PDRIndia
Philippines
Source: Edstats online query database, data for 2003
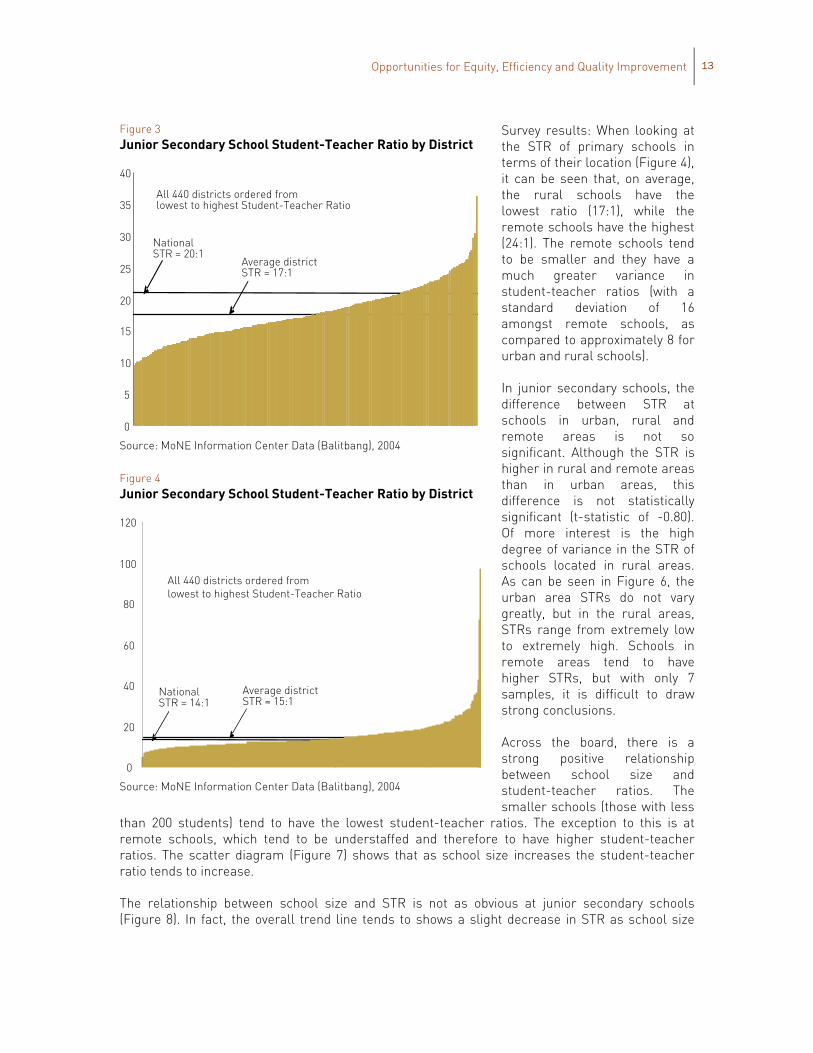
District comparison: District level data available from the Ministry of National Education’s Research and Development Department (Balitbang) allows for comparisons of STRs between different districts. These data show significant differences in the student-teacher ratio across districts (Figure 3, Figure 4). For primary schools, the average district STR is 17:1. Approximately 75% of districts fall below the overall national average of 20:1. In junior secondary schools, the district average is 15:1, but this is in large part because four districts have an STR of over 70:1. Almost 20% of all districts have an average STR of less than 10:1 and 64% of all districts fall below the national average.
12 Data from the Edstats database does not separate junior secondary and senior secondary levels, but instead provides a combined secondary value.
Opportunities for Equity, Efficiency and Quality Improvement 13
Survey results: When looking at the STR of primary schools in terms of their location (Figure 4), it can be seen that, on average, the rural schools have the lowest ratio (17:1), while the remote schools have the highest (24:1). The remote schools tend to be smaller and they have a much greater variance in student-teacher ratios (with a standard deviation of 16 amongst remote schools, as compared to approximately 8 for urban and rural schools).
In junior secondary schools, the difference between STR at schools in urban, rural and remote areas is not so significant. Although the STR is higher in rural and remote areas than in urban areas, this difference is not statistically significant (t-statistic of -0.80). Of more interest is the high degree of variance in the STR of schools located in rural areas. As can be seen in Figure 6, the urban area STRs do not vary greatly, but in the rural areas, STRs range from extremely low to extremely high. Schools in remote areas tend to have higher STRs, but with only 7 samples, it is difficult to draw strong conclusions.
Across the board, there is a strong positive relationship between school size and student-teacher ratios. The smaller schools (those with less
than 200 students) tend to have the lowest student-teacher ratios. The exception to this is at remote schools, which tend to be understaffed and therefore to have higher student-teacher ratios. The scatter diagram (Figure 7) shows that as school size increases the student-teacher ratio tends to increase.
The relationship between school size and STR is not as obvious at junior secondary schools (Figure 8). In fact, the overall trend line tends to shows a slight decrease in STR as school size
Figure 3 Junior Secondary School Student-Teacher Ratio by District
30
35
40
Average districtSTR = 17:1
NationalSTR = 20:1
All 440 districts ordered fromlowest to highest Student-Teacher Ratio
0
5
10
15
20
25
Source: MoNE Information Center Data (Balitbang), 2004
Figure 4 Junior Secondary School Student-Teacher Ratio by District
0
20
40
60
80
100
120
Average districtSTR = 15:1
NationalSTR = 14:1
All 440 districts ordered fromlowest to highest Student-Teacher Ratio
Source: MoNE Information Center Data (Balitbang), 2004

14 Teacher Employment and Deployment In Indonesia
increases. Although smaller schools tend to have lower STRs, there are many outliers and if the three rural outliers in Figure 8 are excluded then the trend line shows an increase.
Figure 5 Primary School Student-Teacher Ratio by Urban-Rural-Remote
Proposed STR target
Current Policy
Urban Rural Remote0
10
20
30
40
50
60
70
80
90
Schools grouped by location and ordered fromlowest to highest student-teacher ratio
Source: Teacher Employment and Deployment Survey, 2005
Figure 6 Junior Secondary School Student-Teacher Ratio by Urban-Rural-Remote
Proposed STR targetCurrent Policy
Urban Rural Remote0
20
40
60
80
100
120Schools grouped by location and ordered fromlowest to highest student-teacher ratio
Source: Teacher Employment and Deployment Survey, 2005

Opportunities for Equity, Efficiency and Quality Improvement 15
Figure 7 Primary School Student-Teacher Ratio and School Size
-200
0
200
400
600
800
1000
0 20 40 60 80 100
Student-Teacher Ratio
School Size(number of students)
UrbanRuralRemoteLinear (Rural)Linear (Remote)Linear (Urban)
Source: Teacher Employment and Deployment Survey, 2005
Figure 8 Junior Secondary School Student-Teacher Ratio and School Size
0
200
400
600
800
1000
1200
1400
0 20 40 60 80 100 120
Student-Teacher Ratio
Scho
ol S
ize
(num
ber
of S
tude
nts)
UrbanRuralRemote
Source: Teacher Employment and Deployment Survey, 2005
16 Teacher Employment and Deployment In Indonesia
DISTRIBUTION: THE UNDER AND OVERSUPPLY OF TEACHERS
One of the critical goals of this study is to determine whether there is an equitable and efficient distribution of teachers. The entitlement formula for primary schools is defined in a ministerial decree as a student-teacher ratio (STR) of 40:1, with all schools required to have at least nine teachers: 6 classroom teachers + 1 head teacher + 1 sports teacher + 1 religion teacher. Based on the number of classroom teachers, schools with less than 240 students are automatically entitled to 9 teachers (6 classes multiplied by 40 students). Schools with more than 240 students then begin applying the STR of 40:1.
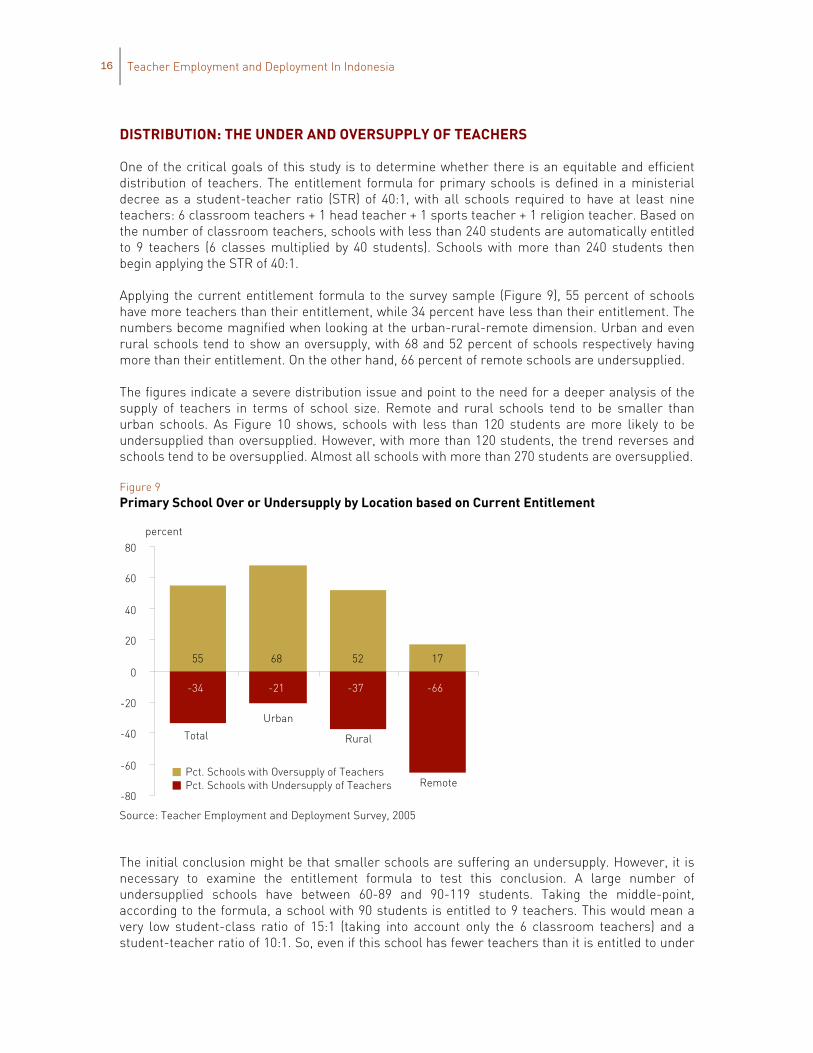
Applying the current entitlement formula to the survey sample (Figure 9), 55 percent of schools have more teachers than their entitlement, while 34 percent have less than their entitlement. The numbers become magnified when looking at the urban-rural-remote dimension. Urban and even rural schools tend to show an oversupply, with 68 and 52 percent of schools respectively having more than their entitlement. On the other hand, 66 percent of remote schools are undersupplied.
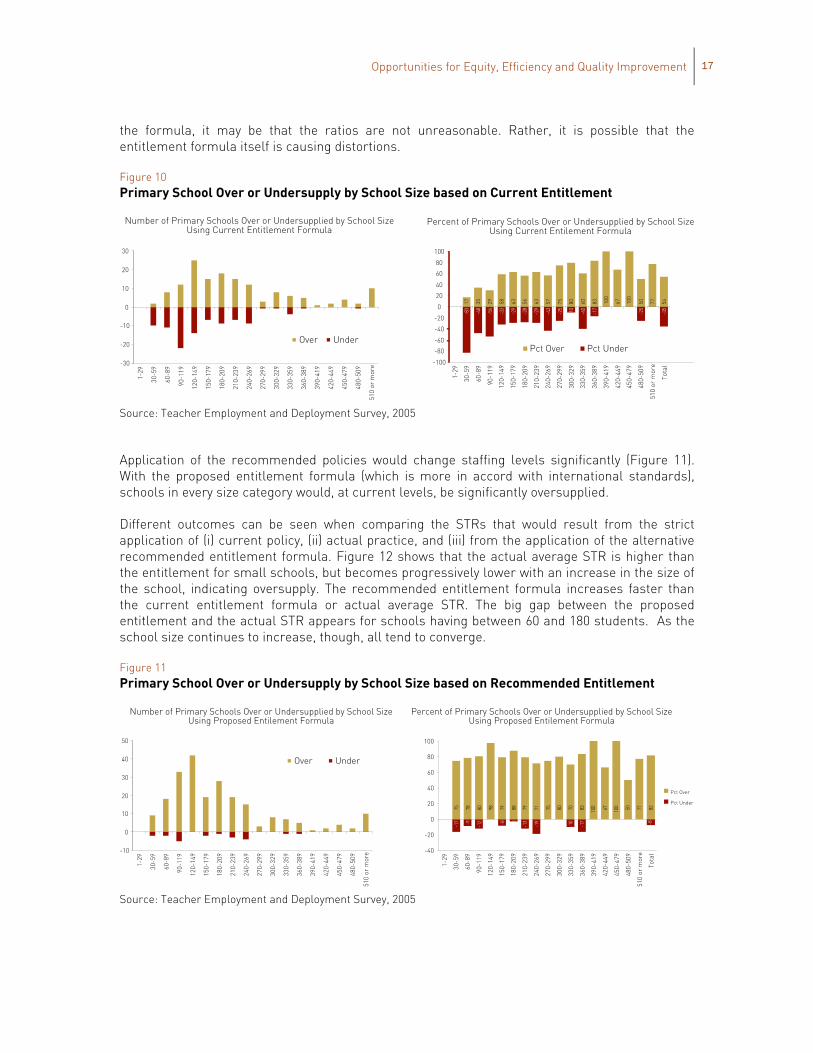
The figures indicate a severe distribution issue and point to the need for a deeper analysis of the supply of teachers in terms of school size. Remote and rural schools tend to be smaller than urban schools. As Figure 10 shows, schools with less than 120 students are more likely to be undersupplied than oversupplied. However, with more than 120 students, the trend reverses and schools tend to be oversupplied. Almost all schools with more than 270 students are oversupplied.
Figure 9 Primary School Over or Undersupply by Location based on Current Entitlement
55 68 52 17
-34 -21 -37 -66
-80
-60
-40
-20
0
20
40
60
80
Total
Urban
Rural
RemotePct. Schools with Oversupply of TeachersPct. Schools with Undersupply of Teachers
percent
Source: Teacher Employment and Deployment Survey, 2005
The initial conclusion might be that smaller schools are suffering an undersupply. However, it is necessary to examine the entitlement formula to test this conclusion. A large number of undersupplied schools have between 60-89 and 90-119 students. Taking the middle-point, according to the formula, a school with 90 students is entitled to 9 teachers. This would mean a very low student-class ratio of 15:1 (taking into account only the 6 classroom teachers) and a student-teacher ratio of 10:1. So, even if this school has fewer teachers than it is entitled to under
Opportunities for Equity, Efficiency and Quality Improvement 17
the formula, it may be that the ratios are not unreasonable. Rather, it is possible that the entitlement formula itself is causing distortions.
Figure 10 Primary School Over or Undersupply by School Size based on Current Entitlement
Number of Primary Schools Over or Undersupplied by School SizeUsing Current Entitlement Formula
-30
-20
-10
0
10
20
30
1-29
30-5
9
60-8
9
90-1
19
120-
149
150-
179
180-
209
210-
239
240-
269
270-
299
300-
329
330-
359
360-
389
390-
419
420-
449
450-
479
480-
509
510
or m
ore
Percent of Primary Schools Over or Undersupplied by School SizeUsing Current Entilement Formula
-83
-48
-54
-33
-29
-28
-29
-43
-25
-10
-40
-17
-25
-35
17 35 29 58 63 56 63 57 75 80 60 83 100
67 100
50 77 54
-100
-80
-60
-40
-20
0
20
40
60
80
100
1-29
30-5
9
60-8
9
90-1
19
120-
149
150-
179
180-
209
210-
239
240-
269
270-
299
300-
329
330-
359
360-
389
390-
419
420-
449
450-
479
480-
509
510
or m
ore
Tota
l
Pct Over Pct Under
100
100
Over Under
Source: Teacher Employment and Deployment Survey, 2005
Application of the recommended policies would change staffing levels significantly (Figure 11). With the proposed entitlement formula (which is more in accord with international standards), schools in every size category would, at current levels, be significantly oversupplied.
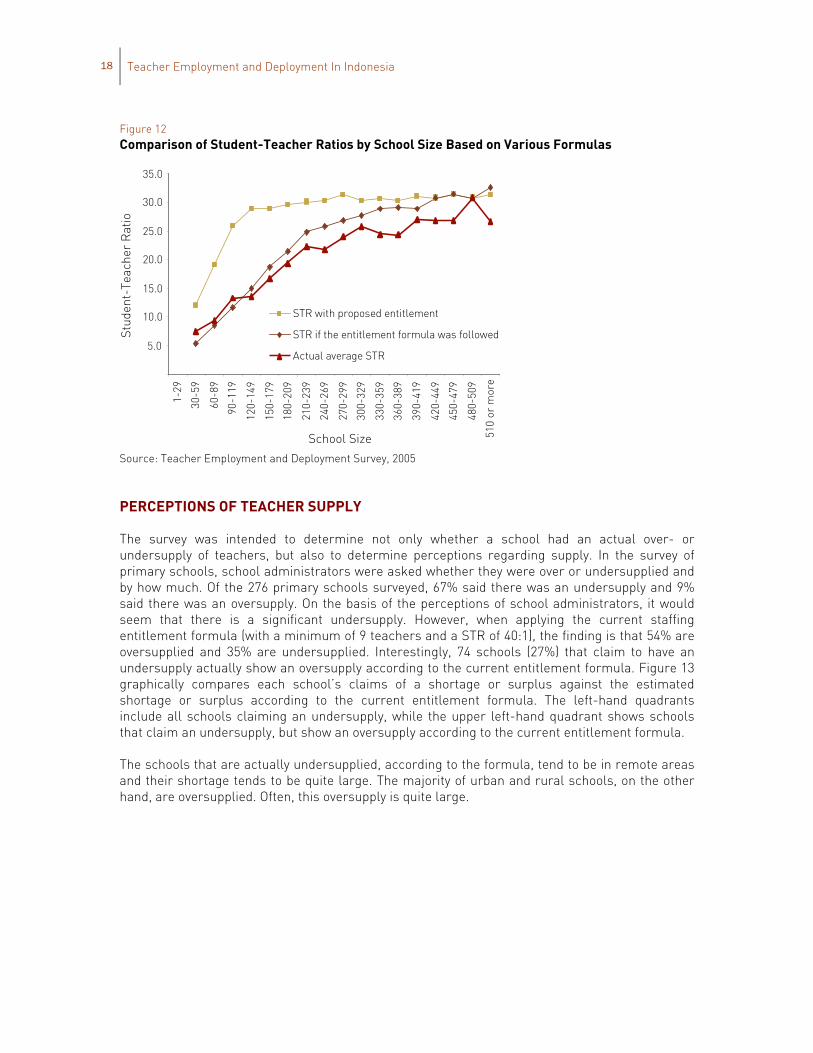
Different outcomes can be seen when comparing the STRs that would result from the strict application of (i) current policy, (ii) actual practice, and (iii) from the application of the alternative recommended entitlement formula. Figure 12 shows that the actual average STR is higher than the entitlement for small schools, but becomes progressively lower with an increase in the size of the school, indicating oversupply. The recommended entitlement formula increases faster than the current entitlement formula or actual average STR. The big gap between the proposed entitlement and the actual STR appears for schools having between 60 and 180 students. As the school size continues to increase, though, all tend to converge.
Figure 11 Primary School Over or Undersupply by School Size based on Recommended Entitlement
-10
0
10
20
30
40
50
1-29
30-5
9
60-8
9
90-1
19
120-
149
150-
179
180-
209
210-
239
240-
269
270-
299
300-
329
330-
359
360-
389
390-
419
420-
449
450-
479
480-
509
510
or m
ore
Over Under
Percent of Primary Schools Over or Undersupplied by School SizeUsing Proposed Entilement Formula
-17 -9 -12 -8 -3 -13
-19
-10
-17 -8
75 78 80 98 79 88 79 71 75 80 70 83 100 67 100 50 77 82
-40
-20
0
20
40
60
80
100
1-29
30-5
9
60-8
9
90-1
19
120-
149
150-
179
180-
209
210-
239
240-
269
270-
299
300-
329
330-
359
360-
389
390-
419
420-
449
450-
479
480-
509
510
or m
ore
Tota
l
Pct Over
Pct Under
Number of Primary Schools Over or Undersupplied by School SizeUsing Proposed Entilement Formula
Source: Teacher Employment and Deployment Survey, 2005
18 Teacher Employment and Deployment In Indonesia
Figure 12 Comparison of Student-Teacher Ratios by School Size Based on Various Formulas
5.0
10.0
15.0
20.0
25.0
30.0
35.01-
29
30-5
9
60-8
9
90-1
19
120-
149
150-
179
180-
209
210-
239
240-
269
270-
299
300-
329
330-
359
360-
389
390-
419
420-
449
450-
479
480-
509
510
or m
ore
School Size
Stud
ent-
Teac
her
Rat
io
STR with proposed entitlement
STR if the entitlement formula was followed
Actual average STR
Source: Teacher Employment and Deployment Survey, 2005
PERCEPTIONS OF TEACHER SUPPLY
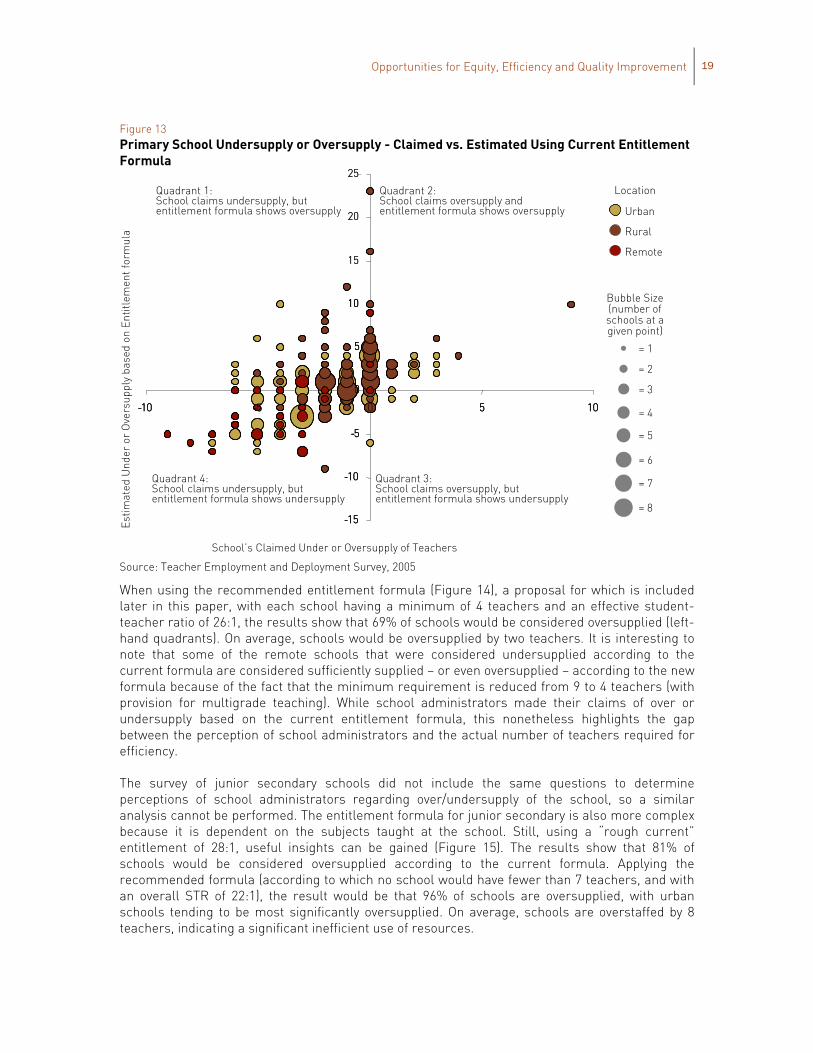
The survey was intended to determine not only whether a school had an actual over- or undersupply of teachers, but also to determine perceptions regarding supply. In the survey of primary schools, school administrators were asked whether they were over or undersupplied and by how much. Of the 276 primary schools surveyed, 67% said there was an undersupply and 9% said there was an oversupply. On the basis of the perceptions of school administrators, it would seem that there is a significant undersupply. However, when applying the current staffing entitlement formula (with a minimum of 9 teachers and a STR of 40:1), the finding is that 54% are oversupplied and 35% are undersupplied. Interestingly, 74 schools (27%) that claim to have an undersupply actually show an oversupply according to the current entitlement formula. Figure 13 graphically compares each school’s claims of a shortage or surplus against the estimated shortage or surplus according to the current entitlement formula. The left-hand quadrants include all schools claiming an undersupply, while the upper left-hand quadrant shows schools that claim an undersupply, but show an oversupply according to the current entitlement formula.
The schools that are actually undersupplied, according to the formula, tend to be in remote areas and their shortage tends to be quite large. The majority of urban and rural schools, on the other hand, are oversupplied. Often, this oversupply is quite large.
Opportunities for Equity, Efficiency and Quality Improvement 19
Figure 13 Primary School Undersupply or Oversupply - Claimed vs. Estimated Using Current Entitlement Formula
School’s Claimed Under or Oversupply of Teachers
Estim
ated
Und
er o
r O
vers
uppl
y ba
sed
on E
ntitl
emen
t for
mul
a
Urban
Rural
Remote
Quadrant 1:School claims undersupply, butentitlement formula shows oversupply
Quadrant 2:School claims oversupply andentitlement formula shows oversupply
Quadrant 4:School claims undersupply, butentitlement formula shows undersupply
Quadrant 3:School claims oversupply, butentitlement formula shows undersupply
Bubble Size(number ofschools at agiven point)
= 1
= 2
= 3
= 4
= 5
= 7
= 8
= 6
Location
-15
-10
-5
0
5
10
15
20
25
-10 -5 0 5 10
-15
-10
-5
0
5
10
15
20
25
-10 -5 0 5 10
-15
-10
-5
0
5
10
-10 -5 0 5 10
Source: Teacher Employment and Deployment Survey, 2005
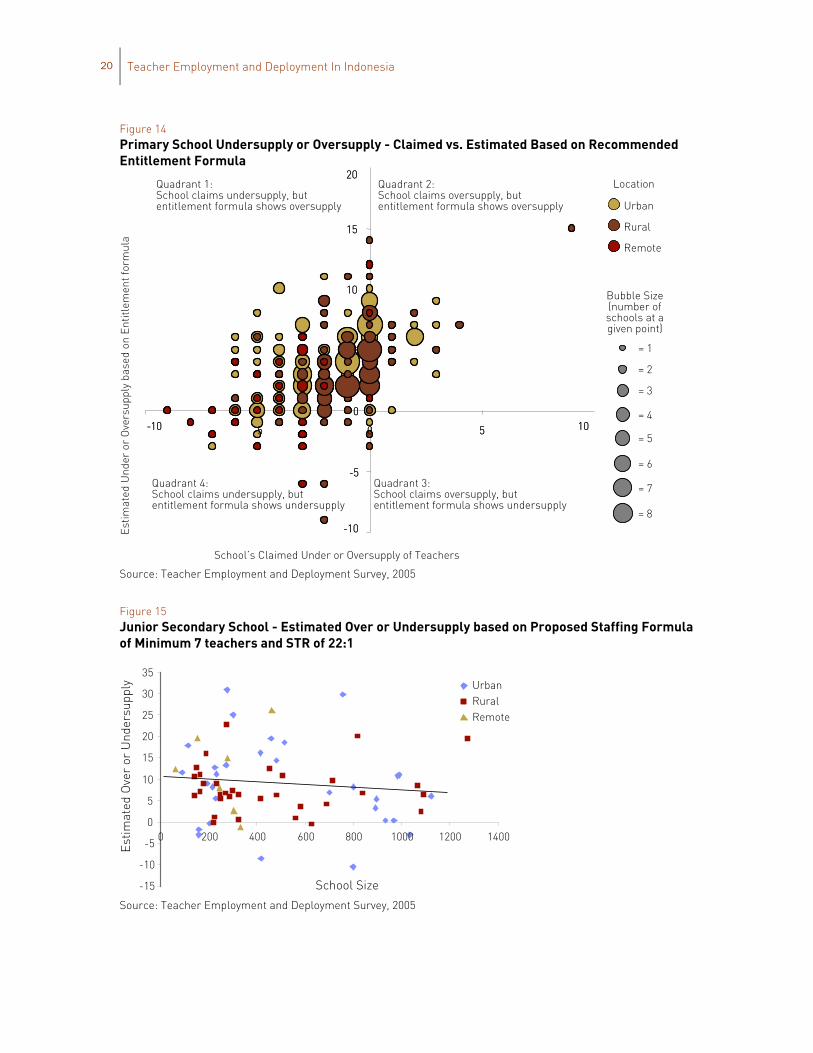
When using the recommended entitlement formula (Figure 14), a proposal for which is included later in this paper, with each school having a minimum of 4 teachers and an effective student-teacher ratio of 26:1, the results show that 69% of schools would be considered oversupplied (left-hand quadrants). On average, schools would be oversupplied by two teachers. It is interesting to note that some of the remote schools that were considered undersupplied according to the current formula are considered sufficiently supplied – or even oversupplied – according to the new formula because of the fact that the minimum requirement is reduced from 9 to 4 teachers (with provision for multigrade teaching). While school administrators made their claims of over or undersupply based on the current entitlement formula, this nonetheless highlights the gap between the perception of school administrators and the actual number of teachers required for efficiency.
The survey of junior secondary schools did not include the same questions to determine perceptions of school administrators regarding over/undersupply of the school, so a similar analysis cannot be performed. The entitlement formula for junior secondary is also more complex because it is dependent on the subjects taught at the school. Still, using a “rough current” entitlement of 28:1, useful insights can be gained (Figure 15). The results show that 81% of schools would be considered oversupplied according to the current formula. Applying the recommended formula (according to which no school would have fewer than 7 teachers, and with an overall STR of 22:1), the result would be that 96% of schools are oversupplied, with urban schools tending to be most significantly oversupplied. On average, schools are overstaffed by 8 teachers, indicating a significant inefficient use of resources.
20 Teacher Employment and Deployment In Indonesia
Figure 14 Primary School Undersupply or Oversupply - Claimed vs. Estimated Based on Recommended Entitlement Formula
-10
-5
0
5
10
15
20
-10 -5 0 5 10
School’s Claimed Under or Oversupply of Teachers
Estim
ated
Und
er o
r O
vers
uppl
y ba
sed
on E
ntitl
emen
t for
mul
a
Urban
Rural
Remote
Quadrant 1:School claims undersupply, butentitlement formula shows oversupply
Quadrant 2:School claims oversupply, butentitlement formula shows oversupply
Quadrant 4:School claims undersupply, butentitlement formula shows undersupply
Quadrant 3:School claims oversupply, butentitlement formula shows undersupply
Bubble Size(number ofschools at agiven point)
= 1
= 2
= 3
= 4
= 5
= 7
= 8
= 6
Location
-10
-5
0
5
10
15
20
-10 -5 0 5 10
Source: Teacher Employment and Deployment Survey, 2005
Figure 15 Junior Secondary School - Estimated Over or Undersupply based on Proposed Staffing Formula of Minimum 7 teachers and STR of 22:1
-15
-10
-5
0
5
10
15
20
25
30
35
0 200 400 600 800 1000 1200 1400
School Size
Estim
ated
Ove
r or
Und
ersu
pply Urban
RuralRemote
Source: Teacher Employment and Deployment Survey, 2005

Opportunities for Equity, Efficiency and Quality Improvement 21
TEACHING HOURS
In primary schools, the average hours worked is 24.7 (Table 2). The established minimum is 18 hours and 23% of all primary school teachers in the sample work less than this established minimum. The rural areas have a larger percentage of teachers who teach less than the minimum number of hours (28%). Remote areas have the smallest proportion of teachers teaching less than the minimum number of hours (13%) and have the highest average hours worked (29.0). This reflects the tendency for there to be an undersupply of teachers in remote areas and an oversupply in rural and urban areas.
Table 2 Primary School: Average Hours and Pct. Below Minimum Average Hours Pct. Teachers Below 18 Hrs. Urban 24.9 18% Rural 23.9 28% Remote 29.0 13% Total 24.7 23%
Source: Teacher Employment and Deployment Survey, 2005
As might be expected, in schools where the STR is low, teachers tend to work fewer hours. The scatter graph (Figure 16) for primary schools shows that, when comparing the number of hours taught by a specific teacher to the student-teacher ratio at that teacher’s school, teachers with lower hours tend to work at overstaffed (low STR) schools.
Figure 16 Primary School: Teacher’s Average Teaching Hours vs. STR at the Teacher’s School
0
10
20
30
40
50
60
70
80
90
0 20 40 60 80 100
Average Teaching Hours
Stud
ent-
Teac
her
Rat
io
UrbanRuralRemote
Source: Teacher Employment and Deployment Survey, 2005
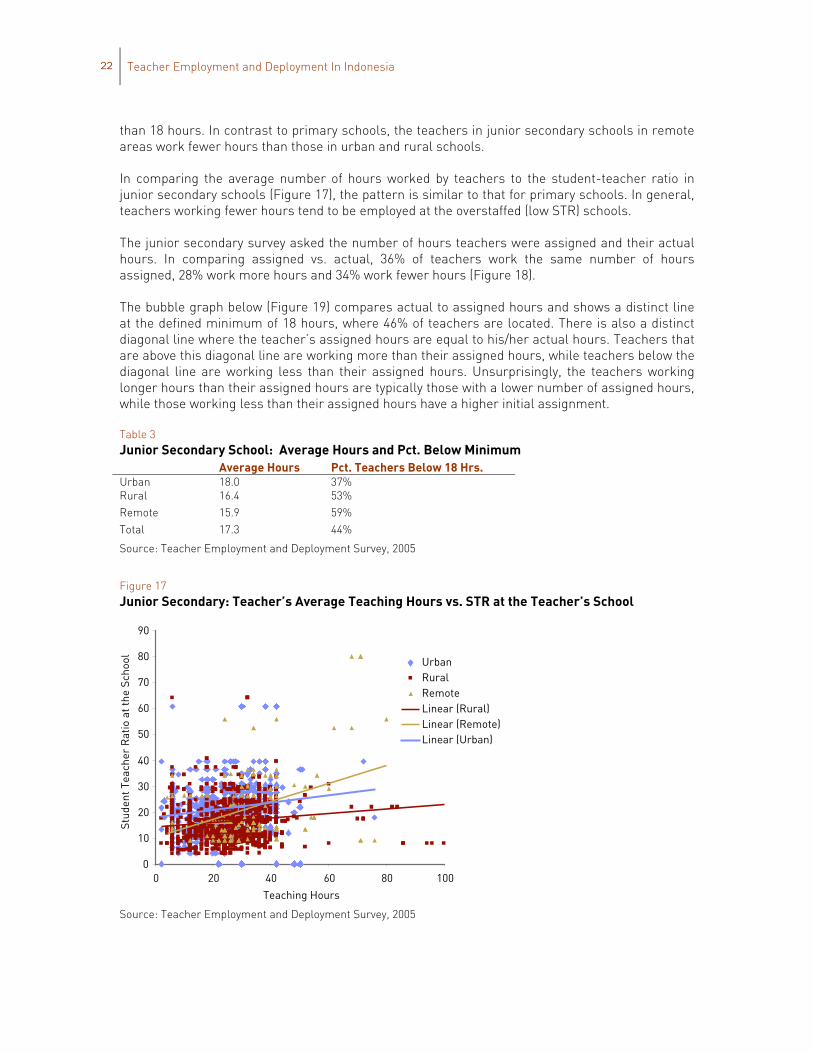
The average number of teaching hours at the junior secondary level (Table 3) is, at 17.3, considerably lower than in primary schools. Urban teachers tend to work longer than teachers in rural and remote areas on average. Interestingly, 44% of all junior secondary teachers work less
22 Teacher Employment and Deployment In Indonesia
than 18 hours. In contrast to primary schools, the teachers in junior secondary schools in remote areas work fewer hours than those in urban and rural schools.
In comparing the average number of hours worked by teachers to the student-teacher ratio in junior secondary schools (Figure 17), the pattern is similar to that for primary schools. In general, teachers working fewer hours tend to be employed at the overstaffed (low STR) schools.
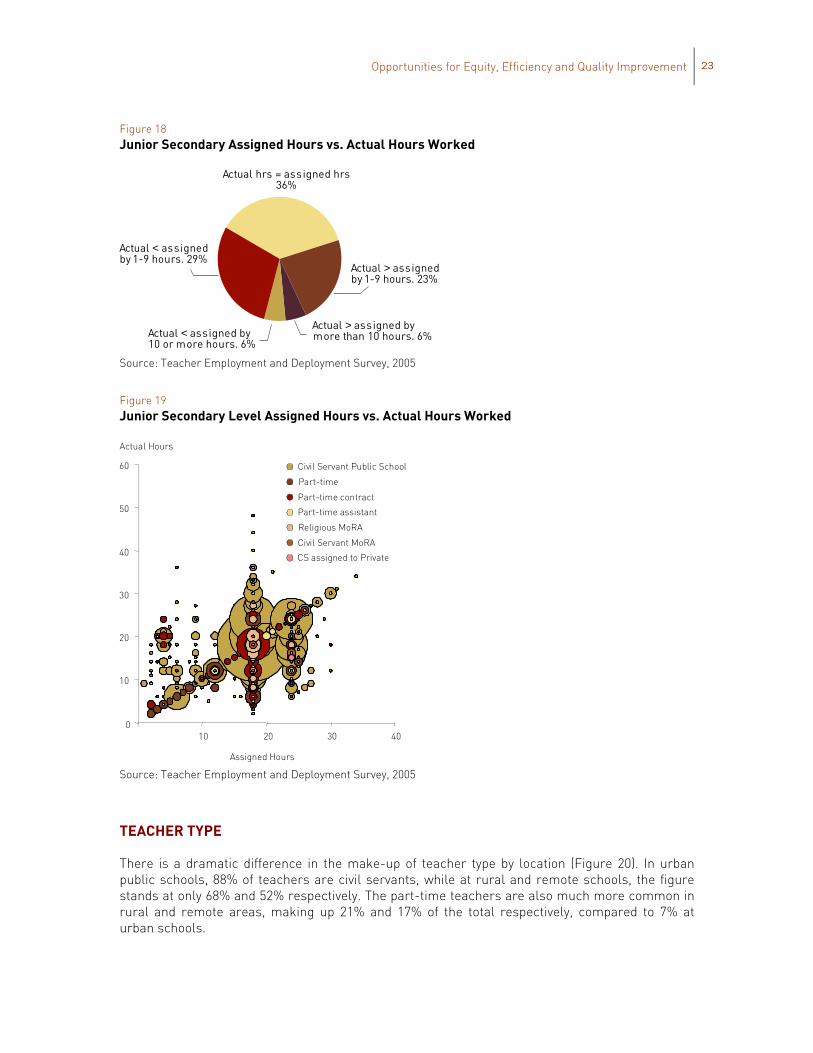
The junior secondary survey asked the number of hours teachers were assigned and their actual hours. In comparing assigned vs. actual, 36% of teachers work the same number of hours assigned, 28% work more hours and 34% work fewer hours (Figure 18).
The bubble graph below (Figure 19) compares actual to assigned hours and shows a distinct line at the defined minimum of 18 hours, where 46% of teachers are located. There is also a distinct diagonal line where the teacher’s assigned hours are equal to his/her actual hours. Teachers that are above this diagonal line are working more than their assigned hours, while teachers below the diagonal line are working less than their assigned hours. Unsurprisingly, the teachers working longer hours than their assigned hours are typically those with a lower number of assigned hours, while those working less than their assigned hours have a higher initial assignment.
Table 3 Junior Secondary School: Average Hours and Pct. Below Minimum Average Hours Pct. Teachers Below 18 Hrs. Urban 18.0 37% Rural 16.4 53% Remote 15.9 59% Total 17.3 44%
Source: Teacher Employment and Deployment Survey, 2005
Figure 17 Junior Secondary: Teacher’s Average Teaching Hours vs. STR at the Teacher’s School
0
10
20
30
40
50
60
70
80
90
0 20 40 60 80 100
Teaching Hours
Stud
ent T
each
er R
atio
at t
he S
choo
l
UrbanRuralRemoteLinear (Rural)Linear (Remote)Linear (Urban)
Source: Teacher Employment and Deployment Survey, 2005
Opportunities for Equity, Efficiency and Quality Improvement 23
Figure 18 Junior Secondary Assigned Hours vs. Actual Hours Worked
Actual hrs = assigned hrs36%
Actual < assignedby 1-9 hours. 29%
Actual < assigned by10 or more hours. 6%
Actual > assignedby 1-9 hours. 23%
Actual > assigned bymore than 10 hours. 6%
Source: Teacher Employment and Deployment Survey, 2005
Figure 19 Junior Secondary Level Assigned Hours vs. Actual Hours Worked
0
10
20
30
40
50
60
10 20 30 40
Assigned Hours
Civil Servant Public School
Part-time
Part-time contract
Part-time assistant
Religious MoRA
Civil Servant MoRA
CS assigned to Private
Actual Hours
Source: Teacher Employment and Deployment Survey, 2005
TEACHER TYPE
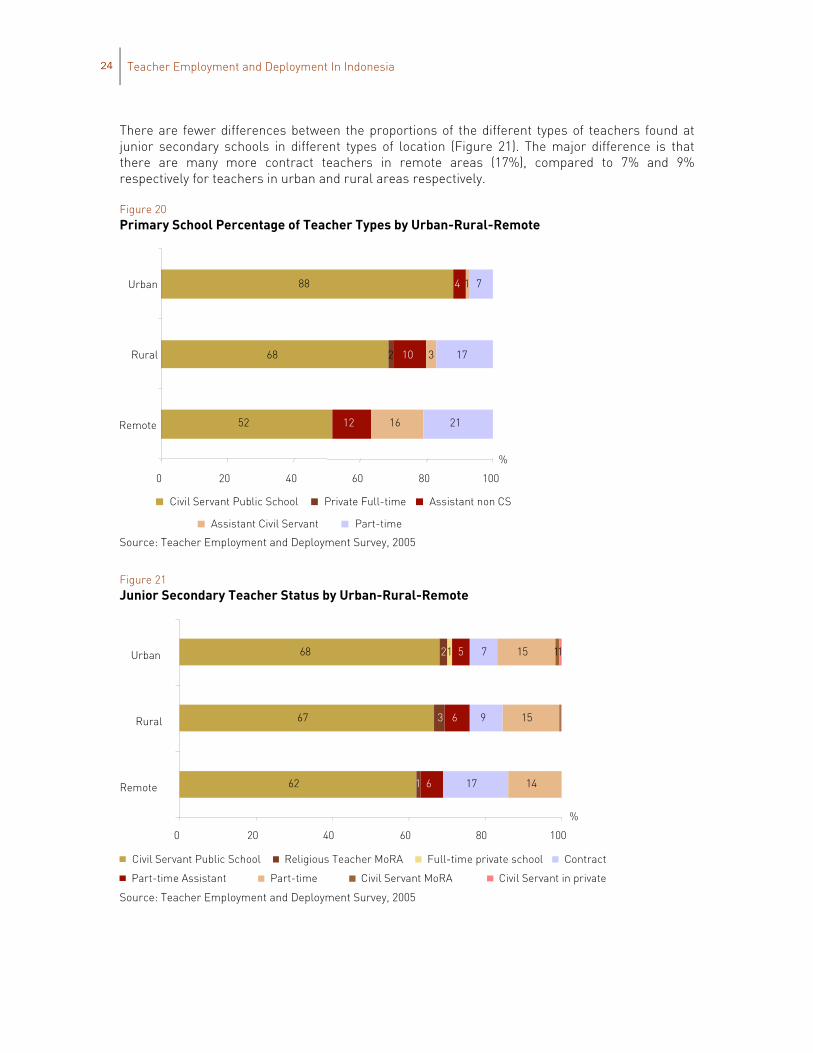
There is a dramatic difference in the make-up of teacher type by location (Figure 20). In urban public schools, 88% of teachers are civil servants, while at rural and remote schools, the figure stands at only 68% and 52% respectively. The part-time teachers are also much more common in rural and remote areas, making up 21% and 17% of the total respectively, compared to 7% at urban schools.
24 Teacher Employment and Deployment In Indonesia
There are fewer differences between the proportions of the different types of teachers found at junior secondary schools in different types of location (Figure 21). The major difference is that there are many more contract teachers in remote areas (17%), compared to 7% and 9% respectively for teachers in urban and rural areas respectively.
Figure 20 Primary School Percentage of Teacher Types by Urban-Rural-Remote
52
68
88
2
12
10
4
16
3
1
21
17
7
0 20 40 60 80 100
Remote
Rural
Urban
Civil Servant Public School Private Full-time Assistant non CS
Assistant Civil Servant Part-time
%
Source: Teacher Employment and Deployment Survey, 2005
Figure 21 Junior Secondary Teacher Status by Urban-Rural-Remote
62
67
68
1
3
21
6
6
5
17
9
7
14
15
15 11
0 20 40 60 80 100
Remote
Rural
Urban
Civil Servant Public School Religious Teacher MoRA Full-time private school
Part-time Assistant
Contract
Part-time Civil Servant MoRA Civil Servant in private
%
Source: Teacher Employment and Deployment Survey, 2005

Opportunities for Equity, Efficiency and Quality Improvement 25
TEACHER EDUCATION LEVEL
Across the nation, teacher education levels tend to be low, particularly amongst primary teachers. Based on the requirements prior to the new Teacher Law, 45% of teachers had qualifications lower than the prescribed D2 while 21% of junior secondary teachers had qualifications lower than the prescribed S1. Additionally, 29% of senior secondary teachers had less than the required S1 qualification (Table 4).
Table 4 Requirements for Education Level before New Teacher Law TEACHER CATEGORY PREVIOUS LEVEL REQUIRED PERCENT BELOW IN 2005 (pre-Law) SD: Primary DII (incl Certificate) 45% SMP: Junior Secondary DIII (incl Certificate) 21% SMA: Senior Secondary S1 (incl Certificate) 29%
Source: Rekapitulasi: Date Sekolah and Guru. Direktorat Tenaga Kependidikan, Directorat Jenderal Pendiikan Dasar Dan Menengah, Departemen Pendidikan Nasional. Tahun 2004
These figures are particularly significant, given the passage of the Teacher Law in December 2005, which requires that all teachers have a qualification of a bachelor’s degree (S1) or four year diploma (D4). According to 2004 data (Figure 22), a staggering number of teachers do not have these new minimum qualifications, with approximately only 15% of primary school teachers currently holding an S1 or D4 degree. For junior and senior secondary teachers, the number of underqualified teachers is 40% and 23% respectively. Overall, approximately 63% of teachers are unqualified according to the requirements of the new Teacher Law.
Figure 22 National Education Levels by School Type
31 1
8
3
49
7
2
30
17
9
6
3
7
9
5
15
60
77
3718
2
0 10 20 30 40 50 60 70 80 90 100
SD / Primary
SMP / Junior SS
SM / Senior SS
ALL TEACHERS
SLTA Dip-I Dip-II Dip-III D4 S1 >S1 Source: 2005 MoNE data
In looking at teachers’ qualifications in terms of their location in urban, rural or remote areas, it can be seen that teachers in remote areas tend to have the lowest education levels, while those in urban areas tend to have the highest levels (Table 5).

26 Teacher Employment and Deployment In Indonesia
Table 5 Survey Sample Education Levels of Primary School Teachers by Location Pct. Below S1 Pct. Below D2 No. Years Post HS Urban 73.0% 18.2% 2.3 Rural 82.6% 30.7% 1.8 Remote 94.8% 62.1% 0.9 Total 80.4% 29.5% 1.9
Source: Teacher Employment and Deployment Survey, 2005
ANALYSIS SUMMARY
The analysis highlights a number of significant issues related to efficiency, equity and quality amongst Indonesia’s teacher workforce. There is generally a significant oversupply of teachers, even with the current generous entitlement formula. Although most schools are oversupplied – particularly in urban areas – there is still a shortage of teachers in many schools and this shortage is most severe in remote areas. Teachers tend to work below the minimum number of hours required for a full-time teacher, which is in part due to the oversupply issue.
The quality of teachers is also an area of concern, with the low teacher education levels being one indicator of underqualification amongst the teacher workforce. There is a new focus on addressing quality through the certification requirements under the Teacher Law. This policy initiative should entail the majority of teachers upgrading their qualifications, which could have a significant impact on quality if implemented properly.
The subsequent sections use the results of this analysis to develop policy recommendations for the employment and deployment of teachers, including the proposed use of an alternative entitlement formula, upon which subsequent analysis was performed and incorporated into this section.
Opportunities for Equity, Efficiency and Quality Improvement 27
5. MAJOR EMPLOYMENT AND DEPLOYMENT ISSUES
The evidence provided by the data from the districts, together with the inputs and discussion from workshops and interviews, identifies six major issues relating to teacher employment and deployment in Indonesia. This section discusses each of the issues and in so doing highlights some of the findings from the analysis in the previous section.
DISTRIBUTION: UNEVEN DISTRIBUTION OF TEACHERS
National policy provides for a staffing formula for primary and junior secondary schools, the basic element of which is the number of learning groups in the school (which normally means the number of classes). As indicated above, the district data show that, based on current policy, there are marked inequities in the deployment of teachers, both across schools and districts. Some 68% of urban primary schools have an excess, while 66% of remote primary schools have a deficit. The imbalance between urban and remote is not as marked at junior secondary schools. Overall, some 81% have an excess, while 13% of schools are short of their entitlement according to the current formula. There are also reported mismatches between the needs of schools and teachers’ areas of competence, particularly in regards to teachers qualified to teach English, sport and religion. Although districts have the authority to transfer teachers within their jurisdiction, there appears to be a reluctance to implement such transfers in practice. There are also anecdotal reports of interference in the posting and transfer process. Further, transfer between districts and between provinces is reported to be particularly difficult. In considering the question of over- or undersupply within a given school or district, it is important to acknowledge that the data in this study are drawn from school and district responses to questions relating to staffing levels, and do not necessarily reflect stated policy. This question is explored in more detail below. Notwithstanding the question of excess and deficit, it is clear that there is an uneven distribution of teachers across both schools and districts.
REMOTE SCHOOLS: INEQUITIES FOR REMOTE SCHOOLS
The national staffing policy, which provides for a minimum of nine teachers regardless of the size of the school, means that remote schools, being relatively small schools, should be well staffed. However, the district data indicate that there are acute shortages of staff in the majority of remote schools, with 93% reporting that they had a deficit. Although there is a requirement for teachers, as civil servants, to serve where they are posted, the policy is clearly not being consistently implemented. As a result, some teachers have heavy workloads and students in many remote schools are disadvantaged. Reasons given for staffing shortfalls include: lack of adequate housing; poor transport; domestic responsibilities; concerns about the isolation from family and friends; and the generally poor services and facilities in remote areas.

28 Teacher Employment and Deployment In Indonesia
WORKLOAD: GENERALLY LOW WORKLOAD, WITH GREAT VARIATION
Not surprisingly, given the inequitable distribution of teachers, there is also a great variation in the actual workloads of teachers. The minimum number of hours a teacher is required to work is determined nationally. The minimum load, for teachers employed at both primary and junior secondary schools, is 18 hours per week. The length of the period varies from 30 minutes in grades 1 and 2, to 40 minutes in grades 5 and 6 and 45 minutes in junior secondary grades. Based on this requirement, a primary teacher should have a minimum teaching load of 24 periods out of the 42 periods in the school week. Teachers in more junior grades, with shorter periods and fewer hours in the school week, could have an even lower teaching load. The district data for primary schools show an average load of some 25 hours per week, with almost a quarter of the teachers reported to have a workload of less than the minimum of 18 hours. The corresponding figure for junior secondary teachers is an average of just over 17 hours per week with 44% below the minimum of 18 hours. Clearly, those schools which have an excess of staff can afford to have lower workloads, whereas those with a staff deficit will tend to have heavier workloads. An additional factor which contributes to workload inequities is that there are specialist teachers for sport and religion in primary schools, who may not have a full teaching load, especially in smaller schools. In the case of junior secondary schools, teachers generally teach only one subject, which restricts the flexibility in staff allocation. Understandably, some teachers would be assigned some non-teaching duties.
EXCESS: OVERALL EXCESS OF STAFF
The generally accepted approach to assessing the level of staffing is to examine the student: teacher ratio (STR). The STR provides a short-hand indicator for making a judgment about the relative over- or undersupply of teachers at different levels of a system. The national policy stipulates an STR for primary schools of 40:1 and for junior secondary schools of 28:1. The stipulated primary and junior secondary ratios are unrealistically high, well in an excess of comparable international practice, and in fact are not being applied. The district data show that the actual STR across the sample is 19.0 for primary schools and 15.6 for junior secondary schools. Available national data demonstrate average ratios of 20:1 at primary schools and 14:1 at junior secondary schools. Comparable average STRs for Asia/Pacific countries are approximately 31:1 at primary schools and 25:1 at junior secondary schools.13 Understandably, it is necessary to exercise caution when making comparisons, as the basis for these calculations can vary. For example, head-teachers and part-time teachers may or may not be included in the data for some countries. It is not possible to calculate a valid nation-wide excess or deficit without having actual data from each school set against an agreed staffing formula. However, taking the sample STR, together with the relatively low workload noted above, it is reasonable to conclude that the actual staffing levels in Indonesian primary and, to a lesser extent, junior secondary schools, are overly generous and unnecessarily costly. Nevertheless, the dominant perception at school and district level is that the majority of schools are understaffed. Unless some corrective action is taken, the adverse resource implications of oversupply will be magnified with the introduction of allowances under the Teacher Law.
13 Source: EdStats database. Primary ratio clearly defined with weighted ratio, but junior secondary ratio estimated by authors due to unavailability of specific international data for this level.

Opportunities for Equity, Efficiency and Quality Improvement 29
By stipulating a more modest STR of, say, 26:1 for primary schools and 22:1 for junior secondary schools and applying these nationally, there would be currently more than 240,500 primary teachers, and approximately 89,700 junior secondary teachers, in excess of requirements. The resource implications are discussed in Section 0.
REMUNERATION: RELATIVELY LOW REMUNERATION, WITH WIDE VARIATION IN ALLOWANCES
Teacher salaries are set nationally, based on the civil service scale. Salaries can be augmented by allowances, which can be paid at district and/or school level. It is generally acknowledged that teacher salaries are low, compared with those received by other civil servants with similar qualifications, particularly for those with higher qualifications. Monthly allowances paid to teachers vary greatly, depending on local circumstances. The field data show that only 36% of primary teachers and 52% of junior secondary teachers receive district allowances, the range being Rp15,000 to Rp1,500,000 for primary teachers and Rp8,000 to Rp1,998,000 for junior secondary teachers. Only 14% of primary teachers and 45% of junior secondary teachers receive a school level incentive, the range being Rp 8,000 to Rp1,500,000 for primary teachers and Rp9,000 to Rp3,136,000 for junior secondary teachers.14 Unsurprisingly, inequities are most apparent in districts and/or school communities that do not have sufficient financial resources to pay allowances, rather than in better off district and/or communities.
Anecdotal evidence suggests that the generally low level of remuneration affects teacher motivation, attendance, and performance, and that it is not uncommon for teachers to take a second job to make ends meet.
This situation is aggravated when teachers are posted to remote areas, where they work under more difficult conditions and are less likely to have access to other paid work. Issues relating to salaries and allowances are acknowledged in the Teacher Law, the intention being to double remuneration (core salary, plus equivalent by way of professional allowance) where teachers have the required qualifications and also to provide an allowance, equivalent to the base salary, for those posted to special areas, including remote schools.
TEACHER QUALITY: CONCERN ABOUT TEACHER COMPETENCIES
Although specific data on the quality of the teaching and learning experience and teacher competencies were not requested in the sample field study, the issue was raised extensively at the workshop. Apart from the generally low level of quality of inputs (e.g., textbooks and teaching/learning materials), the low level of teacher competencies are likely to be contributing to sub-optimal performance on the part of both students and teachers. It is of interest to note that according to the requirements stated in the new Teacher Law, some 82% of primary and some
14 It is worth noting that there are concerns about the accuracy of the district and school incentives reported and that these numbers should certainly not be taken to be representative across Indonesia.
30 Teacher Employment and Deployment In Indonesia
33% of junior secondary teachers nation-wide are underqualified.15 By linking certification based on qualifications and performance to remuneration (with qualified teachers drawing double the core salary), the Government is providing significant incentives to teachers to upgrade their qualifications. Increases in teacher remuneration of this magnitude will, of course, have significant implications for the budget. This and related issues are discussed in Section Resources Implications.
15 Mone Balitbang data 2004-2005

Opportunities for Equity, Efficiency and Quality Improvement 31
6. POLICY RESPONSES TO MAJOR ISSUES
The six major issues presented in Section 5 provide the basis for the consideration of suitable interventions. In looking at the policy options, it is necessary to consider four fundamental criteria:
access to basic education; equity in the delivery of services; quality of teaching and learning; and the cost-effectiveness of the system, so that the best use is made of available resources,
which in turn raises the related consideration of affordability.
This section examines options for intervention for each of the major issues.
DISTRIBUTION: UNEVEN DISTRIBUTION OF TEACHERS
In order to address the issue of the uneven distribution of teachers it will be necessary to revisit policies relating to:
staffing of schools; transfer of staff; minimum years of required service in remote schools; and application of sanctions when requirements are not met.
The preferred option for staffing schools is to determine school entitlements on the basis of the number of students, with a weighting for smaller schools, rather than on the basis of the number of classes/learning groups. This would be accompanied by greater flexibility in the range of subjects that teachers are required to teach and by provision for shared and part-time positions. This approach ensures equity in staff entitlements across schools and has the potential to be cost-effective. It is also relatively easy to administer at national and district levels and to monitor teacher excesses and deficits, on a school and district basis. Given that the teaching service is part of the national civil service, there needs to be provision not only for transfer between schools within a district, but also between districts and between provinces, particularly for promotion purposes.
To achieve these ends, it will be necessary to revisit the existing policies and, where necessary, to ensure that the accompanying mechanisms are put in place to give effect to new policies. The machinery is required to provide for both teachers who seek transfer and those who are required to transfer at the request of the administration, in the interests of access, equity and quality. There is already policy in place to require teachers to serve in remote areas. The challenge is to determine what constitutes a reasonable period of time for required service and what action to take when teachers do not take up their posting or abandon the posting prematurely. In order for a redistribution to be effective, civil service sanctions will have to be invoked in all cases where transfer and initial posting requirements are not met. Specific policy recommendations designed to address the issue of the uneven distribution of teachers are given in Section 7.
32 Teacher Employment and Deployment In Indonesia
REMOTE SCHOOLS: INEQUITIES FOR REMOTE SCHOOLS
Remote schools present a unique challenge in terms of providing access, equity and quality at a level which is cost-effective. Policy options include:
appointing beginning teachers for a minimum term of service; providing a worthwhile incentive to attract and retain teachers; forming multigrade classes in smaller schools16; a staff weighting to ensure that no school need have fewer than three teachers, plus a
head teacher; amalgamation of smaller schools, where the conditions are conducive; assisting teachers who require access to reasonable housing; providing school and/or college scholarships for students from remote areas who want to
become teachers and serve in their home areas.
Of particular significance is the intention under the Teacher Law to provide a location allowance for teachers working in remote areas. Considered collectively, the range of options has the potential to promote access, equity, quality and cost-effectiveness. Specific policy recommendations designed to address the issue of inequities in remote schools are provided in Section 7.
WORKLOADS: TOO LOW, TOO MUCH VARIATION
Generally low workloads, together with the great variation among workloads across schools, are detrimental to the achievement of equity for both students and teachers; to quality; and to cost-effectiveness. In addition, unreasonably high workloads for teachers in small schools can be detrimental to student participation. Policies required to address the twofold issue include:
an agreed minimum and maximum number of teaching hours for teachers at various levels;
a staffing formula which is compatible with the teaching load; teaching expertise which allows for greater flexibility in staff allocation; provision for part-time teaching and for sharing teachers across “neighboring schools”;
and provision to form multigrade classes in smaller schools.
The combined effect of some or all of these measures will spread workloads more equitably and, providing the workload is more in line with international practice, will have a significant impact on cost-effectiveness. Specific policy recommendations designed to address the issue of workloads are given in Section 7.
16 For case study example on multigrade teaching see Annex E: Examples and Case Studies
Opportunities for Equity, Efficiency and Quality Improvement 33
EXCESS: OVERALL EXCESS OF STAFF
An overall excess of teachers has a major and continuing impact on the cost-effectiveness of the system. The basic policy option is to set the staffing formula at levels that are more in keeping with those in similar countries. Teacher salaries and related costs currently account for some 75% of the budget17. A reduction in the number of required teaching positions relative to the number of students would free-up significant funding, which could be directed to support quality inputs. Depending on the scale of the reduction, a proportion of the funds could also be used to support the increase in allowances under the Teacher Law.
At the same time, it is essential to recognize that the downsizing of the teaching service will take time. While the implementation of an effective transfer policy will help to deploy teachers more equitably, reducing the excess presents perhaps the greatest challenge for the system. Given that teachers are within the civil service, there are few options other than attrition or “pay out” to effect the reduction, which would have short-tem budget implications. Some of the excess could be used for an emergency relief pool at district level. An important complementary strategy should be to reduce the intake to training institutions. Also, there should be a two to three year gap in new primary graduates, due to the upgrading of courses from D2 to S1. A relevant point is that having an excess of teachers in junior secondary schools does provide government with the opportunity to accelerate progress towards universal basic education, the overall infrastructure cost of which would, of course, be a major consideration. Specific policy recommendations designed to address the issue of overall excess of staff are given in Section 7.
REMUNERATION: RELATIVELY LOW REMUNERATION, WITH WIDE VARIATION IN ALLOWANCES
Major policy initiatives to address remuneration levels for teachers are provided for in the new Teacher Law. The scale of the increases will have major budgetary implications (see Section 0), but it is reasonable to expect a consequential increase in the quality of both teacher and student performance. Further, the location incentive, if effective, should improve access and equity for students in remote schools. Based on the present plan for a staged introduction, there are two strategies that warrant consideration. First, given the excess of teachers, it should be possible to provide for some release time for those in the process of upgrading their qualifications. Second, the increase in remuneration for certification currently appears to be an all or none provision, but possibly a more graded approach would be more effective, rewarding teachers for their efforts in making progress towards certification. The implications of this observation are discussed in Section 0. Specific policy recommendations relating to the issue of teacher remuneration are given in Section 7.
17 Estimates based on data from the World Bank Public Expenditure Review on Education, 2006

34 Teacher Employment and Deployment In Indonesia
TEACHER QUALITY: CONCERN ABOUT QUALITY OF TEACHER COMPETENCIES
The Teacher Law sets out to address the issue of teacher quality, by promoting teacher qualifications and certification, and linking competence to remuneration. Related policy considerations include:
provision for progression over certain barriers to be linked to performance on agreed competencies;
provision for increased promotion opportunities, to be linked to performance on agreed competencies;
ongoing professional development post-certification; fostering the development of professional associations among teachers; and greater involvement of accredited institutions for both pre and in service training.
There is every reason to believe that the improvement in the quality of teaching will have a direct impact on the quality of learning. If this initiative can be linked with a more equitable distribution of teachers and an increase in the supply of quality inputs to schools, the overall impact on access, equity and quality should be significant over time. Specific policy recommendations designed to address the issue of teacher quality are given in Section 7.

Opportunities for Equity, Efficiency and Quality Improvement 35
7. POLICY RECOMMENDATIONS RELATED TO ISSUES
Section 5 identified six major issues relating to teacher employment and deployment. Section 6 discussed policy options for addressing the issues, having particular regard to the likely impact on access, equity, quality and cost-effectiveness.
This section sets out specific policy recommendations designed to address the six major issues. For ease of reference and follow-up, the recommendations have been grouped to align with likely administrative responsibilities, namely:
teacher recruitment, appointment, salaries and allowances; classification of schools; teacher posting, transfer and attendance; teacher progression and promotion; staffing of schools; class size, including multigrade classes; teaching workload; teaching subjects; student: staff ratios; teacher housing in remote areas; and school mergers.18
Some of the policies within the administrative clusters at the provincial and district levels already exist, albeit expressed differently, some are a modification of current policy and others are new. The inclusion of all three types within the relevant clusters provides a comprehensive and consistent coverage of the set of recommended policies for teacher employment and deployment. Understandably, some of the policies have resource implications, representing both increases and decreases. Relevant items are discussed in Section 9.
The matrix below, which contains the recommendations, is designed to assist stakeholders, particularly management, in relating specific policies to each of the major issues. The framework provides a starting point for national and district agencies to address cooperatively outstanding issues from a shared policy perspective. For example, to successfully address the issue of inequities in remote schools, specific policies need to be drawn from each of the 11 administrative clusters (as shown by the asterisks in the Remote Schools column). Needless to say, as there is an overall coherence among the specific policies targeting remote schools (as well as the other areas), there would be merit in an all rather than some approach. However, it would be possible to be selective and to trial specific policies (e.g., policies to achieve greater efficiencies in the area of student-teacher ratios; teacher workloads; school mergers in particular areas; scholarships for students; multigrade classes). The range of issues and policies is such that there is ample scope for a number of districts to be involved in the trialing of the recommendations.
18 For a case study on school mergers, see Annex E: Examples and Case Studies.

36 Teacher Employment and Deployment In Indonesia
Policy Recommendations Related to Issues
Key Employment and Deployment Issues Ref
Policy Recommendations (* indicates that the policy is particularly relevant to given Issue or Issues)
Distribution Remote Work-load
Excess Remun’tion
Quality
1.0 Teacher recruitment, appointment, salaries and allowances 1.1 That the current policy for the recruitment of teachers
to the civil service be upheld, with provision to consider a gradual progression towards a national teacher service
*
1.2 That teachers be appointed nationally and allocated to districts, with provision for districts to appoint part-time teachers, under nationally determined conditions of employment, within the overall district staffing entitlement
*
1.3 That teacher salaries continue to be determined nationally, with provision for both full and part-time teachers
*
1.4 That core professional and location allowances be set nationally and funded from national revenue (as provided for under the Teacher Law)
* *
1.5 That provision be made for additional allowances to be set at district level and paid from local revenue
*
1.6 That concurrent with proposed improvements in teacher salaries and allowances under the Teacher Law, the current incremental scales be reviewed with a view to simplification and ease of administration
*
1.7 That concurrent with the proposed improvements in teacher salaries and allowances, designed to improve teacher welfare, consideration be given to phasing out additional allowances for teachers at school level
*
1.8 That concurrent with improvements in allowances, designed to attract and retain teachers in remote areas, consideration be given to the provision of scholarships for students from local area who seek to become teachers – while at secondary school and/or training college – where there is a continuing staffing problem
*
2.0 Classification of schools 2.1 That schools be classified in terms of remoteness
from services and of special circumstances (e.g., conflict area)
*
2.2 That the classifications be used as the basis for determining incentive entitlements under the Teacher Law
*
2.3 That the classifications be used as the basis for determining years of service required in a school
* *

Opportunities for Equity, Efficiency and Quality Improvement 37
Key Employment and Deployment Issues Ref
Policy Recommendations (* indicates that the policy is particularly relevant to given Issue or Issues)
Distribution Remote Work-load
Excess Remun’tion
Quality
3.0 Teacher posting, transfer and attendance 3.1 That teachers be posted to schools and transferred
between schools within a district by district administration
*
3.2 That provision be made to transfer teachers between standard urban schools after an agreed period of time
*
3.3 That beginning teachers be required to serve in remote (and special circumstance) schools for a minimum of three years and a maximum of five years, unless the teacher elects to stay longer
*
3.4 That teachers be transferred between districts, within a province by provincial administration
*
3.5 That teachers be transferred between provinces by national administration
*
3.6 That provision be made for sanctions to be applied in cases where teachers do not fulfill transfer and initial posting requirements
*
3.7 That regulations on teacher absenteeism be reviewed, monitored and enforced
* * * * * *
4.0 Teacher progression and promotion 4.1 That provision be made for a number of steps in the base
teacher salary scale, progression beyond which requires demonstrated performance on agreed competencies
* *
4.2 That provision be made for a number of promotion levels beyond the base teacher salary scale, attainment of which requires demonstrated performance on agreed competencies
* *
4.3 That provision be made for communities to be involved in the selection of the principal
*
5.0 Staffing of schools 5.1 That the deployment of teachers to schools be on the
basis of the number of students * *
5.2 That regular primary schools be staffed on the basis of one teacher for approximately 30 students, plus the principal
* * * *
5.3 That provision be made for a weighting of the staff allocation for small schools, such that no school will have fewer than three teachers plus the principal
* *
5.4 That junior secondary schools be staffed on the basis of one teacher for approximately 24 students, plus the principal
* * * *
5.5 That provision be made for a pool of “back up” teachers for each district for relief and emergency purposes
* * * *
5.6 That provision be made for sharing teaching positions between schools
* * * *
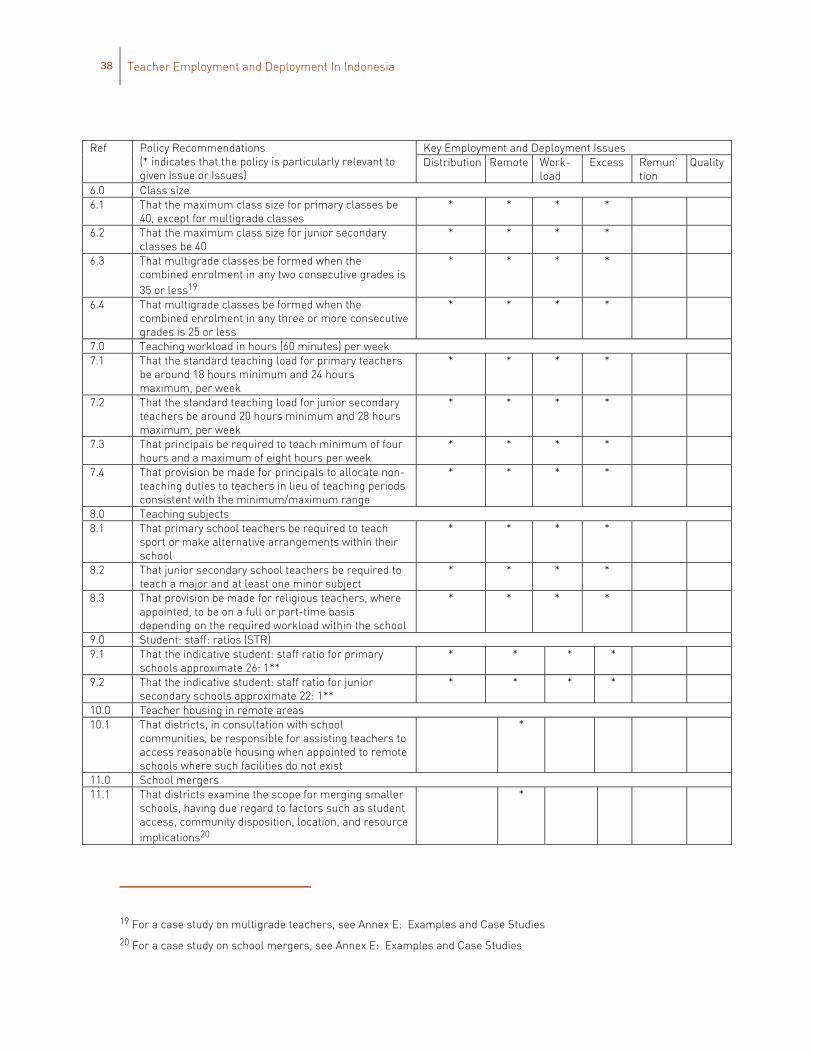
38 Teacher Employment and Deployment In Indonesia
Key Employment and Deployment Issues Ref Policy Recommendations (* indicates that the policy is particularly relevant to given Issue or Issues)
Distribution Remote Work-load
Excess Remun’tion
Quality
6.0 Class size 6.1 That the maximum class size for primary classes be
40, except for multigrade classes * * * *
6.2 That the maximum class size for junior secondary classes be 40
* * * *
6.3 That multigrade classes be formed when the combined enrolment in any two consecutive grades is 35 or less19
* * * *
6.4 That multigrade classes be formed when the combined enrolment in any three or more consecutive grades is 25 or less
* * * *
7.0 Teaching workload in hours (60 minutes) per week 7.1 That the standard teaching load for primary teachers
be around 18 hours minimum and 24 hours maximum, per week
* * * *
7.2 That the standard teaching load for junior secondary teachers be around 20 hours minimum and 28 hours maximum, per week
* * * *
7.3 That principals be required to teach minimum of four hours and a maximum of eight hours per week
* * * *
7.4 That provision be made for principals to allocate non-teaching duties to teachers in lieu of teaching periods consistent with the minimum/maximum range
* * * *
8.0 Teaching subjects 8.1 That primary school teachers be required to teach
sport or make alternative arrangements within their school
* * * *
8.2 That junior secondary school teachers be required to teach a major and at least one minor subject
* * * *
8.3 That provision be made for religious teachers, where appointed, to be on a full or part-time basis depending on the required workload within the school
* * * *
9.0 Student: staff: ratios (STR) 9.1 That the indicative student: staff ratio for primary
schools approximate 26: 1** * * * *
9.2 That the indicative student: staff ratio for junior secondary schools approximate 22: 1**
* * * *
10.0 Teacher housing in remote areas 10.1 That districts, in consultation with school
communities, be responsible for assisting teachers to access reasonable housing when appointed to remote schools where such facilities do not exist
*
11.0 School mergers 11.1 That districts examine the scope for merging smaller
schools, having due regard to factors such as student access, community disposition, location, and resource implications20
*
19 For a case study on multigrade teachers, see Annex E: Examples and Case Studies 20 For a case study on school mergers, see Annex E: Examples and Case Studies
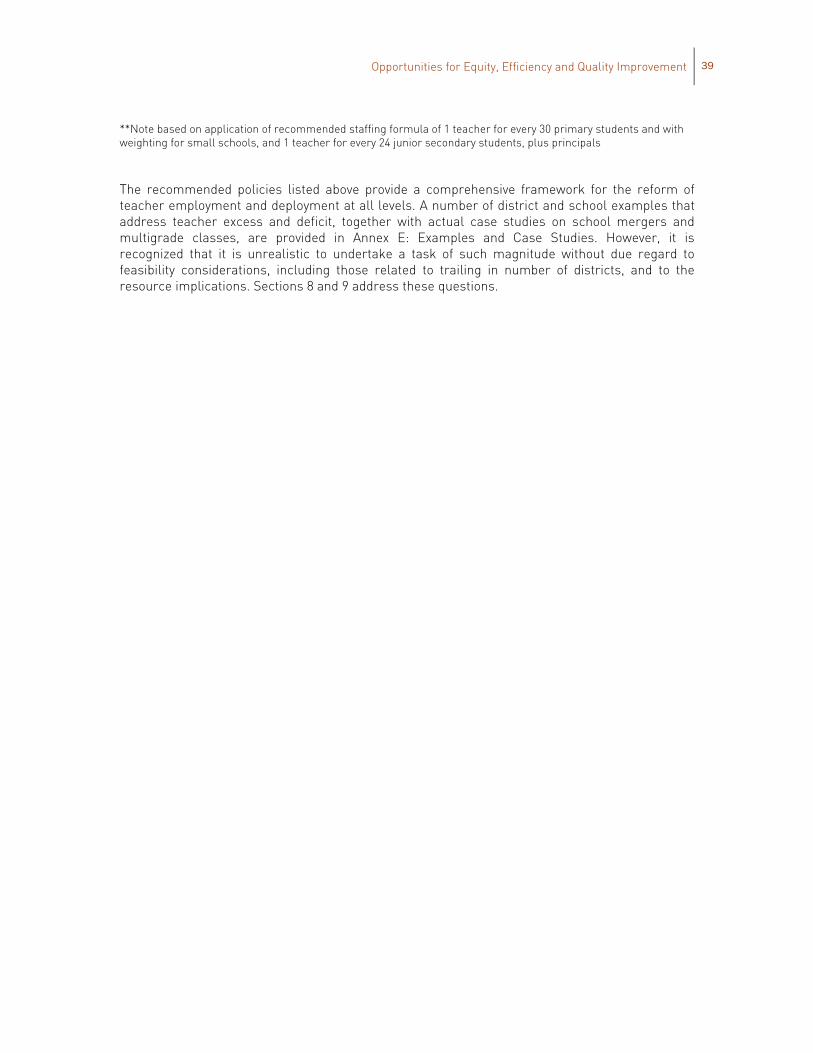
Opportunities for Equity, Efficiency and Quality Improvement 39
**Note based on application of recommended staffing formula of 1 teacher for every 30 primary students and with weighting for small schools, and 1 teacher for every 24 junior secondary students, plus principals
The recommended policies listed above provide a comprehensive framework for the reform of teacher employment and deployment at all levels. A number of district and school examples that address teacher excess and deficit, together with actual case studies on school mergers and multigrade classes, are provided in Annex E: Examples and Case Studies. However, it is recognized that it is unrealistic to undertake a task of such magnitude without due regard to feasibility considerations, including those related to trailing in number of districts, and to the resource implications. Sections 8 and 9 address these questions.

40 Teacher Employment and Deployment In Indonesia
8. FEASIBILITY CONSIDERATIONS
Section 7 presented a range of recommended policies designed to address the identified issues in teacher employment and deployment. This section examines considerations of feasibility relating to the implementation of the recommended policies from a government perspective. This study and the attendant recommendations are based on the assumption that as GOI initiated the investigation and requested assistance through the World Bank, there is a commitment to change in the management of issues and systems related to teacher employment and deployment, at least at the national level. It is in this context that feasibility becomes a critical consideration for governments at all levels, if they are to carry forward the proposed changes. The QITEP-initiated follow-on Pilot Study is an appropriate strategy for testing the feasibility of implementing a range of the recommended policy changes at provincial, district and school levels (see below).
STATUS OF POLICIES
As indicated earlier, there is already a range of policies relating to teacher employment and deployment, derived from various sources. However, it is evident that the existence of policies does not necessarily mean that they are being implemented as intended. Indeed, the field study indicates wide variations in the interpretation and implementation of policies. The possible reasons for this include: lack of knowledge of current policies; confusion over, or disregard for, national policy, following devolution; incompatibility between national and district policy; inappropriateness of current policies; lack of commitment to implement policies; lack of capacity to enforce policy adherence; interference in the decision-making and management processes when endeavoring to implement policies; and cultural tolerance of departure from official policies.
Whatever the reason(s) for the gap between intention and reality, GOI has basically four options:
to allow the current loose interpretation and implementation of employment and deployment policies to continue;
to implement current policies, effectively; to reject some or all of the current policies in favor of revised policies; or to adopt a range of policies – existing, modified and new (including those derived from the
Teacher Law and this Study) – to more appropriately reflect the renewed commitment to change.
The first step, then, is for the central government to determine which employment and deployment policies it will choose to pursue and what responsibilities will be accorded to sub-national agencies. Nation-wide changes will require a robust governance framework underpinned by strong commitment and leadership at all levels.

Opportunities for Equity, Efficiency and Quality Improvement 41
GOVERNANCE PROVISIONS
As stated in the Sector Review, the Education Law 20/2003 transfers the principal responsibilities, the authority and the resources for delivering education services to sub-national levels of government, and, in some cases, to schools themselves. This devolution provides both opportunities and challenges for policy change: opportunities to respond more readily and efficiently to local needs; and challenges associated with the articulation of the various levels of government. The major challenge in regard to the management of teacher employment and deployment is to ensure that centrally determined policies can be put in place at district and school level, while at the same time recognizing local responsibilities and authority, under the education law. Among the constraints is the fact that MoNE has no direct line to districts: rather, existing governance structures provide for coordination between MoNE and the Ministry of Home Affairs (MoHA). As pointed out by Kluyskens and Firdaus: “Line ministries relinquished in principle the personnel management function and their main role became the establishment of minimum standards, a task they now share with MoHA. But the law does not define what the specific functions of local government are.”21 Other potential constraints include: the differing roles of MoNE and MoRA in teacher management; limited expertise in implementing policies at local level; and lack of consistent application of sanctions for non-compliance. A key strategy for influencing policy compliance could be to link district staffing entitlements to dedicated funding for salaries and allowances, based on an agreed STR with annual targets to be achieved. As in most devolved systems, strong leadership, with professional commitment and management good-will, though not binding, are co-requisites to achieving functional structures and systems.
ORGANIZATION STRUCTURES AND SYSTEM CAPACITY
With regard to the current organization and management structures for teacher employment and deployment at the national level, there are three principal areas of concern, these being:
the lack of flexibility resulting from the fact that teachers are employed under the national civil service;
the national government’s lack of a coherent structure required to coordinate, administer and monitor assigned functions relating to the management of teachers; and
the extent to which the current national systems are compatible with the devolved systems and capable of providing required information for planning and monitoring purposes.
Lack of flexibility due to teachers being employed under the national civil service: The Teacher Law is a significant first step to alleviating this problem. In order to realize the full potential of the teacher management systems introduced by the Teacher Law and of the recommended policies on employment and deployment, it may well be necessary to examine the desirability of delinking terms and conditions of employment for the teaching service from the mainstream of the civil service. One report, in referring to reform in teacher management, states that “our most critical recommendation is for the establishment of a separate teaching service that would implement merit and performance based personnel management and continuous professional
21 Kluyskens and Firdaus, page 4
42 Teacher Employment and Deployment In Indonesia
development.”22 However, it is important to be aware that achieving this goal would involve major reforms and changes, and that there are a number of significant barriers to its implementation.
Lack of a coherent structure required to coordinate, administer and monitor assigned functions relating to the management of teachers: Within MoNE, there is evidence of a strong and visionary leadership that is driving the quest to achieve change in teacher management (and quality) and to address major country-wide issues. Further, there appear to be pockets of interest and expertise across other ministries. The same can be said about certain districts, particularly those which have elected to be involved in the Pilot Study. However, it is not clear where responsibility for the various functions relating to teacher employment and deployment rest across governments as a whole, or indeed how the relevant units are coordinated. As noted by Kluyskens and Firdaus: “Before decentralization, the legal and regulatory framework was complex and unclear due to the involvement of many different central government agencies and ministries. Since decentralization, the situation has become worse because of the unclear rules related to the roles and responsibilities of central and local level governments.”23 This shortcoming manifests itself in a number of ways, such as inconsistencies in laws and regulations and lack of clarity regarding the roles and responsibilities of different agencies.
The establishment of a Steering Committee and District Taskforces (supported by technical groups) do provide a structurally sound basis for initial planning and for facilitating and monitoring the implementation of the recommended changes across selected districts. Over time, after the pilot study, such a structure will need to become embedded as a dedicated entity, charged with responsibility for the wider dissemination, promotion and monitoring of change. The existence of such an entity will be vital for carrying forward the implementation of and for following-up on the endorsed policy changes. Without such an entity, there is significant risk that the momentum for change will be lost, if not in the pilot districts, then certainly for system-wide adoption, at a later stage.
The compatibility of current national systems with devolved systems and capabilities for providing required information for planning and monitoring purposes: It has been argued, for example, that there are too many government agencies involved in various tasks and that they all have their own data systems, resulting in the reduplication of efforts and other inefficiencies.24 Urgent action needs to be taken to achieve the rationalization and refinement of the national education management information system (EMIS). An enhanced system will be essential for the implementation of the Teacher Law and for any subsequent nation-wide implementation of the recommended policies changes regarding teacher management.
SERVICE IN REMOTE SCHOOLS
The Teacher Law provides for a major incentive for service in remote schools. The Special Areas Allowance, which is equivalent to the teacher’s base salary, will be available to those who are already in designated schools or who accept postings to such schools. The recommended policies
22 King et al, 2004 23 Ibid, page 10 24 Ibid, page 12

Opportunities for Equity, Efficiency and Quality Improvement 43
in this Report are consistent with this provision. The recommended policies also recognize that additional incentives may be required to attract and retain teachers in more difficult locations. At this stage, proportionately few teachers in remote schools have the required qualifications than those elsewhere, with the survey sample indicating only 5% of rural primary school teachers have an S1 degree compared to 27% of urban primary school teachers. Unless adequate provision is made for teachers in remote areas to upgrade their qualifications, there could well be a dilution of the impact of the Special Areas Allowance as teachers hasten their departure from remote schools so that they can undertake their studies. As entry-level teachers attain the required qualifications and certification upon graduation, this potential impediment should be eased.
TEACHER DEMAND AND SUPPLY
Given that the responsibility for the establishment of policies governing teacher employment and deployment at the national level remain in the hands of the national government, it is reasonable to expect that the GOI should take responsibility for relating the county-wide demand for teachers, based on agreed STRs, with school/district aggregations, and to use this as the basis for planning training needs and advising teacher training institutions accordingly. This does not currently appear to be happening consistently and systematically. Following the establishment of a staffing formula for schools by the government, this should be the next logical step, following agreement on policies relating to the staffing of schools. In the short to medium-term, the projection and planning process will be compounded by the complexities arising from the phased implementation of the Teacher Law and the accreditation of training institutions.
POTENTIAL FOR CORRUPTION
Anecdotal evidence suggests that teacher appointments and deployment are sometimes marred by corruption and other improper practices. This is supported by Kluyskens and Firdaus who state that “… teachers are still subject to a variety of corrupt practices and routinely pay bribes for appointments, transfers, promotions, and selection for training.” This could well be one of the factors contributing to staffing excesses and deficits in certain schools as teachers “pay their way” out of difficult areas into preferred locations. Such practices undermine the intent of policy, the integrity of management, and the confidence of teachers who are trying to play by the rules. If the recommended changes are to be effectively implemented, it is imperative that all parties – teachers, principals, supervisors, district officers and politicians – act strictly in accordance with the rules without fear or favor. Major contributing factors that exacerbate such corrupt and improper practices include the lack of mobility in the civil service since decentralization, which creates additional pressures on deployment, and the absence of effective sanctions against corruption.25
25 Kluyskens and Firdaus, page 6

44 Teacher Employment and Deployment In Indonesia
PILOT STUDY
Based on the above considerations, MoNE has invited a sample of five districts to participate in a policy-based Pilot Study, which involves the application of selected recommended policies to address particular issues in their local schools. The six major issues which have been identified in this Report – distribution of teachers, remote schools, workloads, teacher excess, remuneration, and quality – and the proposed interventions intended to improve identified short-comings related to these issues form the basis for an examination of the feasibility of the recommended policies regarding teacher employment and deployment. A total of 24 policies have been selected for trial across the five districts. The findings will be used not only to provide insights into the feasibility of implementing the suite of recommended policies, but also to complement the policy development work being undertaken in BERMUTU (especially Component 3) and to inform medium to longer-term initiatives for SISWA.
REQUIRED RESOURCES
The resource implications for implementing the Teacher Law and recommended policies for employment and deployment are discussed in Section 0. Broader considerations of affordability and sustainability are discussed and analyzed in Financing Improved Teacher Quality and Deployment26.
26 McMahon.

Opportunities for Equity, Efficiency and Quality Improvement 45
9. RESOURCE IMPLICATIONS This section examines the important question of the resource implications of both the Teacher Law and the recommendations regarding teacher employment and deployment, as presented in Section 7. From a funding perspective, the principal issues which need to be addressed are:
costs associated with the implementation of the Teacher Law, based on the Team’s interpretation of available documentation; and
indicative costs associated with the policy recommendations in this report.
TEACHER LAW
The new Teacher Law has a number of major cost implications, arising out of:
The cost of improving teacher quality; The cost of providing incentives for placement in special areas (location allowance).
The cost of improving teacher quality
As stated in Section 3, the Teacher Law establishes incentives for the achievement of the appropriate, defined professional qualification at an amount equal to the base salary, not including incentives. The data in Table, which are based on information provided by MoNE, assumes that 10% of teachers will be upgraded each year. The table covers all primary and junior secondary teachers in public schools, Government-supported Madrasah and private schools. The costings are shown for the period 2007 to 2011. Data for all years from 2007 to 2015 are given in a separate finance paper27.
Table 6 Cost of Upgrading Primary and Junior Secondary Teachers, 2007-2011 2007 2008 2009 2010 2011Total Primary and Junior Secondary PNS Teachers 1,565,628 1,565,628 1,565,628 1,565,628 1,565,628 PNS with less than S1 1,091,448 993,740 896,031 798,322 700,614 PNS with S1 474,180 571,888 669,597 767,306 865,014 PNS with S1 and Professional 133,919 267,838 401,758 535,678 669,597 PNS S1 without Professional 340,261 304,050 267,838 231,628 195,417 Increase due to Professional Allowance (Rp’000,000) 2,410,546 4,821,091 7,231,651 9,642,197 12,052,742 Total Salary for PNS Teachers (Rp’000,000) 30,591,841 33,002,386 35,412,946 37,823,492 40,234,037 Professional Allowance as a Pct. of Total 8% 15% 20% 25% 30%
Source:MoNE presentation by dr. Fasli Jalal Uses government assumption of 10% of teacher force being certified per year. Average salary of Rp 18,000,000 per year used in calculation
27 Walter M. McMahon, Financing Improved Teacher Quality and Deployment: Costs, Affordability, Financing Methods, and Poverty Reduction Effects, (Draft Paper), December 2005
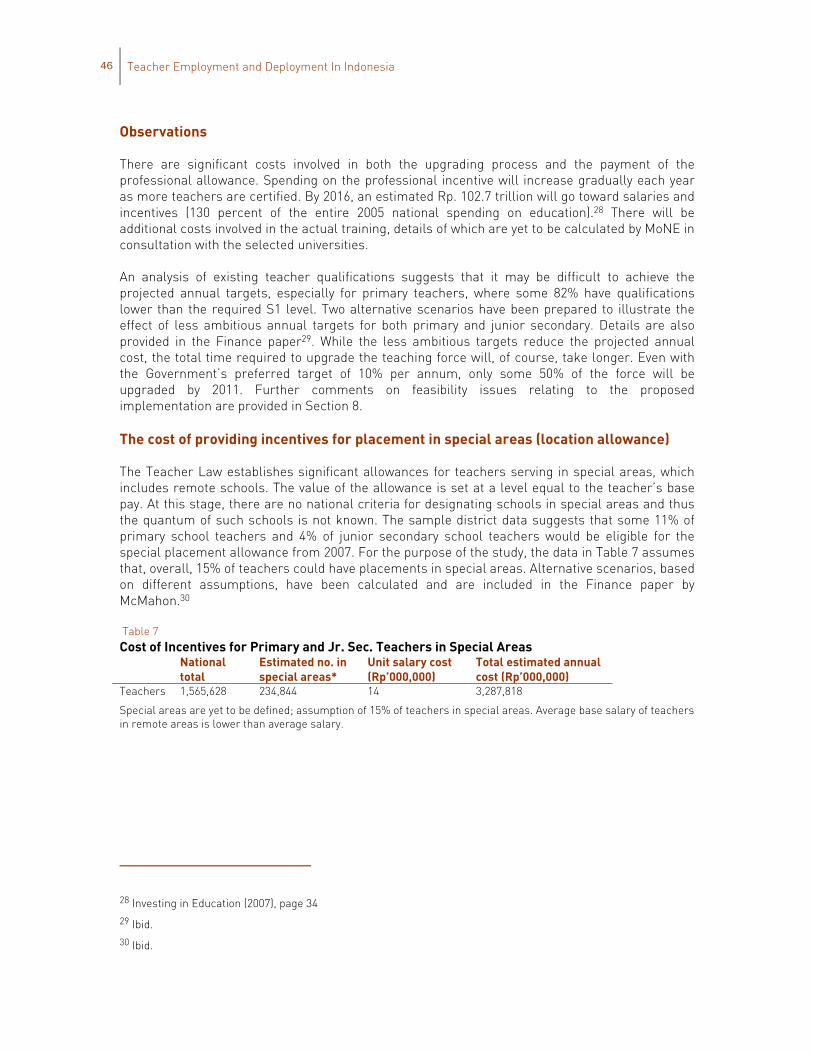
46 Teacher Employment and Deployment In Indonesia
Observations
There are significant costs involved in both the upgrading process and the payment of the professional allowance. Spending on the professional incentive will increase gradually each year as more teachers are certified. By 2016, an estimated Rp. 102.7 trillion will go toward salaries and incentives (130 percent of the entire 2005 national spending on education).28 There will be additional costs involved in the actual training, details of which are yet to be calculated by MoNE in consultation with the selected universities.
An analysis of existing teacher qualifications suggests that it may be difficult to achieve the projected annual targets, especially for primary teachers, where some 82% have qualifications lower than the required S1 level. Two alternative scenarios have been prepared to illustrate the effect of less ambitious annual targets for both primary and junior secondary. Details are also provided in the Finance paper29. While the less ambitious targets reduce the projected annual cost, the total time required to upgrade the teaching force will, of course, take longer. Even with the Government’s preferred target of 10% per annum, only some 50% of the force will be upgraded by 2011. Further comments on feasibility issues relating to the proposed implementation are provided in Section 8.
The cost of providing incentives for placement in special areas (location allowance)
The Teacher Law establishes significant allowances for teachers serving in special areas, which includes remote schools. The value of the allowance is set at a level equal to the teacher’s base pay. At this stage, there are no national criteria for designating schools in special areas and thus the quantum of such schools is not known. The sample district data suggests that some 11% of primary school teachers and 4% of junior secondary school teachers would be eligible for the special placement allowance from 2007. For the purpose of the study, the data in Table 7 assumes that, overall, 15% of teachers could have placements in special areas. Alternative scenarios, based on different assumptions, have been calculated and are included in the Finance paper by McMahon.30
Table 7 Cost of Incentives for Primary and Jr. Sec. Teachers in Special Areas National
total Estimated no. in special areas*
Unit salary cost (Rp’000,000)
Total estimated annual cost (Rp’000,000)
Teachers 1,565,628 234,844 14 3,287,818
Special areas are yet to be defined; assumption of 15% of teachers in special areas. Average base salary of teachers in remote areas is lower than average salary.
28 Investing in Education (2007), page 34 29 Ibid. 30 Ibid.

Opportunities for Equity, Efficiency and Quality Improvement 47
Observations
At a level equal to the base salary, the location allowance should provide a strong incentive for teachers to work in remote areas. While the budgetary impact is small in comparison with that of the professional allowance, it is still a significant investment, amounting to approximately 7% of the 2005 budget, and will require proper targeting to be effective. The appropriate classification of the special areas will be critical so that schools in hardship areas and those facing severe teacher shortages are included. The special area policy is a first step in the right direction, but, in order to improve the quality of services, strong monitoring systems should also be in place, preferably with involvement of local communities.
POLICY RECOMMENDATIONS FROM THIS STUDY
Some of the proposals emerging from this Study have no significant cost implications: others have significant implications, mainly as cost saving measures. The costing is based on projections across primary and junior secondary government schools only.
COST EFFECTIVENESS ASSOCIATED WITH CHANGING DEPLOYMENT POLICIES
Student: teacher ratio: As pointed out in Section 0, the current policy on STR stipulates a ratio of 40:1 for primary schools and 28:1 for junior secondary schools. The actual STR, based on the sample data, is 19.0 for primary schools and 15.6 for junior secondary schools. This study proposes an STR of 26:1 for primary schools and 22:1 for junior secondary schools. The factors taken into account in establishing this recommended STR are summarized in Table 8.
Table 8 Factors Linked to STR – recommended policies
Class size Workload (hours)1
Staffing per number of students
STR (including provision for small schools and principals)
Primary 40 Min: 18 Max: 24
One staff member per 30 students, plus principal
Nation/ district-wide estimate 26:1
Junior Secondary
40 Min: 20 Max: 28
One staff member per 24 students, plus principal
Nation/ district-wide estimate 22:1
Principal Min: 4 Max: 8
1. Actual hours – this could be converted into the number of periods at each grade level.
Comparative costs for each of the three options (A: current policy; B: actual STR, based on sample data; C: application of recommended policy changes, applied to national data) are provided in Table 9.

48 Teacher Employment and Deployment In Indonesia
Table 9 Comparative Costs Based on Different STR Options
A: STR – Policy B: STR – Actual C: STR – Recommended Primary 40:1 20:1 26:1
Teachers required 609,266 1,177,929 937,332
Salary cost 10,427,464,620,745 20,160,028,672,632 16,042,253,262,685
Positions saved B to C: 240,597
Junior Secondary 28:1 14:1 22:1
Teachers required 150,895 364,098 274,354
Salary cost (Rp’000,000) 2,762,820,495,214 6,666,470,847,660 5,023,309,991,298
Positions saved31 B to C: 89,744
Total
Total Teachers 760,160 1,542,027 1,211,686
Total salary cost (Rp’000,000) 13,190,285,115,959 26,826,499,520,292 21,065,563,253,983
Total positions saved B to C: 330,340
Salary savings (Rp’000,000) B to C: 5,760,936,266,309
Teacher difference as percent +/- B to A: 49.7% more teacher employed under B
B to C: 21.0% fewer teacher required under C
Source: MoNE data on teachers, salary
Observations
STRs
As argued in Section 0, the current stipulated STR of 40:1 for primary schools is far too high, as is the STR of 28:1 for junior secondary schools. It is important to note, however, that the actual STR (Option B) is nearly 50% higher than that stipulated by current policy (Option A). Leaving Option A aside, a comparison of Option B and Option C warrants close attention in terms of cost-effectiveness. If fully implemented, Option C would yield an annual savings of 21% of the current outlay on teacher salaries. In addition, Option C would create further savings through reduced expenditure on allowances and other teacher overheads, as fewer positions would be required. Data are not available to estimate the level of savings, as it is unlikely that the number of teachers will be reduced dramatically. As they occur, actual savings can be directed towards the acquisition of quality inputs and/or towards the payment of the planned increases in allowances under the Teacher Law. Another strategy would be to use the teacher excess to expand student access, especially at the junior secondary level.
Savings from the introduction of new student-based school staffing entitlements will only be realized as excess teachers leave the workforce. However, it seems reasonable to expect that in the short to medium term the actual savings will be limited, the assumption being that the most likely strategy for reducing the size of the workforce will be through attrition and reduced training intakes. Assuming an annual attrition rate for teachers of 5%, the annual savings would be in the order of 20,000 teacher salaries per year. Based on an average salary of Rp.18,000,000, the annual savings would amount to Rp.360,000,000,000.
31 Note that
Opportunities for Equity, Efficiency and Quality Improvement 49
Pool of relief teachers
One of the proposed strategies for providing greater flexibility in teacher deployment is to establish a pool of teachers in each district to act in a relief capacity. The extent of such a pool has not been assessed, but could be trialed in a number of selected districts, where there is an excess of teachers. As these teachers are currently drawing salaries, there would be no extra salary costs for the foreseeable future.
Teacher housing
Assistance with the provision of teacher housing in remote areas is mentioned in the Teacher Law and the recommendations in Section 7. At this stage, there is no quantum available. Should Government proceed to implement this policy, adequate provision will need to be made in the appropriate budget(s).
School Mergers
It is possible that further savings could be obtained by the carefully managed merger of small schools. Where there are very small primary schools in close proximity and where a merger would not create any access or equity problems, then districts could work with school communities to effect rationalization. This has already been tried successfully in two districts with reportedly outstanding results.32 Consideration could be given at the district level to the provision of incentives for schools that agree to mergers where such mergers result in recurrent salary savings. As the scope of the potential for mergers is not known, it is not possible to make any reasonable projections based on the sample data. Applying certain assumptions regarding the quantum, the Finance paper has attempted some cost saving projections33.
SUMMARY
The most significant resource implications will arise from the implementation of the provisions of the Teacher Law that provide for both professional and location allowances. While the impact of the professional allowance will be gradual, the impact of the location allowance should be immediate. Significant savings could be made, over time, by increasing the student-teacher ratio so that it reaches a level in line with that of other Asia/Pacific countries. Not surprisingly, the impact of attrition and reduced intakes is likely to be gradual. However, over time, the savings will be significant. Given the shortage of quality inputs, the need to further expand junior secondary education, and the additional cost of implementing the Teacher Law, the increased STR is one of the few areas in which cost-effectiveness measures may be implemented. Further, with the proposed improvements in teacher welfare, the opportunity exists to negotiate some trade-off on workloads, especially with those teachers who will receive increased salaries, allowances and other benefits under the Teacher Law.
32 For a case study on school mergers, see Annex E: Examples and Case Studies 33 Ibid.

50 Teacher Employment and Deployment In Indonesia
10. CONCLUSION The Government of Indonesia has already taken a number of critical initiatives designed to improve the quality of the teaching service. First, the Teacher Law is intended to improve both the qualifications and performance of teachers. In addition, it provides for significant increases in remuneration and for major incentives to attract and retain teachers in remote schools. Second, the newly established Directorate General for PMPTK has a specific mandate to improve the quality of the teaching profession and the associated administrative cadre. Third, as a concurrent development, Government, in conjunction with the World Bank and AusAID, has undertaken a sector review, entitled Education in Indonesia: Managing the Transition to Decentralization. Fourth, the Government has made a major commitment to universal education through its ‘Education for All’ program (which essentially mandates nine years of universal education) This program entails a significant financial commitment, particularly at the junior secondary level, to achieve the objective of universal education and to provide for quality improvements in basic education, nation-wide.
Of particular relevance is the BERMUTU (Better Education through Reformed Management and Universal Teacher Upgrading) Project, which is intended to be introduced in 2008. The project’s development objective is to contribute to the improvement of the overall quality and performance of teachers by enhancing teachers’ knowledge of subject matter and improving their pedagogical skills in the classroom. Provision is made in the project for a component that will focus on policies and strategies to achieve greater teacher accountability and to develop and improve incentive systems for performance appraisal and to encourage career advancement. The objective of the component is to develop an integrated framework designed to achieve ongoing improvements in the quality and level of accountability of teachers after their certification. This objective will be achieved through:
Reviewing and, to the extent possible, reforming existing policies, procedures and instruments used for performance appraisal and for progression and promotion;
Linking incentives provided for under the Teacher Law to career advancement; and Improving lines of accountability between managers (principals/supervisors) and
teachers.
This quality-oriented component will complement the equity and efficiency initiatives being undertaken in the Pilot Study.
This Study has made considerable progress in identifying major issues relating to teacher employment and deployment and in creating greater awareness of the need for improvements in these areas. Under the leadership of PMPTK and through a consultative process with a sample of districts, the following achievements have been made:
useful district data have been collected and analyzed; emergent issues have been identify and clarified though dialogue with districts; recommended policies have been formulated and discussed through a national workshop; the recommended policies have been grouped for administrative convenience and set
against the identified issues; indicative costings have been prepared; and the World Bank (with assistance through a Dutch Trust Fund) is continuing to work with
Government to effect changes in teacher employment and deployment.
The stage has now been reached where a suite of core recommendations can be trialed in a Pilot Study. A total of 25 of the recommendations have been identified through PMPTK for this purpose
Opportunities for Equity, Efficiency and Quality Improvement 51
(see below). Five districts, have been selected on the basis of submissions. The Pilot Study will provide the opportunity to continue the consultative process with districts and to monitor the trial implementation of the recommended employment and deployment policies before the GOI considers their wider adoption. The study is scheduled to extend over three years (2007-2009). Concurrently, the selected districts will work with MoNE on the implementation and monitoring of the certification and upgrading processes under the new Teacher Law. Examples and case studies relating to teacher management are provided in Annex E: Examples and Case Studies.
Concurrently, work has commenced on a new education program, the Education System Improvement through Sector Wide Approaches (SISWA) program. The program will aim to improve efficiency and equity in the use of resources; to increase access to basic education; and to improve the level of achievement by students. The operational focus will be at the district, school and community levels. Early indications are that the findings of the Pilot Study on employment and deployment policies and the policy development work to be undertaken under BERMUTU will be useful for the development of significant initiatives in teacher management under SISWA.
The Government of Indonesia is now on the cusp of addressing major policy and structural issues relating to teacher quality and teacher management. The new Teacher Law, together with the BERMUTU project and the proposed SISWA, provides a unique opportunity to achieve significant improvements in teacher quality and to improve equity and cost-effectiveness system-wide. The Field Study and the follow-on Pilot Study will form a valuable and timely platform to inform key education sector initiatives at all levels.
52 Teacher Employment and Deployment In Indonesia
BIBLIOGRAPHY
Chapman, David W., (2005) Teacher Policy in the MENA Region: Issues and Operations, World Bank background paper
Edstats online query database, devdata.worldbank.org/edstats
King, E., Aarons, A., Crouch, L., Iskandar, S., Larrison, J., et al. (2004). Education in Indonesia: managing the transition to decentralization, World Bank
Kluyskens, J. and Firdaus M., (2006) Teacher Management in the Context of the Civil Service, Background Paper, World Bank Office Jakarta
MoNE, Office of Research and Development (Balitbang), education data set for the 2003/2004 School Year
MoNE, Office of Research and Development (Balitbang), Indonesia: Educational Statistics in Brief 2003/2004
MoNE, Office of Research and Development (Balitbang), Indonesia: Educational Statistics in Brief 2004/2005
MoNE, (2004) Office of Research and Development (Balitbang), Profil Pendidik dan Tenaga Kependidikan di Indonesia
MoNE, Office of Research and Development (Balitbang), Statistik Persekolahan SD 2003-2004
MoNE, Office of Research and Development (Balitbang), Statistik Persekolohan SMP 2003-2004
McMahon, Walter M., (2005) Financing Improved Teacher Quality and Deployment: Costs, Affordability, Financing Methods, and Poverty Reduction Effects, Background Paper, World Bank Office Jakarta
World Bank, (2005) Education Sector Review, World Bank Office, Jakarta
World Bank, (2007) Investing in Indonesia’s Education: Allocation, Equity, and Efficiency of Public Expenditures, World Bank Office, Jakarta
World Bank/MoNE (December 2006), Pilot Study Handbook on Teacher Employment and Deployment, Draft

Opportunities for Equity, Efficiency and Quality Improvement 53
ANNEX A: STUDY METHODOLOGY
Data inputs needed for the study were of two types:
information on current policies on teacher employment and deployment from national, provincial and district sources; and
actual data on current school practice from a selected sample of schools.
Policy and data collection were designed with reference to primary schools, junior secondary schools, senior secondary schools and private schools.
The policies and data required by the study were identified, questionnaires and templates were prepared and a separate consultancy was commissioned to design and build the database needed to house the data and generate reports.
Twelve sample districts were identified by MoNE as being representative of national diversity. They were selected to include a balance of districts from east and west Indonesia; from wealthy and poorer communities; from innovative and more traditional districts; and from urban, rural and remote areas. Within each district, because of timing, logistical and budgetary considerations, it was decided to sample 5% of all primary schools, 10% of junior secondary schools and small samples of both senior secondary schools and private schools. The total sample size was 384 schools, distributed across the districts as shown below.
Within each district, schools were selected on a proportional basis to ensure the correct representative balance of urban, rural and remote schools, big and small schools and government and Madrasah schools.
An initial workshop was held for all district personnel on 25th August, 2005. This workshop was intended to brief the personnel involved on the purpose and methodology of the study and to provide them with the questionnaires and other documentation needed for the fieldwork. Data collection at the school level was then conducted by school supervisors.
All data were returned to the PMPTK team for checking before being entered into the specially prepared database. Once the district reports were analyzed at the central level, PMPTK team members took both the data and policy analysis back to each district to conduct meetings on the findings, to identify issues and to suggest possible solutions. The results of these discussions formed the basis for district presentations at Workshop 2 on 22 and 23 November, 2005.
The PMPTK team, together with World Bank consultants, analyzed data and policy feedback from all 12 districts to identify issues and potential solutions from a national perspective. The results of this analysis formed the basis of the PMPTK team presentation to Workshop 2.

54 Teacher Employment and Deployment In Indonesia
Table 10 Survey Sample
Primary Jr. Sec Sr. Sec Private
Reguler Religious Reguler Religious
No District
Urb
an
Rur
al
Rem
ote
Urb
an
Rur
al
Rem
ote
Urb
an
Rur
al
Rem
ote
Urb
an
Rur
al
Rem
ote
Reg
uler
Rel
igio
us
Pri
mar
y
Jr. S
ec
Sr. S
ec To
tal
1 Bengkalis 8 7 7 0 0 0 2 3 1 0 1 0 3 0 1 0 0 33 2 Tanah Datar 2 12 2 0 2 0 1 4 0 0 1 0 3 0 0 1 0 28 3 Sarolangun 5 7 2 0 1 0 2 1 1 1 0 0 3 0 0 0 1 24 4 East jakarta 39 0 0 1 0 0 9 0 0 1 0 0 3 0 1 0 0 54 5 Pacitan 2 17 3 0 0 0 1 4 0 0 0 0 3 0 0 1 0 31 6 Central Lombok 5 14 8 2 5 2 1 3 2 0 0 0 3 0 0 0 0 45 7 Jembrana 9 9 0 1 0 0 2 1 0 0 0 0 2 1 0 0 1 26 8 West Sumba 2 7 6 1 0 0 1 3 1 1 0 0 3 0 0 0 0 25 9 Bone 10 22 4 0 0 0 2 2 1 0 0 0 3 0 1 0 0 45 10 Parigi Moutong 3 8 4 0 4 0 1 1 0 0 1 0 3 0 0 1 0 23 11 Kutai Kertanegara 7 7 7 1 0 0 3 2 2 0 1 0 3 0 0 0 1 34 12 Jayawijaya 2 4 3 0 0 0 1 1 1 0 0 0 3 0 0 0 1 16
TOTAL 94 114 46 6 9 2 26 25 9 3 4 0 35 1 3 3 4 384

Opportunities for Equity, Efficiency and Quality Improvement 55
ANNEX B: EDUCATION SECTOR DATA Table 11
Education Sector Data by Various Breakdowns Breakdown by Public/Private and School Level and MONE/MORA
Schools Personnel Teacher Education Level Ratios
typePrimary Regular PublicPrimary Madrasah PublicJr. Sec. Regular PublicJr. Sec. Madrasah PublicJr. Sec. OpenSr. Sec. Regular PublicSr. Sec. Madrasah PublicSr. Sec. Voc. PublicPrimary Regular PrivatePrimary Madrasah PrivateJr. Sec. Regular PrivateJr. Sec. Madrasah PrivateSr. Sec. Regular PrivateSr. Sec. Madrasah PrivateSr. Sec. Voc. PrivateTOTAL
Schools135,644
1,43911,234
1,1732,0393,203
563899
10,69019,31810,022
9,5495,0353,4734,216
218,497
Classes929,107
10,553140,662
12,7586,863
48,9837,073
16,72577,250
119,35357,14642,37137,16213,97041,536
1,561,512
Students24,083,746
309,8895,561,706
516,788175,287
1,886,701289,912608,441
1,959,6292,814,2641,961,6121,564,7881,371,306
436,9181,533,133
45,074,120
Directors135,373
1,47211,234
1,1731,5661,509
562899
10,05618,93410,018
9,5264,9253,4084,149
214,804
Pct. Female36.6%
10.6%
100.0%9.0%
10.2%33.3%
14.0%
11.2%
10.1%32.2%
Teachers1,025,384
15,700321,382
30,30922,035
123,98918,54449,94387,761
150,042147,673124,255105,917
52,907113,011
2,388,851
Pct. Female56.3%
49.5%
46.9%
39.2%60.9%
44.2%
39.4%
33.7%51.8%
Teach & Direct1,160,757
17,172332,616
31,48223,601
125,49819,10650,84297,817
168,976157,691133,781110,842
56,315117,160
2,603,655
<=HS33%16%
6%6%
10%2%3%2%
40%49%13%23%
4%13%
4%23%
1-Yr (D1)1%
13%8%3%
16%0%1%0%2%
11%5%7%1%3%1%3%
2-Yr (D2)49%39%
8%5%
16%2%1%2%
24%21%
7%8%2%4%2%
27%
3-Yr (D3)2%6%
16%15%15%10%
8%16%
5%4%
13%12%10%12%15%
7%
4-yr (S1/D4)16%26%62%71%43%85%85%78%29%14%61%50%82%66%77%39%
>=Masters0%0%1%1%1%1%2%1%0%0%1%0%1%1%1%0%
STR*20.718.016.716.4
7.415.015.212.020.016.712.411.712.4
7.813.117.3
SCR*25.929.439.540.525.538.541.036.425.423.634.336.936.931.336.928.9
Breakdown by School Level and MONE/MORASchools Personnel Teacher Education Level Ratios
typePrimary RegularPrimary MadrasahJr. Sec. RegularJr. Sec MadrasahJr. Sec. OpenSr. Sec. RegularSr. Sec. MadrasahSr. Sec VocationalTOTAL
Schools146,334
20,75721,25610,722
2,0398,2384,0365,115
218,497
Classes1,006,357
129,906197,808
55,1296,863
86,14521,04358,261
1,561,512
Students26,043,375
3,124,1537,523,3182,081,576
175,2873,258,007
726,8302,141,574
45,074,120
Directors145,429
20,40621,25210,699
1,5666,4343,9705,048
214,804
Pct. Female36.4%
12.2%
10.3%
10.1%32.2%
Teachers1,113,145
165,742469,055154,564
22,035229,906
71,451162,954
2,388,851
Pct. Female56.6%
47.9%
100.0%43.5%
35.4%51.8%
Teach & Direct1,258,574
186,148490,307165,263
23,601236,340
75,421168,002
2,603,655
<=HS33%46%
8%21%10%
3%11%
3%23%
1-Yr (D1)1%
12%7%6%
16%1%2%1%3%
2-Yr (D2)47%22%
8%8%
16%2%3%2%
27%
3-Yr (D3)2%4%
15%13%15%10%11%15%
7%
4-yr (S1/D4)17%15%61%53%43%83%71%78%39%
>=Masters0%0%1%0%1%1%1%1%0%
STR*20.716.815.312.6
7.413.8
9.612.717.3
SCR*25.924.038.037.825.537.834.536.828.9
Breakdown by School LevelSchools Personnel Teacher Education Level Ratios
typePrimary AllJr. Sec AllSr. Sec AllTOTAL
Schools167,091
34,01717,389
218,497
Classes1,136,263
259,800165,449
1,561,512
Students29,167,528
9,780,1816,126,411
45,074,120
Directors165,835
33,51715,452
214,804
Pct. Female36.4%18.2%10.3%32.2%
Teachers1,278,887
645,654464,311
2,388,851
Pct. Female56.6%50.2%40.1%51.8%
Teach & Direct1,444,722
679,171479,763
2,603,655
<=HS35%11%
5%23%
1-Yr (D1)2%7%1%3%
2-Yr (D2)44%
8%2%
27%
3-Yr (D3)2%
14%12%
7%
4-yr (S1/D4)16%59%79%39%
>=Masters0%1%1%0%
STR*20.214.412.817.3
SCR*25.737.637.028.9
Breakdown by Public/PrivateSchools Personnel Teacher Education Level Ratios
typePublic AllPrivate AllTOTAL
Schools156,194
62,303218,497
Classes1,172,724
388,7881,561,512
Students33,432,47011,641,65045,074,120
Directors153,788
61,016214,804
Pct. Female34.6%19.4%32.2%
Teachers1,607,285
781,5662,388,851
Pct. Female54.2%43.6%51.8%
Teach & Direct1,761,073
842,5822,603,655
<=HS23%24%23%
1-Yr (D1)2%5%3%
2-Yr (D2)34%11%27%
3-Yr (D3)6%
10%7%
4-yr (S1/D4)34%49%39%
>=Masters0%1%0%
STR*19.013.817.3
SCR*28.529.928.9
Sources: Data from Balitbang for 2003/2004. Madrasah data school data is collected from MoRA by Balitbang. Teacher education level calculations were done using the 2005 SIMPTK teacher database, which has more complete information on teacher qualifications.

56 Teacher Employment and Deployment In Indonesia
ANNEX C: SURVEY RESULTS BY PUBLIC VS. PRIVATE SCHOOLS Table 12 Summary of Key Variables by Public vs. Private Schools
PRIMARY JUNIOR SECONDARY Public Private Total Public Private Total Number of records at school level 262 14 276 65 5 70 Number of records at teacher level 2779 151 2930 2138 129 2267 Average School Size 210.9 109.4 205.8 489.7 246.0 472.3 Average Number of Teachers 10.8 10.8 10.8 30.7 24.4 30.3 Average Number of Classes 7.7 5.8 7.6 12.6 4.4 12.0 % Schools with Multigrade 10.7% 7.1% 10.5% - - - % Female Teachers 61% 52% 61% 54% 42% 53% Average Teacher Age 42 33 42 41 34 40 Average Years Teaching Experience 17 9 17 14 6 13 Student-Teacher Ratio 19.5 10.1 19.0 15.9 10.1 15.6 Student-Class Ratio 27.5 18.9 27.2 38.9 55.9 39.3 Student-Administration Ratio 207.8 90.1 200.7 71.1 55.9 70.3 % Schools claiming oversupply 10% 0% 9% - - - % Schools claiming undersupply 68% 50% 67% - - - % Schools oversupply with current entitlement* 53% 71% 54% 82% 80% 81% % Schools undersupply with current entitlement* 35% 29% 34% 14% 0% 13% % Schools oversupply with recommended entitlement 68% 86% 69% 95% 100% 96% % Schools undersupply with recommended entitlement 22% 14% 21% 2% 0% 1% % Part-Time Teachers 10% 45% 12% 32% 65% 34% % Civil Servant Teachers 76% 21% 74% 63% 23% 60% Average Teaching Hours 24.9 21.4 24.7 17.6 13.3 17.3 % Teachers Below 18 Hours. 22% 40% 23% 43% 68% 44%
Source: Teacher Employment and Deployment Survey, 2005

Opportunities for Equity, Efficiency and Quality Improvement 57
ANNEX D: MATRIX OF CORRELATIONS FOR SCHOOL AND TEACHER VARIABLES Figure 23
Matrix of Correlations for School and Teacher Variables
VARIABLE DESCRIPTIONSchool Size The number of students in a given schoolStudent-Teacher Ratio The total number of students divided by the total number of teachersStudent-Class Ratio The total number of classes offered at a school divided by the total number of teachers (e.g. there may two groups of third grade students, so this would be considered two classes.)Pct. PNS Teachers The total number of PNS teachers divided by the total number of teachers for each schoolPct. Contract Teachers The total number of contract teachers divided by the total number of teachers for each schoolOversupply A calculation of whether a school is oversupplied or undersupplied using the current entitlement formula. If a school is undersupplied, the value would be negativeTeaching Hours The total hours worked for each teacher.Teaching Experience The number of years of teaching experience for each teacher. When compared to school level data (e.g. Student-Teacher Ratio) the teacher's school is usedTeacher Age The age of the teacherSalary The teacher's base salary, not including incentives.District Incentive Any incentives given to teachers by the district governmentSchool Incentive Any incentives given to teachers by the schoolFemale Teacher Whether a teacher is female (1=female, 0=male)
Primary School Level
School SizeStudent-Teacher RatioStudent-Class RatioPct. PNS TeachersPct. Contract TeachersMultigrade ClassOversupplyTeaching HoursTeaching ExperienceAgeSalaryDistrict IncentiveSchool IncentiveFemale TeacherTeacher Education Level
Pct. PNSTeachers
Stud-TeachRatio
TeachingHours
AgeStud-ClassRatio
SchoolSize
Pct.ContractTeachers
MultigradeClass
Oversupply TeachingExperience
Salary DistrictIncentive
School•Incentive
FemaleTeacher
TeacherEducation
Level
Junior Secondary School Level
School SizeStudent-Teacher RatioStudent-Class RatioPct. PNS TeachersPct. Contract TeachersMultigrade ClassOversupplyTeaching HoursTeaching ExperienceAgeSalaryDistrict IncentiveSchool IncentiveFemale TeacherTeacher Education Level
Pct. PNSTeachers
Stud-TeachRatio
TeachingHours
AgeStud-ClassRatio
SchoolSize
Pct.ContractTeachers
MultigradeClass
Oversupply TeachingExperience
Salary DistrictIncentive
School•Incentive
FemaleTeacher
TeacherEducation
Level

58 Teacher Employment and Deployment In Indonesia
ANNEX E: EXAMPLES AND CASE STUDIES The following examples and case studies provide insight into actions that could be taken at the district and school levels to address a range of issues relating to teacher management.
EXAMPLE 1: DISTRICT Z
Context: District Z has a population of around 750,000. It has some 500 primary schools (with a total enrolment of approximately 100,000 students) and 50 junior secondary schools (with a total enrolment of approximately 20,000 students). Based on available school census data, the STR for primary schools was found to be just under 19:1, while for junior secondary schools the ratio stood at nearly 15:1. The district has requested an additional 500 teachers to fill existing vacancies, in the expectation that it may get about half that number (250). The district does not have a good record of transferring teachers, the unofficial reason being that it is “all too hard.” It is estimated that if current staffing policies were applied, approximately 15 percent of the teaching force could qualify for the Special Areas Allowance.
Issue: In reality, the District has an over-supply of teachers, albeit with an inequitable distribution across schools and sub-districts. By requesting more teachers, the District hopes to fill some vacancies, thereby avoiding the difficulties associated with forced transfers and the potential for political interference. To date, there has been no consideration given to the fact that the additional teachers will add to the national salaries bill and District overheads. Similarly, no consideration has been given to the fact that, with the implementation of the Teacher Law, there will be additional costs involved in the payment of the Professional Allowance and the Special Areas Allowance.
Options
Do nothing on the grounds that teachers’ salaries are a central government responsibility; Make ad hoc decisions on staffing, without formulating an overall plan and strategies; Apply the recommended policies and set annual targets for addressing excess and deficit.
Suggested Action: District managers have a responsibility to provide equitable and cost-effective services across all communities. Application of the recommended policies for teacher employment and deployment [Option (iii)] would provide a basis for responsible action that gives priority to addressing the legitimate needs of students. The first step for the District would be to determine the extent of oversupply. Taking the recommended STRs as the baseline, the District would be entitled to some 3,850 primary and 910 junior secondary teachers, including Principals. Thus, based on the recommended STRs, there is currently an overall excess of more than 1,000 primary and around 400 junior secondary teachers.
The next step would be to determine where the excesses and deficits are located. This would involve an examination of individual school data. Again on the basis of the recommended policies regarding staff entitlement, primary schools would have a quota of one teacher for every 30 students, while junior secondary schools would have a quota of one teacher for every 24 students, in addition to one Principal in both cases.
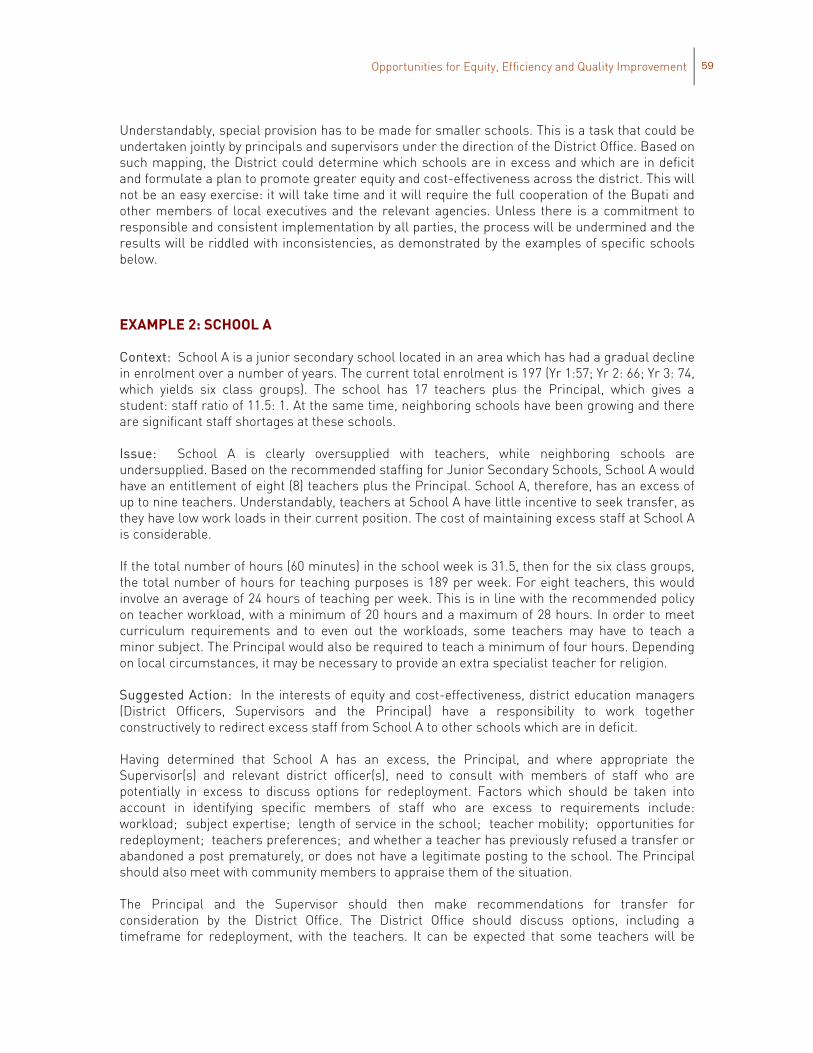
Opportunities for Equity, Efficiency and Quality Improvement 59
Understandably, special provision has to be made for smaller schools. This is a task that could be undertaken jointly by principals and supervisors under the direction of the District Office. Based on such mapping, the District could determine which schools are in excess and which are in deficit and formulate a plan to promote greater equity and cost-effectiveness across the district. This will not be an easy exercise: it will take time and it will require the full cooperation of the Bupati and other members of local executives and the relevant agencies. Unless there is a commitment to responsible and consistent implementation by all parties, the process will be undermined and the results will be riddled with inconsistencies, as demonstrated by the examples of specific schools below.
EXAMPLE 2: SCHOOL A
Context: School A is a junior secondary school located in an area which has had a gradual decline in enrolment over a number of years. The current total enrolment is 197 (Yr 1:57; Yr 2: 66; Yr 3: 74, which yields six class groups). The school has 17 teachers plus the Principal, which gives a student: staff ratio of 11.5: 1. At the same time, neighboring schools have been growing and there are significant staff shortages at these schools.
Issue: School A is clearly oversupplied with teachers, while neighboring schools are undersupplied. Based on the recommended staffing for Junior Secondary Schools, School A would have an entitlement of eight (8) teachers plus the Principal. School A, therefore, has an excess of up to nine teachers. Understandably, teachers at School A have little incentive to seek transfer, as they have low work loads in their current position. The cost of maintaining excess staff at School A is considerable.
If the total number of hours (60 minutes) in the school week is 31.5, then for the six class groups, the total number of hours for teaching purposes is 189 per week. For eight teachers, this would involve an average of 24 hours of teaching per week. This is in line with the recommended policy on teacher workload, with a minimum of 20 hours and a maximum of 28 hours. In order to meet curriculum requirements and to even out the workloads, some teachers may have to teach a minor subject. The Principal would also be required to teach a minimum of four hours. Depending on local circumstances, it may be necessary to provide an extra specialist teacher for religion.
Suggested Action: In the interests of equity and cost-effectiveness, district education managers (District Officers, Supervisors and the Principal) have a responsibility to work together constructively to redirect excess staff from School A to other schools which are in deficit.
Having determined that School A has an excess, the Principal, and where appropriate the Supervisor(s) and relevant district officer(s), need to consult with members of staff who are potentially in excess to discuss options for redeployment. Factors which should be taken into account in identifying specific members of staff who are excess to requirements include: workload; subject expertise; length of service in the school; teacher mobility; opportunities for redeployment; teachers preferences; and whether a teacher has previously refused a transfer or abandoned a post prematurely, or does not have a legitimate posting to the school. The Principal should also meet with community members to appraise them of the situation.
The Principal and the Supervisor should then make recommendations for transfer for consideration by the District Office. The District Office should discuss options, including a timeframe for redeployment, with the teachers. It can be expected that some teachers will be

60 Teacher Employment and Deployment In Indonesia
opposed to any transfer. Such cases should be reviewed by the head of the district education office, to ensure that the proposed action is fair and reasonable. In the event that a mutually acceptable solution cannot be found, the head of the district education office has the option of advising those teachers who refuse to accept the new appointments that they can take leave without pay until a mutually acceptable position becomes available. It is recognized that the process will take time and that due regard must be given to current teaching commitments. In the short-term, the concept of dual assignment to two schools could be considered, with the teacher receiving compensation for the cost of any additional travel.
Caution: It is possible that some teachers may resort to political intervention to avoid transfer. It is essential that employment and redeployment initiatives, which are designed to promote equity, cost-effectiveness and quality, have the full support of the Bupati and colleagues in order to ensure that such intervention does not interfere with the process.
EXAMPLE 5: SCHOOL C
Context: School C is a medium-sized primary school in a congenial urban area. The total enrolment is 389. Because the school is well located and regarded as a “good” school, it continues to attract teachers. Currently, the school has 24 full-time teachers and six part-time teachers (equating to three full-time teachers), plus the Principal (total 28). The STR for School C is currently 14:1. The teachers and the school community are pleased with the current situation: teacher workloads are low and, because there is an excess of staff, the Principal has introduced remedial classes in language and mathematics. Enrolments have remained reasonably constant over the past three years and the projections suggest that this pattern will continue for the next two to three years at least. Two teachers are due to retire at the end of the year, although as they expect the professional allowance to be introduced at any time, they have elected to stay on for at least two years (subject to approval from the District Office).
Issue: School C can be regarded as a fortunate school, particularly when compared with other schools. Applying the recommended policy regarding STRs, School C is entitled to 13 full time teachers plus the Principal (total 14). This would yield an STR of 28. On this basis, the school has an excess of 14 teachers (Meaning that it is 50% overstaffed). Meanwhile, there is a primary school some five kilometers away that has a deficit of eight teachers. There are also other schools in the area, including some smaller remote schools, that have deficits to varying degrees.
Options
Do nothing on the grounds that the teachers prefer to be in School C and that the children are responding well to the remedial group innovation of the Principal;
Initiate the immediate transfer of 14 excess staff to other schools where there are deficits. Advise staff that over a period of, say, 12 months, 14 teachers can expect to be transferred
and that all teachers are invited to express their preferences for transfers to schools with deficits (as advised by the District Office).
Suggested Action: District managers have a responsibility to address the issues of equitable staffing and cost-effectiveness. This could be achieved under Option (iii), without extra cost, by transferring excess teachers to schools which are in deficit. At the same time, it could be argued that redeployment will detract from the Principal’s remedial initiative. A closer analysis of the enrolment data shows that the 12 classes (assuming two classes at each grade level) have an
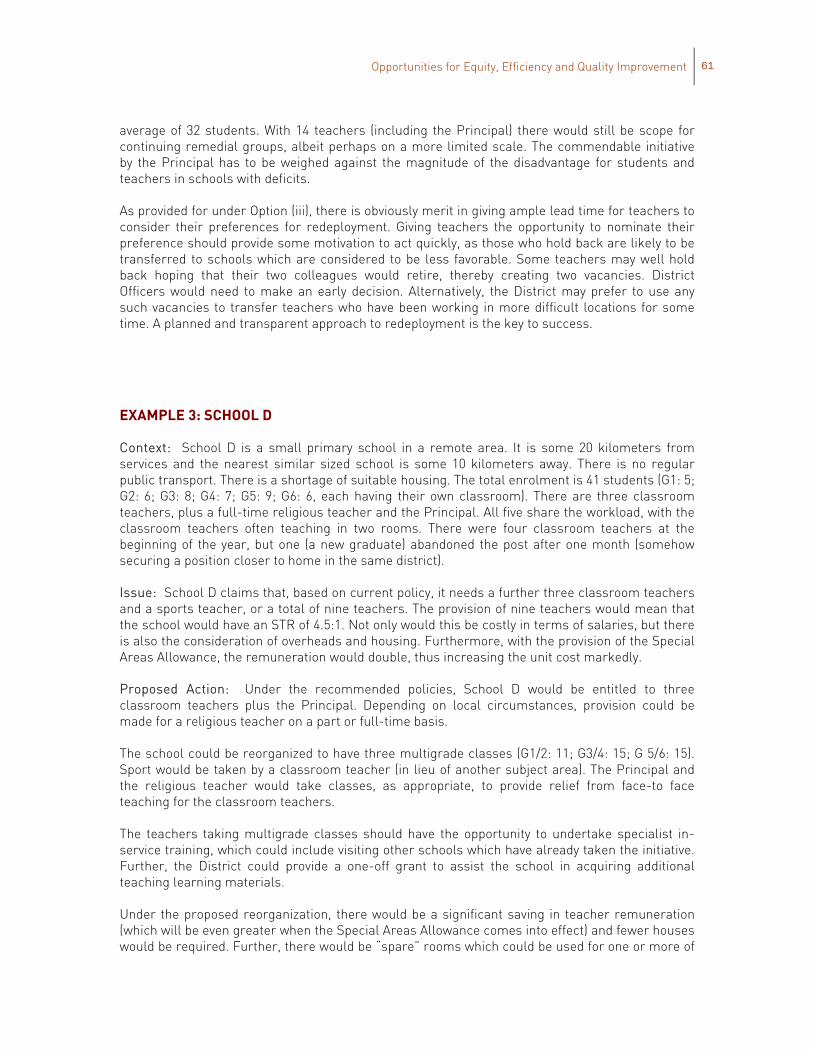
Opportunities for Equity, Efficiency and Quality Improvement 61
average of 32 students. With 14 teachers (including the Principal) there would still be scope for continuing remedial groups, albeit perhaps on a more limited scale. The commendable initiative by the Principal has to be weighed against the magnitude of the disadvantage for students and teachers in schools with deficits.
As provided for under Option (iii), there is obviously merit in giving ample lead time for teachers to consider their preferences for redeployment. Giving teachers the opportunity to nominate their preference should provide some motivation to act quickly, as those who hold back are likely to be transferred to schools which are considered to be less favorable. Some teachers may well hold back hoping that their two colleagues would retire, thereby creating two vacancies. District Officers would need to make an early decision. Alternatively, the District may prefer to use any such vacancies to transfer teachers who have been working in more difficult locations for some time. A planned and transparent approach to redeployment is the key to success.
EXAMPLE 3: SCHOOL D
Context: School D is a small primary school in a remote area. It is some 20 kilometers from services and the nearest similar sized school is some 10 kilometers away. There is no regular public transport. There is a shortage of suitable housing. The total enrolment is 41 students (G1: 5; G2: 6; G3: 8; G4: 7; G5: 9; G6: 6, each having their own classroom). There are three classroom teachers, plus a full-time religious teacher and the Principal. All five share the workload, with the classroom teachers often teaching in two rooms. There were four classroom teachers at the beginning of the year, but one (a new graduate) abandoned the post after one month (somehow securing a position closer to home in the same district).
Issue: School D claims that, based on current policy, it needs a further three classroom teachers and a sports teacher, or a total of nine teachers. The provision of nine teachers would mean that the school would have an STR of 4.5:1. Not only would this be costly in terms of salaries, but there is also the consideration of overheads and housing. Furthermore, with the provision of the Special Areas Allowance, the remuneration would double, thus increasing the unit cost markedly.
Proposed Action: Under the recommended policies, School D would be entitled to three classroom teachers plus the Principal. Depending on local circumstances, provision could be made for a religious teacher on a part or full-time basis.
The school could be reorganized to have three multigrade classes (G1/2: 11; G3/4: 15; G 5/6: 15). Sport would be taken by a classroom teacher (in lieu of another subject area). The Principal and the religious teacher would take classes, as appropriate, to provide relief from face-to face teaching for the classroom teachers.
The teachers taking multigrade classes should have the opportunity to undertake specialist in-service training, which could include visiting other schools which have already taken the initiative. Further, the District could provide a one-off grant to assist the school in acquiring additional teaching learning materials.
Under the proposed reorganization, there would be a significant saving in teacher remuneration (which will be even greater when the Special Areas Allowance comes into effect) and fewer houses would be required. Further, there would be “spare” rooms which could be used for one or more of
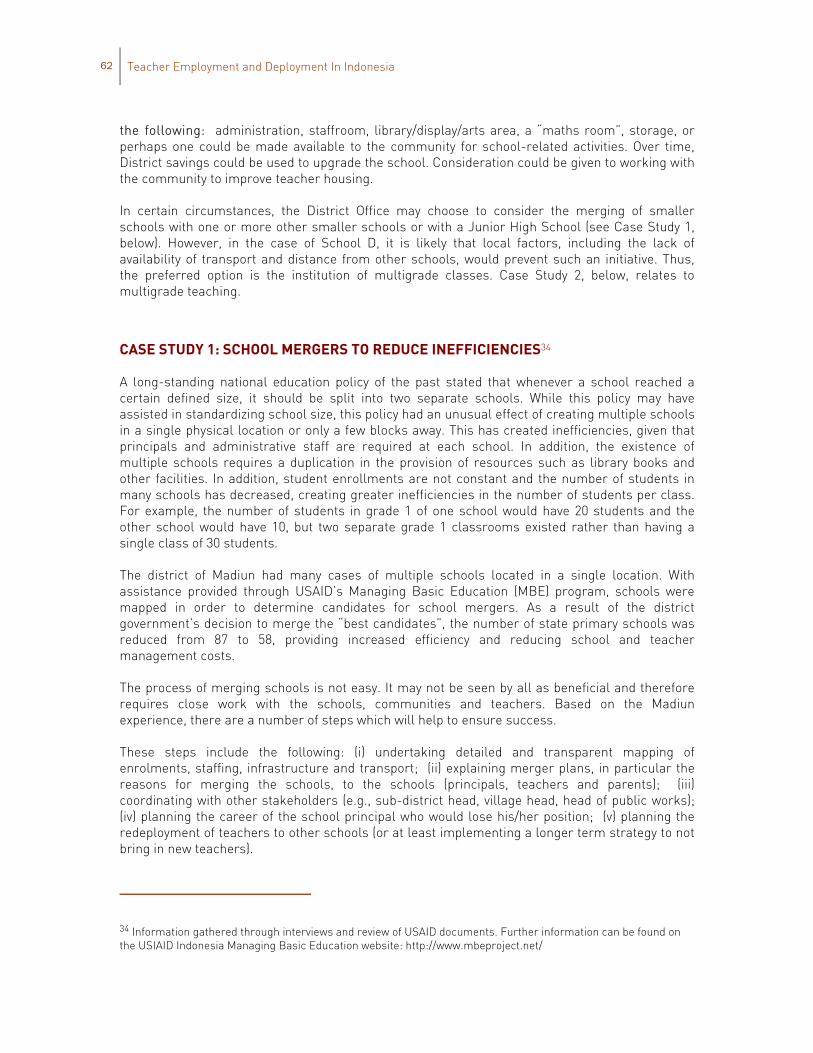
62 Teacher Employment and Deployment In Indonesia
the following: administration, staffroom, library/display/arts area, a “maths room”, storage, or perhaps one could be made available to the community for school-related activities. Over time, District savings could be used to upgrade the school. Consideration could be given to working with the community to improve teacher housing.
In certain circumstances, the District Office may choose to consider the merging of smaller schools with one or more other smaller schools or with a Junior High School (see Case Study 1, below). However, in the case of School D, it is likely that local factors, including the lack of availability of transport and distance from other schools, would prevent such an initiative. Thus, the preferred option is the institution of multigrade classes. Case Study 2, below, relates to multigrade teaching.
CASE STUDY 1: SCHOOL MERGERS TO REDUCE INEFFICIENCIES34
A long-standing national education policy of the past stated that whenever a school reached a certain defined size, it should be split into two separate schools. While this policy may have assisted in standardizing school size, this policy had an unusual effect of creating multiple schools in a single physical location or only a few blocks away. This has created inefficiencies, given that principals and administrative staff are required at each school. In addition, the existence of multiple schools requires a duplication in the provision of resources such as library books and other facilities. In addition, student enrollments are not constant and the number of students in many schools has decreased, creating greater inefficiencies in the number of students per class. For example, the number of students in grade 1 of one school would have 20 students and the other school would have 10, but two separate grade 1 classrooms existed rather than having a single class of 30 students.
The district of Madiun had many cases of multiple schools located in a single location. With assistance provided through USAID’s Managing Basic Education (MBE) program, schools were mapped in order to determine candidates for school mergers. As a result of the district government’s decision to merge the “best candidates”, the number of state primary schools was reduced from 87 to 58, providing increased efficiency and reducing school and teacher management costs.
The process of merging schools is not easy. It may not be seen by all as beneficial and therefore requires close work with the schools, communities and teachers. Based on the Madiun experience, there are a number of steps which will help to ensure success.
These steps include the following: (i) undertaking detailed and transparent mapping of enrolments, staffing, infrastructure and transport; (ii) explaining merger plans, in particular the reasons for merging the schools, to the schools (principals, teachers and parents); (iii) coordinating with other stakeholders (e.g., sub-district head, village head, head of public works); (iv) planning the career of the school principal who would lose his/her position; (v) planning the redeployment of teachers to other schools (or at least implementing a longer term strategy to not bring in new teachers).
34 Information gathered through interviews and review of USAID documents. Further information can be found on the USIAID Indonesia Managing Basic Education website: http://www.mbeproject.net/
Opportunities for Equity, Efficiency and Quality Improvement 63
The benefits include: (i) the students will be able to be grouped more equitably across classes; (ii) resources such as library books and computers can be shared; (iii) a classroom which is no longer necessary can be used for alternative purposes, such as for a library or arts room; (iv) in cases where there are classrooms in poor (or dangerous) condition, these classrooms may not have to be used anymore; and (v) the improved STR can help to reduce inefficiencies.
CASE STUDY 2: IMPLEMENTING MULTIGRADE TEACHING IN SMALL SCHOOLS35
The district of Pacitan had ongoing difficulties in staffing their many small schools in rural and remote areas. Many of the schools had a small number of students – often with less than 10 students per grade – and staffing these schools with a teacher for each grade was inefficient and/or not feasible. Their solution, developed and implemented with assistance from USAID’s Managing Basic Education (MBE) program, was to create 36 multigrade schools, with multigrade teaching, to make better use of staff and facilities.
What is multigrade teaching? A common misperception is that multigrade teaching simply involves teaching two classes in shifts or teaching the classes at the same time, but separating the students from each grade and teaching different topics to each (with the teacher trying to “run” from one classroom to the next.) In fact, multigrade teaching involves the development of a program for the whole combined class, with different activities to cater to different levels of ability. For example, if there are 6 students in grade 1 and 10 students in grade 2, in a multigrade setting all 15 students would be together in the same classroom, but have different activities to cater for the different levels, where necessary, particularly in the skills areas, such as mathematics and literacy-related subjects. Other areas such as culture and arts-based subjects may not require such differentiation.
But does multigrade teaching sacrifice quality? One concern about multigrade teaching is that is seems that quality would be sacrificed. In fact, multigrade teaching has been found to be as effective or even more effective in increasing student learning if it is properly implemented. Training for principals and teachers is essential when implementing multigrade teaching. Key training areas include: (i) structuring and organizing multigrade schools; (ii) organizing and planning for multigrade classrooms; and (iii) using appropriate teaching strategies for multigrade classrooms (traditional teaching methods of lecture and rote learning are not particularly effective). Effective multigrade teaching requires that the teacher use a more participatory approach, with students actively working on learning tasks.
As Pacitan discovered, creating a support system helps ensure the success of multigrade schools. Examples of measures included in such support systems include: (i) creating special multigrade facilitators; (ii) holding special teacher working group (KKG) meetings for multigrade schools supported by district facilitators; (iii) involving not only teachers, but also principals and supervisors in training so that the concepts are understood by all; (iv) arranging field visits between multigrade schools so that each can see various methods of multigrade teaching in action; (v) providing additional learning materials and special facilities such as Learning Centers
35 Information gathered through interviews and review of USAID documents. Further information can be found on the USIAID Indonesia Managing Basic Education website: http://www.mbeproject.net/

64 Teacher Employment and Deployment In Indonesia
where students have a place to go and materials to use when they have finished their assigned work or where they can do group activities.
The district of Pacitan is addressing its teacher management issues in small schools with an approach that is efficient and effective. It is not only students that are benefiting. Teachers have found that it is not as difficult to implement multigrade concepts as they had first imagined and that is makes their teaching tasks easier and more rewarding. Teachers who were overworked as a result of attempts to teach each grade in separate shifts are now able to use their time more effectively.
Opportunities for Equity, Efficiency and Quality Improvement 65
ANNEX F: INTERNATIONAL TRENDS RELATING TO TEACHER EMPLOYMENT AND DEPLOYMENT
In the international context, during the last two decades, several key changes have taken place to the understanding and implementation of education systems that contribute markedly to improved teaching and learning and that significantly impact upon teacher employment and deployment policies.
DEVOLUTION
There has been an international movement towards increased authority and decision-making at the school level. In countries such as Australia, this has lead to the concept of a “self managing school”. Devolution to schools requires a simultaneous relaxation of central and district control, together with empowerment of principals and school committees.
This devolution must be accompanied, and in many cases is driven, by accountability. Education departments are increasingly requiring schools to be accountable for delivering quality education. However, schools can only be held accountable if they have the responsibility for making school-level educational decisions. Any devolution must take place within a sound national framework. National curriculum frameworks, minimum standards, employment structures and salary frameworks are all necessary to avoid fragmentation and chaos. Any school system, devolved or otherwise, requires a careful framework of government legislation, regulations, policies and guidelines in order to be coherent and manageable.
ESTABLISHMENT OF A SEPARATE TEACHING SERVICE
A system-wide improvement in teachers’ conditions, salaries and levels of professionalism benefit from the establishment of a teaching service that is separate from the general civil service. This separation is a natural part of the devolution process and concomitant part of the relaxation of central civil service control of the teacher workforce. This separation provides the opportunity to recognize the unique features of the teaching profession, a recognition that can then be reflected in regulations and policies with respect to recruitment, promotion, salary structures, code of conduct, professional requirements, conditions of service, and qualifications. Further, it allows for the introduction of policies specifically tailored towards improving education in areas such as: merit-based appointments; school-based staff appraisal; teacher specific career structures; salary linked to performance; pre-service training, induction and promotion processes; continuous professional development; and processes for transfer and leave.
The argument that other professions will want the same degree of recognition is not a sufficient reason to deny the educational sector this opportunity to achieve real reform.
66 Teacher Employment and Deployment In Indonesia
CHANGES IN PERSONNEL SELECTION
There has been a gradual devolution of responsibility for school personnel selection to the school level, accompanied by:
Movement to selection entirely on the basis of merit, which usually entails: (i) the removal of service barriers (such as 10 years experience as a teacher before progressing to senior teacher and five years experience as a senior teacher as a prerequisite for promotion to principal); (ii) the abolition of automatic promotion on the basis of seniority: and (iii) a decreasing emphasis on paper qualifications beyond the minimal professional entry requirements and greater emphasis on demonstrated performance.
Increased involvement of stakeholders, with school committees involved in the selection of principals, and principals involved in the selection of their teachers.
This devolution of responsibility requires training in merit-based selection techniques and will probably need to be introduced gradually. To ensure that merit is the sole criterion for appointment, and to guard against corruption and nepotism, it is necessary to establish clear, appropriate guidelines and also provide an appeal or grievance mechanism.
DEVOLUTION OF ACCOUNTABILITY
Schools across the world are being held more and more accountable for educational outcomes. Although there is general acceptance that schools should be accountable for student outcomes, there is vigorous debate about what those outcomes should be and how they should be measured. Principals and school committees are also accountable for their budget expenditure and their management and use of all resources. In many countries, schools are held accountable for the performance of teachers through annual appraisal processes that may or may not be linked to professional development plans and salary incentives. School level accountability requires the provision of the necessary management tools and systems; it requires clear reporting processes; and it must have a system of checks and balances. Central governments must retain the responsibility for the overall monitoring and auditing of the system.
BETTER MANAGEMENT OF RESOURCES
Although education budgets in many countries increased significantly over past decades, there is now a general trend towards improving efficiency in the use of existing resources. Systems and schools cannot keep asking for more funding and are being expected to do better with existing – and sometimes decreasing – budgets. This requires the following:
The best distribution or allocation of available resources: Are resources being targeted to needs? Are the resources being expended having an impact on educational outcomes?
Use of data to make quality decisions and measure performance (this, of course, presupposes that quality data exist);
The introduction of computerized systems, staffing systems, EMIS, financial management packages, that make the tracking of resource allocation and expenditure easier; and
That principals become better managers of students, personnel, finance and facilities.
Opportunities for Equity, Efficiency and Quality Improvement 67
The underlying principle of better management is that savings generated in some areas can be translated into improved funding in other areas of need.
EVOLUTION OF TEACHER RESOURCING MODELS
The most important resource that any education system possesses is teachers. Teachers are also the most costly resource component, usually accounting for between 80 – 90% of education budget expenditure. As a consequence, there have been many attempts over recent years to achieve greater efficiency in the area of allocations of teachers to schools and, in particular, to students’ needs. Allocation models have evolved through what may be referred to as first, second, and third generation models.
First Generation Models allocate teachers per school or teachers per class. For example: all primary schools get at least 9 teachers, or, all secondary schools under 200 students receive 13 teachers. This model is the type currently used in Indonesia and may seem simple, but it is actually extremely difficult to control and quantify accurately. This model is also inequitable in that schools of a wide range of sizes all receive the same allocation. It is incompatible with the achievement of a reasonable and meaningful national STR. It is also difficult to administer. Under this model, national staffing needs (and therefore future workforce projections) depend upon how schools organize their classes and not on total student populations. Another major disadvantage is that the allocation is school-focused, not student-focused: student needs and outcomes should be the focus of all resource allocation policies.
Second Generation Models allocate teachers per student. For example: one teacher for every 35 primary students or part thereof. There must, of course, be inbuilt protection for small schools. This protection could be determined by a sliding scale or simply by a stipulation such as “no school will receive less than four teachers”. The size of the divisor will depend upon the national budget available to fund the employment and deployment of teachers. This system of allocation is much more equitable and has a greater alignment with targeting of STRs. It makes workforce projections easier because teacher numbers are a clear arithmetic function of school enrolments. It also provides a clear basis for the allocation of budgets from the centre to districts and from districts to schools. Another major advantage is that it is student-focused. The major disadvantage is that it is still a centrally prescribed resource model that limits school level management prerogatives.
Third Generation Models allocate funding per student. For example: each primary student is to be funded at Rp xxx per annum. This simple formula can be adjusted to recognize the differing costs at different year levels. For example: students in the early years of primary education may receive higher funding, as may students in the upper, and more expensive, years of secondary education. The allocations can also be adjusted to compensate for poverty, disability, remoteness and other special needs. Each school’s level of funding could be calculated centrally or at district level and paid directly to the school in quarterly grants. Schools could then determine their own requirements for the teacher and other resources they need to deliver educational services within their budgets. Although this is a relatively simple concept, it requires extensive financial and personnel management systems to be in place to operate effectively at a system level. It also requires extensive accountability and control mechanisms, as well as training for school-based personnel so that they are capable of determining and organizing resource allocations.
68 Teacher Employment and Deployment In Indonesia
As far as the allocation of teachers is concerned, Indonesia’s systems are currently based on first-generation models, although some movement towards school level management of, and accountability for, resources and the alignment of resources with student numbers has already taken place through the introduction of the BOS grants to schools. This is a commendable start. If the long-term goal is to move teacher allocation systems to those based on a third generation model, there are clear prerequisites for the transition. Three steps are recommended:
Step 1: Move to an equitable distribution of teachers: This implies the introduction of both student per teacher staffing entitlements and the application and enforcement of deployment policies. This step will ensure closer alignment with the second generation models and will ensure that, as far as possible, each school has a fair share of the teacher resource pool. It will be necessary to continue to improve census data collection from schools to ensure that the enrolment data on which school entitlements are based is sound. The implementation of Step 1 in itself would yield major improvements;
Step 2: Develop the necessary system management tools and accountability and control mechanisms to enable devolution of teacher funding to the school level: This should involve the resolution of any legal or administrative obstacles to the devolution and the development of training packages for school and district personnel;
Step 3: Introduce student per capita funding for teacher salaries. This would be a significant step towards total school funding and self-management. One possibility would be to pilot the introduction of such a measure in a small number of schools.

Opportunities for Equity, Efficiency and Quality Improvement 69
ANNEX G: CIVIL SERVICE AND TEACHER MANAGEMENT
Teachers make up 70% of the core civil service. However, the civil service system itself is in many ways quite irrelevant to teacher management and is often detrimental to addressing teacher management issues. The following points are derived from the background paper, Teacher Management in the Context of the Civil Service (2006, Kluyskens and Firdaus)
The Indonesian civil service is characterized by:
SYSTEM
Closed career-based system whose discipline and performance provisions have largely disappeared and deteriorated in practice;
Lateral entry is not possible; As the system is presently managed, performance and merit are virtually irrelevant to
advancement and promotion; The compensation system is unequal and fragmented; Promotion in practice is based on seniority and has, amongst other anomalies, resulted in
promoting employees to jobs for which they are not qualified; The compensation system is very fragmented between basic salary and other
components, mostly allowances. Local governments can additionally define other allowances and benefits;
The Indonesia civil service is not badly paid, although there are substantial differences depending on rank and post;
The institutional and legal framework of the system is highly fragmented, imprecise and is not well-suited to improving performance or to reforming structures, organizations or personnel management;
Personnel policies are obsolete and dated and the enforcement of rules of the game has been seriously undermined;
The civil service is aging.36
36 Stocktaking on Indonesia’s recent decentralization reforms, page 49, USAid As of December 2005, there were 3,662,336civil servants in the core civil service excluding themilitary, police and public enterprises. Of these approximately 2.5 million are at the regional level.The civil service profile is aging rapidly; 24.6% are in the age of 41- 45, 19,7 % in the age between 46–50 and 16.4 % in the age between 51–5651. The aging of the civil service population is a serious problem that needs to be addressed urgently in order to avoid an under-resourced pension system and gaps in the human resource base.

70 Teacher Employment and Deployment In Indonesia
MANAGEMENT CULTURE
The bureaucratic culture is hierarchical; Work is based on traditional bureaucratic practices and on ensuring that procedures are
followed rather than on achievement of outputs or outcomes; Disciplinary actions are not enforced and a laissez-faire culture prevails, at times
aggravated by corrupt practices; Civil servants are motivated by factors such as job permanency and easy work rather than
an interest in their jobs or in advancing their careers. In addition, they will receive a guaranteed pension at retirement age;
The management of civil servants has been undermined by rampant abuse of the rules and procedures for personnel actions, as well as by the opaqueness of the remuneration system. Widespread patronage and rent-seeking, combined with little enforcement of sanctions, have seriously undermined the accountability of staff and managers.
Career management of teachers
The management of teachers suffers from the same general problems as the civil service as a whole. Examples include:
Recruitment is based on a low standard of qualifications and on successful completion of the entrance examination for the civil service;
Performance evaluation tends to serve a purely administrative purpose and to bear little relationship to actual merit or performance;
Promotion in practice is a function of automatic advancement; by normative standards many teachers should be discharged from the teaching profession;
There are no rigorous generic job descriptions; Most training is compulsory and conducted in order to advance to the next grade in the
civil service. There is little systematic or coherent training related to job requirements or career development;
In certain regions, contract teachers supplement the already existing teacher work force, with these contract teachers often being appointed without rigorous analysis of demand or supply. They are mostly unqualified, lack some of the benefits to which the permanent teachers are entitled and suffer from job insecurity;
The limited number of grades in the scale restricts promotion possibilities and encourages senior teachers to take administrative positions since they have limited options for advancement in the current system. Administrative positions will ultimately allow them to get into a structural position whose basic salary and allowances are far more attractive then those of functional positions;
Lateral entry and accelerated progression through the ranks are not possible. The point system is partly intended to accelerate advancement but in practice the process of point approval by a senior officer is dominated by rent seeking and tends to slow down the teacher’s progression. Teachers do not have the skills to perform tasks that are associated with high points. They also need guidance to identify areas where points may be obtained.
Opportunities for Equity, Efficiency and Quality Improvement 71
Issues related to teachers and their management that deserve particular attention:
1. Contract teachers will be converted to PNS by 2009. Most contract teachers are unqualified and will therefore create an additional group that will be subject to the new Law. It may be useful to analyze the data in terms of the qualifications, age, and years of teaching service and to develop a policy and procedures to see how, when and where they will enter the civil service. This should be developed in relation to MoNE’s current deployment, quota and demand and supply policies and procedures and in coordination with district governments, since districts are responsible for appointments and other related matters. Given that this is a one-off exercise, a project approach may be the best way to help MoNE complete this task in order to ensure transparency and cooperation with MeNPAN, BKN and other relevant stakeholders.
2. Transfer and deployment: Transfer policy is very general and transfers often teachers wanting a transfer make an under-the-table payment to district authorities. This may therefore create distortions in the supply and demand of teachers. Current transfer policy may also create differences between teachers’ levels of qualification, competence and the criteria inherent in the job they transfer to and the job they leave. In addition, transfer may also lead to promotion. The current transfer policy is not teacher specific but applies to all civil servants, and could be reviewed in the context of a reexamination of MoNE’s teacher deployment policy and of an analysis of the quota for planned recruitment of teachers. In particular, the following measures should be considered: i) introducing robust criteria for transfers that include an analysis and justification of demand and supply (level of post and level of teacher); ii) the development of clear procedures for transfer within and among various jurisdictions; iii) the development of a system by which teachers have better access to open positions for transfers and iv) the systemic recording of data related to transfers at the district level.
3. Recruitment and selection remains a complex and sensitive issue, irrespective of whether responsibility for systems of recruitment into the civil service, including the recruitment of teachers, continues at the district level or is officially re-centralized. Within a closed career system, recruitment policies are critical to ensuring the acquisition of the best skills for the civil service. Currently, recruitment policy and procedures are generic, with little evidence that local governments set robust criteria for teachers intending to enter the civil service. There is a need to study how teachers can be better assessed and evaluated during the recruitment and selection process. Reviewing the recruitment and selection policies in the light of developing criteria for teachers will be a vital first step in assisting local governments to develop a more rigorous selection process.
4. Remuneration: The new Teacher Law is specific about the various allowances to which teachers are entitled. The effect of the allowances on teachers’ level of qualifications and performance deserves further attention, as pointed out in the section above.. The Law reflects the perception that allowances are the only way GOI can create additional incentives for teachers in the absence of more systematic reforms to pay, grading, job classification and performance systems, including the point system and seniority-based advancement. On the one hand, the Law is an example of ‘creative improvisation’, in that it introduces a new allowance, the professional allowance. On the other hand, it further increases the large number of existing allowances and rewards, and therefore creates additional complexity. Of particular interest is the functional allowance. Discussions with representatives of MoNE and other agencies suggest that it may be possible to link the functional allowance to an additional increment system, as is currently the case in the higher education system. This system would be new and would not be based upon the scales, ranks and basic salaries currently used, or on any of the other existing allowance systems.
72 Teacher Employment and Deployment In Indonesia
The increment system would have to have a sufficient number of levels in order to motivate teachers to move on to the next increment after successfully passing the performance appraisal.
5. The point system: It is vital to determine whether the point system can be revitalized and the award of the professional allowance (received by certified teachers) linked to performance. Considering the substantial nature of the allowance (100% of the basic salary), this option should be studied and explored carefully. Whether it is politically feasible remains to be seen, since the Law has created the expectation that teachers will automatically obtain this allowance. Failure to meet this expectation may result in a high level of resistance.
6. Performance Management is the underlying concept according to which most of the previous points have been developed. Currently, all human resource policies and instruments are outdated and stem from the 1970’s. Introducing specific, individual policies or instruments within the context of the outdated system of Human Resource Management created by these policies and instruments is doomed to failure. The development of a solid method of appraisal for teachers, for example, may only be useful if certain other key human resource instruments were to accompany it. To start modestly, one could explore which part of the human resource system is crucial to improving the system of teacher management and thereby improving the quality of teachers and the education system, as is envisaged in the new Teacher Law and by the BERMUTU project.
Opportunities for Equity, Efficiency and Quality Improvement 73
ANNEX H: RELATED CONSIDERATIONS
This annex, which provides brief comments on a number of issues raised during the course of the study, is included for the interest of readers. It does not form an integral part of the Report.
Repetitions in the early grades
Although not directly related to teacher employment and deployment, it is apparent from the sample data that there is an extremely high repetition rate in the first year of primary school. Some 12.5%, or one in eight, of beginning students are reported to fail to complete grade 1. The high rate has been attributed, in part, to the fact that many students commence schooling with a knowledge and competence only in their local language and have difficulty in participating in classes in which Bahasa Indonesia is used as the medium of instruction. A related contributing factor could be that the children are in school for a very short period of time each day. It is surprising that during the most effective years for students to learn a language and establish a firm foundation for future learning, they are only required to attend school half-time, meaning that students effectively spend only one year at school over the first two years of education. Although this may facilitate the transition from home to school, this nonetheless seems excessively low. Regardless of the reasons for the high repetition rate, it is a great pity that for one in eight students, their first experience of school is one of failure.
Related recommendations:
Schools should consider revising expectations of student achievement in the early years; Schools should assign the most appropriate and capable teachers to the early years; Consideration should be given to extending the length of the school day for grades 1 and
2; There should be scope for greater professional consultation with early childhood
educators.
Providing specialists such as school counselors in all primary schools
One or two discussion groups at the Workshop raised the issue of the need for all primary schools to be provided with school counselors. This is an attempt to recognize that attitudinal, psychological and societal impacts on student are not confined to secondary schools, but require early attention during the primary years. It is not considered necessary or feasible to provide all primary schools with a school counselor. However, consideration might be given to providing districts with a small entitlement to specialist teachers that could then be shared across schools as needs arose. For example, some districts may prefer specialist student counselors, other districts may prefer experts on numeracy, literacy, early years, music, psychologists, etc. Districts may want to select a mix of specialists.
Related recommendation:
Consideration should be given to providing a small entitlement of specialist teachers to be based in each district.

74 Teacher Employment and Deployment In Indonesia
The apparent sudden drop in enrolments between the end of primary and the start of secondary education
While the participation levels throughout primary schooling are reasonably high, there is a sudden drop off between grade six and year 1 of junior secondary education. It is unclear why this drop off occurs. Students have a number of choices at the end of grade six. They can continue in the SMP schools, transfer to the Madrasah system, enter the Pesantren stream (community or religious schools) or continue their education in the non-formal sector (vocational education) Data for the numbers of students entering some of these options are not readily available. It may be that some students do not continue a standard secondary education because there are insufficient places in the public schools (entry is test based); there is no public or private school accessible in some remote areas; or parents cannot afford the fees (there are so many fees at SMP level that many parents are not in a position to afford the opportunity costs – to forego earnings – to send their children to schools). This is an area that requires further study. If there are students who are capable and interested but unable to access junior secondary education, then that is a matter that should be addressed.
Related recommendation
Further investigation should be conducted to determine how effectively the system is currently providing universal access to secondary education.
Poverty reduction impacts
There is little doubt that children in remote areas suffer educational disadvantage in terms of access, equity and probably quality. Remote villages are not well served under the current educational system. There is also a high correlation between remoteness and poverty. It therefore follows that the poorest sectors of Indonesian society are the least adequately resourced for education. It is also established that direct investment in education, targeting poverty stricken areas, directly leads to poverty reduction. Improving the quality of education in remote and disadvantaged areas should therefore be a priority for government. The new Teacher Law should help to steer better qualified and more professional teachers into the poorer schools. Consideration should be given to complementing this initiative with additional educational resources for remote or disadvantaged areas.
Related Recommendation:
Consideration should be given to weighting resource allocation to recognize the disadvantage suffered by remote and poorer communities.
Consistent terminology
Current national policies in some areas use terminology that is unclear and inconsistent with international usage. For example: Class (or ‘kelas’) is the term used to refer to year or grade level. The Indonesian term for class is ‘rombangan belajar’ (or ‘learning group’). A question on class size will therefore elicit an answer about the number of students at a year level. Similarly there is potential for confusion regarding teaching periods and teaching hours, given that while the word ‘hour’ (‘jam’) is widely used, it may refer to a shorter unit, such as 30 or 40 minute periods.

Opportunities for Equity, Efficiency and Quality Improvement 75
Related recommendation:
Consideration should be given to adopting terminology that is consistent and in accord with international norms.
Assistant teachers
The concept of an “assistant teacher” emerged during discussions on remote schools and scholarships. There could be merit in providing an opportunity for those students in remote areas who have expressed interest in becoming teachers to serve in their local school as assistants for a year before commencing training. During this time they could receive the scholarship allowance.
Related recommendation
Consideration should be given to providing the opportunity for students in remote areas, who have expressed interest in becoming teachers, to serve in their local school as assistants for a year before commencing training.
Five-day school week
The length of the school week for primary and junior secondary schools varies between five and six days. The district is responsible for deciding when schools will be open, providing they meet the nationally prescribed hours of instruction. There could be merit, especially in remote/rural areas, in having a five-day school week. This would allow students more time to assist their parents, without forgoing school time, and teachers more time to access services in nearby towns/villages and/or to return home for week-ends. In areas where students live far from their schools, this would also cut down on student traveling time each week.
76 Teacher Employment and Deployment In Indonesia