Tea vs Coffee – Chloropeth with PS Imago World map · Tea vs Coffee – Chloropeth with PS Imago...
16
Tea vs Coffee – Chloropeth with PS Imago World map
Transcript of Tea vs Coffee – Chloropeth with PS Imago World map · Tea vs Coffee – Chloropeth with PS Imago...
Tea vs Coffee – Chloropeth with PS Imago World map
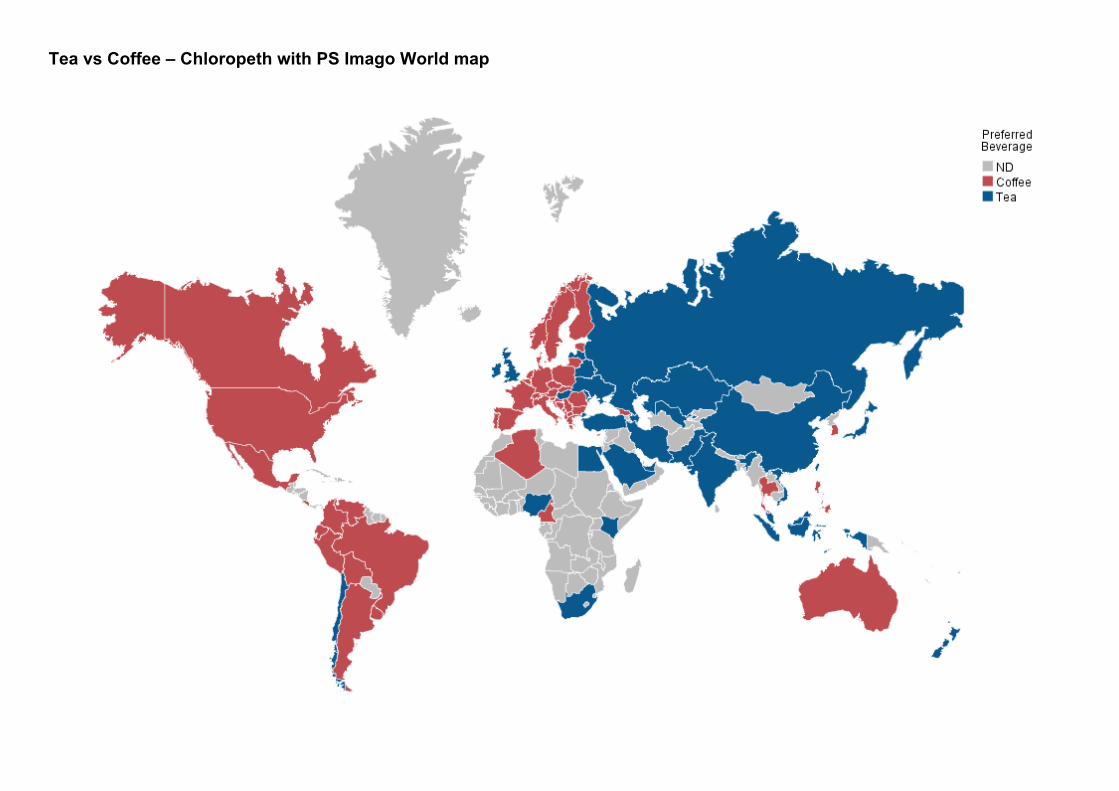
Top 20 Coffee Drinking Nations: PS Imago Table with bar charts
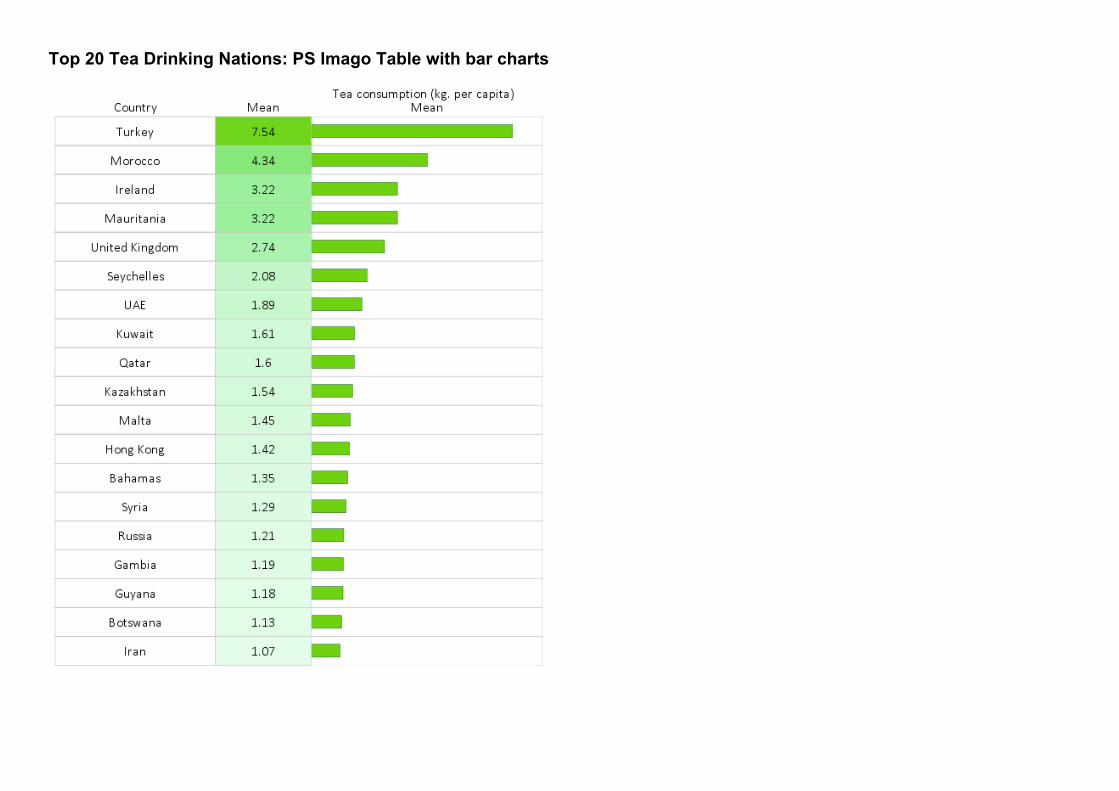
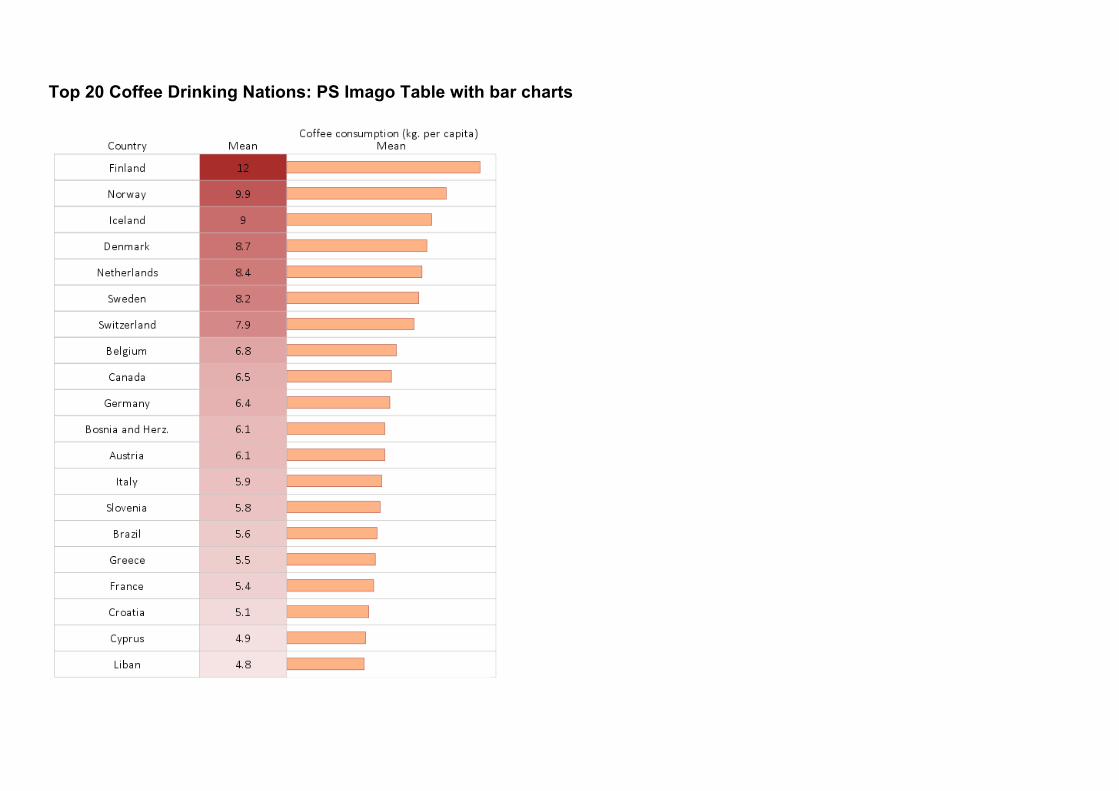
Top 20 Tea Drinking Nations: PS Imago Table with bar charts
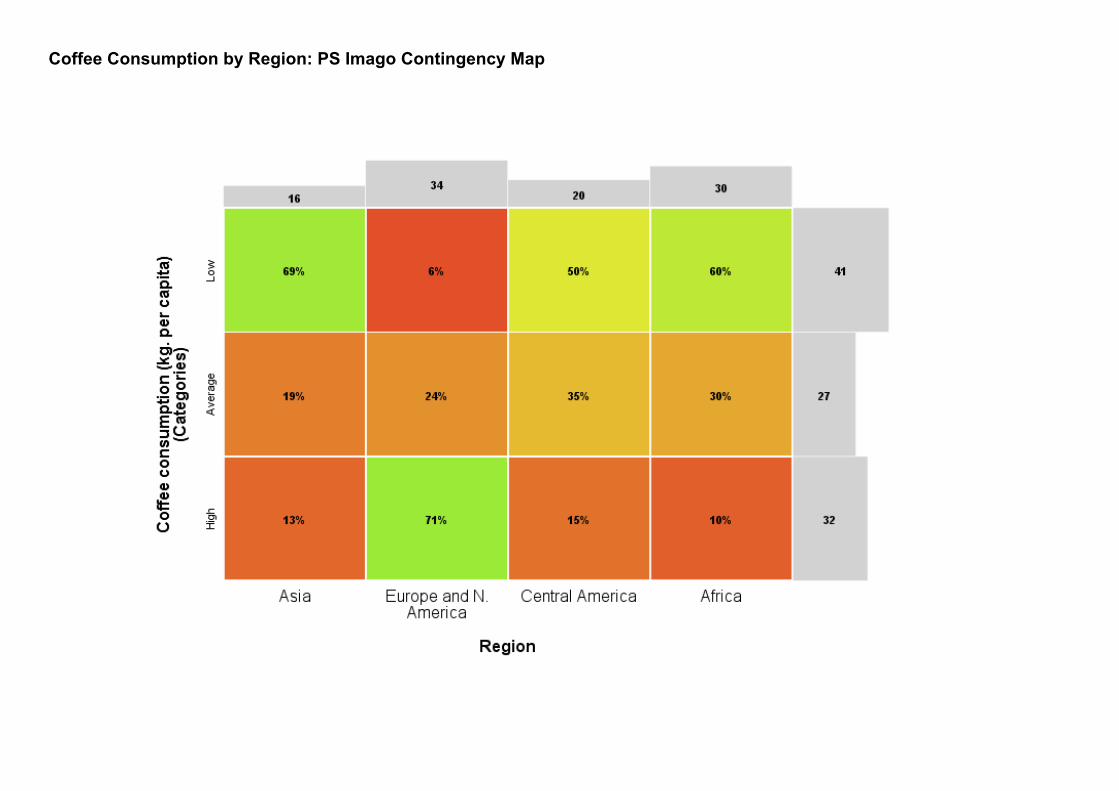
Coffee Consumption by Region: PS Imago Contingency Map
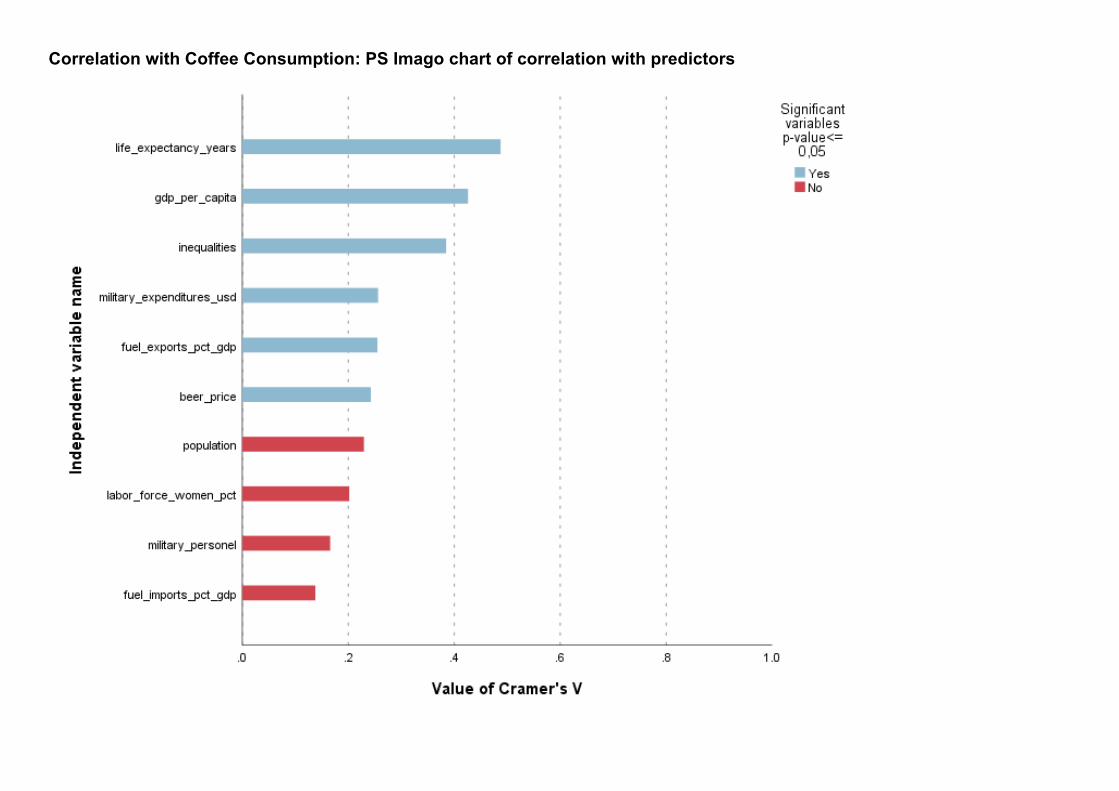
Correlation with Coffee Consumption: PS Imago chart of correlation with predictors
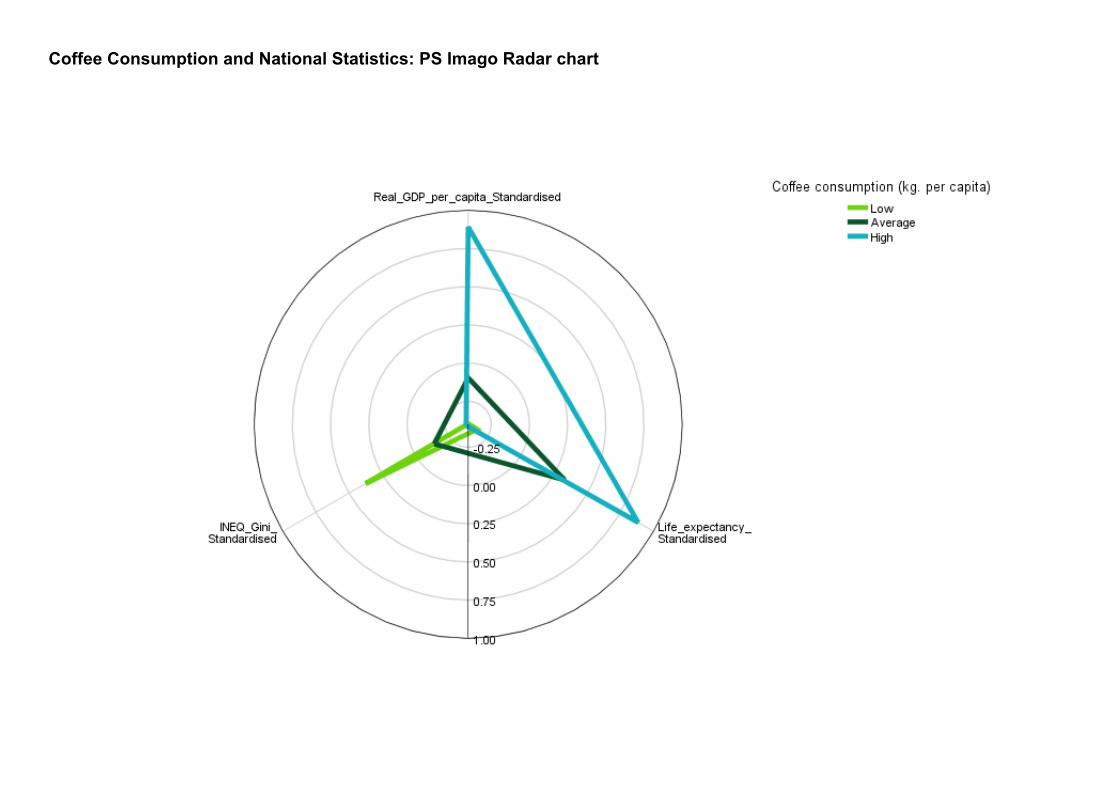
Coffee Consumption and National Statistics: PS Imago Radar chart
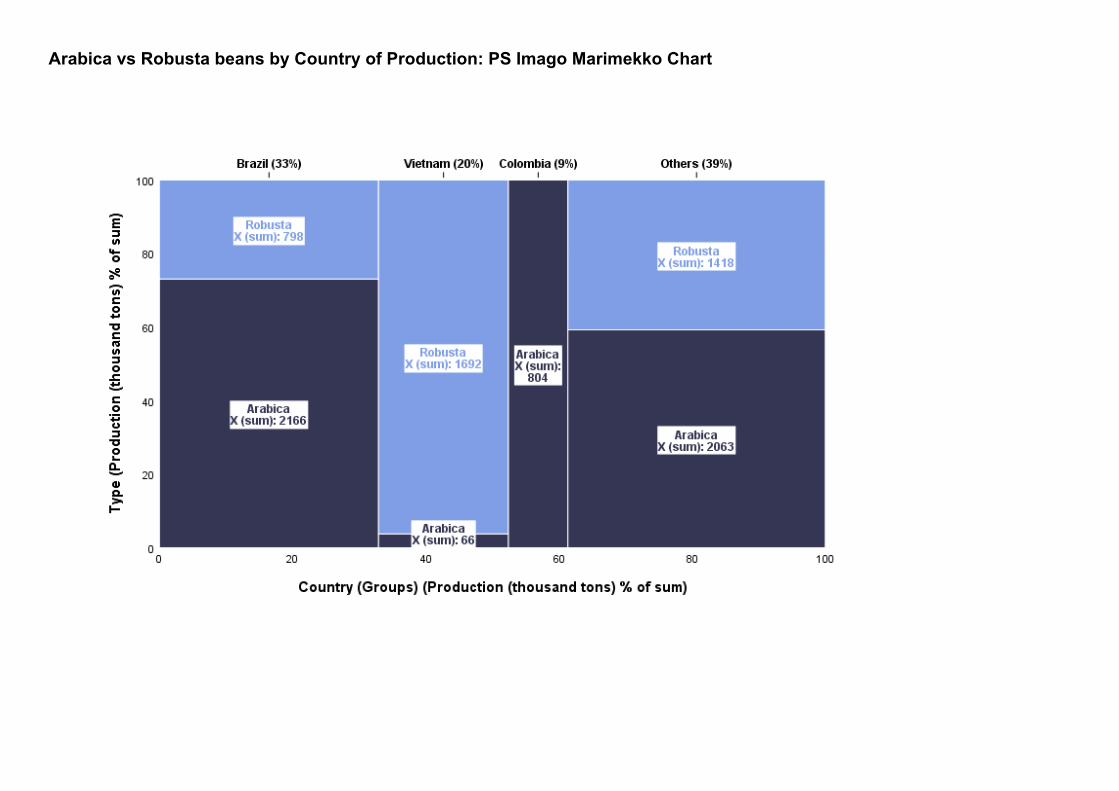
Arabica vs Robusta beans by Country of Production: PS Imago Marimekko Chart
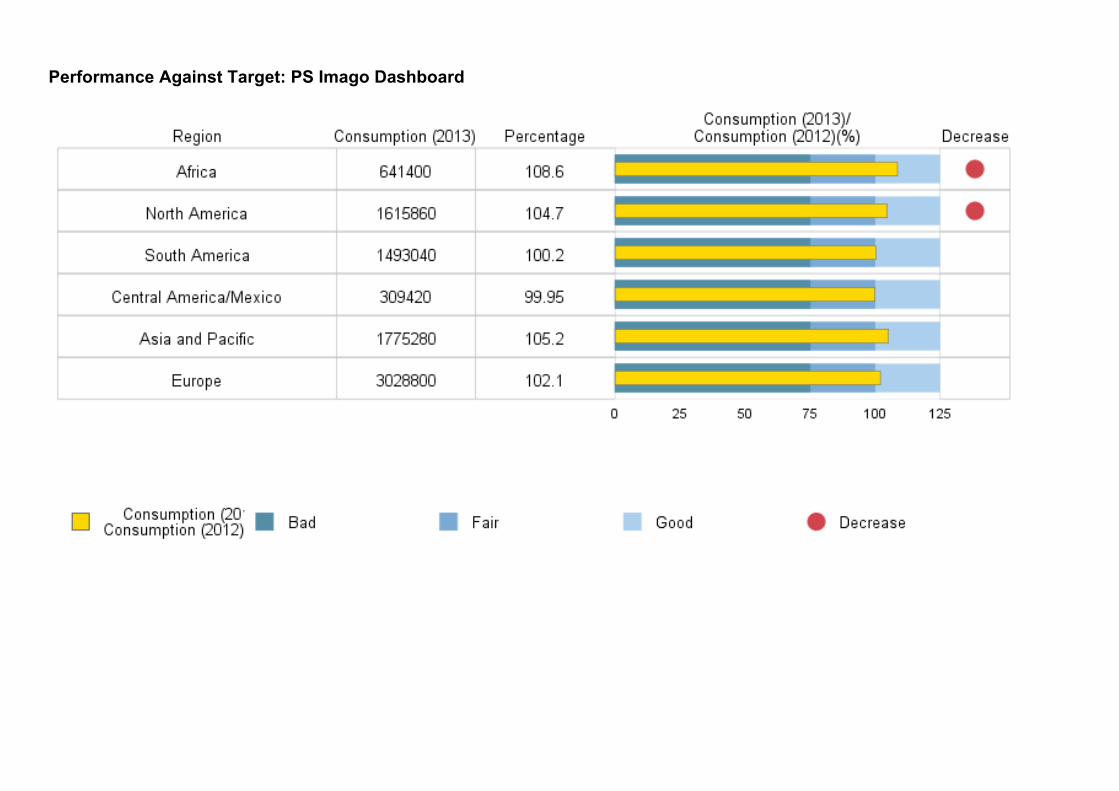
Performance Against Target: PS Imago Dashboard
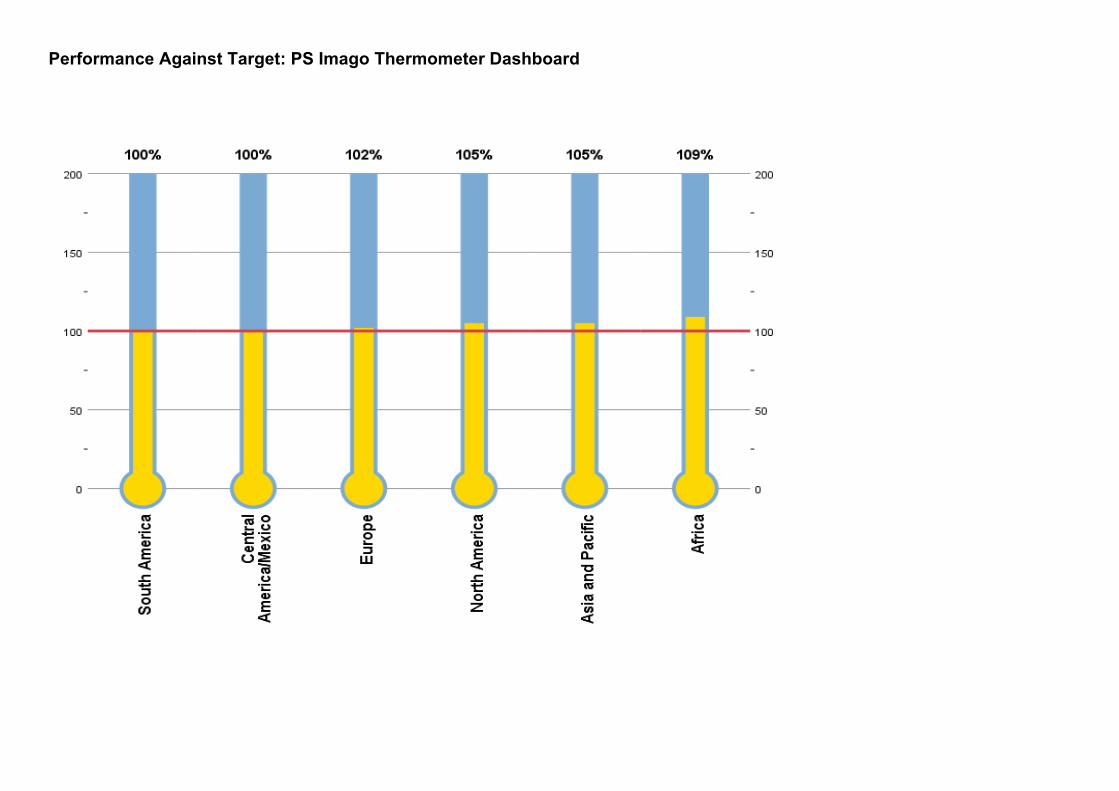
Performance Against Target: PS Imago Thermometer Dashboard
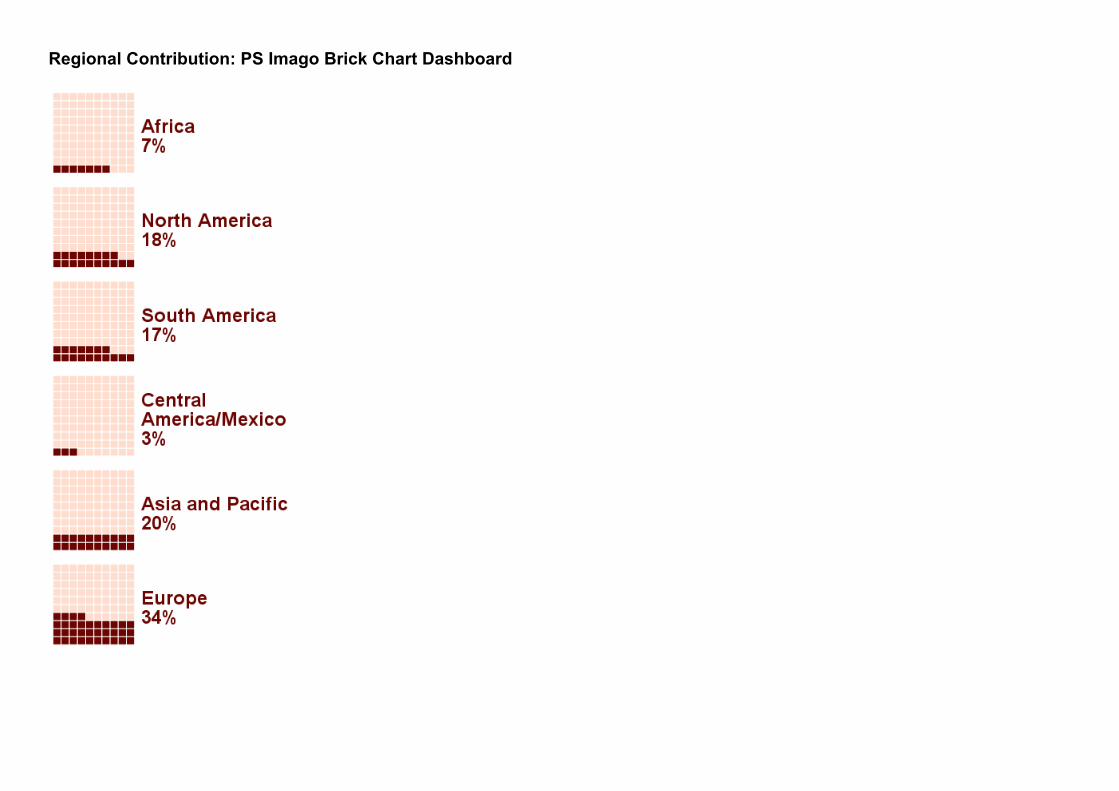
Regional Contribution: PS Imago Brick Chart Dashboard
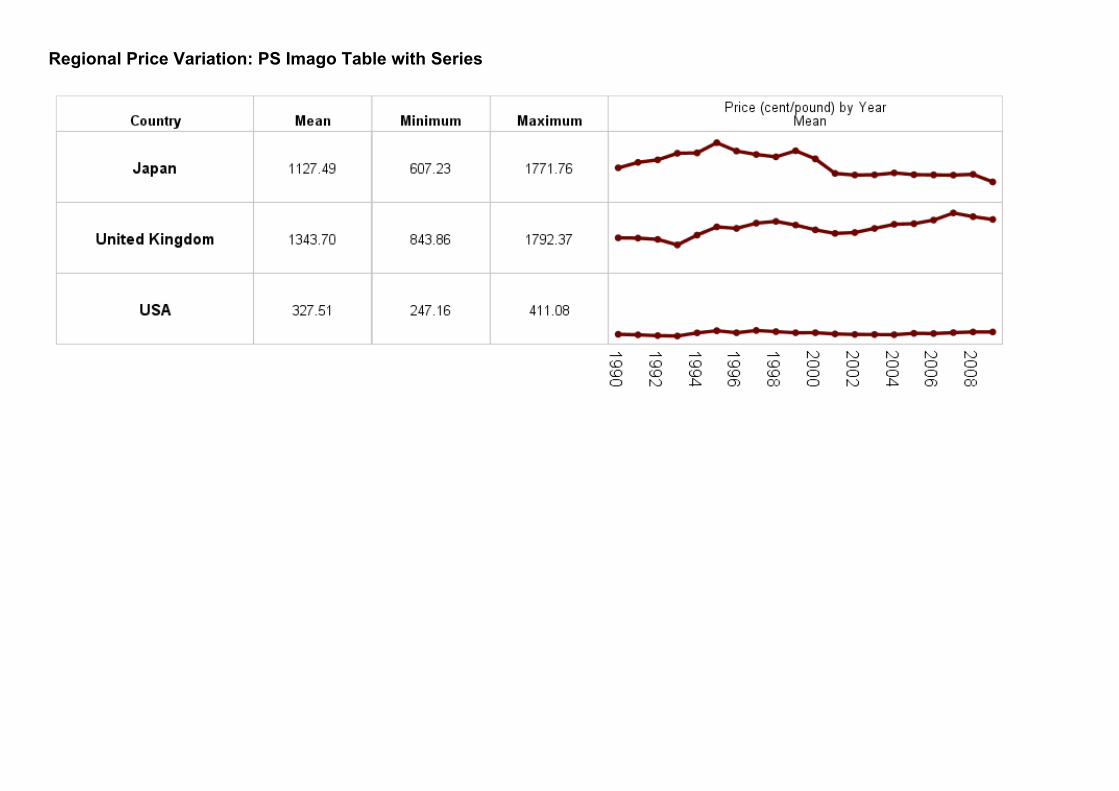
Regional Price Variation: PS Imago Table with Series
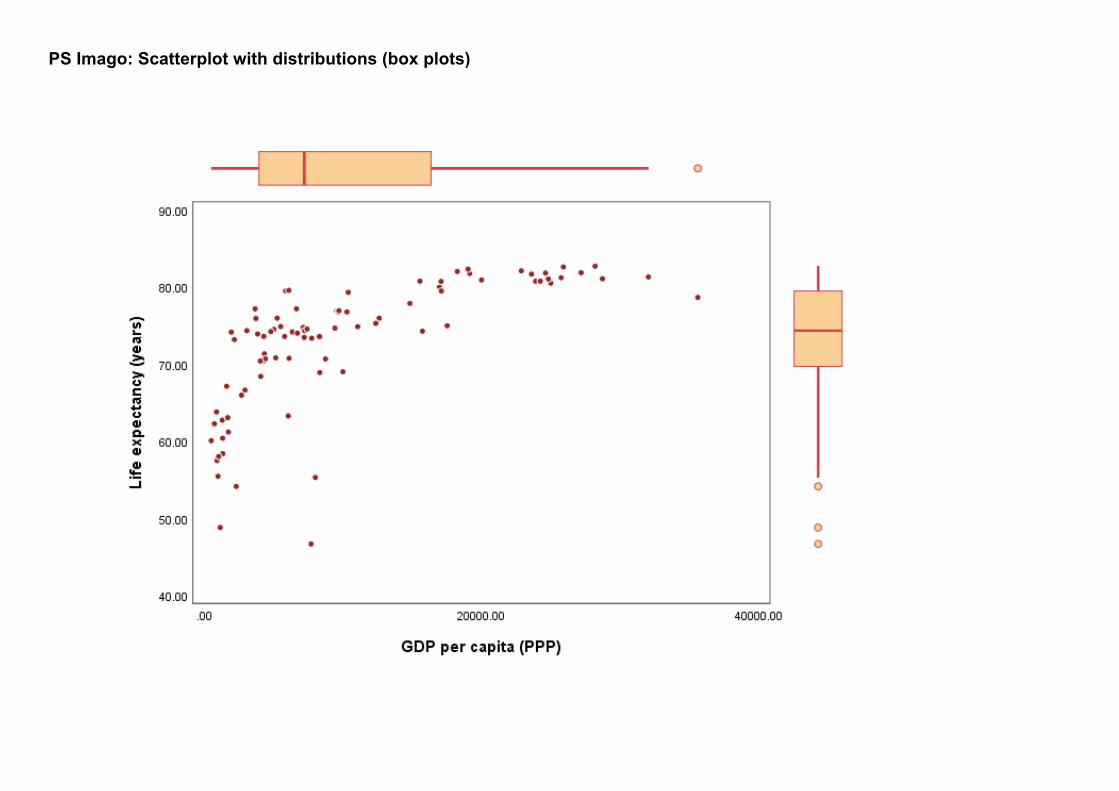
PS Imago: Scatterplot with distributions (box plots)
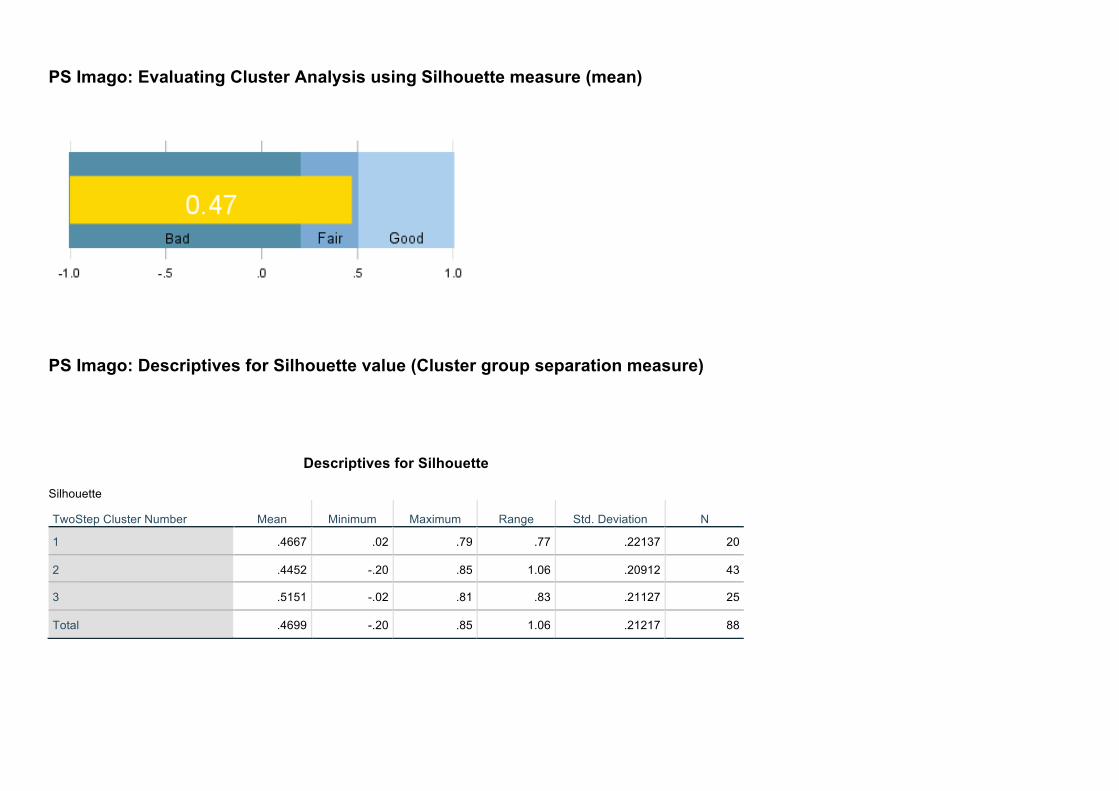
PS Imago: Evaluating Cluster Analysis using Silhouette measure (mean)
PS Imago: Descriptives for Silhouette value (Cluster group separation measure)
Descriptives for Silhouette
Silhouette TwoStep Cluster Number Mean Minimum Maximum Range Std. Deviation N
1 .4667 .02 .79 .77 .22137 20
2 .4452 -.20 .85 1.06 .20912 43
3 .5151 -.02 .81 .83 .21127 25
Total .4699 -.20 .85 1.06 .21217 88
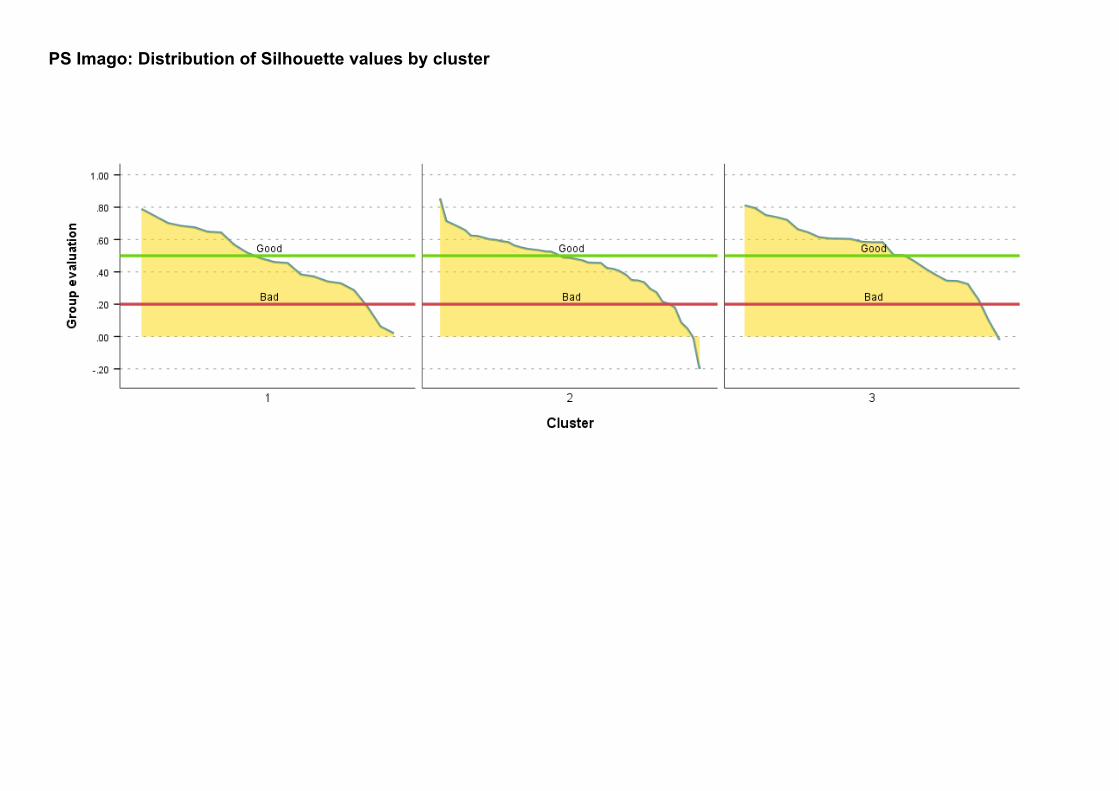
PS Imago: Distribution of Silhouette values by cluster
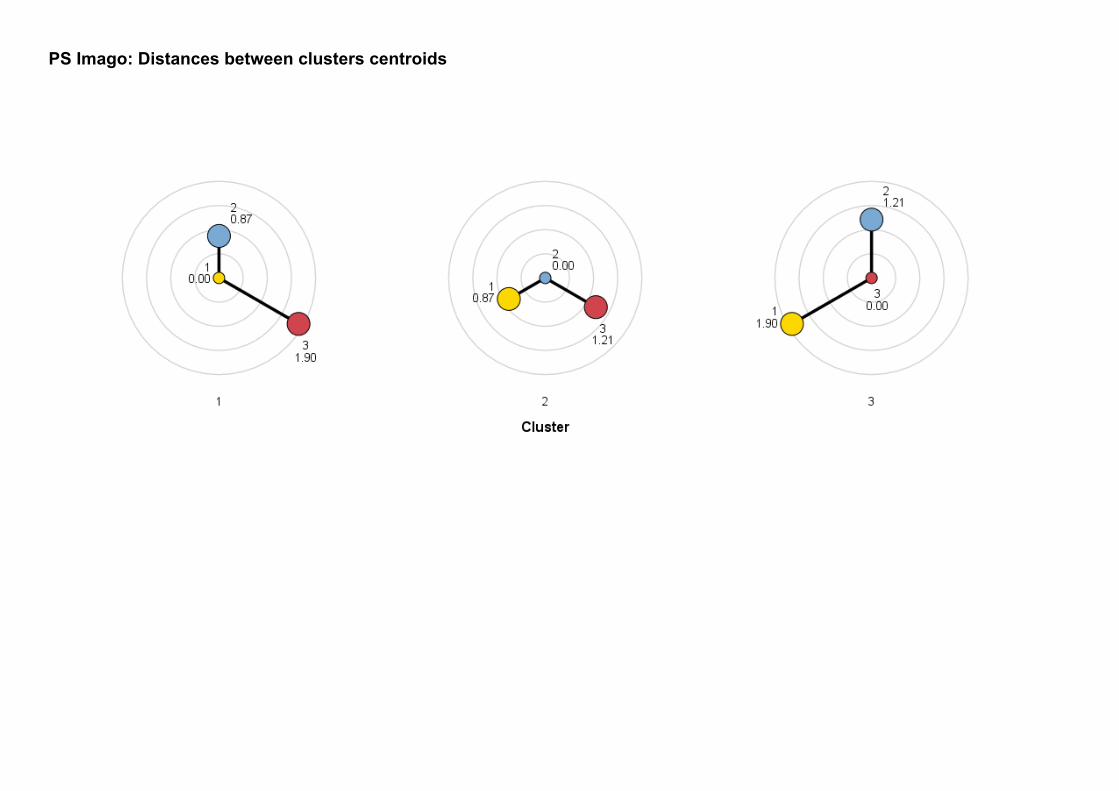
PS Imago: Distances between clusters centroids
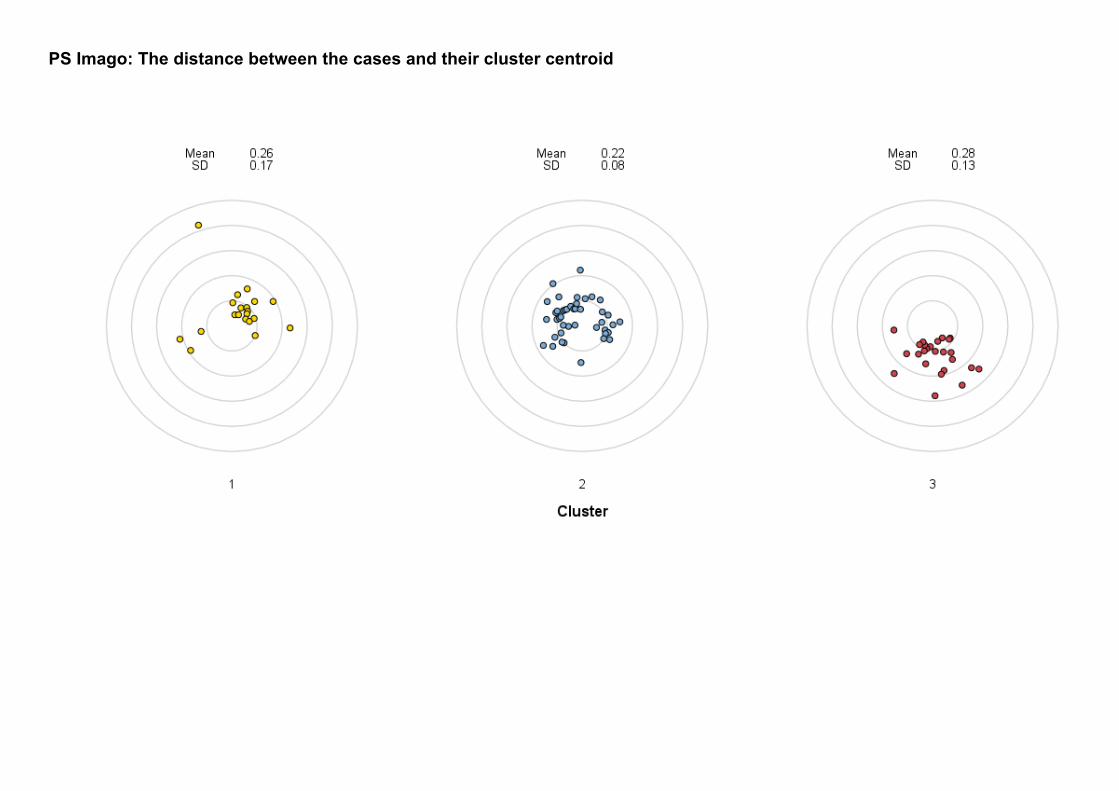
PS Imago: The distance between the cases and their cluster centroid