
Free to Build: Restoring New Zealand's Housing Affordability
1Reserve Bank of New Zealand: Bulletin, Vol. 77, No. 6, December 2014
Reserve Bank of New ZealandTe Pūtea Matua
Bulletin Volume 77, No. 6, December 2014
The Reserve Bank maintains a range of exchange rate indices which summarise developments in the New
Zealand dollar, by aggregating various bilateral exchange rates that are relevant to New Zealand’s economy. In this
article, we review some of the issues involved in doing this aggregation. From 17 December, the number of currencies
in the official Trade-Weighted Index (TWI) basket has been increased to 17, and the weights on the various currencies
will be calculated using shares of bilateral trade in goods and services between New Zealand and the country of each
currency.
Measuring New Zealand’s effective exchange rateDaan Steenkamp1
1 IntroductionMacroeconomic analysis requires summary
data. For example, GDP and the CPI are two well-known
summary measures - of domestic economic activity and
prices respectively. ‘Effective’ exchange rate indices
summarise the value of a country’s currency relative to
those of other countries. But doing so is not simple. There
are more than 150 other currencies, and while some
obviously matter more to New Zealand than others, there
is no universally agreed answer as to how best to construct
an index. As a result, there is often a range of different
effective exchange rate indices for a single country.
A ‘trade-weighted index’ (TWI) is one way of
constructing an ‘effective’ exchange rate index, based
simply on trading partners’ share of New Zealand’s foreign
trade. Since it was introduced in the late 1970s, the
Reserve Bank’s official exchange rate index (known as the
TWI) has been a weighted average of just five exchange
rates (those with the United States, Australia, Japan,
United Kingdom and Germany, and since 1999, the euro
zone). The countries using these five currencies once
accounted for the overwhelming bulk of New Zealand’s
external trade. But New Zealand’s trade has become
increasingly diversified. In particular, China is currently
New Zealand’s second largest trading partner.
In October, the Reserve Bank announced
changes to the construction of its TWI. Those changes
were implemented on 17 December 2014. In particular,
the number of currencies included in the TWI has been
increased from five to seventeen, and the weights for
each currency will now be calculated based solely
on direct bilateral goods and services trade with New
Zealand (having since 1999 been based on both bilateral
goods trade shares and the relative importance of each
economy’s GDP).
This article explains the motivation behind the
changes, and also discusses the methodologies used
in some other estimates of New Zealand’s effective
exchange rate. 1 Thanks to colleagues at the Reserve Bank for helpful comments, especially Rochelle Barrow, Graham Howard, Chris Hunt, Michael Reddell and Christie Smith.
2 Reserve Bank of New Zealand: Bulletin, Vol. 77, No. 6, December 2014
2 A summary measure of the exchange rateBilateral exchange rates are the rates at which
one currency can be exchanged for another. The levels
and/or changes in exchange rates can have important
economic implications. Exchange rates are important for
many firms, affecting (both directly and indirectly) export
competitiveness, and the profitability and competitiveness
of domestic firms that compete with imports. Exchange
rates also affect the local prices of tradable goods and
services, and hence the purchasing power of households
and their ability or willingness to buy imported goods
and services. For example, a holiday decision might be
influenced both by the value of the New Zealand dollar
against all other currencies (whether to go on holiday
overseas) but also by the movements among currencies
(which foreign country to holiday in). Rather than work
with the bilateral exchange rates of each of New Zealand’s
many trading partners - and the relevant exchange rates
will be subtly different for each different individual and
firm - economists typically choose to work with a summary
measure. Fluctuations in such an index over time are
one element in assessing or interpreting macroeconomic
developments.
The distinction between real and nominal indices
also matters. The headline TWI quoted in the media and
appearing in, for example, the Monetary Policy Statement,
is a nominal series – a weighted average of the chosen
exchange rates against the New Zealand dollar. It can
be calculated and reported in real time, but changes in
international competitiveness over time are better captured
by developments in the real exchange rate. The Reserve
Bank’s real exchange rate series adjusts for the difference
between New Zealand’s consumer price inflation and
inflation in the countries whose currencies are included
in the exchange rate basket. For example, higher inflation
in New Zealand than in the countries New Zealanders
trade with will tend to cause the nominal exchange rate to
depreciate over time. But such a depreciation provides no
gain in competiveness, as the fall in the nominal exchange
rate is offset by the higher domestic inflation rate. Deflating
using consumer price inflation is not the only possible
approach - some international agency measures adjust for
differentials in producer price, or unit labour cost, inflation.2
Creating a summary exchange rate measure
requires two sets of decisions: (1) how to weight the
various bilateral exchange rates and (2) how many
currencies to include.
2.1 How to weight currencies in the index?The question of how to weight an exchange rate
index is, at least ideally, about trying to represent the
importance of each currency to New Zealand’s economy.
But even that way of framing the issue has a number of
dimensions. If, for example, the Reserve Bank’s primary
interest was in the transmission of price changes from
abroad to New Zealand, the appropriate weighting scheme
might be rather different than if the primary focus was on
the competitiveness of New Zealand’s tradables sector
(i.e, exporters and domestic import-competing firms).
An index focused on price changes might focus largely
on the exchange rates of the countries we import from
(given that our exports are fairly heavily concentrated in
products that only have modest weight in New Zealanders’
consumption). In practice, the Reserve Bank tends to
use the same summary index for a variety of purposes,
but typically with a focus on the implications of changes
in competitiveness (i.e. the real exchange rate) for the
medium-term pressures on resources and domestic
inflation.
Measuring external competitiveness for a small,
open, agricultural commodity exporting country like
New Zealand can be challenging. Trade destinations
for commodity products can fluctuate considerably,
so that an index using trade weights calculated from
previous years’ trade patterns may not necessarily
capture competitiveness changes during the current year.
Commodities are also, to a substantial extent, priced on
a global market, where prices are determined by global
supply and demand conditions. This means that simply
looking at which countries we sell to would ignore the
2 Several price indices could be used to deflate the nominal TWI, each with their own advantages and disadvantages (see Kite 2007 for more discussion). Unfortunately, measures such as producer price indices, export price or unit labour costs tend not be available over long time spans for a wide range of emerging economies, or sometimes are not available in a timely manner.
3Reserve Bank of New Zealand: Bulletin, Vol. 77, No. 6, December 2014
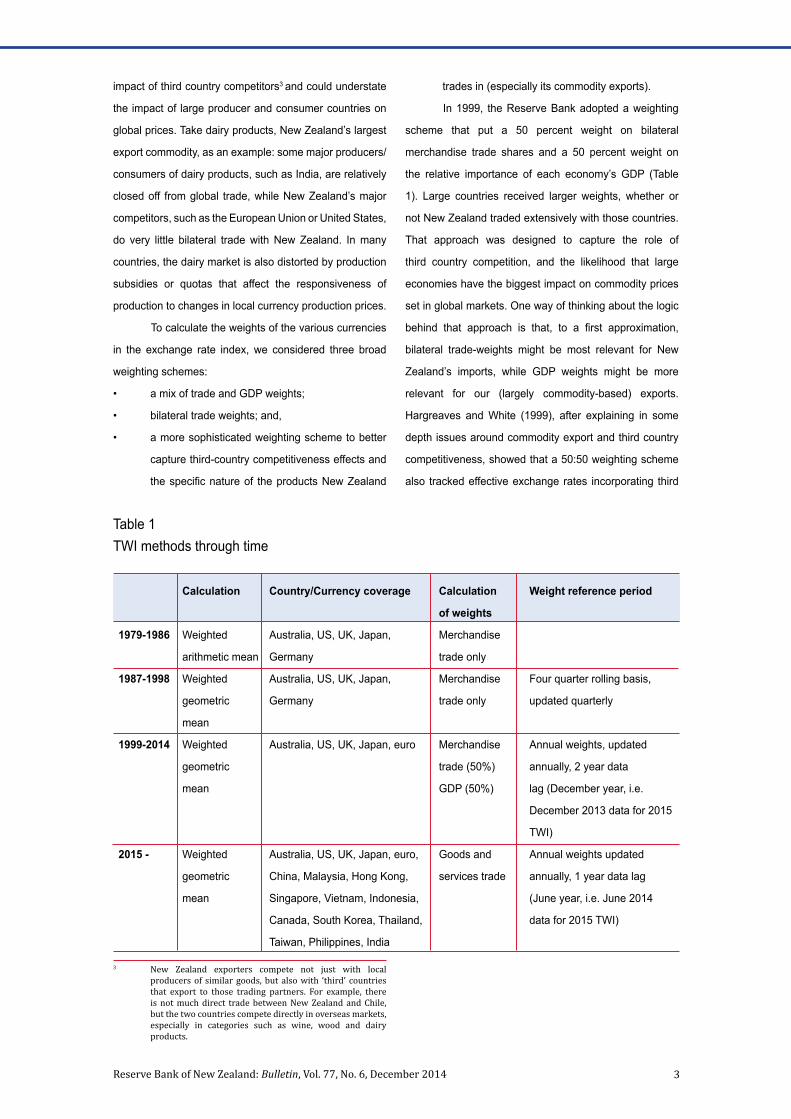
Calculation Country/Currency coverage Calculation
of weights
Weight reference period
1979-1986 Weighted
arithmetic mean
Australia, US, UK, Japan,
Germany
Merchandise
trade only
1987-1998 Weighted
geometric
mean
Australia, US, UK, Japan,
Germany
Merchandise
trade only
Four quarter rolling basis,
updated quarterly
1999-2014 Weighted
geometric
mean
Australia, US, UK, Japan, euro Merchandise
trade (50%)
GDP (50%)
Annual weights, updated
annually, 2 year data
lag (December year, i.e.
December 2013 data for 2015
TWI)
2015 - Weighted
geometric
mean
Australia, US, UK, Japan, euro,
China, Malaysia, Hong Kong,
Singapore, Vietnam, Indonesia,
Canada, South Korea, Thailand,
Taiwan, Philippines, India
Goods and
services trade
Annual weights updated
annually, 1 year data lag
(June year, i.e. June 2014
data for 2015 TWI)
impact of third country competitors3 and could understate
the impact of large producer and consumer countries on
global prices. Take dairy products, New Zealand’s largest
export commodity, as an example: some major producers/
consumers of dairy products, such as India, are relatively
closed off from global trade, while New Zealand’s major
competitors, such as the European Union or United States,
do very little bilateral trade with New Zealand. In many
countries, the dairy market is also distorted by production
subsidies or quotas that affect the responsiveness of
production to changes in local currency production prices.
To calculate the weights of the various currencies
in the exchange rate index, we considered three broad
weighting schemes:
• a mix of trade and GDP weights;
• bilateral trade weights; and,
• a more sophisticated weighting scheme to better
capture third-country competitiveness effects and
the specific nature of the products New Zealand
trades in (especially its commodity exports).
In 1999, the Reserve Bank adopted a weighting
scheme that put a 50 percent weight on bilateral
merchandise trade shares and a 50 percent weight on
the relative importance of each economy’s GDP (Table
1). Large countries received larger weights, whether or
not New Zealand traded extensively with those countries.
That approach was designed to capture the role of
third country competition, and the likelihood that large
economies have the biggest impact on commodity prices
set in global markets. One way of thinking about the logic
behind that approach is that, to a first approximation,
bilateral trade-weights might be most relevant for New
Zealand’s imports, while GDP weights might be more
relevant for our (largely commodity-based) exports.
Hargreaves and White (1999), after explaining in some
depth issues around commodity export and third country
competitiveness, showed that a 50:50 weighting scheme
also tracked effective exchange rates incorporating third
3 New Zealand exporters compete not just with local producers of similar goods, but also with ‘third’ countries that export to those trading partners. For example, there is not much direct trade between New Zealand and Chile, but the two countries compete directly in overseas markets, especially in categories such as wine, wood and dairy products.
Table 1TWI methods through time
4 Reserve Bank of New Zealand: Bulletin, Vol. 77, No. 6, December 2014
country competitiveness and performed well in explaining
inflation and import and export prices.
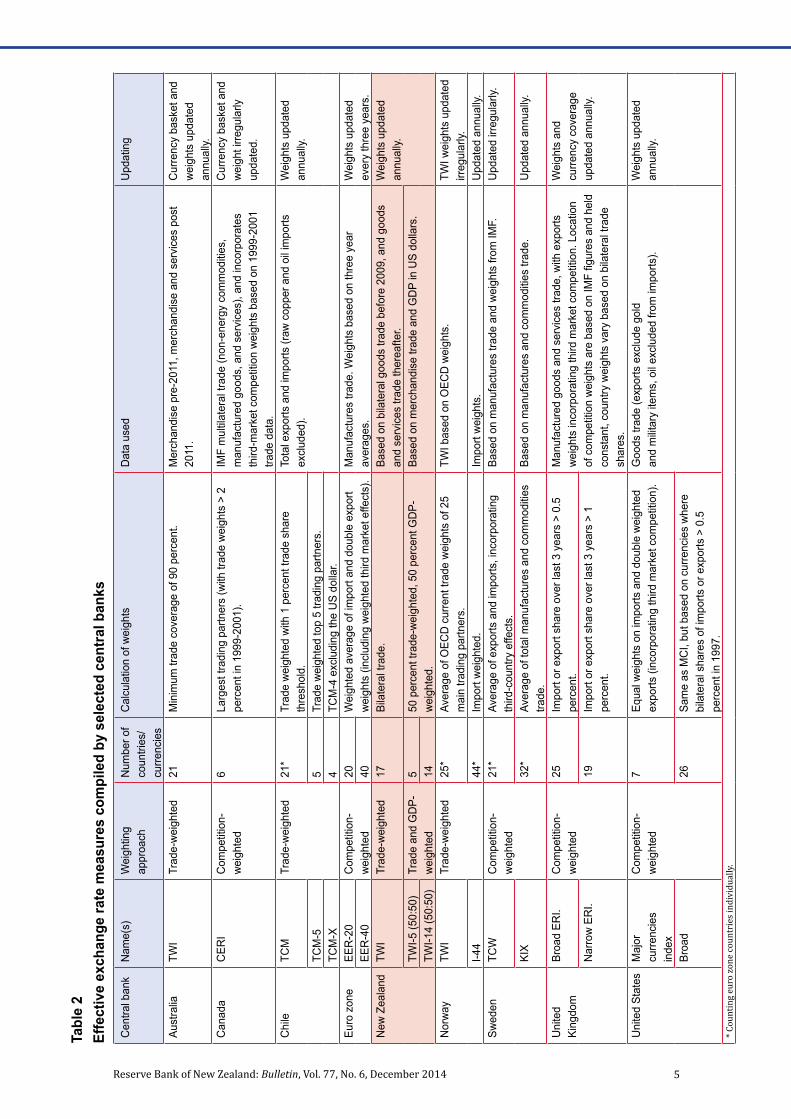
Table 2 sets out how a range of other central banks
construct their effective exchange rate indices. A 50:50
weighting approach is not used by any other advanced
countries that we are aware of. But using bilateral trade-
weights is also relatively uncommon. Most advanced
country effective exchange rates use weighting schemes
that are designed to capture third country competitiveness,
but only in manufacturing.
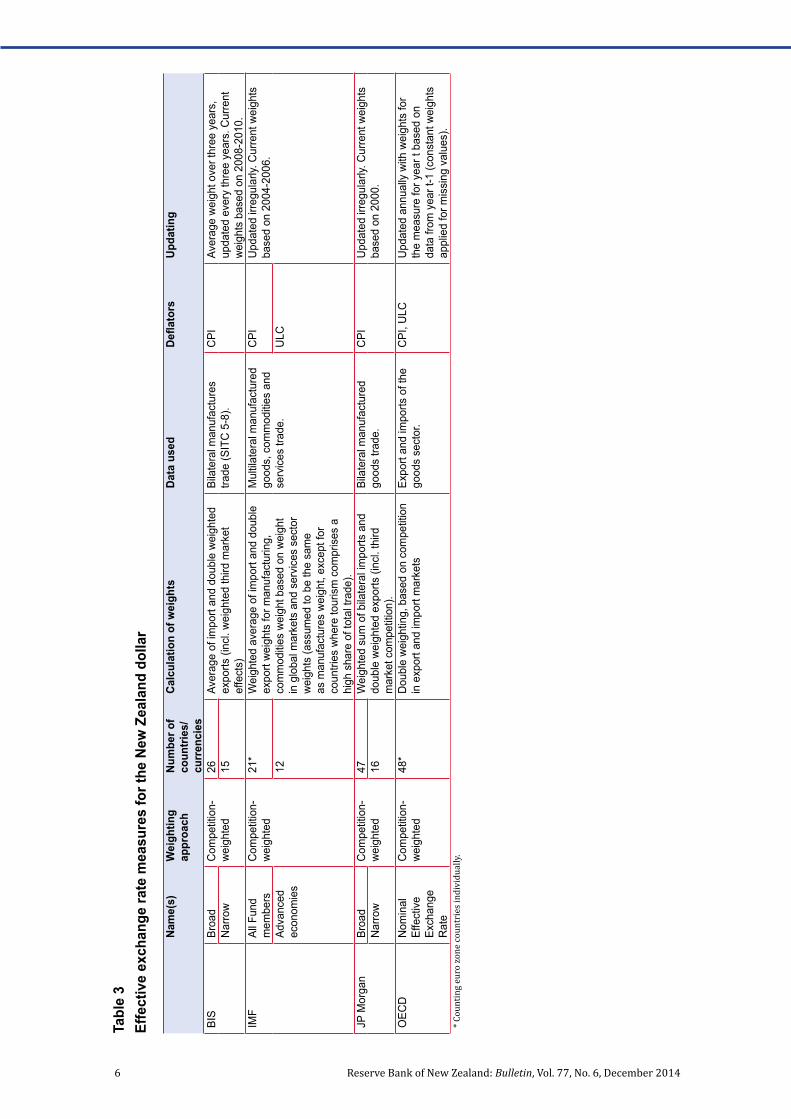
There is also a range of different index measures
for the New Zealand dollar, calculated by international
agencies (the IMF, the OECD, and the BIS) and by JP
Morgan. Table 3 summarises the approaches used by
each institution, while the Appendix provides some detail
on the weights used in each of these other indices.
The BIS measures are often cited since they are
consistently calculated, and updated in a timely way, for a
range of countries. In principle, the BIS measure should
not be a very good representation of New Zealand’s
effective exchange rate. The BIS indices for all countries
are calculated using weights drawn from international
trade in manufactured goods. Manufactures make up
a large share of most advanced country imports and
exports, but in New Zealand, for example, non-commodity
manufactures account for only around 15 percent of total
exports.
The IMF indices attempt to take a much
more sophisticated approach to the measurement of
competitiveness. For each country, they look separately
at trade in manufactures, in services, and in commodities.
However, the weights in these indices are updated only
around once a decade, and so in New Zealand’s case for
example, they do not capture the emergence of China
as one of our largest trading partners and as the largest
global importer of dairy products. In addition, in respect of
both services and commodities, there are real questions
over how well the IMF weighting scheme captures the
appropriate weights to reflect competitiveness for New
Zealand. For example, they capture international trade
in commodities but not the potential impact of domestic
production and consumption.4
One option was for the Reserve Bank to develop
such a sophisticated index specifically tailored to New
Zealand’s particular products and trade structures. Doing
so would have required the commitment of considerable
research resources with no certainty that the resulting
series would have provided materially better insights into
New Zealand’s external competitiveness or our ability to
assess the implications of changes in the exchange rate
for inflation pressures.
On balance, the Reserve Bank decided to return
to a TWI calculated using direct bilateral trade weights,
the approach which had been adopted before 1999. This
is also not a particularly common model internationally,
although it is the approach used by the Reserve Bank
of Australia, the central bank of another commodity-
exporting country. Using simple bilateral trade weights
for a much wider range of countries provides a readily
comprehensible and easily updatable basis for calculating
index weights. As will be discussed later, the key impact of
moving to this weighting structure has been to materially
reduce the weights on the currencies of the United States,
Japan, and the euro zone.
2.2 How many currencies to include in the index?Having settled on bilateral trade weights, the next
important decision is how to determine which currencies
to include in an exchange rate index. The five currencies
used in the previous official TWI measure accounted for
the overwhelming bulk of New Zealand’s trade. Following
the last review of the TWI in 2007 (Kite 2007), the Reserve
Bank also began to publish and monitor a broader TWI-14
(which added China, Singapore, Malaysia, South Korea,
Thailand, Indonesia, Taiwan, Canada, Hong Kong). Since
that review, the trade coverage of the countries/currencies
in the five-currency TWI measure has continued to decline
as New Zealand’s trade has continued to orient towards
Asia, particularly China.5 The countries represented by
4 The IMF gives the euro zone a very large weight as a market/ competitor for New Zealand’s commodities (e.g. the EU is the world’s largest dairy exporter), but the IMF approach does not up-weight the United States because although it is a large producer and consumer the US does only a limited amount of international trade in commodities relevant to New Zealand (see table A1 Appendix). Another example is that IMF’s New Zealand’s tourism weights put a very (and unduly) high weight on Australia, which takes a normalised weight of 100 percent in the IMF’s all fund series.
5Reserve Bank of New Zealand: Bulletin, Vol. 77, No. 6, December 2014
Tabl
e 2
Effe
ctiv
e ex
chan
ge ra
te m
easu
res
com
pile
d by
sel
ecte
d ce
ntra
l ban
ksC
entra
l ban
kN
ame(
s)W
eigh
ting
appr
oach
Num
ber o
f co
untri
es/
curre
ncie
s
Cal
cula
tion
of w
eigh
tsD
ata
used
Upd
atin
g
Aust
ralia
TWI
Trad
e-w
eigh
ted
21
Min
imum
trad
e co
vera
ge o
f 90
perc
ent.
Mer
chan
dise
pre
-201
1, m
erch
andi
se a
nd s
ervi
ces
post
20
11.
Cur
renc
y ba
sket
and
w
eigh
ts u
pdat
ed
annu
ally.
Can
ada
CER
I C
ompe
titio
n-w
eigh
ted
6La
rges
t tra
ding
par
tner
s (w
ith tr
ade
wei
ghts
> 2
pe
rcen
t in
1999
-200
1).
IMF
mul
tilat
eral
trad
e (n
on-e
nerg
y co
mm
oditi
es,
man
ufac
ture
d go
ods,
and
ser
vice
s), a
nd in
corp
orat
es
third
-mar
ket c
ompe
titio
n w
eigh
ts b
ased
on
1999
-200
1 tra
de d
ata.
Cur
renc
y ba
sket
and
w
eigh
t irre
gula
rly
upda
ted.
Chi
leTC
MTr
ade-
wei
ghte
d 21
*Tr
ade
wei
ghte
d w
ith 1
per
cent
trad
e sh
are
thre
shol
d.To
tal e
xpor
ts a
nd im
ports
(raw
cop
per a
nd o
il im
ports
ex
clud
ed).
Wei
ghts
upd
ated
an
nual
ly.
TCM
-55
Trad
e w
eigh
ted
top
5 tra
ding
par
tner
s.TC
M-X
4TC
M-4
exc
ludi
ng th
e U
S do
llar.
Euro
zon
eEE
R-2
0C
ompe
titio
n-w
eigh
ted
20W
eigh
ted
aver
age
of im
port
and
doub
le e
xpor
t w
eigh
ts (i
nclu
ding
wei
ghte
d th
ird m
arke
t effe
cts)
.M
anuf
actu
res
trade
. Wei
ghts
bas
ed o
n th
ree
year
av
erag
es.
Wei
ghts
upd
ated
ev
ery
thre
e ye
ars.
EE
R-4
0 40
New
Zea
land
TWI
Trad
e-w
eigh
ted
17Bi
late
ral t
rade
.Ba
sed
on b
ilate
ral g
oods
trad
e be
fore
200
9, a
nd g
oods
an
d se
rvic
es tr
ade
ther
eafte
r. W
eigh
ts u
pdat
ed
annu
ally.
TW
I-5 (5
0:50
) Tr
ade
and
GD
P-w
eigh
ted
550
per
cent
trad
e-w
eigh
ted,
50
perc
ent G
DP-
wei
ghte
d.Ba
sed
on m
erch
andi
se tr
ade
and
GD
P in
US
dolla
rs.
TWI-1
4 (5
0:50
) 14
Nor
way
TWI
Trad
e-w
eigh
ted
25*
Aver
age
of O
ECD
cur
rent
trad
e w
eigh
ts o
f 25
mai
n tra
ding
par
tner
s.TW
I bas
ed o
n O
ECD
wei
ghts
.TW
I wei
ghts
upd
ated
irr
egul
arly.
I-44
44*
Impo
rt w
eigh
ted.
Impo
rt w
eigh
ts.
Upd
ated
ann
ually
. Sw
eden
TCW
Com
petit
ion-
wei
ghte
d21
*Av
erag
e of
exp
orts
and
impo
rts, i
ncor
pora
ting
third
-cou
ntry
effe
cts.
Base
d on
man
ufac
ture
s tra
de a
nd w
eigh
ts fr
om IM
F.U
pdat
ed ir
regu
larly
.
KIX
32*
Aver
age
of to
tal m
anuf
actu
res
and
com
mod
ities
tra
de.
Base
d on
man
ufac
ture
s an
d co
mm
oditi
es tr
ade.
Upd
ated
ann
ually
.
Uni
ted
King
dom
Broa
d ER
I.
Com
petit
ion-
wei
ghte
d25
Impo
rt or
exp
ort s
hare
ove
r las
t 3 y
ears
> 0
.5
perc
ent.
Man
ufac
ture
d go
ods
and
serv
ices
trad
e, w
ith e
xpor
ts
wei
ghts
inco
rpor
atin
g th
ird m
arke
t com
petit
ion.
Loc
atio
n of
com
petit
ion
wei
ghts
are
bas
ed o
n IM
F fig
ures
and
hel
d co
nsta
nt, c
ount
ry w
eigh
ts v
ary
base
d on
bila
tera
l tra
de
shar
es.
Wei
ghts
and
cu
rrenc
y co
vera
ge
upda
ted
annu
ally.
N
arro
w E
RI.
19Im
port
or e
xpor
t sha
re o
ver l
ast 3
yea
rs >
1
perc
ent.
Uni
ted
Stat
es
Maj
or
curre
ncie
s in
dex
Com
petit
ion-
wei
ghte
d7
Equa
l wei
ghts
on
impo
rts a
nd d
oubl
e w
eigh
ted
expo
rts (i
ncor
pora
ting
third
mar
ket c
ompe
titio
n).
Goo
ds tr
ade
(exp
orts
exc
lude
gol
d an
d m
ilitar
y ite
ms,
oil
excl
uded
from
impo
rts).
Wei
ghts
upd
ated
an
nual
ly.
Broa
d26
Sam
e as
MC
I, bu
t bas
ed o
n cu
rrenc
ies
whe
re
bila
tera
l sha
res
of im
ports
or e
xpor
ts >
0.5
pe
rcen
t in
1997
.* C
ount
ing
euro
zon
e co
untr
ies i
ndiv
idua
lly.
6 Reserve Bank of New Zealand: Bulletin, Vol. 77, No. 6, December 2014
Tabl
e 3
Effe
ctiv
e ex
chan
ge ra
te m
easu
res
for t
he N
ew Z
eala
nd d
olla
r
Nam
e(s)
Wei
ghtin
g ap
proa
chNu
mbe
r of
coun
tries
/cu
rren
cies
Calc
ulat
ion
of w
eigh
tsDa
ta u
sed
Deflators
Upda
ting
BIS
Broa
dC
ompe
titio
n-w
eigh
ted
26Av
erag
e of
impo
rt an
d do
uble
wei
ghte
d ex
ports
(inc
l. w
eigh
ted
third
mar
ket
effe
cts)
Bila
tera
l man
ufac
ture
s tra
de (S
ITC
5-8
). C
PIAv
erag
e w
eigh
t ove
r thr
ee y
ears
, up
date
d ev
ery
thre
e ye
ars.
Cur
rent
w
eigh
ts b
ased
on
2008
-201
0.N
arro
w15
IMF
All F
und
mem
bers
Com
petit
ion-
wei
ghte
d 21
*W
eigh
ted
aver
age
of im
port
and
doub
le
expo
rt w
eigh
ts fo
r man
ufac
turin
g,
com
mod
ities
wei
ght b
ased
on
wei
ght
in g
loba
l mar
kets
and
ser
vice
s se
ctor
w
eigh
ts (a
ssum
ed to
be
the
sam
e as
man
ufac
ture
s w
eigh
t, ex
cept
for
coun
tries
whe
re to
uris
m c
ompr
ises
a
high
sha
re o
f tot
al tr
ade)
.
Mul
tilat
eral
man
ufac
ture
d go
ods,
com
mod
ities
and
se
rvic
es tr
ade.
CPI
Upd
ated
irre
gula
rly. C
urre
nt w
eigh
ts
base
d on
200
4-20
06.
Adva
nced
ec
onom
ies
12U
LC
JP M
orga
nBr
oad
Com
petit
ion-
wei
ghte
d 47
Wei
ghte
d su
m o
f bila
tera
l im
ports
and
do
uble
wei
ghte
d ex
ports
(inc
l. th
ird
mar
ket c
ompe
titio
n).
Bila
tera
l man
ufac
ture
d go
ods
trade
.C
PIU
pdat
ed ir
regu
larly
. Cur
rent
wei
ghts
ba
sed
on 2
000.
Nar
row
16
OEC
DN
omin
al
Effe
ctiv
e Ex
chan
ge
Rat
e
Com
petit
ion-
wei
ghte
d 48
*D
oubl
e w
eigh
ting,
bas
ed o
n co
mpe
titio
n in
exp
ort a
nd im
port
mar
kets
Expo
rt an
d im
ports
of t
he
good
s se
ctor
. C
PI, U
LCU
pdat
ed a
nnua
lly w
ith w
eigh
ts fo
r th
e m
easu
re fo
r yea
r t b
ased
on
data
from
yea
r t-1
(con
stan
t wei
ghts
ap
plie
d fo
r mis
sing
val
ues)
.* C
ount
ing
euro
zon
e co
untr
ies i
ndiv
idua
lly.
7Reserve Bank of New Zealand: Bulletin, Vol. 77, No. 6, December 2014
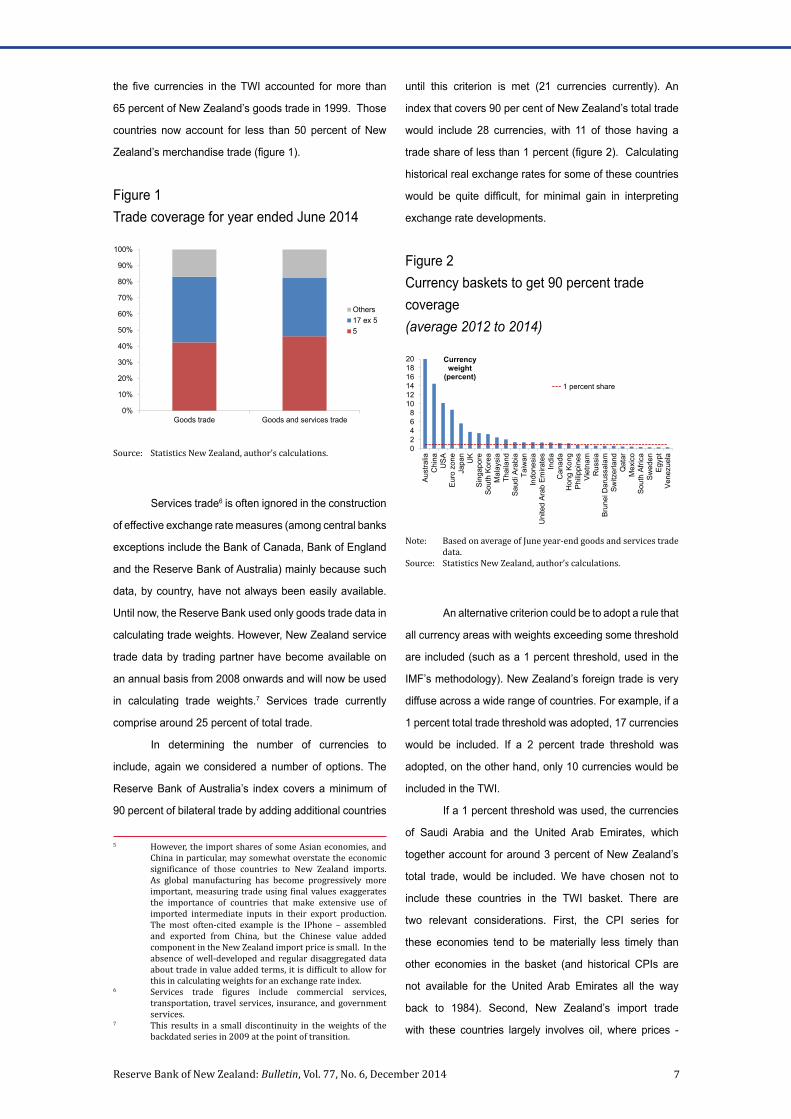
the five currencies in the TWI accounted for more than
65 percent of New Zealand’s goods trade in 1999. Those
countries now account for less than 50 percent of New
Zealand’s merchandise trade (figure 1).
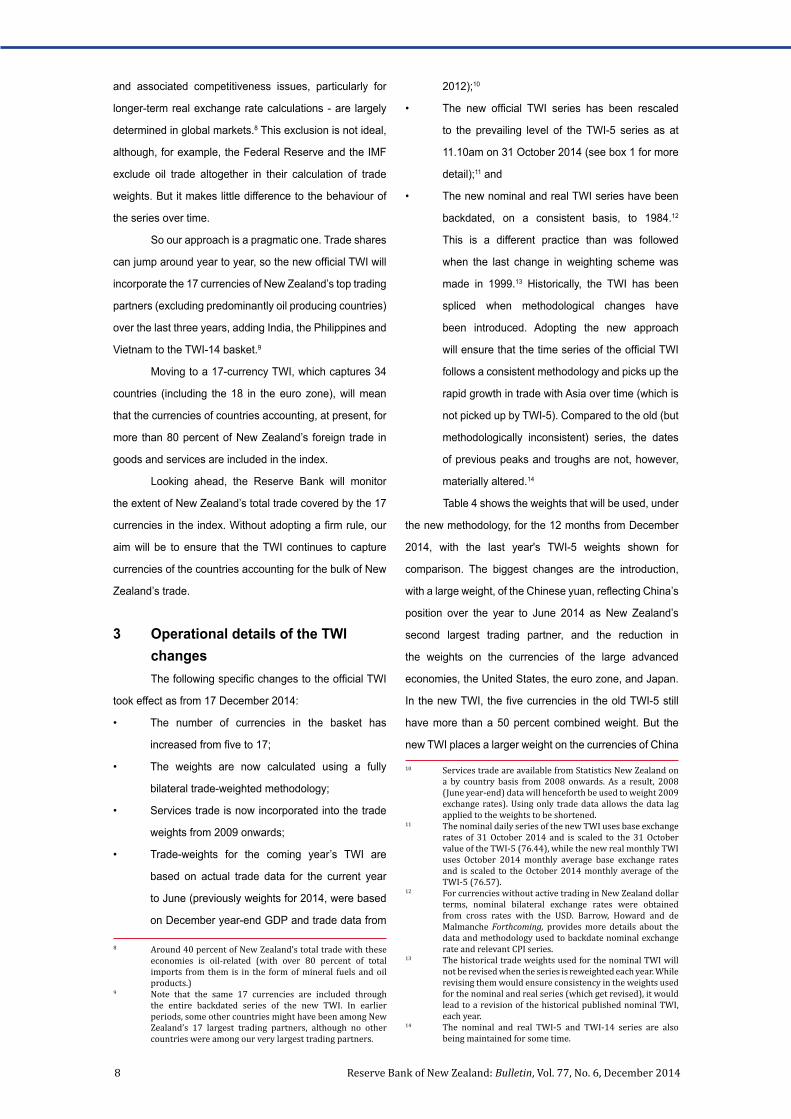
until this criterion is met (21 currencies currently). An
index that covers 90 per cent of New Zealand’s total trade
would include 28 currencies, with 11 of those having a
trade share of less than 1 percent (figure 2). Calculating
historical real exchange rates for some of these countries
would be quite difficult, for minimal gain in interpreting
exchange rate developments.
Source: Statistics New Zealand, author’s calculations.
Figure 1Trade coverage for year ended June 2014
0%
10%
20%
30%
40%
50%
60%
70%
80%
90%
100%
Goods trade Goods and services trade
Others17 ex 55
Services trade6 is often ignored in the construction
of effective exchange rate measures (among central banks
exceptions include the Bank of Canada, Bank of England
and the Reserve Bank of Australia) mainly because such
data, by country, have not always been easily available.
Until now, the Reserve Bank used only goods trade data in
calculating trade weights. However, New Zealand service
trade data by trading partner have become available on
an annual basis from 2008 onwards and will now be used
in calculating trade weights.7 Services trade currently
comprise around 25 percent of total trade.
In determining the number of currencies to
include, again we considered a number of options. The
Reserve Bank of Australia’s index covers a minimum of
90 percent of bilateral trade by adding additional countries
5 However, the import shares of some Asian economies, and China in particular, may somewhat overstate the economic significance of those countries to New Zealand imports. As global manufacturing has become progressively more important, measuring trade using final values exaggerates the importance of countries that make extensive use of imported intermediate inputs in their export production. The most often-cited example is the IPhone – assembled and exported from China, but the Chinese value added component in the New Zealand import price is small. In the absence of well-developed and regular disaggregated data about trade in value added terms, it is difficult to allow for this in calculating weights for an exchange rate index.
6 Services trade figures include commercial services, transportation, travel services, insurance, and government services.
7 This results in a small discontinuity in the weights of the backdated series in 2009 at the point of transition.
Note: Based on average of June year-end goods and services trade data.
Source: Statistics New Zealand, author’s calculations.
Figure 2Currency baskets to get 90 percent trade coverage (average 2012 to 2014)
02468
101214161820
Aus
tralia
Chi
naU
SA
Eur
o zo
neJa
pan
UK
Sin
gapo
reS
outh
Kor
eaM
alay
sia
Thai
land
Sau
di A
rabi
aTa
iwan
Indo
nesi
aU
nite
d Ar
ab E
mira
tes
Indi
aC
anad
aH
ong
Kon
gP
hilip
pine
sV
ietn
amR
ussi
aB
rune
i Dar
ussa
lam
Sw
itzer
land
Qat
arM
exic
oS
outh
Afri
caS
wed
enE
gypt
Vene
zuel
a
Currency weight
(percent) 1 percent share
An alternative criterion could be to adopt a rule that
all currency areas with weights exceeding some threshold
are included (such as a 1 percent threshold, used in the
IMF’s methodology). New Zealand’s foreign trade is very
diffuse across a wide range of countries. For example, if a
1 percent total trade threshold was adopted, 17 currencies
would be included. If a 2 percent trade threshold was
adopted, on the other hand, only 10 currencies would be
included in the TWI.
If a 1 percent threshold was used, the currencies
of Saudi Arabia and the United Arab Emirates, which
together account for around 3 percent of New Zealand’s
total trade, would be included. We have chosen not to
include these countries in the TWI basket. There are
two relevant considerations. First, the CPI series for
these economies tend to be materially less timely than
other economies in the basket (and historical CPIs are
not available for the United Arab Emirates all the way
back to 1984). Second, New Zealand’s import trade
with these countries largely involves oil, where prices -
8 Reserve Bank of New Zealand: Bulletin, Vol. 77, No. 6, December 2014
and associated competitiveness issues, particularly for
longer-term real exchange rate calculations - are largely
determined in global markets.8 This exclusion is not ideal,
although, for example, the Federal Reserve and the IMF
exclude oil trade altogether in their calculation of trade
weights. But it makes little difference to the behaviour of
the series over time.
So our approach is a pragmatic one. Trade shares
can jump around year to year, so the new official TWI will
incorporate the 17 currencies of New Zealand’s top trading
partners (excluding predominantly oil producing countries)
over the last three years, adding India, the Philippines and
Vietnam to the TWI-14 basket.9
Moving to a 17-currency TWI, which captures 34
countries (including the 18 in the euro zone), will mean
that the currencies of countries accounting, at present, for
more than 80 percent of New Zealand’s foreign trade in
goods and services are included in the index.
Looking ahead, the Reserve Bank will monitor
the extent of New Zealand’s total trade covered by the 17
currencies in the index. Without adopting a firm rule, our
aim will be to ensure that the TWI continues to capture
currencies of the countries accounting for the bulk of New
Zealand’s trade.
3 Operational details of the TWI changesThe following specific changes to the official TWI
took effect as from 17 December 2014:
• The number of currencies in the basket has
increased from five to 17;
• The weights are now calculated using a fully
bilateral trade-weighted methodology;
• Services trade is now incorporated into the trade
weights from 2009 onwards;
• Trade-weights for the coming year’s TWI are
based on actual trade data for the current year
to June (previously weights for 2014, were based
on December year-end GDP and trade data from
2012);10
• The new official TWI series has been rescaled
to the prevailing level of the TWI-5 series as at
11.10am on 31 October 2014 (see box 1 for more
detail);11 and
• The new nominal and real TWI series have been
backdated, on a consistent basis, to 1984.12
This is a different practice than was followed
when the last change in weighting scheme was
made in 1999.13 Historically, the TWI has been
spliced when methodological changes have
been introduced. Adopting the new approach
will ensure that the time series of the official TWI
follows a consistent methodology and picks up the
rapid growth in trade with Asia over time (which is
not picked up by TWI-5). Compared to the old (but
methodologically inconsistent) series, the dates
of previous peaks and troughs are not, however,
materially altered.14
Table 4 shows the weights that will be used, under
the new methodology, for the 12 months from December
2014, with the last year's TWI-5 weights shown for
comparison. The biggest changes are the introduction,
with a large weight, of the Chinese yuan, reflecting China’s
position over the year to June 2014 as New Zealand’s
second largest trading partner, and the reduction in
the weights on the currencies of the large advanced
economies, the United States, the euro zone, and Japan.
In the new TWI, the five currencies in the old TWI-5 still
have more than a 50 percent combined weight. But the
new TWI places a larger weight on the currencies of China
10 Services trade are available from Statistics New Zealand on a by country basis from 2008 onwards. As a result, 2008 (June year-end) data will henceforth be used to weight 2009 exchange rates). Using only trade data allows the data lag applied to the weights to be shortened.
11 The nominal daily series of the new TWI uses base exchange rates of 31 October 2014 and is scaled to the 31 October value of the TWI-5 (76.44), while the new real monthly TWI uses October 2014 monthly average base exchange rates and is scaled to the October 2014 monthly average of the TWI-5 (76.57).
12 For currencies without active trading in New Zealand dollar terms, nominal bilateral exchange rates were obtained from cross rates with the USD. Barrow, Howard and de Malmanche Forthcoming, provides more details about the data and methodology used to backdate nominal exchange rate and relevant CPI series.
13 The historical trade weights used for the nominal TWI will not be revised when the series is reweighted each year. While revising them would ensure consistency in the weights used for the nominal and real series (which get revised), it would lead to a revision of the historical published nominal TWI, each year.
14 The nominal and real TWI-5 and TWI-14 series are also being maintained for some time.
8 Around 40 percent of New Zealand’s total trade with these economies is oil-related (with over 80 percent of total imports from them is in the form of mineral fuels and oil products.)
9 Note that the same 17 currencies are included through the entire backdated series of the new TWI. In earlier periods, some other countries might have been among New Zealand’s 17 largest trading partners, although no other countries were among our very largest trading partners.
9Reserve Bank of New Zealand: Bulletin, Vol. 77, No. 6, December 2014
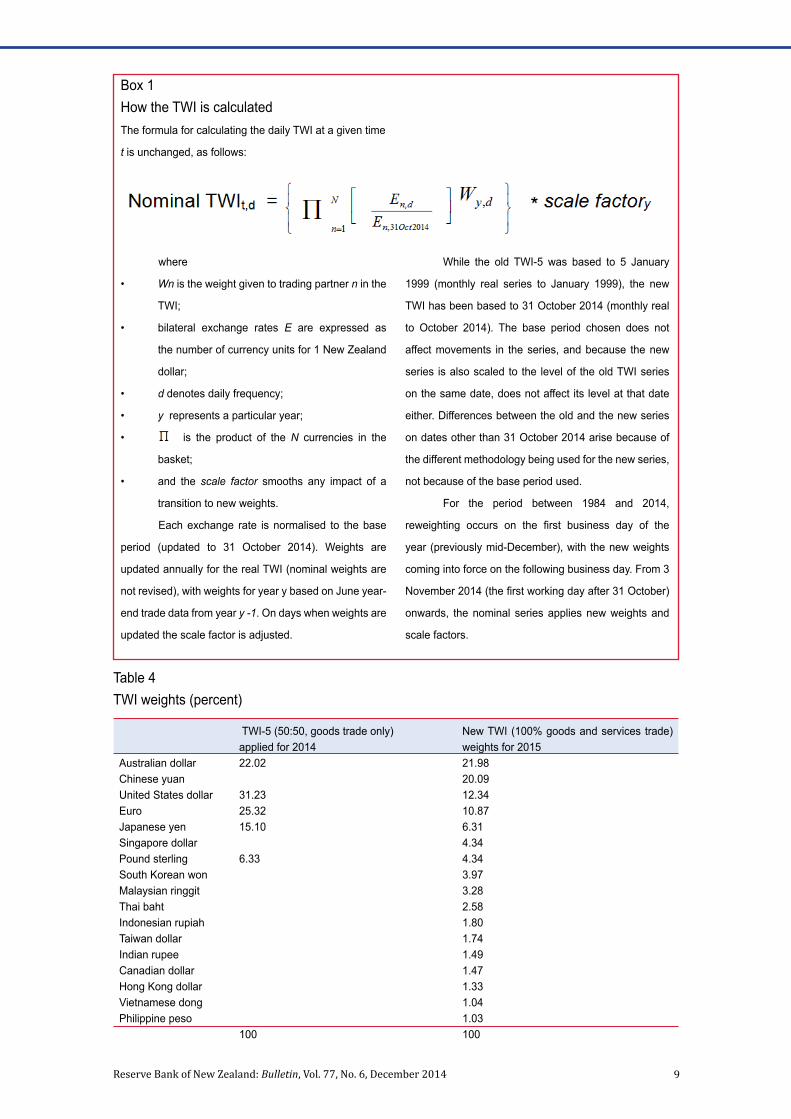
Box 1How the TWI is calculatedThe formula for calculating the daily TWI at a given time
t is unchanged, as follows:
Table 4TWI weights (percent)
While the old TWI-5 was based to 5 January
1999 (monthly real series to January 1999), the new
TWI has been based to 31 October 2014 (monthly real
to October 2014). The base period chosen does not
affect movements in the series, and because the new
series is also scaled to the level of the old TWI series
on the same date, does not affect its level at that date
either. Differences between the old and the new series
on dates other than 31 October 2014 arise because of
the different methodology being used for the new series,
not because of the base period used.
For the period between 1984 and 2014,
reweighting occurs on the first business day of the
year (previously mid-December), with the new weights
coming into force on the following business day. From 3
November 2014 (the first working day after 31 October)
onwards, the nominal series applies new weights and
scale factors.
TWI-5 (50:50, goods trade only)applied for 2014
New TWI (100% goods and services trade) weights for 2015
Australian dollar 22.02 21.98Chinese yuan 20.09United States dollar 31.23 12.34Euro 25.32 10.87Japanese yen 15.10 6.31Singapore dollar 4.34Pound sterling 6.33 4.34South Korean won 3.97Malaysian ringgit 3.28Thai baht 2.58Indonesian rupiah 1.80Taiwan dollar 1.74Indian rupee 1.49Canadian dollar 1.47Hong Kong dollar 1.33Vietnamese dong 1.04Philippine peso 1.03
100 100
where
• Wn is the weight given to trading partner n in the
TWI;
• bilateral exchange rates E are expressed as
the number of currency units for 1 New Zealand
dollar;
• d denotes daily frequency;
• y represents a particular year;
• is the product of the N currencies in the
basket;
• and the scale factor smooths any impact of a
transition to new weights.
Each exchange rate is normalised to the base
period (updated to 31 October 2014). Weights are
updated annually for the real TWI (nominal weights are
not revised), with weights for year y based on June year-
end trade data from year y -1. On days when weights are
updated the scale factor is adjusted.
10 Reserve Bank of New Zealand: Bulletin, Vol. 77, No. 6, December 2014
and Australia (with a combined weight of more than 40
percent) with much reduced weights on the currencies of
the United States, the euro zone and Japan (down from
more than 70 percent combined to around 30 percent).
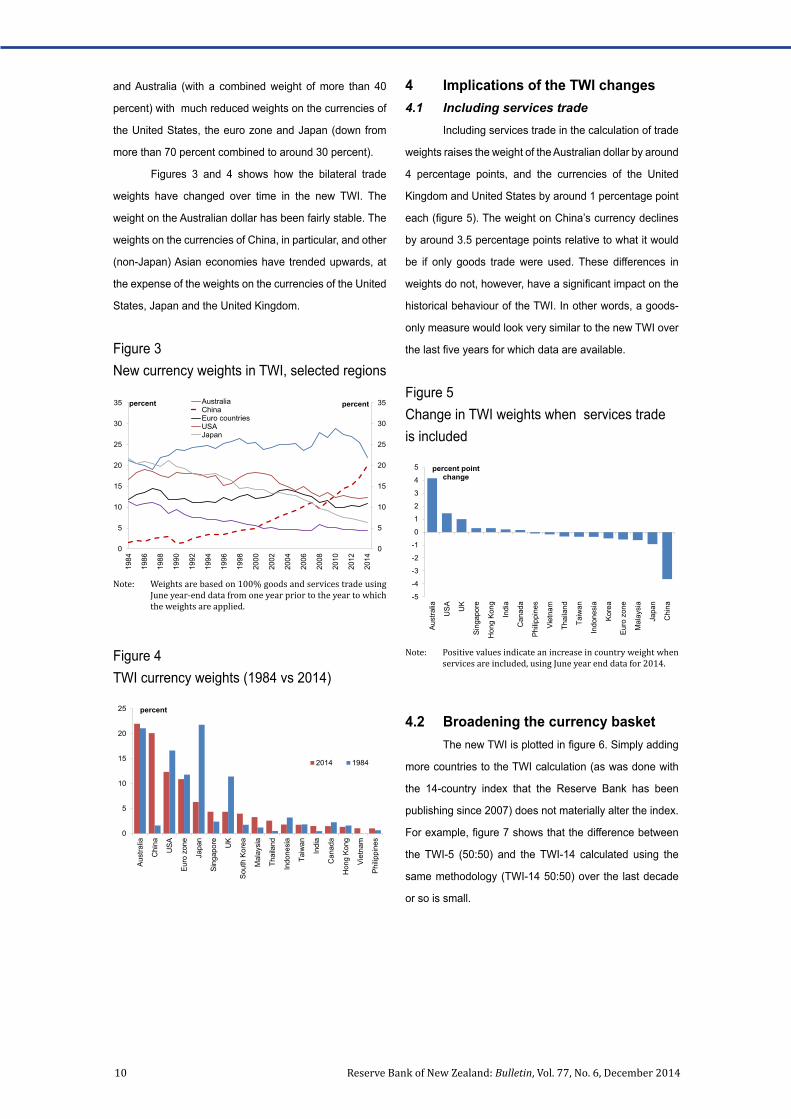
Figures 3 and 4 shows how the bilateral trade
weights have changed over time in the new TWI. The
weight on the Australian dollar has been fairly stable. The
weights on the currencies of China, in particular, and other
(non-Japan) Asian economies have trended upwards, at
the expense of the weights on the currencies of the United
States, Japan and the United Kingdom.
4 Implications of the TWI changes4.1 Including services trade
Including services trade in the calculation of trade
weights raises the weight of the Australian dollar by around
4 percentage points, and the currencies of the United
Kingdom and United States by around 1 percentage point
each (figure 5). The weight on China’s currency declines
by around 3.5 percentage points relative to what it would
be if only goods trade were used. These differences in
weights do not, however, have a significant impact on the
historical behaviour of the TWI. In other words, a goods-
only measure would look very similar to the new TWI over
the last five years for which data are available. Figure 3New currency weights in TWI, selected regions
Note: Weights are based on 100% goods and services trade using June year-end data from one year prior to the year to which the weights are applied.
Figure 4TWI currency weights (1984 vs 2014)
0
5
10
15
20
25
30
35
0
5
10
15
20
25
30
35
1984
1986
1988
1990
1992
1994
1996
1998
2000
2002
2004
2006
2008
2010
2012
2014
percent percent AustraliaChinaEuro countriesUSAJapan
0
5
10
15
20
25
Aust
ralia
Chi
na
USA
Euro
zon
e
Japa
n
Sing
apor
e
UK
Sout
h Ko
rea
Mal
aysi
a
Thai
land
Indo
nesi
a
Taiw
an
Indi
a
Can
ada
Hon
g Ko
ng
Viet
nam
Philip
pine
s
percent
2014 1984
Figure 5Change in TWI weights when services trade is included
Note: Positive values indicate an increase in country weight when services are included, using June year end data for 2014.
-5
-4
-3
-2
-1
0
1
2
3
4
5
Aust
ralia
USA U
K
Sing
apor
e
Hon
g Ko
ng
Indi
a
Can
ada
Philip
pine
s
Viet
nam
Thai
land
Taiw
an
Indo
nesi
a
Kore
a
Euro
zon
e
Mal
aysi
a
Japa
n
Chi
na
percent point change
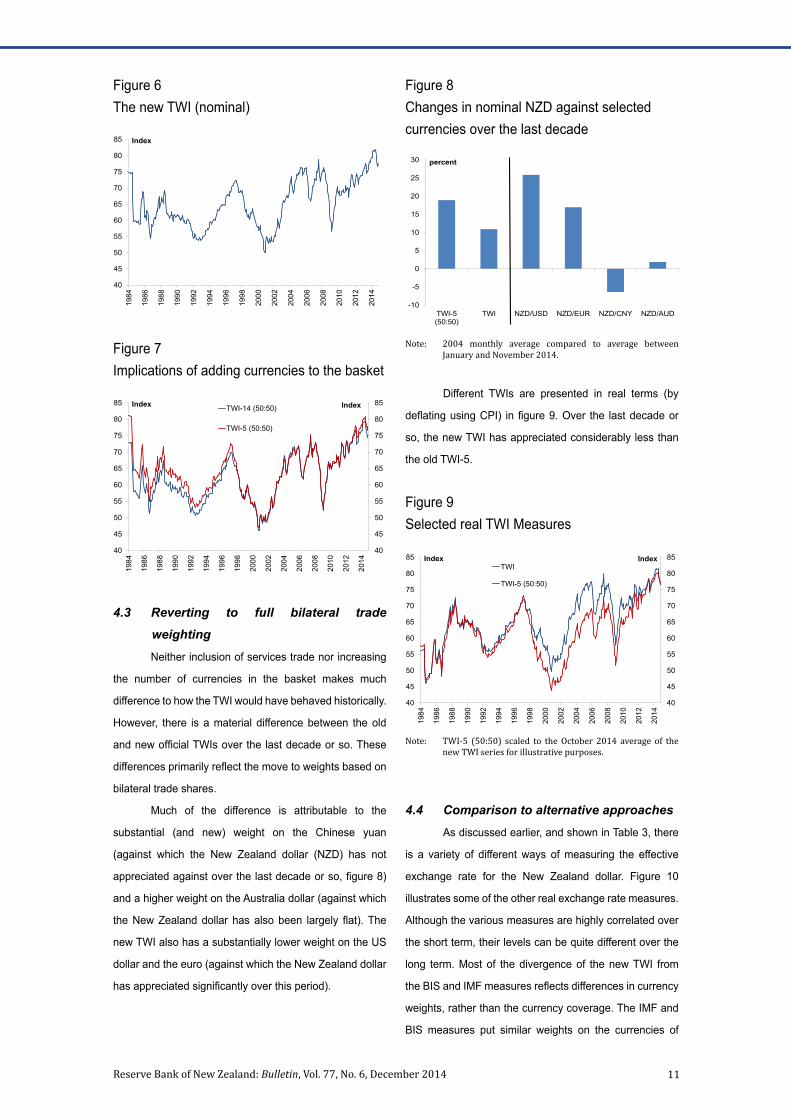
4.2 Broadening the currency basketThe new TWI is plotted in figure 6. Simply adding
more countries to the TWI calculation (as was done with
the 14-country index that the Reserve Bank has been
publishing since 2007) does not materially alter the index.
For example, figure 7 shows that the difference between
the TWI-5 (50:50) and the TWI-14 calculated using the
same methodology (TWI-14 50:50) over the last decade
or so is small.
11Reserve Bank of New Zealand: Bulletin, Vol. 77, No. 6, December 2014
4.3 Reverting to full bilateral trade weightingNeither inclusion of services trade nor increasing
the number of currencies in the basket makes much
difference to how the TWI would have behaved historically.
However, there is a material difference between the old
and new official TWIs over the last decade or so. These
differences primarily reflect the move to weights based on
bilateral trade shares.
Much of the difference is attributable to the
substantial (and new) weight on the Chinese yuan
(against which the New Zealand dollar (NZD) has not
appreciated against over the last decade or so, figure 8)
and a higher weight on the Australia dollar (against which
the New Zealand dollar has also been largely flat). The
new TWI also has a substantially lower weight on the US
dollar and the euro (against which the New Zealand dollar
has appreciated significantly over this period).
Different TWIs are presented in real terms (by
deflating using CPI) in figure 9. Over the last decade or
so, the new TWI has appreciated considerably less than
the old TWI-5.
Figure 6The new TWI (nominal)
Figure 7Implications of adding currencies to the basket
40
45
50
55
60
65
70
75
80
8519
84
1986
1988
1990
1992
1994
1996
1998
2000
2002
2004
2006
2008
2010
2012
2014
Index
40
45
50
55
60
65
70
75
80
85
40
45
50
55
60
65
70
75
80
85
1984
1986
1988
1990
1992
1994
1996
1998
2000
2002
2004
2006
2008
2010
2012
2014
Index Index TWI-14 (50:50)
TWI-5 (50:50)
Figure 8Changes in nominal NZD against selected currencies over the last decade
Note: 2004 monthly average compared to average between January and November 2014.
-10
-5
0
5
10
15
20
25
30
TWI-5(50:50)
TWI NZD/USD NZD/EUR NZD/CNY NZD/AUD
percent
Figure 9Selected real TWI Measures
Note: TWI-5 (50:50) scaled to the October 2014 average of the new TWI series for illustrative purposes.
40
45
50
55
60
65
70
75
80
85
40
45
50
55
60
65
70
75
80
85
1984
1986
1988
1990
1992
1994
1996
1998
2000
2002
2004
2006
2008
2010
2012
2014
Index Index TWI
TWI-5 (50:50)
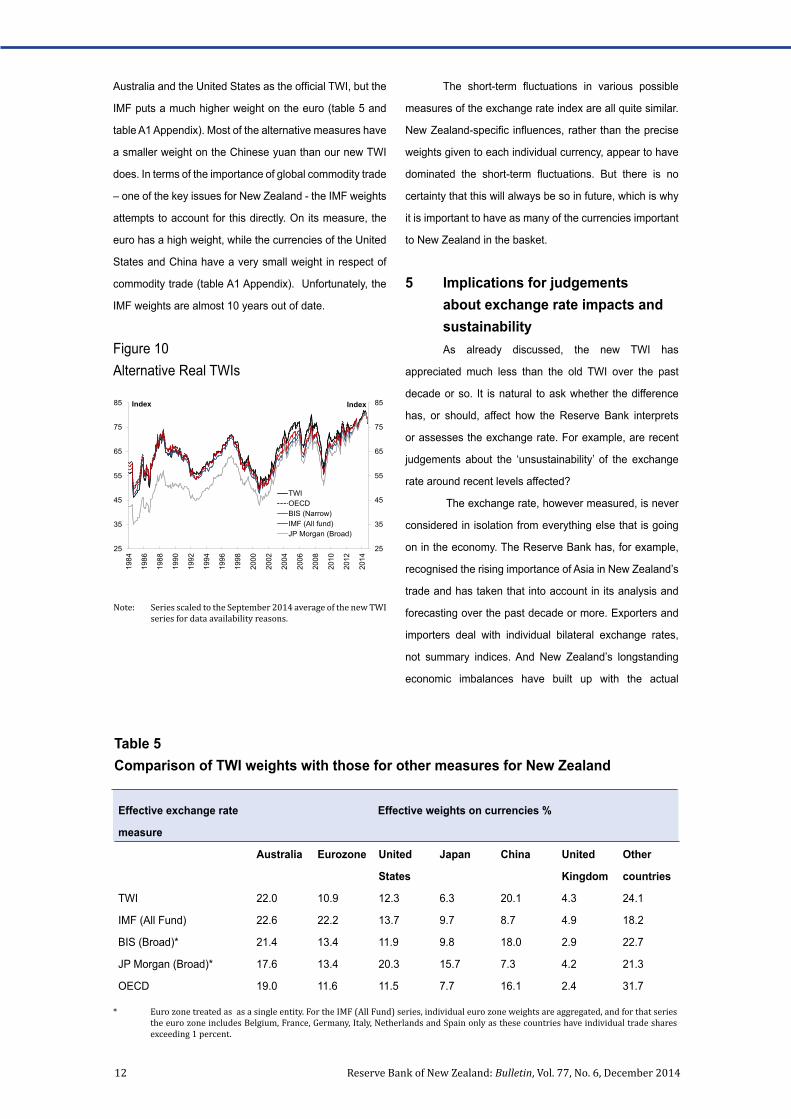
4.4 Comparison to alternative approachesAs discussed earlier, and shown in Table 3, there
is a variety of different ways of measuring the effective
exchange rate for the New Zealand dollar. Figure 10
illustrates some of the other real exchange rate measures.
Although the various measures are highly correlated over
the short term, their levels can be quite different over the
long term. Most of the divergence of the new TWI from
the BIS and IMF measures reflects differences in currency
weights, rather than the currency coverage. The IMF and
BIS measures put similar weights on the currencies of
12 Reserve Bank of New Zealand: Bulletin, Vol. 77, No. 6, December 2014
Australia and the United States as the official TWI, but the
IMF puts a much higher weight on the euro (table 5 and
table A1 Appendix). Most of the alternative measures have
a smaller weight on the Chinese yuan than our new TWI
does. In terms of the importance of global commodity trade
– one of the key issues for New Zealand - the IMF weights
attempts to account for this directly. On its measure, the
euro has a high weight, while the currencies of the United
States and China have a very small weight in respect of
commodity trade (table A1 Appendix). Unfortunately, the
IMF weights are almost 10 years out of date.
The short-term fluctuations in various possible
measures of the exchange rate index are all quite similar.
New Zealand-specific influences, rather than the precise
weights given to each individual currency, appear to have
dominated the short-term fluctuations. But there is no
certainty that this will always be so in future, which is why
it is important to have as many of the currencies important
to New Zealand in the basket.
5 Implications for judgements about exchange rate impacts and sustainability As already discussed, the new TWI has
appreciated much less than the old TWI over the past
decade or so. It is natural to ask whether the difference
has, or should, affect how the Reserve Bank interprets
or assesses the exchange rate. For example, are recent
judgements about the ‘unsustainability’ of the exchange
rate around recent levels affected?
The exchange rate, however measured, is never
considered in isolation from everything else that is going
on in the economy. The Reserve Bank has, for example,
recognised the rising importance of Asia in New Zealand’s
trade and has taken that into account in its analysis and
forecasting over the past decade or more. Exporters and
importers deal with individual bilateral exchange rates,
not summary indices. And New Zealand’s longstanding
economic imbalances have built up with the actual
Figure 10Alternative Real TWIs
Note: Series scaled to the September 2014 average of the new TWI series for data availability reasons.
Table 5Comparison of TWI weights with those for other measures for New Zealand
25
35
45
55
65
75
85
25
35
45
55
65
75
85
1984
1986
1988
1990
1992
1994
1996
1998
2000
2002
2004
2006
2008
2010
2012
2014
Index Index
TWIOECDBIS (Narrow)IMF (All fund)JP Morgan (Broad)
Effective exchange rate
measure
Effective weights on currencies %
Australia Eurozone United
States
Japan China United
Kingdom
Other
countries
TWI 22.0 10.9 12.3 6.3 20.1 4.3 24.1
IMF (All Fund) 22.6 22.2 13.7 9.7 8.7 4.9 18.2
BIS (Broad)* 21.4 13.4 11.9 9.8 18.0 2.9 22.7
JP Morgan (Broad)* 17.6 13.4 20.3 15.7 7.3 4.2 21.3
OECD 19.0 11.6 11.5 7.7 16.1 2.4 31.7
* Euro zone treated as as a single entity. For the IMF (All Fund) series, individual euro zone weights are aggregated, and for that series the euro zone includes Belgium, France, Germany, Italy, Netherlands and Spain only as these countries have individual trade shares exceeding 1 percent.
13Reserve Bank of New Zealand: Bulletin, Vol. 77, No. 6, December 2014
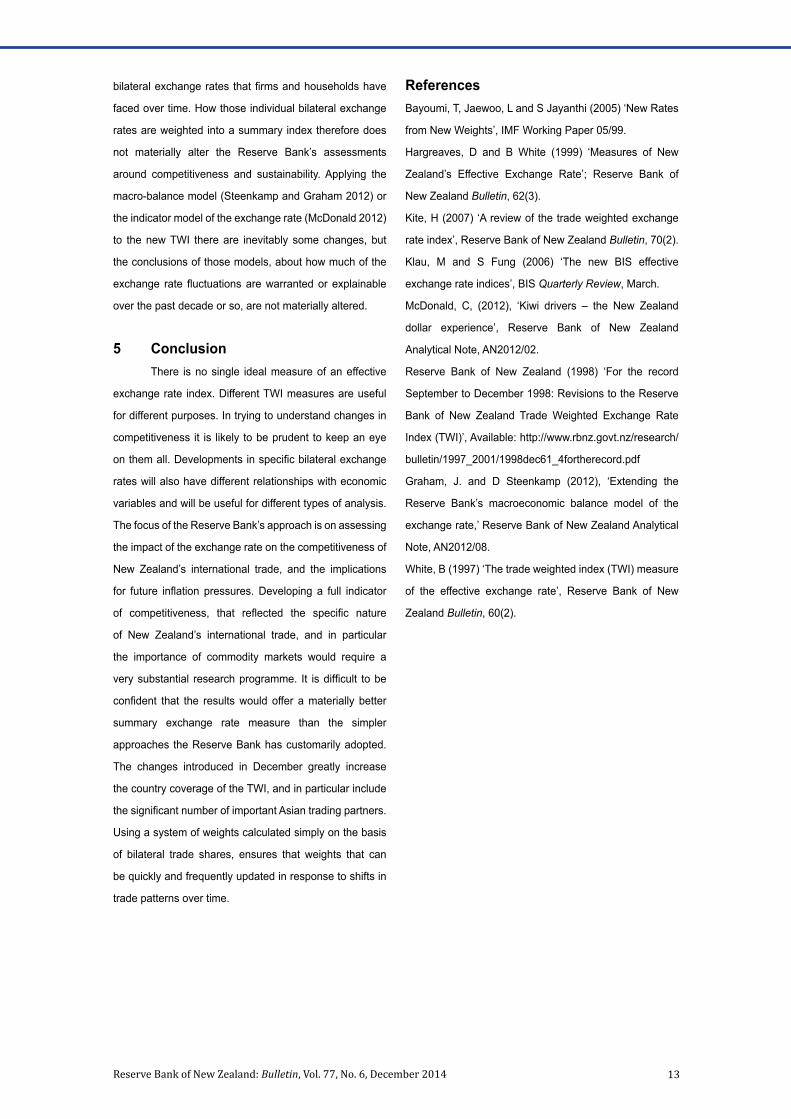
bilateral exchange rates that firms and households have
faced over time. How those individual bilateral exchange
rates are weighted into a summary index therefore does
not materially alter the Reserve Bank’s assessments
around competitiveness and sustainability. Applying the
macro-balance model (Steenkamp and Graham 2012) or
the indicator model of the exchange rate (McDonald 2012)
to the new TWI there are inevitably some changes, but
the conclusions of those models, about how much of the
exchange rate fluctuations are warranted or explainable
over the past decade or so, are not materially altered.
5 ConclusionThere is no single ideal measure of an effective
exchange rate index. Different TWI measures are useful
for different purposes. In trying to understand changes in
competitiveness it is likely to be prudent to keep an eye
on them all. Developments in specific bilateral exchange
rates will also have different relationships with economic
variables and will be useful for different types of analysis.
The focus of the Reserve Bank’s approach is on assessing
the impact of the exchange rate on the competitiveness of
New Zealand’s international trade, and the implications
for future inflation pressures. Developing a full indicator
of competitiveness, that reflected the specific nature
of New Zealand’s international trade, and in particular
the importance of commodity markets would require a
very substantial research programme. It is difficult to be
confident that the results would offer a materially better
summary exchange rate measure than the simpler
approaches the Reserve Bank has customarily adopted.
The changes introduced in December greatly increase
the country coverage of the TWI, and in particular include
the significant number of important Asian trading partners.
Using a system of weights calculated simply on the basis
of bilateral trade shares, ensures that weights that can
be quickly and frequently updated in response to shifts in
trade patterns over time.
ReferencesBayoumi, T, Jaewoo, L and S Jayanthi (2005) ‘New Rates
from New Weights’, IMF Working Paper 05/99.
Hargreaves, D and B White (1999) ‘Measures of New
Zealand’s Effective Exchange Rate’; Reserve Bank of
New Zealand Bulletin, 62(3).
Kite, H (2007) ‘A review of the trade weighted exchange
rate index’, Reserve Bank of New Zealand Bulletin, 70(2).
Klau, M and S Fung (2006) ‘The new BIS effective
exchange rate indices’, BIS Quarterly Review, March.
McDonald, C, (2012), ‘Kiwi drivers – the New Zealand
dollar experience’, Reserve Bank of New Zealand
Analytical Note, AN2012/02.
Reserve Bank of New Zealand (1998) ‘For the record
September to December 1998: Revisions to the Reserve
Bank of New Zealand Trade Weighted Exchange Rate
Index (TWI)’, Available: http://www.rbnz.govt.nz/research/
bulletin/1997_2001/1998dec61_4fortherecord.pdf
Graham, J. and D Steenkamp (2012), ‘Extending the
Reserve Bank’s macroeconomic balance model of the
exchange rate,’ Reserve Bank of New Zealand Analytical
Note, AN2012/08.
White, B (1997) ‘The trade weighted index (TWI) measure
of the effective exchange rate’, Reserve Bank of New
Zealand Bulletin, 60(2).
14 Reserve Bank of New Zealand: Bulletin, Vol. 77, No. 6, December 2014
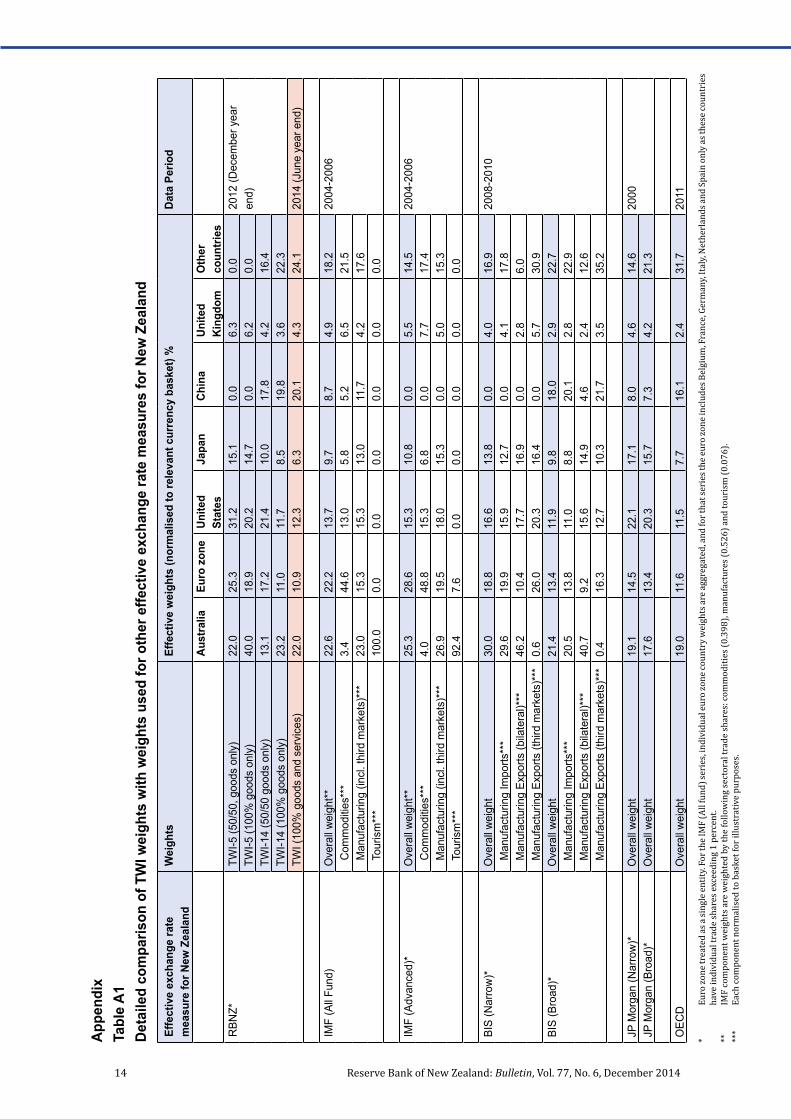
Appe
ndix
Tabl
e A1
Deta
iled
com
paris
on o
f TW
I wei
ghts
with
wei
ghts
use
d fo
r oth
er e
ffect
ive
exch
ange
rate
mea
sure
s fo
r New
Zea
land
Effe
ctiv
e ex
chan
ge ra
tem
easu
re fo
r New
Zea
land
W
eigh
tsEf
fect
ive
wei
ghts
(nor
mal
ised
to re
leva
nt c
urre
ncy
bask
et) %
Data
Per
iod
Aust
ralia
Euro
zon
eUn
ited
Stat
esJa
pan
Chin
aUn
ited
King
dom
Oth
er
coun
tries
RBN
Z*TW
I-5 (5
0/50
, goo
ds o
nly)
22.0
25.3
31.2
15.1
0.0
6.3
0.0
2012
(Dec
embe
r yea
r en
d)TW
I-5 (1
00%
goo
ds o
nly)
40.0
18.9
20.2
14.7
0.0
6.2
0.0
TWI-1
4 (5
0/50
goo
ds o
nly)
13.1
17.2
21.4
10.0
17.8
4.2
16.4
TWI-1
4 (1
00%
goo
ds o
nly)
23.2
11.0
11.7
8.5
19.8
3.6
22.3
TWI (
100%
goo
ds a
nd s
ervi
ces)
22.0
10.9
12.3
6.3
20.1
4.3
24.1
2014
(Jun
e ye
ar e
nd)
IMF
(All
Fund
)O
vera
ll w
eigh
t**22
.622
.213
.79.
78.
74.
918
.220
04-2
006
Com
mod
ities
***
3.4
44.6
13.0
5.8
5.2
6.5
21.5
Man
ufac
turin
g (in
cl. t
hird
mar
kets
)***
23.0
15.3
15.3
13.0
11.7
4.2
17.6
Tou
rism
***
100.
00.
00.
00.
00.
00.
00.
0
IMF
(Adv
ance
d)*
Ove
rall
wei
ght**
25.3
28.6
15.3
10.8
0.0
5.5
14.5
2004
-200
6 C
omm
oditi
es**
*4.
048
.815
.36.
80.
07.
717
.4 M
anuf
actu
ring
(incl
. thi
rd m
arke
ts)*
**26
.919
.518
.015
.30.
05.
015
.3 T
ouris
m**
*92
.47.
60.
00.
00.
00.
00.
0
BIS
(Nar
row
)*O
vera
ll w
eigh
t30
.018
.816
.613
.80.
04.
016
.920
08-2
010
Man
ufac
turin
g Im
ports
***
29.6
19.9
15.9
12.7
0.0
4.1
17.8
Man
ufac
turin
g Ex
ports
(bila
tera
l)***
46
.210
.417
.716
.90.
02.
86.
0 M
anuf
actu
ring
Expo
rts (t
hird
mar
kets
)***
0.
626
.020
.316
.40.
05.
730
.9BI
S (B
road
)*O
vera
ll w
eigh
t21
.413
.411
.99.
818
.02.
922
.7 M
anuf
actu
ring
Impo
rts**
*20
.513
.811
.08.
820
.12.
822
.9 M
anuf
actu
ring
Expo
rts (b
ilate
ral)*
**40
.79.
215
.614
.94.
62.
412
.6 M
anuf
actu
ring
Expo
rts (t
hird
mar
kets
)***
0.4
16.3
12.7
10.3
21.7
3.5
35.2
JP M
orga
n (N
arro
w)*
Ove
rall
wei
ght
19.1
14.5
22.1
17.1
8.0
4.6
14.6
2000
JP M
orga
n (B
road
)*O
vera
ll w
eigh
t17
.613
.420
.315
.77.
34.
221
.3
OEC
DO
vera
ll w
eigh
t19
.011
.611
.57.
716
.12.
431
.720
11
* Eu
ro zo
ne tr
eate
d as
a si
ngle
entit
y. Fo
r the
IMF
(All
fund
) ser
ies,
indi
vidu
al eu
ro zo
ne co
untr
y w
eigh
ts ar
e agg
rega
ted,
and
for t
hat s
erie
s the
euro
zone
incl
udes
Bel
gium
, Fra
nce,
Ger
man
y, Ita
ly, N
ethe
rlan
ds an
d Sp
ain
only
as th
ese c
ount
ries
ha
ve in
divi
dual
trad
e sh
ares
exc
eedi
ng 1
per
cent
. **
IM
F co
mpo
nent
wei
ghts
are
wei
ghte
d by
the
follo
win
g se
ctor
al tr
ade
shar
es: c
omm
oditi
es (0
.398
), m
anuf
actu
res (
0.52
6) a
nd to
uris
m (0
.076
).
***
Each
com
pone
nt n
orm
alis
ed to
bas
ket f
or il
lust
rativ
e pu
rpos
es.
15Reserve Bank of New Zealand: Bulletin, Vol. 77, No. 6, December 2014
Reserve Bank of New Zealand Bulletin
The Reserve Bank of New Zealand Bulletin is published periodically.
Subscribe online: http://www.rbnz.govt.nz/email_updates.aspx
Editorial CommitteeMichael Reddell (chair), Chris Hunt, Jeremy Richardson.
Copyright © 2014 Reserve Bank of New Zealand
ISSN 1177-8644
Recent issues of the Reserve Bank of New Zealand BulletinClick to load the PDF
Vol. 77, No. 2, June 2014
How volatile are New Zealand’s terms of trade? An international comparison
http://www.rbnz.govt.nz/research_and_publications/reserve_bank_bulletin/2014/2014jun77_2steenkamp.pdf
The interaction between monetary and macro-prudential policy
http://www.rbnz.govt.nz/research_and_publications/reserve_bank_bulletin/2014/2014jun77_2dunstan.pdf
Can't see the wood for the trees - shedding light on Kauri bonds
http://www.rbnz.govt.nz/research_and_publications/reserve_bank_bulletin/2014/2014jun77_2reid.pdf
Vol. 77, No. 3, September 2014
The insurance sector and economic stability
http://www.rbnz.govt.nz/research_and_publications/reserve_bank_bulletin/2014/2014sep77_3.pdf
Vol. 77, No. 4, October 2014
Household debt: a cross-country perspective
http://www.rbnz.govt.nz/research_and_publications/reserve_bank_bulletin/2014/2014oct77_4.pdf
Vol. 77, No. 5, October 2014
Documenting the goals for monetary policy: some cross-country comparisons
http://www.rbnz.govt.nz/research_and_publications/reserve_bank_bulletin/2014/2014oct77_5.pdf


