TE CHN ICAL NOTES NATI ONAL ADVISORY COMMI TTEE FOR ...
12
TE CHN IC AL NOTES NATI O NAL ADVISORY COMMI TTEE FOR AERONAUTICS No. 380 A SUGGESTED UETHOD FOR MEASURING TURBULENCE By C. Fayette Taylor Massachusetts Institute of Technology ash i ngton June, 1931
Transcript of TE CHN ICAL NOTES NATI ONAL ADVISORY COMMI TTEE FOR ...
TE CHN I CAL NOTES
NATI ONAL ADVISORY COMMI TTEE FOR AERONAUTICS
No. 380
A SUGGESTED UETHOD FOR MEASURING TURBULENCE
By C. Fayette Taylor Massachusetts Institute of Technology
ash i ngton June, 1931

NATIONAL ADVISORY COMMITTEE FOR AERONAUT I CS
---- --....--
TECHNICAL NOTE NO. 380
A SUGGESTED MET HO D FOR MEASURING TUREULENCE
Ey C. Fayette Taylor
Summary
The desirabili t y of a quantita tive measure of turbulence i s emphasized. and a possible me t h od of attack on the problem i s d is cus s ed. Data are presente d t o show that the hot-wire anemometer h a s possibilities as a n instrument for measuring turbul ence. An app aratus con s isting essentially of two hot wires, one parallel to the air flow and one at right angles to it, is sugg ested. Further study of the possibilities of
. such a n appa ra tus is recommended.
Introduct ion
The desirabil i ty of being ab l e to make a quantitative measurement of turbulence in a movi ng air stream has long been felt. Ev en an instrument fo r quickly indicating the pre s enc e or ab se n ce of turbulence without attempting to measure it would b e of considerable value in experimental aerodynamics .
S i nc e turbulent motion ~£ a fluid is very complex, it would s eem well nigh imp ossible to develop a single instrument whi ch would me asure all aspects of a given turbulent motion.
F or purpo ses of this d iscuss i on it is useful to divide the aspects of a turbulent moti on i nto two classifications, namely:
1) !~liiud~, which may b e taken to be some character i s tic dime n sion which determines the scale of the mo tion. It may be th e average distance of p a rticle moti on across the gen eral flow direction, or the av erage s p read or siz e of vortices, or the amount of t heir path dep artur e from the average p a th of f low.
2 N.A.C . A. Technical Note No. 380
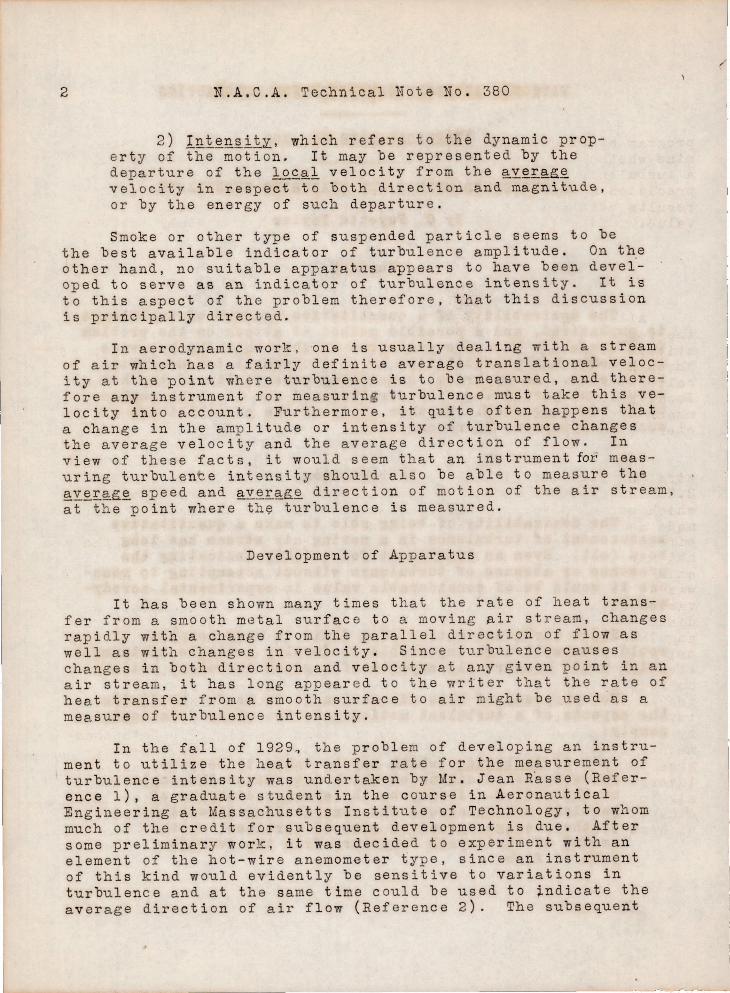
2) l~i~~~ii~, which refers to the dynamic prope rty of the motion. It may be represented by the departure of the lQ£~l velocity from the ~y~~~g~ velocity in respect to both direction and magnitude, or by the energy of such departure.
Smoke or other type of suspended particle seems to be the best available indicator of turbul e nce amplitude. On the other hand, no suitable apparatus appears to have been deveioped to serve as an indicator of turbulence intensity. It is to this aspect of the problem therefore, that this discussion is principally directed .
In aerodynamic work, one is usually dealing with a stream of air which has a fairly definite average translational velocity at the point where turbulence is to be measured, and therefore any instrument for measuring turbulence must take this velocity into account. Furthermore, it quite often happens that a change in the amp litude or intensity of turbulence changes the average velocity and the average direction of flow. In view of these facts, it would seem that an instrument fur measuring turbulent e intensity should also be able to mea sure the ~~~~~g~ speed and ~y~~~g~ direction of motion of the air stream, at t h e point where th ~ turbulence is measured.
Development of Apparatus
It has been shown many times that the rate of h eat transfer from a s mooth metal surfac e to a moving air str e am, changes rapidly with a change from the parallel direction of flow as well as with changes in velocity . Since turbulence causes changes in both direction and velocity at any given p oint in an air stream, it has long appear e d to the writer that th e rate of heat transfer from a smooth surface to air might be used as a measure of turbulence intensity.
In the fall of 1929~ the problem of developing an instrument to utilize the heat transfer rate for the measurement of turbulence intensity was undertaken by Mr. Jean R'asse (Reference 1), a graduate student in the course in Aeronautical Engineering at Massachusetts Institute of Te chnology, to whom much of the credit for subsequent development is due. After some preliminary work, it was decided to experiment with an element of the hot-wire anemometer type, since an instrument of this kind would evidently be sensitive to variations in turbulence and at the same time could be used to ~ndicate the average direction of air flow (Reference 2). The subsequent

N.A.C.A. Technical Note No. 380 3
program of experimental work was undertaken primarily to determine whether or not the idea of using the hot-wire anemometer as a turbulence meter had any practical merit. A high degree of precision was not considered necessary for this purpose, and the results obtained are of qualitative rather than of quantitative value. Units of measure, therefore, have been purposely omitted.
Apparatus
All of the experiments covered by this report were made in the four-foot Venturi type wind tunnel at the Massachusetts Institute of Technology (Reference 3) . The average speed of flow through this tunnel was measured by the permanently installed calibTated piezometer located in the throat of the tunnel. The local average velocity near the hot-wire element was measured by means of a small Pitot-static tube calibrated from the piezometer.
The hot-wire anemometer (Reference 4) consisted of a straight piece of platinum wire .0035 inch in diameter, and 2.85 inches long, stretched between two flattened wire supports which served also as electrical conductors. These supports were made as small as possible in order to minimize their aerodynamic effect. and were flattened to a knife edge at the ends where the hot wire was attached. The anemometer was mounted, near the axis of the wind tunnel, at the end of a small metal tube, and was so arranged that the angular position of the wire could be varied within a vertical plane intersectin~the tunnel axis. A dial, graduated in degrees of angle, was used to indicate the angular position of the hot-wire eleme~t with respect to the tunnel axis. Figure 1 shows the general appearance of the anemometer and a diagram of the electrical circuit. In operation, the current passing through the wire was held constant, the wire temperature varying with changes in the air flow. The temperature of the wire controlled its resistivity, which was indicated by a Wheatstone bridge circuit as shown in the figure. With this method of operation the rate of heat loss -from the wire, per degree temperature difference between wire and air, will be an inverse function of the res is tivity of the wire, assuming the air temperature to remain constant . Increasing resi5~ivity indicates increasing temperature, and therefore a decreasing rate of heat loss per degree of temperature difference.
4 N.A.C.A. Technical Note No. 380
Procedure
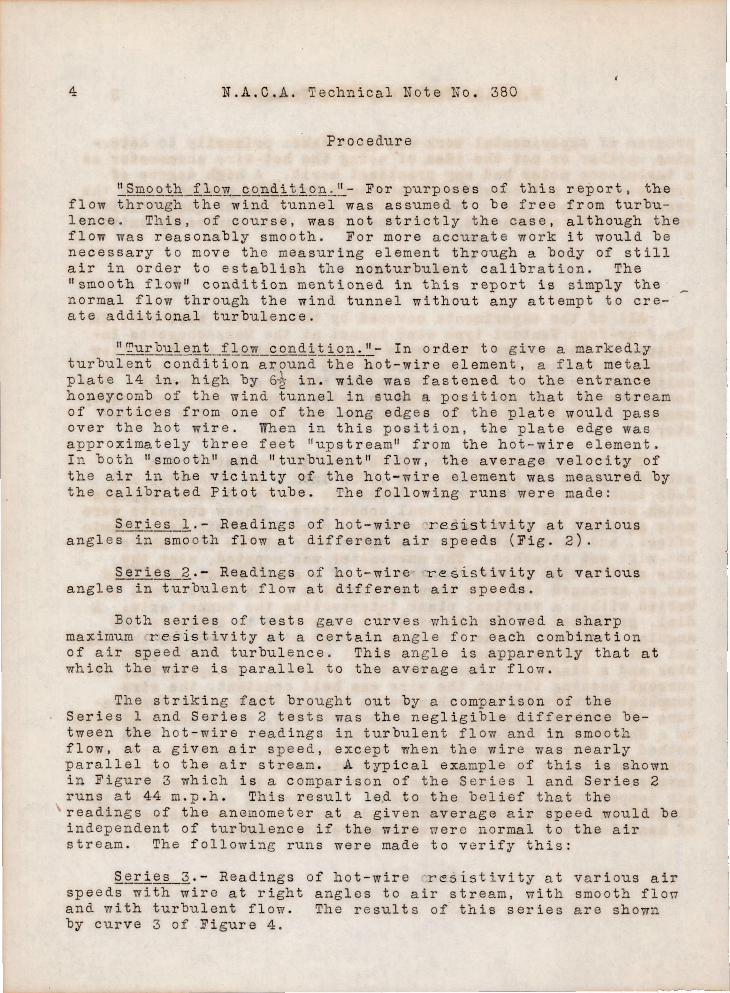
~~~QQih_flQ~_~Qg~iiiQg~~- For purposes of t h is report , t he flow through the wind tunnel was assumed to be free from turbulence. This, of course, was not stric tly the case , although the flow wa s reasonabl y smoo th . For more accurate work it would b e ne cessary t o move the measuring element thr ough a body of still air in order to establish tbe nonturbulent calibration. The IIsmoo th flowll condition mentioned in this repor t i p simply the ' normal flow through the wind tunnel without any attempt to create additional turbulence.
~~urQ~l~gi_flQ~_~Q~~iiiQg~~- In o rder to giv e a markedly turbulent c ondit i on around th e hot-wire element, a fla t metal plate 14 in. high by 6~ in. wide was fastened to t he entrance honeycomb of the wind tunnel in such a pos i tion that the st r eam of vortices from one of the long edge s of th e p late would pass over the hot wire. When i n this position, the p late edge was approximately three feet lIups treamll from the h ot-wi re element. I n both IIs moo t h ll and IIturbulent ll fl ow , the average veloc i ty of the a ir in the vicinity of the hot- wire element was measured by the calibrated Pitot tube. The followi ng runs we re made:
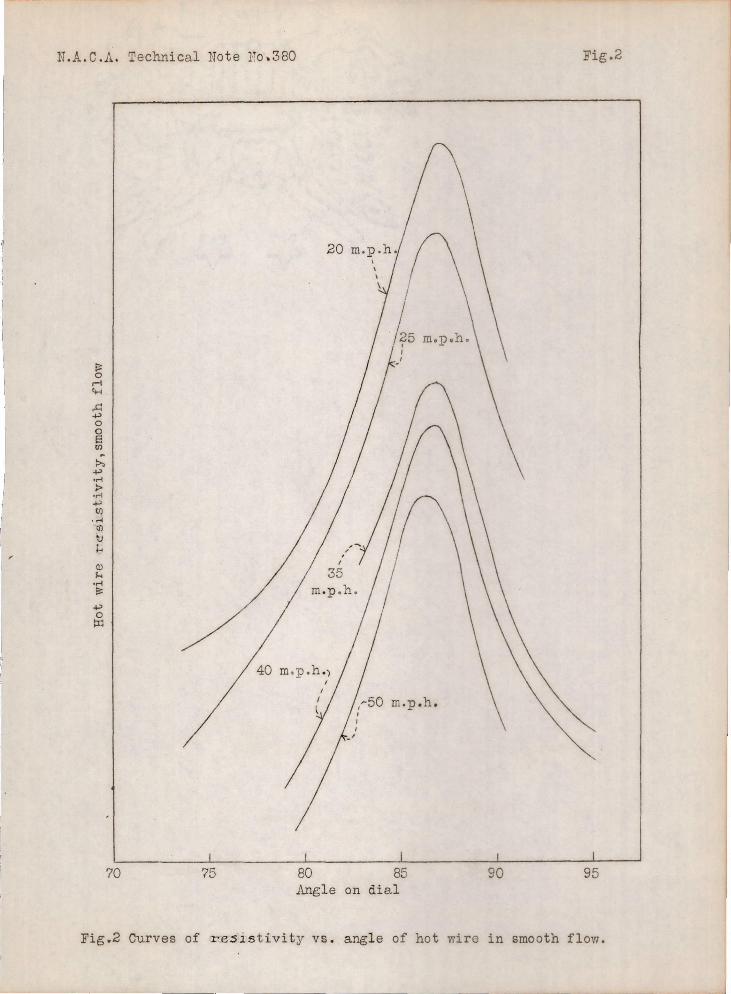
~eri~~_l.- Readings of hot-wire resist ivi ty at various angl e s in smo o th flow at different air sp eeds (Fig. 2).
Seri~~_?- Readi ng s of hot-wire ' resistivity at various angles in turbul ent flow at dif f erent air speeds.
Bo th series of tests g av e curves wh i ch sh owed a sharp maximum resist ivity at a certain angle for each combirration of air sp eed and turbulence. This an g le is a ppa re nt ly that at whi ch the wire is parallel to the av erage air flow.
The striking fa ct br ought out b y a comparison of the Seri es 1 and Ser ies 2 tests was the neg ligible difference b etween the hot - wi re readings i n turbulent flow and in smooth flo w, at a given air speed, except when the wire was nearly paralle l to the ai r st ream . A typical example of thi s is shown in Figure 3 which is a c omparis on of the Series I and Se ries 2 runs at 44 m.p.h. This result led to the belie f that t h e r eadings of the anemometer at a given average air speed would be independent of t urbulenc e if the wire ve r a normal to the a ir stream. The fo llowing runs were ma d e to v er ify this:
~~ri~;?.- Readings of hot-wire resistivity at various air speeds with wire at r i ght angl es to air stream, with smooth flou and with turbulent flou. The results of this series are shown by curve 3 of Figure 4.
N.A.C.A. Technical Note No. 380 5
To summarize th e results of Series land 2, the readings of hot-wire resistivity at the maxima pOints were replotted against air spee d, giving curves 1 and 2, plotted in Figure 4 for purposes of comparison with each other and with Series 3.
Discussion of Result s
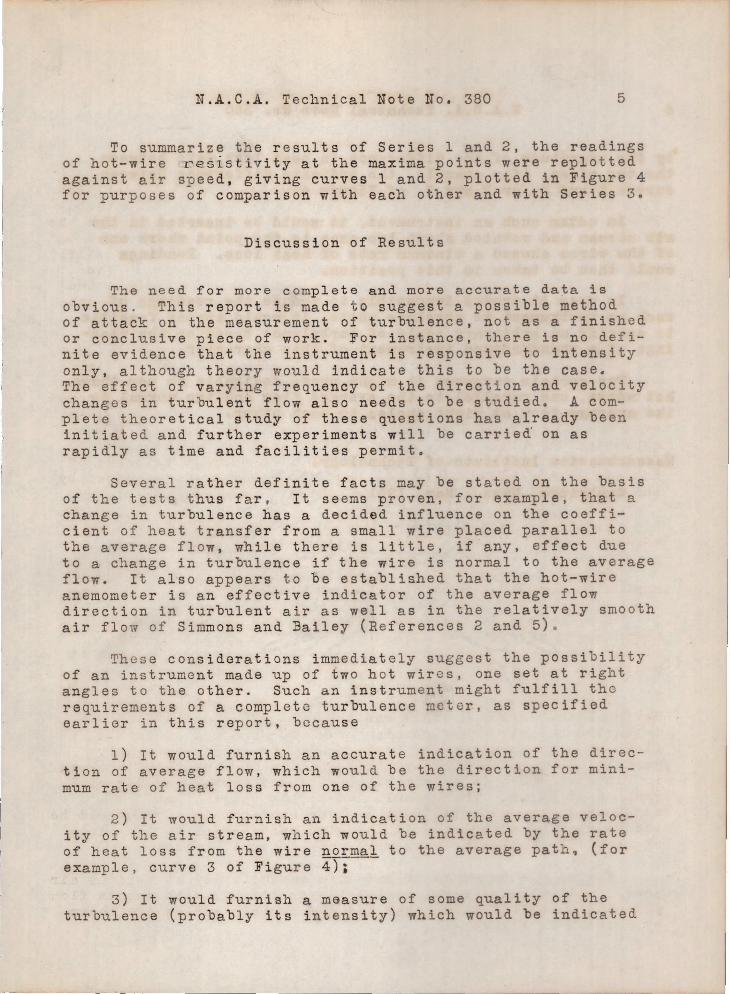
The need for more complete and more accurate data is obvious. This report is made to suggest a possible method of attack on the measurement of turbulence, not as a finished or conclusive piece of work. For instance, there is no definite evidence that the instrument is responsive to intensity only, although theory would indicate this to be the case. The effect of var ying frequency of the direct i on and velocity changes in turbulent flow also needs to be studied. A complete theoretica l study of these questi ons has already been initiated and further experiments wil l be carriea on as rapidly as time and facilities permit.
Several ra ther definite facts may be stated on the basis of the tests thus far , It se ems proven, for example, that a change in turbulence has a decided influence on the coefficient of heat trans fer from a small wire placed parallel to the average flow, while th e re is little, if any, effect due to a change in turbulence if the wire is normal to the average flow. It also appears to be established that the hot-wire anemometer is an effective indicator of the average flow direction in turbulent air as well as in the relatively smooth air flow of Simmons and Bailey (References 2 and 5) .
Th e se considerations immediately suggest the possibility of an instrument made up of two hot wires, one set at right angles to the other. Such an instrument might fulfill th e requirements of a complete turbul ence me ter, as specified earlier in this report, because
1) It would furnish an accurate indication of the direction of average flow, which would be the direction for minimum rate of heat loss from one of the wires;
2) It would furnish an indicati on of the average velocity of the air stream, which would be indicated by the rate of heat loss f rom the wire no~mal to the average path. (for example, curve 3 of Figure 4).
3) It would furnish a maasure of some quality of the turbulence (probably its i ntensity) which would be indicated

6 N.A . C. A . Technical Note No . 380
by the magn itude of the difference in hea t loss rate between the two wires, ( for example, the ordinate differenc e between curves 1 and 3, or 2 and 3, of Figure 4) .
In using such an instrume nt, 'it would be inserted in the air stream and rotated about two axes to the point where one of the wires showed a minimum rate of heat loss . Readings would then be take n in this position .
In case it proves impossible to reduce the rea d ings of such an instrum ent to absolute un i ts, it would appear feasible to specify an arbitrary scale of turbulenc e based on the readings of a standardized instrument of this character.
For cert a in purposes it might p rove desirable to use three hot wires, one parallel to the averag e flow and two normal to the average flow at right angles to e a ch other .
Massachusetts I nstitute of Technology,
Cambridge , Mass . , May, 1931 .

N.A.C.A. Technical Note No. 380 7
References and Bibliography
1. Ra sse, J.
2. Bailey, .:i..
3.
4. King, Louis Vessot
King, Louis Vessot
5. Simmons, L. F. G. and
Bailey, A.
Taylor, C. F. and
Rehbock, A.
Dryden. H. L. and
Kuethe. JL M.
A Possible Apparatus to Measure Turbulence. Thesis on file in Library of the Massachusetts Institute of Technology, Cambridge, Mass.
A Directional Hot-Wire Anemometer. British A.R.C. R&M No. 777, Jan., 1922.
The Four Foot Wind Tunnel at Massachusetts Institute of Technology. Aviation, March 13, 1922.
On the Convection of Heat from Small Cylinders in a Stream of Fluid; Determination of the Convection Constants of Small Platinum Wires, with Applications to Hot-Wire Anemometry. Phil. Trans. Roy. Soc •. Vol. 214, pp. 373-432, 1914.
Pr ecision Measurement of Air VeloCity by Heans o f t he Linear Hot- Wire Anemometer. Phil. Mag., Vol. XXIX, pp. 556-577, 1915.
Not es on a Hot-W"re Speed and Direction Meter. British A.R.C. R&M No. 1019, Feb., 1926.
Rate of Heat Transfer from Finned Metal Surfaces. N.A.C.A. Technical Note No. 331, Jan., 1930.
The Measurement of Fluctuati ons in Air Speed by the Hot-Wire Anemometer. B.A.C.A. Technical Report No. 320, 1929.

B.A.C.A. Technical Note No . 380
~----- 2 . 85" -.------->1
ii"ire (
'1r <,---
a-'
R(1.84w)
J
Galvanometer ;1 20 w
x----:>i
2 . 09 U)
~'V\/vV\NVI Z=55 w v y
'--------4 I I I /1- 110 V --i I I I I ! '==:J
Figll
ammeter
Fig . l Eot wire anemomete r and diagram of Uheatstone Bridge circuit.
N.A.C .A. Technical Note ro .380 Fig.2
~ 0 rI 'H
,.q ..., 0 0 13 (I)
>., ..., 'n > ·n +> tf)
· n C})
~
t-. ,-
Q)
!-< ·n ~
+> 0 :r:
40 m. p.h .)
m.p.h.
70 75 80 85 90 95 Angle on dial
Fig.2 Curves of resistivity vs . angle of hot wire in smooth flow.

N.A.C.A. Technical ~ot e No . 380 Fig.3
'--_---' __ ---.1. __ --'-__ ----1-- I
o 20 40 60 80 100 Angle on dial
Fig.3 Compariso n of r esistivity vs . ans1c curves at 44 m.p.h.) smooth flow and tur ml ont flo '\7 .

1
N.A.C .A. Technical ote No.380 Fig.4
>., 1 +> .,-1
> .,4 .... CI)
. ,-1
CI)
lJ I-<
<ll H
.,-1
~
+> 2 0
Irl
3
o 10 20 30 40 50 6(} Average ind speed near hot wire,m.p.h.
1. Smooth flow,wire parallel to air flow. 2. Turbulent flow,wire parallel to air flow. 3. Wire perpendicular to air stream, in smooth flow'+"and turbulent flow"O':
Fig.4 Curves of resistivity of hot wire parallel and normal to air stream in smooth and turbulent flow.