~.t.C?.~ .l. - CORE · (i) Student number: 3105-557-5 I declare that 'The impact of economic...
167
(i) Student number: 3105-557-5 I declare that 'The impact of economic liberalisation on the spatial patterns of peasant crop farming in Zambia since 1991: the case of Chibombo District in Central Zambia' is my own work and that all the sources that I have used or quoted have been indicated and acknowledged by means of complete references. SIGNATURE (Mr. A. H. Malambo) . . q .l. '?.? ....... . DATE
Transcript of ~.t.C?.~ .l. - CORE · (i) Student number: 3105-557-5 I declare that 'The impact of economic...

(i)
Student number: 3105-557-5
I declare that 'The impact of economic liberalisation on the spatial patterns of peasant crop
farming in Zambia since 1991: the case of Chibombo District in Central Zambia' is my own
work and that all the sources that I have used or quoted have been indicated and acknowledged by
means of complete references.
·--~~---······················ SIGNATURE
(Mr. A. H. Malambo)
. . q ~.t.C?.~ .l. '?.? ....... . DATE

(ii)
THE IMPACT OF ECONOMIC LIBERALISATION ON THE SPATIAL PATTERNS OF PEASANT CROP FARMING IN ZAMBIA SINCE 1991: THE CASE OF
CHIBOMBO DISTRICT IN CENTRAL ZAMBIA
by
AUGREY HICIGAALI MALAMBO
Submitted in fulfilment of the requirements for the degree of
MASTER OF ARTS
in the subject
GEOGRAPHY
at the
UNIVERSITY OF SOUTH AFRICA
SUPERVISOR: MRS. S. ZIETSMAN
JOINT SUPERVISOR: wlR G.M. KAJOBA
NOVEMBER 30, 1999.

(iii)
SUMMARY OF THE DISSERTATION
This is a comparative study of the spatial patterns of peasant crop farming in
Chibombo District between the 1980s and the 1990s. The study lists and
discusses the agricultural support system, communication infrastructure and the
crop production and patterns of the 1980s within the environment of centralised
planning and then compares these to the structures and patterns of the 1990s in
an atmosphere of economic liberalisation. This comparison in crop production,
cropping patterns, institutional support systems and the communication
infrastructure in five sampled farming wards of Chibombo District, leads to the
conclusion that there is a marked change in the structures and patterns of the
1990s from those of the 1980s. Thus, in Chibombo District, the state of the
communication infrastructure in the 1990s is generally poorer than the
communication infrastructure of the 1980s, the agricultural support system of the
1990s is largely privately owned and found in fewer farming areas while the
agricultural support system of the 1980s was state controlled and more widely
spread, and crop patterns in some farming wards are different in the 1990s from
those of the 1980s. In the 1990s, crop production in farming wards with a
supportive environment has increased than it was in the 1980s but decreased in
those where a conducive environment lacks. In this line, the study makes
several recommendations for consideration on how to mitigate the problems that
the peasant farmers are facing or how to enhance the positive changes that
have occurred in Chibombo District.
KEY TERMS OF THE STUDY
The following are the key terms of this study: economic liberalisation, impact,
agricultural policy, agricultural support system, command economy, free market
economy, spatial patterns, peasant farmer, peasant crop farming, crop
production, communication infrastructure, farming resources, farm family,
farming ward, Chibombo District and Central Zambia.

(iv)
DEDICATION
To Angela, Buumba, Tembozi and Mainza.
ACKNOWLEDGEMENTS
The author acknowledges the help rendered by numerous people during the
study. While the people involved are too many to mention, a few notable ones
are worth mentioning by name. These are: Mrs S. Zietsman, Mr. G.M. Kajoba,
Mr. J. Chalila, Mr. Liomba, Mr. G.M. Richmond, Mr. L. Muma, Mr. Chishimba, Mr.
J. Proctor, J. Ndumingo and Mr. M. Baker. Mrs. Zietsman and Mr. Kajoba are
especially thanked for patiently guiding the author through the 'forest' of the
study. Messrs Chalila and Liomba worked on the maps. Mr. Ndumingo helped
with the statistical aspect of the study. Mr. Chishimba provided the information
the author needed from the Department of Agriculture. Mr. Baker, and partly Mr.
Proctor, helped with the computer work. Mr. Richmond gave the author
permission to use the School facilities. Mr. Muma travelled with the author
during the fieldwork to most places visited. To all these people, and those not
mentioned, the author is highly indebted.
~I~ I~ I~~~ 111111111111 ~111111111111 0001761344

(v)
COMMON ABBREVIATIONS USED
1. ACE: Agricultural Commodity Exchange. 2. AFC: Agricultural Finance Company. 3. ARMS: Agricultural Rural Marketing Board. 4. ASIP: Agricultural Sector Investment Programme. 5. BSA Co: British South African Company. 6. COZ: Credit Organisation of Zambia. 7. CPCMU: Central Province Co-operative Marketing Union. 8. CSO: Central Statistical Office 9. CUSA: Credit Union and Savings Association. 10. ECU: Eastern Co-operative Union. 11. FMB: Federal Marketing Board. 12. FNDP: First National Development Plan and Fourth National
Development Plan. 13. GMB: Grain Marketing Board. 14. GRZ: Government of the Republic of Zambia. 15. KCE: Kapiri Commodity Exchange. 16. KRDCU: Kabwe Rural District Co-operative Union. 17. KM: Kilometre. 18. KG: Kilogramme 19. LINTCO: Lint Company. 20. LONRHO: London Rhodesia. 21. MMD: Movement for Multi-party Democracy. 22. NAMBOURD: National Agricultural Marketing Board. 23. NCZ: Nitrogen Chemicals of Zambia. 24. RIF: Rural Investment Fund. 25. SEED-CO: Seed Company. 26. SGS: General Society Surveillance. 27. SNDP: Second National Development Plan. 28. SPCMU: Southern Province Co-operative Marketing Union. 29. TBZ: Tobacco Board of Zambia. 30. TNDP: Third National Development Plan. 31. UNIP: United National Independence Party. 32. ZAMSEED: Zambia Seed Company. 33. ZCF: Zambia Co-operative Federation. 34.ZNFU: Zambia National Farmers' Union.

(vi)
FIGURES (MAPS) USED
1. Figure 1: Zambia's location in Africa. 2. Figure 2: Location of Chibombo District in Zambia. 3. Figure 3: Chibombo District before 1990. 4. Figure 4: Chibombo District after 1990. 5. Figure 5: Relief of Zambia. 6. Figure 6: Soils of Zambia. 7. Figure 7: Vegetation of Zambia. 8. Figure 8: Mean annual Temperature of Zambia. 9. Figure 9: Mean annual rainfall of Zambia. 10. Figure 10: Distribution of agricultural activities in Zambia. 11. Figure 11: Chibombo District: communication infrastructure for the 1980s and 1990s. 12. Figure 12: Chibombo District: samples. 13. Figure ~ 3: Chibombo District: depot infrastructure per ward in the 1980s. 14. Figure 14: Chibombo District: depot infrastructure per ward in the 1990s. 15. Figure 15: Chibombo District: crop land-use in the 1980s as a percentage of total hectarage. 16. Figure 16: Chibombo District: crop land-use in the 1990s as a percentage of total hectarage. 17. Figure 17: Cropping systems for Chibombo District in the 1980s. 18. Figure 18: Cropping systems for Chibombo District in the 1990s. 19. Figure 19: Total crop production for the 1980s (1983-1990) in Chibombo District (sampled farmers only). 20. Figure 20: Total crop production for the 1990s (1991-1997) in Chibombo District (sampled farmers only).
PAGE
4 35 36 36 37 37 38 38 38 39
39 52
55
55
62
62 64 64
74
74

(vii)
TABLES USED PAGE
1. African sales in the line of railway area, 1950 to 1964. 9 2. Amounts of credit approved by Lima Bank and ZCF Finance Services from 1983/84 to 1988/89 (Zambian Kwacha in thousands). 13 3. Maize related subsidies in relation to Government budget (recurrent and capital) and budget deficit 1980 to 1990. 15 4. Crop production estimates for Chibombo District from 1988/89 to 1990/91. 19 5. Maize imports and exports from 1982/83 to 1991/92. 20 6. Marketed crop purchases in thousands from 1989/90 to 1991/92. 21 7. Research assistants. 45 8. Farm family samples in the five Wards of Chibombo District. 53 9. Sample extension officers of cotton companies. 54 1 0. Crops grown in the 1980s by sampled farm families. 62 11. Crops grown in the 1990s by samples farm families. 65 12. Average land hectarage per crop in the 1980s. 67 13. Average land hectarage per crop in the 1980s. 69 14. Crop land-use percentage change-increases and/or decreases in hectarage from the 1980s to the 1990s. 70 15. Crop production in Chaloshi Ward in the 1980s. 73 16. Total annual rainfall for Chibombo District in the 1980s. 74 17. Crop production in Chaloshi Ward in the 1990s. 75 18. Total annual rainfall for Chibombo District in the 1990s. 75 19. Crop production in Chibombo Ward in the 1980s. 77 20. Crop production in Chibombo Ward in the 1990s. 78 21. Crop production in Chikobo Ward in the 1980s. 79 22. Crop production in Chikobo Ward in the 1990s. 81 23. Crop production in Keembe Ward in the 1980s. 82 24. Crop production in Keembe Ward in the 1990s. 83 25. Crop production in Liteta Ward in the 1980s. 84 26. Crop production in Liteta Ward in the 1990s. 86 27. Changes in crop production from the 1980s to the 1990s, expressed as absolute figures (bags) and percentages-based on totals. 'l.g. Crop production estimates for Chibombo District from 1988/89 to 1995/96. 90

(viii)
GRAPHS USED ON THEIR OWN WITHOUT MAPS
1. Graph 1 :Crop land use percentage change- increases and decreases in hectarage from the 1980s to the 1990s.
2. Graph 2: Crop production percentage change between the 1980s and 1990s ..
PAGE
71
89

(ix)
TABLE OF CONTENTS
1. Declaration (i) 2. Title page (ii) 3. Summary of dissertation (iii) 4. Key terms of the study (iv) 5. Dedication (v) 6. Acknowledgements (vi) 7. Common abbreviations used (vi) 8. Figures (Maps) used (vii) 9. Tables (viii) 1 0. Graphs used without maps (ix) 11. Table of contents (x-xi) 12.Chapter 1: 1.1 Introduction 1-27
1.2 Literature review 1. 3 Motivation of the study
13. Chapter 2: Description of the study 28-41 · 2.1 Introduction
2.2 The research problem 2.3 The research hypotheses 2.4 Definition of key terms 2.5 Choice ofthe study area 2.6 Description of the study area 2. 7 Conclusion
14. Chapter 3: Methodology of data collection and limitations of the study 42-58 3. 1 Introduction 3.2 Research preparation 3. 3 Research instruments 3. 4 Interviews 3. 5 Observations 3. 6 Sampling frames 3. 7 Sampling unit 3.8 Sample selection and structure 3.9 Field research administration 3.10 Methods of data collection 3. 11 Limitations of the study

(x)
15. Chapter 4: Testing the hypotheses of the study 59-100 4. 1 General introduction 4.2 Crop patterns and production in Chibombo District in the 1980s and
1990s 4.3 Agricultural support systems in Chibombo District in the 1980s and
1990s 4.4 The communication infrastructure in Chibombo District in the 1980s
and 1990s 4.5 Summary of Chapter 4
16. Chapter 5: Conclusions and recommendations 5.1 Conclusions · 5.2 Recommendations
17. Bibliography 18. List of notable officials spoken to 19. Appendix (Appendix 1, 2, 3, 4)
101-113
114-119
120 END

1
CHAPTER 1
1.1 INTRODUCTION
In Central Zambia, and particularly the Chibombo District, the main economic activity is
peasant farming. It accounts for more than 80 percent of the agricultural and economic
activities in the region. The majority of the people in this region either keep animals or
grow crops on a small scale for a living. As an economic activity, peasant agriculture is
affected, in one way or another, by any change in the economic policies of the country.
Since this type of farming is the main economic activity of the majority of the people in
Chibombo District, like in other parts of Central Zambia, any impact on it is likely to
affect the people's production capacity and the established spatial support structures,
such as institutions, markets and roads.
In 1991 the government of Zambia, in an effort to revamp the ailing economy,
introduced economic liberalisation policies that differed, in large measure, from the
economic policies of centralised planning which the country had pursued since its
independence in 1964. Owing to the different nature of the new economic policies,
they were bound to impact - perhaps profoundly - on the spatial patterns of peasant
crop farming. Both for academic and practical reasons, when there is a major policy
change in a country, particularly shifts that affect many people and established
structures, there is a need to investigate and record its effects on the structures
intended to benefit from it.
This dissertation reports on a study concerned with the impact of economic
liberalisation on the spatial patterns of peasant crop farming in the Chibombo District of
Central Zambia. The investigation was aimed at establishing whether the policies
introduced by the Zambian government in 1991, owing to their scope and intensity, did
in fact affect the spatial patterns of peasant crop farming in Chibombo District. The
study was primarily aimed at investigating the spatial changes that could have occurred
in peasant crop farming in terms of crop production, institutional support networks of
input and resource supply, crop marketing, extension services, and road infrastructure
in farming areas of Chibombo District.

2
Economic liberalisation policies were launched in 1991 by the new government of the
Movement for Multi-party Democracy (MMD), that came into office in that year, in order
to revitalise the country's economy which had been ailing since the late 1970s. To
achieve this the government decided to embark on creating a competitive market
oriented economic environment in which producers, sellers and buyers of goods and
services could freely do as they saw fit within the requirements of the law and the
existing market opportunities. For agriculture, the policy of liberalisation meant a break
from the pre-1991 policy of command structures sustained by the state, to free market
policies in which small-scale farming, like other sectors of the economy, had to sustain
itself depending on market opportunities. According to the pre-1991 policies the
government had a direct participation in farming through its own farms, determination of
prices for inputs and farm produce, provision of subsidies for the operation of state
parastatals that supported agriculture, and the provision of extension services. With
the new agricultural policy, the government opted to dispose of, through various
mechanisms, its farms, discontinued its subsidies to agricultural parastatals,
determination of input and farm produce prices, and liberalised input supply, crop
marketing, provision of extension services and storage facilities. Similarly, farmers
were encouraged to diversify crops and adopt new farming methods to match the new
environment of a free market economy.
Owing to the fact that the bulk of the farmers in Chibombo District are peasants with a
weak resource base and had been sustained for many years by state owned structures,
such a profound shift in policy was likely to bring about many changes in this sector of
the economy. it was this very idea that prompted the study being reported on here.
This dissertation addresses the likely changes that could have occurred in the spatial
patterns of peasant farming in the post-1991 period, and deals with the related issues
in the context of the current government's emphasis on peasant farming as the engine
of agricultural development.
The dissertation is organised in five chapters. Each chapter deals with a specific
component of the study. In each chapter, the researcher has attempted to bring forth
the spatial aspects of the effects of economic liberalisation on peasant farming in
Chibombo District.

3
Chapter 1 outlines how the material is organised in the dissertation, gives a
comprehensive literature review and states the rationale for the study. The literature
review gives a detailed background description of peasant farming in Zambia, the
development of spatial patterns, as well as the impact of government policies and
changes that have occurred over time. The effect of government economic policies on
the development of spatial patterns of small-scale farmers in historical times is
explained with a deliberate emphasis.
In Chapter 2, the study area and the reasons for its selection are described and the
problem under study, objectives of the study, hypotheses to be investigated, and the
limitations of the study are set out. The key terms used in this dissertation are also
defined.
Chapter 3 outlines the methods that were used when collecting the field data. Each
method is explained and reasons for its choice and use are given. Within this chapter,
an effort is made to describe the spatial distribution of the sampled population.
In Chapter 4, the data is presented, explained and analysed. The hypotheses are
tested and the results interpreted. To do this effectively, tables, graphs and maps of
production percentages and figures for the 1980s and 1990s, agricultural support
infrastructure and road networks are used. Deliberately, a comparative approach over
two time periods is adopted here in order to assess the effectiveness, or lack of it, of
the new agricultural policies based on what they set out to achieve in 1991. In this
chapter, careful consideration is given to the results of the study in fine with the set
objectives.
The fast chapter, Chapter 5, deals with the conclusions, which can be drawn from the
results. This chapter also presents a set of recommendations for consideration. These
recommendations are aimed at presenting an alternative way, if necessary, of dealing
with the many problems and challenges facing the peasant farming community in
Chibombo District.

4
At the end of this dissertation is a consolidated list of all references and sources, as
well as the appendices. The bibliography contains the titles of all the materials used,
whether cited, or quoted from, or not. The appendices are those materials used either
as sources of field data or some other information within the dissertation.
1.2 LITERATURE REVIEW
1.2.1 The historical background
The country of Zambia (figure 1), as it is called today, " ... came into being in 1911 when
the two British South African Company co-administered territories of North-western and
North-eastern Rhodesia were brought together (to form Northern Rhodesia) . . . and
becoming a direct British protectorate in 1924 ... " (Wilson 1991 :235). Prior to this
period, 1890 tq 1924, Wilson states that the British South African Company (BSA CO.)
ruled Northern Rhodesia on behalf of the British Colonial Office in London. When this
mandate expired in 1924, the British Colonial Office of the British government took
direct governance control of the territory.
Before 1890 when colonial rule arrived in Northern Rhodesia, agriculture, according to
Muntemba (1977a) and Chipungu (1988), was not commercialised as became the case
in later years. It was structured in a manner that it directly responded to the immediate
needs of the societies, and occasionally a commodity-to-commodity exchange system
of trade. During this period, farmers in various parts of Northern Rhodesia, like in many
parts of Africa, grew crops that had evolved from within their tribal communities. They
" ... cultivated crops such as sorghum (the staple food), millet and local maize under hoe
cultivation for subsistence" (Muntemba 1977a:347). The hoe, according to Muntemba,
was the main farming tool of the time- thus, it defines the technology of the time. Kay
has described this period of agricultural development in Northern Rhodesia as
"primitive ... characterised by a very low level of capitalist inputs, by the use of no power
other than human muscles and fire ... "(Kay 1969:497).
Muntemba (1977a) further points out that due to the type of technology used, low
population levels, limited interaction between communities, lack of active markets, poor

30°
Fig. 1. AFRICA: ZAMBIA'S LOCATION N
30° t 30
ALGERIA
SUDAN
0 0
ZAIRE
0 500 1000 1500 Km
30°
0

5
communication networks and other intervening variables, farming production was low.
At this time agricultural production, in many places, focused more on meeting the food
needs of the immediate community. Occasionally, however, trade occurred between
tribal communities to exchange goods that each community desired from the other. For
example, Muntemba (1977a) argues that the Lenje people traded with both the
Portuguese, through long distance trade, and the neighbouring tribes like the Soli, lla
and Sala, through short distance trade, to obtain cattle, salt, copper and ivory in
exchange for iron ore and other commodities.
During the pre-colonial period farmers used biotic manures like cow dung, ash from
burnt tree branches, simple tools such as hoe and axe, and shifting cultivation in order
to sustain the fertility of the land. Colson (1960) explains that farmers shifted to new
plots of virgin land periodically so that the ones they had used for some time could
regenerate. Owing to low population numbers, land tenure systems that existed at the
time and the abundance of arable land such a method was able to prevail without
undue pressure on the land or inconveniencing other people.
Arising from the above facts, one concludes that the pre-colonial period saw farmers
use local tools like a hoe and axe for cultivating their fields, planted only crops that had
evolved over time from within their communities and produced little but enough mainly
for their own consumption. Similarly, settlements were not as concentrated as they are
today in one or two places due to the shortage of land. Land was abundant relative to
the populations of the day. The abundance of land, relative to the population, made
crop rotation possible. Their settlement patterns, at this time, were dictated mainly by
the availability of security to the whole tribal community. surface water, hunting and
grazing lands.
According to Muntemba (1977a) and Chipungu (1988), with the arrival of colonial rule,
agriculture in Northern Rhodesia changed. The farmers acquired new farming
resources and opportunities - new crops, technologies and other know-how, and new
markets that stimulated a general agricultural expansion. Muntemba (1977a) argues
that the period between 1902 and 1920 witnessed the diffusion of technological and
technical innovations, which saw an increase in agricultural output. She further points

6
out that " ... as early as 1910 the Bulenje cultivators ... were reported as taking
advantage of the markets selling milk, eggs, poultry, vegetables and grain to the
growing towns" (Muntemba 1977a: 345). Kay (1969), Kajoba (1988) and Chipungu
(1988) have all supported this argument. Additionally, Muntemba (1977a) and
Chipungu (1988) seem to share the view that the major factor that inhibited agricultural
development of the peasantry at this time was lack of effective communication links
between communities.
The acquisition of new farming knowledge, crops and tools helped the African farmers
increase their crop production and management of their fields (Gerrard et al 1994).
These developments were particularly pronounced among those African farmers that
were in close proximity with the settler farmers and/or missionaries. Muntemba
(1977a}, Chipungu (1988) and Mwanza (1992a and b) point out that such
developments ·were common in Southern, Central and Eastern Provinces of the
country.
Writing about the Bulenje people, Muntemba (1977a:266) states that:
As the people of Bulenje [Kabwe Rural District] seized the opportunity to produce for the growing urban market, there was triggered a process of agricultural change in terms of crops, the means of production and land tenure. Whereas in the nineteenth century sorghum was the staple grain, the twentieth century saw a shift to maize, which became more profitable to grow commercially.
These developments in Kabwe Rural District (part of which is now Chibombo), like in
many other parts of the country, especially in the districts of Southern Province and
parts of Eastern Province, brought about an increase in crop production and marketed
crop. Muntemba makes this point clear when she says "Whereas the district [Kabwe
Rural District] produced 5,000 bags (of maize) in 1946, production reached 19,000
bags in 1948" (Muntemba 1977a:258). An increase of 14,000 bags of maize within a
short period of two (2) years seems to suggest that there was a remarkable
improvement in farming practices among the farming community. This conclusion
seems to hold ground considering the type of farming tools and knowledge most
farmers had at this time.

7
1.2.2 Agricultural policy and its effect on peasant farming
Prior to 1950 the Colonial Government's agricultural policy, particularly towards the
African peasantry can be said to have been contradictory. On one hand it appeared to
encourage the African peasantry to improve production, while on the other, it clearly
discouraged it. This contradiction is clearly illustrated by the following passages (as
quoted by Chipungu (1988:26)), from the Department of Agriculture's policy documents
just before 1928:
"Agricultural development mu~t receive top priority. African subsistence must develop
into peasant farming. Capital and technical technical (sic] must be made available on a large
scale to make the African farmer efficient (sic]".
At the same time, the Department of Agriculture maintained that
"The ordinary villager. .. is a more economic and productive value [sic] than as a
producer. .. He would be twelve to fifteen times as valuable in terms of manpower as a farm
employee [sic] rather than self-employed".
These two quotations from the policies of the Department of Agriculture indicated a
strong resolve by the ruling class (at this time) to encourage the development of Settler
agriculture while suppressing the African peasantry. This policy only started changing
towards Zambia's independence (Chipungu 1988).
The effects of the Colonial government on African agriculture, prior to the Second
World War, were that African farmers were uprooted from the best fertile lands along
the major road and communication networks and relocated to far flung areas in the
interior where markets, extension services, and other very basic agriculture
requirements were either in minimal supply or did not exist at all (Chipungu 1988).
Muntemba seems to agree with this when she says that land alienation ... in Bulenje
" ... led to the relocation of people away from the towns and main lines of
communication, and caused congestion and land shortage" (Muntemba 1977a:359).
This argument seems to suggest reasons why the majority of the (present day) small
scale farmers are settled, relative to their commercial counterparts, in remote areas of
the country. The relocation of peasant farmers to remote parts of the country could

8
have had an adverse impact on crop production, knowledge diffusion and land
availability. These possibilities seem to be potent considering that some of the places
the farmers were removed from had the best soils in terms of fertility, and were close to
markets and sources of new knowledge- the settler community. By settling the African
peasantry in the reserves the Colonial Government seems to have brought about the
shortage of land for growing crops and grazing animals. The overuse of land for
growing crops and keeping animals could only lead to land exhaustion, declining
production, poor nutrition and ultimately a low standard of living of the people
(Muntemba 1977a). Muntemba (1977a) also indicates that the reserves, where the
peasants were settled, had limited or no services such as schools, clinics and shops.
So it means that to obtain these services the peasants needed to walk long distances.
In the late 1950s and early 1960s the policies changed (for various reasons such as
political appeasement, the need for peasants to have a reliable source of income to
enable them to pay hut tax and the government's need to meet the cheap food
requirements of the urban centres particularly the Copperbelt Province) towards
encouraging the African peasantry to expand crop production. Muntemba (1977a),
Chipungu (1988), Gerrard et al (1994) and Mwanza (1992a and b) have indicated that
to achieve this aim the colonial government established marketing boards, training
institutions, the African Improvement Fund, and distributed chemical fertilisers to the
African farmers, and improved the communication networks in farming areas. Further,
this policy of inclusion, rather than exclusion, enabled the African peasantry to gain
farming resources, farming know-how and new crops directly from the government and
their settler counterparts. The established agricultural support network in the farming
communities, for example Chipembi Farm Institute at Chipembi and Keembe Farm
Institute at Keembe (see figure 13) and the marketing boards became an engine of
development to the areas near or around them.
Under this policy of inclusion, "the Department of Agriculture provided free financial and
technical assistance to some improved farmers- for stumping (a process of clearing the
land by uprooting trees), water supplies, purchase of oxen, inputs, etc. Bonuses were
also allocated on the basis of the size of holdings" (Muntemba 1977a:266). This
policy-change helped farmers acquire the required farming technology. For example,
9
Muntemba further indicates that Kabwe Rural District " ... had a total of 1,253 ox-drawn
ploughs in 1948, ... 1,406 in 1950 and ... 3,530 in 1961; and by 1964 95 percent of the
cultivators used the plough cultivation" (Muntemba 1977a:266).
With an improvement in communication networks and the general farming environment,
the Zambian peasant improved his production capacity. Clearly, the colonial policy of
making farming resources and support infrastructure available to the farming
community, shows that the African peasantry responded, like their counterparts the
European settler farmers, favourably to changes that were taking place in the economic
environment.
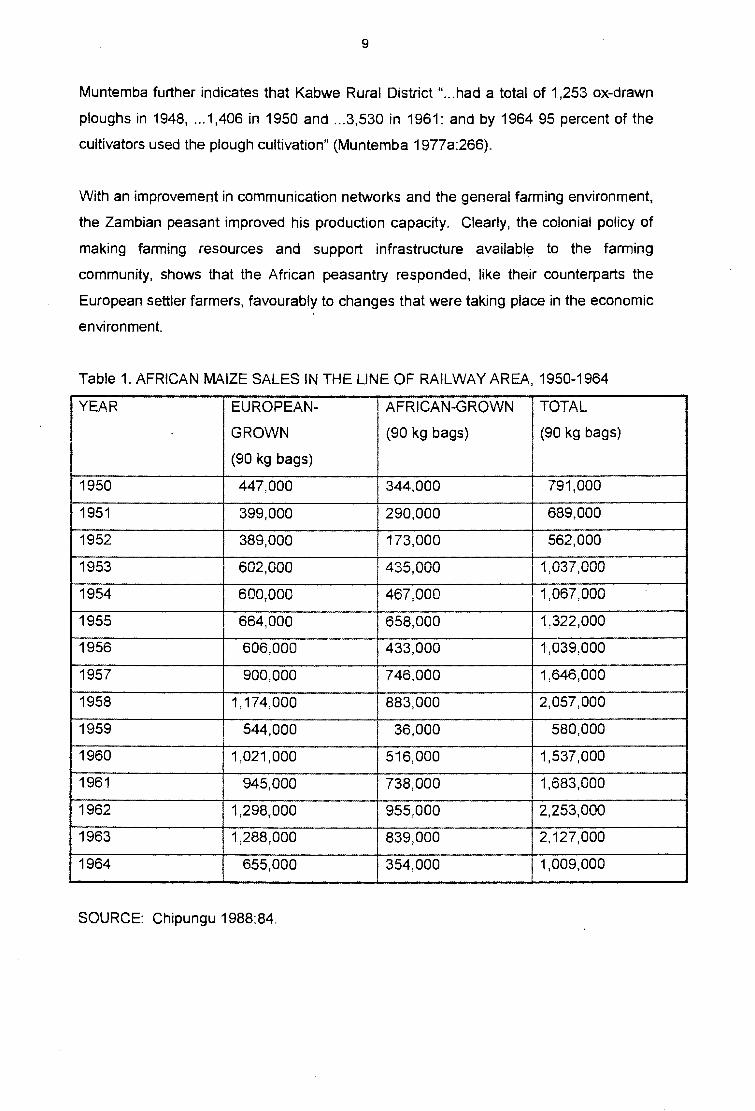
Table 1. AFRICAN MAIZE SALES IN THE LINE OF RAILWAY AREA, 1950-1964
YEAR I EUROPEAN- AFRICAN-GROWN TOTAL
GROWN (90 kg bags) (90 kg bags)
I (90 kg bags) I 1950 447,000 344,000 791,000
1951 399,000 290,000 689,000
1952 389,000 173,000 562,000
1953 602,000 435,000 1,037,000
1954 600,000 467,000 1,067,000
1955 664,000 658,000 1,322,000
1956 606,000 433,000 1,039,000
1957 900,000 746,000 1,646,000
1958 1 '174,000 883,000 2,057,000
1959 544,000 36,000 580,000
1960 1,021,000 516,000 1,537,000
1961 945,000 738,000 1,683,000
1962 1,298,000 955,000 2,253,000
1963 1,288,000 839,000 2,127,000
1964 655,000 354,000 1,009,000
SOURCE: Chipungu 1988:84.

10
Table 1 on maize sales figures demonstrates this positive response by the African
peasantry, in crop production terms. Table 1 shows maize sales figures only because
the information for other crops, like cotton and sunflower that had been introduced
among peasant farmers during this time was scanty and impossible to obtain.
Table 1 indicates that with a provision of an effective farming support network in the
farming community, sound prices of agricultural produce, good road network, and a
general positive environment in the country, crop production improves. The only
reason for crop production fluctuation, if the agricultural policy remains favourable, is
environmental conditions and other external factors that are beyond the control of the
farming community. For example in the years 1951, 52, 59 and 64 production was low
mainly because of poor rainfall and the struggle for political independence that reached
its peak in the 1ate 1950s and early 1960s (Chipungu 1988).
By incorporating the African peasantry into the main stream of commercial agriculture,
the Colonial government enabled the African farmers to improve their perception of
farming as a business. This perceptual change brought about an improvement in the
general response of the African peasantry to farming and their competitiveness.
Gerrard et al (1994) argue that the policy shift resulted in an increase in land-use
intensity particularly in high potential areas, high crop production, and a general
improvement in agricultural efficiency. According to Gerrard and co-authors, the results
from a change in the Agricultural policy of the Colonial government towards the time of
Zambia's independence prove that " ... small farmers are responsive to economic
opportunities ... " (Gerrard et al1994:9).
The colonial government, with all its negative impacts on African peasant agriculture
and the general agricultural policy that was tilted towards making agriculture a mere
provider of cheap food to the mining community, managed, in the researcher's view, to
establish a spatial pattern that favoured farmers in some areas of the country and
created a foundation for the post colonial spatial patterns in Zambia. Among the
institutions founded were the Maize Control Board which was " ... established in 1936
with the power to purchase and sell maize, and later groundnuts along the line of rail

11
area, that is the area between Livingstone and the Copperbelt" (Shawa and Johnson
1990:370). Shawa and Johnson also point out that in 1952 " ... the Eastern Province
Agricultural Produce Board was set-up to provide marketing services in that province"
(Shawa and Johnson, 1990:371).
In 1957, during the time of the Federation of Rhodesia (Northern Rhodesia (now
Zambia) and Southern Rhodesia (now Zimbabwe) and Nyasaland (now Malawi)" ... the
Federal Grain Marketing Board was established to replace both the Grain.Control Board
and Eastern Province Agricultural Produce Board. The Federal Board had an expanded
marketing mandate that included beans, sorghum and millet, in addition to maize and
groundnuts" (Shawa and Johnson 1990:371). The network of the Board grew from the
already developed places such as towns, along the main roads and the railway line and
sparsely into the interior (Shawa and Johnson 1990).
In addition to the Federal Board, " ... some loosely organised marketing co-operatives
existed in the Eastern and Southern provinces, but these only acted as agents for the
marketing boards" (Shawa and Johnson 1990:371). These marketing boards, though
efficient in their operations, had a weakness of overlooking farming activities among the
African peasantry, particularly in remote areas. Additionally, in spatial distribution
terms, the marketing boards were more concentrated along the Livingstone -
Copperbelt trough than in any other area. The spatial concentration of these
agricultural support institutions tended to concentrate agricultural activities in the same
area.
The facts about the Colonial Agricultural policy, brought out here, seem to suggest that
the policy combined government intervention and free markets, particularly with regard
to the co-operatives that were controlled by the settler community. This period should
also be viewed as the period when the foundation of commercial agriculture in Zambia
was established, in terms of crops grown and cropping systems, road networks,
institutional support infrastructure and general agricultural knowledge among the
farmers.

12
With the coming of Independence, the UNIP (United National Independence Party)
government decided to follow a path of "centralised planning" (GRZ 1979:1).
According to this policy, particularly after 1973 after Zambia was declared a one party
humanist state, the government became a central player in all sectors of the economy,
including agriculture. The policy of centralised planning adopted by the UNIP
government at independence had, as is shown later, far reaching effects on the spatial
patterns of peasant farming in the country for a long time.
At independence in 1964 the Gr~in Marketing Board (GMB) and Agricultural Rural
Marketing Board (ARMS) were formed to take over from the Federal Board (Shawa and
Johnson 1990). The GMB operated along the railway line from Livingstone to the
Copperbelt, while the ARMS was given the task of dealing with the rural areas
neglected by the Federal Board. It was the ARMS that was tasked to incorporate the
rural peasantry into the cash economy. The GMB and ARMB dealt in maize,
groundnuts, sorghum, soya beans, cotton, tobacco, fruits and vegetables. In addition
to these two boards two provincial unions in Southern Province (Southern Province
Marketing Union (SPCMU) and Eastern Province (the Eastern Co-operative Union
(ECU)) operated. For cash credit, the government established the Land Bank, the
forerunner of the Credit Organisation of Zambia (COZ) (Mwanakasale 1996). In later in
years, the Land Bank was dissolved and its place was taken over by the Credit
Organisation of Zambia (COZ), which, too, was later dissolved to give way to the
Agricultural Finance Company (AFC).
Shawa and Johnson (1990) argue that due to a duplication of functions, large size of
operation areas, too many heavy responsibilities, poor government pricing policies,
constant government interference and a critical shortage of qualified manpower, the
two marketing boards failed to operate effectively and efficiently. Owing to their poor
performance the ARMS and GMB were dissolved and the government formed the
National Agricultural Marketing Board (NAMBOARD) in 1969 under an Act of
Parliament (Shawa and Johnson 1990:372).
NAMBOARD was given a nation-wide monopoly in agriculture. In Southern and
Eastern Provinces respectively, it competed against the two Unions- SPCMU and ECU.

13
NAMBOARD established a field network of " ... more than one thousand market points ...
relying on a structure of fifty-two major depots" (Shawa and Johnson 1990:373). In
addition this huge infrastructure was controlled from " ... a head office in Lusaka,
operating through nine provincial and forty-three managers" (Shawa and Johnson
1990:373). NAMBOARD's depot network in the sampled wards of Chibombo is shown
in figure 13.
Shawa and Johnson (1990), Mwanza (1992a and b), Mwanakasale (1996) and Klepper
(1979) argue that by 1969 operational problems of NAMBOARD and other agricultural
institutions (involving their inability to efficiently and effectively handle farming
problems, repay government loans, be financially self sustaining and diversify
agriculture) had become very apparent. So, there emerged a strong feeling in
government circles to restructure the institutions by streamlining their operations.
Klepper argues strongly that the inability to service government loans largely emanated
from their culture of " ... treating the money as income rather than investment funds ... "
(Klepper 1979:141).
Table 2. AMOUNTS OF CREDIT APPROVED BY LIMA BANK AND ZCF FINANCE
SERVICES- 1983/84 TO 1988/89 (Zambian Kin thousands)
FARMING SEASON LIMA BANK ZCF FINANCE SERVICES
1983/84 45,585 4,180
1984/85 55,903 6,001
1985/86 48,005 6,026
1986/87 79,322 60,000
1987/88 86,022 80,139
1988/89 214,204 107,933
SOURCE: Chabala and Sakufiwa 1993:37

14
Chabala and Sakufiwa (1993}, and Mwanza (1992a and b) have argued that the
shortage of qualified manpower in these institutions made them operate as social
equity institutions tailored towards government political goals rather than businesses
with a profit motive. Table 2 shows credit disbursements from two credit organisations
between 1984 and 1989. At this time, it must be borne in mind, that these amounts
were big sums of money. Similarly, like Chabala and Sakufiwa (1993:37) have pointed
out, credit lending at this time suffered very high non-recoveries some of which were as
high as 60% or more at times.
Further Klepper states that the government, on its part, "failed to organise and train
cadres to work in rural areas and bring to the peasantry ideological training as a
complement to putting fertilisers, tractors, and ploughs in their hands" (Klepper
1979:141). Such a failure, on the part of the government, created a very serious gap of
understanding. particularly on the part of the farmers concerning the purpose of loans,
and interpretation of government agricultural policies. Many, as became common in
later years, took loans to be cash gifts from government rather than money they
needed to repay.
This culture of not paying back loans affected, directly, both government and
agricultural institutions' coffers. Government subsidies to agriculture kept on
increasing. In 1979, for example, " ... the total subsidy to agriculture, most of which went
to NAMBOARD, exceeded K100 million and was about 19% of total recurrent
government spending" (Mwanza 1992b:131). These subsidies included meeting the
cost of inputs like chemical fertilisers, seed, and funding the credit institutions that gave
the small-scale farmers agricultural loans. Table 3 clearly shows the amount of
government subsidies, especially for maize, for the period 1980 to 1990.

15
Table 3. MAIZE RELATED SUBSIDIES IN RELATION TO GOVERNMENT BUDGET
(RECURRENT AND CAPITAL) AND BUDGET DEFICIT 1980 TO 1990
YEAR I GOVT BUDGET BUDGET MAIZE I SUBSIDIES AS I (K'M) DEFICIT (K'M) SUBSIDIES %OF BUDGET
I (K'M) I I 1980 1,657.6 160.3 154.0 9.3
1981 1,388.6 155.7 87.1 6.3
1982 1,643.2 658.1 138.0 8.4
1983 1,475.9 8.6 124.7 n A 0.~
1984 1,484.6 284.8 81.6 5.5
1985 2,184.3 280.4 134.0 6.1
1986 5,383.6 1,025.7 565.0 10.5
1987 5,837.5 2,146.8 638.4 10.9
1988 8,359.3 1,531.2 1,413.0 16.9
1989 9,838.0 3,699.0 1,585.6 16.1
1990 24,503.3 2,801.4 3,363.9 13.7
K'M = Zambian Kwacha in millions.
SOURCE: Chabala and Sakufiwa 1993:46
NB: No explanation is given to explain why the 1983 budget deficit figure of 8.6 came
about.
According to the Second National Development Plan (SNDP 1972 -76), in order to
achieve the government's aim of diversifying agriculture to make it the mainstay of the
economy, the government decided to pursue the policy of centralised planning more
vigorously. Prior to the oil crisis of 197 4 and the fall of copper prices on the world
market at this same time, according to Klepper (1979), Mwanza (1992a and b) and
Mwanakasale (1996) the Zambian Government was able to continue subsidising
agriculture due to the high incomes it earned from the export of copper. Mwanza
(1992a and b), Klepper (1979) and Chabala and Sakufiwa (1993) have argued that
16
high income earnings from copper at this time made the government fail to see the
need to take practical steps towards cutting down on agricultural subsidies and making
the lending institutions financially self sustaining.
From the Second National Development Plan (1972- 76), Third National Development
Plan (1979- 83), and Mwanza (1992a and b), one concludes that between 1969 and
1991 Zambian agriculture was run by monopoly institutions. These include the National
Agricultural Marketing Board (NAMBOARD) - formerly the Grain Marketing Board;
Tobacco Board of Zambia (TBZ); Lint Company of Zambia (LINTCO); Zambia Seed
Company (ZAMSEED); Nitrogen Chemicals of Zambia (NCZ); Agricultural Finance
Company (AFC) that later changed to Lima Bank, Credit Union and Savings
Association (CUSA); Zambia Co-operative Federation (ZCF formerly numerous co
operatives owned mainly by settler farmers); Provincial and District co-operatives;
Extension Services, and a network of training institutions. Additionally, the government
of the Republic of Zambia built roads that enabled these institutions to reach the rural
farmer even in remote places. Based on the evidence from the field, these roads were
regularly maintained by the government for most parts of the year, particularly during
the dry season just before crop haulage, to make them passable.
Unlike the Grain Marketing Board and individual co-operatives of the colonial period,
that confined their operations to the areas along the major roads and the Livingstone to
the Copperbelt line of rail, the new agricultural support infrastructure was spatially well
spread. This is evidenced by figure 13, which shows the spatial distribution of the
agricultural support infrastructure in Chibombo District before 1991.
According to Mwanza (1992a and b) and Gerrard et al (1994) each of the institutions
(NAMBOARD, ZCF, ZAMSEED, LINTCO, AFC, CUSA, TBZ and NCZ) was tasked to
carry out a specific function to promote agricultural development in accordance with the
centralised policy of management. These were that NAMBOARD, Provincial and
District Co-operatives, and the Zambia Co-operative Federation (Agriculture Business)
were to supply inputs, buy produce and supply storage facilities at selected places in
the farming community at government cost. ZAMSEED developed and supplied hybrid

17
seed for maize and other crops through those institutions with a field network (i.e.
through NAMBOARD, ZCF, NCZ and CUSA).
African Farming Equipment (AFC) had a duty of making and supplying farming
equipment like ploughs, hoes, harrows, and others. These were bought on cash
directly by the farmers through various retail outlets or obtained on loan through
NAMBOARD, the Co-operatives or other farming institutions. African Farming
Equipment had no field network.
Nitrogen Chemicals of Zambia manufactured and supplied chemical fertilisers directly
through its own urban outlets or through NAMBOARD and the other institutions that had
an extensive field network. Like for the other farming resources this was done mainly
on credit.
Lima Bank was given the mandate of giving out government sponsored cash loans to
the farming community. Although it did not have a field network of offices, but only
relied on its urban outlets, it was popular among the small-scale farmers largely
because of the product it dealt in. Owing to the nature of the farming resource Lima
Bank specialised in, farmers of all categories covered distances of various lengths to
reach the Lima Bank offices wherever they were (District Agricultural Co-ordinator -
verbal interview, 1997).
CUSA, like the Lima Bank, specialised in supplying farmers with cash credit. But,
unlike Lima Bank that supplied cash credit to any applicant they approved, evidence
from the field, and Mwanakasale (1996) indicate that CUSA's loans were only accessed
by some of its own members. Non-members were required to apply for membership
before they were given any loans. To be a member one had to pay subscription fees
determined by the CUSA Board. Anyone who did not follow the rules of CUSA was
automatically deregistered. This foundation of operation made CUSA, unlike the
institutions that depended on annual government funding, more financially sound and
economically sustainable.
Zambia Co-operative Federation Finance Services (ZCF Finance Services) provided
cash credit, like Lima Bank and CUSA, to farmers, especially the small-scale farmers.

18
The source of the annual funds to lend out to farmers, like the case for Lima Bank, was
government. This made ZCF Finance Services financially unsustainable and
dependent on government. The situation was made worse by perpetual poor annual
loan recoveries from the farming community that was not held accountable for their
actions.
The Department of Agriculture, through its extensive network of Extension Offices in
the field (see figures 3- Agricultural Camps), provided farmers with extension advice
on farming management, particula~y with regard to crop production. This network of
extension offices made it very easy and cheap for the farming community to obtain
advice from government at no cost at all. To-date, the spatial distribution of this
network, as figure 4 shows, has remained the same.
LINTCO was specialised in promoting cotton growing. It supplied farmers with free
extension service, loaned them with seed and cotton equipment like cotton sprayers,
and provided a closely supervised field network of depots (figure 13). Additionally, this
company, unlike other government run establishments, had more autonomy and was
allowed to have some small private investment. According to Lombard and Tweedie
(1972) and Mwanza (1992a and b) this autonomy LINTCO was given allowed it to
respond favourably to the needs of the farming community and hence enabling cotton
to be a success story in the history of Zambian agriculture. Although it occasionally
suffered bad debts on loans from the farming community, its annual losses were much
less and therefore more manageable than those were for NAMBOARD and the co
operative movement (Lombard and Tweedie 1972, Mwanza 1992a and b).
During this same period the government managed to establish and maintain main roads
and feeder roads in the rural areas (figure 11 ). These roads, as explained later, seem
to have encouraged crop production to be high at the time, as long as there were no
other intervening variables such as droughts. Also, the wide spread of maintained
roads, according to field data collected during the current study, enabled farming
development to take place spatially more evenly. This network of roads was
established mainly during the First National Development Plan (GRZ 1979:1 ). The
FNDP put emphasis on, among others, on the development of communication

I
19
infrastructure in the farming community. According to the FNDP (1966 - 70), SNDP
(1972- 76), TNDP (1979- 83) and the GRZ Economic Review report of 1984, this was
done in order to open up areas previously neglected by the colonial government to
economic development and help reduce the rural-urban drift that followed political
independence.
Using evidence obtained from the field work of the current study, it appears that the
wide spread of support infrastructure in the farming community, the guaranteed
availability of farming resources, and a maintained network of roads, encouraged the
small-scale farmer to locate even in areas that were previously viewed as
disadvantaged (figure 1 0) and be able to produce more. According to Shawa and
Johnson (1990), this was made possible by the government policy of maintaining
uniform prices of agricultural produce across space, establishing and maintaining of
passable roa~s, establishment of social amenities like schools, clinics, shops and
others in the farming community.
Table 4. CROP PRODUCTION ESTIMATES- CHIBOMBO DISTRICT
I 1988/89
1989/90
1990/91
MAIZE
(90 kg)
b ags
15,500
98,200
850,000
COTTON SUN/FLOWER
I (Kilograms) I (SO kg)
baas
I I -
- 2,200
177,000 10,300 I
2.2 Million 5,700
I SOYA
I BEANS
11""0 I ) I ~0 Kg bags
-
-
2,500
GROUNONUTS
(90 kg)
I b~ns -:::
750
883
2,200
SOURCE: Department of Agriculture- Chibombo District (on file)- 1997
SORGHUM
I (80 kg)
"'a'"'" I u ~~
300
222
400
NB: According to the information on file at the Department of Agriculture, 1990/91 year
had favourable weather conditions and hence farmers produced more particularly
cotton. This seems to agree with the statistics for all crops.
I

20
Such a deliberate agricultural policy of encouraging production and paying a uniform
price, on the part of the government, helped farmers, particularly those in remote areas
engage in active production. In a sense this policy seems to encourage farmers to
produce more. This is made clear by the only available statistics of Chibombo prior to
1991 in table 4.
From the above statistics it is clear that crop production, particularly maize which was
the focused food crop by government policies, and cotton were doing well due to the
support infrastructure that existed in the farming communities at this time. Production
of maize and cotton was particularly good in the farming seasons 1988/89 to 1990/91
when Zambia either had no imports or managed to export excess crop and experienced
good rainfall. This is shown in table 6. The statistics in table 5 are inclusive of maize
produced and marketed by both commercial and small-scale farmers countrywide.
Table 5. MAIZE IMPORTS AND EXPORTS 1982/83 TO 1991/92 (thousands of 90kg
bags)
YEAR IMPORTS (000) EXPORTS (000)
1982/83 1,240 I -1983/84 1,100 -1984/85 1,060 -1985/86 1,080 -1986/87 160 -
1987/88 710 -
1988/89 - -1989/90 - 2,000
1990/91 - -1991/92 6,900 -
SOURCE: Chabala and Sakufiwa 1993:6
NB: 1991192 farming season had low rainfall and farming inputs were delivered late to
the farmers, and hence the food imports.

21
It is crucial, however, to realise that over 60 percent of marketed maize in Zambia came
from the small-scale farmers (GRZ 1994a). Additionally, maize exports at this time
were mainly conducted by government parastatals, such as NAMBOARD.
The biased government agricultural policy towards maize, without surprise, had a
negative impact on the production of other crops in the country. Since crops like
sorghum, sunflower, millet, groundnuts and cassava lacked good prices and an
effective in-field infrastructure to support them, they failed to fare as well as maize in
terms of production figures. Farmers, even in ecological zones where these crops were
most appropriate, grew maize while considering other crops as second rate. Table 6
reveals low production for some of these crops.
Table 6. MAR!<ETED CROPS PURCHASES IN THOUSANDS, 1989/90 TO 1991/92
I YEAR I SUNFLOWER I SORGHUM I MILLET
I I thousands of 50 kg Thousands of 90 kg I thousands of 90 kg
bags bags bags
1989/90 148 4 4
1990/91 176 2 2
1991/92 136 1 1
SOURCE: Chabala and Sakufiwa 1993:6
The information contained in table 6 indicates clearly how depressive the agricultural
policy of this government was on other crops in the country. This negative impact of
maize dominance over other crops is also revealed in table 6 above showing estimates
of crop production for Chibombo District. Similarly, it should be pointed out that in as
much as the policy overtly discouraged the growth of other crops, it made the farmers
very dependent on maize and hence promoting food insecurity in households. Farmers
failed to have enough food for themselves and the country whenever maize, for any
reason, failed in any year.

22
Also, household food security was undermined by the subsidised low prices of mealie
meal on the market. Owing to the subsidised mealie meal, many small-scale farmers
sold all their maize produce at harvest expecting to purchase cheap maize meal later
(Chabala and Sakufiwa 1993). This induced attitude of farmers to sell their produce,
not only weakened the farmers' resolve to retain enough food reserves on their farms
for the whole year, but also made them fail to develop appropriate on-farm all-weather
storage facilities. The inability to have effective on-farm storage facilities by the
farmers, and the maintenance of uniform prices throughout the year and in all places in
the country by the government regardless of distance from the market, destroyed the
farmers' initiative to improve the technology of on-farm crop storage and timing of
market opportunities that could have made agriculture a self sustaining and robust
industry. To this day, the problems of food insecurity and inability to hold back the crop
to await market opportunities among farmers arising from lack of effective on-farm crop
storage, according to field data of the current study, have not been resolved.
Agricultural development, as such, suffered in that its success or failure was viewed
only in terms of maize production progress. It is for this reason, perhaps, why Mwanza
(1992b) has pointed out that the problems of agricultural development in Zambia are
due, partly, to having maize as the sole dominant crop. This seems to have also
contributed to making the government fail to discover the potential of other crops
particularly in ecological areas where they are suitable as opposed to maize. In short,
the maize culture seems to have inhibited the overall growth of agriculture in Zambia for
a long time.
Owing to the increase in agricultural subsidies that the government could not sustain,
the inefficient operations of many agricultural support institutions such as NAMBOARD
and the Co-operative movement, and overall poor performance of the Zambian
economy in the late 1970s and 1980s, the government resolved to restructure the
whole agricultural sector putting emphasis on decentralisation and co-operatives. This
restructuring, according to Mwanza (1992a and b), Shawa and Johnson (1993),
Chabala and Sakufiwa (1993) led the government to progressively reduce the functions
of NAMBOARD and then to dissolve it on June 30, 1989 (Chabala and Sakufiwa
1993:41). NAMBOARO's functions were transferred to the Zambia Co-operative

23
Federation and Nitrogen Chemicals of Zambia. This meant that the void left by
NAMBOARD in the farming community, like Chibombo, was completely taken over by
the Co-operative movement and CUSA. The dissolution of NAMBOARD in 1989 by the
government was done on the assumption that the Co-operative movement had
sufficient capacity, in terms of manpower, crop handling resources, and spatial
infrastructure, to service the farming community effectively.
At this point, it has to be emphasised that the dissolution of NAMBOARD was done with
a view to bringing about efficiency in the operations of the agricultural sector, reduce
subsidies, improve loan recoveries and the delivery of inputs to the farmers, and
accelerate crop diversification (Mwanza 1992b, Chabala and Sakufiwa 1993).
Reduction of subsidies meant increasing the cost of inputs and hence raising the price
of produce, particularly the staple food maize.
According to Mwanza (1992a and b), the government's fear to cause urban population
discontent, especially after the food riots of 1986 and 1990 caused by the same factor,
made agricultural restructuring slow or just a complete failure. At best, one would say
that the 'to and from' agricultural policy of the Zambian government between 1980 and
1990 was very confused. The government was in deep confusion about how to
progress with economic restructuring while maintaining its hold on political power
through the provision of cheap food. Like Chabala and Sakufiwa (1993), and Mwanza
(1992a and b) have pointed out that this impasse was finally resolved by the 1990 coup
attempt that brought about a change from the one party political system of the United
National Independence Party (UNIP) that pursued a commandist economy, to the multi
party political system of the Movement for Multi-Party Democracy Party (MMD).
The MMD government, on coming to power in 1991, unlike UNIP, elected to vigorously
pursue economic liberalisation at all costs. Like in other sectors of the economy, the
introduction of the liberalisation policy in agriculture meant a departure from the pre-
1991 policies of "centralised planning in which farmers were sustained (among others)
through government subsidies and interventions" (GRZ 1992:2). In the new policy of
liberalisation the government withdrew " ... from direct involvement in agricultural
marketing and input supply by freeing prices, removing subsidies, privatising

24
parastatals ... and making public storage facilities available to the private sector" (GRZ
1992:12). This new policy, as will be explained later, proved to have far-reaching
effects on the agricultural sector in the years ahead.
The following statement better explains the state of the agricultural industry in 1991 :"
the MMD Government inherited a poorly developed, inefficient, non-sustainable
agriculture base which was characterised by inconsistent policies, heavy subsidies and
heavy government interference and involvement in actual agricultural production
leading to poor growth and performance of the agricultural sector" (MMD 1996:7).
In order to improve the state of the agricultural industry, the government adopted the
policy that it would "... not directly compete with the private sector in the areas of input
supply, production, marketing, transportation, storage, processing or retailing.
However, government will both support and regulate the private sector in these
activities" (GRZ 1992: 8). This policy, therefore, set the tone for a liberalised
environment in the sector. And, in order to deal with the problems of agriculture, the
new government set out the following objectives:
1 Continue with the policy of liberalising agriculture by enhancing the role of the private sectors ....
2 Encourage, assist and strengthen the development of an efficient private sector-driven crop marketing and input distribution system.
3 Recapitalise the agriculture sector by ensuring that there is sufficient medium and long-term development financing and provision of development grant aid ....
4 Found an investment Fund to assist small-scale farmers. 5 Encourage crop diversification and ensure that agricultural production takes
cognisance of agro-ecological variations and market situations. 6 Promote sustainable systems of agriculture through encouragement of good
land use practices and utilisation of organic crop fertilisation methods like green manuring, inter-cropping and crop rotation.
7 Improve crop production and yields through strengthened research and extension and provision of agriculture related information. (MMD 1996:8).
It is, therefore, on the basis of the above agricultural liberalisation policy and goals that
this research was founded. What comes ahead is a comprehensive account of the
results of the field research carried out in Chibombo District in Central Zambia. The
results herein will attempt to show the spatial impact of the agricultural policies of the
MMD government on the institutional support network, crop production figures and the

25
road infrastructure in Chibombo District. To do this, findings have been placed in
tables, graphs and maps. Maps have been used to reveal the spatial changes that
have taken place since 1991. To enable the reader to see the spatial impact of the new
agricultural policies on small-scale farming, a deliberate comparative approach has
been adopted for two time periods, namely the 1980s and 1990s.
According to Gulhati (1992), Mwanza (1992a and b), Gerrard et al (1994) and World
Bank (1994) the economic reforms taking place in Zambia are not unique to this country
alone. There are many countries in Africa, and other parts of the world, undertaking
similar reforms and for the same reasons of economic revival. In the region Kenya,
Tanzania, Malawi and Zimbabwe are some of the countries undertaking economic
reforms along the same lines as Zambia. Specifically, Mwanza (1992a and b), Gerrard
et al (1994) and World Bank (1994) have pointed out that the only differences found in
the reforms taking place in these countries with similar economic histories, is the rate
and sequencing of reforms. Zambia is seen as a country whose reforms have been
implemented at a high pace, in a short period of time and involving all sectors of the
economy. The other reforming countries are viewed as slow, more cautious and are
reforming specific sections of the economy one at a time. This category of countries,
such as Zimbabwe, is viewed as hesitant reformers particularly in agriculture where
state monopoly has been maintained.
1.3 MOTIVATION OF THE STUDY
From the literature cited in the introduction, it is clear that the agricultural policies
pursued between the time of political independence and the coming to power of the
MMD, might have been less than successful, but have had a marked effect on both the
economics and the spatiality of peasant farming in Zambia. The radically different
liberalised economic policies introduced in 1991 were meant to have an impact in all
economic spheres, including that of agriculture. As these policies have now been in
place for more than five years it can reasonably be assumed that they have had a
marked effect on the economy, commercial agriculture and small-scale farming, and it
is now incumbent on scholars of various disciplines - including Geography - to study
their impact.
26
Some researchers, namely Mwanza (1992a and b), Sakamoto (1993), World Bank
(1994, 1996), and Holden and Rajapatirana (1995), have studied the policies and their
impact from an economic viewpoint. Several views have been expressed about how
economic liberalisation has impacted on the way of life in Zambia (namely [Mwanza
1992, Chabala and Sakufiwa 1993; Gerrard et al 1994, Javaheri et al 1996, and Kokwe
1997]). Others, namely Mwanza 1992b, Chabala and Sakufiwa 1993, Gerrard et al
1994, World Bank 1994; Javaheri et al 1996, Kokwe 1997, have written about the
impact of these policies on agriculture. The impact of the economic liberalisation on the
spatial patterns of peasant farming, however, has not been investigated to a notable
degree except for the investigation by Kokwe (1997) who has discussed maize,
markets and livelihoods [sic] of Luapula Province of Zambia from a co-operative
perspective. Mwanza (1992a and b)- though mainly an economic analyst, has covered
agriculture but to a limited degree and only covering the era before 1992 - and,
Chabala and Sakufiwa (1993) - covered mainly maize production and its associated
inputs, storage, marketing, and institutional support, but also only up to 1993. The
study being reported on here, attempts to fill the gap others have left uncovered. Such
spatial changes, or lack of it, could serve as a valuable yardstick to measure the
success - or failure - of the economic liberalisation policies.
The need for such geographical knowledge has become even more necessary now that
the economic policies of a number of African countries, particularly those in the Sub
Saharan region, are changing quite rapidly (Gerrard et al 1994, World Bank 1994,
Kokwe 1997). As is the case in Zambia, the implementation of new economic policies
is done with minimal or no regard to their spatial impact. The driving force for the
restructuring of economic policy is either political or pragmatic (such as the need for
sufficient food supplies), while environmental concerns are of little importance (World
Bank 1994 and 1996). To those in political office, what matters is 'that there is food on
the plate', and not 'how the food gets to the plate'.
Government policies on agriculture, even when endeavouring to increase food
production in the country, are often formulated and implemented with scant regard to
the spatial infrastructure necessary to sustain the agricultural support institutions,
27
roads, information, markets, resource supply and other aspects vital to sustainable
growth in agriculture, is often overlooked (Kokwe 1997). In this study, an attempt is
made to investigate the interrelatedness of the spatial infrastructure for agriculture in
Central Zambia and economic and agricultural policy reforms introduced in 1991. This
study was also necessitated by the need to document information on the current state
of peasant farming in Central Zambia, and specifically Chibombo District. It was felt
that it was worth recording the impacts that the recent economic developments have
had on the spatial patterns of small-scale farming in this region of the cotJntry.
Finally, it was felt that the knowledge contributed by this study will not only help
geographers keep abreast with spatial changes in Central Zambia, but could provide
recommendations on how to improve food security among smallholder farmers at
household, district, regional and perhaps national level. This is significant considering
that in a country like Zambia, this category of farmers produce the bulk of the nation's
food (GRZ 1992, CSO [Central Statistical Office] 1994). Any economic policy that is
implemented should continuously be evaluated with regard to its impact on these
farmers who have the disadvantage of having a weak resource base.

28
CHAPTER2
DESCRIPTION OF THE STUDY
2.1 INTRODUCTION
Chapter 2 gives a detailed outline of the current study. This chapter offers, among
other things, a description of the research problem; formulation of the research
hypotheses; choice of the study area (Chibombo) and definition of the key terms.
2.2 THE RESEARCH PROBLEM
This study proposes to investigate the impact of economic liberalisation on the spatial
patterns of peasant crop farming in Chibombo District since 1991. The basic questions
asked about the research topic include the following: to what extent has economic
liberalisation affected the spatial patterns of peasant crop farming in Chibombo
District?; have the spatial patterns changed?; has crop production changed?; has the
communication infrastructure and agricultural support institutions in the farming areas
changed?; if so, how and in which way has the change affected crop production?
A specific aim of the study is to establish the actual impact the new agricultural policy of
liberalisation has brought about on the pre-1991 agricultural support network of input
supply and buyers of produce, suppliers of agricultural resources, and extension
services. In this sense, the study aims at providing answers to such questions as
follows: has the new agricultural policy of liberalisation affected the pre-1991
agricultural support network of input supply and buyers of produce, suppliers of
agricultural resources and extension services?; has the impact of liberalisation policy on
the agricultural support network in turn affected crop production and cropping
patterns?; in which way has the new agricultural policy affected the communication
infrastructure, and in turn, what has been the impact of the change in the
communication infrastructure on crop production in Chibombo District? These are the
questions that are embodied in the research hypotheses.

29
In evaluating the extent of the impact of economic liberalisation, the study has chosen
to compare the spatial patterns of peasant farming during the period of centralised
planning in the 1980s and the years of economic liberalisation in the 1990s. For the
1980s, the study has covered the 1983/84 to 1989/90 farming seasons. For the 1990s,
the study has focused on the 1990/91 to 1996/97 farming seasons. Each block of time
consists of seven farming seasons. In certain instances, however, in order to offer a
clearer picture of the effects of centralised planning policies, on one hand, and those of
liberalisation, on the other, farming seasons of pre-1983/84 and post-1996/97 have
been referred to.
2.3 THE RESEARCH HYPOTHESES
This study is based on the general hypothesis that there is a marked difference
between the ~patial patterns of peasant crop farming in Chibombo District in the 1990s
and those of the 1980s. Since this impact will manifest itself in the spatial patterns of
crops grown, crop production, land-use, agricultural support structures and
communication networks, it will be investigated by means of the three sub-hypotheses
below.
1. The spatial pattern of crop production and cropping systems of peasant farmers in
the 1990s differs markedly from the pattern that existed in the 1980s.
2. The spatial pattern of the agricultural support system in the 1990s differs markedly
from the pattern that existed in the 1980s.
3. The spatial pattern of communication infrastructure in the 1990s differs markedly
from the pattern that existed in the 1980s.
30
2.4 DEFINITION OF KEY TERMS
The key terms used in the study are as follows:
IMPACT
The word 'impact' is used in this dissertation to refer to the resultant effect or aftermath
of a new idea on an existing spatial pattern or structure. In this study, this impact is
assessed in terms of the changes in crop production, cropping patterns, agricultural
support systems and communication infrastructure in Chibombo District.
ECONOMIC LIBERA LISA TION
'Economic liberalisation' policy is used in the dissertation to refer to a set of economic
ideas that allow individuals and other stakeholders in a country to operate freely, in
accordance with the laws of demand and supply, with minimal government interference.
Here, the freedom being discussed is that one which individuals and institutions have in
agriculture as per government regulations. This freedom deals with the latitude people
and institutions have in deciding what crops to grow, when to grow them, how to grow
them, sources of inputs, markets, and the prices of their produce. It also covers the
liberty people and institutions have to decide on when and where to sell their produce
given the prevailing market opportunities.
AGRICULTURAL POLICY
'Agricultural policy' is being used in this dissertation to refer to the institutional
arrangements made and implemented by the Zambian government to regulate the
development of farming at any given moment in time. These institutional arrangements
help farmers and all stakeholders in agriculture perform their day-to-day functions as
per expectations of the government. Such arrangements influence directly or indirectly
the actual development of institutions that support agriculture. Thus, it covers the
provision of farming resources such as loans, type of crops farmers prefer to grow at a
31
particular time in history, prices of produce, the development and maintenance of roads
and other marketing infrastructure in the farming communities. In short, the agricultural
policy controls the farming environment existing in the country at any given time.
COMMAND ECONOMY
'Command economy' is used here to refer to the Zambian economy of centralised
planning which existed prior to 1991. This economic set-up entailed that government
made economic rules and was a direct participant in the economy. In agriculture, this
term has been used to cover government's direct control of the farming environment
through the agricultural policy of the time, use of parastatals to supply farming
resources, provision of extension services and government's direct involvement in
farming activities through state farms. Here, this term is occasionally interchanged with
controlled ec_onomy, socialist economy, planned economy and centralised economy.
FREE MARKET ECONOMY
In this dissertation, 'free market economy' is used for an economic environment in
which government only formulates laws and doesn't directly take part in running
economic affairs, thus leaving these to private individuals and institutions. As regards
agriculture in Zambia, this term is used to refer to the post-1991 agricultural policy that
allows farmers to buy inputs from any source and sell their produce to a market of their
choice and at a price they determine as per market opportunities prevailing at a given
moment in time. This term refers to the economic environment that allows the
establishment of private agricultural support institutions and the government's withdraw
of direct support to the existing institutions so that they are self-sustaining. In this
dissertation, this term is interchanged with liberalised market, capitalist economy and
non-controlled economy.
SPATIAL PATIERNS
'Spatial patterns' refer to the distribution arrangements of the agricultural support
systems or any arrangement of phenomena across space in Chibombo District.

32
Specifically, this term is used here to denote the distribution of agricultural farming
systems (such as the institutions that provide inputs, extension services and buy
produce), farm families, differences in crop production in given wards, etc.
PEASANT CROP FARMING
'Peasant crop farming' is used here to refer to a farming system that is less mechanised
and uses less sophisticated farming tools such as hoes, axes, oxen, hand sprayer,
uses mainly family labour to produce relatively small quantities for sale. Additionally,
when compared to large-scale commercial farming, peasant crop farming depends on
small plots of land that may or may not entitle the owner to have a leasehold title deed.
The majority of the peasant farmers in Chibombo District are found on communal land,
only a few hold leasehold title to their land. This farming system covers the majority of
farmers in Central Zambia outside typical traditional farming (subsistence farming) in
which production is only for family consumption, and large-scale commercial farming
that is highly mechanised and produces large quantities for the market. In many
instances, this term is interchanged with smailholder farming, small-scale farming and
peasant farming.
PEASANT FARMER
A 'peasant farmer' is one who grows a variety of crops on a small plot of land, keeps
animals on a relatively small scale and uses less scientific farming methods.
Throughout the dissertation, the term is used to indicate the type of farmers that sell
small quantities of crops to the market. These farmers are also referred to as
smallholder farmers and small-scale farmers. Although the peasant farmers produce
only small quantities for sale they are active participants in a cash economy.
CROP PRODUCTION FIGURES
'Crop production figures' refer to the number of bags a peasant farmer or groups of
peasant farmers in the sampled farming wards of Chibombo District are able to produce
in a particular farming season. This term covers the total number of bags or kilograms

33
of various crops produced by the sampled farmers in wards or the annual crop
estimates for Chibombo District in particular farming seasons. In this dissertation,
individual farm production is divided into three categories: less than 30 bags is
regarded as low production, between 30 and 50 bags is regarded as a medium
production and more than 50 bags as high production. These three categories were
arrived at after consulting farmers on their perception of levels of production.
COMMUNICATION INFRASTRUCTURE
'Communication infrastructure' is used here to cover all roads and railways found in
Chibombo District. The Chibombo communication infrastructure includes the old
railway, main Great North road, the 'regularly' maintained roads and the feeder roads
that enter the interior of the rural areas. Further, the roads in the wards have been
described either as passable, impassable, or bad depending on their state to permit
their effective use in the delivery of farming inputs and purchase of farm produce, or
the ease with which farmers are able to move from place to place.
FARMING RESOURCES
'Farming resources' cover all the essentials a smallholder farmer uses or needs for his
farming activities. These resources include, inter alia, cash, manure, seed, farming
equipment, animals, information and water. The resources most emphasised in the
dissertation are those commonly needed and/or used by the peasant farmers of
Chibombo District.
FARMING WARD
'Farming ward' is a term that is used in the dissertation to refer to an official
administrative division, section or segment of the district. Chibombo District has 18
Wards (figure 4). Each of these wards comprises a certain number of farm families.
For this research, these divisions, which are also used for political activities such as
elections, were adopted as the most convenient unit for study. Of the 18 Wards, this
study sampled five- Chaloshi, Chibombo, Chikobo, Keembe and Liteta (figure 4).

34
FARM FAMILY
In this dissertation, the term 'farm family' is used to refer to the whole family of a farmer,
that is, the entire farming household of one adult man or woman whose major livelihood
is farming. In this dissertation this term considers all people making up a household as
equal partners in farming - they are all farmers like the head of the family.
AGRICULTURAL SUPPORT SYSTEM
The dissertation uses 'agricultural support system' to cover all institutions and
structures that help the small-scale farmer carry out his/her farming activities easily and
effectively. These institutions include those that supply inputs, information, provide
storage faciHties, buy farm produce, and provide extension services to the peasant
farmer in Chibombo District. In this study this term is interch<;mged with agricultural
support network, agricultural support institutions and agricultural support infrastructure.
Examples of such systems include input suppliers such as NAMBOARD, LINTCO,
LONRHO, CUSA, Lima Bank, Mbayimbayi and Sons, Department of Agriculture and
Cotmark.
CHIBOMBO DISTRICT
Chibombo District refers to a district or spatial unit in Central Zambia (figure 2). In the
literature review above, this district (Chibombo) has been discussed as a component
part of Kabwe Rural District or Bulenje area in the information covering the period
before 1990, when it was made a district on its own. Muntemba (1977a), especially,
has used the term Bulenje to refer to Chibombo because the majority of the indigenous
people living in the district are called Lenje or Balenje.
CENTRAL ZAMBIA
'Central Zambia' (figure 2) refers to the region located in the central part of the country.
This region is located on the Zambian plateau that stretches from the south to the

35
north. In some instances in the dissertation, Central Zambia is simply referred to as
Central Province or Central Region.
Unless otherwise stated, the above terms are used in the dissertation in the manner
described above. Where different meaning is intended, an attempt is made to state the
targeted meaning. This is done in order to reduce the amount or level of confusion on
the usage of the same term.
2.5 CHOICE OF THE STUDY AREA.
Firstly, Chibombo was chosen as a case study because its main economic activity is
farming, particularly smallholder farming. Smallholder farming accounts for over 80
percent of agricultural activities in the district (CSO 1994, Department of Agriculture
information on file 1996).
Secondly, it was selected as an area for investigation because the researcher resides
in this area and hence knows the area and the people well. The researcher's
knowledge of the area and the people helped, in large measure, to ease
communication during the period of the fieldwork.
Thirdly, the fact that the researcher resides in this district helped cut the cost of the
field- work thereby making the research feasible. This factor was crucial in making it
possible for the researcher to do the fieldwork and control the data collection.
2.6 DESCRIPTION OF THE STUDY AREA
2.6.1 ADMINISTRATION AND LAND HOLDING IN CENTRAL ZAMBIA
Central Zambia is one of the nine provinces of Zambia, located on the Zambian plateau
that stretches from the south to the north, 15'00"S and 28'00"E (Bwalya et al1994:56).
Like other provinces in the country, Central Province is divided into districts. The
districts are Mumbwa, Chibombo, Kabwe, Kapiri Mposhi, Serenje and Mkushi (figure 2).
Civic authorities administer each of these districts. The civic authorities are elected

I
Fig. 2. LOCATION OF CHIBOMBO DISTRICT IN ZAMBIA
4 N? 4 N; 4
............... '> .
100 200 Km ~ ~-J
;' .• ./· . N 0 R T H E R N I'\ ( ...... .... ( : '\. ~ .,) i
0
Z A I R E .::, ;..-., I
.)
/ ,....- >
·-\ ,.; < ., " ' ........ • Q:-
·.·.......... / ANGOLA :-:-:-:-·~ j 41 . . . . ."'\ r-
:-:-:-·.-:-".( )
~) COPPERBEL i · t:>:i~~:~:;7i~~\ /i 0 ! r~ .. :·.-:-:-:-:-:-:-:-.Y { • ;<" • • • • . . • • • • • • • • • ,:.1 \'"
. '\:~:--:-\.,·~··~<-.-·-· _(_:::::::: .·:::::: \.- ~:.-. ..:.: ;~./· 'v -·,·-·""'·- ___ ...... ·"-·'"' {: ·i<A.PiRiuf>osHi ·: · :·j :-: ·i.tlw:s·Hi ·: · :~.
<> . .r ·-~~ ·-·r:-: ·,-,~/:-.J'\ .•.••.• • ·, \;l~·~;.:, \ : 1>-2-A< (·.·-·.·.·.·.·.·.·.·.· .. Cf-1/BOMBO.~ ·-.r:-1' ~
. . . . . . . . . . . . ' ( /~/f-. ~ - \ . • "'--•.·•· .. ··MUMBWA'.· .· .· .. ·. /'~/C:!/ N . !. . ·. ·. ·. · ... ·. ·. · .. ' .. ."C .. y_,;~. CHONGWE
" }::>
~ WESTERN
MOZ/\MBIQUE
f""~·---·"-·.:...:..:...).· .· · ·. ·. ·"' :' \LUSAKA \J. /l. • ·-· . .,. . . • • .. '"' c:.. " l' .J \ ., •. ...... ...... ••• ··v .,,...
~ -:;· \L ....... KAFUi:"·t.~ I ~. v·~ J ...... __
~
WESTERN
LEGEND
,i / SOUTHERN International Boundary .......... ----
Provincial Boundory ........... -·-·-·-District Boundary ............................ .
'-t ZIMBABWE
(h .b o· t · t [2?~~ I ambo IS fiC ............ ~-~-~-~-~-~ r-·-~·-·-,,
Cen trot Province ............ .i..' •. ..:.:.:..:.· •. ,:_;~
SOURCE: Bwalyo eta! 1994:9.

36
council officials at the local level. These authorities implement government
programmes at this level, such as investment in agriculture and land allocation. Tribal
chiefs and headmen help the civic authorities implement government programmes at
the grassroots. The duties of the two authorities (respectively, civic leaders, the tribal
chiefs and headmen) include distribution of land holdings to the people that live in their
locality either through the statutes (title deeds) or traditional land holding (GRZ 1995).
The power of allocating land to the citizens helps the local leadership influence
population distribution in their areas.
Districts, such as Chibombo, are responsible for allocating agricultural land under their
jurisdiction. Plots of land allocated by Councils enable the holders to obtain certificates
of title. Conversely, the tribal chiefs and headmen are responsible for allocating
traditional land to their subjects, with or without certificates of title. Land wholly under
the tribal chi~fs' control is not given certificates of title. However, according to the
Lands Act (1995) land held under traditional or customary tenure can be converted to
leasehold (land held with title of ownership) with the recommendation of the headman,
chief and district to the Ministry of Lands.
While the majority of smallholder farmers in Central Zambia hold land under customary
land tenure, only a very small percentage hold theirs under leasehold (Department of
Agriculture file, 1996). The implication of holding land under customary tenure is that
the land the farmer owns cannot be used as collateral when applying for financial
loans, while those holding land under leasehold can use the land as collateral. In
Chibombo, like in other parts of Central Zambia, the act of holding land under traditional
tenure has proved a major drawback to the development of peasant agriculture
(Department of Agriculture file, 1996).
2.6.2 LOCATION AND ADMINISTRATIVE DIVISIONS OF CHIBOMBO DISTRICT
Chibombo District (figures 2 and 4), with an estimated land area of 23,000 square
kilometres and population of 147,777 (CSO 1990), is located in the Central Province of
the Republic of Zambia on latitude 14' 40" south and longitude 28' 04" east. This
District is located between Kabwe District in the north, Mumbwa in the west, Lusaka

!""''"·'\ Fig. 3. CHIBOMBO DISTRICT Before 1990 -·\ I ·-........ r·...J· """-., . . ....... \ \
/ • '\ ......, t<ABWE \ .Ct£wa • .... \ t • ........ '"""\ .... c.. -..a. ' .... I . --=-- .... • ', ~. \ \. " \ ...... ···· ...... , \ . \ '- )•" ·. '\ . I \
\ ', ·. \, \ \ .... . . . " . . . '""· ' / . . '" (. _....----•t:run~'- :f \.. ~·~· ' ..... _ ....... , •• Muswishi • . ---r- £ Jpongo ..... , .-/ -·-·-... ,..._ 1. I··.... ) • ·,
'/ ,..... I • • I I ( • Kasonkomona '· •. :':-- ·.... ( -·r-·-·-~ .... Kabanga 1 • ..... - . ' ' / , . ,. . c, . . . . ..... • / Chiyuni • '~------- . 'v·""'. ·-·J 1 eMukalashi 1 1 :' .•.. Kabwe·· · ···.···· ······ "~ :p: Chitanda ...... ...;__ .: ! ( . e I ,.-.::t . ....._ (. 1
1 :.East:', ~
I I I \
.;, '..:,. t ) Chibombo,t• • / • :.l• : : ..... , • -:..:., :' '·"'· . ,.. / • rchikonkomene ,_.sombwe (
{ \ : ',..---1 eMulabo ,/ ' ·-· -.J. \ .··· \ o• \ 0 •
;1•. \ Ch 1 : ;' 1 ··Shimbilo- •Molombe •.•• \: ·. Kasamba -.., \
.; • apu a : • :_.... .l. e Molakota. ·. • 4 .·~ \ • ( Masala .-. 0 Ngalo •• , ·.. •
v· \ · / · j ~ · Hunema \ .-/ ~ .-· 1.----~-+- ·· .. Liteta •chankumba Mwembo . •.',Ufwombul~: 0
.;.-- o\ · • · · ·/Nch \ · · ' · • ;j·".:.·.:.:;...o· Mwonkuwae, .· · ··, ••. ema ... ) Sh1mukuni • Homboshi• ' :· \ :i .• .. , ...... · •Kaluso • .... ··· 1 •• __ • ' • ,, ... \;..,.
. ."i Kalobelo e . . . ;', 1
' ._.· 1 c1abona·· .,,..... \ :·. .-······. · · ...... ' •• ·-" . . ' . I • I • -- .; •• • ••• • ....
\ .·: .. :..:.'-- • S t' h..... · • - --y Chai:Jusho : • .. ··-t·· '·
• . ~;.Y' . _. .• 0 9._C I : c:J \ "'' • 1 \ ......_._._.; . ..- Nomokolongo ............ ! -:'-4...- ' : \ .-· : 1
.. ....._. _: / ... -Ke" mb~ ; ........... '..._.§_A"'! ~~be -.-'-<'"..-:-::·· . • Moombe" 1Chamuka • '· -/ o h. e:t ____ ,_-,_. • " \
......_ ... :..::...-- Ranc : Chilikwela'·' • • .... -" Hwoch1sompola : . , I ·~ -~ Muluko,- \ • : : / •
·-..... . -~, • _....._,._ • Mus:no\ •.• :· ... :..-1 /
·-..... •Mui·umtiu ··v"' Chlmono \ • Ploughmar:s _ ---..-:".-('- ; • ''\ • CJ'\ ' • • ................... ••••••• •• J ··· ···• ·~ M t b ..... --:;:- ...... •Arms.-.-·"""',...· •l::Chisambol"···: .. Koputi .... u em a a . ..... • • •
'· :' • Kalnlo. ·~ Mopamapomo ':_ J ·. .· · · · / :\ ·.. . ; I .. . . .. . . . t 'j •Kalola : • : 1 •• • • • • • • • • • • '/
.... ;...::.:.·'············· ; .. ·· · I •Mupelekese • \
-..... - ••. .• I I Kabi le _.;; ····•· · ..... • • ·····:- 1
\.;.a.:."'(~. Chilo• ·· ·-·"'J-,. 1' o; : I "'
·\ iKobongolalo Chipeso• ~ . Chikon,kot.o' / ·~.-·-·-·-·-·-·-.. / \o. .··~:....:...:..! HuchenJe • /
• ....,. \ • • .-· ~ •• ....,..._...u..:: . .._~ungul\ .. i I •\ '\. ~ Mbosya-._ Chung a "'--..:. C.. : {I
'\ . . . ..."" .... ·\ ~ ... / "-- .... : "·- eChitatu :.... ~.t.•c'h." b. J
, ....... • ·- II\Uffi I..-"
,/ """./ ......... ~· ,. . .....,. . "'\... ......... - .... ~.\.
~-
Source: Deportment of Agriculture- Chibombo
0 10 20Km
Roods
Railway
-·-·-· District Boundary
•. ._ . ._ __ Word Boundary
............ Camp Boundary
' Agricultural Camp
• Lint Company Depot
• Veterinary Camp
c:::J Dip Tonk

r·".Ji... Fig. 4. CHIBOMBO DISTRICT After 1990 ./ ......... '-· I ........ .- ""'· . '·-. \ \. I "' .-< • ..chow a·-.. . ,..... .) / ' · \,_.... ....... _,. KA~Wf-·-..- ~ A '"
I \ f ' '.... '. ., I. I ' ... , .> .\ . . ', ~"\ J.. . ! 1 -----.. /"''""-·\ , t:"·~;_,.... "--~~ •Huswishi l , pengo ... --- •M d -... • . r } , • '· ,.......,...- un u ..._, / -·-.-·, ( . I,. " t
' / 'A ' ' I L' / . 1 Kosonkomono '::..~ '· . . ,-Kobongo.' "' ·• Chiyuni• ··~---:----, ['/'"·....... (T""'\i •Mukoloshr / 1 1 '"·\. ~ ! ,,•chrtondo - ..... _ j 1 . ·, A .-· ·-· i ~eChikonkomene J I IPONGO ./t 't'- \.-·7\JCHIBOMBO~l-. ~ /./ -·-·- . ·' 1 ,a ',,A / ' (. I ) ' · ,. \ .. ;t.A., · I ...... -._. 1 ~Bombwe · I ---"' }:-..:/Shto b"l •Molombe : \ CHAMVKA , __ _,.., I
: 1 • ' .,.. 1m r a '·· I• .r \ eChopuloi,... KAKOMA,../ CHI KOBO ( •Mokoto ', NORTH Munemo• \ · r ··-....; · eNgoro- · • .·' CHITANDA : __ :.:-,....+..,."". • Liteto.AeChonkumbo \) ', l. I / - / " ·"' -.. L 1 T ETA · · AUfwambula \ • { .. _ •• \ .• ~· •1• " \TShrrt1ukuni I ---·· .. eMomboshr • · ... ~ . ~··:::- .. ,.... Ka ~so :\ . /' "7" .. ...--,;·.:::: ........ '\ .; ' .. -"··-··- .. ./ '""""· \ / Kalobela•,.... .. -· ', MASHIKILI ! 1 ---- ,/ / )~ (Komano ........... / \.- .. J .. - .. .J '-·,, ·, _ .. -·· ,/ Solochie ',.JMusopelo \', ."""·~- -;oL·· / • ./ \ \
. _ .. : _.. .. _ .. ~.. ..- , , .. -· Chobusi)'U Mombe 1 \ '<.,, Nomokalongo.J• •· •K.l b~ .... ·::::-\:.·.:::-~·~~e~~ '~' ....... -.-:-~:-: /
1 •..1 ,.'(homuko · , . / eem e "'\ ,....:-:---· --=·....- • . .._ ; 1 ·- .. -··.J-· Ranch : / • -.i~Mwochi- \ · ··-.,-';)/ •
"< . ..._, KEEMBE \H~s~k_o, • s.·.mpolo ··CHALOS!:!!/ CHISAMBA ,--;;;;.-f'o J -........ 'I Musena • \ --- ~ .r CHAMUKA 1...
- . ._!r..,ulumbu (_, \ APtougllmons·- .. ...,Chisamb~--- K t" SOUTH .J ..--··- .. -. ., . , a 1. ~cpu 1 1 ·-.. ......, ]l K ALULA -'K~lolo •Mupomano 1j --1 .
\ -... ................... , ·- '' \ I . '-t\ \ 1: ' ' --· I ·J•Kaota : 11 '·.. -r--~...-- I \ ... ./~ 1 I; ', eMupetekese i
• ---- ----.. -.. ~ J, ·-, • -- T··- -·· I' \ _..a..K9b1le : " . ·-·-·-·l. \, /
., KABJL£ ! ~··-··-.... KATUBA \- Karubwe) ....... , "1 / • • '.. • -·-J \ .,... .. .,..,.- ~ -~ ) "-• ...... ..-.-·~·-·-·-·-· I /. A'· /I . '· AKobongolal<i MUCHENCJh(u'-~~ I • Village or other Settlement
\ 'eMbosho nga,. ----- 1 1·-.. _,,...- MUNGULE, j_ ( ~ ·"'-. /'-t::... ' eChikumbi J ' .. ............. .: t /
"" ·~. I ,-"" . '/o:: _..,. ,. . . t:'>
N
t
10 20Km 0
Main Road
Other Road
Railway
Word Boundary
I<ALOLA Word !Arealname
Source: Surveyor- General'~ Off ice ... Agricultural Camp
37
and Kafue in the South and Chongwe District in the east (Bwalya et al 1994: 10 and
56). In the 1980s, Chibombo was divided into six Farming Wards, namely Chisamba,
lpongo, Katuba, Chitanda, Chikobo and Chunga (figure 3-no clear boundaries were
available on the original map or district). In the 1990s, the District is divided into 18
Farming Wards (figure 4). For administrative purposes, each ward is under local
leadership. For agricultural administration, the Wards are under the control of
extension officers. In each ward the resident extension officer(s) is/are responsible for
providing the farmers with farming information they require.
2.6.3 PHYSICAL AND CLIMATIC ·cONDITIONS OF THE STUDY AREA
2.6.3.1 RELIEF AND DRAINAGE OF CHIBOMBO
Chibombo District lies on the Zambian plateau with an altitude of between 900 and
1200 metres above sea level. Although this land is generally flat, it has scattered hills
in places. It is this general flatness of the plateau that has proved ideal for agriculture in
the district and the country as a whole. This point is emphasised by the wide spread of
farming activities in Zambia as revealed in figure 10. The relief of the land is also ideal
for easy construction of communication infrastructure. This perhaps explains why the
post-independence government in Zambia managed to construct so many major roads
and feeder roads in Chibombo District (figure 11) and the rest of the country.
2.6.3.2 SOILS
The Zambian plateau, as shown in figure 6, has well-drained sandy-loam soils suitable
for the cultivation of many tropical crops like maize, sunflower, cotton, sweet potatoes,
sorghum, groundnuts, millet and others. For Chibombo District, the sandy-loam soils
dominate the central landscape, parts of the west around Keembe, Mwachisompola
and the east covering both Chamuka North and South. These soils are also found in
parts of Chibombo Ward. In Wards bordering swamps, clay soils dominate. Around
Mungule area, sandy soils are dominant over sandy-loams.

Fig. 5 RELIEF OF ZAMBIA
0 ZOO Km
Source: D H Davies (1971: 15)
Motres. For;t
over 1829 • over 6000
15 24-1829 0 5000-6000
1218 -152 4 [ill 4ooo -sooo
91 4-1218 B 3ooo-4ooo
60 9- 91 4 D 2ooo-3ooo
305-609 01000-2000
[ ~ onfours J 1n f1211t

Fig. 6 SOILS OF ZAMBIA
0 200 Km
Source: D H Davies (1971: 27)
LEGEND
FERSIALLIT!C SOILS
NORTHERN FERRALLITIC SOILS S 0 U Tl~ ERN FERRALL I T1 C S 0 I L S
• • • BAROTSE SANDS
VERTISOLS OF KAFUE FLATS VERTISOLS OF R!VER VALLEYS
ON FLOOD PLAINS

38
2.6.3.3 VEGETATION
Vegetation in Chibombo District, like in many other areas in Central Zambia (figure 7)
that experience medium level rainfall (figure 9), is mainly of scattered miombo and
munga woodland (both indigenous hardwood trees) and open grassland. This type of
vegetation, like for many parts of south central Africa, is referred to as savannah
vegetation. In recent years, many trees have been cleared to make way for agriculture
or for charcoal making and human settlements. However, typical savannah vegetation
is still evident in Chibombo to this day. The grass of this area is appropriate as pasture
for animals kept by small-scale farmers. This is the reason why the Lenje people have,
over the ages, managed to maintain cattle, goats and other animals.
2.6.3.4 TEMPERATURE
The central Zambian plateau, on which Chibombo lies, experiences a tropical climate
with a mean annual temperature of 22 degrees Celsius (figure 8). In the hot-dry and
the hot-wet seasons, mean daily temperatures in Chibombo, like in other parts of
Central Zambia, are generally high. In certain instances the maximum daily
temperature may reach 36 degrees Celsius. In the cool-dry season, between May and
late July, temperatures are fairly low. During this time, minimum daily temperatures
may drop to as low as 15 degrees Celsius. The temperatures of Chibombo, like for any
other place in Central Zambia, tends to influence the farmers' activities at different
times of the year, such as what crops to grow or the time when to clear the fields in
readiness for the coming rainy season.
2.6.3.5 RAINFALL
Rainfall in Chibombo District, as is the case on the central Zambian plateau (figure 9),
is moderate and comes in the hot-wet season between October and April. As figure 9
shows, the mean annual rainfall averages 800 millimetres. Nevertheless, this varies
from place to place. Towards the south of the Central region, rainfall decreases (to
about 700 millimetres) while the north registers higher rainfall (about 1000 millimetres).
According to the information obtained in this study during the survey, the amount of

N
Fig. 7 VEGETATION OF ZAMBIA
LEGE NO
~ - Grassland and swamp
~ Livu nda Forest
' ~ Hutemwa Forest - It i g i For est - H ushibe Woodland
D Miombo Woodland
0 100 200Km § Mopane Woodland
Chipya Woodland
~ Lu sese Wood! and
Source D. H. Davies ( 1971: 25} ~ X Mungo Woodland

Fig. 8 MEAN ANNUAL TEMPERATURE
Scale 1:9 000 000 0 100 200 300 km
Source: Bwalya et at 1994:12
Temperature in ° C
Over 22.5
20 ~ 22·5
17·5-20
Under 17.5
_Isotherms

N
Fig. 9 MEAN ANNUAL RAINFALL t
0 200 l<m
Source: Department of Hefeorogy

39
rainfall seems to be adequate for crops grown in the Chibombo District. In low rainfall
zones like lpongo, drought tolerant crops such as sorghum and millet are mainly grown
to supplement low maize yields. According to the Department of Agriculture
(information on file, 1996) droughts in the 1980s were not as frequent as they have
become in the 1990s. This Department cites the fact that one drought occurred in the
early 1980s, and one occurred in the early 1990s, but since then droughts occur more
frequently (information on file, 1996).
2.6.4 ECONOMIC FEATURES OF CHIBOMBO DISTRICT
2.6.4.1 ECONOMIC ACTIVITIES
In Chibombo District, farming (both small-scale and commercial scale) is an important
economic activity. This is shown in the agricultural map of Zambia (figure 1 0). The
dominant type of farming practised here is small-scale farming. It accounts for 80
percent of all agricultural activities and over 90 percent of economic activities in the
district (CSO 1994). For instance, at the time of this study there were a total of 31,188
farm families in the entire district (Department of Agriculture file, 1996). Of this number
24,950 were small-scale farmers engaged in the cultivation of maize, cotton,
groundnuts, sorghum, sweet potatoes and other crops (Department of Agriculture file,
1996). With a total population of 147,777 (CSO 1994) this amounts to a very
significant part of the population involved in small-scale farming.
The people not involved in agriculture are found in careers such as teaching, health,
engineering, civic duties, retailing and quarrying. These professions, however, employ
less than 10 percent of the people in Chibombo (CSO 1994) and hence, in comparison
to small-scale farming, are less significant.
2.6.4.2 COMMUNICATION NETWORKS
As figure 11 shows, Chibombo District has a number of roads and other communication
infrastructures. Some of these are: (1) the old railway line that passes on the eastern
part of the district, (2) the Great North road (the main tarred road), (3) the Landless

Fig.10 DISTRIBUTION OF AGRICULTURAL ACTIVITIES IN ZAMBIA, 1975
100 0
r·· :' ) l ..-··-··~
100 200 Km
\ .. . : . . .·. . ... \. •• • ••••• I• • •' -· . ...._ r-· · . ... -: ......... _.. .. ·~ I .. \\ '' .a-,_ , "'!!.l'•~.i ·. : I •• • • ....._. l r :• .. _,·
r·- .. - . -a••:: I ··-·· . / ' •.\.·-··--··-', .. : -~-.. _-:-: .. I • .. ~·' • ...... ••• ••• .· .·.·.-· . . ,. .·~· ..... . .. '. ·.· . • • • ··~'701.... ·' ' ... '. I .·-·
0 I ''• ~,... 0
I · · I- ' • • ••• •• i ' ·-·-· • • .-2.' ... .
' • .-.---~--- I• I
-.... • •• :• .. .... . -·-· -.... . . .,
I -~ ... ·-.
l
~ .. . <I •• E: ... • • 0 ••••
N •l:: .... Mongo~
\
l . \ .. •_; / '· .-... •'-. .. ·~~ \,. •• \o•j
•• •• •• • • '\.. ••• • ••~~a I ..... ..· . ··'·s ..... .. . ... ·. ..-·-··~ .. ""-........ . . . ..
'S01 1fi Cf"; ftr1r inn ':''flo rl, "j· nl. 19 n(). Th~ n 'Ill",,,;-~ ~ f ,,
.. .. -.. ..,.. .. -(jf
·-// ( . . I • • \ . . .. \ .. . \ ·--.....,
...... N
t I ••• •• :•. \.•
'\
,_...-/ /j., . '
'·-...
" ·. '\ \,.
...----'{-·--... \ \ : -:/ (
.. . .. \ ......
. ·. :- :j .· :··.·:··:) . ... . . -~·· ... ·.· ... ' . .
Large scale commercial farming areas
Small and medium scale semi commercial farming are as
Pockel's of small scale semi commercial farming
Chibombo district"
Provincial boundary
Major roods
Rai I ways
0[10]
r ..-·:-:-I ••••• -·-·---+--!-

r ·"' ·.f'· F i g . 11 . '·- CHIBOMBO OISTRIC T
1980s AND 1990s .
COMMUNICATION FOR THE / '·- ...... I I I
1...
:oKasonkomona ! I
I
\_,...·-.. ... \
}
f- ·"\._.\ I ·-·-·-·'\ ( / .
'·.......,.·-.... r·-·v -----..,. '-"'. 8Chitanda .._-......... ' ·chibombo
.... , . ..._,.\/ --,
I \
~. ~hitanda \Landless \ _ .. turn offK "mbe Corner '· ...- - - __ _ . ...- '.C.. e., ~---
................. / \ Mwachi-'·-..... _ / sompola To ·-:..e:- ---Humbwa -.... ·-..... I
......... , \ ·-... I
\ I .\ .... ~.-- ......
\ ..eKabi.le \
0 10 20 Km ) ' I ..
Source: Chibombo district map ( 19 96)
...., /''-·-·- .........
,--""-e... I
-../ Chabusha
...... . ...- L.,
_../ \ \ .,., I. . l<ABWE '\ \
. ~ > . \ ' . 1 'A:,. . ' ............. ...._ __ ) t.
<;"·~ / "
i I / ·) i I ('...,. / I \ ', \ \ \ , __ ----\ .
\ ) \ ·\.
\ '· ........ \ .,. \ \ I \ I Chamuka j ~ ~
N
t
/ j -~ i - . ' I ,._{hisam~a~ /
I I
i. ~ /
,
I I .~· ·-·-:J......... ·-· . -··- t
·- \. -·- ttlemen I \ .... _____ . ther Se Village or o '/ I •
I
J ., ---I I I
Main Tarmac Rood
Main Gravel Road
Maintained Road
Motoroble Track
Railway

40
Comer to Mumbwa gravel road, (4) Chitanda turnoff to the lpongo dusty road, (5) the
Chisamba turnoff through Chisamba siding to Kabwe gravel road, and (6) a number of
feeder roads leading to many places in the district.
These communication networks were mainly established in the period of the First
National Development Plan (FNDP) of 1966 to 1970. Through the years, the
government of Zambia and the local community have mainly been maintaining these
roads to keep them passable, most especially during peak farming seasons when
inputs and/or outputs are moving. It seems that in places where the communication
infrastructure was established a long time ago, it has contributed, largely, to the spatial
pattern of the settlements in Chibombo District as they are today. According to the
Department of Agriculture (information on file, 1996), this is particularly so along the
Great North road and the railway.
The establishment of this infrastructure was part of the ambitious government
programme of rural development in the formative years of independence (GRZ 1979).
From the time of construction during the FNDP until the early 1980s, the Chisamba
turnoff to Chisamba siding road was tarred and the road from Landless Corner to
Mumbwa (see figure 11) was a very well maintained gravel road that could be used by
any automobile. Seasonal grading and general maintenance of the roads in rural areas
seems to have been a priority of the pre-1991 government (GRZ 1986). According to
field data, grading and general maintenance of rural roads was common between April
and the beginning of June in readiness for crop marketing that started at the end of
June. The government's policy of regular road maintenance helped to keep roads
(including feeder ones) passable during most parts of the year. With a widespread
social infrastructure of schools, clinics and shops the rural population was helped to
settle in many places of the district including those previously considered too remote
like lpongo (Department of Agriculture file, 1996).
2. 7 CONCLUSION
As explained above, Chibombo District is mainly an agricultural area where small-scale
farming is the most important economic activity. Chapter 2 has offered a detailed

41
description of Chibombo District in order to put the discussion of this study in
perspective.

42
CHAPTER3
METHODOLOGY OF DATA COLLECTION AND LIMITATIONS OF THE STUDY
3.1 INTRODUCTION
Chapter 3 covers details about the preparation of the research, its implementation, the
sample design and the limitations of the study. This chapter outlines how the research
assistants were recruited and trained; the type and structure of the research
instruments; the interviews held; observations made in the field; the sampling frame;
sampling units; sample selection and structure; management of the fieldwork,
description of methods of data analysis, and the limitations the study faced. In dealing
with each of these issues, an attempt has been made to provide specific details on
what they in~olve.
The section on research assistants provides details about how many research
assistants were recruited, how they were selected, their qualifications, how they were
trained both in theory and field practice. This section also touches on how the. pilot
survey, using the research instruments, was conducted and then a post pilot survey
review was conducted to improve the structure and simplicity of the questions while
minimising the degree of error in the quality of the field data.
The instruments used in this study to collect the field data are identified, listed and
described. Then, the structure and scope of each instrument is outlined. In outlining
the structure and scope of the instruments, the nature of the questions asked and their
focus are discussed. Here, the purpose is to reveal the specific details of each
questionnaire in terms of the nature and focus of the questions asked to the
respondents.
The interviews conducted in the field are described. The description of the interviews is
confined to their nature and purpose, how they were done and who did them.

43
The section on observations outlines the aim of the observations and how they were
carried out in the field. This section also states that these observations were made
primarily as supplement to the data collected through the use of questionnaires and
interviews.
Three sampling frames have been presented. These are the sampling frames for the
Department of Agriculture officials, the frame for officials of cotton companies and the
frame for peasant farmers.
discussed.
Each frame's composition and structure are then
Dual spatial sampling units are outlined. These are the extension unit (for both
extension workers for the Department of Agriculture and cotton companies) and
farming ward unit to cover farm families. These sampling units were used as a basis
for the current study.
For the sample selection, it is explained how it was done, which sections of the
population were selected, and the method that was adopted in order to ensure that the
sample was spatially representative. This section also gives the structure of the
selected sample- that of the extension workers and peasant farmers (farm families).
The section on management of fieldwork covers the actual work of the researcher and
the research assistants. This section thus explains how the researcher and his
assistants did data collection. It further explains the controls that were put in place to
ensure that the assistants did their work correctly and the post-fieldwork reviews. It is
this section that outlines how the researcher made sure that the objectives of the
fieldwork were achieved.
Finally, section 3.11 presents the numerous limitations that were faced during the
period of data collection. Here, the nature of the problems have been identified, how
they affected the research and the steps that were taken to solve them so as to
minimise their effects on the quality and quantity of the data. Although the study
encountered several limitations, only the severe ones have been discussed in this

44
section. All minor limitations have been omitted because their bearing on the quality
and quantity of the information obtained in the field was insignificant and tolerable.
3.2 RESEARCH PREPARATION
3.2.1 RECRUITMENT AND TRAINING OF RESEARCH ASSISTANTS
3.2.1.1 Recruitment of research assistants
In order for the study to be successful, 39 research assistants were employed from the
50 that had applied. Thus, 8 assistants for Chaloshi, 5 for Chibombo, 8 for Chikobo, 8
for Keembe and 1 0 for Liteta. Each of these assistants had to meet some minimum
educational qualification. It was required that any aspirant had to have at least a grade
9 standard of education and be able to carry out basic instructions and tasks as
demanded by the programme. Similarly, the aspirants were subjected to a test that
covered basic English and mathematics problems. Only those that passed this test at
their level (grade 9 and 12 educational levels) were picked as assistants.
Further, it was required that the aspirants show the ability to translate English to the
local language Lenje or the sister language Tonga. This was a necessary skill since
some of the peasant farmers they had to deal with could not speak or write English.
A further requirement to the research assistants (for each ward) was that they needed
to be resident in the farming ward. This requirement was given for two reasons. First,
the researcher needed only people that knew the farming ward well. Secondly, it was
done in order to reduce the cost of transport between the point of residence and the
research area. Moreover, all the assistants were encouraged to use local transport to
reach the farmers. Although this presented problems initially, the work smoothened out
as the research gained momentum.
Based on this selection procedure, each ward had a specific number of research
assistants (see table 7). Research assistants with grade 9 and 12 educational levels
were selected. The two grade levels were used for this study because the majority of

I
45
the people who came forward during the recruitment exercise had this type of
education. The dominance of these two levels of education is due to the fact that these
are the two levels at which people drop out of the education system in Zambia.
Table 7. RESEARCH ASSISTANTS
Assistants with Assistants with Total number of
grade 9 education grade 12 education assistants in the
I I I Ward
I Chaloshi 16 12 18 I Chibombo
1: I~ 1: Chi kobo
1
Keembe 1: 1: I ~a Lit eta
The average number of respondents each assistant had to deal with determined the
number of assistants in each ward. In order to minimise the workload; each assistant
was limited to a maximum of 11 farmers. Thus, assistants in Chaloshi had to deal with
11 farmers each, Chibombo 9 farmers each, Chikobo 9 farmers, Keembe 11 farmers
and Liteta 10 farmers per research assistant. At the end of the fieldwork it was
appreciated that the limitation in number of farmers per assistant helped maintain the
standard of information obtained. Also, this enabled the researcher to easily carry out
random visits to sampled households to check whether or not the assistants actually
visited the farms.
3.2.1.2 Training of research assistants
After the 39 research assistants were recruited in the five wards a one-week training
programme per ward was organised by the researcher. A home of one of the grade 12-
research assistants in each ward was used as a training base. The training programme
or learning schedule covered reading, interpreting and translating the questionnaire;
asking questions; effective listening and recording responses; formulating follow-up
I I
I I

46
questions; drawing sketch maps of visited areas; mathematical calculations of addition,
subtraction, fractions and divisions; nature and cause of measurement error, and
identification of the samples selected by the researcher (emphasising systematic and
stratified random sampling). The theory-training programme lasted for three days on
average.
3.2.1.3 Field trials
During the field trials (which lasted for one full day), the research assistants were
subjected to methods of selecting sample farmers, asking them questions, translation
and recording responses and sketching maps of visited areas. They were also
encouraged to practice humility during their visits to selected households, particularly
when it entailed dealing with farm families that were not very receptive. This aspect
was empha~ised in order to avoid confrontations between the research assistants and
their respondents.
The field trials were conducted in groups of one (where the group of assistants was
small) or two (if the group of assistants exceeded five). The researcher or a selected
grade 12 assistant who had shown great initiative and fast learning abilities in the
acquisition of the research skills led each group. The assistants used as leaders
during the field trials eventually assumed the same role in the final field research
because of their reliability.
3.2.1.4 Field trial review
The last day of the training programme involved reviews of the field trials. In the
reviews the trainees shared their experiences, problems and challenges encountered in
the field. Additionally, they used this time to bring out suggestions on how to solve
problems faced during the one-day field trials. This day proved very important to the
whole research preparation programme as it was used by all the parties to seek
clarifications on issues that were not clear to them in the initial stages (or any other
stage) of the training schedule. The researcher used the day of review to emphasise

47
those areas of research in which measurement errors could easily arise and the
methods the assistants needed to adopt in order to minimise such problems.
3.3 RESEARCH INSTRUMENTS
The instruments of research used here were three questionnaires.
The three questionnaires were A, 8 and C.
3.3.1 QUESTIONNAIRE A
Questionnaire A (appendix 1) was designed in a way that peasant farmers provided
information for the 1980s and 1990s. This instrument had 15 questions that ranged
from personal identity of the individual farmers to their crop production activities during
the 1980s and the 1990s. This instrument was tried in the field before it was finally
used during the actual field research. The field trial involved giving the questionnaire to
a small number of farmers in Chikobo and Liteta to answer on their own. After this was
done, the researcher discussed the strengths and weaknesses of the questions. These
discussions were used as a basis to improve this instrument.
As the main research instrument of this study, each research assistant conducted
physical questioning (where the respondents could not read or write) in a translated
form in Lenje (the local language) or Tonga (the sister language) at sampled
households in the wards. Respondents that displayed good knowledge of English and
the ability to write, had to fill in the questionnaire either as the research assistants
waited or on short term agreements of a day or two. Each assistant had a notebook in
which they wrote the names of the farmers with whom they had deposited the
questionnaire on a given day and when to collect them. Such record keeping was done
in order not to lose vital information from the sampled farmers in each study unit that
each assistant covered.

48
3.3.2 QUESTIONNAIRE B
This questionnaire (appendix 2) was aimed at the extension officers of the Department
of Agriculture in the Ministry of Agriculture, Food and Fisheries based in the sampled
five wards. The instrument had 12 questions. These questions ranged from the
personal identity and rank of the individual extension officer to their perception of
liberalisation experiences among the farmers in the wards under their jurisdiction.
This instrument was meant to elicit the personal views of these officials on the changes
taking place in Chibombo District after the introduction of economic liberalisation in
1991. This questionnaire was also intended to act as a supplement to questionnaire A.
Prior to the use of this questionnaire in the survey, it was distributed to eight selected
officials at the Department of Agriculture in Chibombo for testing. After they completed
answering the questions, a meeting was held with the officers (by the researcher) to
discuss areas· of improvement in terms of the clarity, appropriateness and effectiveness
of all the 12 questions. Improvements to this instrument were largely based on the
resolutions of this meeting.
This questionnaire was distributed among the sampled extens1on officers in the five
wards and later collected from them by the researcher himself. Because of their
educational standards they did not face many problems in answering the questions.
3.3.3 QUESTIONNAIRE C
Questionnaire C (appendix 3) had 12 questions and was aimed at extension officers
from companies promoting cotton growing in Chibombo. The purpose of this
instrument was twofold. First, it was meant to provide this study with the knowledge
these officials had on managing a single crop. Second, it was meant to obtain their
suggestions on how the peasant farmers growing other crops (other than cotton) could
use knowledge from this sector to improve their farming skills, particularly in the present
era of liberalisation.

49
In a way, it was this instrument that was aimed at providing this study with practical
suggestions on how to improve the operations of the peasant farmers. This instrument
was also included in the investigation mainly because over the years cotton growing
had enjoyed a high degree of autonomy from state control and consequently performed
better than the farming areas that were under heavy state influence (Department of
Agriculture file, 1996).
Just as for questionnaires A and B, this instrument was also subjected to field trials
during the training period in order to discover its weaknesses.
Out of this trial it was improved upon, particularly in wording and sentence construction
in order to reduce areas of difficulty.
Questionnaire C was distributed to and collected back from the officials in the cotton
companies by the researcher himself. The officials answered the questions on their
own and then handed back the answered questionnaires to the researcher after a day
or two. Their level of education helped them to easily understand what was required of
them.
3.4 INTERVIEWS
The interviews held with farmers and the five field agricultural officials were direct
structured ones. These interviews involved prepared written questions on selected
aspects of small-scale farming such as crop production during the 1980s and 1990s,
state of road networks and their associated impact on production, cropping systems,
land holding rights, farming resources and/or agricultural support institutions. In some
cases, the interviews were used to get more data from those people who had
completed questionnaires. This was done as a follow-up to questionnaires. In other
cases, they were used to get information from those seen as important but not covered
by filling in of questionnaires. For example, this method proved effective in eliciting
information from officials of the Department of Agriculture at Chibombo and other
Ministry of Agriculture, Food and Fisheries personnel in Central Province, the headmen
and chiefs of various areas in the district (Chibombo) who were not covered by the
three questionnaires.

50
At Kasukwe the researcher interviewed officials from Tazcor Company Limited (figure
14) that now occupies the premises previously owned by the Central Province Co
operative Union (CPCU). The officials of this company were interviewed because it is
the only enterprise specialising in supplying fertilisers to small-scale farmers on loan in
exchange for maize bags. Thus, it exchanges one bag of fertiliser for two bags of 90
kilogrammes of maize on harvest. It also buys maize and sorghum on cash or in
exchange for fertiliser. This company started its operations in the 1995/96 marketing
season.
3.5 OBSERVATIONS
The type of observation method adopted for this study was one of non-participant. As
a research instrument, observations were used to verify certain information collected by
questionnaires or interviews, or to collect information, which could not be collected by
any other way than mere observation. However, due to this method's high degree of
subjectivity, its general level of inclusion when processing the field data was kept to a
low level except in instances where authentic independent details existed to support
such a view (Silk 1979). This stand was deliberately taken to safeguard the reliability of
field data and hence reduced personal views that could not be supported by any other
independent information.
Data on the communication infrastructure was collected from the farmers as they filled
in the questionnaires, through the observations of the researcher and his assistants
during their visits to the study areas and from the information found on file at the District
Council. The District Council provided detailed information on the total length of the
communication infrastructure, their state and any developments that may have
occurred. This information was verified by the data from farmers and the field visits by
the researcher and his assistants. Similarly, the researcher verified all lengths of the
railway and individual roads by calculating each length from maps using the provided
linear scale. This was done in order to minimise the degree of error in the data given
by the council officials.

51
3.6 SAMPLING FRAMES
This study adopted a multiple frame of sampling. Thus, it used a frame for small-scale
farmers, a frame for extension officers in the Department of Agriculture and one for
extension officers from companies promoting cotton growing.
3.6.1 FRAME FOR SMALE-SCALE FARMERS
Village registers maintained by the individual village headmen in wards and a list of
households of small-scale farmers for the whole district from the Department of
Agriculture were used as a base for this frame.
These two registers were used to decide which farmers to include in the sample.
Using the two lists and the knowledge of the assistants about the individual study
areas, it was fairly easy to collect field data from the farmers.
3.6.2 FRAME FOR EXTENSION OFFICERS OF THE DEPARTMENT OF
AGRICULTURE
The list of these extension officers was obtained from the Department of Agriculture at
Chibombo District office. For administrative purposes, the Department maintains an
up-to-date register of its officers in the field, with their operation stations clearly stated.
Since the Department of Agriculture has an elaborate field infrastructure for their
extension officers it was easy to select those in the sampled wards.
3.6.3 FRAME FOR EXTENSION OFFICERS OF COMPANIES PROMOTING
CODON GROWING
The lists of extension officers from companies promoting cotton growing were
obtained from the district head offices. The managers at the head office of each
cotton company provided the researcher a consolidated list of their officers in the
various locations in Chibombo District. This made the researcher's work easier to do.
Similarly, the accompanying official introductions from the headquarters for each

52
company to the extension officers at various stations in the sampled wards enabled
the researcher to receive maximum co-operation from the respective officers.
3. 7 SAMPLING UNIT
Farming wards were used as the spatial units for this study. Of the 18 wards, this
study selected five Wards (Chaloshi, Chibombo, Chikobo, Keembe and Liteta) for
investigation. The five wards selected represent 27.8 percent of the entire number of
wards in Chibombo. These five Wards were selected because of their level of
agricultural activity, accessibility and proximity to the researcher's residence.
Additionally, Chaloshi, Chibombo, Chikobo and Liteta are adjoining. Keembe, though
removed by a distance of about 36 kilometres from the other wards, was selected
because of the reported high agricultural activities as compared to the other farming
wards (Department of Agriculture file 1996).
3.8 SAMPLE SELECTION AND STRUCTURE
3.8.1 FARM FAMILIES
In each ward, a specific number of households/farm families were selected as
respondents by the researcher as the main source of primary data. Stratified random
and systematic sampling methods were used for this task. Stratified random sampling
was used here for its flexibility to allow other methods to be incorporated. On the
other hand systematic sampling was adopted in this study due to its being easy to
handle.
Using stratified random sampling, the sampled farm families were selected at ten
percent of the total population of farm families in the ward, except for Liteta Ward
where eight percent was regarded as sufficient due to the large population of the ward
(see table 8). In the other four wards, a ten-percent sample was used for
respondents because it was considered the most convenient, cost effective and
manageable. Then each ward was divided into several strata comprising groups of
villages. In each stratum, a number of farm families were selected for this current

r"'"".J'"- Fig. 12 C HIBOMBO DISTRICT: SAMPLES i ·- .......... _ . '" I . . \ . ....~·- ......
I \ i ·1.
i r·~.
' .')
\ \ ·,.
lpongo (.· "-·-• ·-·-·"\
I PON GO
.. .,.,.·-.. /
/ I._.~
........ \ )
( r' ,..·
CHIT A NO A
\ •Kabile
.......
\ KABILE
0 10
o 1 P~rson
0 2 People
OS People
20Km } ·-.....
To \ Mumbwa
Circles proportional to populatiofl
Source : Field Research
/ .. -.. -.• MUCHENJE
...... ·"""". r-·/ \. ....... \ \. . '\
KABWE .t... ·" \ . . \ ) . . / \
~--·- ) i i ' ·.__
I ~ \ j
. ...__.-.. . .J / CHAMUKA \
NORTH \
N
t L. \ .. .. -·· . ~ '-" .. ./":· -..__ .. -..... / , .. ._ .. ._... ........ · . ."""
r: '·, / • Chamuka \ ··- .. } i
CHI SAMBA _ .. -·· )
DChisambaJ CHAMUKA ~ : SOUTH ...i ( -~-- /
i ! : I
,,..-..-.f. .' Korubwe ·-.. /
' I .._. "'·-·-·-· --·-·-·-·""'
a Village or other Settlement
Main Road
Railway
Ward Boundary
0 Sample population per ward
CHIBOMBO Ward I Area) name

53
study using, first, random and then systematic interval sampling. To determine the
spatial units, the following formula was used:
S = N/n. Where S =sample interval/spatial unit, n =sample size, N =population size
(Silk 1979).
For instance, to determine the spatial unit or sample interval for Keembe, the following
calculation was done:
N=891, n=10. Therefore, if S = N/n, then S = 891/89 = 10
Using this method, for all wards except Liteta, after the randomly selected first farm
family from the list in the village register or the CSO map (example appendix 4), the
next family to be interviewed was the tenth of the total number of units in the village.
This method of selecting farm families proved feasible to handle by the research
assistants as it was easy to understand and apply, and it also enabled the households
to be spatially well distributed. However, in places with a sparse population, the
interval for farm families was reduced to four. Thus, instead of selecting every tenth
household on the list, the fourth household was selected for interviews. This was
done in order to be able to obtain the required sample size per spatial unit.
Table 8. FARM FAMILY SAMPLES IN THE FIVE WARDS
WARD FARM FAMILIES I SAMPLE PERCENTAGE
Chaloshi 867 87 10
Chibombo 442 44 10
Chikobo 747 75 10
Keembe 891 89 10
Lit eta 1264 101 8
Total. 4211 396 9
NB: In Lite fa - only 100 were interviewed.

54
The actual number of households (farm families) selected for this current study from
villages in the wards is shown in table 8. In order to make field operations easy, each
research assistant had a CSO map of his study area (see example of CSO map,
appendix 4).
3.8.2 EXTENSION STAFF
3.8.2.1 DEPARTMENT OF AGRICULTURE
All officers who happened to be present in the sampled wards were used for this
study. This was done because there was one extension officer in each sampled ward.
3.8.2.2 COTTON COMPANIES
All extension officers available in the wards, except one in Keembe, were included.
The actual number of those picked for this study is shown in table 9. Extension
officers at permanent depots (see figure 14) were used for this study. Officers in
temporary stations were not included in the sample because at the time of data
collection these facilities were non-operational.
Table 9. SAMPLE EXTENSION OFFICERS OF COTTON COMPANIES
WARD NUMBER OF OFFICERS PERCENTAGE STATION IN
OFFICERS INTERVIEWED WARD
Chaloshi 1 1 . 100 Mupamapamo
Chibombo 3 3 100 Chibombo Tum-
off
Chi kobo 1 1 100 Shimbilo
Keembe 6 5 83 Keembe and
Mwachisompola
Lit eta 1 1 100 Chankumba ..
NB: 1. Cha/osh1 IS bemg served from Katuba, MwachJsompola, Mupamapamo and
Chisamba Railway Siding. 2. For details see figure 14.

55
As in the case of the extension officers in the Department of Agriculture, the extension
staff for the cotton companies in Chibombo were given a self administered
questionnaire to answer at their own time. After a day or two, the researcher went
round to collect the questionnaires from them and, wherever necessary, had an
immediate follow-up interview with anyone of them.
3.9 FIELD RESEARCH ADMINISTRATION
3.9.1 RESEARCH ASSISTANTS' FIELDWORK ACTIVITIES
Throughout the period of field research, the research assistants were closely
supervised in their work by either the appointed group leaders in their units or by the
researcher himself. The group leaders maintained a close watch on the work of those
under their supervision on a day to day basis. This was done so that each one of the
assistants did not do anything that was outside the stipulated guidelines, particularly
with regard to selecting the sampled farm families, distributing the questionnaires or
conducting the physical scheduled interviews in situations where farmers could neither
read nor write, and maintaining an up-to-date list of farmers visited.
The lists of farmers visited were sub:nitted weekly to the group leaders who in tum
submitted them to the researcher. As an administrative control and in order to ensure a
reduced level of error, the researcher used these lists to conduct random visits to any
randomly selected farm families. This strategy acted as a sure way of compelling the
research assistants in all wards to visit all recorded households.
Furthermore, occasional meetings with research assistants also helped to solve, with
minimum delay, any of the problems that came up in the process of their work. To a
large extent, this contact with the researcher helped to maintain their focus on the key
objectives of the fieldwork and a high level of work satisfaction.
At the end of the fieldwork, the researcher and his assistants held a post-fieldwork
review. This was done for two reasons. Firstly, it was done in order to share the field

r·"·J"· Fig. 13. CHIBOMBO DISTRICT: DEPOT INFRASTRUCTURE PER WARD IN THE 1980s
'-. I. ~ ......... _
·-..,.
I I I
<... ')
Jpongo
•
IPONGO
\ ....... ·-- ..... \
)
r·,., ~ . . r-· ,e.
I ....... ___ ., . '· (:.' : \ ( -·-·-·...., ~ ........ . .
'• ('/"'...... ,· .. -- . .J / ~ • Chitanda ·. '! · ·.. ,- ~- -. ) I '·'\.,J CH~_BOMBO ~-.KR,OCU//
1 J .•••.• · ~ Namboard
~o~>;\'1
~ \to<>
: · ··· ~Kasukwe .. .J j-.. ...., KAKOMA .-·· CHI KOBO /1CPCMU/Namboard _
·" C HI TAN D A : ··....... '·. • Liteta • Chankumba \-'· / _ I \ ··..... ~KRDCU/Namboa.rd
( .. -·· ,_ .. /·· .. : :. LITETA .··"·· .......... J · .. ·
·.
..,.,.·"""'· ./ L. ,..... ......
\
ABWE ~\
,) ,.--·/· i I ~
CHAMUKA NORTH
\ -, '" \
\ ) ·z
N
t . ....
\
/ (
I \
'1 \
/ / •. - - MASHIKILI \ . • ••• . . . . . . . ,_ .......................... _,.·....:--. · .. - .. _ .. ..,.,··-·· .,_ .........
\ •' \ . . . ·,_ ,./··- /.· ......... - : -·. ... ~ : .. •. • .......... • Keembe \ _,. .••• •
·-................ I .. ·· ... . ....... :~.---·· . \
0
·-....... .•.· CPCMU. •• eHwochl- · • . ·-_.;-"- KEEMBE A ·./ sompolo \CHALOSHJ . .'
10
-....... -....... Namboaql llCPCMU •. ' •. · ...... _ ZCF : lintco/Nom,boord ·.
20 Km
'\·.:_:"' ....... Lintco ': KALOLA •
\ · .... •·"····:· I \
\ • Kobile \ I<ABILE
) ........
To Mumbwa
......... ····r·• ... o•"'":' . .• j : ...... .. . •' \ .....-•·..,.,. .
/' MUCHENJ£ \....,,
1.· Chunga' '\ ··-·· HUNGULE -. ...,...:_ . -.... /'-L -'· . . ........ ... ....... ..... ......... ... ......
'·-../,'
CHUNGA'·
Source: Dept. of Agriculture and Field Research.
.·
......... CHI SAMBA ..... .
~Chisombd .. ~ PCMU ;
Z CF .: Lintco/Naf_11board
• Chamuka
CHAMU KA SOUTH
/ i
i i
~----·-·-·-·------~·
I
J:..
• Depot I KROCU/ Namboard J
Village or other Settlement
• ......... Sample Ward Boundary
_ .. _ .. _Ward Boundary
KEEMBE Ward C Area I name
Main Tarmac Road
I I I Railway
\
I
\ I (
.../

Fig. 14. CHIBOMBO DISTRICT: DEPOT INFRASTRUCTURE PER WARD IN 1990s
)'·'"'·.!'· . \..-... I
., __
. '" I .,_/'·~ . . 0 I \ ~ i }-. ...._, o.'< ~o~l;~ 1 lpongo
1. -._,....__.. _....._., \.:>~c
'. . ' ( '-·--- ..... . . ., , 'I ·-........ ·rv·'-. ·..--.::' ·--.i /.
·"""· r:-·/" \......._\
\ "· ABWE ~- '\ \ . . \ ) .
I i (
/ \ (\·-· (
_}• Chitando l ? . ~ CHIBOMBO•. /"' : v- v ·. . .: ·. Lonrtio : I :-·· · · thmaka
IPONGO ·-·-.J·
CHAMUKA NORTH
·• . . orazcor /" C HI TAN 0 A .f' ''-.. · ·. iteta eChankumbo
· • • \ ·. .... D Amaka
\. J \ \ \
N
t ,) ' KAKOHA .• •· CHIKO~oKa'"kwo
,_ .. ./ •• /· ....J : : LIT ETA .·••. . ... ·f' .... I --·- I . .· ..... .
\ ./ . ...-·· MASHIKILI \ •. • . . · .. .
"/""'' -- ../ .. -. __ .. __ .. \. - .. -.. .. \... . ......... \ .. -'-· ./ ... . \ .·· '·< / .. ······· . ·· · · ........ ~KeemJ:!e \ .. -.· ·· ···
........... .. . ......... - .. ........._ .... ,J.' £0Lonrho:. Amaka o•Hwachi-~ • •
·.......:.. KEEHBE Amok~ .•• • Lonrhoo sompola ··.C HALOSHI; ........._, D Mbayrmbayi Mbayimbayi '·. """"'" .•
.........._, and Son~ and Sons ·• ·. "'-c:~...... ... ': KALOLA '·: .
\ ·-........... : . .
········· .........
Chi samba OJ Chi sa mbci Marketing d\ ;
• Chamuka
CHAMUKA SOUTH-
I
\ \ i
c.. ./
I
. i -~·~.~ .
\ \ • Kabile
............. ,. ······ ... )·
0 10 20Km t== I d
\ KABILE
\ • I • • • • • • • • • •
j \'' ·· ... •• -·· E :" . ...- MUCHE"!.L. :
/ · ·-- - / MUNGULE /.. .. -·· ·......___
To Mumbwa
,· ........ /'1-. ..__., /·j· 1_, ...____,,,_ ___ - ' . .___. . --._ ·-<.... ,.s·
CHUNGA • '
source: Dept. of Agriculture and Field Research.
Korubwe '"'\. I . . ~-~~~·-·-·-·---·~
D Depot ( Tazcor I
• Village or other Settlement
• .. .. • ... Sample Ward Boundary
-·· - .. - Ward Boundary
CHIBOMBO Ward I Area J nama
Hain Tarmac Road
1 1 1 Railway

56
experiences. Secondly, this was done so that we identified the problem areas that
needed urgent attention in order to correct situations that could have affected the field
data in one way or another. Once any problem was identified, and perhaps called for
revisiting the area of study, this was done without delay. This post-field review also
heiped the researcher to have a comprehensive understanding of the thoughts and
deeds of the research assistants. This aspect of the post-field review helped the
researcher in sorting, evaluating and processing the field data.
3.10 METHODS OF DATA ANALYSIS
First, the data is organised according to the three hypotheses. Under each of these
hypotheses sections, tables and maps have been included to summarise and analyse
statistical information. Specifically, maps have been used in order to emphasise the
spatial approach of the study.
Secondly, each hypothesis has been tested as follows: (1) the crop totals and yearly
crop production fluctuations were used to analyse the crop production trends for the
1980s and 1990s. (2) In order to test the hypothesis that there has been an
institutional change in agriculture after the introduction of economic liberalisation in
1991, the agricultural support institutions of the 1980s and 1990s were listed and
compared and maps have been used ~o show the differences in spatial distribution. (3)
The changes that have occurred (or not occurred) on the road infrastructure, since the
introduction of economic liberalisation policies in 1991, have been examined in terms
of the differences in the length and percentages of passable roads throughout the
year, passable roads during the dry season only and the length of impassable roads in
the 1980s and 1990s. The basis of this analysis is a map.
3.11 LIMITATIONS OF THE STUDY
The study, as anticipated, faced some limitations. These limitations directly and
negatively impacted upon the quantity and quality of data from the field. The major
problems faced were:

57
(a) Some government departments did not co-operate with the researcher in the
provision of required information. This was particularly so with the Ministry of
Agriculture, Food and Fisheries in Lusaka. Although the researcher had official
introduction documents, from both the University of Zambia, in Lusaka, and University
of South Africa, in Pretoria, some officials hid behind the long bureaucracy to avoid
giving out vital information that was needed. The problem as such was never solved.
As a result of this, the researcher had no option but to rely heavily on secondary
sources of information, and occasionally used somewhat junior officers, who could not
be quoted for fear of victimisation from superiors, to provide what was needed.
Although the researcher finally obtained the information that was intended from the
Ministry of Agriculture using these sources, the input from those in decision-making
positions was lacking. In the researcher's view, this input could have helped
authenticate, correct, and/or enhance pieces of information, especially on matters of
policy, from other sources.
(b) The Department of Agriculture at Chibombo lacked some detailed information on
crop production and farmer's resource base in the district. The lack of information was
acute particularly for the 1980s. The explanation for this was that most of the
information the department had for this period was lost during the department's
movement from Kabwe (a town located about 55 kilometres to the north). To solve this
problem, the researcher used the fragmented details the department had on the files.
This was supplemented by verbal evidence from those officials who had worked with
the department for a long time
(c) Some Agricultural Extension officers, particularly for Chaloshi and Keembe, failed to
provide full information about their wards at the time of research. The officer for
Chaloshi argued that she was new in the ward and her predecessor did not leave any
reliable information on file and hence it was not possible for her to have up-to-date
information about the agricultural activities in the ward as she was expected to. But, to
try to solve this problem she personally accompanied the researcher to ail areas that
were visited in this ward. Her presence on the tour of the Ward helped clear and/or
confirm many important activities there.

58
The Extension Officer for Keembe was found operating from Mwachisompola (figures 3
and 4). Her explanation was that she didn't have accommodation in Keembe. Coupled
with inadequate transport, she failed to provide the researcher with some of the details
that he needed from the ward. As a way of solving the problem, the study used what
she had on file and the field data. Unfortunately, like her counterpart in Chaloshi, she
didn't have information for some years because, it was claimed, that her predecessor
left the files with limited information.
(d) As the research went into the rainy season, some areas that are swampy could not
be accessed easily. It was very· difficult to visit some remote areas in the sampled
wards because roads became impassable. During this time, fortunately, the bulk of the
research had already been done. The major impact of this limitation was that it made
the final part of the intensive field research slow, and that a few places in some wards
could not be visited as earlier intended.

59
CHAPTER4
TESTING THE HYPOTHESES OF THE STUDY
4.1 GENERAL INTRODUCTION
The introduction of economic liberalisation policies in agriculture in 1991 by the
Zambian government was done with a view to improve, among other things, productivity
and efficiency. In line with government policy, agricultural production and efficiency
could improve, as stated in earlier chapters, through the withdrawal of government
participation in funding and provision of logistics to the agro companies; ownership of
farms; removal of monopolies in input supply; crop marketing and provision of storage
space in farming areas. According to Kokwe (1997), the MMD government started to
effectively irt:Jplement its new policies in the 1994/95 farming season although the
statutes were actually changed immediately after assuming office in 1991. Largely,
between the 1990/1991 and the 1994/95 farming seasons, the government continued
relying on the old institutions to support agriculture while trying out new measures.
In examining the impact of the policies of economic liberalisation on peasant agriculture
in Chibombo District, this chapter puts forward research findings on the state of
agricultural support institutions, cropping systems, and crop production and the
communication infrastructure as they stood in the two time periods of 1983/84 to
1989/90, and 1990/91 to 1996/97. As much as possible, the researcher has
endeavoured to use only those pieces of data directly relevant to the three hypotheses
of the study. Other details not directly relevant to the study, though important, have
either been mentioned only in passing or been omitted altogether.

60
4.2 CROP PATTERNS AND PRODUCTION IN CHIBOMBO DISTRICT IN THE 1980s
AND 1990s
4.2.1 CROPPING PATTERNS
4.2.1.1 CROPS GROWN
Table 10 and figure 15 show the _main crops that peasant farmers in the five sampled
wards of Chibombo District grew in the 1980s during the period of centralised planning
policies. Of the crops grown, maize, cotton, groundnuts, sunflower and sorghum stand
out as the prominent ones (figure 15). In terms of preference, maize and cotton were
ranked first and second respectively. Thus, maize and cotton polled as follows:
Chaloshi, 870(o and 75%; Chibombo, 59% and 16%; Chikobo, 95% and 64%; Keembe,
91% and 69%; Liteta, 81% and 46%. The dominance of maize over the other crops in
Zambia was due to "The policy of subsidising maize production and marketing coupled
with maize production credit packages ... " (Chabaia and Sakufiwa 1993:4).
Like Gerrard et al (1994) and Kokwe (1997) have pointed out, maize and cotton were
preferred in the 1980s because of the government institutional and logistical support
they received. These two crops were supported by the government through the
following measures: a wide network of government funded parastatals that supplied
inputs and cash loans; the buying of these two crops at government determined prices;
provision of storage space; the provision of extension services. According to Chipungu
(1988), Mwanza (1992a and b), Gerrard et al (1994) and Kokwe (1997), maize enjoyed
this government support because it is the staple food of the country. On the other
hand, the government supported cotton growing among the smallholder farmers
through LJNTCO because it wanted the local textile industry to obtain the raw material
locally. This support that the two crops received from government made the farmers
grow them even in areas where conditions were unfavourable (Kokwe 1997).
Additionally, while this biased government support to maize and cotton depressed the
interest of farmers in the other crops, it also made all wards in Chibombo District, like in
other parts of Central Zambia, maize dominated areas (figures 15 and 17). This

61
government-induced bias towards maize also limited crop rotation among the farmers.
Information from the survey of this study reveals that farmers failed to practice crop
rotation on a wide scale because other crops were unprofitable.
As a commercial crop, sunflower was the third most important crop among the farmers
in the 1980s. During that period, sunflower grown by the farmers was sold to the
government sponsored companies. Farmers seemed to prefer sunflower to some other
commercial crops because it is drought resistant, does not require strict attention,
requires less labour and is early maturing.
Groundnuts were grown on a small scale for food. Peasant farmers in Chibombo grew
groundnuts as a direct substitute to cooking oil in relish. It is added to green
vegetables such as rape and cabbage in powder form. The same was the case in
other parts of Central Province. The amount of groundnuts entering the market was
negligible, although the number of farmers who grew groundnuts in each ward was
relatively high.
Table 10 also reveals that sorghum and vegetables were grown by a substantial
number of farm families in the 1980s, but on a small scale. These two crops were
grown mainly for domestic purposes. If there were any commercial intentions at all,
they were limited to the local community, mainly neighbours. According to the field
data, sorghum was grown for sale to beer brewers within the village and hence its
commercial aspects rarely went beyond the local community as well. Vegetables were
grown as relish.
A close examination of the data reveals that the percentages of crop preference,
emanating from the money and food value attached, determined the amount of land
hectares that each crop enjoyed on the farm (figure 15).
After the introduction of economic liberalisation policies in 1991, the traditional crops
grown by the farmers in the sampled wards have remained largely the same (table 11
and figure 16). Although in some wards there has been a visible reduction in the
percentage of farmers preferring maize to other crops, and a rise in those that prefer

62
other crops particularly cotton (compare tables 10 and 11, and also compare figures 15
and 16), the types of crops dominating the peasant farming community is the same -
maize, cotton, groundnuts, sunflower, sorghum, and vegetables.
Table 10. CROPS GROWN IN THE 1980s BY SAMPLED FARM FAMILIES
Crops I Chaloshi Chibombo Chi kobo Keembe Liteta
Grown (Number (Number (Number (Number (Number
and and and I and I and
percentage percentage percentage I percentage I percentage
of 87 farm of 44 farm of 75 farm of ~-9 farm I of :.~0 farm families) famiiies) families) fam1hes) fam111es)
Maize 7~ (87 40/_) IV I. /U 26 (59.1%) 7nca~ ~%) IV .._,V.tJ 81 (91.0%) 81 (81.0%)
Cotton 65 (74.7%) 7 (15.9%) 48(64.0%) 61 (68.5%) I 46 (46.0%)
Groundnuts 76 (87.4%) 15 (34.1%) 32(42.7%) 48 (53.9%) 41 (41.0%)
Sunflower 76 (87.4%) 7 (15.9%) 48(64.0%) 48 (53.9%) 54 (54.0%)
Sorghum 0 (0.0%) 2 (4.5%) 21(28.0%) 23 (25.8%) 11 (11.0%)
Vegetables 33 (37.9%) 4 (9.1 %) 11(14.7%) 13 (14.6%) 16 (16.0%)
Cowpeas 0 (0.0%) 2 (4.5%) 0 (0.0%) 3 (3.4%) 0 (0.0%)
Soya beans 0 (0.0%) 2 (4.5%) 0 (0.0%) 8 (9.0%) 8 (8.0%)
Sweet
potatoes 0 (0.0%) 2 (4.5%) 0(0.0%) 5 (5.6%) 19 (19.0%)
Water
melons 0 (0.0%) 2 (4.5%) 0(0.0%) 0 (0.0%) I 0 (0.0%)
Pumpkins 0 (0.0%) 2 (4.5%) 0 (0.0%) 0 (0.0%) 3 (3.0%)
Millet 0 (0.0%) 2 (4.5%) 5 (6.7%) 3 (3.4%) 3 (3.0%)
Irish
potatoes 0 (0.0%) 0 (0.0%) 0(0.0%) 0 (0.0%) 3 (3.0%)
lmpwa (local
Is (5.6%) egg plants) 0 (0.0%) 0 (0.0%) 5 (6.7%) 0(0.0%) i
NB. Percentages are rounded off to one decimal place.
I

l. ') .
' : \ \ \.
IPONGO
/ r·-· /
\ -·--·. ........-· -.....:.:-'
I
"·-.)
) (
) ... /
1980s AS
. I
lite to
CHAMUKA NORTH
·. \ \
'"' . . I
\ .
N
t / CHITANDA \
l \
\
KALOLA
Q ·-·~ . ·--..../'\ .-·--.....--·-./·-4........ .-... .. -·-·-" -~.
CHI SAMBA
/. ., .
/ '- --·-.) ,-·-)
(
I
CHAMUKA SOUTH
.
' . l. .~"'
I
-·-·\ J I
. -. -•' ..• \1 i. ·........:--...
r-· \.: .. \ .
/ HUCHENJE )
I .\ .. --· ·-.i... r ......... r.. ·'-· I .. _. .. ...- .. _.._. .. ..,... ..
KATUBA
r:' CROP LANDUSE IN PERCENTAGES-1980s AS
PERCENTAGE OF TOTAL HECTARAGE /. _/; MUNGULE ~ ....._ ·- .,.l ·• .!--·........ ·"""'··...-.... ...... .. '\..~ .. .........,. ~--~ / . .·..)
: ?<.. -~ .r·
0 10 20km
Maize
Cotton
Ground nuts ===-=t OIUNGA ,\)
c--:-·~J Study area~vlord -··- .. -District boundary
-·-·_Ward bour.dary
SOURCE: Field Research
Sunflower
Sorghum
Vegetables
Sweet Potatoes
OTHER CROPS: (Cowpeas, Soya beans, MiHet, Water melons, Pumpkins, Popcorn & Irish potatoes)

I I
l. ') . l
\ .
' )- .. "" .1 ......... _ ... ,, .....
'· IPONGO !
..1 \ _,.-
.-·-· )
/
/ (
,.; _,...- CHITANOA
Chibcmbo
r··l_ .. "'
r·· ··"· . ·"·
\ . \
CHAMUKA NORTH
''\ . I . . \
\
N
t
·. ,/ I --< . ........ .J·6,;· ~.
........ "'<".'·-.. · .. 2.0·. 11.9 8.1 . · ·':v · · t .-·../ CHAMUKA SOUTH ( ··~·-·
'. . . 1.4 · . · I ,.- , '···..:.. ·. ·. ·. • . Keembe<·· CHISAMBA \. ...i
··~·........ .
0
r~- . --l . . . . . . . . . .... . . . . .
<-·-·..:_:. · ......... i i i \ -..... ........... "\...... 2 0 . .
\._ "\ 2·.0 . . \ i . . ... -~·-··-·' I : \ 1 · . · . · . · ·~ \ ··- •• -i. I
•• KABILE • . ;,;._- • ..:.._.: · ·. . ':f .. ,, : \ ..) (- '-· KATUi3AJ• ·-··-··-··-··-·.:..;·-=-·-·--.J-=-------1
,,-·- \.., : CROP LANDUSE IN PERCENTAGES-1990s AS ',"' ./ MUCHENJE ) •• ':J ~ PERCENTAGE OFTOTAL HECTARAGE
• I . &..s \ r-. .-·./ MUNGUL E .... ' .· ., "-L. ~ . / .. . ··~ ;
·""\,·' ..........,. ..,. .,..,.,. '
10 20km Maize
Cotton
Study area -Ward
District boundary Ward boun dory
·-.;. CHUNGD ·._ '.s~ Groundnuts
Sunflower
Sorghum
SOURCE: Field Research
Vegetables
.Sweet- Pota roes OTHER CROPS: Hit let, Soya beans, Irish pot-atoes
Popcorn, lmpwa [locale~~ plant & Cowpeas

63
The strong attitude of peasant farmers towards traditional crops, according to Chabala
and Sakufiwa (1993), has arisen from a lack of incentives for crop diversification over
the years, and the favoured position of maize as the main food crop in the country.
Government has complained at different forums about this inability of peasant farmers
to diversify their crops. For instance, the Deputy Minister of Agriculture, Food and
Fisheries was quoted as saying " ... peasant farmers needed to diversify their crops in
order to survive in a liberalised environment. .. " (Times of Zambia, Friday, December 20,
1996:2). Such statements indicate the frustration of the government about the lack of
crop diversification in the new agricultural environment of liberalisation.
According to data from the survey in this current study, the increase in market demand
of some crops (for example cotton in Chibombo and Keembe) and difficulties faced in
procuring inputs such as chemical fertilisers (for example maize in Chaloshi and
Chikobo), many farmers have started switching to cotton, vegetables, soya beans,
sweet potatoes, pumpkins, lmpwa (local egg plants) and pop corn. The growing
popularity of cotton, and the gradual adoption of the once neglected crops, such as
lmpwa, sorghum and millet, appears to be the major change in crop patterns being
experienced among peasant farmers in Chibombo today. The cropping shift occurring
in the 1990s is resulting in a cotton-maize cropping system (Chaloshi), maize-cotton
cropping system (Chibombo), cotton-maize cropping system (Chikobo), maize-cotton
cropping system (Keembe) and maize cropping system (Liteta)- see figures 16 and 18.
This is in contrast to the 1980s when maize dominated (see figures 15 and 17).
These cropping systems, just like the 1980s maize dominated cropping system in all the
wards, reveal the dominant crop(s) in the late 1990s. In these systems, the crop stated
first is more dominant than the second (compare figures 17 and 18). But the presence
of the second crop in the cropping system entails that the crop is also a major one in
the area. In terms of dominance, the recent cropping systems, in comparison to the
maize dominated cropping system of the 1980s in all the wards, shows, at least for
cotton and maize, a major development unfolding in Chibombo District in terms of
preference and land hectares set aside for each crop by the peasant farmers.
Changes have been particularly prominent in Chaloshi for maize. This seems to have

64
resulted from the collapse of the support infrastructure and increasing cases of peasant
farmers seeking some manual work in the nearby commercial farms. In Chikobo a
decline in maize, cotton, groundnuts and sorghum, according to the data from the
survey, seems to have come about because of a collapse in the institutional support
system and poor state of the roads.
The farmers that have started to adopt the once neglected crops have given a variety
of reasons for the shift in crops preferred. Thus, 62.1% farmers in Chaloshi; 75% in
Chibombo; 7-8.7% in Chikobo; 68.5% in Keembe and 59% in Liteta blamed the late
arrival of inputs (particularly chemical fertilisers) and/or limited market opportunities as
reasons for starting to grow other crops. Also, faced with difficulties to procure inputs
such as chemical fertilisers, there is now visible evidence of crop rotation among
farmers in Chibombo District. Crop rotation is especially practised in Chibombo, Liteta
and Keembe wards.
The fact that in all sampled wards more than half of the farmers interviewed pointed to
the changed market environment as the main reason for their shift to other crops on the
farms, was an indication of the farmers' own changing strategies to survive and
perhaps an emerging positive response to market opportunities. But, whatever the
reason for starting to grow other crops in the 1 990s, there is a definite growing trend
among farmers, particularly those that l1ave access to the market, to grow those crops
that will give them better cash returns (Kajoba 1994). Assessing the volume of the
growing trend, one may say that it is gaining momentum by the year judging from the
amount of commercial crops farmers have adopted and/or continue adopting in recent
years (World Bank 1 994). For the government's dissatisfaction with the pace of crop
diversification, one may say that the government is expecting 'too much within too short
a time' from farmers who for many years got used to growing the same type of crops.
The government needs to observe the internal changes taking place in crop
preferences among the farmers within the realm of the traditional crops if it is to
appreciate the direction crop farming is gradually taking. To identify and acknowledge
some of these emerging patterns in agriculture in their early stages would help the
government find solutions to some problems peasants face today.


r-1g. "Jtj.LKUt-"1--'lf\JlJ :::> Y:J I tf"l::::, 1-U~ l Hll:301•1d0- ·1 )l)IUs
0 10 20 k m
lpo~go I
\. . . . '\
Chiyunr . "'chi ronda
.I IPONGO
)(" eChnpu!a ~ ....... JfAKOMA
. -~ ,./ NDA I / CHI TA -. ./
/ -·- \ r·-· ··· ''HIK!LI r "olobe!a• " "" M A"' . • - I
I / '•otO<h;• •""""'1' be · -· . ··/'7)'/}.. •KP.P:m ..1- . /'- I Y:t;:~/////7:;>:~~ :~_o /"'- .•
~~. / ·~ ~e~:;nt,e ~*Ji?t(. . .IHwachisompola ~. /~/~ //, r-•" / / /"" ~,, -£MBr:./~ ~ /K~ ,~ .• 0!.·% /;;:-;:;;:;;;Jr;; ~ %
. ~~~~~~~ 'eKaala \..
1990s ~
:!: I4J 1--
oVl z U.J >-3 1-Vl 0 <Ce::J c::: ~z t:l
L"(L Vl Oa_ Q. oa 0 c::: c:: ~
'-'
~ @ Haize
0 (0) Col'~on
8 Groundnuts
Ef} Sunflowl?r
KALOLA
eKabile -·......_·-~ .. _ . .,.,.-
f(ABIL£: ___ . ..J
\ /;~;"haMUCHENJE ~-\ Jr-.....__ A (~"ngo•~ v '-..._J ~._./ HUNGULE
~ CHUNGA ...
S!lrghum •t.• ... ~ Vegr<>tables
SO URC£ Field surve)'
CHI
.,Makat-o
•Chikonkom~ne
CHAAIUKA NORTH
-. . ..,. ·~·..J'"'· _,. ' r-·-·-·-···/ -·-·-·/'''
Hombee /,/ .chomuka
'·-·: A NB A _ . ..--
y•omr .. "'"" I I .;. .
!,...-._,
~ -~
EJ
CHAMUKA
sour1-1
19 Mupelr<> kese
__) Sampled wards
Major towns
Oth!<'r settlem::nts
District boundary
Ward boundary
Main road
Railway
N
t

65
Table 11. CROPS GROWN IN THE 1990s BY SAMPLED FARM FAMILIES
Crops I Chaloshi Chibombo Chi kobo Keembe Lit eta
Grown I (Number (Number (Number (Number (Number
and and and and and
percentage percentage percentage percentage percentage
of 87 farm of 44 farm of 75 farm of 89 farm of 100 farm
families) families) families) families) families)
Maize 61 (70.1%) 35 (79.5%) 64 (85.3%) 84 (94.4%) 89 (89.0%)
Cotton 67 (77.0%) 22 (50.0%) 54 (72.0%) 79 (88.8%) 35 (35.0%)
Groundnuts 60 (69.0%) 13 (29.5%) 48 (64.0%) 51 (57.3%) 62 (62.0%)
Sunflower 44 (50.6%) 4(9.1%) 38 (50.7%) 48 (53.9%) 35 (35.0%)
Sorghum 11 (12.6%) 2 (4.5%) 11 f14 70fo) I \ I • I I 13 (14.6%) 14 (14.0%)
Vegetables 33 (37.9%) 9 (20.5%) 16 (21.3%) 18 (20.2%) 3 (3.0%)
Soya Beans 11 (12.6%) 2 (4.5%) 0 (0.0%) 8 (9.0%) 3 (3.0%)
Sweet
Potatoes 0 (0.0%) 2 (4.5%) 16 (21.3%) 3 (3.4%) 22 (22.0%)
Pumpkins 0 (0.0%) 2 (4.5%) 0 (0.0%) 0 (0.0%) 3 (3.0%)
Pop Corn 0 (0.0%) 2. (4.5%) 0 (0.0%) 3 (3.4%) 3 (3.0%)
lmpwa 0 (0.0%) 0 (0.0%) 5 (6.7%) 5 (5.6%) I 8 (8.0%)
(Local egg I I I I I plants)
Millet 0 (0.0%) 0 (0.0%) 0 (0.0%) 0 (0.0%) 3 (3.0%)
Cowpeas 0 (0.0%) 0 (0.0%) 0 (0.0%) 5 (5.6%) 0 (0.0%)
NB: Percentages are rounded off to one decimal place.
4.2.1.2 CROP LAND-USE
During the 1980s, maize dominated other crops in Chibombo in the amount of land
hectarage it covered every farming season (table 12 and figure 15). For instance,

66
among the sampled farm families in Chaloshi, of the 610 hectares cultivated, maize
occupied 39%, cotton 26%, groundnuts 15%, sunflower 15% and vegetables 4%.
According to table 12 and figures 15 and 17, the six traditional preferred crops also
enjoyed a large farm hectarage. The dominance of one group of crops over others
during the 1980s also indicated, particularly for maize, the government's biased
agricultural policy and the crop's own long history of a favoured position both as a food
and commercial crop. As stated earlier, maize cultivation dates back to pre-colonial
days in Chibombo and other districts of Central Zambia (Muntemba 1977a). Owing to
having such a long history, maize had established itself well among the smallholder
farmers. With a comprehensive package of support from the government annually, both
in terms of inputs and marketing, farmers were encouraged to grow maize on a large
hectarage.
In the 1990s, the hectarage for maize, though still large in comparison to other crops
particularly those that for a long time were neglected by the government structures and
policy, has started to shrink (table 13 and figure 16). For example, commenting on crop
forecasts for 1997, Muluzi pointed out that "Cropping figures in the final food forecast
by the Ministry of Agriculture, Food and Fisheries show that the area planted has
declined for most crops ... with maize production declining steeply ... " (Muluzi 1997:16).
In the current study, the hectares for maize compare with cotton as follows: in Chaloshi
the hectares for maize declined by 10.9%, while the hectares for cotton improved by
13.3%; in Chibombo a maize hectare decline of 24.5% saw a rise of 30.1% for cotton;
in Chikobo a maize hectare decline of 9.9% has seen an increase of 14.5% for cotton
(see tables 11 and 12, and compare figures 15 and 16). Even where the maize
hectarage has risen (in Keembe and Liteta), the increase has been small when
compared to the expansion in cotton hectarage. Thus, for Keembe, the hectarage for
maize has increased by 0.3% while the cotton hectarage has gone up by 0.6%; in
Liteta, where the hectarage for maize has risen by 1.9%, the one for cotton has gone
up by 4.1% (see table 14). This strong showing for cotton is an indication of the
farmers' resolve to take advantage of the elaborate field infrastructure and the
competitive producer price in existence in the 1990s. With the unreliable, and at times,
the non-existing field-support infrastructure for maize (for example in Chaloshi and
Chikobo), coupled with low producer prices, more farmers seem to be increasing the

67
hectarage for cotton (for example in Chibombo) against that for maize. In a way, if
nothing is done to improve the standing for maize in the market, in the very near future
many homes will start facing low food reserves and hence seriously threatening
household, district and national food security.
Table 12. AVERAGE LAND HECTARAGE PER CROP IN THE 1980s
Crops Chaloshi
(Land
hectarage
as
Chibombo
(Land
hectarage
as
Chi kobo
(Land
I hectarage
as
percentage percentage percentage
of 610 total of 387 total of 954 total
hectarage) hectarage) hectarage)
Keembe
(Land
Liteta (Land
hectarage
hectarnge as I as percentage
percentage I of 1166 total I of 1179 total I hectarage) I hectarage)
Maize 239 (39.2%) 269 (69.5%) 454 (47.6%) 555 (47.1%) 599 (51.4%)
Cotton
Gmundnuts
Sunflower
Sorghum
Vegetables
Co~tvpeas
Soya Beans
Sweet
Potatoes
Water
Melons
Pumpkins
Millet
Irish
Potatoes
159 (26.1%) 42 (10.9%) 163 (17.1%) 272 (23.1%) 160 (13.7%)
93 (15.2%) 34 (8.8%) 1102 (10.7%) 99 (8.4%) 203 (17.4%)
93 (15.2%) 11(2.8%) 174 (18.2%) 143 (12.1%) 178 (15.3%)
0 (0.0%) 5 (1.3%) 36 (3.8%) 23 (2.0%) 16 (1.4%)
26 (4.3%) 6 (1.6%) 5 (0.5%) 28 (2.4%) 9 (0.8%)
0 (0.0%) 2 (0.5%) 0 (0.0%) 2 (0.2%) 0 (0.0%)
0 (0.0%) 5 (1.3%) 0 (0.0%) 10 (0.9%) 0 (0.0%)
0 (0.0%) 5 (1.3%) 20 12 (1.0%) 0 (0.0%)
(2.10%)
0 (0.0%) 2 (0.5%) 0 (0.0%) 3 (0.3%) I 0 (0.0%)
0 (0.0%) 1 0 (0.0%) 0 0 (0.0%)
1 (0.3%) 1 (0.0%)
0 (0.0%) 5 0 (0.0%) 29 0 (0.0%)
(1.3%) (2.5%)
0 (0.0%)
(0.0%)
o (0.0%) I i (0.0%)
0 0 1 (0.1%)
NB: Percentages are rounded off to one decimal place.

68
From these field statistics, the picture that seems to be emerging is that in the 1990s
cotton is benefiting from a continuing reduction in the hectarage for maize. The
positive growth cotton has registered, and perhaps will continue to register, is due to a
combination of factors. First, after the collapse of the government sponsored LINTCO,
the private companies, with an elaborate field infrastructure, have been established.
This field infrastructure provides cotton farmers with inputs, extension service, and
storage facilities and buy the crop at competitive prices. As Kokwe (1997) has argued,
wherever an elaborate field infrastructure exists, farmers tend to respond positively.
Secondly, the expansion of the hectarage for cotton as revealed here, should be
understood to be the farmers' own response to the new market environment. As the
World Bank (1994) has pointed out, farmers in a liberalised economy, like anyone in
business, tend to shift to the crops that give them the highest returns at minimal cost.
Considering that the cost of inputs in cotton cultivation is lower than the returns, it is not
surprising that many farmers are adopting the crop on a large scale despite its high
labour demand.
Thirdly, the shift in crop hectarage towards cotton should be taken to mean the farmer's
desperation to find a crop that will help them make a living when the staple food, maize,
is failing because the inputs are either too expensive or not available. By growing
cotton, farmers are attempting to find money from one crop in order to be able to buy
the food crop maize. This issue featured prominently among respondents during the
field survey in the five wards. 67% of the respondents argued that this was the only
feasible way to survive in an economy where their input needs for the staple food
(maize) are not being met. Respondents during the survey indicated that for
comparative advantage purposes, it makes sense now to grow more cotton than maize
for a farmer to be financially self sustaining in later years particularly now that there is
no firm to offer cash loans.
The small percentage changes shown here (tables 12, 13 and 14, and graph 1) for
crops such as millet, groundnuts and sorghum may indicate the poor input supply
system and markets. Also, it could be due to the poor extension services rendered, and

69
Table 13. AVERAGE LAND HECTARAGE PER CROP IN THE 1990s
Crop Chaloshi Chibombo Chikobo Keembe Liteta (Land
(Land (Land (Land (Land hectarage
1
hectarage hectarage hectarage hectarage as
as as as as percentage
I percentage percentage percentage percentage of 1169 total
of 637 total of 393 total of 968 total of 1230 total hectarage)
hectarage) hectarage) hectarage) hectarage)
Maize 180 (28.3%) 177 (45.0%) 365 (37.7%) 583 (47.4%) 623 (53.3%)
Cotton 251 (39.4%) 161 (41.0%) 306 (31.6%) 291 (23.7%) 208 (17.8%)
Groundnuts 97 (15.2%) 28(7.1%) 90 (9.3%) 100 (8.1%) 169 (14.5%)
Sunflower 77(12.1%) 4 (1.0%) 117 (12.1%) 146(11.9%) 133 (11.4%)
Sorghum 6 (0.9%) 4 (1.0%) 32 (3.3%) 17(1.4%) 10 (0.9%)
Vegetables 13 (2.0%) 11 18 (1.9%) 25 (2.0%) 6 (0.5%)
1 (2.8%) I I Sweet 0 (0.0%) 4 31 (3.2%) 9 (0.7%) 18 (1.5%)
Potatoes (1.0%)
Millet 0 (0.0%) 0 (0.0%) 0 (0.0%) 26 (2.1%) 0 (0.0%)
Soya Beans 13 (2.0%) 0 (0.0%) 0 (0.0%) 25 (2.0%) I 0 (0.0%)
Pumpkins 0 (0.0%) 0 (0.0%) 0 (0.0%) 0 (0.0%) 0 (0.0%)
Irish 0 (0.0%) 0 (0.0%) 0 (0.0%) 0 (0.0%) 2 (0.2%)
Potatoes I Pop Corns 0 (0.0%) 4 (1.0%) 0 (0.0%) 3 (0.2%) 0 (0.0%)
lmpwa 0 (0.0%) 0 (0.0%) 9 (0.9%) 3 (0.2%) I
0 (0.0%)
(Local egg I plant)
Cowpeas 0 (0.0%) 0 (0.0%) 0 (0.0%) 2 (0.2%) 0 (0.0%)
NB: Percentages are rounded off to one decimal place.

70
hence limiting the farmers' own knowledge about the crops. If these problems are
tackled, the farmers may increase the land hectarage and ultimately the production of
these crops (World Bank 1994). To some degree, the increase in the hectarage and
production of these crops, coupled with a change in eating habits of the rural
population, could solve some of the food security problems being faced by some
households at present.
Table 14. CROP LAND-USE PERCENTAGE CHANGE - INCREASES AND/OR
DECREASES IN HECTARAGE FROM THE 1980s TO THE 1990s
j Chaloshi (% Chibombo Chi kobo (% Keembe (% Lit eta (%
change) (%change) change) change) change)
Maize (10.9) (24.5) (9.9) 0.3 1.9
Cotton 13.3 30.1 14.5 0.6 4.1
Groundnuts 0 (1. 7) (1.4) I (0.3) (2.9)
Sunflower (3.1) (1.8) (6.1) (0.2) (3.9)
Sorghum 0.9 (0.3) (0.5) (0.6) (0.5)
Millet 0 (1.3) 0 (0.4) 0
Vegetables (2.3) 1.2 1.4 (0.4) (0.3)
Sweet 0 (0.3) (1.1) (0.3) 1.5
potatoes I I
NB: (1) figures in brackets indicate a percentage decline.
(2) Figures without brackets indicate a percentage increase or no recorded
change.
Fourthly, the increase in the hectarage for cotton and the decrease in the hectarage for
other crops (mostly maize) could be understood in the context of changing weather
conditions in some farming seasons. Thus, with some unfavourable weather conditions
in some farming seasons, many farmers tend to grow drought resistant crops in order to
reduce the chances of crop failure and hence increasing opportunities of a big harvest

71
even with adverse conditions. Many farmers that grow cotton for this reason also
continue the cultivation of other crops, including maize. To a large degree, it can be
argued that smallholder farmers grow different crops on their farms in one season in
order to increase the chances of crop success and hence keep the risk of crop failure,
for any reason, to the barest minimum. Information from the survey carried out in this
study reveals that the degree of success among farmers who grow more than one crop
is higher than that for those who specialise. It is also among this category of farmers
that incidences of crop rotation and multi-cropping were recorded.
Graph 1. CROP LAND-USE PERCENTAGE CHANGE
INCREASES AND DECREASES IN HECTARAGE FROM THE 1980s TO 1990s
-30+------------.------------~------------r-----------~----------~ Chaloshi {%) Chibombo (%} Chi!<obo (%) !C.eembe (%) Liteta (%)
I 0 Maize llJ Cotton 0 Ground nuts 0 Sunflower Iii Sorghum 0 Vegetables 0 Sweet Potatoes I
In the field survey, it was discovered that farmers that practice crop rotation
interchanged maize with cotton, groundnuts and sweet potatoes. Crop rotation was
evident in Chibombo, Keembe, and parts of Chikobo and Liteta. According to the
farmers surveyed, this is done because the crops interchanged with maize fix nitrogen

72
into the soil either from their roots, leaves or from the chemicals used. However, the
farmers surveyed also stated that crop rotation was affected by the availability of
chemical fertilisers and other inputs. Accordingly, where inputs (mostly chemical
fertilisers) are available as in accessible places along major roads, crop rotation is not a
high priority as the same field can be used many times without a remarkable reduction
in yields. For these areas, there is no clear evidence of a deliberate crop rotation
pattern. Unlike in the 1980s when chemical fertilisers were readily available in many
places, in the 1990s crop rotation is used mainly as a last resort to plough back soil
nutrients in a field where the farmer is unable to procure chemical fertilisers, particularly
in the remote areas of the district.
4.2.2 CROP PRODUCTION
4.2.2.11NTRODUCTION
Crop production is analysed per crop and in terms of the numbers of bags produced by
the sampled farmers for each ward. To give a general picture of the crop production
trends in Chibombo District as a whole, crop estimates for some farming seasons have
also been used. The use of this information is also meant to show that the changes
noticed in the sampled wards are not confined to these areas alone.
4.2.2.2 CROP PRODUCTION IN CHALOSHI WARD
In the 1983/84 farming season, crop production in Chaloshi Ward was not as high as in
the 1984/85 farming season (table 15). While the agricultural inputs such as seed and
chemical fertilisers were delivered early in the farming season, the rainfall was slightly
low (table 16, GRZ 1986). With a big improvement in rainfall in the 1984/85 farming
season, coupled with the supply of inputs on time, crop production was high (tables 15
and 16, Department of Agriculture File, Chibombo, 1995). While rainfall was above
normal in the 1985/86 season (see table 16), the crop production declined due to the
late delivery of agricultural inputs by NAMBOARD and other agro companies (GRZ
1986). This decline continued in the following farming seasons (1986/87 and 1987/88)
due, largely, to a drought (table 16). In the 1988/89 to 1989/90 farming seasons,
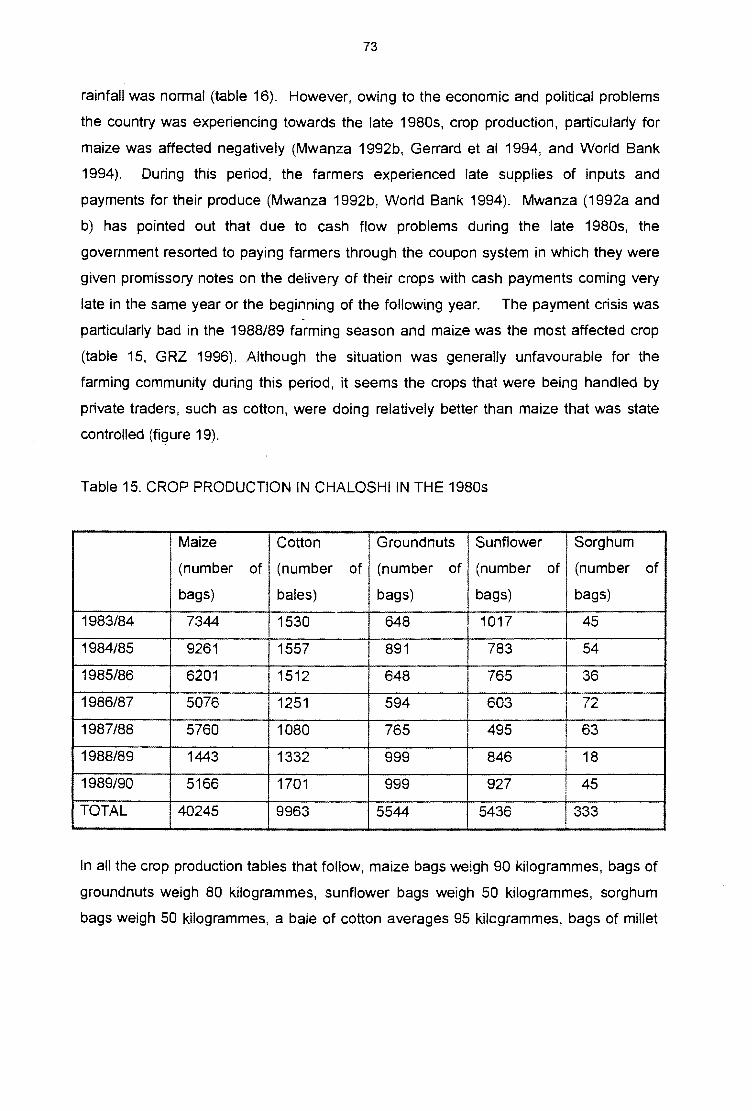
73
rainfall was normal (table 16). However, owing to the economic and political problems
the country was experiencing towards the late 1980s, crop production, particularly for
maize was affected negatively (Mwanza 1992b, Gerrard et al 1994, and World Bank
1994). During this period, the farmers experienced late supplies of inputs and
payments for their produce (Mwanza 1992b, World Bank 1994). Mwanza (1992a and
b) has pointed out that due to cash flow problems during the late 1980s, the
government resorted to paying farmers through the coupon system in which they were
given promissory notes on the delivery of their crops with cash payments coming very
late in the same year or the beginning of the following year. The payment crisis was
particularly bad in the 1988/89 farming season and maize was the most affected crop
(table 15, GRZ 1996). Although the situation was generally unfavourable for the
farming community during this period, it seems the crops that were being handled by
private traders, such as cotton, were doing relatively better than maize that was state
controlled (fi~ure 19).
Table 15. CROP PRODUCTION IN CHALOSHIIN THE 1980s
Maize Cotton Groundnuts I Sunfiower I Sorghum
(number of (number of (number of (number of (number of
bags) bales) bags) bag~ I bag~ 1983/84 7344 1530 648 1017 45
1984/85 9261 1557 891 783 54
1985/86 6201 1512 648 765 36
1986/87 5076 1251 594 I 603 I ..,.~
1£.
1987/88 5760 1080 765 495 63
1988/89 1443 1332 999 846 18
1989/90 5166 1701 999 927 45
TOTAL 40245 9963 5544 5436 333
In all the crop production tables that follow, maize bags weigh 90 kilogrammes, bags of
groundnuts weigh 80 kilogrammes, sunflower bags weigh 50 kilogrammes, sorghum
bags weigh 50 kilogrammes, a bale of cotton averages 95 kilogrammes, bags of millet
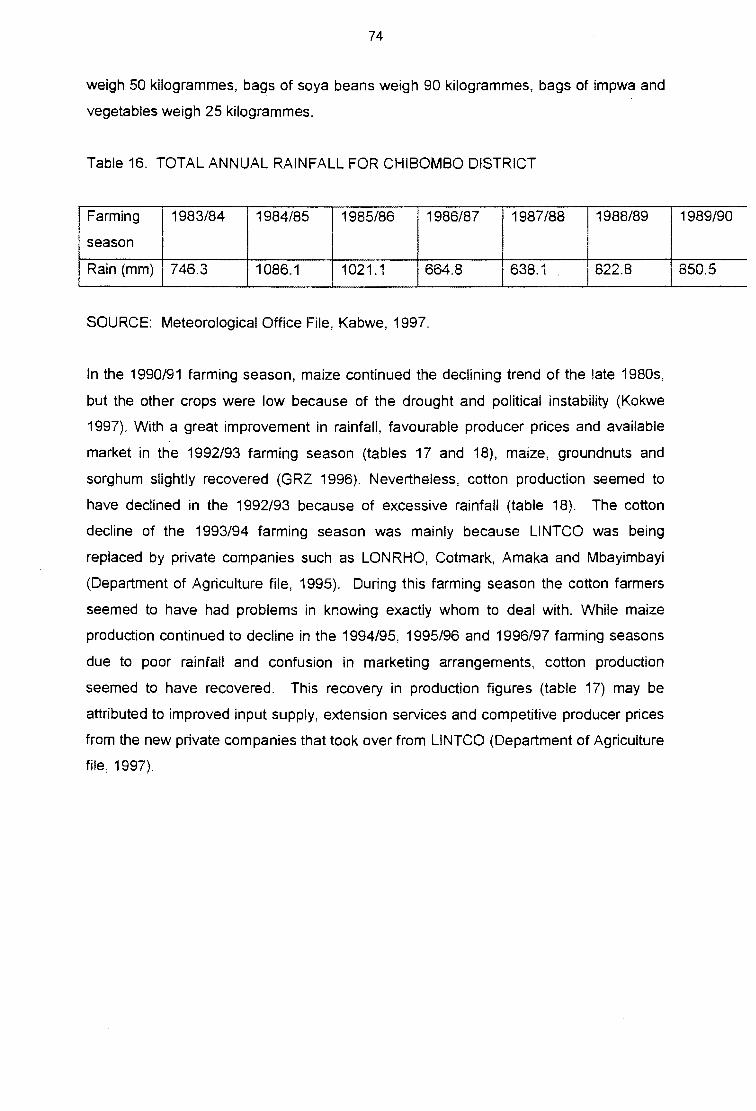
74
weigh 50 kilogrammes, bags of soya beans weigh 90 kilogrammes, bags of impwa and
vegetables weigh 25 kilogrammes.
Table 16. TOTAL ANNUAL RAINFALL FOR CHIBOMBO DISTRICT
Farming 1983/84 1984/85 1985/86 1986/87 1987/88 1988/89
season
Rain (mm) 746.3 1086.1 1021.1 664.8 638.1 822.8
SOURCE: Meteorological Office File, Kabwe, 1997.
In the 1990/91 farming season, maize continued the declining trend of the late 1980s,
but the other crops were low because of the drought and political instability (Kokwe
1997). With a great improvement in rainfall, favourable producer prices and available
market in the 1992/93 farming season (tables 17 and 18), maize, groundnuts and
sorghum slightly recovered (GRZ 1996). Nevertheless, cotton production seemed to
have declined in the 1992/93 because of excessive rainfall (table 18). The cotton
decline of the 1993/94 farming season was mainly because LINTCO was being
replaced by private companies such as LONRHO, Cotmark, Amaka and Mbayimbayi
(Department of Agriculture file, 1995). During this farming season the cotton farmers
seemed to have had problems in knowing exactly whom to deal with. While maize
production continued to decline in the 1994/95, 1995/96 and 1996/97 farming seasons
due to poor rainfall and confusion in marketing arrangements, cotton production
seemed to have recovered. This recovery in production figures (table 17) may be
attributed to improved input supply, extension services and competitive producer prices
from the new private companies that took over from LINTCO (Department of Agriculture
file, 1997).
1989/90
850.5

Fig.19. TOTAL CROP PRODUCTION FOR THE 1980s (1983·1990 for samples only) CHIBOMBO
<pengo ~ "Mundu
Kasonkomona
IPONGO
0 10
Tons 8000 LITETA
/
Tons 7000
Chiyuni~ ........ 6000
Chif-anda'f
,./500 (
20 km
KEEMBE
Tons CHIKOBO 5000
l. Tens CHIBOMBO
2000
-- -1 1
---~··so l ' ... ·\·:·:ou,~v Crop~'·1· ~· 3_ ~V · ..... /:::-·s'""8hpi0~~i_L,ci<.:.:.: . .' :: ·CHit<C!.· . . ·.·.· •... 20 . . . . ...
lllJ"l:·,''\t:::;m.,._~··~Ngo!a.'. Lihera .' . .' . .'-.'-.'.
'.4s ·--.-x.·r·.L!~E.r~-:-:.·.· .I. Shimukun1 · ·. J ·. ·. ·. ·. ·. ·. · .1 .,.. '- ...... . i .. . \
-• l<eembe \ -··~ . '" __\. -· '\• . ·.·.·: r·;;-· •. ·. ·. ·• l,l'lu.~oka Mwac his o-·. ·. ·. · .Y -mpola :rrm r. ·. · . · ·
'"'!ill..l. . . . '( •• t::J.S •••••••
2 3 .. 5· ...... ) ''·.:.......,J··_.:...,:. ·•
KALOLA
'\.Koala \..... '-·--·-. ...._
'/ '..._ 0 IA&~I.Iu....,j. , '.
j Crops1.'~:_3 4'5~.'· . . .../ Ychikonkot~~'
r·- ' ,/ MUCHENJE ri)Chunga
KABILE
SOURCE: Field Research
•Chikonkomene
CHAMUKA
NORTH
·-·-........"'- '"' __, Kamano ./ :y-· ........ --. ...-·
;',/
eBombwe
• Mom be / ....... • Chamuka
........ _., Chisamba (
·-·-... ·""' J i • Kaputi
\ I
CHAMUKA SOUTH
• Mupe.lakese
EJ Sampled ward
N
i
• Village/other settlement
-.-.- Ward boundary CROPS
\ ) ~
1 ~----Maize 4[lli _____ Sunflo~er 2 §§! _____ Cotton sl _____ Sorghum
[!"!:7.1 3 ~----Groundnuts

Fig.20. TOTAL CROP PRODUCTION FOR THE 1990s (1YY1·1YY7, ror samples omy J LMJDUI"Jou:
(....,.'-!\ . ._ __ _ I
....... _ . . ....... I \_., ·-""" i \)
' . ~ ! J.- ....... I, •tpongo •
( 1000 ·"!.Kasonkomona
\ IPONGO
Chiyuni ...... ,
Ctlitondatooo I
(
\ : . .~ ' ~'· . ,/ \ r·- 'CHI TAND.A400~ .. . . ·"" \ _ •• .1 Katobetge / .........
\ / .· 300 "-<' Namakalongo / •. -:-: ·-:-. .. ;"· .. . ........ / ...... . - . ~· .. . -........ . . ..J··~ ....... 2.0~0
~·- ........ . ··....:,.'. 'KEEMBE' ' '·
·~ ..... ·.·.· . ...:..:·. :-:. 1~0~
~--··-·" ., 500 ·, 0 [ +''· fl ,,_
Crops A 8( 0 E \. l \ •tcobite
' Tons CHIKOBO 4000
Tons CHIBOHBO 4000 r-----
KALOLA
\ KA'BILE
0 10 20 km
"" \ '·
SOURCE Field Research
...... -~ ~_.· ""'"· . ' ~ABW~ .chowo'"·
. "' \ . . \ .I . r.--·-·/· •Huswishi \ I .
. ' I . . "" / •Chikonkomene ') ~ .
~ ....... -._; CHAMUKA etombwe (
I eHatolca NORTH \
Munema• \
N
+
\ . "-·._. ,.. .. - , .. \ Komano'"'-•' · "" " .·- .._.. ··-··' -.....
\.- ··-. /. ·- '-"• : . ' / .
~m~e \ :... •Ctlamuka \
·----.. .. ..,.,.,.... . ,/ I
~-- . hisamba} CHAMUKA SOUTH (
j • Kaputi /'./
\ ·' . I ! . -·-·-J I
·~.". I ~-~-~-~---~·~·~·~·
c~:) Samj)led ~rd • Village other settlement
_ .. _ .. -Word boundary
CROPS
A~Moin &~Cotton = ~ L'\ii!~:J &routdnuts
'
0 ....,I 11,...,.,111"'"111 Suflftower
E-Sol'ghum

75
Table 17. CROP PRODUCTION IN CHALOSHIIN THE 1990s
Maize I Cotton Ground- Sunflower Sorghum I Soya Beans
(number of
1
(number of nuts (number (number
1
(number of
bags) bales) (number of bags) of bags) bags)
of bags)
1990/91 2025 1071 369 72 19 1o
1991/92 1935 1368 378 351 36 23
1992/93 3222 1296 963 225 63 46
1993/94 3168 909 1035 225 27 25
1994/95 2727 1431 1134 477 78 11
1995/96 2529 1422 738 432 69 13
1996/97 1818 1890 945 279 16 18
TOTAL 17424 9387 5562 2061 308 151
In the 1990s, maize and sunflower figures in Chaloshi declined (table 17). Maize
recorded an annual mean production of 2489.14 bags against 5750.10 bags for the
1980s; cotton 1341.00 bales against 1423.29 bags for the 1980s; groundnuts 794.57
bags against 792.00 bags for the 1980s; sunflower 294.43 bags against 776.57 bags in
the 1980s, and sorghum 44.00 bags against 47.57 in the 1980s. In terms of totals
between the 1980s and 1990s, except for groundnuts that had a slight increase from
5,544 bags to 5,562 bags, all crops declined in production figures. Thus, maize fell
from 40,245 bags to 17,424 bags; cotton from 9,963 bales to 9,387 bales; sunflower
from 5,436 bags to 2,061 bags, and sorghum from 333 bags to 308 bags (see also
table 27 and graph 2).
Table 18. TOTAL RAINFALL FOR CHIBOMBO DISTRiCT IN THE 1990s
Farming 1990/91 1991/92 1992/93 1993/94 1994/95 1995/96 1996/97
Season
Rain 768.4 476.9 1026.7 697.0 711.2 722.0 1091.0
(mm)
SOURCE: Meteorological Office File, Kabwe, 1997.

76
4.2.2.3 CROP PRODUCTION IN CHIBOMBO WARD
In the 1983/84 farming season, crop production in Chibombo Ward was generally low
(table 19). Low crop production during this season is attributed to below normal rainfall
(table 16). In the 1984/85 and 1985/86 farming seasons rainfall dramatically improved
(see table 16) and consequently the Ward recorded a better crop production in maize,
cotton, and groundnuts (table 19). Such an improvement also signals stability in input
supply and marketing arrangements (Department of Agriculture file, Chibombo, 1995).
For lack of adequate inputs and market support, sunflower and sorghum continued to
perform poorly. In the 1986/87 and 1987/88 farming seasons there was reduced
rainfall in the district as a whole, but due to the nature of soils, early planting and
availability of inputs, crop production was, except for sorghum, good. In the 1988/89
farming season, though rainfall improved to normal levels, crop production, except for
cotton and sorghum, declined (table 19). This decline in production was as a result of
late payments to the farmers by the government funded companies in the previous
farming season (Mwanza 1992a and b, Chabala and Sakufiwa 1993, Department of
Agriculture file, Chibombo, 1995). In the 1989/90 farming season crop production
improved despite a slight reduction in rainfall. According to the Department of
Agriculture at Chibombo, this improvement was due to the marketing arrangements the
government had put in place.
The mean crop production for Chibombo Ward in the seven farming seasons (1983/84
to 1989/90) were: maize 1879.57 bags; cotton 348.71 bales; groundnuts 393.43 bags;
sunflower 68.14 bags and sorghum 4.57 bags. These averages reveal the order of
crop importance in Chibombo Ward and perhaps in general, the levels of production
during this period.
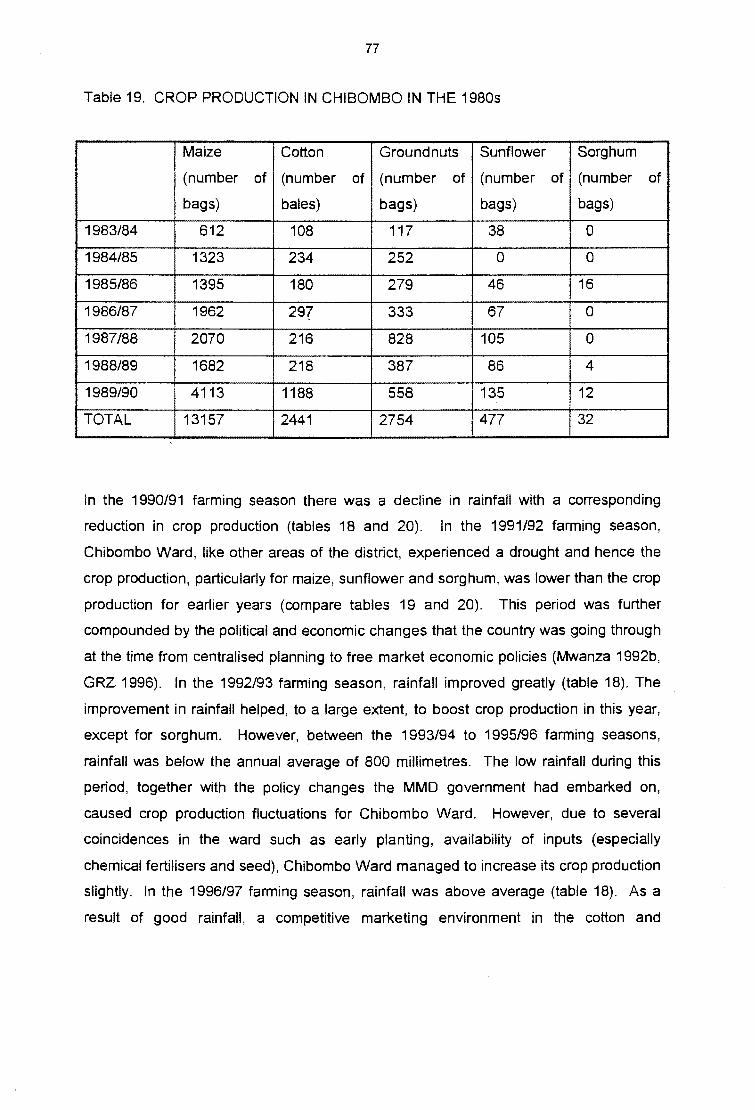
77
Table 19. CROP PRODUCTION IN CHIBOMBO IN THE 1980s
Maize Cotton \ Groundnuts Sunflower Sorghum
(number of (number of I (number of (number of (number of
bags) bales) I bags) bags) bags)
1983/84 612 108 117 38 0
1984/85 1323 234 252 0 0
1985/86 1395 180 279 46 16
1986/87 1962 297 333 67 0
1987/88 2070 216 828 105 0
1988/89 1682 218 387 86 4
1989/90 4113 1188 558 135 12
TOTAL 13157 2441 2754 477 32
In the 1990/91 farming season there was a decline in rainfall with a corresponding
reduction in crop production (tables 18 and 20). In the 1991/92 farming season,
Chibombo Ward, like other areas of the district, experienced a drought and hence the
crop production, particularly for maize, sunflower and sorghum, was lower than the crop
production for earlier years (compare tables 19 and 20). This period was further
compounded by the political and economic changes that the country was going through
at the time from centralised planning to free market economic policies (Mwanza 1992b,
GRZ 1996). In the 1992/93 farming season, rainfall improved greatly (table 18). The
improvement in rainfall helped, to a large extent, to boost crop production in this year,
except for sorghum. However, between the 1993/94 to 1995/96 farming seasons,
rainfall was below the annual average of 800 millimetres. The low rainfall during this
period, together with the policy changes the MMD government had embarked on,
caused crop production fluctuations for Chibombo Ward. However, due to several
coincidences in the ward such as early planting, availability of inputs (especially
chemical fertilisers and seed), Chibombo Ward managed to increase its crop production
slightly. In the 1996/97 farming season, rainfall was above average (table 18). As a
result of good rainfall, a competitive marketing environment in the cotton and

78
groundnut, production improved. During this season maize, especially, failed to do well
partly because of having no support infrastructure, and having had a low price on the
market. Nevertheless, when compared with Chaloshi where production declined,
Chibombo Ward had better mean and total production in the 1990s than in the 1980s.
Thus, mean production for maize increased from 1879.57 bags to 2910.86 bags, cotton
from 348.71 bales to 772.71 bales, groundnuts from 393.43 bags to 471.86 bags,
sunflower from 68.14 bags to 106.86 bags and sorghum from 4.57 bags to 46.00 bags.
Total crop production figures were higher for the 1990s than those for the 1980s
(compare tables 19 and 20, and figures 19 and 20). This favourable crop production
seems to have occurred because of a fair state of the communication infrastructure
(roads) in many places, emergence of a private agricultural support system and readily
available market with the ward and nearby town of Kabwe (Department of Agriculture
file, 1996).
Table 20. CROP PRODUCTION IN CHIBOMBO IN THE 1990s
Maize Cotton I Groundnuts Sunflower I Sorghum
(number of (number of I (number of (number of I (number of bags)
bags) 1 bales) bags) bags)
1990/91 3564 432 108 69 41
1991/92 2916 522 189 48 I 36
1992/93 3375 639 540 71 18
1993/94 2502 729 756 87 54
1994/95 2151 747 630 116 71
1995/96 3438 1044 306 223 62
1996/97 2430 1296 774 134 40
TOTAL 20376 5409 3303 748 322
4.2.2.4 CROP PRODUCTION IN CHIKOBO WARD
Like for the wards discussed above, crop production in Chikobo for the 1983/84 season
was lower than the crop production for the 1984/85 to 1985/86 farming seasons
because the season had below normal rainfall (see tables 16 and 21). In the two

79
farming seasons (1984/85 and 1985/86) rainfall was way above normal (table 16).
With adequate input supplies and marketing arrangements on the part of agro
companies and co-operatives, crop production was high. But crop production slightly
declined in the 1986/87 and 1987/88 farming seasons owing to a reduced amount of
rainfall (table 16 and 21). This was despite the stability in input supply and the market.
The only crop that registered an increase was sorghum and this is perhaps because of
it being a drought resistant crop and the availability of a local market among beer
brewers (Department of Agriculture file, Chibombo, 1995).
Table 21. CROP PRODUCTION iN CHIKOBO IN THE 1980s
Maize Cotton Groundnuts j Sunflower Sorghum
(number of (number of (number of I (number of (number of
bags) bales) bags) bags) bags)
1883/84 5040 585 485 333 333
1984/85 5472 747 630 459 144
1985/86 9783 540 927 594 99
1986/87 8280 396 603 558 162
1987/88 7992 558 675 468 108
1988/89 3211 630 558 369 216
1988/90 5724 711 855 459 I 189
TOTAL 45502 4167 4743 3240 11251
Despite an improvement in rainfall in the 1988/89 farming season, crop production
continued to decline and/or fluctuate (table 21). According to the Department of
Agriculture at Chibombo (information on file, 1985), this can be attributed to the overall
economic pressure the country was going through at this time. In the 1989/90 farming
season, rainfall was normal and hence a slight improvement in crop production was
attained in Chikobo Ward (table 21) against a background of continued political and
economic problems the country was going through (Department of Agriculture file,
Chibombo, 1995).
I

80
During the 1990/91 farming season, crop production in Chikobo Ward, except for
maize, was adversely affected by a minor reduction in rainfall (table 18) and the political
transition the country was going through (Department of Agriculture file, Chibombo,
1995). In the 1991/92 farming season, despite adequate input supplies the
government had given the farmers, through the agro companies and co-operatives,
crop production, except for groundnuts, was low because of the drought the whole
region experienced (tables 18 and 22). In the 1992/93 farming season, rainfall was
abundant (table 18) and hence a slight improvement in crop production was recorded
for maize and sunflower but not for cotton and groundnuts. It seems that cotton,
groundnuts, and sorghum could not perform as much because farmers had put more
interest in the staple food, maize. Despite the reduced rainfall in the 1993/94 farming
season (table 18), farmers produced more maize because of early planting, adequate
inputs and a favourable producer price (Department of Agriculture file, Chibombo,
1995). Cott~n seems to have failed to perform well because of the transition from
LINTCO to the private sector at the time. In the 1994/95 season, rainfall slightly
improved (table 18). This improvement in the rainfall during the 1994/95 farming
season seemed to have made it possible for cotton, sunflower and sorghum to do well
(table 22). In the 1995/96 farming season, maize failed to perform as in earlier farming
seasons (see table 22) because of the confusion in the marketing arrangements on the
part of the companies responsible for supplying inputs and buying the produce
(Department of Agriculture file, Chibornbo, 1996). On the contrary, cotton, groundnuts,
sunflower and sorghum performed better because of an elaborate privately-funded
support infrastructure that had emerged at this time (Department of Agriculture file,
Chibombo 1996). The 1996/97 farming season saw a continued decline in maize
production despite a high rainfall amounts (see tables 18 and 22). Cotton, sunflower,
sorghum and, to some extent, groundnuts continued to do well (table 22).
Comparing the mean crop production figures for the 1980s and 1990s, Chikobo Ward
recorded a decline in the 1990s (graph 2 and, figures 19 and 20). Thus, maize
declined from an annual average of 6,500.29 bags to 4,875.43 bags; cotton declined
from an annual average of 595.29 bales to 363.00 bales; groundnuts declined from an
annual average of 677.58 bags to 339.29 bags; sorghum declined from an annual
average of 178.71 bags to 145.29 bags. Sunflower was the only crop that recorded an

81
increase in the mean crop production for the 1990s, from an annual average of 462.86
bags to 703.29 bags. This increase in sunflower was partly caused by the high market
demand for this crop from local suppliers by Premium Oils Company. The changes in
the total production figures are emphasised by table 27 and graph 2 below.
Table 22. CROP PRODUCTION IN CHIKOBO IN THE 1990s
Maize Cotton Ground- Sunflower Sorghum
(number (number nuts (number (number
of bags) of bales) (number of bags) of bags)
of bags)
1990/91 5517 360 216 342 180
1991/92 2538 351 279 225 117
1992/93 .3861 288 144 468 99
1993/94 10710 190 926 297 126
1994/95 9135 378 270 1278 153
1995/96 1827 389 279 I 1080 180
1996/97 540 585 261 1233 162
TOTAL 34128 2541 2375 4923 1017
4.2.2.5 CROP PRODUCTION IN KEEMBE WARD
In the 1983/84 farming season Keembe Ward had generally a good harvest (table 23).
Despite the rainfall being below average in the 1983/84 farming season (table 16),
farmers in Keembe took advantage of stability in input supply, markets and early
planting to produce more (Department of Agriculture file, Chibombo, 1995). With a
great improvement in rainfall in the 1984/85 and 1985/86 farming seasons, farmers
continued to do well except for sorghum and cotton that slid down due to the farmers'
over-emphasis on maize, groundnuts and sunflower. In the 1986/87 and 1987/88
farming seasons, rainfall was below average (table 16). A reduction in rainfall, despite
the relative stability in the supply of inputs, seems to have caused crop production -

82
especially for maize - to decline (table 23). Cotton and groundnuts did not do well in
the 1986/87 farming seasons but recovered the following farming season (table 23). In
the 1988/89 farming season, although rainfall had improved to normal levels (table 16),
economic problems in the country seemed to have affected crop production, especially
maize, which continued to decline (table 23). In the 1989/90 farming season, rainfall
continued to be normal (table 16) and the government attempted to supply farmers with
inputs on time despite the continuing economic problems (Mwanza 1992b, Gerrard et al
1994). This measure helped raise production slightly in Keembe Ward (table 23).
Table 23. CROP PRODUCTION IN KEEMBE IN THE 1980s
Maize Cotton Groundnuts I Sunflower Sorghum
(number of (number of (number of I (number (number
bags) bales) bags) 1 of bags) of bags)
1983/84 14140 1386 738 I 1161 45
1984/85 15715 1332 576 864 0
1985/86 15985 900 729 837 0
1986/87 9038 621 558 1125 54
1987/88 4950 1098 729 1440 99
1988/89 3245 1188 648 1224 27
1989/90 8070 1026 882 1701 30
TOTAL 71143 7551 4860 8352 255
In the 1990/91 farming season, Keembe, like other areas in the region, faced reduced
rainfall (table 18) and a transition to economic liberalisation. Crop production, however,
improved (table 24) from the previous season largely because of the marketing
arrangements that the government had put in place the previous season (Department
of Agriculture file, Chibombo, 1995). The coming season, 1991/92 experienced a
severe drought (table 18). Except for sorghum that seemed to have done relatively
better because of being drought resistant, there was a reduction in production for all the
other crops (table 24). During the 1992/93 farming season, crop production improved
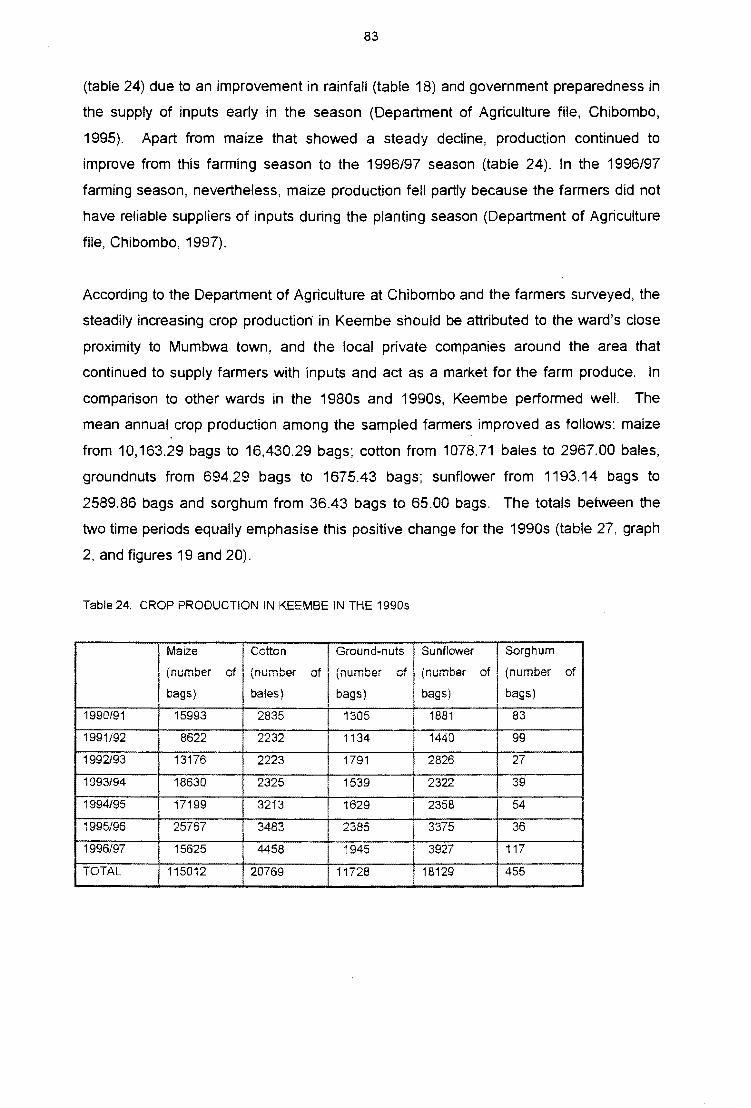
83
(table 24) due to an improvement in rainfall (table 18) and government preparedness in
the supply of inputs early in the season (Department of Agriculture file, Chibombo,
1995). Apart from maize that showed a steady decline, production continued to
improve from this farming season to the 1996/97 season (table 24). In the 1996/97
farming season, nevertheless, maize production fell partly because the farmers did not
have reliable suppliers of inputs during the planting season (Department of Agriculture
file, Chibombo, 1997).
According to the Department of Agriculture at Chibombo and the farmers surveyed, the
steadily increasing crop production in Keembe should be attributed to the ward's close
proximity to Mumbwa town, and the local private companies around the area that
continued to supply farmers with inputs and act as a market for the farm produce. In
comparison to other wards in the 1980s and 1990s, Keembe performed well. The
mean annual crop production among the sampled farmers improved as follows: maize
from 10,163.29 bags to 16,430.29 bags; cotton from 1078.71 bales to 2967.00 bales,
groundnuts from 694.29 bags to 1675.43 bags; sunflower from 1193.14 bags to
2589.86 bags and sorghum from 36.43 bags to 65.00 bags. The totals between the
two time periods equally emphasise this positive change for the 1990s (table 27, graph
2, and figures 19 and 20).
Table 24. CROP PRODUCTION IN KEEMBE IN THE 1990s
Maize I Cotton I Ground-nuts Sunflower I Sorghum
(number of
1
(number of (number of
1
(number ~· of
1
(number VI
bags) bales) bags) bags) bags)
1990/91 15993 2835 1305 1881 83
1991/92 8622 2232 1134 1440 99
1992/93 13176 2223 1791 2826 27
1993/94 18630 2325 1539 2322 39
1994/95 17199 3213 1629 2358 54
1995/96 21::7~7 \JIUI 3483 2385 3375 '2~
-..IV
1996/97 15625 4458 1945 3927 117
TOTAL 115012 20769 11728 18129 455
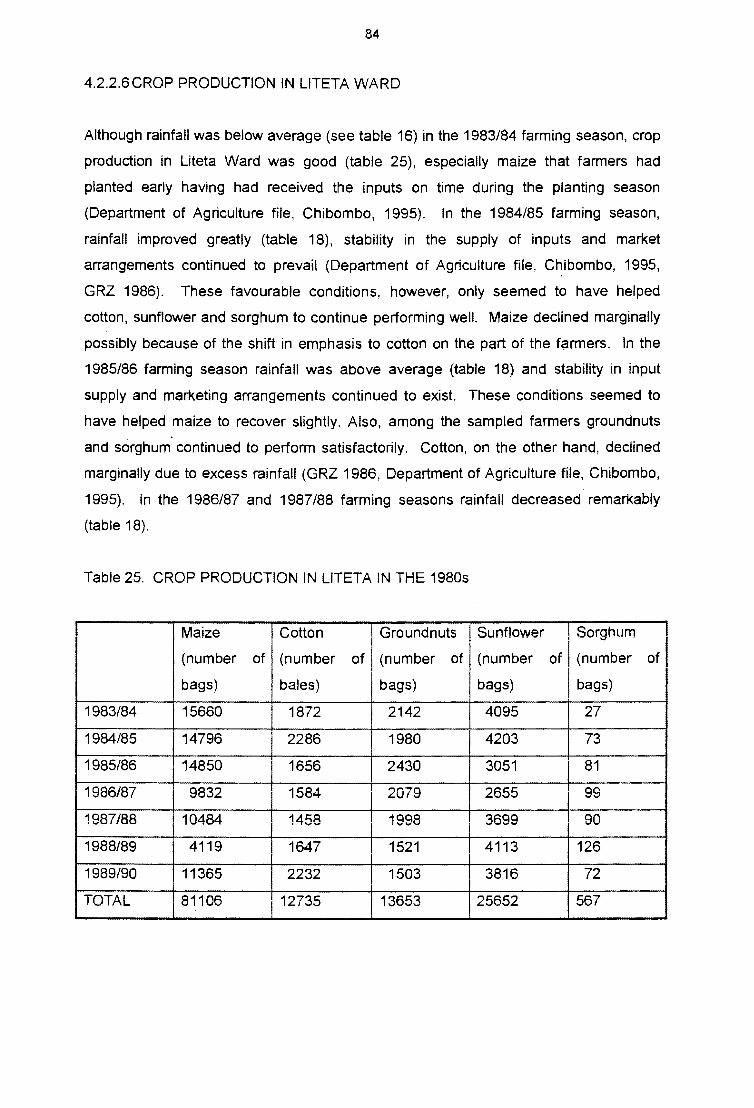
84
4.2.2.6CROP PRODUCTION IN LITETA WARD
Although rainfall was below average (see table 16) in the 1983/84 farming season, crop
production in Liteta Ward was good (table 25), especially maize that farmers had
planted early having had received the inputs on time during the planting season
(Department of Agriculture file, Chibombo, 1995). In the 1984/85 farming season,
rainfall improved greatly (table 18), stability in the supply of inputs and market
arrangements continued to prevail (Department of Agriculture file, Chibombo, 1995,
GRZ 1986). These favourable conditions, however, only seemed to have helped
cotton, sunflower and sorghum to continue performing well. Maize declined marginally
possibly because of the shift in emphasis to cotton on the part of the farmers. In the
1985/86 farming season rainfall was above average (table 18) and stability in input
supply and marketing arrangements continued to exist. These conditions seemed to
have helped maize to recover slightly. Also, among the sampled farmers groundnuts
and sorghum continued to perform satisfactorily. Cotton, on the other hand, declined
marginally due to excess rainfall (GRZ 1986, Department of Agriculture file, Chibombo,
1995). In the 1986/87 and 1987/88 farming seasons rainfall decreased remarkably
(table 18).
Table 25. CROP PRODUCTION IN LITETA IN THE 1980s
Maize Cotton I Groundnuts I Sunflower I Sorghum ! (number of (number of I (number of (number of I (number of I bags) bales) l bags) I bags) I bags)
1983/84 15660 1872 2142 4095 27
1984/85 14796 2286 1980 4203 73
1985/86 14850 1656 2430 3051 81
1986/87 9832 1584 2079 2655 99
1987/88 10484 1458 1998 3699 90
1988/89 4119 1647 1521 4113 126
1989/90 11365 2232 1503 3816 72
TOTAL 81106 12735 13653 25652 567

85
Although some relative stability continued in the supply of inputs and markets, crop
production decreased especially in the 1986/87 farming season when it was very dry
(table 18). In the 1988/89 farming season, crop production continued to fair badly
(table 25) despite having normal rainfall (table 18). This low production can be
attributed to the delay in payments the previous farming season and the general
economic stress the farmers were facing at this time. During the 1989/90 farming
season, maize and cotton seemed to have recovered (table 25) due to average rainfall
received and inputs being available to farmers in the area.
During the 1990/91 farming season, crop production declined slightly mainly because of
the small reduction in rainfall (table 18). The decline in production for maize and cotton
continued in 1991/92 farming season when the whole region experienced a severe
drought (table 18). But, despite the low rainfall in this farming season, groundnuts,
sunflower and sorghum did well. The fair production among these three crops (table
26) during this season may have been due to the crops having resisted the drought
(Department of Agriculture file, Chibombo, 1995). With an improvement in rainfall in
the 1992/93 farming season (table 18) and the government's supply of adequate inputs
early in the season, maize and cotton showed some degree of recovery (table 26). The
decline in the other crops could have been due to the farmers' own shift in emphasis .
from the other crops to the staple food, maize. During the 1993/94 farming season,
despite a low rainfall (see table 18), maize, sunflower and sorghum performed better
than in the 1992/93 farming season (table 26). During this season (1992/93) cotton may
have not performed well due to high rainfall (table 18). In the farming seasons 1994/95
and 1995/96 maize continued to perform well despite the rainfall that was slightly lower
than average (table 18). A reduction in cotton production during these seasons
coincided with the transition from LINTCO to the private companies such as LONRHO,
Amaka and Mbayimbayi and Sons in the 1993/94 farming season. For two seasons
(1994/95 and 1995/96) cotton production continued to be low (table 26) as farmers
seemed to have failed to respond to the new agricultural environment of liberalisation.
In the 1996/97 farming season maize, sunflower, and groundnut production slumped
despite adequate rainfall (tables 18 and 26). Only cotton production slightly recovered
(table 26). The Department of Agriculture at Chibombo, and the farmers interviewed

86
during the survey, attributed this decline to mixed signals received from the
Meteorological Department about the amount of rainfall the season would receive. It
was reported that rainfall would not be adequate, but the opposite proved the case.
In terms of mean annual crop production during the 1980s and 1990s, Liteta Ward
recorded an increase in maize production from 11,586.57 bags in the 1980s to
12,645.14 bags in the 1990s and in sorghum from 81.00 bags in the 1980s to 223.00
bags in the 1990s. A sharp increase in sorghum production seems to have emanated
from the increased demand of the crop in the local beer industry. But the ward had a
decline in cotton from 1,819.29 bales per annum in the 1980s to 1,077.43 bales to the
1990s, groundnuts fell from 1,950:43 bags per annum in the 1980s to 1,609.71 bags
per annum in the 1990s. Sunflower production among the sampled farmers dropped
from 3,664.57 bags per annum in the 1980s to 1,609.71 bags per annum in the 1990s.
These differences in crop production in Liteta are also displayed by the totals (tables
25, 26 and 27, graph 2).
Table 26. CROP PRODUCTION IN LITETA IN THE 1990s
Maize Cotton I Groundnuts Sunflower I Sorghum
(number (number I (number of (number of I (number of
of bags) I of bales) I bags) I bags) I bags) I 1990/91 8739 1395 972 2025 216
1991/92 7326 1188 1287 2088 263
1992/93 11673 1269 846 1818 180
1993/94 13239 1053 1953 2583 247
1994/95 13941 909 2682 1287 252
1995/96 22257 738 2403 1017 189
1996/97 11341 990 1125 976 214
TOTALS 88516 7542 11268 11794 1561
In summary, the total crop production figures of the surveyed farmers in the five
sampled wards show that Chibombo and Keembe Wards recorded an increase from
the 1980s to the 1990s. It seems that these two farming wards recorded an increase in

87
crop production in the 1990s mainly because of the existence of a support
infrastructure in their borders or in close proximity. Chaloshi Ward recorded a decline
from the 1980s to the 1990s. In the 1990s, Chikobo Ward had a decline in maize,
cotton, groundnuts and sorghum, but an increase in sunflower. In the 1990s, Liteta
Ward recorded an increase in maize and sorghum but a decrease in cotton, groundnuts
and sunflower. The wards with crop production decline have had no established
support infrastructure for individual crops within close reach. Changes in crop
production are better summarised by graph 2, and figures 19 and 20.
More specifically, evidence from the survey in this study reveal that the changes in crop
preferences, hectarages and production in wards were a direct response to the
emerging conditions after 1991. In Chaloshi, it seems that the changes are being
influenced by the collapse of the agricultural support system at Chisamba Siding,
Mupamapamo and Mwachisompola, and the increasing demand for manual labour in
the nearby commercial farms from the peasant farmers. The decline of the crop
hectarage and production in Chikobo, and some parts of Chibombo and Liteta, seems
to be emanating from the declining state of the communication infrastructure (roads)
and the collapse of the agricultural support system. The favourable crop hectarage and
production in Keembe and large sections of Chibombo and Liteta seems to be a direct
response to the emergence of a private agricultural support system, fair state of the
communication infrastructure and effective markets in nearby towns of Mumbwa
(Keembe) and Kabwe (Chibombo and Liteta).
For the district as a whole, the 1990s seem to have been characterised by an increase
in crop production figures (table 28). According to the Department of Agriculture at
Chibombo, crops have been able to do well particularly in places that are accessible to
main roads, near markets or have alternative ways (for example buying chemical
fertiliser and seed from travelling salesmen on highways) of obtaining agricultural inputs
especially seed, chemical fertilisers, pesticides and farming equipment. For the areas
that did not do well, the " ... main problem was that farmers had no money to buy
fertiliser on cash basis ... " (Shamatutu 1997:2). In order to help those farmers without
money obtain chemical fertiliser, the ZN FU in December 1996 said " ... members stuck
with maize for lack of market were ... free to barter their produce with some limited

88
stocks of fertiliser with the union" (Times of Zambia, Wednesday, December 25,
1996:2). During the 1996/97 farming season, many farmers took advantage of this
announcement to barter their maize with fertilisers. This happened particularly in
remote parts of the district. Other reasons contributing to the poor performance in
production among some farmers includes the poor state of communication
infrastructure, lacking a reliable input supply and market networks.
Table 27 displays the crop production percentage changes in the five wards of
Chibombo District among the sampled farmers.
Table 27. CHANGES IN CROP PRODUCTION FROM THE 1980s TO THE 1990s,
EXPRESSED AS ABSOLUTE FIGURES (BAGS) AND PERCENTAGES
BASED ON TOTALS.
Chaloshi Chibombo Chi kobo Keembe Liteta.
(bags) (bags) (bags) (bags) (bags)
Maize (22827) 7219 (11374) 43869 7410
(56.7%) 54.9% (25.0%) 61.7% 9.1%
Cotton (576) 2968 (1626) 13218 (5193)
(5.8%) 121.6% (39.0%) 175.0% (40.8%)
Ground nuts 18 549 (2368) 6868 (2385)
0.3% 19.9% (50.0%) 141.3% (17.5%)
Sunflower (3375) 271 1683 9777 (13838)
(62.1%) 56.8% 50.0% 117.1% (53.9%)
Sorghum (25) 290 (234) 200 994
(7.5%) 906.3% (18.7%) 78.4% 175.3%
NB:
-Figures in brackets indicate a decrease in production.
-Percentages are rounded off to one decimal place.

89
This information is also displayed here in graph 2.
Graph 2- CROP PRODUCTlON PERCENTAGE CHANGE BE1WEEN THE 1980S AND 1990S
1000.-------------------------------------------------
800 +-----------------600 +----------------
400 +-----------------' 200 +------------------' o~~--~--~~R=~
-200~------------------------------------------------
Chaioshi (%) Chibombo (%) . Chikobo (%) Keem be(%) Uteta (%)
D Maize Iii! Cotton 0 Ground nuts 0 Sunflower ll!l Sorghum
Table 28 brings out interesting points about crop production in Chibombo. Firstly, it
shows that crop production in Chibombo, like other places in Central Province,
fluctuates from year to year depending on the prevailing conditions. With favourable
weather conditions coupled with early delivery of agricultural inputs and good market
conditions, for example in the 1989/90, 1990/91, 1992/93 and 1995/96 farming
seasons, crop production increased. This aspect is emphasised by the 1995/96
farming season when all crops fared above average. In years of poor rainfall (the
drought years), unfavourable market conditions and late delivery of agricultural inputs,
for instance in the 1991/92, 1993/94 and 1994/95 farming seasons, production of crops
- particularly maize - was low. According to the field data, these three seasons were
the most chaotic farming seasons in terms of rainfall, input supply and marketing
arrangements. The problems in input supply and marketing arrangements affected the
production of maize, cotton, soya beans, groundnuts and sorghum.
Secondly, table 28 also reveals that maize responds more to changing farming
conditions from year to year than any other crop. The huge fluctuations in maize
production between years may be attributed to several factors. Thus, maize seems to
be too dependent on external factors such as time of planting, rainfall amount received
during the growing season, amount of basal and top dressing fertilisers applied to the
crop and when this is done. Furthermore, maize seems to be easily affected by the
number of farmers that plant it during that particular season and the price offered by the

90
buyers at harvest time. With unstable market conditions in the 1990s, unlike in the
1980s, it appears that while maize production figures have increased, there are more
fluctuations (positive as well as negative) from one season to the other (table 28). The
1980s, although with smaller production figures (see table 28), showed an increase in
production. In the researcher's view, the production figures in the 1980s may indicate
stability and predictability of market conditions during that time. In the 1990s, there
seems to be instability and unpredictability in the market.
Table 28. CROP PRODUCTION ESTIMATES FOR CHIBOMBO DISTRICT
1988/89 1989/90 1990/91 1991/92 1992/93 1993/94 1994/95 1995/96
Maize 15500 98200 850000 841000 1340000 812000 603000 1600000
(90 kg
I I I bags)
Cotton - 177000 2200000 3500000 5800000 3800000 3300000 15CXXJOOO
(KGs)
Sun 2200 10300 l:J"f'\f'\ 5800 19400 22000 "')-tf'\1"\f'\
314451
I I I ;..JfUU
I I I I ..J.IVUU
I flower
(50 kg 1 I I '
I I I I bags)
Soya - - 2500 8800 16300 2600 800
Beans 3912
(50 kg I bags) i I I Ground 1 750 883 2200 4562 19700 4800 17200 64560
nuts (80 I I kg bags)
Sorghum 300 222 400 530 689 1800 4000
(50 kg
I 5616
bags)
Note: A dash (-) represents no statistics available.
SOURCE: Chibombo District Agriculture Department, 1997.

91
These factors may not affect the other crops in the same way as they do for maize.
This is so (perhaps) because they are drought resistant, for example cotton, sorghum
and to some extent sunflower. Other crops, such as sunflower, groundnuts and
sorghum are less affected by the supply of inputs because they are grown without a
huge dependence on chemical fertilisers. Similarly, for these crops, farmers maintain
seed from one harvest for planting in the coming season. This is particularly common
with groundnuts and sorghum. While cotton has a definite advantage of being a
drought resistant crop, it also enjoys an elaborate field infrastructure and competitive
price at harvest. The existence of this infrastructure and competitive price at harvest
are responsible, to a large extent, for the rising production throughout the period shown
in table 28.
To some extent, the production of sunflower and groundnuts has been influenced by
the establishment of oil processing companies in the country in the late 1980s
(Premium Oil Company) and (Amanita Zambiana) in the 1990s. Although these are
deliberately promoting the cultivation of seed oil crops in the country, they have no field
infrastructure in farming areas such as Chibombo. But, the mere existence of a market
is stimulating high production among the farmers as they are assured of a buyer every
marketing season. When comparing the 1980s with the 1990s - particularly the years
1988/89 and 1989/90, on one hand, and the period between 1992 and 1996, on the
other - one would argue that sunflower production seems to have tremendously
expanded in the 1990s (see table 28). To a large extent, this can be attributed to better
producer prices and emergence of oil processing machines (the yenga press).
The increase in production of sorghum in the 1990s may be attributed to the
emergence of several beer-brewing companies in urban centres. Unlike in the 1980s,
when brewery industries had no deliberate linkage with farmers, now there is a policy of
promoting the cultivation of sorghum and millet. The companies involved in such
schemes include Zambia National Breweries and Chinika Breweries. This seems to be
boosting sorghum production in Chibombo District.

92
4.3 AGRICULTURAL SUPPORT SYSTEMS IN CHIBOMBO DISTRICT IN THE 1980s
AND THE 1990s
4.3.1 INPUT SUPPLY AND PROVISION OF CREDIT
During the 1980s, the National Agricultural Marketing Board (NAMBOARD), Zambia
Seed Company (ZAMSEED), Lint Company of Zambia (LINTCO), Zambia Co-operative
Federation (ZCF), Kabwe Rural District Co-operative Union (KRDCU) and Credit Union
and Savings Association (CUSA) had an elaborate agricultural support network in
Chibombo District (figure 13). Nitro"gen Chemicals of Zambia (NCZ) only had an urban
network but used the field infrastructure for NAMBOARD, ZCF, Kabwe Rural District
Co-operative Union and CUSA to supply its chemical fertilisers to the farmers. Lima
Bank, on the other hand, only relied on its urban infrastructure to supply the farmers
with cash credit. With a sustained government support during the 1980s, these
companies managed to render their services to the farming community (Mwanza 1992a
and b, Kokwe 1997).
With the advent of economic liberalisation in 1991, the government of Zambia
discontinued its financial, material and logistical support to the agricultural companies
and the co-operatives (Kokwe 1997, GRZ 1996). The government's withdrawal of
support led to the collapse of the old institutions such as NAMBOARD, ZCF, CUSA,
Chibombo District (Kabwe Rural) Co-operative Union and Lima Bank. Although
ZAMSEED and NCZ seem to have survived the wind of change, their operations are
not as smooth as they were in the past. The collapse of these agro companies brought
about the cessation of the once elaborate agricultural support system in Chibombo.
In place of the collapsed government-sponsored agricultural support system, a number
of new private companies emerged. The new companies largely occupied the physical
infrastructure of the collapsed companies, particularly along the major roads (figure 14).
The new private companies include Omnia and Kynoch that supply chemical fertilisers;
Pannar, Seed-CO, Cargill, and Carnia responsible for supplying hybrid seed through
stockists; LONRHO, Mbayimbayi and Sons, Amaka, Swarp Spinning and Cotmark that
supply inputs and buy cotton; Chisamba Marketing and Tazcor that supply inputs and

93
buy maize (see figure 14 for the companies with a field network). Although the new
companies have a field support system that is limited in spatial extent as compared to
the wide spread support system of the collapsed companies of the 1980s (see figures
13 and 14}, their operations seem to be more competitive and efficient. Other
companies involved with the supply of chemical fertilisers are, though without a field
support system of their own, the two commodity exchanges. Thus, the Agricultural
Commodity Exchange (ACE), established in 1994 as a commodity market by the
Zambia National Farmers' Union (ZNFU) and based in Lusaka; and the Kapiri Mposhi
Commodity Exchange (KCE) established in 1997 and based at Kapiri Mposhi. Of the
two Commodity Exchanges, only ttie former has expressed intentions of establishing a
field infrastructure. This proposal is actually in agreement with the views of the Minister
of Agriculture, Food and Fisheries. At one time, he was quoted directing the
Agricultural Commodity Exchange to " ... build depots in the rural areas so fertiliser can
be delivered to the farmers who need not travel to Lusaka to buy fertiliser as the cost of
production shoots up" (Times of Zambia, Thursday, January 2, 1997:1).
Since the demise in the middle 1990s of Lima Bank, ZCF Finance Services and CUSA,
there has been no supplier of cash credit to peasant farmers in Chibombo District and
perhaps - other parts of Central Zambia. The government has made some attempts to
entice the private sector to fill up this void but to no avail. In comparison to the 1980s
when farmers were provided w1th casi1 loans annually, the lack of this facility in the
1990s has resulted in operational difficulties for the smallholder farmers. Since the
collapse of the cash lending institutions, there is evidence that several farmers in
different parts of Chibombo are not able to buy inputs and other farming requisites.
Nevertheless, in terms of spatial distribution the agricultural support system of the
1980s was more widely spread than the agricultural support system of the 1990s (see
figures 13 and 14). Further, it may be said that the agricultural support system of the
1980s had such a wide network due to its long history in agriculture and the financial,
material and logistical support it had enjoyed for many years from government. On the
other hand, the new agricultural support network is still confined to the main roads and
other communication networks due to its limited financial resources and short history in

94
the agricultural industry. With more time, the new infrastructure may expand into the
more remote areas.
Research information has shown that the private companies now operating in
Chibombo District, perhaps owing to their self-sustaining base and competitive nature,
seem to be serving the peasant farmers better than the parastatals of the 1980s. For
instance, cotton companies now supply inputs (seed and chemicals) and equipment
early and at competitive prices. Additionally, their loan recovery rate is far above 70
percent as compared to the government controlled structures that had a loan recovery
of as " ... low as 3.34% for SGS and 17.51% for Cavmont" (Mwanakasale 1996:6).
4.3.2 EXTENSION SERVICES
In the 1980s, the Department of Agriculture and LINTCO provided farmers with
extension services through an extensive field network (figure 3). Because of the
monopolistic nature of the market at this time, these two extension providers focussed
more on production than marketing. According to the farmers in the study area, the
monopoly enjoyed by the two bodies caused the quality of the service to be poor. The
low quality extension services were common with the Department of Agriculture mainly
because of limited resources.
With the coming of economic liberalisation in 1991, the providers of extension services
increased in number. In addition to the Department of Agriculture, the service is now
being provided by LONRHO, Amaka, Mbayimbayi and Sons, Cotmark and other new
private companies (see figures 4 and 14). The increase in number of extension service
providers has resulted in competition and a marked improvement in the quality of
services. Moreover, the private companies and the Department of Agriculture are
offering production extension services free of charge. In the 1990s, field evidence
revealed that extension officers visited the farmers more often (than in the 1980s) to
monitor the progress of crops. Such visits are very common among the extension
officers from private companies because of their capacity to cover large distances with
motor cycles, unlike extension officers under the Department of Agriculture.

95
Despite the wide availability of extension services in the 1990s, the type of information
they provide is still- as it has always been -about production. This is not completely
appropriate and not adequate, as farmers also require information about storage,
processing and marketing.
4.3.3 PROVISION OF STORAGE FACILITIES
During the period of centralised planning, the state-funded companies· provided crop
storage facilities within the premises of their widespread field infrastructure (figure 13).
On the farms, there were granaries to store food reserves for the whole year and
temporary structures to keep crops meant for selling only for a short period. According
to Chabala and Sakufiwa " ... there was no incentive for farmers to develop on-farm
storage, since ... all their produce were purchased during the dry season. The ...
government was meeting storage and other marketing related costs ... " (Chabala and
Sakufiwa 1993:44). One major incentive lacking during the 1980s to encourage the
development of on-farm storage facilities, was the change in prices of farm produce at
different times of the year (Chabala and Sakufiwa 1993:44). The government-set
prices of farm produce remained the same throughout the year and hence farmers did
not see the need to hold back their produce in the year.
With the coming of liberalisation in 1991 and the eventual collapse of agro parastatals,
crop storage had to be provided by the emerging private sector. On its part, the
government through its agricultural policy, undertook to " ... making public storage
facilities available to the private sector (for hire)" (GRZ 1992:12). In line with this policy
of hire, a number of private companies operating in Chibombo District took over the
premises previously used by the collapsed parastatals (figure 14). Among the
companies that took advantage of this policy of hire were LONRHO, Amaka,
Mbayimbayi and Sons, Swarp Spinning, Tazcor and Chisamba Marketing Company. In
addition to adopting some old infrastructure, LONRHO has created some new depots in
the farming community. According to field evidence, this was done to reduce the length
of distances farmers are expected to cover when delivering their produce. To a large
extent, one would argue that this is a remarkable improvement brought about by
liberalisation. However, many of these depots operate during the marketing season

96
only. When one compares the distribution of the depots in Chibombo District in the
1980s to the 1990s, it is clear that the infrastructure of the 1980s was more widespread
than the present one. With differences in prices of farm produce at different times of
the year, there is some limited evidence that farmers are also starting to develop on
farm storage facilities for marketable crops. It appears that this is being done to take
advantage of marketing opportunities that arise later in the year when prices increase.
The only problem at the moment, however, is that farmers that have started developing
such on-farm storage facilities are still few.
4.3.4 BUYERS OF AGRICULTURAL PRODUCE
During the 1980s, NAMBOARD, KRDCU, CPCMU, CUSA and ZCF (figure 13) bought
the farm produce from farmers at government-set prices (Mwanza 1992a and b,
Chabala and Sakufiwa 1993, GRZ 1996). These companies used their wide spread
field network to buy the farm produce from the farmers. With the introduction of
economic liberalisation in 1991 these organisations collapsed.
After 1991, new buyers of crops appeared. In Chibombo District, the list of new
entrants in the market included Chisamba Marketing, Tazcor, LONRHO, Amaka,
Mbayimbayi and Sons, and Cotmark. Most of these organisations inherited field
network of the collapsed companies, especially the facilities along major
communication networks (figure 14). In comparison to the network of the 1980s, their
network is limited in distribution (figures 13 and 14). However, while these companies
cover only small farming areas, field evidence shows that they are efficient,
competitive, self-supporting and generally more effective in servicing the peasant
farmers than the collapsed parastatals or government appointed buyers of the 1980s.
Other companies involved with buying farm produce are Amanita Zambiana which buys
sunflower and groundnuts; National Milling Company, Simba Milling Company and
Antelope Milling Company which buy mainly maize; National Breweries and other
breweries which buy sorghum. Amanita Zambiana, National Milling, Simba Milling,
Antelope Milling, and National Breweries all have no field infrastructure in the farming
community. Their purchases are dependent on the farmers' deliveries to their

97
premises. The advantage they have is that they pay the farmers promptly in cash for
any deliveries made. However, the fact that they only rely on deliveries from farmers
means that they only cater for those farmers that have transport, owned or hired. This
limitation entails that the majority of the peasant farmers, particularly those in outlying
areas, are not catered for.
4.4 THE COMMUNICATION INFRASTRUCTURE IN CHIBOMBO DISTRICT IN THE
1980s AND THE 1990s
The total length of the rail line in Chibombo District in the 1980s, and it is still so today,
was 71 kilometres (Chibombo District Council file, 1996). This passes through the
eastern part of Chibombo District (figure 11). No marked change either in length or
condition has taken place on the railway.
In the 1980s, Chibombo District had a total length of 120 kilometres of tarred roads.
This included 81 kilometres of the Great North road, 25 kilometres of the road from
Chisamba turnoff to Chisamba Siding, and 14 kilometres of the road from Lusaka to
Mumbwa (figure 11 ). In the 1990s, Chibombo has a total of 95 kilometres of tarred
roads. The 95-kilometre network includes the 81-kilometre stretch of the Great North
road and the 14-kilometre stretch of the road from Lusaka to Mumbwa. The 25-
kilometre road linking Chisamba turnoff to Chisamba Siding is now a maintained road.
The Chisamba turnoff-Chisamba Siding road has deteriorated into a maintained road
due to lack of regular maintenance (Chibombo District Council file, 1996). So, the
length of tarred roads has decreased by 20.8 percent.
During the 1980s, Chibombo District had a total of 156 kilometres of main gravel roads.
This length comprised 7 4 kilometres of the road from Landless Corner to Mumbwa and
82 kilometres of the road from Lusaka through Chamuka to Kabwe (figure 11). These
roads were passable all-year round. In the 1990s, the total length of main gravel roads
in Chibombo has remained at 156 kilometres. But the length of passable roads
throughout the year has declined to 7 4 kilometres. Thus, the road from Landless
Corner to Mumbwa is the gravel road one can drive through at any time of the year.

98
The 82 kilometres stretch of the road from Lusaka through Chamuka to Kabwe is
passable only during the dry season (Chibombo District Council file, 1996).
In the 1980s, Chibombo had a total of 288 kilometres of maintained roads. This length
of maintained roads included 65 km of the road from Keembe through Muchenje to the
Great North road; 7 km of the road from Chibombo Bema to the Great North road; 19
km of the road from Mwachisompola through Chibombo to Chitanda; 50 km of the road
from Chisamba Siding to Chongwe; 35 km of the road from Chitanda turnoff to
Chitanda (figure 11). Of these roads, a total length of 176 kilometres (61.1%) was
passable throughout the year and 112 kilometres only passable during the dry season
(Chibombo District Council file, 1996). The 112-kilometre stretch of road network
included 44 km of the road from Chitanda to Kasonkomona; 51 km of the road from
Chitanda to Chibombo; 17 km of the road from the Great North road to Chabusha
(figure 11 ).
In the 1990s, Chibombo District has a total length of 313 kilometres of maintained
roads. The increase has been brought about by a stretch of 25 kilometres of the road
from Chisamba turnoff to Chisamba Siding. This stretch of the road was tarred in the
1980s. This 313 kilometres of maintained roads includes 65 kilometres of the road
from Keembe through Muchenje to the Great North road; 7 km of the road from
Chibombo Bema to the Great North road; 19 km of the road from Mwachisompola
through Chibombo to Chitanda; 25 km of the road from Chisamba turnoff to Chisamba
Siding; 35 kilometres of the road from Chitanda turnoff to Chitanda (figure 11). Of the
313 kilometres of maintained roads, 151 kilometres (48.2%) are passable throughout
the year and 162 kilometres (51.8%) are passable only during the dry season
(Chibombo District Council file, 1996). The roads that are passable during the dry
season only include 44 km of the road from Chitanda to Kasonkomona; 51 km of the
road from Chitanda to Chibombo Bema; 17 km of the road from the Great North road to
Chabusha; 50 km of the road from Chisamba Siding to Chongwe (figure 11 ).
In the 1980s, Chibombo District had a total length of 170 kilometres of motorable tracks
(Chibombo District Council file, 1996). Of the 170 kilometres, a total of 51 kilometres of
road network was passable throughout the year (Chibombo District Council file, 1996).

99
The passable roads (throughout the year) were the 46 km road from Mwachisompola to
Kabile, and the 5 km of the road from Off-Mumbwa road to Chitanda (figure 11 ). 119
kilometres stretch of roads, on the other hand, was passable during the dry season
only. This category of roads included the 25 km of the road from Chabusha to
Kamano; 21 km of the road from Mwachisompola to Kabile; 5 km of the road from Off
Mumbwa road to Chitanda; 46 km of the road from Chongwe to the town of Kabwe
(figure 11).
In the 1990s, the total length of motorable tracks has remained at 170 kilometres
(Chibombo District Council file, 1996). Of this length, only 25 kilometres is passable
throughout the year - the road from Off-Mumbwa road to Kabile (Chibombo District
Council file, 1996, figure 11). In addition to this, a 97-kilometre network of roads is
passable during the dry season only. The 97-kilometre stretch of roads comprise 25
km of the ro~d from Chabusha to Kamano; 21 km of the road from Mwachisompola to
Kabile; 5 km of the road from Mwachisompola to Chitanda; 46 km of the road from
Chongwe to the town of Kabwe (figure 11). In the 1990s a total length of 48 kilometres
roads are impassable. The impassable roads include a 40 km stretch of road from Off
Chibombo road to Chitanda, and an 8 km stretch of road from Chitanda through
Kasonkomona to Lukanga (figure 11).
In summary, one would say that Chibombo District has had a total of 734 kilometres of
road networks both in the 1980s and 1990s. In the 1980s, a total iength of 503
kilometres (68.5%) was passable throughout the year against a total length of 345
kilometres (47.0%) in the 1990s. In the 1980s, a total length of 231 kilometres (31.5%)
of roads was only passable during the dry season, compared to a total length of 341
kilometres (46.5%) in the 1990s. In the 1980s, there was no record of impassable
roads against a total length of 48 kilometres (6.5%) of impassable roads in the 1990s.
These records seem to indicate that the 1980s had better roads than the 1990s. This
change in the quality of road networks in Chibombo District may be attributed to the
lapse in the government's road maintenance policy (Chibombo District Council file,
1996).
100
4.5 SUMMARY OF CHAPTER 4
This Chapter has argued that from the 1980s to the 1990s, substantial changes had
taken place in the cropping patterns and crop production figures, agricultural support
systems and the road infrastructure of Chibombo. Some changes have been beneficial
to the farmers while others have not. Beneficial developments highlighted include a
shift by the smallholder farmers to the crops previously neglected such as groundnuts,
sunflower, sorghum and vegetables; an expansion of the farmed hectarage for such
crops as cotton and hence an increase in their production; emergence of a private
agricultural support system such as Pannar, Carnia, Cargill, Seed-CO, LONRHO,
Amaka, Cotmark, Mbayimbayi and Sons; and the changes in the farmers' attitude
towards the ever changing market environment in the days of liberalisation.
Negative deyelopments have also taken place. First, there seems to be a growing
reduction in the hectare of maize. Secondly, the removal of government support (in
terms of subsidies) and protection (through monopolistic statutes) for agricultural
parastatals have resulted in the collapse of NAMBOARD, Lima Bank, ZCF Finance
Services and the district co-operatives. From the old agricultural support system only
ZAMSEED and NCZ have survived. The collapsed companies had a more extensive
field network throughout Chibombo than the agro companies of the 1990s. The road
infrastructure has also suffered from neglect and its state is deteriorating. The poor
state of roads seem to have started affecting the farmers in far-flung areas where
transporters are unwilling to go to, either to deliver inputs or buy farm produce.

101
CHAPTERS
CONCLUSIONS AND RECOMMENDATIONS
5.1 CONCLUSIONS
The previous chapters have covered the historical development of small-scale farming
in Chibombo District, and to some extent, Zambia's pre-independence days, highlighted
the post-independence agricultural policies of centralised planning, in which agriculture
in the country was run through parastatals and strict government regulation. Finally,
they have given an account of the liberalisation policies of the 1990s and their impact
on the spatial patterns of peasant crop farming in Chibombo District.
With the introduction of economic liberalisation in 1991, particularly after 1994/95
farming season when the new agricultural policies started to take root, the spatial
patterns of peasant crop farming in Chibombo District began to change. Some of the
changes were positive and others negative. Conclusions drawn under each of the three
sub-hypotheses follow.
1. The spatial pattern of crop production and cropping systems of peasant
farmers in the 1990s differs markedly from the pattern that existed in the
1980s.
First, despite the introduction of iiberalisation in agriculture in 1991, farmers in
Chibombo District continued to grow mainly maize, cotton, groundnuts, sunflower and
sorghum.
At this level, the hypothesis is rejected as not completely correct. Although some shift
has started evolving, farmers are yet to show major changes in the crops the types of
crops they grow. Changes that have been noticed are more to do with crop emphasis
than complete change in crops grown.
But in terms of land-use, the pattern which has emerged is that there was a decline in
land hectares for maize in most wards such as Chaloshi, Chibombo, and Chikobo but

102
an increase in Keembe and Liteta; cotton hectares increased in all wards; groundnut
hectares remained the same in Chaloshi but declined in Chibombo and increased in
Chikobo, Keembe and Liteta; sunflower hectares declined in all sampled wards
(compare figures 15 and 16). Against this background of changes in hectarage, crop
production faired as follows: maize declined in Chaloshi and Chikobo, increased in
Chibombo, Keembe and Liteta; cotton declined in Chaloshi, Chikobo and Liteta but
increased in Chibombo and Keembe; groundnuts production declined in Chaloshi,
Chikobo and Liteta but increased in Chibombo and Keembe; sunflower declined in
Chaloshi and Liteta but increased in Chibombo, Chikobo and Keembe, and sorghum
production declined in Chaloshi and Chikobo but increased in Chibombo, Keembe and
Liteta (compare figures 19 and 20). These changes seem to have been a direct
response to rainfall conditions, and changes in the communication infrastructure
(especially in Chikobo) and the agricultural support system (for example in Chaloshi).
As explained earlier, the agricultural policy of the 1980s encouraged the direct
government involvement in agriculture either through financial and logistical support to
agro companies and co-operatives, determination of the producer prices of various
crops or the government's establishment of farms in different parts of the country
(Mwanza 1992a and b, World Bank 1994, GRZ 1996, Kokwe 1997). After 1991, this
policy changed. In the 1990s, the government has discontinued the financial and
logistical support it gave the agro companies and co-operatives, the setting and
announcement of producer prices and the ownership of state farms (Mwanza 1992a
and b, Chabala and Sakufiwa 1993, World Bank 1994, GRZ 1996, Kokwe 1997).
Without government support, farmers have no access to adequate cash and
commodity loans, predictable markets and the stimulating agricultural environment of
the 1980s. With these marked changes, this hypothesis is accepted as correct.

103
2. The spatial pattern of the agricultural support system in the 1990s differs
markedly from the pattern that existed in the 1980s.
This hypothesis is accepted on the following accounts:
With the introduction of economic liberalisation in 1991, the existing institutions
such as NAMBOARD, LINTCO, Lima Bank, Kabwe Rural District Co-operative
Union, Central Province Co-operative Marketing Union, CUSA and ZCF Finance
Services collapsed. NCZ scaled down its production to a point that it started
importing the same products it ·used to export (GRZ 1996, Department of Agriculture
file, Chibombo, 1996). ZAMSEED and NCZ have survived and continue to operate.
TBZ, though operating, is facing serious financial problems (GRZ 1996 and 1997).
This agricultural support system either collapsed or changed in the way of operation
because the government withdrew the financial and logistical support it had
rendered previously (Mwanza 1992a and b, GRZ 1996, and World Bank 1996).
The collapse of the majority of these agricultural support institutions created room
for the emergence a new support system but also left the farmers without a support
system, especially in the transition period (GRZ 1996, Kokwe 1997). Of the five
wards sampled, Chaloshi and Chikobo were the most affect.
In the place of the collapsed agricultural support system of the 1980s, a privately
funded and controlled agricultural support system has emerged. This includes
Chisamba Marketing Company, Tazcor, LONRHO, Amaka, and Mbayimbayi and
Sons (figure 14). Unlike the agricultural support system of the 1980s that was very
widespread in Chibombo and other areas of Central Zambia, the new system is
limited only to the areas near the main communication networks and occupy the
structures of the collapsed infrastructure (see figures 13 and 14). Despite being
new in the agricultural industry and limited to a few areas only, however, the new
agricultural system is self-supporting and has proved to be more efficient and
competitive in its delivery of services to the farmers (Department of Agriculture file,
Chibombo, 1996, World Bank 1996, GRZ 1996 and 1997, Kokwe 1997).

104
This study reveals that in other parts of Central Zambia several other private
institutions have emerged. This includes firms selling chemical fertilisers (Omnia
and Kynoch), a buyer of groundnuts and sunflower (Amanita Zambiana), traders in
various agricultural products (Agricultural Commodity Exchange, Petauke
Commodity Exchange and Kapiri Commodity Exchange), suppliers of hybrid seed
and agricultural chemicals (Pannar and Seed-Co). In Chibombo District, non of
these companies has a field network. Omnia, Kynoch, Pannar and Seed-Co sell
their products either through stockists (these are commercial farmers and any
interested retailers in farming areas) or farmers buy directly from the urban outlets
of these companies. Amanita· Zambiana, on the other hand, deals with individual
farmers. The Agricultural Commodity Exchange, Petauke and Kapiri Commodity
Exchanges are yet to make an impact in Chibombo.
3. The spa~ial pattern of communication infrastructure in the 1990s differs
markedly from the pattern that existed in the 1980s.
Firstly, this hypothesis is rejected on the premise that in the 1990s the 71 kilometre
length and state of the railway have remained the same as they were in the 1980s.
From the 1980s to the 1990s, no marked developments have taken place in the rail line
or its effectiveness to deliver services to the people of Chibombo District.
The hypothesis, however, is accepted on the ground that there have been marked
changes to the road infrastructure in the 1990s. The changes that have taken place to
the road infrastructure in Chibombo District are discussed below.
After 1991, certain changes have occurred in the 734 kilometres of road network in
Chibombo District. Firstly, the total length of tarred roads has declined from 120
kilometres in the 1980s to 95 kilometres in the 1990s. Secondly, the total length of
passable gravel roads throughout the year has declined from 156 kilometres in the
1980s to 7 4 kilometres in the 1990s. A length of 82 kilometres of gravel roads is now
passable only during the dry season. In the 1990s, the total length of maintained roads
has increased from 288 in the 1980s to 313 kilometres. Of this total length, 151
kilometres is passable throughout the year and 162 kilometres is passable only during

105
the dry season. For motorable tracks, of the 170 kilometres only 25 kilometres is
passable throughout the year, 97 kilometres is passable during the dry season only and
48 kilometres is impassable throughout the year. These changes can be summarised
as follows: of the 734 kilometres of road network in Chibombo District, a total of 503
kilometres (68.5%) were passable throughout the year in the 1980s against a length of
345 kilometres (47.0%) in the 1990s; in the 1980s, a total of 231 kilometres (31.5%)
were passable during the dry season against 341 kilometres (46.5%) in the 1990s; in
the 1980s, there was no record of impassable roads (0%) against a total length of 48
kilometres (6.5%) in the 1990s (Chibombo District Council file, 1997). These statistics
reveal that the state of the road infrastructure in Chibombo District has declined in the
1990s. The decline is attributed to lack of regular maintenance in the 1990s (World
Bank 1994).
In the sampled wards, the road infrastructure has particularly deteriorated in Chikobo,
parts of Chaloshi, Chibombo, Keembe and Liteta. In other wards, they have
deteriorated in Kakoma, Katuba, Chamuka North and South, lpongo, Chitanda,
Muchenje, Mungule, Mashikili, parts of Chunga and Chisamba.
5.2. RECOMMENDATIONS
Below are recommendations for consideration. These recommendations have been
divided into three categories: (1) the farmers' ways of solving the problems facing them;
(2) the private sector's role and (3) the government's role in surmounting the many
problems facing the peasant farmers in Chibombo today. These suggestions are
confined to the abilities of each of the parties involved to find solutions to the problems
facing peasant farmers.
5.2.1 RECOMMENDATIONS FOR PEASANT FARMERS
It is recommended that peasant farmers should consider the following:
(a) Establishing temporary groups based on their needs at a given time. This means
that, for convenience and practical reasons, farmers should pool their resources

106
together both at planting and selling seasons to buy inputs or sell their produce to the
market as a group. This suggestion is more applicable to farmers who have no
transport or any other resources of their own, especially in remote wards such as
Chamuka North and South, lpongo, Chitanda, Chikobo, Kakoma and Mashikili. If this
suggestion is implemented costs of obtaining inputs and delivery of produce to the
market could be minimised.
What is being suggested here is that each farmer puts his financial or commodity
resources in the community pool. The pooled resources will be used to source inputs
from suppliers in bulk using transport hired by the whole group and on arrival share the
bought inputs according to money or resources contributed. In the same way, when it
comes to selling the produce to, perhaps, a distant market, the whole group will put
their produce together, hire transport and deliver the produce as a single entity. On
getting the proceeds, the farmers merely sit down to share the money according to the
number of bags sold by each one of them. The cost of hiring transport, depending on
what the farmers agree, may be calculated on the basis of the individual amounts of
inputs and/or produce sold by each farmer. In the researcher's view, this will allow
farmers to enjoy the advantages of a group while still retaining their individual interests.
(b) Farmers should consider promoting barter trade. Here, they need to seriously go
into exchanging their produce with farming inputs and other resources, as is the case
already in some parts of Chibombo District where fertiliser is being exchanged with two
bags of 90 kilograms of maize at harvest. Others are paying transporters of eggplants
(lmpwa) with an agreed number of lmpwa bags for the provision of transport. Both the
farmer and the trading partners gain mutually in such an arrangement. The only aspect
the farmers need to be careful with is the quality of information that they have to use at
bargaining time so that they avoid being cheated as has been the case in some parts of
Chibombo. This consideration will help farmers to deal with the problem of cash that
they usually face. This suggestion is applicable to wards where buyers with ready cash
may not be found. For instance, remote wards like lpongo.
(c) Farmers with a high level of education should consider forming permanent business
ventures such as co-operatives. These 'businesses' should operate on the basis of
107
capital contributed by individual farmers in a given area. To make them more business
oriented, each firm should be allowed to employ full-time employees with basic
business training. As suggested in the Co-operative Act of 1998, the farmers should
have limited control over the operations of their businesses only through an elected
board of directors or committee of management and policy formulation through annual
general meetings. As shareholders, each farmer should receive dividends at the end of
each financial year when the business has made profit.
To avoid the problems of the collapsed co-operatives in Zambia, the new ventures
could include a clause in their regulations not to allow shareholders to have executive
powers in the daily operations of each firm. The collapsed co-operatives showed that
interference by the members leads to misuse of resources, corruption, bickering and
the destruction of the profit motive of the firm.
(d) Individual farmers and groups of farmers should consider on-farm processing of
their produce to increase product value as they enter the market and provide nutritional
improvements. Technologies that farmers may consider acquiring include the Yenga
Press Machine (oil extracting machine from groundnuts and sunflower) and mealie
meal grinders. Such machines will help farmers improve food processing and provide
each family with cheap edible oils and other food stuffs within easy reach, provide them
with income and generally will help e3ch farm family to sell their produce at a higher
price than they do now. However, where farmers are unable to acquire such
technologies in their individual capacities, co-operatives established could buy and hire
them to members.
(e) Peasant farmers in Chibombo District, and probably the rest of Central Zambia,
should consider improving their on-farm storage, as suggested also by Chabala and
Sakufiwa (1993) and the World Bank (1994, 1996). Presently, the crop storage
facilities available in Chibombo are either inadequate in size or not just able to maintain
the crop in a good state for the whole year. The absence of appropriate on-farm
storage technology is making smallholder farmers fail to keep their produce long
enough to ensure household food security and take advantage of market opportunities
that arise at certain times of the year. In the researcher's view, there is need for each

108
farm family to consider building brick walled structures with concrete or clay smeared
floors and walls so that the crop can last long. At the base of the granary or storage
facility, a farmer should spread some ash, or some pesticide or insecticide to kill insects
and rodents attacking crops. While ash can be afforded by every farmer, chemicals
may only be used by those farmers with a good financial base.
(f) Farmers should consider revisiting their old cropping patterns of intercropping,
multicropping, crop rotation, manuring and the cultivation of indigenous crops that are
adapted to particular ecological zones. As Kajoba (1993) has suggested, the
cultivation of indigenous crops such as finger millet, sorghum, pumpkins, sweet
potatoes and local maize breeds and, the use of known cropping methods could enable
many farm families in the whole of Chibombo District have adequate food supplies and
ensure all-year round food security at the household, district and perhaps national level.
Moreover, the old methods may be improved upon by incorporating new but adapted
technologies. For instance, those farm famiiies living in dambo areas or along rivers
should consider irrigation of crops during the dry season as they used to in the past
than relying on the unpredictable rainfall in Central Zambia. The use of cow dung
among cattle keeping tribes like the Tonga and Lenje should be a serious consideration
as a substitute for chemical fertilisers.
5.2.2. RECOMMENDATIONS FOR THE PRIVATE SECTOR
(a) The private sector should consider setting up crop processing ventures in farming
areas. Such ventures would help process crops that are too heavy to carry from
production wards. Such a measure would help to cut on transport costs and at the
same time provide markets and employment to the local people. This step would
improve the value of crops on entering the market and bring about an increase in crop
production. Such a measure is recommended for wards far away from already existing
processing infrastructure. Chikobo, Chaloshi, parts of keembe and Liteta, lpongo,
Mashikili and Chitanda are some of the wards that would greatly benefit from such a
measure.

109
(b) The private sector should consider expanding their input manufacturing or supplying
infrastructure in farming areas to enable the small-holder farmers obtain the inputs at
more competitive prices than is the case at the moment where these facilities only exist
in few areas, particularly the urban centres. The present practice of having the
infrastructure limited to a few centres, mostly away from the main farming areas has
made input supply expensive and/or inaccessible especially for farmers in remote
areas. For instance, it is unpractical for a small-scale farmer from lpongo Ward to
reach Lusaka, which is over 200 kilometres away, for fertiliser. What Omnia and
Kynoch need to do is to have a base in places like lpongo, Chamuka North and South
to help farmers obtain fertiliser at hear proximity. The same thing should be said about
crop buyers.
(c) Private firms involved in agro business should consider adopting some farmers to
grow individual crops on contract or out-grower scheme basis. To begin with,
companies would have to contract farmers in accessible places near the main
communication networks and later expand in the more remote areas. At the moment,
some cotton and horticultural companies in some parts of the country are undertaking
this mechanism. What needs to be done is to include all crops, for instance millers and
exporters can target maize. With an assured market and guaranteed price, crop
production would improve. Such a measure has worked well with cotton.
(d) Private companies in agro business should consider focussing on or specialising in
a few crops and maintaining a relatively small field-network in farming areas to minimise
the operational difficulties that always arise from large sizes of businesses. For
instance, due to a massive field infrastructure LONRHO failed to pay some cotton
farmers on time in the 1996/97 farming seasons. This was in total contrast to the field
goodwill it established in previous farming seasons of prompt payments when the field
network was still manageable. Also, LONRHO failed during the 1996/97 farming
season to compete favourably with cotton companies (such as Amaka Cotmark and
Mbayimbayi and Sons) with a relatively manageable network in paying farmers promptly
for their produce. The idea of "small size is more effective than large size" should be
adopted by many agro businesses for the sake of efficiency and effectiveness.
Alternatively, they may consider expanding their operations cautiously without

110
undermining their goodwill. Accessible Wards like Chibombo, Chaloshi and parts of
Chikobo would be good areas to begin with.
(e) The private firms should consider expanding the content of the extension services,
which they give the farmers. Extension services should include crop production,
storage, processing and marketing. In the researcher's view, this would provide
farmers in all wards with adequate information at all levels of the production line. Such
a strategy would enable the smallholder farmers make informed decisions that will lead
to the maximisation of liberalisation opportunities. The fieldwork data revealed that
most smallholder farmers are unable to compete favourably in a liberalised environment
because they lack vital information on crop processing, storage, and effective
marketing.
5.2.3. RECOMMENDATIONS FOR THE GOVERNMENT
(a) While sustaining the policies of liberaiisation, the government should consider
establishing an elaborate policy, through the National Roads Board, on road
development and maintenance in farming areas, for instance in Chikobo Ward where
the road infrastructure has become bad. The present set-up of concentrating on urban
roads may be promoting economic growth, but injuring agricultural production. As long
as roads in farming areas are poor, the cost of production on the part of farmers will
remain high. Ultimately, the high cost of agricultural production is passed over to the
consumer through final prices of agricultural produce. As a spin-off effect, the high cost
of agricultural production will cause the products of agriculture in the country to be less
competitive against foreign ones.
Similarly, the poor state of roads causes transporters to decline reaching out to remote
areas or if they do, at great cost. As transporters can only deliver inputs or produce at
high cost, the final price of the merchandise is equally increased, further
disadvantaging peasant farmers and agriculture as a whole. In order to reduce the cost
of transportation, the government, through District councils, should regularly maintain
feeder roads in the farming areas.
111
(b) Government should consider establishing policies that give firms involved in
promoting agricultural development tax incentives or direct capital loans of low interest
if they set up bases in peasant farming areas. Such policies should target agro
industries involved in supplying inputs, those involved in processing agriculture produce
or mere buyers. If this strategy is used, the cost of agricultural production would be
lowered and then farmers would have ready markets for their produce and nearby
sources of inputs. This strategy would, in turn, make local agriculture competitive. In
the researcher's view, such a measure would help remote farming areas (for example
Chitanda, Chamuka North and South) more than the farming areas already near such
infrastructure (for example Chibombo Ward).
(c) Government should consider improving the operations of field extension officers
through the provision of appropriate transport. The extension officers need motor
cycles more than they need bicycles. The use of motor cycles could enable the officers
to reach out to all farmers in their wards with more ease than the current practice of
using bicycles. It is important for the government to realise that the people who need
more effective transport are field extension officers, not the principal officers based at
the district or national levels. Partly, the bias in the provision of transport to high
ranking officers at the district and national levels should be blamed for the failure of
agricultural programmes in Chibombo and other parts of Central Zambia. For high
ranking officers to make good decisions they need correct information from the bottom.
Evidence from this research reveals that extension officers at the grassroots level, at
the moment, usually provide the top with their 'approximations' of reality on the ground
rather than the truth because they are immobile. The recommendation applies to all
wards.
(d) The Zambian government should rethink the limits of the Rural Investment Fund
(RIF) and Agricultural Sector Investment Programme (ASIP). Government policies
should be designed in a manner that they have a clear and definite mechanism to take
care of the individual profit motive of farmers even when group work is encouraged.
Accepting that farmers are primarily individuals with personal interests is crucial in
making any policy or programme successful.

112
Similarly, when such policies are vigorously pursued at the individual level, an
impression will be created among farmers that farming is a business each one of them
is capable of handling as an individual not as groups of individuals. When people are
encouraged to work in groups, inasmuch as they may benefit from the advantages of a
group, many will normally remain inactive. The best example of agro businesses failing
to prosper in Zambia due to indiscipline arising from members are producer co
operatives (Kokwe 1997). The other disadvantage of groups, as many authorities have
pointed out, is their inability to encourage and reward individual initiative and hard work
among farmers. In the researcher's view, individual interests of farmers should always
be accounted for if any policy or programme is to succeed. This demand is even more
important now that economic liberalisation policies are gaining ground. Groups can
succeed if the individual profit motive of farmers is included in the governing policies.
(e) Government should consider promoting the use of donkeys for draught among
peasant farmers in combination with the oxen. Donkeys are more resistant to animal
diseases than cattle. The present efforts being made by institutions like Palabana to
introduce donkey draught power among peasant farmers are important but not enough.
Government should supplement them. The environmental impact of large numbers of
donkeys should, however, be assessed before such a scheme is embarked on. Since
almost all wards have lost large numbers of oxen through foot-and-mouth disease, this
recommendation applies to the entire district.
(f) Government should consider re-introducing tractor hire schemes in farming areas as
was the case in the 1970s. This scheme, according to many farmers spoken to, can
help solve the problem of farming implements farmers are facing due to the large scale
death of their oxen from animal diseases in recent years. To begin with, the
government would have to use the existing infrastructure at Keembe Institute and the
National Service Camp near Chisamba turnoff to serve the nearby farming areas such
as Chaloshi and Keembe.
The findings, conclusions and recommendations above, nevertheless, are all grounded
on a study carried out in five wards of one district of the 72 districts in the whole
country. Further the study covers the formative years of the liberalisation policies in

113
which the old spatial units, structures and policies still had some spillover effects.
These limitations entail that a fair assessment of the liberalisation policies either in
Chibombo District or the rest of the country cannot be made. The research was not
able to cover a wider area due to relatively short time. In order to find out how
liberalisation has affected peasant farming in the country as a whole, research in other
areas and over a longer time is imperative. Any future study in Chibombo District
would be more beneficial if it focussed on those farming wards in which farming
activities have either markedly declined (for example Chaloshi) or improved (for
example Keembe) since the introduction of economic liberalisation policies in 1991.
Such a focussed study would enable the researcher(s) or any interested individuals to
have a fair assessment of the impact of these policies on peasant farming. The view of
the researcher for this current study is that a similar study at the national level would
help to cultivate reliable results for the whole country.

114
BIBLIOGRAPHY
1. Arrighi, G. and Saul, J.S., 197 4, Essays on the Political Economy of Africa, Nairobi: The East African Publishing House.
2. Bratton, M., 1977, Peasant and Party-State in Zambia: Political Organisation and Resource Distribution in Kasama District, PH. D. Thesis, Michigan State University.
3. Birmingham, D. and Martin, P.M., (eds.), 1974, History of Central Africa, London: Longman Group UK Limited.
4. Bwalya, T.M., Nzala, A.B.K. and Manda, P.H., 1994, Basic Education Atlas. of Zambia, London: Macmillan Press Limited.
5. Central Statistical Office (CSO), 1990, Preliminary Census Report on Population and Agriculture,
Lusaka: Government Printers.
6. Central Statistical Office (CSO), 1994, Census Report on Population and Agriculture, Lusaka: Government Printer.
7. Chabala, C. and Sakufiwa, E., 1993, Small-scale Maize Marketing, Handling and Storage in Zambia,
Lusaka: IF AD Smallholder Services
8. Chibombo District Council file, 1996
9. Chibombo District Council file, 1997.
10. Chileshe, J.H., 1987, Third World Countries and Development Options: Zambia, New Delhi: Vikas Publishing House PVT Limited.
11. Chipungu, S.N., 1988, The State, Technology and Peasant Differentiation in Zambia: A Case Study of Southern Province, 1930-1986,
Lusaka: Historical Association of Zambia.
12. Chisanga, B., (ed.), 1986, Practical Aspects of Smallholder Farming Policies in Frontline States: Extension and Marketing Services,
Lusaka: Government Printer.
13. Clausen, A.W., (ed.), 1981, Accelerated Development in Sub-Saharan Africa: An Agenda for Action,
Washington, D.C.: The World Bank.
14. Cliffe, L., 1979, 'Labour Migration and Peasant Differentiation: Zambian Experiences', in Turok, B., (ed.), 1979, Development in Zambia: A Reader,
London: Zed Press.
15. Colson, E., 1960, Social Organisation of the Gwembe Tonga, Manchester: Manchester University Press.
16. Davies, D.H., 1971, Zambia in Maps, London: Hodder and Stoughton.
17. Department of Agriculture file, 1995, Chibombo.

115
18. Department of Agriculture information on file, 1996, Chibombo.
19. Department of Agriculture file, 1997, Chibombo.
20. Euroconsult, 1995, Farm Restructuring and Land Tenure in Reforming Socialist Economies: A Comparative Analysis of Eastern and Central Europe,
Washington, D.C.: The World Bank.
21. Gerrard, Christopher, D., Posehn, G.D. and Ansong, G., 1994, Agricultural Pricing Policy in Eastern Africa: A Macroeconomic Simulation for Kenya, Malawi, Tanzania, and Zambia,
Washington, D.C.: The World Bank.
22. GRZ, 1966, The First National Development Plan, 1966-1970, Lusaka: National Commission for Development Planning.
23. GRZ, 1968, Zambia's Economic Revolution, Lusaka: Government Printer.
24. GRZ, 1971, Second National Development Plan, 1972-1976 Lusaka: National Commission for Development Planning.
25. GRZ, 1979, Third National Development Plan, 1979-1983, Lusaka: National Commission for Development Planning.
26. GRZ, 1985a, Fourth National Development Plan, 1985-1990, Lusaka: National Commission for Development Planning.
27. GRZ, 1985b, Guidelines for the Formulation of the Fourth National Development Plan, Lusaka: National Commission for Development Planning.
28. GRZ, 1985c, Economic Report 1984, Lusaka: National Commission for Development Planning.
29. GRZ, 1986, Economic Review and Annual Plan, Lusaka: National Commission for Development Planning.
30. GRZ, 1990, 1990 Census of Population, Housing and Agriculture: Preliminary Report, Lusaka: Government Printer.
31. GRZ, 1992, A Framework for Agricultural Policies to the Year 2000 and Beyond, Lusaka: Government Printer.
32. GRZ, 1994a, National Census of Agriculture (1990/92) Part I, Census Report, Volume1, Structural Type and 1991/92 Post-Harvest Data, Lusaka: Government Printer.
33. GRZ, 1994b, National Census of Agriculture (1990/92) Part II, Census Report, Volume II, Structural Type and 1991/92 Post-Harvest Data, Lusaka: Government Printer.
34. GRZ, 1995a, Agricultural Sector Investment Programme, Lusaka: Government Printer.
35. GRZ, 1995b, The Lands Act, 1995, Lusaka: Government Printer.
116
36. GRZ, 1996, Agricultural Sector Investment Programme Review, Lusaka: Government Review.
37. Gulhati, R., 1992, The Making of Economic Policy in Africa, Washington, D.C.: The World Bank.
38. Hellen, J., 1968, Rural Economic Development in Zambia 1890-1964, Munchen: Welt Forum.
39. Holden, P., and Rajapatirana, S., 1995, Directions in Development, Unshackling the Private Sector: A Latin American Story,
Washington, D.C.: The World Bank.
40. Jacobsen, V., Scobie, G.M. and Duncan, A., 1995, Statutory Intervention in Agricultural Marketing: A New Zealand Perspective,
Washington, D.C.: The World Bank.
41. Javaheri, F., Mulila, M.J., Mitti, G. and Phiri, E., 1996, Integrated Crop Management: A Guide for Sustainable Smallholder Farming,
Lusaka: Integrated Crop Management/Food Legume Project.
42. Johnson, . C. E., 1956, African Farming Improvements in Plateau Tonga Maize Area of Northern Rhodesia,
Lusaka: Department of Agriculture, Agricultural Bulletin No. 11, 1956.
43. Kajoba, G.M., 1993, Food Crisis in Zambia, Lusaka: Zambia Printing Company Limited.
44. Kajoba, G.M., 1994, 'Changing Perceptions on Agricultural Land Tenure Under Commercialisation Among Small-scale Farmers: The Case of Chinena Village in Chibombo District (Kabwe Rural), Central Zambia', in Science Reports of the Tohoku University, ih Series, (Geography), Volume 44 No. 1, December, 1994, pp 43-64. Sendal: Institute of Geography, Faculty of Science, Tohoku University.
45. Kajoba, G.M., 1997, 'Women and Land in Chinena Village, Chibombo District, Central Zambia: Voices from the Grassroots' in Hitotsubashi Journal of Social Studies, Volume 29, No. 1, July, 1997.
46. Kajoba, G.M. 1988, Land Tenure, Land Usage and the Historical Development of Agrarian Capitalism in Zambia: The Experience of the Periphery, M. Phil, Thesis,
Sussex: University of Sussex.
47. Kaunda, J., 1996, 'Farmers get Help ... ACE Moves in to Buy Their Maize', in the Post Newspaper, Friday, October 25, 1996, page 6,
Lusaka: Post Newspaper limited.
48. Kaunda, J., 1998, 'Agriculture's Low Performance Attributed To Inconsistency', in the Post Newspaper, Monday, June 15, 1998, page 2,
Lusaka: Post Newspaper limited.
49. Klepper, R., 1979, 'Zambian Agricultural Structure and Performance', in Turok, B., 1979, Development in Zambia: A Reader,
London: Zed Press.

117
50. Kokwe, G. M., 1997, Maize, Market and Livelihoods: State Intervention and Agrarian Change in Luapula Province, Zambia, 1950-1995,
Helsinki: Institute of Development Studies.
51. Kay, G., 1969, 'Agricultural Progress in Zambia', in Thomas, M.F. and Whittington, G.W., 1969, Environment and land Use in Africa,
London: Methuen.
52. Lombard, C.S., and Tweedie, A.H.C., 1972, Agriculture in Zambia Since Independence, Ndola: NECZAM.
53. Marter, A., and Honeybone, D., 1977, The Economic Resources of Rural Households and the Distribution of Agricultural Development, ·
Lusaka: UNZA, Rural Development Studies Bureau.
54. Meteorological Department, Kabwe and Lusaka, 1996 and 1997.
55. MMD, 1991, Movement for Multi-party Democracy: Manifesto 1991-1996, Lusaka: The MMD.
51. Muluzi, K., 1997, The Government's withdrawal From Credit Supply and Marketing Has Touched Off Conflicting Views in the Agricultural Sector', in the Zambian Farmer, Volume 12, No. 5,,June 1997, page 7, Lusaka.
52. Muntemba, M.S., 1977a, Thwarted Development: A Case Study of Economic Change in the Kabwe Rural District of Zambia, 1902-1970', in Palmer, R. and Parsons, N., 1977, The Roots of Poverty in Central and Southern Africa,
London: Heinemann.
53. Muntemba, M.S., 1977b, Rural Underdevelopment in Zambia: Kabwe Rural District, 1850-1970, PhD. D. Thesis,
Los Angeles: University of California.
54. Muntemba, M.S., 1980, 'Regional and Social Differentiation in Broken Hill Rural District, Northern Rhodesia, 1930-1964', in Martin, Klien, A., (ed.), Peasants in Africa,
London: Historical and Contemporary Perspectives, Sage Publishers.
55. Mwalukanga, G.M., 1984, Constraints on the Development of Cotton Production in Northern Rhodesia, 1900-1945: The Case of Luangwa District, MA Dissertation,
Lusaka: University of Zambia.
56. Mwanakasale, A., 1996, 'Government Withdraws from Credit Scheme', in the Zambian Farmer, Volume 1, No. 12, November 1996, Lusaka, page 6.
57. Mwanza, A.M., 1992a, The Structural Adjustment Programme in Zambia: Lessons from Experience,
Harare: Sapes Books.
58. Mwanza, A. M., (ed.), 1992b, Structural Adjustment Programme in SADC: Experiences and Lessons from Malawi, Tanzania, Zambia and Zimbabwe,
Harare: Sapes Trust.
59. Naidoo, M.R. and Bwalya, T.M., 1996, A Secondary Geography of Zambia, London: Longman Group UK limited.

118
60. Palmer, R., and Parsons, N., (eds.), 1977, The Roots of Rural Poverty in Central and Southern Africa,
London: Heinemann.
61. Phiri, B., 1999, 'Government Admits Failure in Agriculture', in the Post Newspaper, No. 1182, Monday, March 8, 1999,
Lusaka: Post Newspapers Limited.
62. Sakamoto, K.,1993, Structural Adjustment in Zambia: An Evaluation, Tokyo: International Development Center of Japan.
63. Sato, S. and Humphrey, D. B., 1975, Transforming Payment Systems: Meeting the Needs of Emerging Market Economies, ·
Washington, D.C.: The World Bank.
64. Seidman, A., 'The Economics of Eliminating Rural Poverty', in Turck, B., (ed.) 1979, Development in Zambia: A Reader,
London: Zed Press.
65. Shamatutu, M., 'Nawakwi calls for changes in fertiliser distribution', in The Zambia Daily Mail, of Monday, January 2, 1997.
66. Shawa, J.,_ and Johnson, W.I.R., 1990, 'Historical Perspectives', in Wood, A.P., Kean, S.A., Milimo, J.P. and Warren, D.M., (eds), 1990, The Dynamics of Agricultural Policy and Reform in Zambia,
Iowa: Iowa State University.
67. Silk, J., 1979, Statistical Concepts in Geography, London: George Allen & Unwin.
68. Times of Zambia, Wednesday, December 20, 1996, Lusaka: Printpak (Z) limited.
69. Times of Zambia, Thursday, January 2. 1997, Lusaka: Printpak (Z) limited.
70. Times Reporter, 1998, 'State Changes Agro Course', in the Times of Zambia, Wednesday, December 2, 1998, page 1.
Lusaka: Printpak (Z) limited.
71. Times Reporter, 1998, 'Private Agro Sector Has Failed-Minister', in the Times of Zambia, Thursday, May 7, 1998, page 3.
Lusaka: Printpak (Z) limited.
72. Turck, B., (ed.), 1979, Development in Zambia: A Reader, London: Zed Press.
73. Turck, B., 1989, Mixed Economy in Focus: Zambia, London: Institute for African Alternatives.
74. Valdes, A. and Schaeffer, B., 1995, Surveillance of Agricultural Price and Trade Policies: A Handbook for Argentina,
Washington, D.C.: The World Bank.
75. Village Registers for Study Wards, 1996 and 1997.

119
76. Wills, A.J., 1991, An Introduction to the History of Central Africa: Zambia, Malawi, and Zimbabwe,
Oxford: Oxford University Press.
77. Wilson, D., 1991, A History of South and Central Africa, Cambridge: Cambridge University Press.
78. Wood, A.P., Kean, S.A., Milimo, J.T. and Warren, D.M., (eds.), 1990, The Dynamics of Agricultural Policy and Reform in Zambia,
Ames, Iowa: Iowa State University Press.
79. World Bank, 1994, Adjustment in Africa: Reforms, Results, and the Road Ahead, Oxford: Oxford University Press.
80. World Bank, 1996, Development in Practice: Toward Environmentally Sustainable Development in Sub-Saharan Africa,
Washington, D.C.: World Bank.

120
NOTABLE OFFICIALS SPOKEN TO DURING THE RESEARCH
1. Chibombo District Officials, especially the Council Secretary and Director of Works.
2. Chiefs Chamuka, Chitanda and Liteta.
3. District Agricultural Co-ordinator for Chibombo.
4. Principal Extension Services Officer for Chibombo.
5. Provincial Agricultural Officer for Central Province.
6. Senior Economist for the Ministry of Agriculture, Food and Fisheries at the Ministry
Head Office in Lusaka.
7. Various Village Headmen in the sampled wards.

APPENDIX 1

QUESTIONNAIRE FOR PEASANT FA~MEft§..iSMALL-SCALE FARMERS).
RESEARCH TOPIC: IMPACT OF ECGNOMIC LIBERAL/SAT/ON ON THE SPATIAL PATTERNS OF PEASANT CROP FARMING IN ZAMBIA SINCE 1991: THE CASE OF CHIBOMBO DISTRICT IN CENTRAL ZAMBIA.
Number: A ............ .
INSTRUCTIONS.
Dear farmer.
Please attempt to answer the questions below from a student interested in knowing the development of peasant farming in Chibombo district. The information you will provide is needed for academic purposes only. Answer questions as per instruction given or as per structure.
1. (a) What is your name? ...................................................................................... .
(b) How old are you? (slate number of years): .................................................... .
(c) What is the name of your village? ................................................................. ..
(d) In which Farming Ward is your village located? (i.e. lpongo, Chitanda, Mashikili. Kakoma. Chibombo. Keembe. Kabile. t<alola. Chaloshi. Muchenje, Uleta. Chisamba, Chamuka North, Chamuka South. Kaluba, Mungule, Chunga, Chikobo):
2. (a) For how long have you been a fanner? (give number of years): .................. ..
(b) When did you settle on this farm? (give year): .............................................. ..
3. (a) What is the size of your farm? (give number of hectares): ............................. .
(b) At the time you first settled on this farm. how much land was cultivated? (gilli'J"hcctares): .............................................................................................................. .
tc) How much of your land is currently under cultivation? (state number of hectares): ........................................................................................................................ .
4. (a) If you started farming before 1991 . list the type of crops you used to grow on your farm: .................................................................................................................. . ' ..... ~ ............................................................ ' . . . . . . . . ................................ ' ........................... . ································································· ············ .......................................................... .
(b) Give the amount of land. in hectares. you used to use for each crop above:
Type of Crop
······························· ~~····················

I C) What crops do you grow now cstnce H}~l1 >? . .......................................... .. • • • • ~ ...................................... 0 ••••••••••••••••••••••• 0 •••••••••••••••••• 0 •••• 0 ••••••••• " ........... 0 ••••••• ' " •••••••••• 0 ••••••
' 0 4 I 0 0 0 0 0 0 o- o 0 ~ o o o 0 0 o 0 0 0 ~ 0 o 0 0 0 0 0 0 o o o 0 0 o o 0 o o 0 o 0 o o o o o 0 0 o 0 0 o 0 o 0 0 ' 0 0 * 0 o 0 0 0 0 0 0 0 0 o 0 o 0 o 0 0 0 0 o 0 0 o 0 0 o o o o o 0 O 0 ° 0 0 0 O 0 O O O O 0 ° O O. 0 O O 0 O 0 0 0 O O O O O O O. O # O O O O O O O O
.......................................................................................................................................... ··········································································································································
•• ' • • • 0 ••••• ~ •••••••••• ' • • • • • • • • • • • • • • • • • • • • • •••••••••••• 0 ••••••••••••••••••••••••••••••• ' ••••••••• " •••••• " •••••••••••••••••• ' ••••••••
··················•••ooo•O•oo•••••••••ooo•••················o·····················•o•·······•••o••·····•••oooooooooo••···················· ......................................... 0 •••••••••••••••••••••••••••••••• ~ •••••••• 0 ......... 0 ............................................... .
(d) Give the amount of land, in hectares. you use for each crop you grow now:
Type of Crop
!lo!l,~--··············· .. ······
(e) If you have changed crops from what you used to grow in the 1980s to what you now grow, give reasons why you have changed: ...................................................... .
5. (a) Which of the following farming resources do you own? (lick):
Traclor. ........... Trailer. .......... Callle (oxen and cows) ............ Tractor plough ........ Oxen plough ........ Tractor planter ........ Oxen planter. ........ Tractor sprayer. .......... Oxen sprayer ....... Harrow ........ Axe ......... Hoe ....... · ... Ox-cart ........... Other tincludlng cash capital): ............................................................................................................................. .
8(b) How many oxen do you own? (state exact number) ..................................... .
6. Since you became a farmer, have you been pr.ing a surplus? (state Yes or No).
······································•·•o••········••o•o•• ·····•••o••·····•·••o••••·····••o••···········································
7. If your answer in 6 above is Yes. give the number of bags you have produced In the following seasons for the crops listed here:
PRE- 1991 FARMING SEASONS
1983184 1984185 1985186 1986/87 1987188 1988189 1989190
Maize Cotton Groundnuts Sunflower
··········· ................ ············· ··········· ·········••o···· ,, ........... .
Sorghum Others

POST -1991 FARMING SEASONS.
1990191 1991/92 1992/93 1993194 1994195 1995196 1996/97
Maize Cation Groundnuts Sunflower Sorghum Others
6. (a) Below. give the names of the institutions which supplied you with the following inputs in the 1980s:
Fertiliser: ......................................................................................................................... ..
Seed: ................................................................................................................................ .
Chernicals: ....................................................................................................................... ..
Cash loatl~~"'' .......................................................... · · · ·. ·. · .. · · · · ...... · ...... · ... · .. · .. · · ............... ..
Others: ............................................................................................................................ ..
(b) In kilometres, state how far each of the institutions in 8 (a) above were from your farm:
Institution Distance (f<ilometres)
9. (at..,aelow list the names of the institutions which have been supplying you with inputs since 1991:
~~ Fertiliser: .......................................................................................................... : .............. .
Seed: ............................................................................................................................... ..
Chemicals: ........................................................................................................................ .
Cash loans: ..................................................................................................................... ..
Others: ............................................................................................................................ ..
farm: (b) Below state, in kilometres, how far the above institutions are from your
Institution Distance (Kilometres)
·······································

4
10. (a) In the 1980s, which institutions provided you with extension services?
··;······························· .. ·······································································································
(b) In kilometres, how far were these institutions from your farm?
Institution Distance <Kilometres)
11. (a) WJ11fh institutions give you extension services now (after 1991)?
(b) In kilometres. how far are these institutions from your farm?
Institution Distance (Kilometres)
12. (a) Below, list the names of the institutions which used to buy your produce In the 1980s: ....................................................................................................................... ..
................... :~r,~:··· .............................................................................................................. .
(b) In kilometres. how far were these institution~pl your farm?
Institution
(c) Below. list the names of institutions that buy your produce now: ........................................................................................................................................... ••• • •• ,. ...................... ••••••••• ••••••••••••••••••••••••••••• 0 ••••••••••••• 0 •••• 0 .~ •••••••••• 0 0 ••••••••••••••••••••••••••••••••••••••
• • • • • • • • ~ ••• 0 •••••••••••••••••••••••••••••••••• 0 ••••••••••••••••••••••••••• 0 •••••••••••••••••••••••••••••••••••••••••••••••••••• 0 ••••••••
(d) In kilometres, how far are these institutions from your farm?
Institution
·······················••o••·········· ······································

5
13. (a) Using Better, Worse or Same, state whether input supply (of fertilisers, seed, chemicals, cash loans, etc) were better in the 1980s than they are llOW ............................................................................................................ .
(b) Using Better, Worse or Same, state whether extension services were better in the 1980s than are now ..................................................................................................... .
(c) Using Better, Worse or Same, state whether markets for your produce were better in the 1980s than they are now ..................... : .......................................................... .
14. (a)Using Good, Average, Bad or Impassable, describe the stale of the road network in your farming ward in the 1980s than they are now ................................................................................................................ .
(b) How did the state of the roads described in 14 (a) above affect your crop production in the l~? (State helped increase production, decreased production, or had no effect) ................................................................................................... .
(c) How is the state of roads in your ward affecting your crop production now? (Answer as in 14 (b) above) ...................................................................................... ,
15. Generally, as a peasant farmer, are you better off today than in the 1980s? (State better off today or worse off tod.ay) .......................................................................................................... .
Thank you very much for your co-operation.
A.H. Malambo 1fResearcher)
Banani International Secondary School, Private Bag RW 199X, Ridgeway, 15102, LUSAKA.
~

APPENDIX2

!
I I
1
QUESTIONNAIRE FOR MINISTRY OF AGRICULTURE, FOOD AND FISHERIES OFFICIALS:
RESEARCH TOPIC: IMPACT OF ECONOMIC LIBERAL/SA TION ON THE SPATIAL PATTERNS OF PEASANT CROP FARMING IN ZAMBIA SINCE 1991: THE CASE OF CH/BOMBO DISTRICT IN CENTRAL ZAMBIA.
Numbar: B ................ .
INSTRUCTIONS. Dear respondent, You are being requested to answer ttJe questions below in your capacity as an official of the ministry responsible for agriculture in Zambia. Your answers are all needed for an academic function. I assure you that they will be used for this purpose only. Please an~w~r the questions as per instruction given or their structure.
1. (a) What is your name (optional): ....................................................................... . (b) What is your rank: ........................................................................................ . (c) What is your main duty: .............................................................................. .. (d) In which Farming Ward is your office located (Wards are lpongo, Chitanda,
Kakoma, Chibombo, Chikobo, Liteta, Chaloshi, Kalola, Keembe, Mashikili, Kabile, Muchenje, Mungule, Chunga, Katuba, Chisamba, Chamuka South, Chamuka North): ................................................................................................................................. 2. (a) In the 1980s how many peasant farmers were there in your Ward (state number):
································································································································· (b) How many peasant farmers are there now (after 1991) in your Ward: ............ . (c) State the number of peasant farmers found in each village of your Ward:
Village ~· Number of farmers
...................... ~;
·~, 3. (a) List the crops that peasant farmers were growing in the 1 980s ....................... . ················································································· .............................................. . ················································································· ···············································
(b) After 1991, what crops have peasant farmers been growing in your Ward: ··················································································· ············································· ...............................................................................................................................
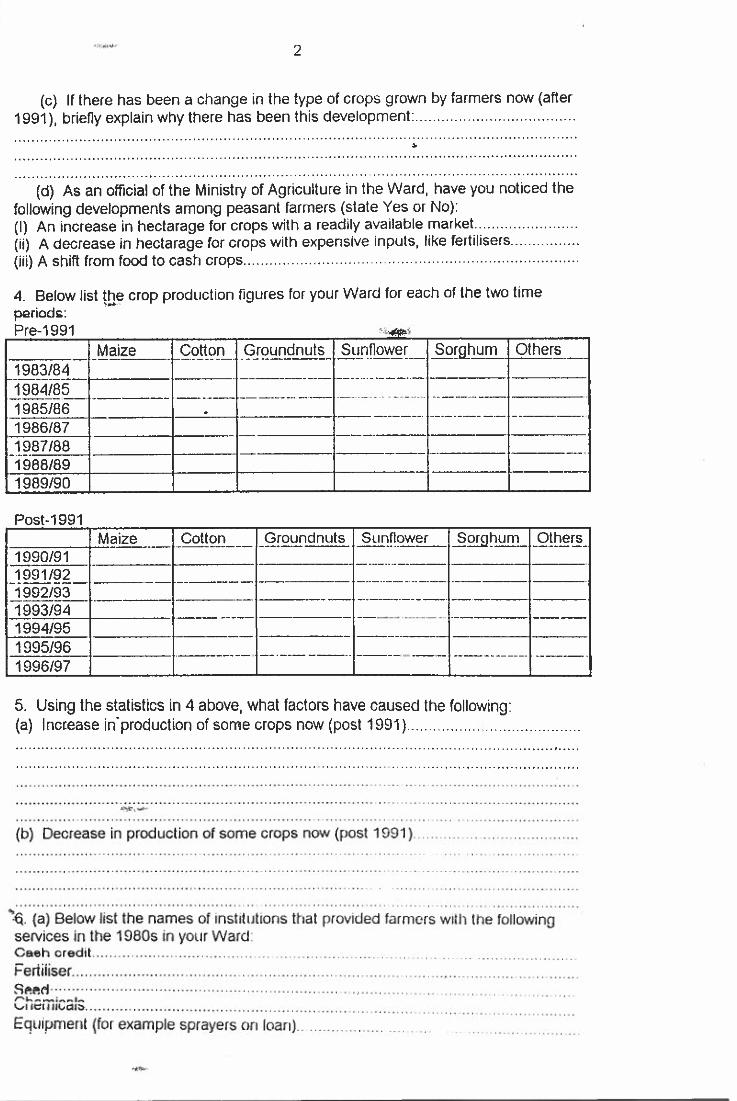
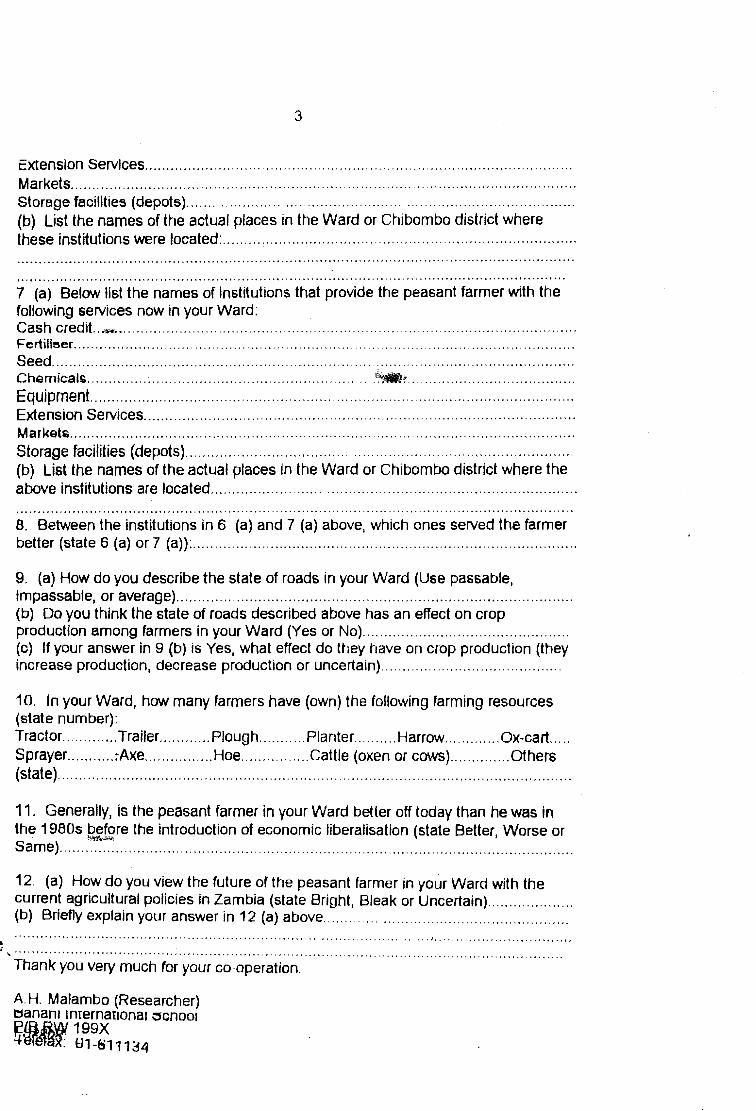
I !
3
Extension services .................................................................................................. . Markets .................................................................................................................... . Storage facilities (depots) ......................................................................................... . (b) List the names of the actual places in the Ward or Chibombo district where these institutions were located: ................................................................................. .
································································································································· ................................................................................................................................ 7 (a) Below Jist the names of institutions that provide the peasant farmer with the following services now in your Ward: Cash credit. . .,.,., .......................................................................................................... . Fertilleer ................................................................................................................... . Seed ....................................................................................................................... .. Charnical& .................................................................. _t,_~ ...................................... . Equipment. ............................................................................................................. .. Extension Services ................................................................................................... . Market~ .................................................................................................................... .
Storage facilities (depots) ......................................................................................... . (b) List the names of the actual places in the Ward or Chibombo district where the above institutions are located ................................................................................... .
8. Between the institutions in 6 (a) and 7 (a) above, which ones served the farmer better (state 6 (a) or 7 (a)): ....................................................................................... ..
9. (a) How do you describe the state of roads in your Ward (Use passable, impassable, or average) ........................................................................................... . (b) Do you think the state of roads described above has an effect on crop production among farmers in your Ward (Yes or No) .............................................. .. (c) If your answer in 9 (b) is Yes, what effect do tt1ey have on crop production (they increase production, decrease production or uncertain) ........................................ ..
10. In your Ward, how many farmers have (own) the following farming resources (state number): Tractor. ............ Trailer ............ Plough ........... Planter. ......... Harrow ............. Ox-cart .... . Sprayer.. ......... :Axe ................ Hoe ................ Cattle (oxen or cows) .............. others (state) ...................................................................................................................... .
11. Generally, is the peasant farmer in your Ward better off today than he was in the 1980s pefore the introduction of economic liberalisation (state Better, Worse or Same) ....... ~~ ......................................................................................................... .
12. (a) How do you view the future of the peasant farmer in your Ward with the current agricultural policies in Zambia (state Bright, Bleak or Uncertain) ................... . (b) Briefly explain your answer in 12 (a) above .................................................... ..
'a.. •••••••··•••·•·•·•·••••··•••··•·············••·•·····················• ······· ·················'································ (
' ••••••••••••••••••••••• 0 •••••••••••• '....................... • ••••••••••••••••••••••••• '' •••••••••••• ' ••••••••••••••••••••••••
Thank you very much for your co-operation.
A H. Malambo (Researcher) oanam 1mernanona1 ocnoo1 ~/fl8.W.199X ~~ret~: tJ1-0111 ~4

APPENDIX 3

I
~
QUESTIONNAIRE ON SMALL··SCALE (PEASANT) COTTON GROWING IN ZAMBIA.
RESEARCH TOPIC: IMPACT OF ECONOMIC LIBERAL/SAT/ON ON THE SPATIAL PATTERNS OF PEASANT CROP FARMING IN ZAMBIA SINCE 1991: THE CASE OF CHIBOMBO DISTRICT IN CENTRAL ZAMBIA.
VOl Number: C .•.....•..•...•
INSTRUCTIONS.
Dear respondent,
You are being requested to answer the questions below as an official of a company involved in promoting cotton growing in Zambia. Your answers are needed for academic purposes only. I assure you that they will be used for this purpose only. Answer the questions as per instructions given or as per structure.
1. (a) What is your name? (optional) ....................................................................... .
(b) State the name of your company: .................................................................. .
(c) What is your rank? ......................................................................................... . "'-"'""
(d) What is the name of the station where you are posted? .............................. ..
(e) In which Farming Ward is your station located? (Wards are lpongo, Chitanda. Kakoma. Chibombo, Chikobo,liteta, Chaloshi, Kalola, Keembe, Mashikili, Kabile, Muchenje, Mungule, Chunga, Katuba, Chisamba, Chamuka South, Chamuka North) ............ : ............................................................................................................... ..
(f) Other than your Ward, in which other Wards of this District does your company operate? ............................................................................................................ .
2. (a) When did your Company start promoting colton growing in Chibombo District? (state the year) ........................................................................................ .' ......... ..
'*"'" 3. (a) If your company started operating in the 1980s, how many Cotton Centres/depots did it have in this Ward? .............. ~ ................................................... ..
(b) Of the above number how many colton centres/depots were there in each village of this Ward? (list numbers as follows)
Village name ' ................................... . . ........... ··········'··················
........................................
.........................................
................................... ·········································

2
(c) Now (after 1991) how many cotton centres/depots are there in your Ward? ...........................................................................................................................................
{d) Of the number of cotton centres in 3 (c) how many are there in each village of your Ward?
Village name Number of centres/deQots ........ .,~~,., .................... .. ·········································
·········································
········································· .........................................
4. (a) How many small-scale cotton farmers were there in this Ward In the 1980s?
··········································································································································
(b) Of the number of farmers in 4 (a) above. how many were found in each village of your Ward?
Villag~ Number of farmers ... ~ .................... ' ................. . ···········································
•• ••••• • o o41i:lf'¥'•• ••• • o ••••••• o o ••• •• o ••
................. ~~ .................. .
(c) How many small-scale cotton farmers are there now (after 1991) In your Ward? ............................................................................................................................... .
(d) Of the number of farmers in 4 (c) above, how many are there in each village of your Ward now?
Village Number of farmers
5. (a) In the 1980s. what was the total cotton production by small-scale farmers in your Ward for the following periods? (stale number of bags and/or kilograms) Years Production
·~ --1983~- ~--- --~-~-------~-----------
. "1984185----~-------------- ~-------~-~-- --- ~---------------~1985/86----------~------ --- ~ -- - .. ~ .. ------ -----.. ~~ -~~-~ -- --- ~-----.-- ----------------· ---1986/87 ·--- ~-------------·--··
-1987188 ~---------!---·-------~ ----------~------ ---~~
f-1988/89----------~~----- -----~ --~-~~~-·- ~ -- -~~ ~--- ~------- ~-~---~--------~~------J
1989190 ~ ~-·-f---~--------------------~

=~
)
(b) Now (after 1991), what Is the total cotton production by small-scale farmers in your Ward for the following periods? (state the number of bags and/or kilograms)
Year Production . 1990191
-1992'93 __________ .. ___ -----·-·--- -1991.f"j/9ft:;2;-------- 3-
1993194 ~,;iii! _____ _:__~--·------· -
J::~ ·---=~~-==:=i-~-~~~=--~~~~~-~·~~-:__-- -·-------1996197- --- ------- --·--=--==- 1
6. (a) In the 1980s, what was the average cotton hectarage per farmer in your Ward? ..•........................... -; ................................................................................................ .
(b) What Is the average cotton hectarage per farmer in your Ward now (after 1991)? .............................................................................................................................. .
(c) If the cotton hectarage per farmer has increased from the 1980s to now, give the reason(s) why this change has taken place: ...................................................... . ................................................................................................................................................... ••••••••.••••O•••••••~:·••••••••••••••••••••••••••••••••••••••••••••••••••oo•••••••••••••••••••••••••••••oo•••••••••••••••••••••••••••••
...............................................................................................................................................
.......................................................................................... ~ ............................................ .
(d) If the cotton hectarage per farmer has declined from the 1980s to now, give the reason(s) why this change has taken place: ............................................................. .. .............................................................................................................................................. ............................................................................................................................................. • ............. . . . • .... -~ ... · ......................................................................................... · ........................................ . ...............................................................................................................................................
7. (a) What services did your company provide farmers in your Ward In the 1960s? (list them) ............................................................................................................ . ............................................................................................................................................... ·····································································································································.····· ................................................................................................................................................
(b) What services does your company provide farmers in your Ward now? (list , them) .............................................................................................................................. -.. . ............................................................................................................................................ t 0 0 0 •I I• 0 •Of IO 0 • O °' 0 • 0 e • e • • 0 I 0 t • e 0 I•• 0 O •I• o • • • 0 0 o • 0 0 o ,j t 0 O o o e I 0 • • • • • • t • o. I o O O O • ~. o o o O o I • o o o o o o t • • 0 t o • Io + • o • o o I o O o a 0 o • o • O I o o • o IO• O o O • e O O 0 o 0 IO•
'-••!".•.••······································································.····.··························································
• (c) How do you compare services offered by your company to the cotton farmer now to those offered In the 1980s? (state Better, Worse or Same) ................................ ..
a. (a) How would you describe the slate of the roads in your Ward in the 1980s? (state Good, Average, Bad or Impassable) ..................................................................... ..
(b) Ho~d the state of the roads described in 8 (a) above affect cotton production In your Ward? (state helped Increase production, decreased production, had nq effect on production, or uncer1ain) ....................................................................... .
•tM'.Wr.+L.~~~[~'
~ " ·.-: . .< ~i.
i'i'' i: - ii -
' ~ '
·"*· '·~
.,._. ,- ~l'
::~ . ;.l
!t 'i . '. t
' ~ ~
) l l
t ~ ! .f : ~
" :t,
~) i \j "\ ;L " l I q d ,, q. (t,
I~ ' :,
if ii ;~ jt 'f -, 'i ·:r ·i r·
!:I-~
. ~ .
~; l f l l ti 'l ~: y \\ . [l: 11'
·IL:
~iJ: +
·~ ;11•~ :1 ·;~ '.!·~ JI-~ <'.~ i;u
1.~
1U ,~· ,,
.;; ): 'J ·~ \
. ;: ~ ,/',)

4
(c) How do you describe the state of the roads in your Ward now? (state Good, Average, Bad or Impassable) .......................................................................................... ..
(d) How does the state of the roads described In 8 (c) above affect cotton production in your Ward now? (state help to Increase production, decrease production, have no effect, or uncertain) ........................................................................................... ..
9. (a) In the 1980s, how many small-scale cotton farmers in your Ward had the following farming resources?
Tractor ................ Trailer ................ Cattle (oxen or cows) ........ Piough .......... Pianter ........ ..
Sprayer .............. .Harrow ............... Axe .......... .Hoe ............. Ox-cart. ........ Cash capital. ... ..
Other (state them) ........................................................................................................... ..
(b) How many small-scale cotton farmers in your Ward have these farming resources now (after 1991)?
Tractor .............. Trailer ................. Cattle (oxen or cows) ......... Piough ....... Pianter ............ .
Spr'(iyer ............. Harrow ............... Axe .............. Hoe ............. Ox-cart ............ Cash capital...
Other (state them) ............................................................................................................ .
10. Do you think a small-scale cotton farmer in your Ward is better off today than he was in the 1980s? (state Better, Worse, or Same) .......................................................... ..
11. How do you view the future of small-scale cotton farmers In your Ward under the current agricultural policies of liberallsalion? (state Bright, Bleak, or Uncertain) ............................................................................................................................................
12. Under the current agricultural policies in Zambia, how can a small-scale farmer In your Ward use his cotton growing experience to increase the production of other crops? (briefly explain) .................................................................................................... .. • 0 0 0 ~ ·"-~-! 0 0 •••••••• 0 ••• 0 .... 0 •••••••••••••••••••••• ' •••••••••••••••••••••••••••••••••••••••••••••••••••••••••••••••••••••••••••••••••••••••
·········································································································································· ·······························································~·······;r.·l-i'''''''"'···········~·~···································· ............................................................................................................................................ ........................................................................................................................................... ··········································································································································
Thank you very much for your co-operation.
A.H. Malambo (Researcher) ·~ Bananllnternatlonal School
'P/8 RW 199X Ridgeway Lusaka.

APPENDIX4
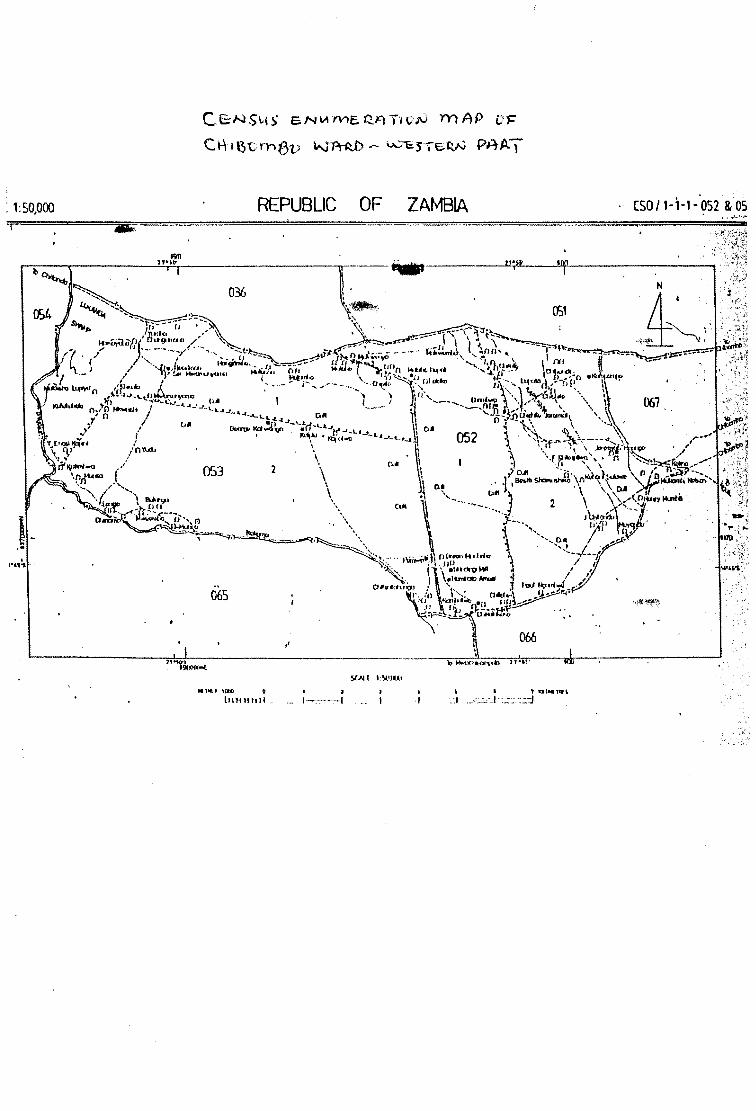
CG:N$1-\S e.N\.1\ME. QAT•o.N mAP c.,::
C. I-\ t()t; fht:)V \ioJ~ ~ '-'-'-,:,5TE-~N PA-A.}
1:50,000 REPUBLIC OF ZAMBIA
065
,.11id. J t(J:IO 0 ' ' Y~U«lJifL lHHHt111. . J ·'·-·'~:..1 ·:_:-: :.::1