TBT and imposex - HELCOM Indicators/TBT-and-imposex_HELCOM core indicator... · the AA-EQS as the...
23
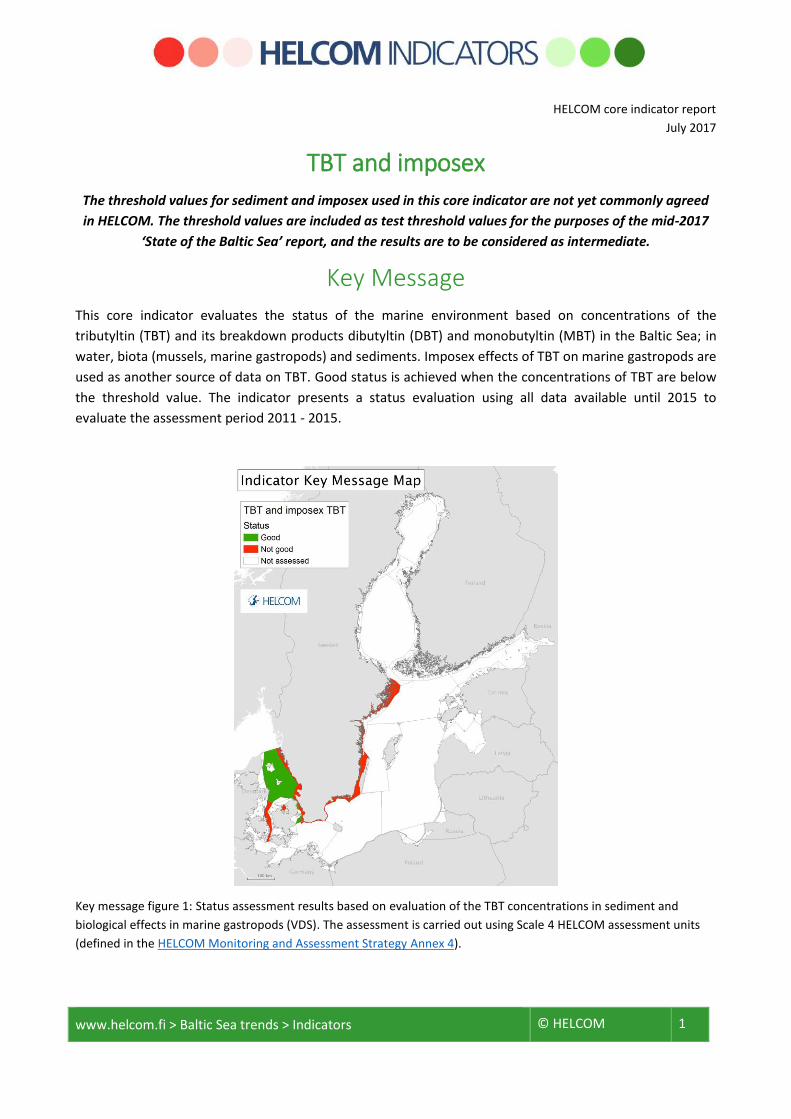
www.helcom.fi > Baltic Sea trends > Indicators © HELCOM 1 HELCOM core indicator report July 2017 TBT and imposex The threshold values for sediment and imposex used in this core indicator are not yet commonly agreed in HELCOM. The threshold values are included as test threshold values for the purposes of the mid-2017 ‘State of the Baltic Sea’ report, and the results are to be considered as intermediate. Key Message This core indicator evaluates the status of the marine environment based on concentrations of the tributyltin (TBT) and its breakdown products dibutyltin (DBT) and monobutyltin (MBT) in the Baltic Sea; in water, biota (mussels, marine gastropods) and sediments. Imposex effects of TBT on marine gastropods are used as another source of data on TBT. Good status is achieved when the concentrations of TBT are below the threshold value. The indicator presents a status evaluation using all data available until 2015 to evaluate the assessment period 2011 - 2015. Key message figure 1: Status assessment results based on evaluation of the TBT concentrations in sediment and biological effects in marine gastropods (VDS). The assessment is carried out using Scale 4 HELCOM assessment units (defined in the HELCOM Monitoring and Assessment Strategy Annex 4).
Transcript of TBT and imposex - HELCOM Indicators/TBT-and-imposex_HELCOM core indicator... · the AA-EQS as the...
www.helcom.fi > Baltic Sea trends > Indicators © HELCOM 1
HELCOM core indicator report
July 2017 TBT and imposex
The threshold values for sediment and imposex used in this core indicator are not yet commonly agreed
in HELCOM. The threshold values are included as test threshold values for the purposes of the mid-2017
‘State of the Baltic Sea’ report, and the results are to be considered as intermediate.
Key Message
This core indicator evaluates the status of the marine environment based on concentrations of the
tributyltin (TBT) and its breakdown products dibutyltin (DBT) and monobutyltin (MBT) in the Baltic Sea; in
water, biota (mussels, marine gastropods) and sediments. Imposex effects of TBT on marine gastropods are
used as another source of data on TBT. Good status is achieved when the concentrations of TBT are below
the threshold value. The indicator presents a status evaluation using all data available until 2015 to
evaluate the assessment period 2011 - 2015.
Key message figure 1: Status assessment results based on evaluation of the TBT concentrations in sediment and
biological effects in marine gastropods (VDS). The assessment is carried out using Scale 4 HELCOM assessment units
(defined in the HELCOM Monitoring and Assessment Strategy Annex 4).

www.helcom.fi > Baltic Sea trends > Indicators © HELCOM 2
Data on TBT induced effects of imposex (as Vas deference Sequence index – VDSI) biological effects in
marine gastropods are available from Denmark and Sweden (webtool:
dome.ices.dk/HELCOMHZ2016/main.html). Data was extracted from the HELCOM COMBINE database for
TBT in water and biota.
The confidence of the indicator evaluation is high in the Kattegat and Belt Sea/The sound area since the
data on TBT concentrations and imposex bivalves, sediments and marine gastropods is spatially adequate
and time series are available for several stations. In the rest of the Baltic Sea, confidence is low due to very
limited data availability.
All significant trends is downwards, as would be expected as the main source of TBT is in antifouling paints
which has been banned, but sediments are still a source for TBT in harbours and shipping lanes, which can
be re-suspended during storms.
The indicator is applicable in the waters of all countries bordering the Baltic Sea.
Relevance of the core indicator
Organotin, and in particular TBT, has been shown to be very toxic to marine life, resulting in changes in
oyster shells and interfering with the marine gastropods female reproductive organ, causing sterility in
some sensitive species. TBT is bioaccumulated by marine organisms causing harmful effects that mainly
depend on the level of its final concentration in the tissues. Mussels are not able to degrade TBT by de-
butylation, as fish and some marine gastropods are. Levels can be high in top-predators (Strand et al, 2005;
Law et al, 2012). That is why the concentrations of TBT, especially those of importance to ecosystem or
human health, have to be monitored. EQS values have been set for water AA-EQS at 0.2 ng/l and MAC-EQS
at 1,5 ng/l, but the detection limit of analytical methods is up to 1 ng/l.
TBT and triphenyltin (TPT) were introduced in antifouling paints in the 1960s, but soon after, effects on
growth and shell forming was found on French oyster grounds, and shortly after, also the effect on marine
gastropods reproductive system was discovered. This led to a ban on use of these paints on pleasure boats,
and eventually followed up by a total ban on TBT in antifouling paints (782/2003/EC (EC, 2003)) effective
from 2008 (OSPAR, 2014).
Some concern over TBT in fish for human consumption exists, EFSA set a group TDI of 0.25 μg/kg for TBT,
DBT, TPT and dioktyltin (DOT) (EFSA, 2004), noting that also pesticides, plastic additives and food contact
substances can contain organotin, so an integrated risk assessment is needed to take into account all of
these sources. Based on the fish intake and concentration levels in fish, it was not expected TDI in general
to be exceeded, except perhaps for consumption of fish caught in harbour areas or other very polluted
sites.
www.helcom.fi > Baltic Sea trends > Indicators © HELCOM 3
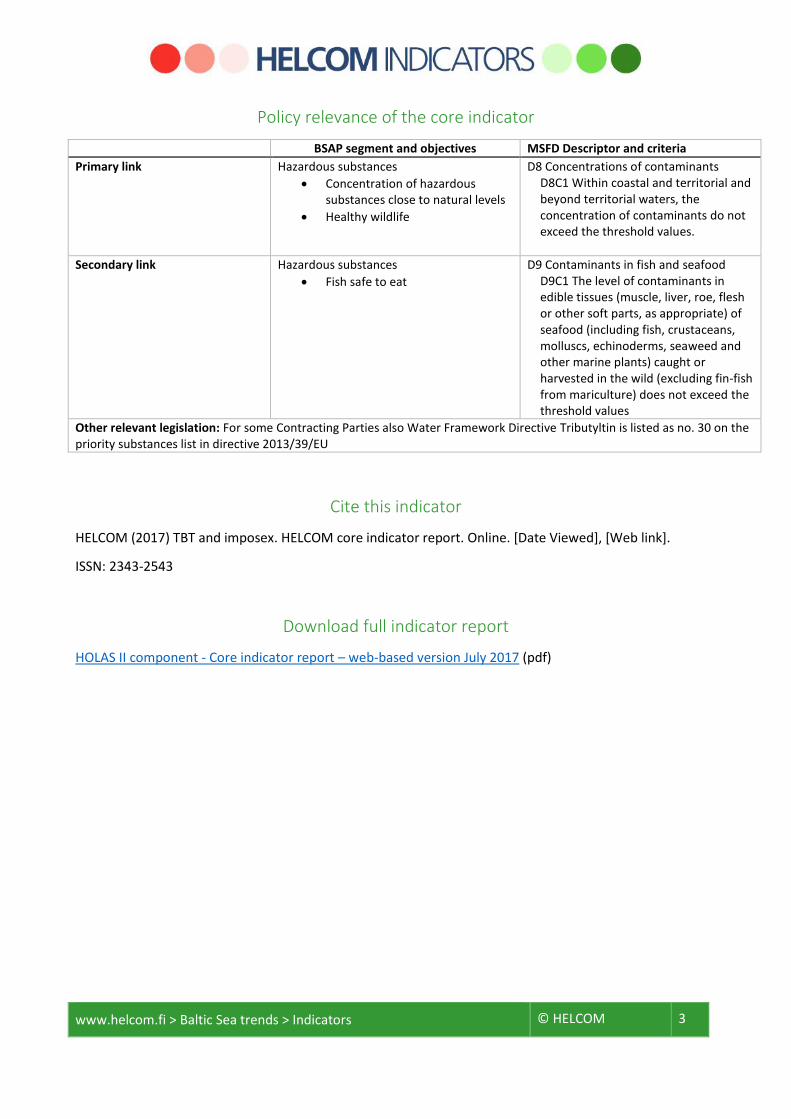
Policy relevance of the core indicator
BSAP segment and objectives MSFD Descriptor and criteria
Primary link Hazardous substances
Concentration of hazardous substances close to natural levels
Healthy wildlife
D8 Concentrations of contaminants D8C1 Within coastal and territorial and beyond territorial waters, the concentration of contaminants do not exceed the threshold values.
Secondary link Hazardous substances
Fish safe to eat
D9 Contaminants in fish and seafood D9C1 The level of contaminants in edible tissues (muscle, liver, roe, flesh or other soft parts, as appropriate) of seafood (including fish, crustaceans, molluscs, echinoderms, seaweed and other marine plants) caught or harvested in the wild (excluding fin-fish from mariculture) does not exceed the threshold values
Other relevant legislation: For some Contracting Parties also Water Framework Directive Tributyltin is listed as no. 30 on the priority substances list in directive 2013/39/EU
Cite this indicator
HELCOM (2017) TBT and imposex. HELCOM core indicator report. Online. [Date Viewed], [Web link].
ISSN: 2343-2543
Download full indicator report
HOLAS II component - Core indicator report – web-based version July 2017 (pdf)

www.helcom.fi > Baltic Sea trends > Indicators © HELCOM 4
Results and Confidence
The data presented in the core indicator report were collected in the HELCOM COMBINE data base from
the monitoring activities reported by all Baltic countries. Several countries experienced data reporting
issues, and substantial improvements are expected when the report is updated to include 2016 data. The
report presents information on the current levels of TBT concentrations in selected marine matrices:
seawater, biota (mussels, marine gastropods) and sediments. Fish data have not been used, as currently no
thresholds have been defined for TBT in this matrix.
Seawater
The agreed secondary threshold value for TBT in water is the EQS value (AA-EQS) of 0.2 ng/l. This is in
conflict with the HELCOM COMBINE monitoring program, where the preferred matrix is biota and
sediment. As a result, very little data is available for TBT in water.
TBT concentrations in the water phase have been measured by Poland (2011–2012) and Lithuania (2010–
2015) (Results figure 1). Only 6% of these values were above the maximum annual Environmental Quality
Standards (MAC-EQS) of 1.5 ng/l. Most samples was above the averaged annual concentration EQS (AA-
EQS) of 0.2 ng/l, which was below the quantification limits in Lithuania until 2015, and the lowest value
measured in Poland. The AA-EQS is considered to be high. For example compared to the OSPAR (Oslo-Paris
Convention for the Protection of the Marine Environment of the North-East Atlantic) Environmental
Assessment Criteria (EACs) in seawater (0.01-0.1 ng/l). The 2004 revision of OSPAR EACs suggested using
the AA-EQS as the lower and MAC-EQS as the upper EAC value. Hence, the AA-EQS is considered to be the
relevant threshold value, not MAC-EQS that would normally be used for spot samples (Results figure1).
With a quantification limit (QL) around 0.06-1 ng/l, even the newest, best method with QL at 0.06 ng/l is at
30% of the AA-EQS, which is the minimum performance criteria for methods of analysis used in the Water
Framework directive set by the European Commission (2009). Unfortunately, the minimum requirement
was only achieved in 2015 for Lithuanian samples where the newest analytical method was used.
The Lithuanian results show a slight tendency for decreasing concentrations from 2011 to 2012, but
interpretation is difficult due to results being close to (and below) the quantification limits. In 2015, no
samples were above the quantification limit.
Some Lithuanian stations have been monitored in the period 2010 to 2015 (Results figure 2), but most
results were at the quantification limit, so no further interpretation of the results is possible.

www.helcom.fi > Baltic Sea trends > Indicators © HELCOM 5
Results figure 1. TBT in seawater from Poland (rhombe, 2011-2012) and Lithuanian data (circle, 2010 to 2015). Results
above 5 ng/l (21 ng/l for Polish and 600 ng/l for Lithuanian outlier) are marked with red rim. The blue line indicates
the threshold value which is the annual average Environmental Quality Standard (AA-EQS) of 0.2 µg/l and the orange
line indicates the threshold for maximum annual concentration Environmental Quality Standard (MAC-EQS) at 1,5
ng/l. Quantification limits in Lithuania was 1 ng/l in 2010-2012, reduced to 0.06 in 2015. No information on
quantification limits in Poland, but lowest reported values are 0.2 ng/l.

www.helcom.fi > Baltic Sea trends > Indicators © HELCOM 6
Results figure 2. Selected time trend stations from Lithuania. Notice that except for one data point (at 600 ng/l, above
range), all results are at the quantification limit (1 ng/l), which was reduced for from 1 ng/l to 0.06 ng/l in 2015.
Mussel – intermediate results based on test threshold value
Soft body of mussel was indicated as a secondary matrix for TBT status assessment. Data was extracted
from the HELCOM COMBINE database, however no assessment of results has been developed due to issues
with data processing. There is no data in northern part of the Baltic Sea, while in the western part the net
of sampling stations is very dense (Results figure 4).
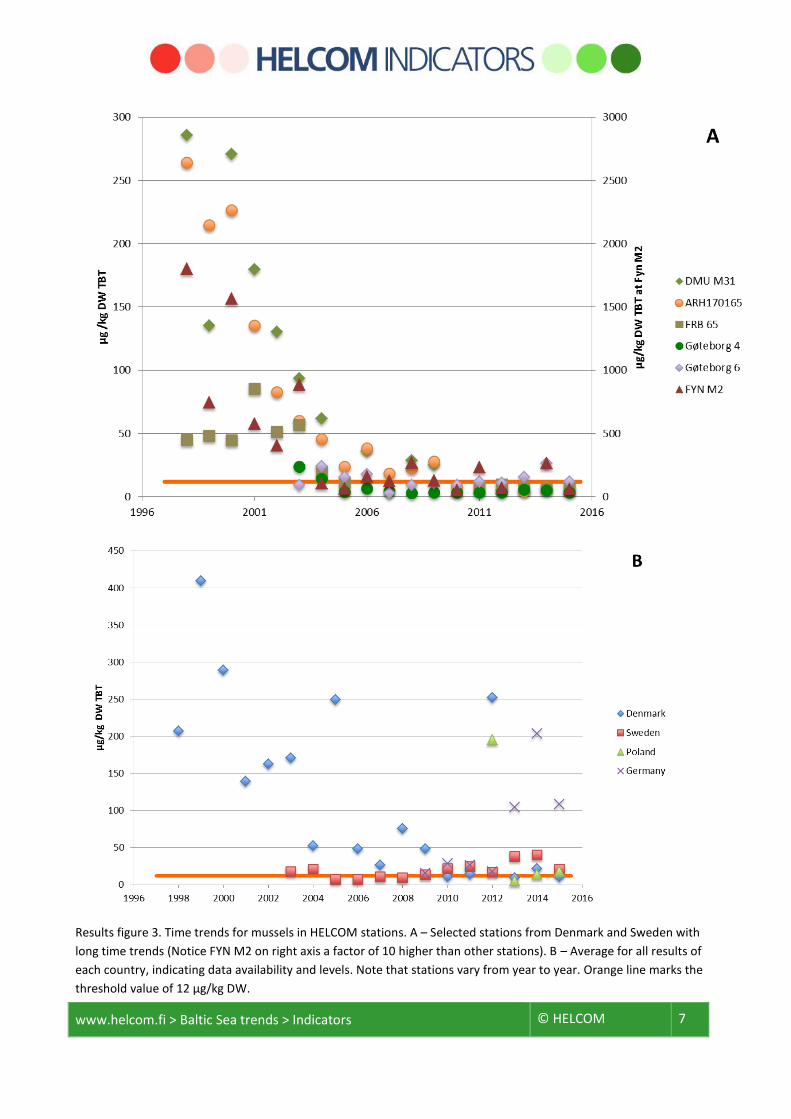
For the stations in the HELCOM COMBINE database, the average of each of the four countries reporting
(Denmark, Germany, Poland and Sweden) are shown in Results figure 3 (upper). The levels in Germany are
influenced by some stations with very high concentrations in 2013-15, probably harbour areas. The Danish
stations in the sound (DMU M31), Odense Fjord (FYN M2, 10x higher levels on 2. Axis scale), and Bay of
Århus (close to harbour, ARH 170165) have a clear tendency of decreasing concentrations from 1998 to
2005, and then concentrations seems to level out at these stations.
Time trend analysis has been performed by OSPAR at some stations in the Kattegat area (according to the
same principles as in the HELCOM assessment but with different threshold values) but no significant trends
were detected (Result figure 4).
www.helcom.fi > Baltic Sea trends > Indicators © HELCOM 7
Results figure 3. Time trends for mussels in HELCOM stations. A – Selected stations from Denmark and Sweden with
long time trends (Notice FYN M2 on right axis a factor of 10 higher than other stations). B – Average for all results of
each country, indicating data availability and levels. Note that stations vary from year to year. Orange line marks the
threshold value of 12 µg/kg DW.

www.helcom.fi > Baltic Sea trends > Indicators © HELCOM 8
Results figure 4. Examples from OSPAR assessment in the Kattegat area, notice the limits are not the same as used in
the HELCOM assessment, and the measurements are per wet weight. Neither of trends are significant. [source:
http://dome.ices.dk/OSPARMIME2016/main.html]
Marine Gastropods – intermediate results based on test threshold value
The biological effect on marine gastropods reproductive organs has been classified after the Vas deference
Sequence index (VDSI), and due to the different sensitivity, good status is achieved at the threshold value of
VDSI 2 for the sensitive species dog whelk (Nucella lapillus) and red whelk (Neptunea antiqua). Most other
less sensitive species are set at good status for a threshold value of VDSI 0.3, with exception of the laver
spire shell (Peringa ulvea) for which good status threshold value is set at only VDSI 0.1. The stations
assessed are shown in Results figure 5. Examples of time trends are shown in Results figure 6.
www.helcom.fi > Baltic Sea trends > Indicators © HELCOM 9
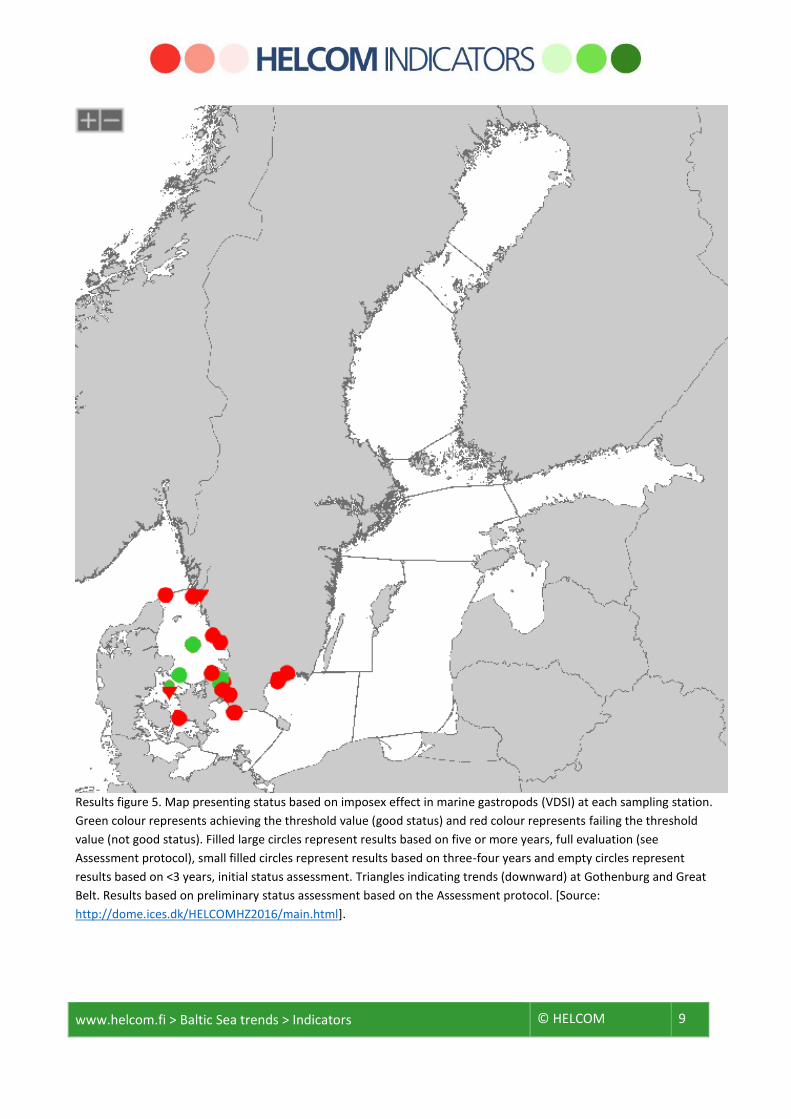
Results figure 5. Map presenting status based on imposex effect in marine gastropods (VDSI) at each sampling station.
Green colour represents achieving the threshold value (good status) and red colour represents failing the threshold
value (not good status). Filled large circles represent results based on five or more years, full evaluation (see
Assessment protocol), small filled circles represent results based on three-four years and empty circles represent
results based on <3 years, initial status assessment. Triangles indicating trends (downward) at Gothenburg and Great
Belt. Results based on preliminary status assessment based on the Assessment protocol. [Source:
http://dome.ices.dk/HELCOMHZ2016/main.html].
www.helcom.fi > Baltic Sea trends > Indicators © HELCOM 10
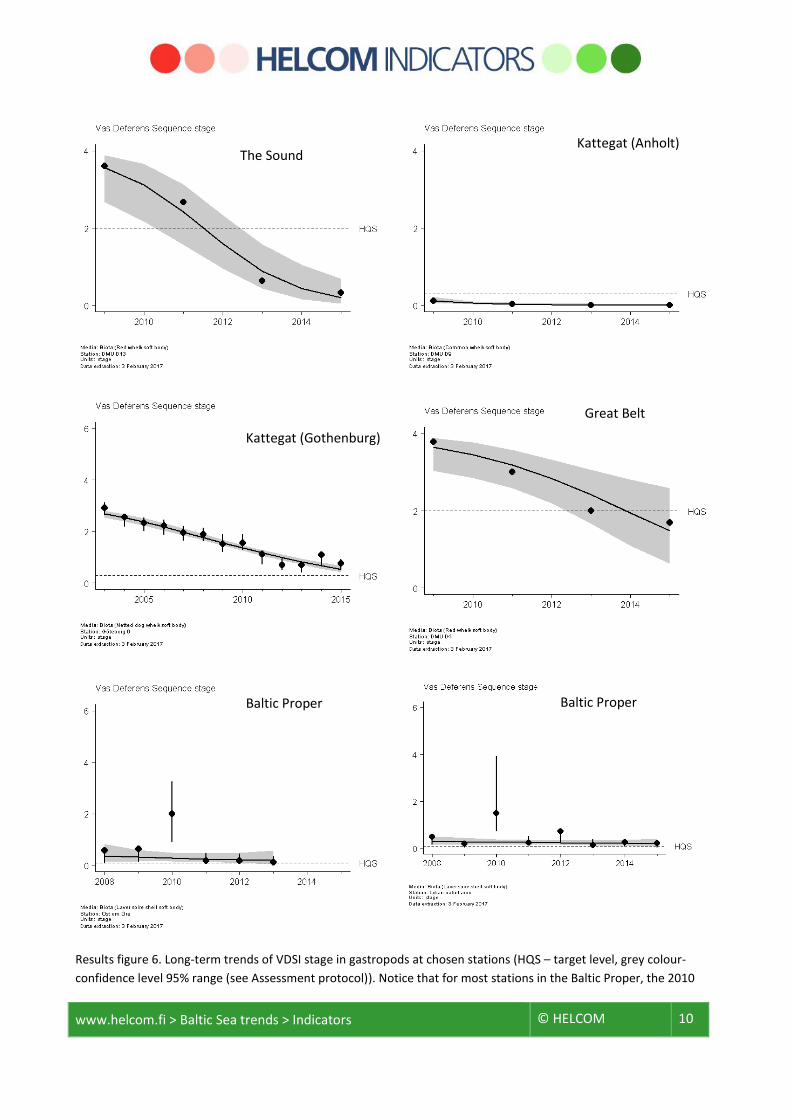
Results figure 6. Long-term trends of VDSI stage in gastropods at chosen stations (HQS – target level, grey colour-
confidence level 95% range (see Assessment protocol)). Notice that for most stations in the Baltic Proper, the 2010
The Sound Kattegat (Anholt)
Kattegat (Gothenburg)
Great Belt
Baltic Proper Baltic Proper

www.helcom.fi > Baltic Sea trends > Indicators © HELCOM 11
data are an outlier due to an error in the database and updated figures will be made when corrected. [Source:
http://dome.ices.dk/HELCOMHZ2016/main.html]
The VDSI is measured at 41 stations, and at 7 of these, downward trends were observed. No upward trends
were found. 10 stations achieve good status. The biological effects therefore support the observations of
TBT in mussels and water, generally indicating a reduction in contamination levels. But even so, most
stations are still not at good status. As most stations are time trend stations, the biological effects
measurements generally have a high confidence rating.
Results figure 7. Map presenting status based on TBT in sediment at each sampling station. Green colour represents achieved
threshold value (good status) and red colour represents failed threshold value (not good status). Filled large circles represent
results based on five or more years, full evaluation (see Assessment protocol), small filled circles represent results based on three-
four years and empty circles represent results based on <3 years, initial status assessment (see Assessment protocol). [Source:
http://dome.ices.dk/HELCOMHZ2016/main.html].
www.helcom.fi > Baltic Sea trends > Indicators © HELCOM 12
Sediment – intermediate results based on test threshold value
Only Danish results were available for the sediment assessment for the period 2011-2015 (Results figure 7),
but no time trends are available, as sediments are not analyzed for time trends only up to 3 results per
station were available. Hence, only an initial status assessment is available for sediments. Of the 138
stations investigated, only 2 from the Great Belt were found to be below the QS for sediment (1.6 µg/kg).
The average organic carbon content is around 2%, and less than 10% of the stations are above 5% organic
carbon, which increases the concentrations.
TBT is only slowly debutylated to DBT, MBT and finally tin, especially in anoxic sediments, so the sediment
concentration are expected to be above the QS many years ahead, but to eventually follow the decreasing
pattern seen in imposex and biota. As the stations are only based on 1-3 data points, only a low confidence
rating can be given to the data.

www.helcom.fi > Baltic Sea trends > Indicators © HELCOM 13
Good Environmental Status
Good Environmental Status is achieved if the concentrations of TBT are below the specified threshold
values (Good Status figure 1).
Good status figure 1. Good status is achieved if the concentrations of TBT are below the threshold values listed in
Good environmental status table 1.
The good status threshold for TBT are based on Environmental Quality Standards (EQS) for water and biota
(Good environmental status table 1) which have been defined at EU level for substances included in the
priority list under the Water Framework Directive, WFD (European Commission 2000, 2013).
The threshold value is applicable if concentrations are measured in the appropriate matrix. For historical
reasons, the countries around the Baltic Sea have differing monitoring strategies. As a pragmatic approach,
a threshold value is defined for primary matrix (sediment). However, if suitable monitoring data is not
available in a region the secondary threshold value can be used for the evaluation of alternative matrixes
(biota, water) (Good environmental status table 1). Under the WFD, Member States may establish other
values than EQS for alternative matrixes if specific criteria are met (see Art 3.3. in European Commission
2008a, revised in European Commission 2013).
www.helcom.fi > Baltic Sea trends > Indicators © HELCOM 14
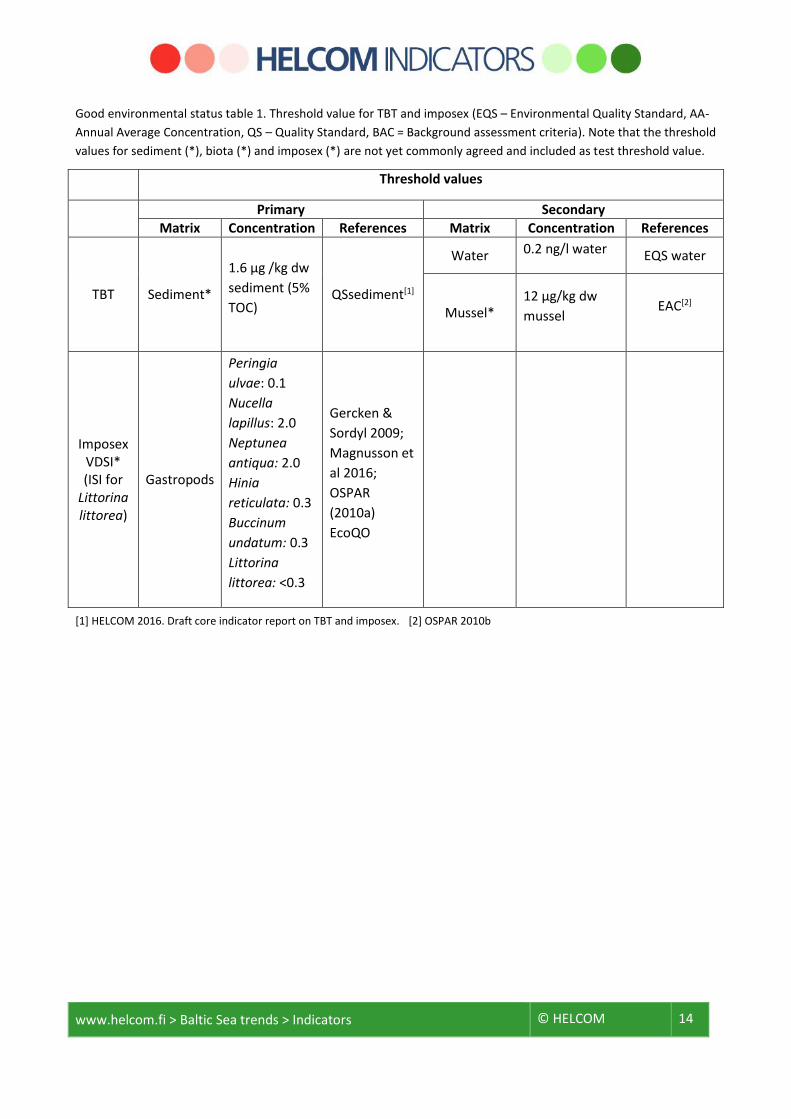
Good environmental status table 1. Threshold value for TBT and imposex (EQS – Environmental Quality Standard, AA-
Annual Average Concentration, QS – Quality Standard, BAC = Background assessment criteria). Note that the threshold
values for sediment (*), biota (*) and imposex (*) are not yet commonly agreed and included as test threshold value.
Threshold values
Primary Secondary
Matrix Concentration References Matrix Concentration References
TBT Sediment*
1.6 μg /kg dw
sediment (5%
TOC) QSsediment[1]
Water 0.2 ng/l water EQS water
Mussel* 12 μg/kg dw
mussel EAC[2]
Imposex VDSI* (ISI for
Littorina littorea)
Gastropods
Peringia
ulvae: 0.1
Nucella
lapillus: 2.0
Neptunea
antiqua: 2.0
Hinia
reticulata: 0.3
Buccinum
undatum: 0.3
Littorina
littorea: <0.3
Gercken &
Sordyl 2009;
Magnusson et
al 2016;
OSPAR
(2010a)
EcoQO
[1] HELCOM 2016. Draft core indicator report on TBT and imposex. [2] OSPAR 2010b
www.helcom.fi > Baltic Sea trends > Indicators © HELCOM 15
Assessment Protocol
To evaluate contamination status of Baltic Sea, the ratio of concentration of TBT in the biotic and abiotic
elements of marine environment to the specified concentration (threshold) levels are used. Data are
extracted from the HELCOM COMBINE database as specified in the extraction table to ensure that the
values are from the appropriate measurement matrices (Assessment protocol table 1).
All available data on TBT concentrations in seawater, molluscs and sediments from 2011 to 2015 or longer,
reported by HELCOM Contracting Parties to the HELCOM COMBINE database, were used to assess the state
of the Baltic Sea environment. Also imposex in marine gastropods, as VDSI, was used.
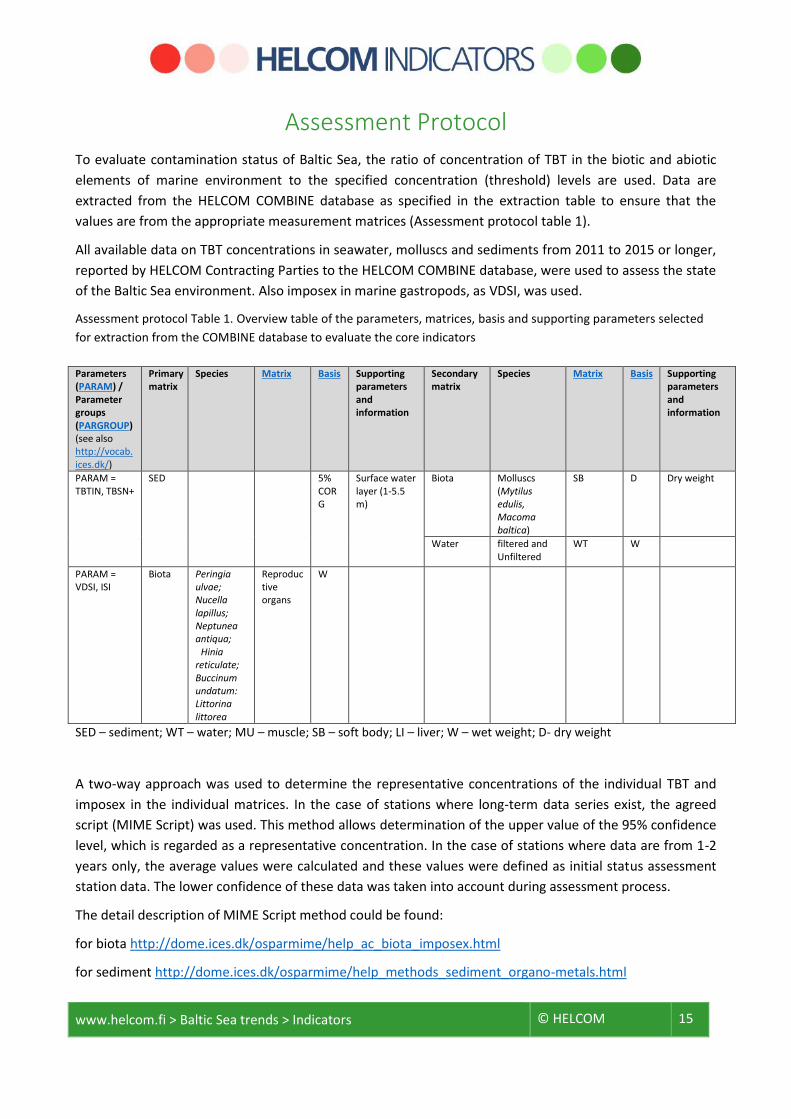
Assessment protocol Table 1. Overview table of the parameters, matrices, basis and supporting parameters selected
for extraction from the COMBINE database to evaluate the core indicators
Parameters (PARAM) / Parameter groups (PARGROUP) (see also http://vocab.ices.dk/)
Primary matrix
Species Matrix Basis Supporting parameters and information
Secondary matrix
Species Matrix Basis Supporting parameters and information
PARAM = TBTIN, TBSN+
SED 5% CORG
Surface water layer (1-5.5 m)
Biota
Molluscs (Mytilus edulis, Macoma baltica)
SB D
Dry weight
Water filtered and Unfiltered
WT
W
PARAM = VDSI, ISI
Biota Peringia ulvae; Nucella lapillus; Neptunea antiqua; Hinia reticulate; Buccinum undatum: Littorina littorea
Reproductive organs
W
SED – sediment; WT – water; MU – muscle; SB – soft body; LI – liver; W – wet weight; D- dry weight
A two-way approach was used to determine the representative concentrations of the individual TBT and
imposex in the individual matrices. In the case of stations where long-term data series exist, the agreed
script (MIME Script) was used. This method allows determination of the upper value of the 95% confidence
level, which is regarded as a representative concentration. In the case of stations where data are from 1-2
years only, the average values were calculated and these values were defined as initial status assessment
station data. The lower confidence of these data was taken into account during assessment process.
The detail description of MIME Script method could be found:
for biota http://dome.ices.dk/osparmime/help_ac_biota_imposex.html
for sediment http://dome.ices.dk/osparmime/help_methods_sediment_organo-metals.html
www.helcom.fi > Baltic Sea trends > Indicators © HELCOM 16
Assessment units
The assessment of the present environmental status in respect of TBT content has been carried out in all
assessment units at level 4.
The core indicator evaluates the status with regard to concentrations of TBT using HELCOM assessment
unit scale 4 (division of the Baltic Sea into 17 sub-basins and further division into coastal and offshore
areas). The assessment units are defined in the HELCOM Monitoring and Assessment Strategy Annex 4.

www.helcom.fi > Baltic Sea trends > Indicators © HELCOM 17
Relevance of the Indicator
Hazardous substances assessment
The status of the Baltic Sea marine environment in terms of contamination by hazardous substances is
assessed using several core indicators. Each indicator focuses on one important aspect of the complex
issue. In addition to providing an indicator-based evaluation of the status of the Baltic Sea in terms of
concentrations of TBT in the marine environment, this indicator along with the other hazardous substances
core indicators contributes to the overall assessment of hazardous substances.
Policy relevance
The core indicator on TBT concentrations and imposex addresses the Baltic Sea Action Plan's (BSAP)
hazardous substances segment's ecological objectives 'Concentrations of hazardous substances close to
natural levels' and 'All fish safe to eat'. The natural level of TBT is zero. TBT is included in the HELCOM list of
substances or substance groups of specific concern to the Baltic Sea.
The core indicator also addresses the following qualitative descriptors of the MSFD for determining good
environmental status (European Commission 2008b):
Descriptor 8: 'Concentrations of contaminants are at levels not giving rise to pollution effects' and
Descriptor 9: 'Contaminants in fish and other seafood for human consumption do not exceed levels
established by Community legislation or other relevant standards'
and the following criteria of the Commission Decision (European Commission 2010):
D8C1 (concentration of contaminants)
D9C1 (levels, number and frequency of contaminants).
TBT and its compounds are included in the EU WFD (in water). Part of the EU food directives set limits in a
range of fish species, shellfish and other seafood. In the OSPAR Coordinated Environmental Monitoring
Programme (CEMP), TBT and imposex are to be measured on a mandatory basis in sediment and marine
gastropod (OSPAR 2010).
Article 3 of the EU directive on environmental quality standards states that also long-term temporal trends
should be assessed for substances that accumulate in sediment and/or biota (European Commission
2008a).
Role of TBT in the ecosystem
Since 1960, the tri-substituted OTC (TBT and TPT) has been used extensively as biocide in antifouling paints
for boats. It was very efficient and considered to have a low toxicity to mammals. The use has been
restricted in many countries, starting in France 1982, because of the recognised adverse effects of these
compounds on the aquatic ecosystem. The European Union, Regulation 782/2003/EC (EC, 2003c) requires
TBT free anti-fouling systems to be used from 1 July 2003, and removal of TBT containing paints from 2008.
The uses of TBT and TPT, their persistence, their tendency to bioaccumulate through the food chain (in
particular fish and seafood), their high toxicity to aquatic organisms even at levels below 1 ng/l in water,
and their complex toxicity profile in experimental animals cause concerns about risks to humans and
nonhuman organisms. Apart from the discovery that organotins were causing deformation and

www.helcom.fi > Baltic Sea trends > Indicators © HELCOM 18
reproductive failure for oysters in France in the 1970s, and at the same time discovery of the imposex
effect of masculinisation of female gastropods was later followed by observation of masculinisation of fish
(Shimasaki et al., 2003), suggesting that these compounds are strong endocrine disruptors (WHO-IPCS,
1999a,b).
Human pressures linked to the indicator
General MSFD Annex III, Table 2a
Strong link Substances, litter and energy - Input of other substances (e.g. synthetic substances, non-synthetic substances, radionuclides) – diffuse sources, point sources, atmospheric deposition, acute events
Weak link
After the ban on TBT in antifouling paints, few uses of organotins as pesticides (mainly phenyltins) are still
legal. The major source is now its release from impacted sediments in harbour areas and shipping routes
(dredging) and illegal use of TBT-containing antifouling paints.

www.helcom.fi > Baltic Sea trends > Indicators © HELCOM 19
Monitoring Requirements
Monitoring methodology
HELCOM common monitoring of relevance to the indicator is described on a general level in the HELCOM
Monitoring Manual in the programme topic: Concentrations of contaminants ) and Biological effects of
contaminants (imposex) [still under development]
Quality assurance in the form of international workshops and proficiency testing has been organized
annually by QUASIMEME starting from development exercises in 1998, with two rounds each year for
water, sediment and biota.
Current monitoring
The monitoring activities relevant to the indicator that is currently carried out by HELCOM Contracting
Parties are described in the HELCOM Monitoring Manual in the relevant Monitoring Concept Tables.
Sub-programme: Contaminants in biota
Monitoring Concept Table [DK only listed in COMBINE program from 2015 in mussels]
Sub-programme: Contaminants in water
Monitoring Concept Table
Sub-programme: Contaminants in sediment
Monitoring Concept Table
Concentrations of TBT and imposex are monitored regularly in few countries, mainly in the more saline
parts of the Baltic Sea. Monitoring is performed in sediment (Denmark only), mussels and fish liver (several
contracting partners but no threshold for fish livers) and Water (Germany, Lithuania and Poland). Imposex
is reported by Denmark and Sweden.
The number of sediment and biota monitoring stations per sub-basin is indicated in Monitoring Figure 1.
Description of optimal monitoring
TBT concentrations are spatially highly varying in the Baltic Sea. Therefore, a dense network of monitoring
stations is needed to have reliable overviews of the state of the environment. The monitoring should
contain both mussels and marine gastropods. Current levels are close to detection limits in pristine areas
away from ship routes and harbours with historic contaminations.
Sediment monitoring can complement the assessment. Sediment represents longer timespans than biota
(typically years vs. months), and is available in all places, whereas especially local species are not always
available for spatial surveys. Time-trends from dated sediment cores in undisturbed (anoxic) areas can be a
valuable source of information on the development in concentrations from before monitoring was started
and even back to pre-industrialized times.
Water monitoring is generally at levels close to or below the current quantification levels, and can only be
recommended with quantification levels around 0.05 ng/l or preferably better.
Monitoring of TBT is relevant in the entire sea area.
www.helcom.fi > Baltic Sea trends > Indicators © HELCOM 20
Data and updating
Access and use
The data and resulting data products (tables, figures and maps) available on the indicator web pages can be
used freely given that the source is cited. The indicator should be cited as following:
HELCOM (2017) TBT and imposex. HELCOM core indicator report. Online. [Date Viewed], [Web link].
ISSN: 2343-2543
Metadata
Result: TBT and imposex
Data: TBT and imposex sediment data
Data: TBT and imposex biota data
The indicator is based on data held in the HELCOM COMBINE database hosted at the International Council
for the Exploration of the Seas (ICES).
www.helcom.fi > Baltic Sea trends > Indicators © HELCOM 21
Contributors and references
Contributors
Martin M. Larsen, Rob Fryer, Sara Danielsson, Jakob Strand
HELCOM Expert Network on Hazardous Substances
Archive
This version of the HELCOM core indicator report was published in July 2017
HOLAS II component - Core indicator report – web-based version July 2017 (pdf)
References
EFSA Journal (2004) Opinion of the Scientific Panel on Contaminants in the Food Chain on a request from
the Commission to assess the health risks to consumers associated with exposure to organotins in
foodstuffs 102, 1-119
European Commission (2000) Directive 2000/60/EC of the European Parliament and of the Council of 23
October 2000 establishing a framework for Community action in the field of water policy. Off. J. Eur. Union
L 327.
European Commission (2006a) Commission Regulation (EC) No 1881/2006 of 19 December 2006 setting
maximum levels for certain contaminants in foodstuffs. Off. J. Eur. Union L 364.
European Commission (2006b) Directive 2006/113/EC of the European Parliament and of the Council of 12
December 2006 on the quality required of shellfish waters. Off. J. Eur. Union L 376.
European Commission (2008a) Directive 2008/105/EC of the European Parliament and the Council on
environmental quality standards in the field of water policy (Directive on Environmental Quality Standards).
Off. J. Eur. Union L 348.
European Commission (2008b) Directive 2008/56/EC of the European Parliament and the Council
establishing a framework for community action in the field of marine environmental policy (Marine
Strategy Framework Directive). Off. J. Eur. Union L 164: 19-40.
European Commission (2009) Commision Directive 2009/90/EC of 31 july 2009 Laying down, pursuant to
directive 2000/60/EC of the European Parliament and of the Council, technical specifications for chemical
analysis and monitoring of water status.
European Commission (2010) Commission Decision of 1 September 2010 on criteria and methodological
standards on good environmental status of marine waters (2010/477/EU). Off. J. Eur. Union L232: 12-24.
European Commission (2013) Directive 2013/39/EU of the European Parliament and of the Council of 12
August 2013 amending Directives 2000/60/EC and 2008/105/EC as regards priority substances in the field
of water policy. Off. J. Eur. Union L 226: 1-17.
Gercken J. and Sordyl H., 2009. Pilotstudien zum biologischen Effektmonitoring in Küsten- und
Binnengewässern Mecklenburg-Vorpommerns , Schriftenreihe des Landesamtes für Umwelt, Naturschutz
und Geologie Mecklenburg-Vorpommern 2009, Heft 2, 134pp (In German)
www.helcom.fi > Baltic Sea trends > Indicators © HELCOM 22
Law, R.J., Bolam, T., James, D., Deaville, R., Reid, R.J., Penrose, R., Jepson, P.D. (2012) Butyltin compounds in
liver of harbor porpoises (Phocoena phocoena) from the UK prior to and following the ban on the use of
tributyltin in antifouling paints (1992-2005 & 2009). Marine Pollution Bulletin 64, 2576-2580.
Magnusson, M., Andersson, S., Bergkvist, J., & Granmo, Å., 2016: Biologiska effekter av organiska
tennföreningar. Havet 2015/2016 s. 95-97. Havs och vattenmyndigheten. ISBN 978-91-87967-12-2. (In
Swedish)
OSPAR (2008) Monitoring and Assessment Series Publication Number No. 379
OSPAR (2009) Draft Agreement on CEMP Assessment Criteria for the QSR 2010. Meeting of the
Environmental Assessment and Monitoring Committee (ASMO), Bonn, Germany, 20 - 24 April 2009.
OSPAR (2010a) EcoQO on imposex in dogwhelks and other selected gastropods. QUALITY STATUS REPORT
2010 Evaluation of the OSPAR system of EcoQOs for the North Sea,
OSPAR (2010b) OSPAR Quality Status Report 2010. OSPAR Commission, London. 176 pp. Available at:
http://qsr2010.ospar.org/en/downloads.html
OSPAR (2014) Imposex and TBT: Status, trends and effects in marine molluscs: An improving situation?
HASEC14 AS01
OSPAR CEMP Assessment Manual. Co-ordinated Environmental Monitoring Programme Assessment
Manual for contaminants in sediment and biota. OSPAR Commission, London. 39 pp.
Shimasaki, Y., Kitano, T., Oshima, Y., Inoue, S., Imada, N. and Honjo, T. 2003. Tributyltin causes
masculinization in fish. Environ Toxicol Chem.; 22(1):141-4.
Strand, J. Larsen M.L. and Lockyer, C. (2005) Accumulation of organotin compounds and mercury in harbour
porpoises (Phocoena phocoena) from the Danish waters and West Greenland. Science of the Total
Environment 350, 59–71
WHO-IPCS. 1999a. Concise International Chemical Assessment 13: Triphenyltin compounds. World Health
Organization, Geneva.
WHO-IPCS. 1999b. Concise International Chemical Assessment 14: Tributyltin oxide. World Health
Organization, Geneva.
Additional relevant publications
Bignert, A., Berger, U., Borg, H., Danielsson S., Eriksson, U., Faxneld, S., Haglund, P., Holm, K., Nyberg, E.,
Nylund, K. (2012) Comments Concerning the National Swedish Contaminant Monitoring Programme in
Marine Biota. Report to the Swedish Environmental Protection Agency 2012. 228 pp.
Bignert, A., Danielsson, S., Faxneld, S., Nyberg, E., Vasileiou, M., Fång, J., Dahlgren, H., Kylberg, E., Staveley
Öhlund, J., Jones, D., Stenström, M., Berger, U., Alsberg, T., Kärsrud, A.-S., Sundbom, M., Holm,K., Eriksson,
U., Egebäck, A.-L., Haglund, P., Kaj, L. (2015) Comments Concerning the National Swedish Contaminant
Monitoring Programme in Marine Biota 2015, 2:2015. Swedish Museum of Natural History, Stockholm,
Sweden.
HELCOM (2010) Hazardous substances in the Baltic Sea – An integrated thematic assessment of hazardous
substances in the Baltic Sea. Balt. Sea Environ. Proc. No. 120B.

www.helcom.fi > Baltic Sea trends > Indicators © HELCOM 23
Jensen, J.N. (2012) Temporal trends in contaminants in Herring in the Baltic Sea in the period 1980-2010.
HELCOM Baltic Sea Environment Fact Sheet 2012.
Law, R., Hanke, G., Angelidis, M., Batty, J., Bignert, A., Dachs, J., Davies, I., Denga, Y., et al. (2010) MARINE
STRATEGY FRAMEWORK DIRECTIVE Task Group 8 Report Contaminants and pollution effects. JRC Scientific
and Technical Reports.
HELCOM core indicator report
ISSN 2343-2543