TB/18-19/126 - KMPT
36
TB/18-19/126 1 Title of Meeting Board of Directors Date 29 November 2018 Title of Paper: Integrated Performance and Quality Report (October) Author: Executive Management Team Presenter: Executive Management Team Members Executive Director: Helen Greatorex, Chief Executive Officer Purpose: the paper is for: Delete as applicable This report is for discussion and information. It provides quality and performance information/data at trust-wide level, care group and local departments. Recommendation: The Board is asked to receive the October 2018 Integrated Quality and Performance Report (IQPR) and note and discuss the key areas of concern and mitigations, planned, in place or ongoing. Summary of Key Issues: No more than five bullet points The following key points are raised for the Board’s attention: The report now includes monthly comparative data in the Board Assurance Framework (BAF) summary; As discussed in the Board assurance framework key areas of concern and risk include recruitment and retention which is lined to both quality, patient care and safety and the resultant impact on temporary staffing. The key actions and mitigations are discussed in this report, was highlighted in the BAF and related costs discussed in the finance and performance monthly report; and Areas of good performance include the continued improvement against the crisis planning trajectory. Report History: Executive Team Finance & Performance Committee (27/11/2018) Key quality metrics included in this report also discussed at the Quality Committee last met on 20/11/2018
Transcript of TB/18-19/126 - KMPT

TB/18-19/126
1
Title of Meeting Board of Directors Date 29 November 2018
Title of Paper: Integrated Performance and Quality Report (October)
Author: Executive Management Team
Presenter: Executive Management Team Members
Executive Director: Helen Greatorex, Chief Executive Officer
Purpose: the paper is for: Delete as applicable
This report is for discussion and information. It provides quality and performance information/data at trust-wide level, care group and local departments.
Recommendation:
The Board is asked to receive the October 2018 Integrated Quality and Performance Report (IQPR) and note and discuss the key areas of concern and mitigations, planned, in place or ongoing.
Summary of Key Issues: No more than five bullet points
The following key points are raised for the Board’s attention:
The report now includes monthly comparative data in the Board Assurance Framework (BAF) summary;
As discussed in the Board assurance framework key areas of concern and risk include recruitment and retention which is lined to both quality, patient care and safety and the resultant impact on temporary staffing. The key actions and mitigations are discussed in this report, was highlighted in the BAF and related costs discussed in the finance and performance monthly report; and
Areas of good performance include the continued improvement against the crisis planning trajectory.
Report History:
Executive Team
Finance & Performance Committee (27/11/2018)
Key quality metrics included in this report also discussed at the Quality Committee last met on 20/11/2018

TB/18-19/126
2
Strategic Objectives: Select as applicable
☒ Consistently deliver an outstanding quality of care
☐ Recruit retain and develop the best staff making KMPT a great place to work
☒ Put continuous improvement at the heart of what we do
☐ Develop and extend our research and innovation work
☐ Maximise the use of digital technology
☐ Meet or exceed requirements set out in the Five Year Forward View
☐ Deliver financial balance and organisational sustainability
☐ Develop our core business and enter new markets through increased partnership
working
☐ Ensure success of our system-wide sustainability plans through active participation,
partnership and leadership
Implications / Impact:
Patient Safety: Patient safety is a key priority and issues that may affect this, are highlighted in the report and considered by the Board.
Identified Risks and Risk Management Action: Risks set out in the report are all reflected in the Trust’s risk register or BAF. All risks are outlined within the paper below
Resource and Financial Implications: Failure to achieve some of the regulatory, performance or data quality metrics could result in a financial penalty under the NHS Standard Contract and importantly, to a poor quality service for patients potentially leading to claims.
Legal/ Regulatory: None
Engagement and Consultation: Not applicable
Equality: None
Quality Impact Assessment Form Completed: No

TB/18-19/126
3
Introduction
The Integrated Quality and Performance Report (IQPR) is a key document in ensuring that the Board is sighted on key areas of concern in relation to a range of internally and externally set Key Performance Indicators (KPIs). Good examples of IQPRs from high performing organisations change and improve over time. KMPT’s is no different, and continues to be adjusted and improved in the light of feedback from internal and external stakeholders. Any changes to indicators will be clearly documented and the report will include the rationale for any change. Each member of the Chief Executive’s team provides the commentary to the area for which they are the lead. This adds a further strengthening to the actions outlined, and ownership and accountability where improvements are required. Importantly the IQPR now includes a dedicated section on workforce. This is an extremely important area of focus for us because without brilliant people, we cannot deliver brilliant care. Reducing our turnover rate, improving the robustness of our appraisal and supervision, and helping our workforce stay fit and at work, are all essential in meeting our strategic objectives. Because this report brings together in one place, all the key work streams that the Chief Executive’s team lead, the overarching paper is presented to the Board by the Chief Executive. Our nine Strategic Objectives (for 2016-19) are set out at the start of the report under our aim of Brilliant Care Through Brilliant People, along with the Care Quality Commission’s five Domains (Safe, Caring, Effective, Responsive and Well Led) helps focus the report on both the national and local context.

TB/18-19/126
4
Chief Executive’s Commentary The data provided to the Board is drawn from performance in October and is shown at Trust-wide level. Additional indicators have been added to the Caring domain since the last report to show performance against the Trust’s Patient Reported Evaluation Measures (PREM) this rightly to strengthens our focus on patient experience. A trend line over twelve months is provided after each section enabling the reader to see a year’s performance at a glance. Trust-wide data is drawn from a range of sources and includes individual, team, Care Group and locality information. That data is reviewed and explored by members of the executive team with every Care Group at the monthly Quality Performance Review meetings. In addition, where an area is receiving additional attention as a result of concerns, special reporting and monitoring mechanisms are implemented, supported by trajectories for improvement. Not all areas of performance (including those nationally set) have a target set against them. This is an area for further consideration with the board as the report evolves. Of the eighteen Single Oversight Framework targets, it is notable that the biggest challenges relate to the organisation’s financial performance. This is accurately reflected on the BAF and the Well Led section of this report sets out the detail of actions in hand to ensure that we remain on track to meet our year end control total, and address our underlying financial defecit. There is an important interface between some aspects of this, and our ability to attract and retain the best people, high spend on temporary staff, and our current above agency cap spend are issues on which the board will want to remain sighted. We retain our focus on delivering CQC Must Dos in our Community Mental Health Teams including Care Plans, Crisis Plans and Risk Assessments. The planned six month transition programme which transfers the management of Kent County Council (KCC) staff back to the Local Authority, commenced as planned in October. The Board has previously received updates on progress with this important piece of work and will receive a formal mid point report in January. The Chief Operating Officer and her team, are focusing on ensuring that the carefully agreed transition plan, is adhered to, ensuring that patients are safe, and staff supported and clear. Underpinning the IQPR is a series of executive chaired meetings. They bring together KMPT experts in their field in order to understand the data at a granular level and test that actions in hand to resolve concerns are strong enough and delivering improvements in a timely way. Supporting the work of the board, are its sub-committees each of which considers in detail, aspects of the IQPR. This report, when working as we expect it to, will enable the board to operate at strategic level, confident in the work of the sub-committees in testing assurance and understanding further detail provided by the executive and their teams. The report is becoming a familiar tool and point of reference in the Trust and as we had hoped, further strengthening our ability to triangulate information and explore in detail areas of concern. Examples in this report include possible links between our emergency re-admission rate, which increased in October, the number of incidents of patients going Absent Without Leave (also increased in October) and Length of Stay (which has reduced). My team will provide detail on the work being done to understand and address these areas of concern whilst maintaining improved performance across a range of other areas. Helen Greatorex Chief Executive
TB/18-19/126
5
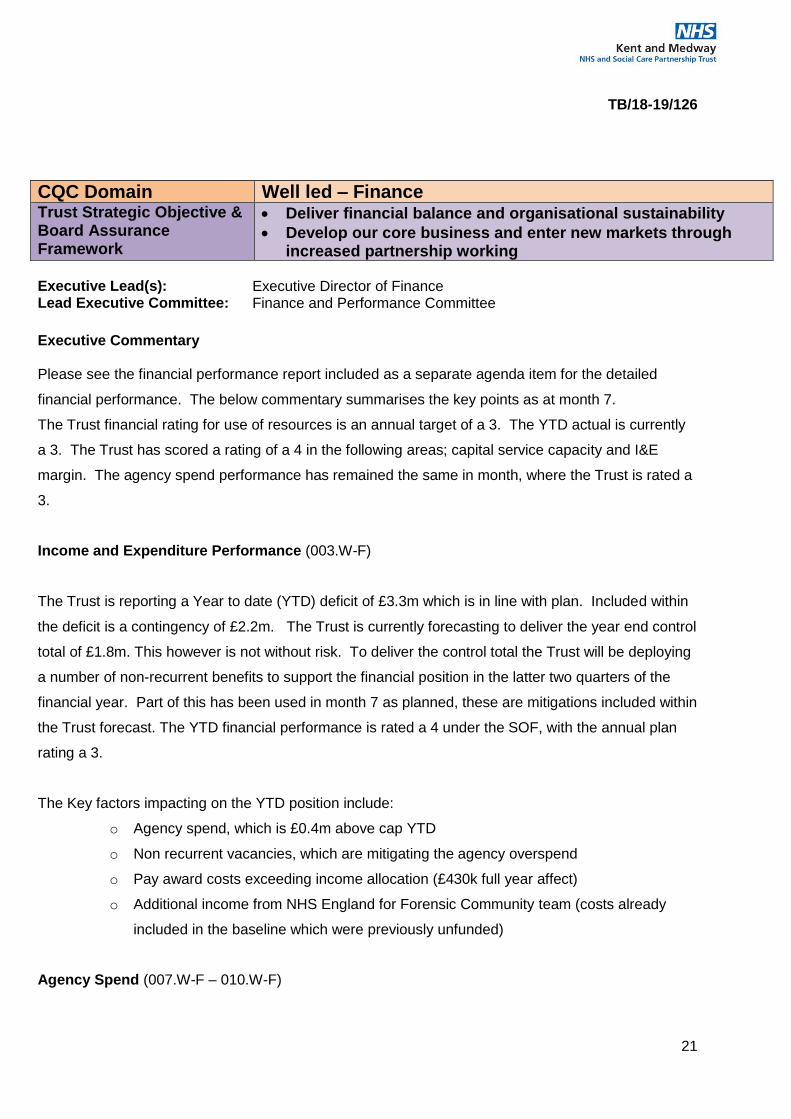
Regulatory Targets – Single Oversight Framework (SoF)
Overview The Single Oversight Framework (SOF) sets out how NHS Improvement (NHSI) oversee NHS trusts and NHS foundation trusts, using one consistent approach. It helps to determine the type and level of support needed. The first version of the SOF was published in September 2016 with small amendments made in 2017. The Framework aims to help NHSI to identify NHS providers' support needs across five themes:
quality of care
finance and use of resources
operational performance
strategic change
leadership and improvement capability
NHSI monitor providers’ performance under each of these themes and consider whether they require support to meet the standards required in each area. Individual trusts are segmented into four categories according to the level of support each trust needs. KMPT’s current segmentation is 2 as highlighted below:
NHSI segment providers based on information collected under the SOF, existing relationship knowledge, information from system partners (e.g. CQC, NHS England, clinical commissioning groups) and evidence from formal or informal investigations. The process is not one-off or annual. NHSI will monitor and engage with providers on an ongoing basis and, where in-year, annual or exceptional monitoring flags a potential support need a provider’s situation will be reviewed. The current list of provider segmentation can be accessed here. A breakdown of measures reported against the Single Oversight Framework can be found in appendix A. This shows that currently the trusts biggest challenge is achievement of the agency cap against the national target. It also reports staff turnover as non compliant. This is against a target that is set by the Trust as no target has been set in the SoF.
Segment Description
1Providers with maximum autonomy: no potential support needs identified. Lowest level of oversight; segmentation decisions
taken quarterly in the absence of any significant deterioration in performance.
2
Providers offered targeted support: there are concerns in relation to one or more of the themes. We've identified targeted
support that the provider can access to address these concerns, but which they are not obliged to take up. For some providers
in segment 2, more evidence may need to be gathered to identify appropriate support.
3
Providers receiving mandated support for significant concerns: there is actual or suspected breach of licence, and a Regional
Support Group has agreed to seek formal undertakings from the provider or the Provider Regulation Committee has agreed to
impose regulatory requirements.
4Providers in special measures: there is actual or suspected breach of licence with very serious and/or complex issues. The
Provider Regulation Committee has agreed it meets the criteria to go into special measures.

TB/18-19/126
6
IQPR Dashboard Guide The IQPR is structured by domains with executive commentary followed by the domains dashboard and a page in which up to three indicators are brought into focus with additional information on current actions in place. The diagram below provides a guide for each of the columns with the domain dashboards, this is followed by further information on the application of Statistical Process Control charts which are applied within the ‘Domain Indicators in Focus’ sections.
Statistical Process Control (SPC) Charts Explainer
SPC Charts are used to study how a process changes over time. Data is plotted in time order. A control chart always has a central line for the average, an upper line for the upper control limit and a lower line for the lower control limit. These lines are determined from historical data. By comparing current data to these lines, you can draw conclusions about whether the process variation is consistent (in control) or is unpredictable (out of control, affected by special causes of variation).
Upper and Lower control limits are set by calculating the average +/- 2 standard variation (a quantity expressing by how much the members of a group differ from the mean value for the group).
Where significant process change is implemented you may recalculate the mean and control limits to reflect this change.
The SPC charts within this document only apply the basic rule set of identifying breaches of control limits, charts can however be developed further to identify additional triggers for investigation, such as a succession of 9 or more data points on the same side of the mean.
IQPR Dashboard: Safe
Ref Measure
SoF Target
Local /
National
Target
Oct-17 Nov-17 Dec-17 Jan-18 Feb-18 Mar-18 Apr-18 May-18 Jun-18 Jul-18 Aug-18 Sep-18
001.S 0 N 0 0 0 0 0 0 0 0 0 0 0 0
002.S 95% N 82.1% 84.4% 88.6% 93.0% 93.6% 90.1% 90.5% 91.7% 93.0% 93.2% 92.9% 92.4%
003.S 90% L 94.3% 93.1% 95.4% 94.7% 95.3% 94.9% 95.2% 96.7% 95.2% 96.1% 97.3% 93.7%
004.S 5% L 11.2% 6.9% 6.9% 6.2% 5.3% 15.0% 12.4% 11.0% 14.9% 9.1% 10.5% 5.8%
Indicates if the measure is contained within the SingleOversight Framework as measured by NHS Improvement
to inform segmentation of providers: https://improvement.nhs.uk/resources/single-oversight-framework/
Targets: Determine by regulatory bodies where stated (N). In absence of national
target a local target has been set (L) for some indicators.
Domain: The report is presented in sections consistent with the 5 domains set out by the
CQC.
Monthly performance: performance for a given month, usually reflective of performance for the
stated period but may reflect a rolling 12 months for some indicators.Grey boxes show where indicator is reported at a frequency less that monthly.
Ref: Individual indicator ID's, refrenced in supporting
narrative within report

TB/18-19/126
7
Trust IQPR by CQC Domains, Trust Strategic Objectives & Board Assurance Framework
CQC Domain Safe Trust Strategic Objective & Board Assurance Framework
Consistently deliver an outstanding quality of care
Executive Lead(s): Executive Director of Nursing & Quality Lead Executive Committee: Quality Committee
Executive Commentary
Two metrics saw a decline in performance since last report and they are emergency readmission rates and AWOLs. A deep dive report on emergency readmissions was provided to the Quality Committee in September and a task and finish group established to take forward the recommendations. An update report will be provided to Quality Committee as per reporting schedule and performance will continue to be scrutinised operationally at the Quality Performance Review meetings. AWOLS continue to be scrutinised at Trust Wide Patient Safety and Mortality Review Meeting and the findings are that they are largely in respect of patients who fail to return to acute wards at agreed times. An improvement since last report has been noted in physical health checks within 72hrs of admission. This has been a result of increased training, clinical supervision and support to inpatient ward staff. CPA patients receiving reviews Our patients on CPA present with the highest level of health needs due to having enduring and complex mental health conditions. The CMHT improvement programme has been focused on ensuring that these patients are reviewed in line with national standards and local policy. The performance in relation to CPA reviews has seen a gradual improvement since March (90.1%) compared to 93.4% in October. This improvement correlates with a decrease in Care Coordinator caseload sizes, the systems and processed now in place to oversee performance, an increase in crisis and contingency plans, care plans and positive PREMs. Equally the care plans distributed to service users has improved month on month.
Serious Incident (SI) reports within 60 days
The national SI framework requires us to complete and submit learning reviews within 60 days from the date the incident is formally reported. The Trust has been working hard to ensure reports are shared with families and submitted to commissioners within the required timeframe. To improve our performance, a system was established six months ago to track progress on weekly basis through the meetings with Deputy Director of Quality and Safety and Care Groups SI leads and escalations to Heads of Service. This process has ensured timely response and provision of additional support to investigators where indicated.
Improvements in our performance have been further enhanced by provision of additional capacity to the investigation of serious incidents and complex complaints. This staffing enhancement has been welcomed by operational services as it releases their time to focus on operational service delivery. Joint assurance panels between the Trust and North and West Kent CCG have been in operation since February and have supported timely discussions and scrutiny of reports to ensure that clinical teams focus on implementing and monitoring the recommendations.

TB/18-19/126
8
All restraints Numbers of physical restraints remain higher than beginning of the year. An analysis of these shows they are largely due to “safe holds” necessary to support personal care for older people with behaviour that challenges, notably on Hearts Delight. The sharp increase in July coincides with our participation in an NHSI national pilot on restrictive practice, for which our work stream is focussing on increasing and standardising reporting practice. Prone restraints The national target is for zero prone restraints. Prone restraints have been in single figures for most of the year but for the first time in last twelve months, we have reported one prone restraint. This prone position was assessed as the safest way to administer medication for this patient. There has been concerted effort to reduce restrictive practice through increase in de-escalations, positive behaviour support plans and the provision of therapeutic engagement and activities on the wards. The draft Promoting Safer Services Strategy is due to be presented to the Quality Committee in December and will enforce our ambition to further reduce levels of violence and aggression, restraints and use of seclusions. Safer staffing We externally report on our average fill rates every 15th day of the month and the data is published on our external website. The exceptions we report on internally are average fill rates of below 80% for safety and patient experience reasons and over 130% to ensure efficiency and best use of resources. While the average safer staffing fill rates for both Registered Nurses and Health Care Assistants are within our acceptable range, however there are some exceptions noted as detailed below. There have been no serious incidents or complaints reported as a result of lower staffing fill rates. Acute wards - of the eleven acute wards, Pinewood and Willow Suite operated with Registered Nurses’ staffing levels below 80% due to vacancies. In Willow Suite, this would have meant a shift covered by two Registered Nurses instead of three. The gaps are mitigated by additional support workers on each shift and input from other multi professional staff who contributes hugely to care delivery. Going forward, the staffing levels for Registered Nurses look more positive as the Acute Care Group has had 10 new starters in the last 2 months. Six acute wards operated at above 130% average unregistered staffing levels in October 2018 due to high numbers of patients on enhanced observations in response to increased risk of self-harm, falls, safeguarding, and aggression and violence. Cherrywood, a female ward in Dartford was an outlier due to having a patient on 3:1 observations for 2 weeks until transfer to a female PICU. The Willow Suite seclusion room remains out of commission while the major ward upgrade progresses as part of capital programme work. An additional health care assistant is booked on shift each shift to further support patient and staff safety. The older adults care group had a higher number of unfilled vacancies which has impacted on fill rates particularly on Ruby ward. This is due to some posts being held whilst a review of continuing healthcare bed based services are carried out with CCGs across the county. Inpatient services based at Frank Lloyd unit have supported a growing number of patients to make planned transfers to longer term placement in the community and care homes. Numbers of referrals for admission to our specialist continuing health care beds has also significantly reduced over the past eighteen months and the two wards at Frank Lloyd have been relocated on to a single floor in order to maintain patient safety and care quality. There is higher fill rates on Sevenscores due to the challenging behaviour

TB/18-19/126
9
from some patients living with dementia. The senior leadership team on each ward continue working together to regularly review the observation levels and to ensure appropriate staffing levels. Forensic services – the lowest fill rates across the Trust have been in Medium Secure wards at TGU and were impacted by vacancies and inability to secure short term NHSP/Agency staff with the relevant skill set to work in the service. The gaps have been mitigated by supernumerary multi professional staff cover, the co-location of wards which enables movement of staffing resources and support from a “floating team member”. The Care group are trialling various strategies to improve the recruitment. Looking ahead, we have been piloting the e-roster SafeCare module to ensure enhanced efficiency in use of staffing resources and closely aligning it to patients’ needs. There is a plan to roll this out in a stepped approach across the care groups in the New Year.

TB/18-19/126
10
IQPR Dashboard: Safe
Ref Measure
SoF Target
Local /
National
Target
Nov-17 Dec-17 Jan-18 Feb-18 Mar-18 Apr-18 May-18 Jun-18 Jul-18 Aug-18 Sep-18 Oct-18
001.S Occurrence Of Any Never Event 0 N 0 0 0 0 0 0 0 0 0 0 0 0
002.S CPA Patients Receiving Formal 12 Month
Review95% N 84.4% 88.6% 93.0% 93.6% 90.1% 90.5% 91.7% 93.0% 93.2% 92.9% 92.4% 93.4%
003.S % Inpatients With A Physical Health Check
Within 72 Hours 90% L 93.1% 95.4% 94.7% 95.3% 94.9% 95.2% 96.7% 95.2% 96.1% 97.3% 93.7% 96.4%
004.S Emergency Readmission Within 28 Days 5% L 6.9% 6.9% 6.2% 5.3% 15.0% 12.4% 11.0% 14.9% 9.1% 10.5% 5.8% 9.6%
005.S Number Of Unplanned Absences (AWOL and
Absconds on MHA)22 17 21 14 14 22 14 16 12 29 13 19
006.S Serious Incidents Declared To STEIS 12 6 18 11 16 16 15 5 12 13 14 7
007.S % Serious Incidents Declared To STEIS within
48 hours100% 100% 100% 100% 100% 100% 100% 100% 100% 100% 100% 100%
008.S Number Of Grade 1&2 Sis Confirmed
Breached Over 60 Days0 L 8 3 11 11 3 8 6 5 6 11 5 2
010.S All Deaths Reported On Datix And Suspected
Suicide56 192 178 185 137 157 67 78 84 73 86 64
011.S Restrictive Practice - All Restraints 132 153 151 100 122 109 135 103 177 178 199 194
012.S Restrictive Practice - No. Of Prone Incidents 0 L 5 6 10 6 8 6 4 2 6 2 5 1
013.S Restrictive Practice - No. Of Seclusions 22 25 25 30 20 16 18 17 20 16 22 24
014.S Safety Thermometer 95% L 98.8% 97.8% 96.2% 97.1% 97.8% 97.8% 98.1% 98.1% 99.4% 98.0% 99.1% 98.9%
015.S Ligature Incidents - Ligature With Fixed
Points (moderate to severe harm)0 L 0 0 0 0 0 0 0 1 0 1 0 0
016.S Ligature Incidents - Ligature With No Fixed
Points (moderate to severe harm)0 0 1 0 2 1 0 0 0 1 0 1
017.S RIDDOR Incidents 6 4 5 4 4 7 5 5 1 0 2 6
018.Sa Infection Control - MRSA bacteraemia 0 N 0 0 0 0 0 0 0 0 0 0 0 0
018.Sb Infection Control - Clostridium difficile 0 0 0 0 0 0 0 0 0 0 0 0
019.S Safer staffing fill rates 80% L 106.0% 111.6% 104.9% 103.9% 104.7% 105.3% 100.6% 100.3% 100.9% 100.7% 98.0% 100.7%

TB/18-19/126
11
Domain Indicators in Focus The graphs below provide a 12 month trend on areas of focus from the IQPR dashboard.
There has been concerted effort to reduce restrictive practice by:
increasingly focusing on de-escalations
increasing positive behaviour support plans
the provision of therapeutic engagement and activities on the wards
Actions in place:
a system was established six months ago to track progress on weekly basis through the meetings with Deputy Director of Quality and Safety and Care Groups SI leads and to Heads of Service.
provision of additional capacity to the investigation of serious incidents and complex complaints,

TB/18-19/126
12
CQC Domain Effective Trust Strategic Objective & Board Assurance Framework
Make continuous improvement at the heart of what we do
Develop and extend our research and innovation work
Executive Lead(s): Chief Operating Officer Lead Executive Committee: Finance and Performance Committee
Executive Commentary
Patients with Valid CPA Care Plan Or Plan Of Care (007.E) & Crisis Plans (All Patients) (008.E)
A sustained improvement has been evidenced in these indicators: Care plans have increased by
5.7% since March and Crisis plans by 3.6% in the same period. It is however recognised these
improvements have generally plateaued; the Care Groups are committed to meeting the trajectories
for Care Planning and Crisis Plans; to be monitored and scrutinised by the Quality Performance
Review meetings.
The trust is committed to ensuring all patients have care plans, crisis plans and risk assessments and
will continue to review caseloads at patient level to address all non-compliant documents.
Inappropriate Out-Of-Area Placements for Adult Mental Health Services (005.E)
We are committed to our patients to our beds, and since December 2016 have eradicated the use of
private beds for overspill acute mental health patients. This work was clinically led and has resulted in
not only significant savings (the Trust was spending over £1.3m per month on private beds in mid-
2016) but more importantly, on higher quality, person centred care.
The Out of Area admissions referred to in this report, relate solely to the use of beds for women who
need admission to a Psychiatric Intensive Care Unit (PICU). The Trust has one, PICU and it is a male
only ward. Where a woman requires PICU therefore, we use an agreed list of external providers for
the shortest duration of time possible. Patients are then recalled once ready to step down in to an
acute admission bed.
Approximately half of those admitted to out of area PICUs have a primary diagnosis of Personality
Disorder and delivery of the Trust’s Personality Disorder Strategy is therefore a priority. Robust
alternatives to admission for this patient group is key and will lead to a significant reduction of Out of
Area PICU use.

TB/18-19/126
13
For the very small number of remaining Out of Area bed admission, the Patient Flow Team and Chief
Operating Officer are working with Clinical Leads and Commissioners to agree potential solutions,
underpinned by our aim of admitting our patients to our own beds.
For all indicators the quality of service is equally important and triangulating this data against numbers
and outcome actions of SIs, complaints and CLIQ checks takes place through the QPR meeting. This
key meeting is used to provide assurance to the Finance and Performance Committee, the Quality
Committee and Trust Executive Assurance Committee.
Note regarding 007.E – 009.E: although all figures reported for October look identical to September
data, the board are to be assured these metrics are accurate. These three consecutive indicators
have seen small variations but remain the same when rounded to 1 decimal place as shown below.
Sept Oct Sept Oct
007.E 93.63% 93.55% 93.6% 93.6%
008.E 94.39% 94.37% 94.4% 94.4%
009.E 78.01% 77.97% 78.0% 78.0%
Actuals Rounded in IQPR

TB/18-19/126
14
IQPR Dashboard: Effective
Ref Measure
SoF Target
Local /
National
Target
Nov-17 Dec-17 Jan-18 Feb-18 Mar-18 Apr-18 May-18 Jun-18 Jul-18 Aug-18 Sep-18 Oct-18
001.E Care Programme Approach (CPA) Follow-Up
– Proportion Of Discharges From Hospital
Followed Up Within Seven Days 95% N 94.1% 94.3% 92.7% 93.9% 94.1% 93.3% 97.2% 97.2% 99.1% 94.4% 96.0% 96.3%
002.E % Clients In Settled Accommodation N 82.5% 81.8% 81.4% 81.7% 81.6% 82.7% 83.0% 83.1% 82.8% 82.7% 82.6% 82.4%
003.E % Clients In Employment N 14.5% 14.7% 14.1% 14.3% 14.7% 14.9% 14.8% 14.7% 14.9% 14.9% 15.0% 15.0%
004.E Data Quality Maturity Index (DQMI) – MHSDS
Dataset Score N 98.2% 98.3% 98.3% 98.3% 98.2% 98.1% 98.1% 98.0% 98.0% 98.0% 98.0% 98.0%
005.E Inappropriate Out-Of-Area Placements For
Adult Mental Health Services. N 187 154 155 98 223 226 182 236 183 237 260 289
006.E Delayed Transfers Of Care 7.5% N 8.9% 8.1% 6.9% 6.6% 7.4% 6.9% 6.8% 5.5% 7.3% 6.9% 6.5% 8.1%
007.E % Of Patients With Valid CPA Care Plan Or
Plan Of Care95% L 77.5% 76.5% 78.1% 86.6% 87.9% 90.2% 92.4% 92.7% 93.4% 93.7% 93.6% 93.6%
008.E Crisis Plans (All Patients) 95% L 88.5% 87.5% 87.6% 90.3% 90.8% 91.6% 91.9% 92.5% 93.0% 94.5% 94.4% 94.4%
009.E % Reviews Undertaken Within The Maximum
Cluster Review Period95% L 70.4% 72.0% 72.7% 65.6% 78.0% 74.7% 78.9% 78.8% 78.1% 77.9% 78.0% 78.0%
010.E % Of Service Users Assessed With Cluster
Assigned95% L 92.4% 93.0% 93.0% 93.8% 94.3% 95.1% 95.2% 96.0% 96.1% 95.8% 95.5% 95.2%
011.E Number Of Home Treatment Episodes 224 L 263 235 302 258 279 278 293 275 304 297 256 258
012.E Average Length Of Stay(Younger Adults) 25 L 23.6 22.8 21.4 23.1 20.6 21.3 20.8 20.9 20.7 24.2 24.0 19.6
013.E Average Length Of Stay(Older Adults) 52 L 125.3 179.9 109.3 123.1 172.9 88.5 77.7 69.9 111.0 100.4 74.5 85.8
014.E Care Plans Distributed To Service User 75% L 55.5% 55.3% 55.6% 51.7% 53.4% 55.3% 56.6% 56.6% 59.2% 60.8% 62.2% 64.4%

TB/18-19/126
15
Domain Indicators in Focus The graphs below provide a 12 month trend on areas of focus from the IQPR dashboard
The Chief Operating Officer has requested an urgent review by the Acute and Community Recovery Care Groups.
Discussions will take place with commissioners as part of the contracting round for 2019/20.
The Care Groups are committed
to meeting the trajectories for Care
Planning and Crisis Plans by the
end of the financial year. These
will be monitored by the Quality
Performance Review meeting.
Positive improvement overall this
financial year, continued monitoring in
place within QPR’s to achieve
continuous improvement

TB/18-19/126
16
CQC Domain Well led – Workforce Trust Strategic Objective & Board Assurance Framework
Recruit, retain and develop the best staff making KMPT a great place to work
Executive Lead(s): Director of Workforce and Communications Lead Executive Committee: Workforce & Organisational Development Committee
Executive Commentary Staff Sickness – Overall (001.W-W)
KMPT is running at 4.05% for the month of September, compared to 4.84% the same period last year.
For the financial year to date we are running at 4.2% compared to 5.0% for the same period last
financial year. Long term sickness is 2.7% for the month of September. For August and September
this year we are showing a decrease in % of 0.4%, and long term sickness is the lowest since start of
financial year, each month from April to July was 2.9%.
We continue to deliver our health and wellbeing plan to support people in the workplace and back to
work, including our current flu campaign, where 36% have been vaccinated. Additional activities to
support sickness absence include: involvement in the NHS Improvement Health and Wellbeing
Programme, monthly case review meetings, monthly Health and Wellbeing meetings as well as
ongoing support for managers.
Staff Turnover (004.W-W)
We started at 16.4% at start of year and decreased until July. There is a 0.2% increase between
September and October 2018. All Care Groups are above target with exception of Community
Recovery and main areas of concern are East Kent for nursing and medical staff.
All Care Groups have been asked to draw up retention plans and these will be shared with WF&OD
Committee at their next meeting. Additionally a new workforce group is being set up start work in
December, which will include a focus on retention of employees.
Appraisals and Personal development Plans (005.W-W)

TB/18-19/126
17
Following the first appraisal window April – July, It is positive to report we are currently achieving 98%
compliance and Care Groups are working on an individual basis for 100% compliance. A quality audit
is underway for appraisals to ensure as well as achieving compliance, they are quality reviews.
Vacancy Gap (006-009.W-W)
The May and June figures are lower due to assimilation of budgets for the new financial year.
Overall we are running at 12.4% in October, compared to a target of 14%. The biggest vacancy gap
is in medical staffing, which is 28.8% - we have had 1 new starter in month and 1 in the pipeline to
start in January 2019.
We are looking at different ways to close the vacancy gap, including a pilot in East and West Kent
where we have recruited 1 Advanced Clinical Practitioners and use of Non-Medical Responsible
Clinicians. We have also developed of a new career route; the Certificate of Eligibility for Specialist
Registration (CESR) fellowship, which has been recently advertised. We are currently exploring a
conference for Consultant Psychiatrists in India. The recent independent recruitment visit to Ireland
resulted in making 5 contacts and we continue to keep in touch with these individuals.
Pleasingly, nursing vacancies show a further decrease this month. We have a new programme of
Nursing Associates and will be looking to recruit a 2nd cohort in January 2019. We are also exploring
the possibility of a nursing academy with a local health trust. We continue to advertise flexible
working opportunities within KMPT and are exploring with operational teams having a pilot for a
peripatetic team. Retire and Return case studies are being promoted and supported by retirement
sessions.
Staff survey - Response rate and engagement score (010 & 011.W-W)
Our response rate as at 18 November is 46.8%, well above the average for Mental Health Trusts of
39.8% and just below the best response rate of 48.7%. Initial results will be available early in 2019
and will be shared with the board.
Essential Training for Role (012.W-W)
There has been an increase in month of 1.3% and still above the 85% target. The HR Business
Partners are working with the Head of Learning and Development to formulate action plans to
address and ensure they become compliant.

TB/18-19/126
18
Although this is overall compliance at present, there are discussions with all stakeholders to increase
the target compliance rate over a period of time. A plan will be drawn up with the Care Groups for
implementation of the new targets. We will also be conducting a deep dive review of Essential
Training for Role and making recommendations in early 2019.
Freedom to Speak Up (013.W-W)
No reported issues in the month and current issues being addressed and individuals supported
accordingly. Financial year to date there have been 21 approaches via FTSU and this compares to 6
in the same period last year. We welcome the increase as this is an indication as employees are
becoming more willing to speak up in KMPT.
We are also recruiting to a full time Freedom To Speak Up Guardian to support this important agenda,
retaining Executive overview by Director of Workforce and Communications.
In addition to the above, we will be awarding the ‘Just and Learning’ culture work which has been out
to tender. This will ensure that we identify our future culture, understanding where we are now and be
able to put in place actions to address the gap.

TB/18-19/126
19
IQPR Dashboard: Well Led (Workforce)
Ref Measure
SoF Target
Local /
National
Target
Nov-17 Dec-17 Jan-18 Feb-18 Mar-18 Apr-18 May-18 Jun-18 Jul-18 Aug-18 Sep-18 Oct-18
001.W-W Staff Sickness - Overall 4.3% L 5.5% 5.3% 5.5% 4.3% 4.4% 4.2% 4.3% 4.4% 4.3% 3.9% 4.2%
002.W-W Staff Sickness - Short term 2.0% L 2.0% 1.9% 2.7% 1.9% 1.6% 1.3% 1.5% 1.5% 1.4% 1.4% 1.7%
003.W-W Staff Sickness - Long term 2.0% L 3.5% 3.5% 2.8% 2.5% 2.7% 2.9% 2.9% 2.9% 2.9% 2.5% 2.5%
004.W-W Staff Turnover 12.0% L 17.8% 17.3% 16.6% 16.8% 16.6% 16.4% 11.8% 11.6% 11.8% 13.4% 14.7% 14.9%
005.W-WAppraisals And Personal Development Plans 95% L 80.5% 82.5% 84.0% 85.0% 84.8% 9.9% 21.8% 54.8% 96.7% 96.7% 96.7% 98.1%
006.W-W Vacancy Gap - Overall 14% L 14.5% 13.9% 13.3% 12.3% 12.6% 12.1% 7.0% 7.5% 12.4% 13.1% 12.4% 12.3%
007.W-W Vacancy Gap - Medical 25.2% 25.7% 26.4% 29.0% 28.7% 28.8% 28.8%
008.W-W Vacancy Gap - Nursing 11.6% 9.5% 11.2% 14.0% 14.0% 12.4% 11.5%
009.W-W Vacancy Gap - Other 11.1% 4.0% 3.8% 10.0% 11.1% 10.7% 10.9%
010.W-W Staff Survey Response Rate 36.3%
011.W-W Staff Survey Engagement Score
012.W-W Essential Training For Role 85% L 90.7% 92.0% 92.4% 93.0% 93.2% 93.8% 93.9% 93.9% 93.8% 92.8% 91.7% 93.0%
013.W-W Freedom to speak up issues 0.2% 0.2% 0.1% 0.1% 0.2% 0.1% 0.0% 0.2% 0.0% 0.1% 0.0% 0.0%

TB/18-19/126
20
Domain Indicators in Focus The graphs below provide a 12 month trend on areas of focus from the IQPR dashboard
Care Groups have retention plans in
place and are shared with WF&OD
Committee. Additionally a new
Workforce Group will support this work,
and build on the NHS Improvement
Retention programme workstream.
Activities to support sickness absence
include: involvement in the NHS
Improvement Health and Wellbeing
Programme, Monthly case review
meetings, monthly Health and Wellbeing
meetings as well as ongoing support for
managers.
TB/18-19/126
21
CQC Domain Well led – Finance Trust Strategic Objective & Board Assurance Framework
Deliver financial balance and organisational sustainability
Develop our core business and enter new markets through increased partnership working
Executive Lead(s): Executive Director of Finance Lead Executive Committee: Finance and Performance Committee
Executive Commentary Please see the financial performance report included as a separate agenda item for the detailed
financial performance. The below commentary summarises the key points as at month 7.
The Trust financial rating for use of resources is an annual target of a 3. The YTD actual is currently
a 3. The Trust has scored a rating of a 4 in the following areas; capital service capacity and I&E
margin. The agency spend performance has remained the same in month, where the Trust is rated a
3.
Income and Expenditure Performance (003.W-F)
The Trust is reporting a Year to date (YTD) deficit of £3.3m which is in line with plan. Included within
the deficit is a contingency of £2.2m. The Trust is currently forecasting to deliver the year end control
total of £1.8m. This however is not without risk. To deliver the control total the Trust will be deploying
a number of non-recurrent benefits to support the financial position in the latter two quarters of the
financial year. Part of this has been used in month 7 as planned, these are mitigations included within
the Trust forecast. The YTD financial performance is rated a 4 under the SOF, with the annual plan
rating a 3.
The Key factors impacting on the YTD position include:
o Agency spend, which is £0.4m above cap YTD
o Non recurrent vacancies, which are mitigating the agency overspend
o Pay award costs exceeding income allocation (£430k full year affect)
o Additional income from NHS England for Forensic Community team (costs already
included in the baseline which were previously unfunded)
Agency Spend (007.W-F – 010.W-F)

TB/18-19/126
22
The Trust has been set an agency cap of £6.1m for the financial year. The YTD cap is £3.6m and the
Trust is currently reporting spend of £4.0m, £0.4m above the cap. The agency run rate has slowed in
the last few months; the Trust was £7k above cap in month. There are a number of actions being
taken to reduce agency spend, which entails reviewing our workforce to consider how we recruit too
hard to fill posts going forward. There is a strong correlation between our ability to attract people and
our high temporary staffing spend. The Trust is also leading the STP Productivity work stream and as
part of this work stream is leading the Temporary staffing working group. In the last four weeks the
group has been working on developing a consistent contract with nursing agencies, including KPI’s
and adherence to rate caps. The Trust has adopted the same contractual terms and conditions and
rate cards which will provide a positive benefit in the latter part of the financial year.
CIPs (011.W-F – 013.W-F)
The Trust has a CIP plan of £6.7m this year (4%). In order to deliver the annual deficit of £1.8m the
full CIP plan will need to be delivered. In addition to this the Trust needs to deliver a further £4.6m of
efficiencies through operational productivity to tackle the underlying deficit. Therefore a total of
£11.4m efficiencies are required. The operational productivity programmes focuses on:
o Care Hours Per Patient Day (CHPPD) £1m
o Back office benchmarking £1m
o Pathway reviews £1.4m
The Trust has delivered savings of £3.6m YTD, which is a favourable variance of £552k. This is due
to a number of non-recurrent schemes within the clinical care groups. This is not expected to continue
in the latter part of the financial year, therefore there is an ongoing focus on identifying further
schemes. The current forecast for CIP delivery is £6m against the annual target of £6.7m.
Long Term Financial Sustainability
The finance team have implemented a deep dive approach to review clusters, using Service Line
Reporting (SLR) as its basis. This approach has been designed to tackle the underlying financial
deficit. This approach will look at our clinical pathways and activities and identify potential
unwarranted variation to enable the Trust to move towards long term financial sustainability. This will
be completed between now and March 19 focussing on the top eight areas. The deep dives to be
completed are detailed in the table below:

TB/18-19/126
23
The Trust has an underlying deficit of c£7m per annum. Plans to reduce the deficit are being
addressed utilising the Deep Dive approach referenced above and the Operational Productivity
programme.

TB/18-19/126
24
IQPR Dashboard: Well Led (Finance)
Ref Measure
SoF Target
Local /
National
Target
Nov-17 Dec-17 Jan-18 Feb-18 Mar-18 Apr-18 May-18 Jun-18 Jul-18 Aug-18 Sep-18 Oct-18
001.W-F Capital Service Capacity 1.1 N 1.1 1.1 1.2 1.2 1.4 0.6 0.6 0.4 0.5 0.5 0.5 0.8
002.W-F Liquidity (Days) -11.4 N -13.3 -12.0 -10.2 -10.5 -8.2 -10.8 -5.4 -11.6 -13.5 -12.4 -13.4 -12.2
003.W-F Income And Expenditure Margin YTD (%) -1.0% N -1.9% -1.9% -1.8% -1.7% -0.7% -4.2% -4.1% -4.1% -4.1% -4.1% -4.0% -3.1%
004.W-F Planned Surplus/(Deficit) YTD (£000) (1,800) N (2,326) (2,560) (2,717) (2,779) (2,834) (621) (1,211) (1,815) (2,437) (3,065) (3,561) (3,300)
005.W-F Actual Surplus/(Deficit) YTD (£000) (2,283) (2,511) (2,658) (2,717) (1,223) (621) (1,211) (1,815) (2,437) (3,064) (3,555) (3,298)
006.W-F Distance From Financial Plan YTD (%) 0.0% N 0.0% 0.0% 0.0% 0.0% 0.9% 0.0% 0.0% 0.0% 0.0% 0.0% -0.2% 0.0%
007.W-F Agency Cap YTD (£000) 6.1m N 4,665 5,240 5,814 6,383 6,951 515 1,030 1,545 2,060 2,575 3,090 3,605
008.W-F Agency Spend Actual (£000) 4,552 5,121 5,759 6,325 6,924 702 1,454 2,046 2,660 3,193 3,448 3,971
009.W-F Agency Variance from Cap (£000) (113) (119) (55) (58) (27) 187 424 501 600 618 358 366
010.W-F Agency Spend Against Cap YTD (%) 0.0% N -4.2% -4.2% -3.0% -3.2% -2.8% 36.2% 41.1% 32.4% 29.1% 24.0% 11.6% 10.1%
011.W-F CIP Plan (£000) 6.7m L (1) 582 370 369 472 381 411 391 356 360 468 669
012.W-F CIP Actual (£000) 368 660 629 630 682 411 451 1,151 730 448 347 485
013.W-F CIP Variance (£000) (368) (78) (260) (262) (210) 30 40 760 374 88 (120) (184)

TB/18-19/126
25
Domain Indicators in Focus The graphs below provide a 12 month trend on areas of focus from the IQPR dashboard
Actions in place:
Fortnightly CIP meetings as part of
CIP governance process
Deep dive approach (Oct 18 –Mar
19)
Annual planning for 2019/20
started
There are a number of actions being
taken to reduce agency spend which are
included within the domain indicators in
focus section for Well-led Finance.
Recruitment of ACPs instead of
medical staff
Use of Safe Care to inform
appropriate establishments for
wards
Review of observation policy
Cessation of support to acute
trusts beyond 24 hours
Care Hours per Patient Day
(CHPPD) work

TB/18-19/126
26
CQC Domain Caring Trust Strategic Objective & Board Assurance Framework
Consistently deliver an outstanding quality of care
Executive Lead(s): Executive Director of Nursing & Quality Lead Executive Committee: Quality Committee
Executive Commentary
Complaints – actuals (003.C)
Number of reported complaints in October slightly increased by four from last report. The top themes for both PALS and Complaints were all aspects of clinical treatment followed by communication, admission/discharge arrangements and staff attitude. A thematic review of these key areas was previously presented to the Quality Committee and the improvement work is being overseen by the Trust Wide Patient and Care Experience group. The areas of concern are largely from adult CMHTs and the themes centre on the complainant’s expectations of services they feel should be provided and how we communicate with them. Some of the complaints have been as a result of enforcing a standardised CMHT operating model and the challenges of managing previously held expectations of the function of a CMHT. As the new operating model becomes embedded, it is envisaged that these themes will decrease.
Complaints acknowledged within 3 days and responded to within 25 days (or agreed timeframe) (005.C and 006.C) Improvement has been maintained for 100% of all complaints acknowledgment within three days. Similarly, an improvement was noted in October with 96% of complaints investigations responded to within the 25 day timeframe or the agreed timeframe, the best recorded performance year to date. The improvement is attributable to closer monitoring of complaint response deadlines, engaging proactively with investigators and escalating when necessary.
Patient Reported Experience Measures (PREM) (0013.C – 0015.C) We implemented the PREM in December 2017 as part of our Quality Account priority. The PREM was co-produced with services users and staff. The feedback responses have increased from 64 in December to 703 in October. The best performing teams are CMHTs, Places of Safety (S136 Suites) Crisis teams, Older Adults CMHTs and the Specialist teams in Forensics and Specialist Care Group. The Older Adult Care Group has had the highest responses since the launch of the PREM. Services that have longer length of stay such as rehabilitation units, older adults’ dementia or continuing care and forensic wards tend to have lower response rates. This is to be expected in view of the patients profile and long length of stay. The survey is administered less frequently than acute and community teams. Strategies to improve feedback collection are shared at Trust Wide Patient and Carer Experience Group and local governance meetings and further by the Patient experience Team. We are aiming to achieve at least 1000 responses a month in time.
An analysis of the positive responses indicates that on average 90% of the patients report that they:

TB/18-19/126
27
o Feel listened to and supported
o That we communicate well with them
o We treat them with dignity and respect
o That they receive good care
Areas for improvement identified by 8% of respondents indicate that they do not always feel involved
in the planning of their care and that we do not always involve their friends, family or supporters in to
the extent they want us to. Through our implementation of the Triangle of Care principles, we should
see in time, an improvement in this area.

TB/18-19/126
28
IQPR Dashboard: Caring
Ref Measure
SoF Target
Local /
National
Target
Nov-17 Dec-17 Jan-18 Feb-18 Mar-18 Apr-18 May-18 Jun-18 Jul-18 Aug-18 Sep-18 Oct-18
001.C Staff Friends And Family Test %
Recommended – Care 67.8% 69.8% 68.4%
002.C Mental Health Scores From Friends And
Family Test – % Positive 93% N 92.0% 91.0% 90.4% 94.1% 95.8% 95.3% 95.1% 95.2% 93.2% 96.4% 96.2% 95.4%
003.C Complaints - actuals 16 17 27 16 22 15 21 30 28 48 40 44
004.C Complaints - per 10,000 contacts 4.79 6.58 8.26 5.72 7.42 4.97 6.64 9.54 8.33 15.75 13.80 13.31
005.C Complaints acknowledged within 3 days (or
agreed timeframe)100% L 81% 100% 85% 81% 100% 93% 95% 100% 100% 94% 100% 100%
006.C Complaints responded to within 25 days (or
agreed timeframe)100% L 63% 76% 67% 69% 45% 33% 52% 30% 86% 89% 94% 96%
007.C Compliments - actuals 74 75 71 77 72 93 90 97 83 94 74 107
008.C Compliments - per 10,000 contacts 22.13 29.04 21.72 27.53 24.28 30.82 28.45 30.85 24.70 30.84 25.54 32.36
010.C PALS acknowledged within 3 days (or agreed
timeframe)92% 98% 98% 98% 100% 100% 96% 98% 100% 98% 100% 100%
011.C PALS responded to within 25 days (or agreed
timeframe)89% 98% 94% 93% 91% 90% 91% 99% 99% 91% 90% 97%
012.C PALS - actuals 55 65 72 77 75 61 72 63 92 65 49 47
013.C Patient Reported Experience Measures
(PREM): Response count64 290 509 561 507 587 605 672 595 597 703
014.C Patient Reported Experience Measure
(PREM): Response rate0.5 2.2 3.9 4.3 3.9 4.4 4.6 5.0 4.5 4.7 5.2
015.C Patient Reported Experience Measure
(PREM): Achieving Regularly %94% 94% 94% 93% 94% 94% 94%

TB/18-19/126
29
Domain Indicators in Focus The graphs below provide a 12 month trend on areas of focus from the IQPR dashboard
The improvements are attributable to:
closer monitoring of complaint
response deadlines
engaging proactively with
investigators
escalating when necessary.

TB/18-19/126
30
CQC Domain Responsive Trust Strategic Objective & Board Assurance Framework
Maximise the use of digital technology
Meet or exceed the requirements set out in the Five Year Forward View
Ensure success of STP through active participation and leadership
Executive Lead(s): Chief Operating Officer Lead Executive Committee: Finance and Performance Committee
Executive Commentary
4 week to assessment and 18 week referral to treatment (002.R and 003.R)
We do not want patients who need our services, to have to wait. Our aim is to provide a responsive
and consistently high quality services to those who need us. Our work on the CMHT Single Operating
Model is designed to deliver that aim, and we have evidence that it is making a significant difference.
Our capacity however, is limited, and along with many other NHS services, we are now seeing
unprecedented demand in some of our teams.
Compared to overall pre-Summer statistics we have seen an increase in the average number of
referrals received to our community services (284 per day in October). The increase can impact on
the ability to offer timely intervention– see example A
Example A:
Older Persons CMHTs have increased numbers of referrals for memory assessment. The
increase started over the Summer 2018 and did not move back to pre-summer numbers. The
available team capacity is completing assessment, working extended hours and at weekends,
however cannot meet the demand. Offering more assessment slots impacts on the capacity to
deliver timely interventions. The Care Group, with support from finance, is currently reviewing
the memory assessment pathways to ensure quality, efficiency, unwarranted variation and
productivity are at maximum optimum
The Specialist Care group has a number of very small services and are unable to meet the referral
rate or provide specialist interventions following assessment. The trust continues to work through the
contracting meetings to highlight and identify gaps in provision with commissioners

TB/18-19/126
31
% Of Patients Waiting List Over 28 Days (004.R) & DNA’s and Cancellations (007.R – 010.R)
Where patients have been referred, assessed and are waiting for treatment, the Active Review
process ensures that we remain in contact with them, and ensure their safety. Feedback from patients
who are supported through active review has been extremely positive and the CQC noted Active
Review as good practice in their October inspection of community teams.
This area of work, the solutions to resolving waits for treatment, and the level of commissioned
services are a priority for the Chief Operating Officer and her team. Progress against our trajectories
are regularly shared with the executive and board sub committees and will continue to be so.

TB/18-19/126
32
IQPR Dashboard: Responsive
Ref Measure
SoF Target
Local /
National
Target
Nov-17 Dec-17 Jan-18 Feb-18 Mar-18 Apr-18 May-18 Jun-18 Jul-18 Aug-18 Sep-18 Oct-18
001.R People With A First Episode Of Psychosis
Begin Treatment With A Nice-Recommended
Care Package Within Two Weeks Of Referral 53% N 79.3% 81.8% 81.3% 93.8% 76.0% 76.2% 87.5% 75.0% 81.8% 85.0% 70.6% 76.2%
002.R Referral To Assessment Within 4 Weeks 95% L 84.8% 88.4% 78.5% 84.5% 80.0% 78.1% 83.8% 86.9% 86.7% 84.8% 82.3% 84.0%
003.R 18 Weeks Referral To Treatment 95% L 89.5% 90.5% 89.1% 90.7% 89.6% 87.4% 87.9% 88.9% 89.0% 91.3% 89.7% 88.9%
004.R % Of Waiting List Over 28 Days 52.9% 55.7% 49.2% 49.8% 52.9% 54.7% 51.5% 62.3% 55.3% 53.7% 54.8% 51.4%
005.R % of Liaison (urgent) referrals seen within 1
hour76.2% 82.9% 84.4% 83.4% 70.7% 77.6% 90.7% 84.5% 86.2% 80.7% 87.1% 82.1%
006.R % of Liaison (urgent) referrals seen within 2
hours81.1% 83.2% 80.2% 84.1% 75.8% 84.6% 78.3% 79.0% 81.1% 79.7% 82.2% 84.4%
007.R DNA'S - 1st Appointments 8.4% 8.5% 8.0% 7.8% 7.7% 6.9% 7.4% 7.3% 8.0% 7.8% 7.8% 6.7%
008.R DNA's - Follow Up Appointments 10.5% 11.0% 10.6% 10.4% 10.2% 10.0% 9.9% 10.6% 10.2% 9.5% 9.3% 9.4%
009.R Patient cancellations- 1st Appointments 2.4% 2.4% 2.8% 2.6% 2.8% 2.1% 2.3% 2.3% 2.4% 2.3% 2.5% 2.7%
010.R Patient cancellations- Follow Up
Appointments4.6% 5.6% 4.7% 5.4% 5.3% 4.8% 5.1% 5.0% 5.1% 4.6% 4.7% 4.6%
013.R Referrals Received (ave per calendar day) 272.8 226.0 261.8 247.0 248.6 249.9 269.7 275.5 281.3 284.2 264.8 284.3

TB/18-19/126
33
Domain Indicators in Focus The graphs below provide a 12 month trend on areas of focus from the IQPR dashboard
Actions in place:
Each CMHT has calculated the
number of assessment slots
they are able to provide each
week in accordance with the
KCC transformation.
Clinical leaders are currently
redefining the assessment
process in line with the clinical
care pathways increase
capacity to deliver more
assessments.
The Chief Operating Officer will
set up and lead a task and finish
group to address factors
impacting waiting lists including
DNA’s and Cancellations.

34
Date of Update: Nov 19th 2018
Board Assurance Framework

35
Ref Chart Key Risk Risk Risk Description Likelihood ConsequenceRisk Score:
Nov 18
Variance
from Aug
18
SO1.1 4248Community Flow; High Caseloads and
Unallocated Cases
Requirement for practitioners caseload being at an appropriate and safe level to manage quality of
service, staff stress and turn over, potential serious harm to service users.2 4 8 -4
SO1.2 3756 CQC ComplianceEffective means for assessing, measuring, monitoring and reviewing quality and safety standards
required to uphold CQC registration 2 3 6 -3
SO1.3 4083 Management of Environmental LigaturesEffective means for measuring, monitoring and assessing the risks associated with anchor points
required to minimise exposureof patients to patient safety risks 2 4 8 0
SO2.1 3808 RecruitmentImpact on the ability to meet safe staffing requirements and continued reliance on agency staff,
increased cost and potentially lower quality service to patients4 3 12 0
SO2.2 5148 Retention of employeesImpact on staff morale, absence and productivity and potential impact on patient experience
4 3 12 0
SO2.3 3738Staff engagement, acting on feedback and
cultural change
Impact on staff morale, recruitment, retention, absence and productivity and have a potential impact
on patient experience 3 3 9 0
SO2.4 5673 Culture is not open or transparentCulture to promote; openness, transparency and addressing poor performance to deliver Brilliant
Care Through Brilliant People 3 3 9 -3
SO3.1 2820Emergency and Business Continuity
Planning
Trust readiness to respond appropriately to foreseeable emergencies affecting continuity of service
in order to minimise harm to persons, premises, delivery of services, reputation.2 4 8 -4
SO3.2 3763 Estates Transformation Programme (Hard)Potential for an estate that is unfit for purpose and does not support delivery of the clinical
services/strategy 2 3 6 0
4 SO4.1 5345Participation in international research &
development
Increasing activity in this area to improve attractiveness of the Trust in terms of recruitment and
tendering and patient choice.3 2 6 0
5 SO5.1 3750 IT Connectivity - Access to RiOPotential reduced access to information and delays in producing and reviewing key information and
possible harm to patients and staff plus poor morale.3 2 6 0
6 SO6.1
7 SO7.1 5624 Financial OverspendDelivery of the £11.4m saving target to deliver the FY18/19 plan to minimise risk that the Trust misses
the 3 year sustainability target, impcating the ability to deliver long term financial sustainability. 5 4 20 4
8 SO8.1 5456 New Care Models - Secure ServicesPotential financial risk which relates to the Trust Income baseline with NHSE
2 4 8 0
9 SO9.1 4996 STP ProcessActive engagement in the Kent wide STP Process to ensure any proposed changes can be dealt with
in sufficient depth2 3 6 0
Ensure success of our system-wide
sustainability plans through active
Objective
1Consistently deliver outstanding quality of
care
2Recruit retain and develop the best staff
making KMPT a great place to work
3Put continuous improvement at the heart of
what we do
Develop and extend our research and
innovation work
Maximise the use of digital technology
Meet or exceed requirements set out in the
Five Year Forward View
Deliver financial balance and organisational
sustainability
Develop our core business and enter new
markets through increased partnership

36
Appendices Appendix A
*The above tables includes those SoF measures that are reportable and supported by clear national guidance but is not inclusive of all indicators within the SoF. Full details available here
IQPR Dashboard: Single Oversight Framework
RefMeasure Target Sep-18 Oct-18
Trend(Last 12 months where available, left to right)
001.S Occurrence Of Any Never Event0 0 0
001.E Care Programme Approach (CPA) Follow-Up –
Proportion Of Discharges From Hospital
Followed Up Within Seven Days
95% 96.0% 96.3%
002.E % Clients In Settled Accommodation82.6% 82.4%
003.E % Clients In Employment15.0% 15.0%
004.E Data Quality Maturity Index (DQMI) – MHSDS
Dataset Score98.0% 98.0%
005.E Inappropriate Out-Of-Area Placements For
Adult Mental Health Services.260 289
001.W-W Staff Sickness - Overall4% 4.2%
002.W-W Staff Sickness - Short term2% 1.7%
003.W-W Staff Sickness - Long term2% 2.5%
004.W-W Staff Turnover12% 14.7% 14.9%
011.W-W Staff Survey Engagement ScoreLast results Sept 2017: 3.8%
001.W-F Capital Service Capacity1.06 0.5 0.8
002.W-F Liquidity (Days)-11.40 -13.4 -12.2
003.W-F Income And Expenditure Margin YTD (%)-1.0% -4.0% -3.1%
010.W-F Agency Spend Against Cap YTD (%)0.0% 11.6% 10.1%
001.C Staff Friends And Family Test %
Recommended – Care
002.C Mental Health Scores From Friends And
Family Test – % Positive93.0% 96.2% 95.4%
001.R People With A First Episode Of Psychosis
Begin Treatment With A Nice-Recommended 53.0% 70.6% 76.2%