Tax compliance nudges are used increasingly by governments ...
49
econstor Make Your Publications Visible. A Service of zbw Leibniz-Informationszentrum Wirtschaft Leibniz Information Centre for Economics Antinyan, Armenak; Asatryan, Zareh Working Paper Nudging for Tax Compliance: A Meta-Analysis CESifo Working Paper, No. 8500 Provided in Cooperation with: Ifo Institute – Leibniz Institute for Economic Research at the University of Munich Suggested Citation: Antinyan, Armenak; Asatryan, Zareh (2020) : Nudging for Tax Compliance: A Meta-Analysis, CESifo Working Paper, No. 8500, Center for Economic Studies and Ifo Institute (CESifo), Munich This Version is available at: http://hdl.handle.net/10419/223572 Standard-Nutzungsbedingungen: Die Dokumente auf EconStor dürfen zu eigenen wissenschaftlichen Zwecken und zum Privatgebrauch gespeichert und kopiert werden. Sie dürfen die Dokumente nicht für öffentliche oder kommerzielle Zwecke vervielfältigen, öffentlich ausstellen, öffentlich zugänglich machen, vertreiben oder anderweitig nutzen. Sofern die Verfasser die Dokumente unter Open-Content-Lizenzen (insbesondere CC-Lizenzen) zur Verfügung gestellt haben sollten, gelten abweichend von diesen Nutzungsbedingungen die in der dort genannten Lizenz gewährten Nutzungsrechte. Terms of use: Documents in EconStor may be saved and copied for your personal and scholarly purposes. You are not to copy documents for public or commercial purposes, to exhibit the documents publicly, to make them publicly available on the internet, or to distribute or otherwise use the documents in public. If the documents have been made available under an Open Content Licence (especially Creative Commons Licences), you may exercise further usage rights as specified in the indicated licence. www.econstor.eu
Transcript of Tax compliance nudges are used increasingly by governments ...

econstorMake Your Publications Visible.
A Service of
zbwLeibniz-InformationszentrumWirtschaftLeibniz Information Centrefor Economics
Antinyan, Armenak; Asatryan, Zareh
Working Paper
Nudging for Tax Compliance: A Meta-Analysis
CESifo Working Paper, No. 8500
Provided in Cooperation with:Ifo Institute – Leibniz Institute for Economic Research at the University of Munich
Suggested Citation: Antinyan, Armenak; Asatryan, Zareh (2020) : Nudging for Tax Compliance:A Meta-Analysis, CESifo Working Paper, No. 8500, Center for Economic Studies and IfoInstitute (CESifo), Munich
This Version is available at:http://hdl.handle.net/10419/223572
Standard-Nutzungsbedingungen:
Die Dokumente auf EconStor dürfen zu eigenen wissenschaftlichenZwecken und zum Privatgebrauch gespeichert und kopiert werden.
Sie dürfen die Dokumente nicht für öffentliche oder kommerzielleZwecke vervielfältigen, öffentlich ausstellen, öffentlich zugänglichmachen, vertreiben oder anderweitig nutzen.
Sofern die Verfasser die Dokumente unter Open-Content-Lizenzen(insbesondere CC-Lizenzen) zur Verfügung gestellt haben sollten,gelten abweichend von diesen Nutzungsbedingungen die in der dortgenannten Lizenz gewährten Nutzungsrechte.
Terms of use:
Documents in EconStor may be saved and copied for yourpersonal and scholarly purposes.
You are not to copy documents for public or commercialpurposes, to exhibit the documents publicly, to make thempublicly available on the internet, or to distribute or otherwiseuse the documents in public.
If the documents have been made available under an OpenContent Licence (especially Creative Commons Licences), youmay exercise further usage rights as specified in the indicatedlicence.
www.econstor.eu

8500 2020
August 2020
Nudging for Tax Compliance: A Meta-Analysis Armenak Antinyan, Zareh Asatryan

Impressum:
CESifo Working Papers ISSN 2364-1428 (electronic version) Publisher and distributor: Munich Society for the Promotion of Economic Research - CESifo GmbH The international platform of Ludwigs-Maximilians University’s Center for Economic Studies and the ifo Institute Poschingerstr. 5, 81679 Munich, Germany Telephone +49 (0)89 2180-2740, Telefax +49 (0)89 2180-17845, email [email protected] Editor: Clemens Fuest https://www.cesifo.org/en/wp An electronic version of the paper may be downloaded · from the SSRN website: www.SSRN.com · from the RePEc website: www.RePEc.org · from the CESifo website: https://www.cesifo.org/en/wp

CESifo Working Paper No. 8500
Nudging for Tax Compliance: A Meta-Analysis
Abstract Tax compliance nudges are used increasingly by governments because of their perceived cost-effectiveness in raising tax revenue. We collect about a thousand treatment effect estimates from 45 randomized controlled trials, and synthesize this rapidly growing literature using meta-analytical methods. We show that interventions pointing to elements of individual tax morale are on average ineffective in curbing tax evasion (when evaluated against a control group of taxpayers receiving neutral communication). In contrast, deterrence nudges - interventions emphasizing traditional determinants of compliance such as audit probabilities and penalty rates - increase compliance. However, their effects are modest in magnitude increasing the probability of compliance by 1.5-2.5 percentage points more than non-deterrence nudges. Our additional results suggest that nudges i) work better on sub-samples of late payers and when delivered in-person, ii) are less effective in the long-run and in lower-income countries, and iii) are somewhat inflated by selective reporting of results. JEL-Codes: C930, D910, H260. Keywords: tax compliance, randomized control trials, nudging, tax morale, meta-analysis.
Armenak Antinyan
Zhongnan University of Economics and Law Wuhan / China
Zareh Asatryan ZEW Mannheim
Mannheim / Germany [email protected]
First version: November, 2019 This version: August, 2020 We thank Sebastian Blesse, Keith Marzilli Ericson, Annika Havlik, Jost Heckemeyer, Friedrich Heinemann, Carla Krolage, Tom Lane, Carina Neisser, Justus Nover, Anh Pham, Johannes Rincke, Christian Traxler as well as workshop participants at ZEW Public Finance Conference, Armenian Economic Association and International Institute of Public Finance for valuable comments. We are grateful to Felix Köhler and Agon Topxhiu as well as Kerry Neitzel, David Westerheide and Zeyuan Xiong for excellent research assistance.

1 Introduction
Recent years have seen a lot of excitement around the idea of using “nudges” with the aim
to improve individual behavior. Nudges are interventions that respect the freedom of choice
and leave economic incentives intact (Benartzi et al. 2017),1 and they have been studied
in many important policy areas such as taxation (Mascagni 2018), education (Dizon-Ross
2019), healthcare (Wisdom et al. 2010), consumer behavior (Costa and Kahn 2013), among
others.
In the field of taxation, nudging has become widely popular in the last decade among pol-
icy makers who often claim that relative to the negligible direct cost of nudging (e.g., sending
a letter) the potential payoffs involved can be extremely high.2 Academic economists, on the
other hand, have come to recognize that a large behavioral response to a simple informational
update induced by a nudge is not overly consistent with expected utility theories of human
behavior where tax compliance is primarily driven by fundamental economic incentives.3 Such
evidence showing that agents respond to nudges would at least demonstrate the presence of
information imperfections (e.g., taxpayers misperceive the probability of being detected when
evading), and would possibly hint to the existence of deviations from utility maximization
(e.g., taxpayers additionally care about tax morale).4
In this paper, we use methods of meta-analysis and ask whether nudges are really effective
in increasing tax compliance levels among individuals and small firms. In so doing we aim to
present a systematic review of the literature and to provide guidance for further tax experiments
1Thaler and Sunstein (2008) define a nudge as an “aspect of the choices architecture that alters people’sbehavior in a predictable way without forbidding any options or significantly changing their economic incen-tives.” They continue that for an intervention “to count as a mere nudge, the intervention must be easy andcheap to avoid”.
2For instance, Hallsworth et al. (2017) and Bott et al. (2017) report £9 million and $25 million increasein tax revenues, respectively, due to letters sent. Although, typically these letters are interpreted of beingvirtually costless, Allcott and Kessler (2019) argues that nudges entail significant costs for the nudge recipientsand shows that the failure to take into account these costs overstates the effects of nudges on social welfare.
3This canonical theory of Allingham and Sandmo (1972), Yitzhaki (1974), modeled after the economics ofcrime literature (Becker 1968), views the individual as a rational agent with some level of risk aversion whoconsiders tax evasion as a gamble trading off the benefits of successful evasion against the costs of detectionand punishment.
4Motivated by mounting evidence on various behavioral biases of taxpayers, Farhi and Gabaix (2019)develops a theory of optimal taxation with behavioral agents also incorporating nudges into this framework.For a recent review of behavioral public economics literature, see, Bernheim and Taubinsky (2018).
2

and policy interventions. Of course, an alternative and arguably a more thorough way of
surveying the literature can be done through qualitative means. Many excellent literature
reviews have been written, such as Alm (2019), Andreoni et al. (1998), Slemrod (2007,
2019), Slemrod and Yitzhaki (2002) on tax compliance generally, as well as Luttmer and
Singhal (2014) on tax morale, Mascagni (2018) on tax experiments and Pomeranz and Vila-
Belda (2019) on tax capacity, more specifically. We extend this literature by performing
a systematic empirical analysis of nudging interventions. This is an important task since
as Luttmer and Singhal (2014) put it “similar interventions have produced varying results in
different contexts” and “it would be useful to examine why”. We are aware of two meta-studies
of tax experiments (Alm et al. 2018, Blackwell 2007) which study laboratory experiments
while we focus on field work.5 Additionally, Benartzi et al. (2017), DellaVigna and Linos
(2020), Hummel and Maedche (2019) perform meta-analyses of nudges, but they do so in
various fields of policy rather than focusing on tax compliance as we do here.
As opposed to qualitative reviews, our meta-analysis attempts to give more systematic
answers to questions like: i) Are nudges effective in curbing tax evasion? ii) If so, on which
margins of compliance and by how much on average? iii) Which nudge types work more
effectively? iv) Are nudges effective also in the longer horizon? v) Which groups of taxpayers
are more responsive to nudges? vi) Do nudges work in specific settings (e.g., low compliance
environment) or more generally?
To answer these questions we collect data on nearly 1,000 treatment effect estimates of
tax compliance coming from 45 studies.6 We divide these data into three different samples
according to the measure of tax compliance employed:7 i) extensive margin of tax compliance
measured as either the probability to pay or file or report taxes, ii) intensive margin of tax
5Blackwell (2007) concludes that increasing the penalty rate, the marginal per capita return to the publicgood and the probability of audit lead to higher tax compliance, meanwhile tax rate has no significant impacton tax compliance. Focusing on a larger set of papers, Alm et al. (2018) illustrate that audit probabilityincreases tax compliance on the extensive margin, while audit probability and the tax rate influence taxcompliance negatively on the intensive margin.
6These studies are listed in Table 1. The map in Figure 1 shows the geographic distribution of theseexperiments as well as of 18 ongoing interventions registered in the randomized control trial (RCT) registryof the American Economic Association.
7Figures 2(a), 2(b) and 3 present the distributions of these three variables.
3

compliance measured as the amount of reported income or reported tax, and iii) the stan-
dardized t-value behind the treatment effect estimates for all various types of tax compliance
measures.
Unlike many other meta-studies in economics,8 one advantage of this paper is that we
pool together RCTs which have a relatively high degree of homogeneity in their quality of
identification. This higher than usual level of comparability of treatment effects coming from
different interventions makes our conclusions more meaningful.9 Another favorable feature of
this exercise is that we can study magnitudes of effects in addition to their direction since
tax compliance, our dependent variable of interest, can be measured in a relatively standard
form. A third advantage is that since almost all of the studies in our sample implement several
interventions in their experiments, we can use study fixed effects thus obtaining within study
estimates of nudges that control for all study characteristics.
Our main finding is that, in contrast to the recent excitement over nudges, the behavioral
content introduced in the communication between the tax administration and the taxpayer is
not as effective as often thought. We present robust evidence that on average only deterrence
interventions, i.e., nudges informing about audit probabilities and potential penalties, work in
increasing compliance levels. The baseline effects of behavioral letters that inform taxpayers
about the importance of paying taxes for the adequate provision of public goods, about the
(positive) behavior of their peers, or hint towards general appeals of paying taxes as a morale
obligation are on average ineffective once these are properly compared to a control group
of taxpayers who receive some neutral information. The effect magnitudes of deterrence
intervention are modest as they increase compliance by 1.5 to 2.5 percentage points on the
extensive margin compared to taxpayers receiving non-deterrence treatments.10
8For several recent applications, see, Card et al. (2010, 2017), Feld and Heckemeyer (2011), Gechert(2015), Heinemann et al. (2018), Lichter et al. (2015), Neisser (2017), and for a review of meta methods,see, Anderson and Kichkha (2017), Nelson and Kennedy (2009), Stanley et al. (2013), Stanley (2001), Stanleyand Doucouliagos (2012).
9This argument is one reason behind the methods of meta-analysis being so much more popular in thefield of medical sciences (which often evaluate randomized clinical trials) than in economics (Stanley 2001).
10These relative effects are somewhat higher in our additional sample studying responses at the intensivemargin, and range from 5 to 13 percentage points on average. However, these effects are still moderate whencomparing them to the effects of various other characteristics on intensive margin compliance.
4

A strong way of interpreting this evidence is that individual financial motives, rather
than elements of tax morale11 like social norms or reciprocity remain the first order factors
behind compliance decisions. A competing interpretation, however, is that deterrence and non-
deterrence nudges are not equally effective in shifting the prior beliefs of taxpayers. According
to Pomeranz and Vila-Belda (2019), it may well be that nudges implemented by tax authorities
are more effective in shifting perceptions of audit probabilities than perceptions of social norms.
Either way, our evidence suggests that at the very least the mainstream neoclassical approach
to tax evasion should take into account the possibility that taxpayers are constrained with
information imperfections.
Despite these modest baseline effects, our additional findings highlight certain design
aspects of experiments that may make them potentially more effective. For example, we find
that nudges communicated through in-person visits deliver more powerful results in terms of
compliance outcomes than nudges communicated through letters. In terms of different groups
of taxpayers, we find that the practice of selecting to focus on previous non-compliers (such
as late-payers) can potentially increase the effectiveness of nudges. On the other hand, we
find that the effects of nudges are likely to be bound to the short-run, as well as to work less
effectivelly in lower income countries. In line with DellaVigna and Linos (2020),12 we also find
evidence that these experimental estimates are inflated by selective reporting of results.13
2 Sample of studies
Literature search: We ran a literature search on a rolling basis throughout March to Octo-
ber of 2019. First, we searched for relevant papers using a defined combinations of keywords14
11See Besley et al. (2019) for theory and evidence on the interaction between individual and social motivesin tax evasion.
12DellaVigna and Linos (2020) compare estimates of interventions presented in research studies versus theunpublished estimates obtained from trials done “at scale” by two nudge units in the US.
13Both in terms of p-hacking, where marginally significant treatment effects are more likely to be reportedthan results narrowly failing to reject the null, as well as file drawer type of bias, where the results notsupporting the likely hypotheses of researchers are not reported.
14The keywords include: randomized controlled trial, RCT, field experiment, nudging, nudges, behavioralintervention, tax evasion, tax compliance, tax non-compliance.
5
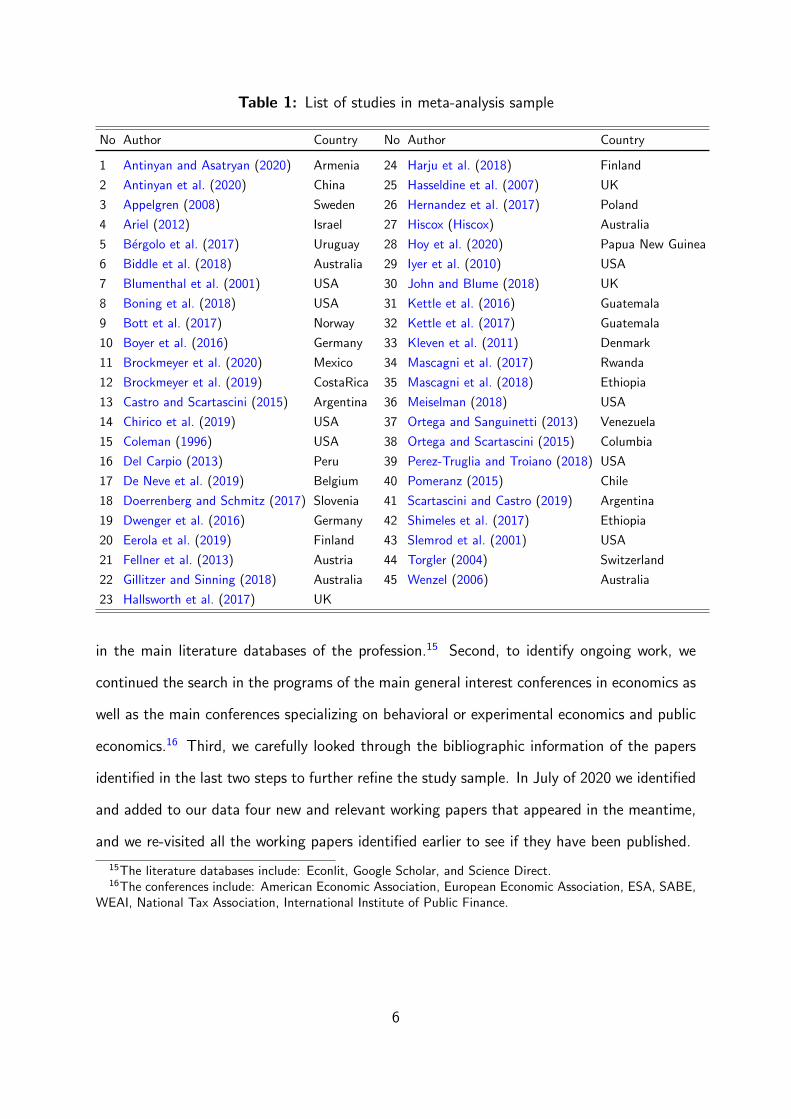
Table 1: List of studies in meta-analysis sample
No Author Country No Author Country
1 Antinyan and Asatryan (2020) Armenia 24 Harju et al. (2018) Finland
2 Antinyan et al. (2020) China 25 Hasseldine et al. (2007) UK
3 Appelgren (2008) Sweden 26 Hernandez et al. (2017) Poland
4 Ariel (2012) Israel 27 Hiscox (Hiscox) Australia
5 Bergolo et al. (2017) Uruguay 28 Hoy et al. (2020) Papua New Guinea
6 Biddle et al. (2018) Australia 29 Iyer et al. (2010) USA
7 Blumenthal et al. (2001) USA 30 John and Blume (2018) UK
8 Boning et al. (2018) USA 31 Kettle et al. (2016) Guatemala
9 Bott et al. (2017) Norway 32 Kettle et al. (2017) Guatemala
10 Boyer et al. (2016) Germany 33 Kleven et al. (2011) Denmark
11 Brockmeyer et al. (2020) Mexico 34 Mascagni et al. (2017) Rwanda
12 Brockmeyer et al. (2019) CostaRica 35 Mascagni et al. (2018) Ethiopia
13 Castro and Scartascini (2015) Argentina 36 Meiselman (2018) USA
14 Chirico et al. (2019) USA 37 Ortega and Sanguinetti (2013) Venezuela
15 Coleman (1996) USA 38 Ortega and Scartascini (2015) Columbia
16 Del Carpio (2013) Peru 39 Perez-Truglia and Troiano (2018) USA
17 De Neve et al. (2019) Belgium 40 Pomeranz (2015) Chile
18 Doerrenberg and Schmitz (2017) Slovenia 41 Scartascini and Castro (2019) Argentina
19 Dwenger et al. (2016) Germany 42 Shimeles et al. (2017) Ethiopia
20 Eerola et al. (2019) Finland 43 Slemrod et al. (2001) USA
21 Fellner et al. (2013) Austria 44 Torgler (2004) Switzerland
22 Gillitzer and Sinning (2018) Australia 45 Wenzel (2006) Australia
23 Hallsworth et al. (2017) UK
in the main literature databases of the profession.15 Second, to identify ongoing work, we
continued the search in the programs of the main general interest conferences in economics as
well as the main conferences specializing on behavioral or experimental economics and public
economics.16 Third, we carefully looked through the bibliographic information of the papers
identified in the last two steps to further refine the study sample. In July of 2020 we identified
and added to our data four new and relevant working papers that appeared in the meantime,
and we re-visited all the working papers identified earlier to see if they have been published.
15The literature databases include: Econlit, Google Scholar, and Science Direct.16The conferences include: American Economic Association, European Economic Association, ESA, SABE,
WEAI, National Tax Association, International Institute of Public Finance.
6

Figure 1: Country coverage of nudging experiments
PaperOnly Ongoing ExperimentNo Paper or Experiment
Source : Own compilation. The papers are listed in Table 1. Data on ongoing experiments is based on theRCT registry of the American Economic Association as retrieved on October 21, 2019.
Study inclusion criteria: For a paper to be included in our sample all of the following
four criteria need to be fulfilled: i) the study is based on a RCT performed at the level
of taxpayers (i.e. individuals or firms rather than, e.g., regions); ii) the trial introduces a
nudging intervention which closely follows the definition of Thaler and Sunstein (2008); iii)
the dependent variable of interest is the tax payment behavior of the taxpayer; and iv) the
resulting study reports all the relevant statistics necessary for our meta-analysis (e.g., effect
sizes along with the standard errors) for at least one treatment effect estimate.
Final sample: After applying these four filters to the list of papers collected from our
extensive search we arrive at an overall sample of 45 studies. These studies are listed in Table
1 in alphabetical order. These 45 experiments were performed in 28 countries situated mainly
in Europe, Africa, Australia and the Americas as presented in the map of Figure 1.
7

Figure 2: Distribution of treatment effects of extensive and intensive margin responses
(a) Probability to comply (b) Log amount
Notes : Sub-figure (a) and (b) plot a histograms of treatment effects on extensive and intensive margins ofcompliance, respectively, which we obtained from the primary studies in our sample. We plot these treatmenteffect for deterrence and non-deterrence nudges separately. For visual clarity, sub-figures (a) and (b) drop,respectively, 6 and 28 outlier observations that are larger than 1.
3 Data
3.1 Dependent variables
We adopt three different dependent variables that measure either the magnitude of tax com-
pliance in two ways or the statistical significance of the treatment effects.
Extensive margin: Our main dependent variable of interest attempts to measure the mag-
nitude of tax compliance as generally as possible. In particular, it captures treatment effect
estimates that measure the impact of nudges at the extensive margin of tax compliance. This
margin is defined as either the probability to pay or file or report taxes in a given time horizon.
This variable is available for 488 observations coming from 31 studies. This makes about
half of our full sample of estimates, owing to the fact that papers measure tax compliance
differently, but it still contains sufficient variation for identification. Figure 2 (a) presents a
histogram of the distribution of treatment effects on extensive margin of compliance.
8

Figure 3: Distribution of t-values of treatment effects in the full sample
Notes : Figure plots a histogram of t-values of treatment effects which we obtained from the primary studiesin our sample. We plot t-values for deterrence and non-deterrence nudges separately. For visual clarity, wedrop 117 outlier observations that lie outside the (-10, 10) range. Vertical lines denote critical values fortwo-sided significance tests at t-values of +/-1.645, +/-1.96 and +/-2.58.
Intensive margin: The second dependent variable collects estimates that measure the im-
pact of nudges on intensive margin of tax compliance.17 Studies use different measures of
intensive margin responses, and the most common ones that we choose to focus on study
either reported taxes or reported income. These variables are estimated either in absolute
values in national currencies or on a logarithmic scale. To assure comparability across studies,
we transformed those effect sizes that appear in absolute values by dividing the point estimate
of the treatment effect by the average of the dependent variable of the control group (in the
post-intervention period when available). We are left with only about the sixth of our total
sample size which substantially reduces the precision of our estimates. Compliance measured
at the intensive margin comprises of 175 observations from 17 papers, and intends to serve
as a sample for testing the robustness of hypotheses in addition to our main sample. The
variable is plotted in the histogram of Figure 2 (b).
17We do not claim that the intensive margin effect is necessarily separable from the extensive margin effectin all contexts, and rather rely on the respective specification of the primary study. For work that allowsfor both intensive and extensive margin responses to taxes, see, Blundell and MaCurdy (1999) and Klevenand Kreiner (2006) in the context of labor supply responses, and Almunia et al. (2019) in the context of taxdeductible charitable donations.
9

T-values: The third dependent variable comprises of the full sample of t-values of treatment
effect estimates. We cannot analyze the magnitude of compliance in this sample, and rather
we only study the direction and statistical significance of effects. We also caution against the
fact that t-values are, of course, a function of degrees of freedom, thus making the cross-study
comparisons not straightforward. The main benefit of using this variable is that t-values being
standard measures are available for all 45 studies in the sample covering 997 estimates. We
thus follow other applications of meta-analytical techniques in economics, such as by Baskaran
et al. (2016), Card et al. (2010, 2017), Heinemann et al. (2018), Klomp and De Haan (2010),
and use this sample. Our primary motivation for using the t-values is the aim to study the
robustness of results coming from the main sample of extensive margin responses. Figure 3
presents a histogram of the distribution of t-values.
3.2 Types of nudges
We classify nudges into deterrence and non-deterrence categories. Each category contains
about half of our sample. We then further divide the non-deterrence nudges into interventions
related to reminders, simplifications and information on one side, and tax morale related
nudges on the other side. Figure 4 presents a tabulation of the types of nudges with respect
to the three dependent variables.
Deterrence nudges: To be considered as a deterrence nudge, the communication between
tax administration and taxpayers should specifically contain a threat that highlights one of
the economic factors behind the tax compliance decision as in the canonical model of tax
evasion by Allingham and Sandmo (1972): mainly the possibility of audit and the potential
penalty if caught evading. An example of such a nudge is the following one used by Castro
and Scartascini (2015): “Did you know that if you do not pay the CVP on time for a debt
of AR$ 1,000 you will have to disburse AR$ 268 in arrears at the end of the year and the
10

Figure 4: Frequency of observations per type of nudge for each dependent variable
010
020
030
0
Remind
er,
Simpli
ficati
on,
and I
nform
ation
Deterre
nce
Deterre
nce
Intera
cted
Public
Good
Peer E
ffect
Moral A
ppea
l
t-value extensive intensive
Notes : The figure shows the frequency of non-missing observations per type of nudge for the three dependentvariables. For visual clarity we drop 36 observations from the full sample that fall into other less popularcategories of nudges.
Municipality can take administrative and legal action?”.18 Within the category of deterrence
nudges we also distinguish deterrence nudges that additionally include a tax morale type nudge
(as defined below) and call these nudges “deterrence interacted”.
Tax morale related nudges: To be acknowledged as a non-deterrence nudge, the commu-
nication content between the tax administration and taxpayers should not contain a threat that
has the potential to alter the taxpayers’ financial motives. The first and main sub-category
of non-deterrence nudges is built on the solid evidence in the literature that taxpayers can be
motivated by such considerations as morality, the perception of fairness, social norms in the
society, provision of public goods by the government, and the like. For convenience, we call
these types as “tax morale related” nudges. The three common nudges in this sub-category
are detailed below:
18Note that communications including both deterrence and non-deterrence components are classified asa deterrence nudge given the presence of the threat component. In an additional analysis we label thesecommunications as mixed deterrence nudges and study their effects separately.
11

• Public good, which makes it clear that the taxes paid by individuals are used to finance
public goods and services: “Your tax payment contributes to the funding of publicly
financed services in education, health and other important sectors of society” (Bott
et al. 2017).
• Peer effect, which underlines that the majority of individuals in a given country/community
are complying with taxes: “Nine out of ten people pay their taxes on time” (Hallsworth
et al. 2017).
• Moral appeal, which appeals to morality to influence taxpayer behavior: “If the taxpayers
did not contribute their share, our commune with its 6226 inhabitants would suffer
greatly. With your taxes you help keep Trimbach attractive for its inhabitants” (Torgler
2004).
In our analysis we study deterrence and the main non-deterrence nudges as two broad
groups of nudge types, and in additional analysis we study the individual effects of these three
types of non-deterrence nudges separately.
Reminder, simplification and information nudges: The second sub-category of non-
deterrence nudges mainly contains manipulations that are utilized “to correct” the taxpayer
non-compliance that stems from such behavioral fallacies as limited attention, procrastination
and cognitive overload among others. For instance, simple reminders are sent to taxpayers
to overcome the problem of limited attention (Hernandez et al. 2017, Mascagni et al.
2017). The problem of cognitive overload is usually bypassed through the simplification of
the communication language, the introduction of visual stimuli or provision of information
how to file the income (De Neve et al. 2019, Eerola et al. 2019). This sub-category of non-
deterrence nudges also include communications which introduce various types of informational
content, such as a sentence on tax deductible donations (Biddle et al. 2018), phone number
for enhanced consumer service (Coleman 1996), a statement of intent by tax administration
to help during the filing process (Hasseldine et al. 2007), and the like. In the analysis that
12

Figure 5: Study characteristics
Deterrence
Non-Deterrence
Nudge type
No Info
Baseline Info
Letter
Control group
Unpublished
Published
Publication status
Physical Letter
Digital Letter
In Person
Delivery method
Income Tax
Corporate Tax
Property Tax
VAT
Other
All
Tax type
Long Run
Short Run
Response horizon
On Time
Late
Late-payer or not
Low Income
Middle Income
High Income
Income level
Notes : The figure shows the distributions of categories within study characteristics for the full sample oft-values.
follows, we group all these nudges under the common umbrella name reminder, simplification
and information nudges. Although, the types of nudges in this sub-category are not always
coherent in the type of content they introduce, they make only about a quarter of non-
deterrence nudges.
3.3 Study characteristics
We account for about a dozen characteristics related to studies in our primary sample. Most
of these are study specific, and a few vary within studies. We set forth three characteristics
that define a baseline nudge, and a number of additional characteristics which we use to
study potential heterogeneities in the effects of nudges on compliance. Figure 5 presents a
tabulation of these characteristics.
Baseline characteristics: i) type of a nudge as defined in Section 3.2, in the most general
specification it classifies the nudge into deterrence or non-deterrence types; ii) the benchmark
against which the interventions are evaluated, in particular, defining the control group as
taxpayers who did not receive any communication (no information), received some neutral
information (baseline information), or the comparison is made against another behavioral
13

intervention (letter); and iii) publication status of the study, i.e., working paper or published
article.
Additional characteristics: iv) communication channel used by the tax authority to reach
out to the taxpayers, i.e., digital letters (e.g., e-mails, SMS, CAPTCHA), physical letters (e.g.,
letters, tax bill manipulations), and in-person visits; v) type of the tax, i.e., personal income
tax, corporate income tax, property tax, VAT, all taxes and other taxes19; vi) response horizon
of the compliance measure, i.e., a dummy variable on whether the time interval between the
date on which the nudge was sent and the date when the outcome variable was measured is
shorter or longer than 12 months; vii) a dummy whether the taxpayer is a late payer, i.e., did
not comply in paying taxes by the official deadline; and viii) the income level of the country
where the experiment was conducted, i.e. low, middle or high-income country.
4 Empirical methodology
Baseline specification: We estimate the following equation:
Estimateτi,p = α + βτNudgei,p + γBaselineCharacteristicsi,p + εi,p (1)
where Estimateτi,p is the ith estimate from paper p of type τ : i) treatment effects on exten-
sive margin responses, ii) treatment effects on intensive margin responses, and iii) t-value of
primary studies. Figures 2(a) and 2(b) and 3 plot the distributions of these three dependent
variables, respectively. For a more detailed description of these variables, see Section 3.1.
Nudgei,p is a binary variable indicating whether a nudge is of deterrence or non-deterrence
type, as discussed in Section 3.2. BaselineCharacteristicsi,p additionally include a cate-
gorical variable capturing whether the control group received no letter, a baseline letter or a
behavioral letter, and a dummy variable on the publication status of the study, as defined in
19Other taxes include country-specific taxes or fees, e.g., the church tax in Germany, wealth tax in Colombia,TV license fees in Austria.
14

Section 3.3. εi,p is the error term which is clustered at the level of papers p. We choose this
level of clustering the errors, since the estimates may not be independent within studies.
The intercept α is our main coefficient of interest. It captures the average effect of
a baseline intervention. As our baseline effect we understand a nudge intervention of non-
deterrence type that is compared to a control group of taxpayers who received a neutral
communication and which has been published.
Specification with study fixed effects: Having defined the baseline effect, we now turn
to the identification of relative effects of deterrence nudges to that of non-deterrence types of
nudges on tax compliance. Almost all of the studies in our sample implement several nudge
interventions.20 Therefore, unlike many other meta-analyses in economics, we can exploit the
substantial within-study variation in the data and study the relative effects of deterrence and
non-deterrence nudges controlling for study fixed effects. The specification is as follows:
Estimateτi,p = α + βτNudgei,p + λp + εi,p (2)
which is similar to Equation 1, but additionally includes the study fixed effects λp. Given that
most of our characteristics do not vary within studies we drop BaselineCharacteristicsi,p.
β is the main coefficient of interest which shows the effect of deterrence types of nudges
on the tax compliance measure under study compared to that of non-deterrence nudges. Note
that in this equation with study fixed effects, we are not anymore interested in interpreting the
intercept α which is some average value of the study fixed effects. In an additional variation of
this specification, we let Nudgei,p to be defined more broadly as a categorical variable taking
into account the several different types of nudges as defined in Section 3.2 and presented in
Figure 4.
20Since the number of estimates across studies differs, we treat our data as an unbalanced panel. Twostudies do not allow for within-study variation, that is, Blumenthal et al. (2001) with only one estimate andTorgler (2004) with one type of nudging intervention (moral suasion).
15

Heterogeneity in treatment effects: We are also interested in the question of whether
various study-, experiment-, or country-specific characteristics drive the heterogeneity in treat-
ment effect estimates. Most of these characteristics do not vary within studies, therefore we
revert to Equation 1 and drop the study fixed effects instead of them introducing a richer set
of characteristics as follows:
Estimateτi,p = α + βτNudgei,p + γBaselineChi,p + δOtherCharacteristicsi,p + εi,p (3)
γ and δ are the main coefficients of interest which capture the average effects of baseline
as well as the additional characteristics as defined in Section 3.3.21
Estimation method: In the choice of our estimation methods we follow a number of recent
applications of meta-analytical techniques in economics (Card et al. 2010, 2017, Feld and
Heckemeyer 2011, Gechert 2015, Heinemann et al. 2018, Lichter et al. 2015, Neisser
2017) as well as a literature reviewing these methods (Nelson and Kennedy 2009, Stanley
et al. 2013, Stanley 2001, Stanley and Doucouliagos 2012). Our simplest specification
relies on an OLS estimator. We present all set of results estimated with the OLS, and, in the
Appendix, show the robustness of these results to estimates using two further methods.
Given that meta-analytical regressions are known to be heteroskedastic,22 we follow the
literature and as a second specification use a WLS estimator, whereas analytical weights we
take the inverse of the squared standard error of the parameter estimates.23 This weighting
scheme that makes use of standard errors is standard in the literature, however, it is obviously
appropriate to use only in specifications where we study the magnitudes of compliance at the
extensive and intensive margins. For the sample where the dependent variable is captured
by the t-value, we follow Heinemann et al. (2018) and replace the former analytical weights
21In an extended version of Equation 3, we interact nudge types with all characteristics in order to testthe hypothesis of whether the potential heterogeneities are different between deterrence and non-deterrencenudges.
22One form of heteroskedasticity arises because the variance of the individual estimates is negatively relatedto the size of the underlying sample and this correlation is likely to be different between the primary studies.
23Due to their wide distribution we follow Card et al. (2017) and winsorize these analytical weights at thetop and bottom deciles. Results remain very similar to alternative winsorizations at 1 or 5 percentiles.
16

with inverse of the share of observations per study in relation to the full sample. Additionally,
as a third method, we adopt a random effects model,24 which assumes the existence of a
distribution of true effects for distinct studies and populations. Thus we relax the assumption
that for each type of a nudge there exists a single “true” effect which is common to all studies
under consideration.
5 Results
We start by describing the baseline effect of a typical nudge in Sub-section 5.1. Sub-section 5.2
contains our main specification with study fixed effects where we quantify the relative effects
of deterrence nudges to those of non-deterrence nudges within papers. In the following Sub-
section 5.3 we break down nudges into more detailed categories and study their relative effects.
Sub-section 5.4 relaxes the strategy of using study fixed effects, which allows to study the
role of a wider set of study characteristics in addition to types of nudges in explaining the
variation in estimated treatment effects. Sub-section 5.5 adopts a number of approaches to
examine traces of publication bias in our sample of RCTs.
The tables discussed in this section follow a similar structure. Each of the three columns
of the tables represents one of our dependent variables as discussed in Section 3.1. These
variables are tax compliance at the extensive margin as our main variable of interest, as well as
compliance at intensive margin and the t-value of the treatment effect as additional variables
of interest. In our main estimations we use an OLS estimator. In the Appendix we present
robustness tables behind all of these estimates using two estimators that are standard in
the meta literature, a weighted least squares and a random effects model as introduced in
Section 4.
24The terminology of random effects in this context should not be confused with the study fixed effects,the inclusion of dummies for individual studies.
17

5.1 Baseline effect
In order to understand the baseline effect of a nudge we necessarily need to define what
we understand under a baseline nudge. One way of thinking about the baseline effect of a
nudge is simply to think about some average of the raw data of treatment effect estimates.
According to our data, the average (median) deterrence nudge increased compliance by 7.7%
(4.6%) at the extensive margin, while the average (median) non-deterrence nudge increased
compliance by 3.1% (1.5%). At the intensive margin, the average (median) treatment effect
is an increase of 81% (34%) and 23% (20%) for deterrence and non-deterrence nudges,
respectively. However, the relatively wide distribution of estimates – as presented by the
histograms of Figures 2 and 3 – as well as the multi-dimensionality of study characteristics
raises the question of whether such an average gives any meaningful characterization about
the baseline effect of interest.
Another, arguably a more meaningful, approach of thinking about the baseline effect is
to try and define a nudge based on a combination of characteristics. As discussed in Section
3.3, we have two sets of characteristics, baseline and additional characteristics. The main
approach behind thinking about a baseline nudge that we adopt defines the baseline on only
three rather generic but meaningful characteristics. In so doing we remain relatively agnostic
about what constitutes a “typical” nudge. The results of this main exercise are discussed
below. In an additional analysis of Section 5.4, we also make an attempt of fixing both the
baseline as well as the additional characteristics. Although the results turn out to be similar,
we believe that this choice of characteristics is necessarily a subjective one. In addition, the
fact of fixing of too many characteristics dramatically narrows down the sample the baseline
effect is representing.
As discussed in Section 3.3, the three baseline characteristics are as follows. First, given
the interest of this paper in studying deterrence and non-deterrence nudges, as a baseline
we fix non-deterrence nudges so that we can later compare the effects of deterrence nudges
to the baseline. Second, and most importantly, we fix the benchmark against which the
interventions are evaluated. In particular, as baseline we take those estimates that compare
18

Table 2: Baseline effects of nudges
(1) (2) (3)Extensive Intensive t-value
Baseline effect -0.002 0.000 -0.099(0.019) (0.226) (2.599)
Treatment (omitted: Non-Deterrence)Deterrence 0.041∗ 0.410 5.253
(0.019) (0.277) (2.708)Baseline Comparison (omitted: Baseline Info)No Info 0.025 -0.034 1.164
(0.021) (0.197) (1.959)Letter -0.027 -1.352∗ -4.864∗
(0.015) (0.596) (2.320)Publication Status (omitted: Unpublished)Published 0.034 1.073 3.756
(0.022) (0.558) (3.396)Study FE No No NoObservations 471 174 977R2 0.112 0.164 0.094
Standard errors in parentheses∗ p < 0.05, ∗∗ p < 0.01, ∗∗∗ p < 0.001
Regressions are estimated according to Equation 1.
the intervention versus a control group of taxpayers that received some neutral information,
rather than a control group that did not receive any communication. This choice is motivated
by the fact that interventions in the latter group also capture the effects of sending any
communication and are not able to isolate the effects of the content of the nudge. Third,
given the evidence in the past meta literature as well as our analysis of Section 5.5 on the
existence of publication bias, we fix whether a study is published or not.
Table 2 plots the results from the estimation of Equation 1. The baseline effects of a
nudge is represented by the estimated intercept α. Since we are interested in the baseline
effects of nudges across studies, in these regressions we leave out the study fixed effects
which is otherwise our preferred specification. Column (1) shows that the treatment effect
of a non-deterrence nudge at the extensive margin evaluated against a control group that
received neutral communication and as presented in an unpublished paper is very small and
is about -0.2% on average. Similarly, column (2) shows that at the intensive margin this
19

baseline effect is close to 0. Column (3) shows that the t-value behind the treatment effect
for this non-deterrence nudge is about 0.1, and is thus far from a critical value of a significant
effects. None of these average effects are statistically different from zero.
Overall, this evidence shows that the baseline effect of a non-deterrence nudge published
in a paper and evaluated against a control group receiving some neutral communication is
close to 0. This evidence is robust across the various margins of compliance that we consider.
The evidence also remains robust when we estimate Equation 1 with a WLS estimator as
presented in columns (1)-(3) of Table A2 of the Appendix.25
5.2 Deterrence and non-deterrence nudges
We next study the effect of deterrence nudges relative to non-deterrence nudges on the
magnitudes of treatment effect estimates and their t-values. All regressions include study
fixed effects, and thus use variation coming from within studies. Given that most study
characteristics other than the types of nudges do not vary within studies, we do not include
these characteristics in these regressions. The specification is more precisely represented by
Equation 2, and its estimation results are plotted in Table 3. As before the main results are
estimated using an OLS model, while Table A3 tests for the robustness of these estimates
using WLS and RE estimators.
Column (1) of Table 3 shows a statistically significant 2.5 percentage point increase in
the probability to comply when receiving deterrence as opposed to receiving non-deterrence
nudges. Consistent with this result, column (2) indicates that deterrence nudges increase
intensive margin compliance by about 12.6 percentage points more than the non-deterrence
nudges. Results from the full sample of column (3) show that studies in our sample find
significantly higher t-values on the treatment effects of deterrence nudges compared to those
of non-deterrence nudges. These findings are robust across the two alternative estimation
25For symmetry, this table also presents the results from the random effects estimator, however, we notethat, given the assumption of this model about the existence of a distribution of effects across studies asdiscussed in Section 4, the intercept does not have the same interpretation such that it would inform aboutthe baseline effect of interest as before.
20

Table 3: Deterrence and non-deterrence nudges
(1) (2) (3)Extensive Intensive t-value
Treatment (omitted: Non-Deterrence)Deterrence 0.025∗∗∗ 0.126∗ 1.420∗∗
(0.006) (0.045) (0.526)Constant -0.026∗∗∗ 0.007 -0.585
(0.006) (0.030) (0.526)Study FE Yes Yes YesObservations 471 174 979R2 0.368 0.364 0.384
Standard errors in parentheses∗ p < 0.05, ∗∗ p < 0.01, ∗∗∗ p < 0.001
Regressions are estimated according to Equation 2.
methods as presented in Table A3. The WLS estimator yields smaller, but still statistically
significant, effect sizes of 1.5 and 5.9 percentage points on the extensive and intensive margins,
respectively, and the RE estimator yields similar results.
Overall, this evidence suggests that deterrence nudges are more effective in improving tax
compliance than non-deterrence nudges. However, the magnitudes of these relative effects
are in general fairly modest.
5.3 Detailed categories of nudges
In this section, instead of grouping the multiple types of behavioral interventions into deter-
rence and non-deterrence nudges, we study the relative effects of more detailed categories of
nudges on tax compliance. Within the deterrence nudge category, we differentiate between
pure deterrence and mixed deterrence nudges, where the latter type of nudges append a deter-
rence with a non-deterrence communication. Within the non-deterrence nudge category, we
distinguish between nudges that are of “Reminder, simplification and information” type and
nudges that are related to tax morale. In this latter category we further distinguish between
Public Goods, Peer Effects, and Moral Appeals nudges. Section 3.2 discusses the further
typological details behind the nudge categories, and Figure 4 presents a tabulation of our
data over these nudges.
21

Table 4: Types of nudges
(1) (2) (3)Extensive Intensive t-value
Treatment (omitted: Reminder, Simplification and Information)Deterrence 0.022∗ 0.061 0.427
(0.009) (0.105) (0.584)Deterrence Interacted 0.028∗∗ 0.177∗∗ 1.853∗∗
(0.009) (0.050) (0.634)Public Good -0.007 -0.078 -1.287
(0.008) (0.105) (0.732)Peer Effect 0.002 -0.086 -1.042
(0.012) (0.088) (0.792)Moral Appeal -0.001 -0.032 -0.849
(0.008) (0.091) (0.766)Other -0.005 -1.766
(0.014) (1.978)Constant -0.023∗ 0.077 0.408
(0.009) (0.102) (0.584)Study FE Yes Yes YesObservations 471 174 979R2 0.369 0.365 0.385
Standard errors in parentheses∗ p < 0.05, ∗∗ p < 0.01, ∗∗∗ p < 0.001
Regressions are estimated according to Equation 2.
The estimates based on a variation of Equation 2 are collected in Table 4. First, regarding
the tax morale related nudges, we find that the individual effects of three main types of tax
morale nudges – that are public goods, peer effects, and moral appeals – are not statistically
distinguishable from “Reminder, simplification and information” nudges.26 This result has two
implications. First, the comparison of tax morale nudges to the omitted category of nudges
provides further support for the conclusions of Section 5.1 that tax morale related nudges are
not effective once evaluated against a control group of taxpayers who receive some neutral
communication. In particular, this adds within paper evidence to the previous cross-sectional
result. Indeed, this interpretation rests on the assumption that “Reminder, simplification and
information” nudges can be thought of as neutral nudges, similar to the baseline nudges of
Section 5.1. Second, this finding suggests that we not only fail to find evidence that an average
26This finding does not change if we combine the three tax morale nudges into one category.
22

tax morale nudge works, but we also fail to find evidence that its more detailed components
– those that are related to public goods, peer effects, and moral appeals – matter for tax
compliance.
Regarding deterrence nudges, once we distinguish between deterrence and mixed deter-
rence nudges the effects of the deterrence category of our treatment variable as compared to
the omitted group become somewhat less precise although the magnitudes are robust to what
we found in Section 5.2. Although the mixed deterrence nudges become strong and sizable,
in an additional test where we omitted the simple deterrence category we failed to reject the
null hypothesis that mixed deterrence nudges are not different from deterrence nudges. All of
these findings are generally robust to the alternative estimators presented in Table A4.
5.4 Study characteristics and heterogeneity in treatment effects
The last three sub-sections have documented the finding that deterrence interventions are ef-
fective in increasing tax compliance while non-deterrence interventions are not. By accounting
for the types of nudges we were able to explain 36 to 37% of the observed within study vari-
ation in treatment effect estimates of, respectively, intensive and extensive margin responses
(see R2 of Table 3).
In this sub-section we study whether and how various additional characteristics, as devel-
oped in Section 3.3 and summarized in Figure 5, drive our results. Most of these characteristics
are study-specific.27 Therefore, we relax our preferred model and do not include the study
fixed effects. Taken together these study characteristics can explain an additional of 23%
to 30% of the remaining heterogeneity in the treatment effect estimates of nudges (see the
difference in R2 between Table 5 and Table 2).
Before studying the heterogeneities, we note that the baseline effects on the extensive and
intensive margins – as captured by the estimates of the intercepts in Table 5 – are statistically
27There are exemptions to this rule. For example, several papers estimate tax compliance responses acrossdifferent time horizons, or a few papers vary the methof of the delivery of the nudge. However, these are rareexemptions. For the vast majority of cases characteristics do not vary within studies. For example, we do nothave a single experiment in our sample that was implemented across multiple countries or across multiple taxtypes.
23

Table 5: Heterogeneity of results
(1) (2) (3)Extensive Intensive t-value
Baseline effect 0.056 -0.039 1.540(0.036) (0.821) (1.356)
Treatment (omitted: Non-Deterrence)Deterrence 0.016 0.166∗∗ 1.405∗
(0.010) (0.054) (0.555)Baseline Comparison (omitted: Baseline Info)No Info 0.031 0.293 2.634∗
(0.019) (0.446) (1.088)Letter -0.049∗∗ -0.268 -5.390∗∗
(0.017) (0.567) (1.932)Publication Status (omitted: Published)Unpublished 0.007 0.491 1.274
(0.013) (0.322) (1.061)Delivery (omitted: Physical Letter)Digital Letter 0.018 0.832∗ 2.183
(0.024) (0.310) (1.350)In Person 0.111∗∗ 2.180∗∗∗ 12.975∗∗
(0.040) (0.494) (4.533)Tax Type (omitted: Corporate Tax)Income Tax -0.016 0.675 2.473∗
(0.028) (0.370) (0.948)Property Tax -0.032 0.281 2.533
(0.036) (0.369) (1.673)VAT -0.004 1.546∗∗∗ 1.959
(0.018) (0.319) (1.529)Other 0.044 1.447∗∗∗ 12.216∗∗∗
(0.024) (0.243) (1.864)All 0.036 1.485∗∗∗ 4.992∗∗
(0.033) (0.292) (1.695)Response Horizon (omitted: Short Run)Long Run -0.040∗ -0.023 -1.161
(0.018) (0.133) (1.000)Late-payer sample (omitted: Late)On Time -0.031∗ -1.140∗∗∗ -6.026∗∗∗
(0.012) (0.175) (1.268)Development Level (omitted: High Income)Low Income -0.056∗ -0.799∗∗ -2.514
(0.025) (0.254) (1.504)Middle Income -0.016 -0.835∗ -0.169
(0.015) (0.302) (1.141)Study FE No No NoObservations 467 174 963R2 0.338 0.474 0.379
Standard errors in parentheses∗ p < 0.05, ∗∗ p < 0.01, ∗∗∗ p < 0.001Regressions are estimated according to Equation 3.
not distinguishable from zero. This implies that, similar to the findings of Section 5.1, the
baseline effects of non-deterrence nudges are close to zero. The baseline nudge in this model
24

is understood as having the following eight characteristics: it is a non-deterrence nudge (i)
evaluated against a control group that received neutral communication (ii) and published in
a working paper (iii), and additionally is a nudge that was delivered through a physical letter
(vi) to a corporate taxpayer (v) situated in a high income country (vi) who was late with her
payment (vii) and whose compliance behavior is measured in a short horizon (viii). We do not
claim that the combination of these characteristics defines a “representative” nudge, however
this combination creates a meaningful group that is one of the more common types in our
sample. Changing some of these characteritics will, of course, affect the baseline result, and
we devote the remainder of this section to the discussion of the more important characteristics
that seem to explain the heterogeneity in the treatment effect estimate.
Four results stand out as being quantitatively important and robust across the three
sample. First, we find that a key feature of the experimental design, its delivery method,
matters for compliance. Table 5 suggests that interventions delivered by in-person visits
to taxpayers relative to nudges delivered through physical letters raise compliance by 11
percentage point at the extensive and by twice at the intensive margin. The full sample
analysis suggests that interventions studying in-person visits are more likely to find significant
treatment effect with larger t-values than interventions delivered through letters.
Second, we find that nudges are more effective when addressing sub-sample of taxpayers
who missed their deadline of paying taxes. The magnitude of the effect is 3 percentage point
at the extensive margin and is over 100 percentage points on the intensive margin. This
finding remains robust at the full sample, in general suggesting that late-payers are more
sensitive to nudges.
Third, Table 5 shows evidence for the hypothesis that the treatment effects are stronger
statistically as well as in magnitude in the short-run compared to the long-run. At the extensive
margin, taxpayers whose compliance is measured within 12 months after the interventions are
4 percentage point more likely to comply with taxes than taxpayers whose compliance is
measured after 12 months of the intervention. The directions of the point estimates of
intensive margin responses and at the full samples are consistent with this interpretation, but
25

are small and statistically not distinguishable from zero. However, the results of Table A5
provide additional support to this interpretation.
Fourth, when comparing experimental results across countries where the RCTs were
conducted, we find that experiments seem to be more effective in high-income countries
compared to low- as well as middle-income countries. This finding may reflect the fact that
lower-income countries have to in general operate in much lower compliance environments
such that letters hardly change taxpayer behavior. However, the result may also simply be
driven some other endogenous variable correlated with development.
The finding about the null effect of a baseline non-deterrence nudge as well as the results
about four important variables explaining the heterogeneity of treatment effects are in general
very robust to the alternative estimation methods presented in Table A5. We note, however,
that these results represent correlations and can be driven by other factors unobservable to
us that happen to coincide with these characteristics.
Finally, in Table A6 of the Appendix we interact all these baseline and additional charac-
teristics, as discussed in Section 3.3, with the types of nudges. The idea is to test whether the
effects we find here hold generally for all nudge types or if they are mainly driven by deterrence
nudges. The evidence of Table A6 in general does not support the hypothesis that the effects
of these characteristics are driven by a particular type of a nudge.
5.5 Publication selection bias
One standard question often discussed in the meta-analytical literature is that the estimated
treatment effects shown in the primary studies are systematically biased towards positive and
significant effects. The underlying hypothesis is that researchers tend to present results that
show: i) positive effects because it is generally believed that nudges should only have positive
effects (file drawer bias), and ii) statistically significant effects because of the belief that
non-significant effects are harder to publish (p-hacking). Additionally, we ask whether such
potential biases can be different for deterrence and non-deterrence nudges, and thus potentially
explaining our result that deterrence nudges are more effective than non-deterrence ones.
26

Figure 6: Funnel plots
(a) Extensive margin (b) Intensive margin
Notes : The blue circles plot deterrence and the red diamonds plot the non-deterrence nudges. Blue dashedand red undashed vertical lines show precision weighted means of the treatment effect for the two nudges,respectively. For visual clarity, sub-figure (a) drops 56 outlier observations that are larger than 500 on they-axis, and sub-figure (b) drops 4 obervations that are larger than 5 on the x-axis.
Funnel plots are a common way of visually diagnosing meta-datasets for the file drawer
bias. These plots provide visual checks for asymmetries in the relation between treatment
effect magnitudes and measures of their precision. The idea is that absent publication bias
very imprecise estimates should be randomly distributed around zero rather than being skewed
to the right. We present funnel plots for our extensive and intensive margin samples in Figures
6 (a) and (b), where the x-axis plots the size of the treatment effect and the y-axis plots
the inverse standard error of the treatment effects as a measure of precision. The vertical
lines show the precision weighted means of the treatment effect. The figures separately plot
deterrence and non-deterrence nudges. In both the extensive and intensive margin samples
we observe that the imprecisely estimated treatment effects, i.e. those in the bottom of the
funnel plot, tend to be skewed towards positive values. This visual evidence speaks for the
presence of file drawer type bias in our general sample. We do not find striking evidence that
the bias is present for one and absent in the second type of nudge that we study.28
28More formally, we use the method of Egger et al. (1997) to test for funnel-plot asymmetry in our metasamples. In the extensive margin sample, we fail to reject the null hypothesis that there is no publicationbias for both deterrence as well as non-deterrence nudges. In contrast in the intensive margin sample, wereject the null seperately for both deterrence and non-deterrence nudges. Thus we continue maintaining thehypothesis that at least part of our sample has publication bias.
27

Figure 7: Distribution of t-values in the full sample
Notes : Figures plot histograms of t-values of treatment effects of deterrence and non-deterrence nudgesstacked together. The kernel density line is estimated for the total sample of both nudges according to anEpanechnikov function. For visual clarity, the left sub-figure drops 117 outlier observations that lie outsidethe (-10, 10) range. The right sub-figure plots the same data as in the left sub-figure but zooming in to therange (1 , 4). Vertical lines denote critical values for two-sided significance tests at t-values of 1.645, 1.96and 2.58.
One approach used to study p-hacking type of bias is to check for unusual patterns around
critical values in the distribution of t-values. Such evidence is presented by Brodeur et al.
(2016). The paper uses a large data comprising of tests published in top economics journals,
and shows a disproportionately large share of tests that narrowly reject the null hypothesis.
We follow this test and plot the distribution of t-values in Figure 7. We are working with much
small sample sizes to make definitive conclusions, but this evidence suggest some bunching
in the number of observations of t-values situated just right to the three critical values which
are denoted by vertical lines. We also observe corresponding missing masses on the left sides
of the critical values. This evidence suggests that part of the studies in our sample select
to report results that are statistically significant at conventional level, and ignore treatment
effect estimates that narrowly miss to reject the null hypothesis. Figure 7 shows the relative
contribution of deterrence and non-deterrence nudges to bunching at critical values. Although,
again the sample is too small to make definitive conclusions, we do not see overwhelming
evidence that one nudge types dominates the other type at close vicinity to critical values.
28

Thus, we do not think that p-hacking bias may completely explain away explain the earlier
result that deterrence nudges are more effective than non-deterrence nudges.
Third, a related but separate idea is that, in addition to researchers selecting to report
stronger results in working papers, the publication process will either exacerbate or mitigate
this selection (see, e.g., Andrews and Kasy 2019). Both directions of selection are plausible.
If journals have preferences similar to those of researchers, the publication process may amplify
the selection bias. On ther other hand, if the peer-review process effectively serve as a check
against the behavior of researchers to report results selectively, the publication process will
mitigate the selection effect. In either case, this discussion leads to the testable hypothesis
that biased significant and positive treatment effects in working paper versions of studies will
tend to different in published studies. We test this hypothesis by including a dummy for the
publication status in Tables 5 and A5. We do not find evidence that either the magnitude or
the statistical significance of treatment effects are different in working papers as compared to
published papers. In Table A6 we fail to find any evidence for the hypothesis that this specific
type of bias is more pronounced in one of the two types of nudges of interest.
Overall we conclude that our sample is likely to be biased both due to file drawer as well
as to p-hacking type bias. We do not find evidence for positive or negative selection bias at
the publication stage, and we find it unlikely that the existing biases can explain the difference
in the effects of deterrence and non-deterrence nudges that we document. In general, this
evidence for selective reporting of results that we find is similar to the findings of many other
meta-analytical applications in economics. This suggests that empirical studies implementing
RCTs, which are otherwise believed to have relatively sound methodologies, are not immune
to biased reporting of results.29
29See Brodeur et al. (2018) for evidence on how publication selection bias differs by the identificationmethod used.
29

6 Conclusions
Policy interventions that nudge taxpayers with the aim of increasing compliance have become
an attractive tool among many governments due to their ease of implementation and low
monetary costs. This easy adoption of the policy is demonstrated, for example, by Hjort et al.
(2019) who inform Brazilian mayors about research on the positive tax compliance effects of
reminder letters in an experimental setting and find that the treated municipalities are more
likely to implement nudging interventions. However, little is known about the effectiveness
of nudges beyond the evidence presented in individual experiments carried out in different
contexts.
In this paper we summarize the knowledge accumulated so far from 45 nudging interven-
tions in a systematic way. We show that, unlike the general excitement over nudges in policy
and academic circles, communications informing taxpayers about the morale aspects of paying
taxes are not very effective in increasing compliance. Although, nudges that threaten taxpay-
ers with audit probabilities and other elements of deterrence can be effective, the magnitudes
of these effects are fairly small and are likely to be bound to the short-run.
Our evidence in general warns against the widespread and unconditional adoption of tax
nudges in practice. However, this is not to say that nudges are useless. Our evidence on
the particular design features of interventions that make them more effective (e.g., sending
deterrence rather than only non-deterrence letters) combined with the identification of the sub-
populations of taxpayers that are likely to be more sensitive to nudges (e.g., focusing on late-
payers) provide guidance for potentially more effective policy interventions in the future. Note
that the nudges we study are arguably the most common types of behavioral interventions, but
governments can nudge in other ways too. For example, policies that publicly recognize the
top taxpayers and shame the tax delinquents, as studied by Slemrod et al. (2019) and Dwenger
and Treber (2018),30 or ones that use third-party information reports to pre-fill tax returns,
as studied by Fochmann et al. (2018), Gillitzer and Skov (2018), Kotakorpi and Laamanen
(2016), might as well be considered as nudges in a broader sense of the word.
30For a welfare analysis of a wide class of social recognition policies, see, Butera et al. (2019).
30

This review also highlights a number of opportunities for researchers by directing atten-
tion towards gaps in the literature where the evidence has been weak so far. For example,
only few papers test whether nudges work in the longer run, and when implemented repeat-
edly. Evidence on the question of whether the strength of deterrence (e.g., different audit
probabilities or fine rates) and non-deterrence (e.g., different degrees of public goods) nudges
matters is also lacking. Importantly, we do not have much knowledge on whether interventions
interact with the context they operate in. This is not surprising given that randomized control
trials tend to narrowly focus on local environments where the context is fixed. Cross-study
comparisons such as the one adopted in this paper, on the other hand, are limited due to
methodological concerns in comparing different experiments. Such an analysis in our paper
would be additionally constrained due to the fact that interventions so far have mainly fo-
cused on Europe and the Americas leaving us with little cross-sectional variation to exploit.
Future interventions, possibly ones that span across borders, could try to study i) whether
non-deterrence nudges work more effectively in contexts of higher levels of trust, and ii) if
deterrence nudges work better in uncorrupt environments where audits can be enforced more
credibly compared to institutionally less mature environments.
31

References
Allcott, H. and J. B. Kessler (2019). The welfare effects of nudges: A case study of energy
use social comparisons. American Economic Journal: Applied Economics 11(1), 236–276.
Allingham, M. and A. Sandmo (1972). Income tax evasion: A theoretical analysis. Journal of
Public Economics 1(3-4), 323–338.
Alm, J. (2019). What motivates tax compliance? Journal of Economic Surveys 33(2),
353–388.
Alm, J., A. Malezieux, and M. McKee (2018). 40 years of tax evasion games: A meta-analysis.
Working paper.
Almunia, M., I. Guceri, B. Lockwood, and K. Scharf (2019). More giving or more givers? the
effects of tax incentives on charitable donations in the uk. Journal of Public Economics,
forthcoming .
Anderson, R. G. and A. Kichkha (2017). Replication, meta-analysis, and research synthesis
in economics. American Economic Review 107(5), 56–59.
Andreoni, J., B. Erard, and J. Feinstein (1998). Tax compliance. Journal of economic
literature 2(36), 818–860.
Andrews, I. and M. Kasy (2019). Identification of and correction for publication bias. American
Economic Review 109(8), 2766–2794.
Antinyan, A. and Z. Asatryan (2020). Tax compliance nudges in Armenia. Technical report,
Mimeo.
Antinyan, A., Z. Asatryan, Z. Dai, M. C. Villeval, and K. Wang (2020). Frequent reminders.
Technical report, Mimeo.
Appelgren, L. (2008). The effect of audit strategy information on tax compliance-an empirical
study. eJournal of Tax Research 6(1), 67–81.
32

Ariel, B. (2012). Deterrence and moral persuasion effects on corporate tax compliance:
Findings from a randomized controlled trial. Criminology 50(1), 27–69.
Baskaran, T., L. P. Feld, and J. Schnellenbach (2016). Fiscal federalism, decentralization,
and economic growth: a meta-analysis. Economic Inquiry 54(3), 1445–1463.
Becker, G. S. (1968). Crime and punishment: An economic approach. Journal of Political
Economy 2(76), 169–217.
Benartzi, S., J. Beshears, K. L. Milkman, C. R. Sunstein, R. H. Thaler, M. Shankar, W. Tucker-
Ray, W. J. Congdon, and S. Galing (2017). Should governments invest more in nudging?
Psychological science 28(8), 1041–1055.
Bergolo, M. L., R. Ceni, G. Cruces, M. Giaccobasso, and R. Perez-Truglia (2017, July). Tax
audits as scarecrows: Evidence from a large-scale field experiment. Working Paper Series
23631, National Bureau of Economic Research.
Bernheim, B. D. and D. Taubinsky (2018). Behavioral public economics. In B. D. Bernheim,
S. DellaVigna, and D. Laibson (Eds.), Handbook of Behavioral Economics: Applications
and Foundations 1, Volume 1, pp. 381–516. Elsevier.
Besley, T., A. Jensen, and T. Persson (2019). Norms, enforcement, and tax evasion. Technical
report, National Bureau of Economic Research Working Paper No. 25575.
Biddle, N., K. M. Fels, and M. Sinning (2018). Behavioral insights on business taxation:
Evidence from two natural field experiments. Journal of Behavioral and Experimental Fi-
nance 18, 30–49.
Blackwell, C. (2007). A meta-analysis of tax compliance experiments. In Martinez-Vazquez
and J. Alm (Eds.), Tax Compliance and Evasion.
Blumenthal, M., C. Christian, J. Slemrod, and M. G. Smith (2001). Do normative appeals
affect tax compliance? evidence from a controlled experiment in minnesota. National Tax
Journal 54(1), 125–138.
33

Blundell, R. and T. MaCurdy (1999). Labor supply: A review of alternative approaches. In
Handbook of labor economics, Volume 3, pp. 1559–1695. Elsevier.
Boning, W. C., J. Guyton, R. H. Hodge, J. Slemrod, U. Troiano, et al. (2018). Heard it
through the grapevine: direct and network effects of a tax enforcement field experiment.
Technical report, National Bureau of Economic Research Working Paper No. 24305.
Bott, K. M., A. W. Cappelen, E. Ø. Sørensen, and B. Tungodden (2017). You’ve got mail: A
randomised field experiment on tax evasion. Discussion Paper 10/2017, Norwegian School
of Economics, Department of Economics.
Boyer, P. C., N. Dwenger, and J. Rincke (2016). Do norms on contribution behavior af-
fect intrinsic motivation? field-experimental evidence from germany. Journal of Public
Economics 144, 140 – 153.
Brockmeyer, A., A. M. Estefan, K. R. Arras, and J. C. S. Serrato (2020). Taxing property in
developing countries: Theory and evidence from mexico. Technical report.
Brockmeyer, A., M. Hernandez, S. Kettle, and S. Smith (2019). Casting a wider tax net:
Experimental evidence from costa rica. American Economic Journal: Economic Policy .
Brodeur, A., N. Cook, and A. Heyes (2018). Methods matter: P-hacking and causal inference
in economics and finance. IZA DP No. 11796 .
Brodeur, A., M. Le, M. Sangnier, and Y. Zylberberg (2016). Star wars: The empirics strike
back. American Economic Journal: Applied Economics 8(1), 1–32.
Butera, L., R. Metcalfe, W. Morrison, and D. Taubinsky (2019). The deadweight loss of social
recognition. Technical report, National Bureau of Economic Research Working Paper No.
25637.
Card, D., J. Kluve, and A. Weber (2010). Active labour market policy evaluations: A meta-
analysis. The Economic Journal 120(548), F452–F477.
34

Card, D., J. Kluve, and A. Weber (2017). What works? a meta analysis of recent active
labor market program evaluations. Journal of the European Economic Association 16(3),
894–931.
Castro, L. and C. Scartascini (2015). Tax compliance and enforcement in the pampas evidence
from a field experiment. Journal of Economic Behavior & Organization 116, 65 – 82.
Chirico, M., R. Inman, C. Loeffler, J. MacDonald, H. Sieg, J. A. Mortenson, H. R. Schramm,
A. Whitten, D. Shoag, C. Tuttle, et al. (2019). Deterring property tax delinquency in
philadelphia: An experimental evaluation of nudge strategies. National Tax Journal 72(3),
479–506.
Coleman, S. (1996). The minnesota income tax compliance experiment: State tax results.
Costa, D. L. and M. E. Kahn (2013). Energy conservation “nudges” and environmentalist
ideology: Evidence from a randomized residential electricity field experiment. Journal of
the European Economic Association 11(3), 680–702.
De Neve, J.-E., C. Imbert, M. Luts, J. Spinnewijn, and T. Tsankova (2019). How to improve
tax compliance? evidence from population-wide experiments in belgium. Technical report,
CEPR Discussion Paper 13733.
Del Carpio, L. (2013). Are the neighbors cheating? evidence from a social norm experiment
on property taxes in peru. Working paper, Princeton University.
DellaVigna, S. and E. Linos (2020). Rcts to scale: Comprehensive evidence from two nudge
units. Technical report, NBER Working Paper No. 27594.
Dizon-Ross, R. (2019). Parents’ beliefs about their children’s academic ability: Implications
for educational investments. American Economic Review 109(8), 2728–65.
Doerrenberg, P. and J. Schmitz (2017). Tax compliance and information provision. a field
experiment with small firms. Journal of Behavioral Economics for Policy 1(1), 47–54.
35

Dwenger, N., H. Kleven, I. Rasul, and J. Rincke (2016). Extrinsic and intrinsic motivations for
tax compliance: Evidence from a field experiment in germany. American Economic Journal:
Economic Policy 8(3), 203–32.
Dwenger, N. and L. Treber (2018). Shaming for tax enforcement: Evidence from a new policy.
Technical report, CEPR Discussion Papers No. 13194.
Eerola, E., T. Kosonen, T. Lyytikainen, and J. Tuimala (2019). Tax compliance in the rental
housing market: Evidence from a field experiment. Technical report, VATT Institute for
Economic Research Working Papers No 122.
Egger, M., G. D. Smith, M. Schneider, and C. Minder (1997). Bias in meta-analysis detected
by a simple, graphical test. Bmj 315(7109), 629–634.
Farhi, E. and X. Gabaix (2019). Optimal taxation with behavioral agents. The American
Economic review, forthcoming .
Feld, L. P. and J. H. Heckemeyer (2011). FDI and taxation: A meta-study. Journal of
economic surveys 25(2), 233–272.
Fellner, G., R. Sausgruber, and C. Traxler (2013). Testing enforcement strategies in the
field: Threat, moral appeal and social information. Journal of the European Economic
Association 11(3), 634–660.
Fochmann, M., N. Muller, and M. Overesch (2018). Less cheating? the effects of prefilled
forms on compliance behavior. Arqus Discussion Paper No. 227 .
Gechert, S. (2015). What fiscal policy is most effective? a meta-regression analysis. Oxford
Economic Papers 67(3), 553–580.
Gillitzer, C. and M. Sinning (2018). Nudging businesses to pay their taxes: Does timing
matter? Iza discussion paper 11599.
36

Gillitzer, C. and P. E. Skov (2018). The use of third-party information reporting for tax
deductions: evidence and implications from charitable deductions in Denmark. Oxford
Economic Papers 170(3), 892–916.
Hallsworth, M., J. A. List, R. D. Metcalfe, and I. Vlaev (2017). The behavioralist as tax
collector: Using natural field experiments to enhance tax compliance. Journal of Public
Economics 148, 14 – 31.
Harju, J., T. Kosonen, and O. Ropponen (2018). Do honest hairdressers get a haircut.
Unpublished manuscript.
Hasseldine, J., P. Hite, S. James, and M. Toumi (2007). Persuasive communications: Tax
compliance enforcement strategies for sole proprietors. Contemporary Accounting Re-
search 24(1), 171–194.
Heinemann, F., M.-D. Moessinger, and M. Yeter. (2018). Do fiscal rules constrain fiscal
policy? a meta-regression-analysis. European Journal of Political Economy 51, 69–92.
Hernandez, M., J. Jamison, E. Korczyc, N. Mazar, and R. Sormani (2017). Applying behavioral
insights to improve tax collection - experimental evidence from poland. Working paper, The
World Bank.
Hiscox, M. Improved compliance with the deferred gst scheme. Behavioural Economics Team
of the Australian Government, Working Paper .
Hjort, J., D. Moreira, G. Rao, and J. F. Santini (2019). How research affects policy: Experi-
mental evidence from 2,150 brazilian municipalities. Technical report, National Bureau of
Economic Research Working Paper No. 25941.
Hoy, C., L. McKenzie, and M. Sinning (2020). Improving tax compliance without increasing
revenue: Evidence from population-wide randomized controlled trials in Papua New Guinea.
IZA DP No. 13407 .
37

Hummel, D. and A. Maedche (2019). How effective is nudging? a quantitative review on the
effect sizes and limits of empirical nudging studies. Journal of Behavioral and Experimental
Economics 80, 47–58.
Iyer, G. S., P. M. Reckers, and D. L. Sanders (2010). Increasing tax compliance in washington
state: A field experiment. National Tax Journal 63(1), 7.
John, P. and T. Blume (2018). How best to nudge taxpayers? the impact of message simpli-
fication and descriptive social norms on payment rates in a central london local authority.
Journal of Behavioral Public Administration 1(1), 1–11.
Kettle, S., M. Hernandez, S. Ruda, and M. Sanders (2016). Behavioral interventions in tax
compliance: Evidence from guatemala. Policy research working papers 7690, The World
Bank.
Kettle, S., M. Hernandez, M. Sanders, O. Hauser, and S. Ruda (2017). Failure to captcha
attention: Null results from an honesty priming experiment in guatemala. Behavioral Sci-
ences 7(2), 1–21.
Kleven, H. J., M. B. Knudsen, C. T. Kreiner, S. Pedersen, and E. Saez (2011). Unwilling or
unable to cheat? evidence from a tax audit experiment in denmark. Econometrica 79(3),
651–692.
Kleven, H. J. and C. T. Kreiner (2006). The marginal cost of public funds: Hours of work
versus labor force participation. Journal of Public Economics 90(10-11), 1955–1973.
Klomp, J. and J. De Haan (2010). Inflation and central bank independence: A meta-regression
analysis. Journal of Economic Surveys 24(4), 593–621.
Kotakorpi, K. and J.-P. Laamanen (2016). Prefilled income tax returns and tax compliance:
Evidence from a natural experiment. University of tampere Working Paper No. 104 .
Lichter, A., A. Peichl, and S. Siegloch (2015). The own-wage elasticity of labor demand: A
meta-regression analysis. European Economic Review 80, 94–119.
38

Luttmer, E. F. and M. Singhal (2014). Tax morale. Journal of Economic Perspectives 28(4),
149–68.
Mascagni, G. (2018). From the lab to the field: A review of tax experiments. Journal of
Economic Surveys 32(2), 273–301.
Mascagni, G., A. T. Mengistu, and F. B. Woldeyes (2018). Can icts increase tax? experimental
evidence from ethiopia. ICTD Working Paper 82, The International Centre for Tax and
Development.
Mascagni, G., C. Nell, and N. Monkam (2017). One size does not fit all: A field experiment
on the drivers of tax compliance and delivery methods in rwanda. ICTD Working Paper 58,
The International Centre for Tax and Development.
Meiselman, B. S. (2018). Ghostbusting in detroit: Evidence on nonfilers from a controlled
field experiment. Journal of Public Economics 158, 180 – 193.
Neisser, C. (2017). The elasticity of taxable income: A meta-regression analysis. Discussion
paper no. 17-032, ZEW.
Nelson, J. P. and P. E. Kennedy (2009). The use (and abuse) of meta-analysis in envi-
ronmental and natural resource economics: an assessment. Environmental and resource
economics 42(3), 345–377.
Ortega, D. and P. Sanguinetti (2013). Deterrence and reciprocity effects on tax compliance:
Experimental evidence from venezuela. CAF Working Papers 08/2013, Development Bank
Of Latinamerica.
Ortega, D. and C. Scartascini (2015). Don’t blame the messenger: A field experiment on
delivery methods for increasing tax compliance. IDB Working Paper Series 627, Inter-
American Development Bank.
Perez-Truglia, R. and U. Troiano (2018). Shaming tax delinquents. Journal of Public Eco-
nomics 167, 120–137.
39

Pomeranz, D. (2015). No taxation without information: Deterrence and self-enforcement in
the value added tax. American Economic Review 105(8), 2539–2569.
Pomeranz, D. and J. Vila-Belda (2019). Taking state-capacity research to the field: Insights
from collaborations with tax authorities. Annual Review of Economics 11, 755–781.
Scartascini, C. and E. Castro (2019). Imperfect attention in public policy: A field experiment
during a tax amnesty in Argentina. Technical report, IDB Discussion Paper No 665.
Shimeles, A., D. Z. Gurara, and F. Woldeyes (2017). Taxman’s dilemma: Coercion or per-
suasion? evidence from a randomized field experiment in ethiopia. American Economic
Review 107(5), 420—424.
Slemrod, J. (2007). Cheating ourselves: The economics of tax evasion. Journal of Economic
Perspectives 21(1), 25–48.
Slemrod, J. (2019). Tax compliance and enforcement. Journal of Economic Literature 57(4),
904–954.
Slemrod, J., M. Blumenthal, and C. Christian (2001). Taxpayer response to an increased
probability of audit: Evidence from a controlled experiment in minnesota. Journal of Public
Economics 79(3), 455 – 483.
Slemrod, J., O. U. Rehman, and M. Waseem (2019). Pecuniary and non-pecuniary motivations
for tax compliance: Evidence from Pakistan. Technical report, National Bureau of Economic
Research Working Paper No. 25623.
Slemrod, J. and S. Yitzhaki (2002). Tax avoidance, evasion, and administration. In Handbook
of public economics, Vol. 3, Volume 2, pp. 1423–1470. Elsevier.
Stanley, T., H. Doucouliagos, M. Giles, J. Heckemeyer, R. Johnston, P. Laroche, J. Nelson,
M. Paldam, J. Poot, G. Pugh, and R. Rosenberger (2013). Meta-analysis of economics
research reporting guidelines. Journal of economic surveys 27(2), 390–394.
40

Stanley, T. D. (2001). Wheat from chaff: Meta-analysis as quantitative literature review.
Journal of economic perspectives 15(3), 131–150.
Stanley, T. D. and H. Doucouliagos (2012). Meta-regression analysis in economics and busi-
ness. New York & London: Routledge.
Thaler, R. H. and C. R. Sunstein (2008). Nudge: Improving decisions about health, wealth,
and happiness. New Haven & London: Yale University Press.
Torgler, B. (2004). Moral suasion: An alternative tax policy strategy? evidence from a
controlled field experiment in switzerland. Economics of Governance 5(3), 235–253.
Wenzel, M. (2006). A letter from the tax office: Compliance effects of informational and
interpersonal justice. Social Justice Research 19(3), 345–364.
Wisdom, J., J. S. Downs, and G. Loewenstein (2010). Promoting healthy choices: Information
versus convenience. American Economic Journal: Applied Economics 2(2), 164–78.
Yitzhaki, S. (1974). A note on income tax evasion: A theoretical analysis. Journal of public
economics (3), 201–202.
41

Appendix
Table A1: Summary statistics
Full sample Extensive margin Intensive marginVariable Obs Mean Obs Mean Obs MeanDependent variableTreatment effect 979 4.954 471 0.054 174 0.633Nudge typeDeterrence (0) and non-det. (1) 979 0.486 471 0.495 174 0.310Baseline characteristicsBaseline comparison 977 1.309 471 1.344 174 1.454Publication status 979 0.454 471 0.561 174 0.402Additional characteristicsDelivery method 979 0.403 471 0.344 174 0.391Tax type 979 1.539 471 1.599 174 1.891Response horizon 965 0.892 467 0.891 174 0.851Taxpayer type 979 0.726 471 0.643 174 0.897Late payer sample 974 0.454 471 0.584 174 0.609
42
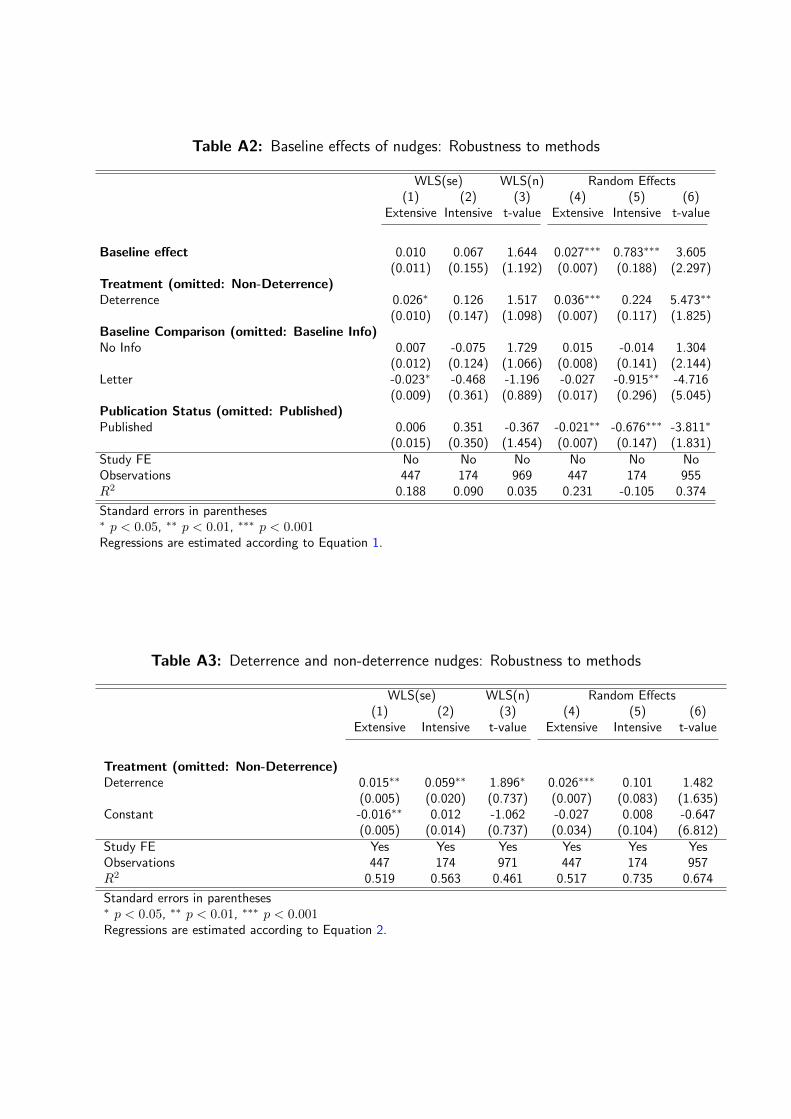
Table A2: Baseline effects of nudges: Robustness to methods
WLS(se) WLS(n) Random Effects(1) (2) (3) (4) (5) (6)
Extensive Intensive t-value Extensive Intensive t-value
Baseline effect 0.010 0.067 1.644 0.027∗∗∗ 0.783∗∗∗ 3.605(0.011) (0.155) (1.192) (0.007) (0.188) (2.297)
Treatment (omitted: Non-Deterrence)Deterrence 0.026∗ 0.126 1.517 0.036∗∗∗ 0.224 5.473∗∗
(0.010) (0.147) (1.098) (0.007) (0.117) (1.825)Baseline Comparison (omitted: Baseline Info)No Info 0.007 -0.075 1.729 0.015 -0.014 1.304
(0.012) (0.124) (1.066) (0.008) (0.141) (2.144)Letter -0.023∗ -0.468 -1.196 -0.027 -0.915∗∗ -4.716
(0.009) (0.361) (0.889) (0.017) (0.296) (5.045)Publication Status (omitted: Published)Published 0.006 0.351 -0.367 -0.021∗∗ -0.676∗∗∗ -3.811∗
(0.015) (0.350) (1.454) (0.007) (0.147) (1.831)Study FE No No No No No NoObservations 447 174 969 447 174 955R2 0.188 0.090 0.035 0.231 -0.105 0.374
Standard errors in parentheses∗ p < 0.05, ∗∗ p < 0.01, ∗∗∗ p < 0.001Regressions are estimated according to Equation 1.
Table A3: Deterrence and non-deterrence nudges: Robustness to methods
WLS(se) WLS(n) Random Effects(1) (2) (3) (4) (5) (6)
Extensive Intensive t-value Extensive Intensive t-value
Treatment (omitted: Non-Deterrence)Deterrence 0.015∗∗ 0.059∗∗ 1.896∗ 0.026∗∗∗ 0.101 1.482
(0.005) (0.020) (0.737) (0.007) (0.083) (1.635)Constant -0.016∗∗ 0.012 -1.062 -0.027 0.008 -0.647
(0.005) (0.014) (0.737) (0.034) (0.104) (6.812)Study FE Yes Yes Yes Yes Yes YesObservations 447 174 971 447 174 957R2 0.519 0.563 0.461 0.517 0.735 0.674
Standard errors in parentheses∗ p < 0.05, ∗∗ p < 0.01, ∗∗∗ p < 0.001Regressions are estimated according to Equation 2.

Table A4: Types of nudges: Robustness to methods
WLS(se) WLS(n) Random Effects(1) (2) (3) (4) (5) (6)
Extensive Intensive t-value Extensive Intensive t-value
Treatment (omitted: Reminder, Information and Omission)Deterrence 0.009 -0.013 0.530 0.015 0.014 0.338
(0.007) (0.032) (1.165) (0.011) (0.120) (2.574)Deterrence Interacted 0.019∗ 0.185∗ 1.100 0.029∗ 0.154 2.029
(0.008) (0.064) (1.677) (0.013) (0.151) (3.451)Public Good -0.011 -0.090 -2.480 -0.016 -0.105 -1.453
(0.010) (0.064) (1.704) (0.012) (0.149) (2.914)Peer Effect -0.005 -0.130∗∗ -1.354 -0.007 -0.128 -1.164
(0.008) (0.036) (1.557) (0.012) (0.213) (3.431)Moral Appeal -0.001 -0.046 -1.374 -0.009 -0.059 -0.957
(0.007) (0.029) (1.380) (0.016) (0.226) (3.807)Other -0.005 -2.765 -0.012 -1.872
(0.009) (2.076) (0.017) (5.514)Constant -0.010 0.090∗ 0.305 -0.016 0.100 0.496
(0.007) (0.039) (1.165) (0.035) (0.146) (7.180)Study FE Yes Yes Yes Yes Yes YesObservations 447 174 971 447 174 957R2 0.524 0.570 0.466 0.500 0.744 0.665
Standard errors in parentheses∗ p < 0.05, ∗∗ p < 0.01, ∗∗∗ p < 0.001Regressions are estimated according to Equation 2.

Table A5: Heterogeneity of results: Robustness to methods
WLS(se) WLS(n) Random Effects(1) (2) (3) (4) (5) (6)
Extensive Intensive t-value Extensive Intensive t-value
Treatment (omitted: Non-Deterrence)Deterrence 0.009 0.058∗ 1.665 0.014∗ 0.042 1.402∗
(0.005) (0.026) (0.871) (0.006) (0.059) (0.676)Baseline Comparison (omitted: Baseline Info)No Info 0.019 0.303 3.740∗ 0.024∗ -0.203 2.889∗∗
(0.015) (0.245) (1.540) (0.010) (0.194) (1.033)Letter -0.034∗∗∗ -0.157 -0.508 -0.041∗∗∗ -0.657∗ -5.652∗∗
(0.008) (0.323) (2.075) (0.012) (0.257) (1.881)Publication Status (omitted: Published)Unpublished 0.025∗ 0.579∗ 1.355 0.016∗∗ 0.339∗ 1.322
(0.010) (0.253) (0.922) (0.006) (0.131) (0.753)Delivery (omitted: Physical Letter)Digital Letter 0.025 0.836∗ -2.217 0.024∗∗ 1.098∗∗∗ 1.776
(0.027) (0.367) (1.735) (0.009) (0.125) (0.978)In Person 0.059∗∗∗ 1.211∗∗∗ 6.463 0.063∗∗∗ 1.061∗∗∗ 13.398∗∗∗
(0.003) (0.085) (3.640) (0.011) (0.104) (1.294)Tax Type (omitted: Corporate Tax)Income Tax -0.001 0.688∗ 0.476 -0.014 0.388∗∗ 2.156∗
(0.009) (0.260) (1.577) (0.010) (0.127) (1.068)Property Tax 0.002 0.380 1.961 -0.028∗∗ 0.089 2.101∗
(0.018) (0.270) (2.067) (0.010) (0.164) (1.061)VAT -0.002 1.091∗∗∗ 0.974 -0.023 0.866∗∗∗ 1.963
(0.020) (0.233) (1.615) (0.015) (0.141) (1.268)Other 0.034∗∗ 1.074∗∗∗ 4.896 0.028∗ 0.816∗∗∗ 11.771∗∗∗
(0.010) (0.219) (3.119) (0.011) (0.122) (1.234)All 0.066∗∗∗ 1.057∗∗∗ 4.235 0.040 0.771∗∗∗ 4.898
(0.010) (0.223) (2.241) (0.137) (0.207) (3.915)Response Horizon (omitted: Short Run)Long Run -0.025∗ -0.163 -0.327 -0.038∗∗∗ -0.211 -1.355
(0.012) (0.096) (1.058) (0.008) (0.110) (1.044)Late-payer sample (omitted: Late)On Time -0.018∗∗∗ -0.511∗∗∗ -5.899∗∗∗ -0.019∗∗ -0.470∗∗∗ -6.227∗∗∗
(0.004) (0.119) (1.631) (0.007) (0.111) (0.769)Development Level (omitted: High Income)Low Income -0.041∗ -0.324 0.165 -0.045∗∗∗ -0.306∗ -2.742∗∗
(0.015) (0.159) (1.689) (0.009) (0.131) (1.000)Middle Income -0.013 -0.545∗∗ -0.553 -0.015∗ -0.732∗∗∗ -0.332
(0.012) (0.137) (1.331) (0.007) (0.189) (0.850)Constant 0.016 -0.408 1.762 0.042∗∗∗ 0.325 1.990
(0.011) (0.550) (2.045) (0.011) (0.338) (1.412)Study FE No No No No No NoObservations 443 174 955 443 174 941R2 0.579 0.626 0.274 0.798 0.775 0.952
Standard errors in parentheses∗ p < 0.05, ∗∗ p < 0.01, ∗∗∗ p < 0.001Regressions are estimated according to Equation 3.

Table A6: Heterogeneity of results behind deterrence and non-deterrence nudges
(1) (2) (3)Extensive Intensive t-value
Treatment (omitted: Non-Deterrence)Deterrence -0.017 -1.974∗∗ -3.598
(0.059) (0.647) (3.715)Baseline Comparison (omitted: Baseline Info)No Info 0.043∗ 0.048 1.131
(0.021) (0.079) (0.761)Letter -0.055∗ -0.025 -6.770∗∗
(0.022) (0.113) (2.275)Unpublished 0.012 0.229∗∗∗ 2.086∗∗
(0.014) (0.041) (0.722)Delivery (omitted: Physical Letter)Digital Letter -0.001 1.212∗∗∗ 2.206
(0.034) (0.220) (1.579)In Person -0.025 0.816∗∗∗ 3.961∗∗
(0.048) (0.037) (1.424)Tax Type (omitted: Corporate Tax)Income Tax -0.057 0.116∗∗ -0.814
(0.049) (0.036) (0.928)Property Tax -0.085 0.333 -1.123
(0.051) (0.378) (1.175)VAT -0.032 0.168∗∗∗ -0.193
(0.033) (0.039) (0.810)Other 0.032 0.117∗∗∗ 5.769
(0.077) (0.026) (3.763)All -0.007 0.103∗ 0.532
(0.049) (0.039) (1.021)Response Horizon (omitted: Late)Short Run 0.036∗∗ 0.107 2.012∗∗∗
(0.013) (0.107) (0.539)Late-payer sample (omitted: On Time)Late 0.029 0.175∗ 3.842∗∗
(0.016) (0.062) (1.112)Middle Income 0.036 0.309∗∗∗ 2.549
(0.042) (0.073) (1.482)High Income 0.058 0.418∗∗∗ 3.576∗
(0.041) (0.037) (1.551)Deterrence × No Info -0.040 0.457 2.389
(0.026) (0.537) (1.811)Deterrence × Letter 0.015 0.074 4.532
(0.029) (0.562) (3.086)Deterrence × Unpublished -0.006 0.804∗∗ -1.310
(0.018) (0.207) (1.314)Deterrence × Digital Letter 0.046 0.000 -0.160
(0.043) (.) (1.784)Deterrence × In Person 0.187∗∗∗ 1.966∗∗∗ 12.998∗∗
(0.051) (0.197) (3.837)Deterrence × Income Tax 0.063 0.573 4.699∗∗
(0.053) (0.427) (1.619)Deterrence × Property Tax 0.098 0.000 6.034∗∗
(0.056) (.) (2.195)Deterrence × VAT 0.030 1.405∗∗∗ 3.312
(0.036) (0.320) (1.819)Deterrence × Other -0.000 1.474∗∗∗ 5.530
(0.079) (0.242) (4.165)Deterrence × All 0.069 1.421∗∗∗ 6.635∗∗
(0.054) (0.267) (2.144)Deterrence × Short Run 0.006 -0.066 -1.439
(0.030) (0.273) (1.451)Deterrence × Late 0.002 0.973∗∗∗ 3.684∗∗
(0.021) (0.204) (1.234)Deterrence × Middle Income -0.007 -0.204 0.072
(0.046) (0.337) (1.818)Deterrence × High Income -0.027 0.688∗∗ -0.646
(0.045) (0.231) (2.143)Constant -0.031 -0.623∗∗∗ -5.221∗
(0.042) (0.022) (2.007)Observations 467 174 963R2 0.385 0.496 0.407
Standard errors in parentheses∗ p < 0.05, ∗∗ p < 0.01, ∗∗∗ p < 0.001Regressions are estimated according to Equation 3.