Tax avoidance on a social network · Tax Avoidance on a Social Network Duccio Gamannossi...
32
DUCCIO GAMANNOSSI MATTHEW D. RABLEN DEGL’INNOCENTI UNIVERSITY OF EXETER UNIVERSITY OF SHEFFIELD Tax avoidance on a social network TARC DISCUSSION PAPER 019-17
Transcript of Tax avoidance on a social network · Tax Avoidance on a Social Network Duccio Gamannossi...
DUCCIO GAMANNOSSI MATTHEW D. RABLEN DEGL’INNOCENTI UNIVERSITY OF EXETER UNIVERSITY OF SHEFFIELD
Tax avoidance on a social network
TARC DISCUSSION PAPER 019-17
Tax Avoidance on a Social Network∗
Duccio Gamannossi degl’Innocenti†[email protected]
Matthew D. Rablen‡m.rablen@sheffi eld.ac.uk
November 16, 2017
Abstract
We relate tax avoidance behaviour to a substantial literature on self and social comparison injudgements. Taxpayers engage in tax avoidance (which is both risky and costly) as way topotentially boost their present consumption relative to others in their “local” social network,and relative to the past. The unique Nash equilibrium of the model relates optimal avoidanceto a (Bonacich) measure of network centrality: more central taxpayers avoid more. We provideformal comparative statics results for optimal avoidance and, using simulation, address policyquestions. We find evidence in favour of targeting tax authority interventions at highly centraltaxpayers (celebrities) in social networks, and document a role for self comparison in explainingpersistent post-intervention behavioural effects. Our approach helps to marry analytical andagent-based approaches to tax avoidance.
JEL Classification: H26, D85, K42.Keywords: Tax avoidance, Social networks, Network centrality, Optimal auditing, Social com-parison, Self comparison.
∗Acknowledgements: We thank Julie Corah, Mandy Chik, Frederick Nelson, and participants at the 5thAnnual TARC Workshop (Exeter) for helpful comments. We are grateful to the ESRC for financial supportunder grant ES/K005944/1.†Department of Economics, University of Exeter, Exeter, EX4 4PU, UK.‡Department of Economics, University of Sheffi eld, Sheffi eld, S1 4DT, UK.
1 Introduction
Individuals take a variety of actions to reduce their tax liabilities. The UK tax authority,
for instance, distinguishes three distinct types of action (H.M. Treasury and H.M. Revenue
and Customs, 2011): those that breach tax law (tax evasion); those that use the tax law
to get a tax advantage that lawmakers never intended (tax avoidance); and those that use
tax allowances for the purposes intended by lawmakers (tax planning). By these definitions,
both tax evasion and tax avoidance are responsible for significant losses in public revenue:
estimates provided by the UK tax authority put the value of tax avoidance at £ 1.7 bn. and
the value of tax evasion at £ 5.2 bn. (H.M. Revenue and Customs, 2016). Given the first
order significance of tax avoidance, it is of note that the first economic studies relating to tax
compliance (e.g., Allingham and Sandmo, 1972; Srinivasan, 1973; Yitzhaki, 1974) neglect
the possibility of tax avoidance altogether, and the economic literature that followed has
largely retained this bias.
In this paper we link avoidance behaviour to a mass of evidence that people continually
engage in comparisons —with others (social comparison) and with themselves in the recent
past (self comparison — or “habit”). Utility, evidence for developed economies suggests,
is in large part derived from consumption relative to these comparators, rather than from
its absolute level (e.g., Ferrer-i-Carbonell, 2005; Luttmer, 2005; Clark and Senik, 2010;
Mujcic and Frijters, 2013). The evolutionary processes that might explain this phenomenon
are explored in Postlewaite (1998), Rayo and Becker (2007) and Samuelson (2004), among
others. Researchers have proposed that self and social comparison can explain economic
phenomena including the Easterlin paradox (Clark et al., 2008; Rablen, 2008), the equity-
premium puzzle (Constantinides, 1990; Galí, 1994); stable labour supply in the face of
rising incomes (Neumark and Postlewaite, 1998); upward rather than downward sloping
wage profiles (Loewenstein and Sicherman, 1991; Frank and Hutchens, 1993); the feeling
of poverty (Sen, 1983); the demand for risky activities (Becker et al., 2005); and migration
choices (Stark and Taylor, 1991). There are important consequences for consumption and
saving behaviour (Dybvig, 1995; Chapman, 1998; Carroll et al., 2000), for the desirability
of economic growth (Layard, 1980, 2005), for monetary policy (Fuhrer, 2000), and for tax
policy (Boskin and Sheshinki, 1978; Ljungqvist and Uhlig 2000; Koehne and Kuhn, 2015).
Despite the overwhelming evidence of a concern for self and social comparison, neither has
ever been formally explored in the context of the tax avoidance decision. Here, therefore,
1
we provide a network model of the tax avoidance decision in which taxpayers are assumed
to have an intrinsic concern for income relative to a benchmark that can reflect both self
and social comparison.1 Taxpayers observe the consumption of a subset of other taxpayers
(the “reference group”) with whom they are linked on a social network. In this context,
taxpayers may seek to avoid tax so as to consume more relative to those they compare
against. Taxpayers also benchmark their current consumption in part against its lagged
values. The model exhibits strategic complementaries in avoidance choices, so that more
avoidance by one taxpayer reinforces other taxpayers’ decisions to avoid also. Following
the lead of Ballester et al. (2006), we utilise linear-quadratic utility functions to provide a
characterisation of Nash equilibrium. We show that there is a unique Nash equilibrium in
which avoidance is a weighted network centrality measure of the form proposed by Bonacich
(1987). Network centrality is a concept developed in sociology to quantify the influence or
power of actors in a social network: it counts the number of all paths (not just shortest
paths) that emanate from a given node, weighted by a decay factor that decreases with the
length of these paths. In this sense, our contribution combines sociological and economic
insights in seeking to understand tax avoidance behaviour.
Although the model is simple enough to admit an analytic solution, it is also suffi ciently rich
that it may be used to address a range of questions of interest to academics and practitioners
in tax authorities. Here we focus on three such questions: first, we investigate how changes
in the exogenous parameters affect avoidance; second, we explore how the marginal revenue
effects that arise from performing one extra intervention vary across taxpayers with different
levels of network centrality; and last we consider the dynamic profile of behavioural responses
to an successful anti-avoidance intervention by the tax authority.
An important feature of our model is that it addresses explicitly the role of local comparisons
on a social network. By contrast, the existing analytical literature on the related study of
tax evasion allows only global (aggregate) social information to enter preferences: the global
statistic that taxpayers are assumed to both have a concern for, and to be able to observe,
is modelled as either (i) the proportion of taxpayers who report honestly (Gordon, 1989;
Myles and Naylor, 1996; Davis et al., 2003; Kim, 2003; Traxler, 2010); (ii) the average post-
tax consumption level (Goerke, 2013); (iii) the level of non-compliance as a share of GDP
(Dell’Anno, 2009); or (iii) the average tax payment (Mittone and Patelli, 2000; Panadés,
1The economics of networks is a growing field. For recent overviews, see Ioannides (2012), Jackson andZenou (2015), and Jackson et al. (2017).
2
2004). While reducing social information to a single statistic known to all taxpayers has a
benefit in terms of analytical tractability, it is problematic in a number of respects. First,
from the perspective of modelling with explicit social networks, assuming that taxpayer’s
observe aggregate-level information is implicitly the assumption that the social network is
the complete network (in which every taxpayer is directly linked to all other taxpayers). Yet
there are reasons to think that relative consumption externalities are, in fact, heterogeneous
across individuals. In particular, we know that people’s reference group is typically composed
of “local”comparators such as neighbours, colleagues, and friends (Luttmer, 2005; Clark and
Senik, 2010).2 Moreover, implicitly assuming a complete network implies that all taxpayers
are equally connected socially, thereby ruling out, in particular, the existence of highly-
connected “stars”or “celebrities”. Yet, such features of social networks may matter for the
targeting of tax audits (Andrei et al., 2014).
The only literature that has enriched the introduction of social information (again in the tax
evasion context) is that which uses agent-based simulation techniques as an alternative to
analytical methods. Even here, however, the majority of studies allow for this feature in only
a limited way that, in particular, does not allow fully for heterogeneity in connectedness:
authors often impose symmetry on the network of links, as in, e.g., Davis et al. (2003) and
Hashimzade et al. (2014, 2016) and/or assume the size of the reference group to be equal
across taxpayers (e.g., Korobow et al., 2007; Hokamp and Pickhardt, 2010; Bloomquist,
2011; Hokamp, 2014).3 We offer a model that is both analytically tractable and that allows
for local comparisons on an arbitrary social network. In this sense, our approach lies in
the cleavage between existing analytical and agent-based approaches, and is complementary
to each. Extending analytical understanding of network effects upon tax avoidance — in
particular being able to prove formal comparative statics properties of the model —aids the
interpretation of simulation output from related agent-based models.
To our knowledge, no previous contribution has allowed simultaneously for both self and
social comparison in the tax compliance decision. Goerke (2013), however, allows for social
comparison by assuming an intrinsic concern for relative consumption by taxpayers. The
2More generally, relative consumption externalities may be viewed as a form of peer effect. In othercontexts, generative models of peer effects predict heterogeneous exposure. For instance, when job informa-tion flows through friendship links, employment outcomes vary across otherwise identical agents with theirlocation in the network of such links (Calvó-Armengol and Jackson, 2004).
3Zaklan et al. (2008) and Andrei et al. (2014) are among exceptions that do explore more general networkstructures.
3
primary focus of his contribution is, however, the derived impact on tax compliance from
endogenous changes in labour supply, whereas we treat income as an exogenous parameter.
In the remaining literature that considers a social dimension to the tax compliance decision,
taxpayers are assumed to derive utility solely from absolute consumption, but nonetheless
react to social information because they experience social stigma — the extent of which
depends on the compliance behaviour of other taxpayers —if revealed to be noncompliant.
The focus of much of this literature is on the potential for multiple equilibria, whereas our
model yields a unique equilibrium. While a concern for relative utility is compatible with
the simultaneous existence of social stigma towards non-compliers, the two approaches differ
in emphasis. Underlying the idea of social stigma is the concept of social conformity, in
which agents seek to belong to the crowd, whereas the presumption of relative consumption
theories is that individuals seek to stand out from the crowd. A small literature relating
to this point in the context of tax compliance supports the notion that social information
impacts compliance behaviour (Alm et al., 2017; Alm and Yunus, 2009), but rejects social
conformity as the underlying mechanism (Fortin et al., 2007).4
A recent contribution that allows explicitly for self comparison in the tax compliance de-
cision is Bernasconi et al. (2016). There are, however, important differences in approach
and results. In our model taxpayers are myopic, and habit reflects only recent consumption
outcomes, whereas these authors consider far-sighted taxpayers and assume habit to reflect
the full history of consumption. Stronger habit is associated with higher avoidance in our
model, for it generates a negative internality on myopic taxpayers: higher past consump-
tion outcomes reduce present utility. To overcome this internality, taxpayers must gamble
(avoid) more. Conversely, Bernasconi et al. find that stronger self comparison improves tax
compliance.
This article adds to the small, but growing, economic literature that models the tax avoidance
choice (Alm, 1988; Alm and McCallin, 1990; Alm et al., 1990; Cowell, 1990; Slemrod, 2001;
Neck et al., 2012; Gamannossi degl’Innocenti and Rablen, 2016). Like us, Alm and McCallin
(1990) describe avoidance as a risky asset owing to the possibility of effective anti-avoidance
measures by the tax authority, whereas the remaining papers characterise avoidance as a
riskless, albeit costly, asset. None of these papers consider avoidance in a social network
4We also note that acts of tax avoidance appear often to attract less social stigma than acts of tax evasion(see, e.g., Kirchler et al., 2003).
4
setting, however. Much of the remaining literature on tax avoidance is concerned with
whether income tax has “real”effects upon labour supply or simply leads to changes in the
“form”of compensation (e.g., Gruber and Saez, 2002; Slemrod and Kopczuk, 2002; Slemrod
1995; Piketty et al., 2014).5 We also connect to a broader literature that applies network
theory to the analysis of crime (e.g., Glaeser et al., 1996; Ballester et al., 2006).
The plan of the article is as follows: section 2 develops a formal model of tax avoidance
on a social network. Section 3 analyses —using both formal and simulation methods —the
predictions of the model for optimal avoidance, and for understanding the effects of tax
authority interventions. Section 4 concludes. All proofs are in the Appendix.
2 Model
Let N be a set of taxpayers of size N . A taxpayer i ∈ N has an income Wi drawn from an
income distribution defined on the interval [W,W ], where 0 < W < W . If a taxpayer were
to pay income tax on their full income, Wi, they would receive a net disposable income Xi ≡Xi (Wi). Taxpayers can, however, choose to avoid paying an amount of taxAit ∈ [0,Wi −Xi].
Avoidance technology is, though, costly, for devising avoidance schemes that reduce a tax
liability without ostensibly violating tax law invariably requires a detailed understanding
of tax law, coupled with a degree of ingenuity, that few taxpayers possess.6 Satisfying this
demand for tax avoidance is, therefore, a substantial industry dedicated to the development
and marketing of avoidance schemes (see, e.g., Sikka, 2012; Committee of Public Accounts,
2013; Addison and Mueller, 2015).
As in Gamannossi degl’Innocenti and Rablen (2016), we assume that the avoidance scheme
available to taxpayer i offers a reduction of Ait in theoretical tax liability at a cost φAit, where
φ ∈ (0, 1). In this way, φ may be interpreted as measuring the degree of competition in themarket for tax avoidance schemes, with lower values of φ indicating the presence of stronger
competitive forces. We emphasise here, however, that the theoretical tax reduction of φAit,
on which the fee for avoidance technology is based, is not necessarily the tax reduction
that is ultimately achieved: should the tax authority successfully intervene legally against
5In these studies, the term “tax avoidance” typically refers to all form-changing actions that reduce atax liability. This definition overlaps with ours but is broader in that it includes actions that fall in to ournotion of tax planning.
6People not only have diffi culties in understanding tax law, but also show poor knowledge of tax rates(Blaufus et al., 2015; Gideon, 2017) and basic concepts of taxation.
5
the avoidance scheme we assume it obtains the right to reclaim the avoided tax Ait (but
cannot levy a fine). Accordingly, all monetary risks associated with the possible detection
and termination of the tax avoidance scheme are borne by the taxpayer.7
The probability that taxpayer i’s attempt to avoid tax is unsuccessful in a given period is
pi ∈ (0, 1). This parameter captures the joint likelihood that the tax authority learns ofthe avoidance activity, that it chooses to mount a legal intervention (it may not have the
resources to challenge all schemes), and that the legal intervention is successful. Allowing
for taxpayer heterogeneity in pi implies that the tax authority may condition its enforcement
upon observable features of the taxpayer.
Taxpayers are assumed to derive utility from their level of consumption (income) relative to
a reference level Ri (the determination of which we shall come to later). As is standard in
agent-based modelling, although taxpayers live for multiple periods, each makes a succession
of single-period decisions and so is “myopic”.8 In each period, taxpayers behave as if they
maximise expected utility, where utility is denoted by U (z) = [b− az/2] z. We restrictutility to satisfy the standard conditions U ′ > 0 and U ′′ < 0 for all taxpayers, suffi cient
conditions for which are that a ∈(0, b
maxi∈N Wi
)and b > 0.
The expected utility of taxpayer i is therefore given by
E (Uit) ≡ [1− pi]U (Csit −Rit) + piU (Cuit −Rit) , (1)
where consumption in the successful avoidance state (Csit) and in the unsuccessful state (Cuit)
is given by:
Csit ≡ Xi + [1− φ]Ait; (2)
Cuit ≡ Csit − Ait. (3)
An obvious objection to this formulation is that it neglects entirely the possibility of absolute
utility. Although an absolute component to utility surely exists, we omit it here for simplicity7Although systematic information regarding the precise contractual terms upon which avoidance schemes
are typically sold is scarce, we understand from a detailed investigation in the UK that, for the majorityof mass-marketed schemes, enforcement risk is indeed borne by the taxpayer as described (Committee ofPublic Accounts 2013, 11).
8For a small theoretical literature that does not assume myopic taxpayers see, e.g., Levaggi and Menoncin(2012, 2013). Note, however, that Manski (1991) and McFadden (2006) argue that individuals faced withdynamic stochastic decision problems that pose immense computational challenges may look to other indi-viduals to infer satisfactory policies, consistent with our modelling of the role of social networks.
6
and emphasis.9 Optimal avoidance in period t is the solution to the problem maxAi E (Uit)
subject to the Cournot constraint that reference consumption, Rit, is taken as given. The
first order condition for optimal avoidance is given by
[1− pi] [1− φ]U ′(Csit)− piφU ′(Cuit) = 0,
which can be solved to give optimal avoidance at an interior solution satisfying Ait ∈(0,Wi −Xi) as
Ait =1− pi − φ
aζ i{b− a [Xi −Rit]} , (4)
where ζ i ≡ [1− pi − φ]2 + pi [1− pi] > 0. Given that marginal utility, b − a [Xi −Rit], is
positive by the assumed restrictions on a, the expression for optimal avoidance in (4) will
indeed satisfy Ait ∈ (0,Wi −Xi) for all i if
0 < 1−maxi∈N {pi} − φ < mini∈N{
aζ i [Wi −Xi]
b− a [Xi −Rit]
}. (5)
In what follows we shall take the inequalities in (5) to hold. The left-side inequality is
equivalent to the condition that expected consumption,
qit ≡ E (Cit) = Xi + [1− pi − φ]Ait, (6)
is increasing in avoided tax Ait (so the avoidance gamble has a positive expected return).
2.1 Reference consumption
Reference consumption, Rit, is a function of self and social comparison. To formalise the
notion of social comparison, we assume that a taxpayer’s realised consumption is observed
by a subset of other taxpayers belonging to N , a set we term the reference group.
We represent the observability of consumption in the form of a bidirectional network, where
a link from taxpayer i to taxpayer j indicates that i observes j’s consumption. Links are
permitted to be subjectively weighted, for some members of the reference group may be
more focal comparators than are others. We focus on (strongly) connected networks —a
9In international studies, measures of subjective wellbeing measures typically become uncorrelated withaverage national income above a threshold estimated at $5,000 (in 1995, PPP) by Frey and Stutzer (2002).Since most citizens of developed countries lie above this threshold, our model may be a reasonable approxi-mation in such cases.
7
network is connected when there is a path (though not necessarily a direct link) between
every pair of taxpayers.10 The network, which may also update over time, can be represented
as an N × N matrix Gt of subjective weights 1 ≥ gijt ≥ 0, where giit = 0 (the adjacency
matrix). Hence, the reference group of taxpayer i is the set of taxpayers for whom gijt > 0,
and∑
j gijt measures the total psychological weight a taxpayer places on members of the
reference group.
People predominantly compare with others who are similar to them on prescribed dimensions
(McPherson et al., 2001), perhaps because these comparisons are the most informative (Clark
and Senik, 2010). It follows that changes in the psychological weight attached to different
comparator taxpayers in the network may arise, for instance, as a response to recent changes
in consumption. To capture this effect in a simple way, we suppose the gijt can evolve as
lagged functions of absolute consumption differences, |Ci,t−1 − Cj,t−1|. In particular, gijt isnegatively related to |Ci,t−1 − Cj,t−1| so that comparison is more intensive between taxpayersi and j the closer are Ci,t−1 and Cj,t−1.
With the social network defined, we then write reference consumption as
Ri,t (q−i,t) ≡ ιhCi,t−1 + ιs∑
j 6=igijtqjt > 0, (7)
where∑
j 6=i gijtqjt is the weighted mean over the reference group of expected consumption
(reflecting social comparison) and Ci,t−1 is the “habit”level of consumption (reflecting self
comparison), which, as is common, we equate with realised consumption in the previous
period.11 The parameters ιh > 0 and ιs > 0 are the psychological weights taxpayers place
on, respectively, self and social comparison. In this sense, the total psychological weight
placed on social comparison, ιs∑
j 6=i gijtqjt, contains a component common across taxpayers,
given by ιs, and an idiosyncratic component given by∑
j 6=i gijtqjt. We use the shorthand
q−i,t to refer to the set of all qjt excluding qit.
10This restriction does not play any explicit role except to simplify our discussion of comparative staticseffects. In an unconnected or weakly connected network taxpayers whom nobody observes generate noconsumption externality on others, and taxpayers who do not observe any other taxpayer are not subject toa consumption externality, in which case our strict comparative statics findings in general become weak.11For examples of this approach see, e.g., Muellbauer (1988), Carroll and Weil (1994) and Guariglia and
Rossi (2002).
8
2.2 Nash Equilibrium
Using (7) in the first order condition (4), we now solve for the unique Nash equilibrium of
the model. To do this, we first define a notion of network centrality due to Bonacich (1987),
which computes the (weighted) discounted sum of paths originating from a taxpayer in the
network:
Definition 1 For a network with (weighted) adjacency matrix G, diagonal matrix β andweight vector α, the weighted Bonacich centrality vector is given by b(G,β,α) = [I−Gβ]−1αprovided that [I−Gβ]−1 is well-defined and non-negative.
In Definition 1, the matrix β specifies discount factors that scale down (geometrically) the
relative weight of longer paths, while the vector α is a set of weights. Ballester et al. (2006)
show that [I−Gβ]−1 will be well-defined, as required by Definition 1, when I > ρ (G)β,
where ρ (G) is the largest absolute value of the eigenvalues of G. Intuitively, this condition
is that the magnitude of the local externality that a taxpayer’s avoidance imparts upon other
taxpayers cannot be too large. If local externality effects are too strong then the set of linear
equations that define an interior Nash equilibrium of the model have no solution. In this
case, multiple corner equilibria can instead arise (see, e.g., Bramoullé and Kranton, 2007).
Focusing on the case when local externality effects are not too large, we have the following
Proposition:
Proposition 1 If p < I− φ, αt < [I−Htβ] [W −X], and I > ρ (Ht)β there is a unique
interior Nash equilibrium, at which the optimal amount of tax avoided is given by
At = b(Ht,β,αt),
where
hijt =[1− pi − φ][1− pj − φ]
ζ igijt;
βii = ιs;
αi1t =1− pi − φ
aζ i{b− a [Xi −Rit (X−i,t)]} .
According to Proposition 1, a taxpayer’s optimal avoidance corresponds to a Bonacich cen-
trality on the social network Ht, weighted to reflect a taxpayers marginal utility of con-sumption. By this measure, taxpayers that are more central in the social network avoid
9
more.12 The three conditions under which this result holds are comprised of the two interior
conditions in (5), now written in matrix form as functions of the exogenous variables, and
the condition that local externality effects are not too strong. The uniqueness of equilibrium
avoidance follows intuitively from the observation that, under linear-quadratic utility, each
taxpayer’s best response function is linear in the avoidance of every other taxpayer. The
social network Ht transforms the underlying comparison intensity weights, gijt, by a factor
[1−pi−φ][1−pj−φ]ζ−1i in order to reflect potential differences in the probability of success-
ful avoidance across taxpayers. It follows that, in the special case that all taxpayers face a
common success probability, no adjustment to the underlying comparison intensity weights
is warranted. In this case, therefore, optimal avoidance is a weighted Bonacich centrality
measure on the untransformed network Gt:
Corollary 1 If α < [I−Gtβ] [W −X], I > ρ (Gt)β and pi = p < 1−φ for all i the uniqueinterior Nash equilibrium for avoidance is given by At = b(Gt,β,αt), where
Gijt = gijt;
βii =ιs[1− p− φ]2
ζ;
αi1t =1− p− φ
aζ{b− a [Xi −Rit (X−i,t)]} .
3 Analysis
The model of the previous section is suffi ciently rich that it may be used to address a wide
range of questions of interest to academics and practitioners in tax authorities. Here we
limit ourselves to a focus on three such questions: first, we investigate how changes in the
exogenous parameters affect optimal avoidance; second, we explore how the various direct
and indirect marginal revenue effects that arise from performing one extra intervention vary
across taxpayers with different levels of network centrality; and last we consider the dynamic
profile of behavioural responses to a legal intervention by the tax authority.
12Our interpretation of the matrix of weights, αt, follows from noting that marginal utility in the linear-quadratic specification is given by U ′ (z) = b− az. Accordingly, the term in braces in the expression for αi1tis the marginal utility from ones own legal consumption, Xi, relative to a reference level of consumption.The latter utilises the weighted average of legal consumption of the members of the reference group.
10
3.1 Comparative statics
An advantage of the existence of an analytical solution to the model is that we may for-
mally derive general comparative statics results. We therefore characterise the way in which
equilibrium responds to changes in the underlying exogenous parameters for an arbitrary
social network. Because the effects of habit and network updating are not contemporane-
ous, but rather occur at the first lag, it is necessary in the context of comparative statics
to distinguish between the short-run (contemporaneous) effect and the long-run effect (al-
lowing for lagged adjustments). Accordingly, for an arbitrary exogenous variable, z, we
analyse the “short-run”comparative static, ∂Ait/∂z and the “long-run”comparative static
E (∂Ai,t+1/∂z).
As precise computation of the short-run derivatives for an arbitrary N is burdensome, we in-
stead utilise the supermodularity of the taxpayer’s objective function in avoidance choices to
deduce the signs of the comparative statics effects from the theory of monotone comparative
statics (Edlin and Shannon, 1998; Quah, 2007).13 We then reason the long-run comparative
static properties of the model from the findings for the short-run.
Proposition 2 At an interior Nash equilibrium the comparative statics of optimal avoidanceare given by
Variable Short-run Long-runb, Ci,t−1, ιh, ιs, Xj + +a, pi, pj − −φ −/+ −/+Xi − −/+
The first results in Proposition 2 we consider are for the pair of parameters {a, b} belongingto the utility function. Noting that the coeffi cient of absolute risk aversion is given byA (z) =a [b− az]−1 > 0, increases in a associate with increased risk aversion, while increases in b
associate with decreased risk aversion. Consistent with this observation, increases in a cause
optimal avoidance to decrease, while b increases optimal avoidance. Long-run adjustments
reinforce these effects: taking a as an example, an increase in a at time t causes a short-
run fall in avoidance; as avoidance has positive expected returns, this lowers the expected
realisation of Ct. The lower expected realisation of Ct implies that, in expectation, the
taxpayer will, at time t + 1, shift their comparison intensity weights towards taxpayers
with lower expected consumption, implying that the expectation (as of time t) of the term
13See Tremblay and Tremblay (2010) for an excellent introduction to these methods.
11
∑j 6=i gij,t+1qj,t+1 falls. As both Ct and
∑j 6=i gij,t+1qj,t+1 enter Ri,t+1 positively, the expected
value of reference consumption at time t + 1 unambiguously falls. It is straightforward to
observe from (4) that Ait is contemporaneously increasing in Rit, hence a fall in the expected
value of Ri,t+1 causes the expected value of Ai,t+1 to fall also. Hence, E (∂Ai,t+1/∂a) < 0.
An increase in one’s own probability of successful avoidance raises optimal avoidance, but
so also does an increase in the success probability of another taxpayer in the social net-
work. When another taxpayer’s success probability increases they increase their avoidance,
thereby increasing the need for other taxpayers to do likewise to maintain a given level of
relative consumption. Long-run adjustments reinforce these effects. There is no clear rela-
tionship between optimal avoidance and the competitiveness of the market for avoidance, as
measured by φ. Increases in φ induce a substitution away from avoidance, but this makes
the taxpayer poorer, and therefore less risk averse, which induces more avoidance. These
competing income and substitution effects also make unclear the effect of the associated
long-run adjustments. In the event that the substitution effect empirically dominates the
income effect, however, a negative relationship is predicted in both the short- and long-run.
The parameter, ιs, which measures the extent to which taxpayers care about social compar-
ison, is positively associated with avoidance. Taxpayers impose a negative externality upon
other taxpayers when their expected consumption increases, and the size of this externality is
directly regulated by ιs. The greater the externality, the more avoidance is pushed upwards
in the struggle among taxpayers to maintain relative consumption. The parameters Ci,t−1and ιh, which both reflect the role of self comparison, are also positively associated with
avoidance, but the economic intuition (relative to social comparison) differs. Whereas social
comparison generates negative externalities, self comparison generates negative internali-
ties: past consumption outcomes affect negatively the evaluation of current consumption.
To overcome this internality, taxpayers must seek a present consumption level that beats
Ci,t−1,which entails avoiding more. The effects of self and social comparison therefore in-
teract positively: the desire to out-consume one’s reference group induces avoidance, which
then pushes up past consumption (in expectation), causing a further increase in avoidance
on account of the concern for self comparison.
3.1.1 Avoidance and Income
The final set of results in Proposition 2 deal with the comparative static effects of the level of
income. Although an increase in the income of other taxpayers in the social network has the
12
unambiguous effect of raising own avoidance, the effect of movements in own income exhibit
potentially important differences in the short- and long-run effects, so we consider this case in
more detail. Noting that (i) income Wi enters optimal avoidance only through Xi (Wi); and
(ii) that Wi enters Xi (Wi) positively, the sign of ∂Ait/∂Wi is the sign of ∂Ait/∂Xi. In our
model we obtain in the short-run that ∂Ait/∂Xi < 0, so also ∂Ait/∂Wi < 0. Interestingly,
however, the negative relationship between income and avoidance in the short-run may
readily be overturned in the long-run. The key to this finding is that, although Wi lowers
Ait in the short-run, it may nonetheless increase expected consumption. To see this, observe
that the full short-run equilibrium effect ofWi on qi (accounting for equilibrium adjustments
in Ait) is given by
dqitdXi
= 1 + [1− pi − φ]∂Ait∂Xi
,
so dqit/dXi is positive so long as ∂Ait/∂Xi is not too large (in absolute value), i.e., dqit/dXi >
0 ⇔ |∂Ait/∂Xi| < [1− pi − φ]−1. When increases in Xi raise short-run expected consump-
tion, the long-run effects on avoidance act against the short-run effect. Specifically, the
increase in qit increases the expectation of Ct and of∑
j 6=i gij,t+1qj,t+1, which implies that the
expectation of Ri,t+1 increases, thereby driving up optimal avoidance in t+ 1.
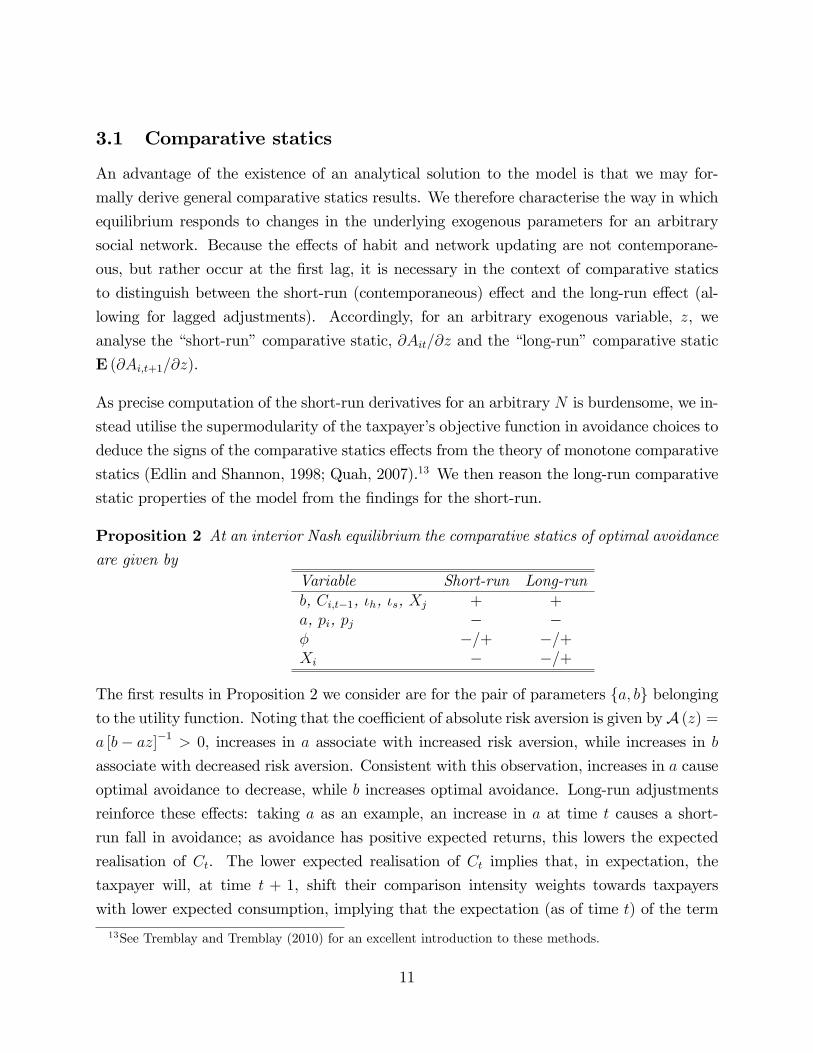
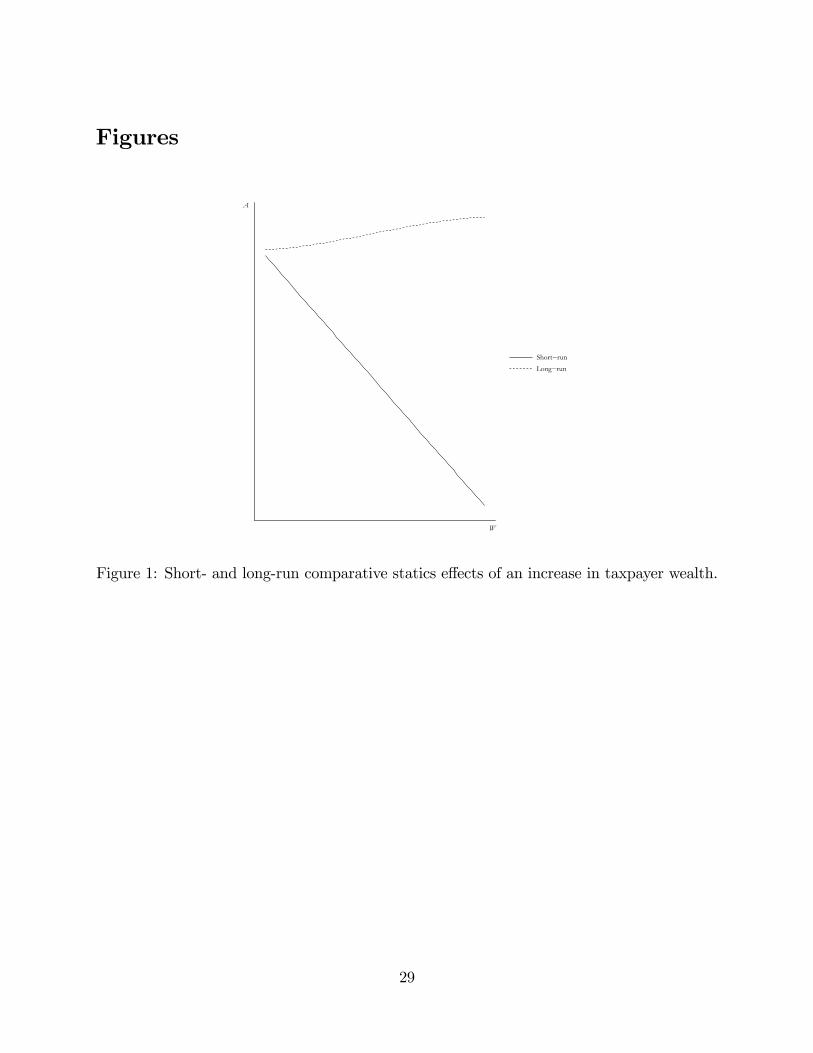
In Figure 1 we demonstrate the potential for differing short- and long-run effects.14 To
introduce homophily in income, comparison intensity weights at time t are given by
gijt = ς1 −ς2 |Ci,t−1 − Cj,t−1|
maxi∈N {Ci,t−1} −mini∈N {Ci,t−1}.
where ς1 ∈ (ς2, 1) and ς2 ∈ [0, 1) are constants that must be chosen to respect the non-negativity of the gijt. In particular, ς2 regulates the degree of homophily in income, with
no homophily arising if ς2 = 0. As is seen in the Figure (drawn for ς1 = 1, ς2 = 0.8), the
short-run effect of an increase in Wi is to lower avoidance; moreover this effect is observed
to be linear in Wi. Once all sources of dynamic adjustment are allowed for, however, we
observe in Figure 1 a positive long-run relationship between avoidance and income. While
detailed empirical evidence is limited, this long-run finding is consistent with a widely held
14The parameters required to replicate all figures in this paper are a = 1, b = 50, ιs = 4, ιh = 1, φ = 0.35,pi = p = 0.625, N = 750, Xi (Wi) = 0.55Wi. Our qualitative results are, however, robust to a range ofparameter specifications. Figures are produced in R using RStudio random seed no. 14082017; our codesare available upon request. We report the average result of 200 replications to wash-out the random effectscaused by the contingent realisation of tax authority interventions. To eliminate start-up effects, the resultswe report omit the first 20 periods of each simulation.
13
presumption that tax avoidance is more prevalent among the wealthy.15 In sum, our findings
point to an important role for self and social comparison in mediating the relationship
between income and avoidance. Specifically, a positive long-run relationship between these
variables arises when increases in income induce taxpayers to, in turn, compare to richer
taxpayers, and thereby acquire a higher level of habit consumption.
3.2 Intervention strategy
In this section we investigate the implications of the model for the design of intervention rules
by tax authorities. Conventionally, the literature on optimal auditing assumes that a tax
authority can condition its intervention decisions solely on the income declaration contained
within a taxpayer’s tax return. If, however, a tax authority can (at least partially) observe
the network of links between taxpayers, it is of interest to examine the differing implications
of targeting taxpayers with different degrees of centrality in the social network.
Can tax authorities observe links in social networks? Although surely the full gamut of links
cannot be observed, importantly, there exist some individuals —celebrities —for whom it is
common knowledge that many people are linked to them. Also, even for non-celebrities, the
idea that tax authorities know at least something about people’s associations is becoming
more credible with the advent of “big data”. The UK tax authority, for instance, uses a
system known as “Connect”, operational details of which are in the public domain (see,
e.g., Baldwin and McKenna, 2014; Rigney, 2016; Suter, 2017). Connect cross-checks public
sector and third-party information, seeking to detect relationships among actors. According
to Baldwin and McKenna (2014), the system produces “spider diagrams”linking individuals
to other individuals and to other legal entities such as “property addresses, companies,
partnerships and trusts.”
The revenue effects of an intervention are commonly broken down three ways (e.g., DeBacker
et al., 2015): the direct effect is the contemporaneous recovery of tax that would otherwise
have been avoided; the own indirect effect refers to the expected additional revenue arising
from future changes in avoidance behaviour by the affected taxpayer, while the other indirect
effect refers to the expected additional revenue arising from spillover effects in avoidance
15We see from Proposition 2 that, unlike the effect of own income, the cross effect from one taxpayerbecoming richer on the avoidance of other taxpayers is unambiguous and positive. This effect arises asone taxpayer becoming richer requires other taxpayers to avoid more to preserve their level of relativeconsumption.
14
behaviour by the unaffected taxpayers. The relative magnitudes of these three effects is
investigated empirically in DeBacker et al. (2015, 2017). Different from these studies, we
do not seek to examine the magnitude of these three effects —instead we exploit the local
reference group heterogeneity allowed for by our approach to examine how the magnitude of
each effect varies across taxpayers who are more or less central in the social network.
As in Andrei et al. (2014), we analyse these three revenue effects in “scale-free”networks,
generated using the algorithm of Barabási and Albert (1999).16 As well as closely approxi-
mating the structure of real-world social networks, scale-free networks generate considerable
variation in connectedness (centrality): there exist celebrity taxpayers, who are highly con-
nected in the network, alongside other taxpayers who are very weakly connected within the
network. Here, to focus on the role of connectedness in the network, we eliminate all other
sources of taxpayer heterogeneity, so wi = w and pi = p for all i ∈ N and the social network
is taken to be fixed, i.e., gijt = gij for all t ∈ T . We consider the marginal revenue effectsfrom conducting one additional intervention against a taxpayer with a given Bonacich cen-
trality, b(Gt,β,αt), which, by Corollary 1, is identical to the taxpayer’s avoidance. To the
extent that these effects persist for several periods following an intervention, the measured
effects are aggregated over the full lifetime of the effect (we discuss the dynamic profile of
these effects in the next section). For each of the three effects, we normalise the results so
that the largest value of each effect across taxpayers (which turns out always to be for the
most central taxpayer) is assigned the value unity.
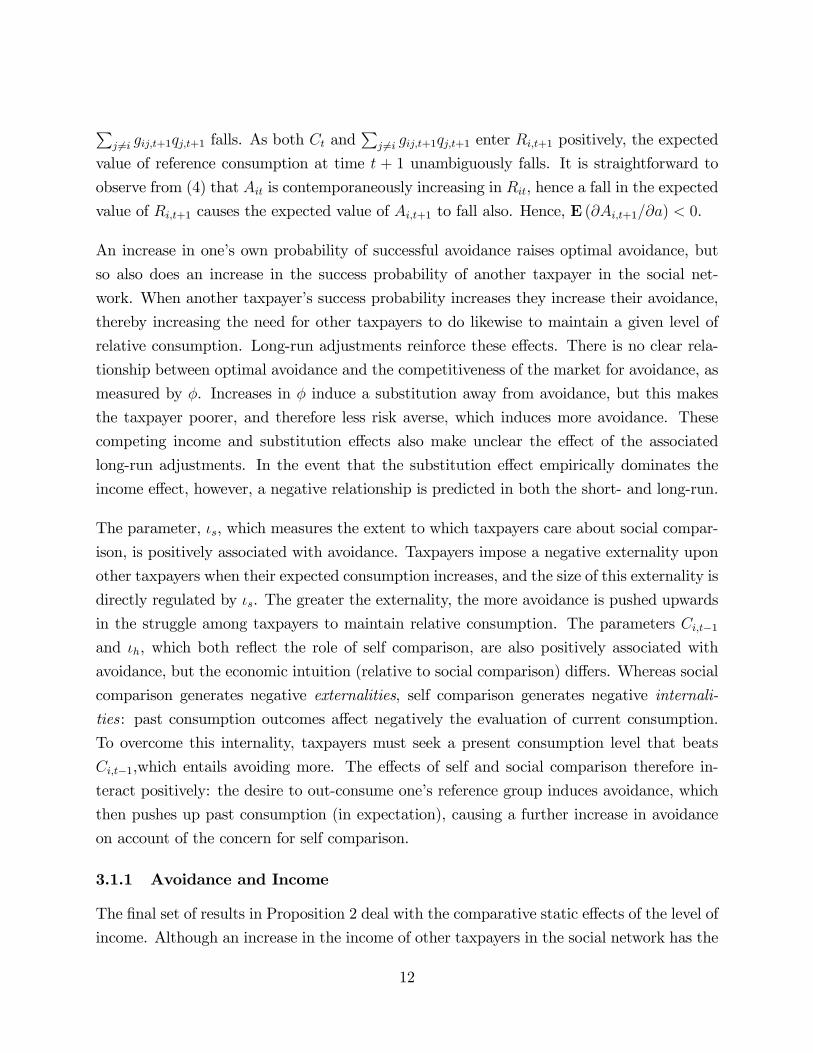
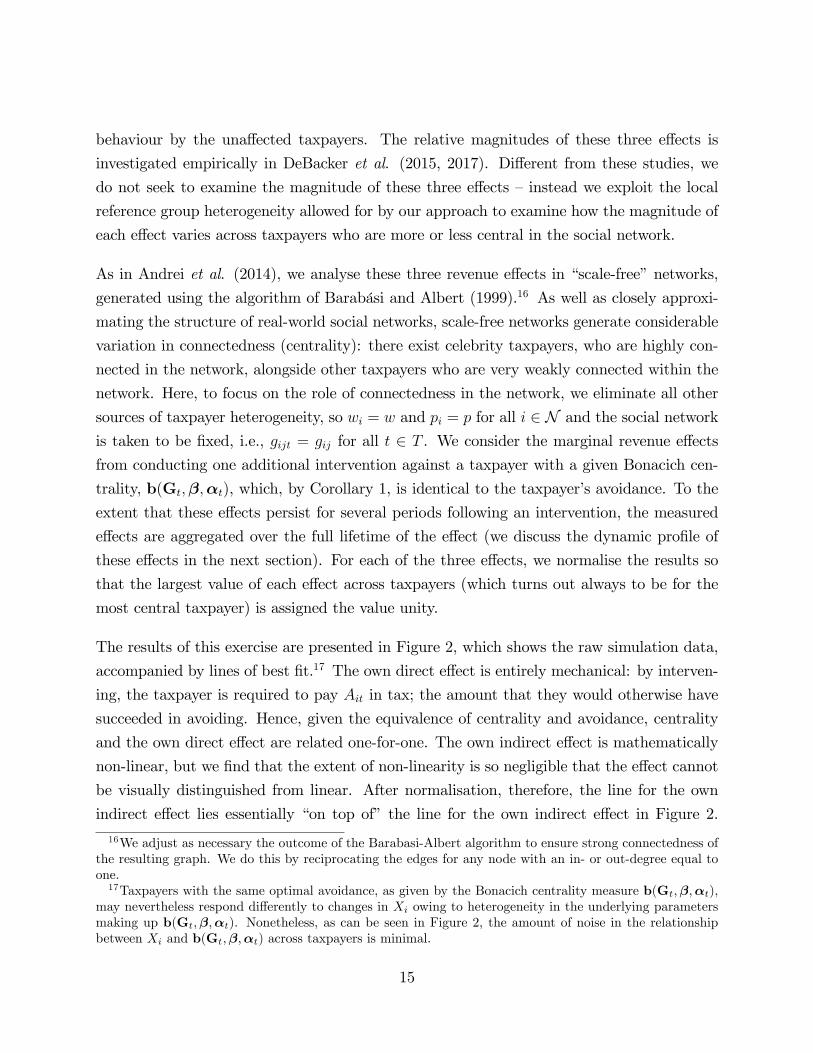
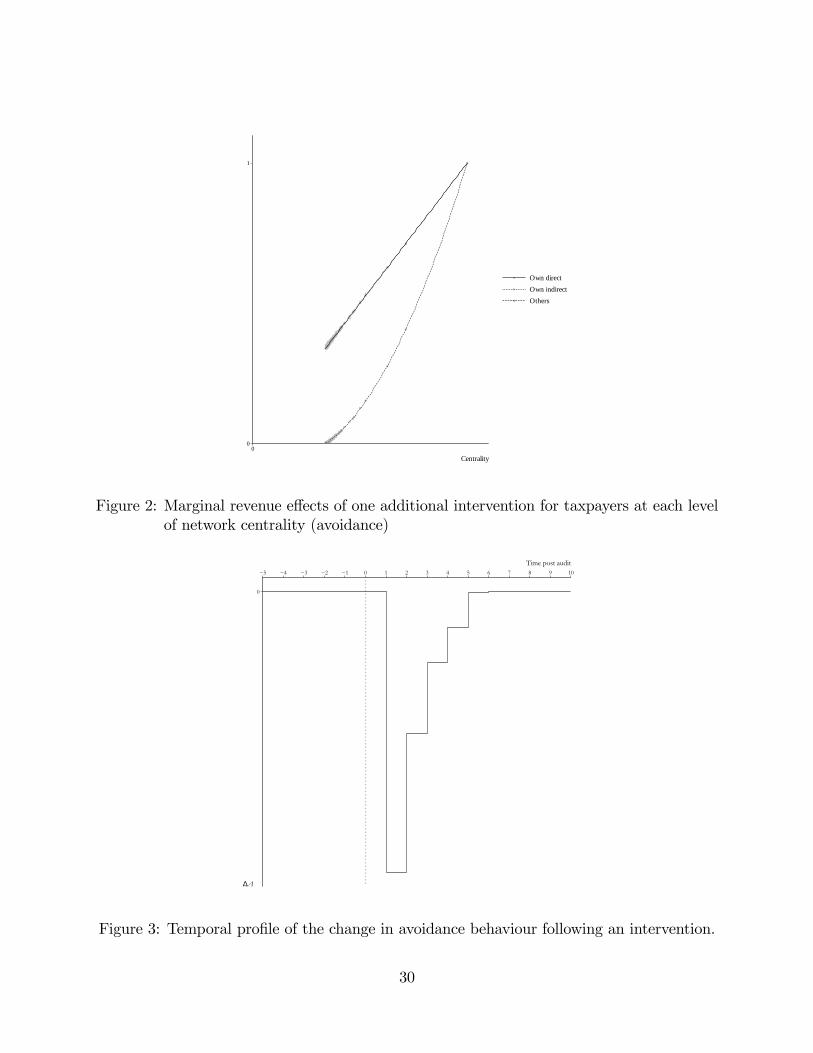
The results of this exercise are presented in Figure 2, which shows the raw simulation data,
accompanied by lines of best fit.17 The own direct effect is entirely mechanical: by interven-
ing, the taxpayer is required to pay Ait in tax; the amount that they would otherwise have
succeeded in avoiding. Hence, given the equivalence of centrality and avoidance, centrality
and the own direct effect are related one-for-one. The own indirect effect is mathematically
non-linear, but we find that the extent of non-linearity is so negligible that the effect cannot
be visually distinguished from linear. After normalisation, therefore, the line for the own
indirect effect lies essentially “on top of” the line for the own indirect effect in Figure 2.
16We adjust as necessary the outcome of the Barabasi-Albert algorithm to ensure strong connectedness ofthe resulting graph. We do this by reciprocating the edges for any node with an in- or out-degree equal toone.17Taxpayers with the same optimal avoidance, as given by the Bonacich centrality measure b(Gt,β,αt),
may nevertheless respond differently to changes in Xi owing to heterogeneity in the underlying parametersmaking up b(Gt,β,αt). Nonetheless, as can be seen in Figure 2, the amount of noise in the relationshipbetween Xi and b(Gt,β,αt) across taxpayers is minimal.
15
In contrast, the indirect effect on the avoidance of others is highly non-linear (elastic) in
centrality: the taxpayer with the lowest centrality in the network has around 35% of the
centrality of the most central taxpayer, yet commands an indirect effect on other taxpayers
of just 0.44% of that of the most central taxpayer. Ceteris paribus, it is desirable to intervene
against those taxpayers with the highest Bonacich centrality, as measured by b(Gt,β,αt),
for these taxpayers (i) engage in the most avoidance themselves; (ii) decrease their avoidance
the most following an intervention; and (iii) have the most impact on the avoidance of other
taxpayers following an intervention.
3.3 Dynamic responses to intervention
There is growing interest in understanding behavioural responses to tax authority interven-
tions. In the tax evasion context, for instance, behavioural responses to being audited have
recently been analysed from both theoretical (Bernasconi et al., 2014) and empirical (Gem-
mell and Ratto, 2012; DeBacker et al., 2015, 2017; Advani et al., 2016; Mazzolini et al., 2017)
standpoints. These studies find that audits have persistent effects on subsequent compliance
behaviour, with an effect still discernible four or more years after the initiation of an audit.
Typically, these studies emphasise the role of taxpayer learning (about the probability of
audit and the effectiveness of the audit process in detecting noncompliance) in accounting
for this phenomenon, while Dubin (2007) notes that it could be due to the delayed audit
cycle (the audit itself may not conclude for several years, and taxpayers might rationally
alter their reporting behaviour while an audit is in progress).
The analogous phenomenon to audit-response in the context of tax avoidance is the behav-
ioural response to a successful legal intervention. In our model the objective probability that
an intervention is successful is known (ruling out learning) and we disregard time lags in
the legal process (ruling out intervention cycle effects). In this context it is interesting that,
under empirically plausible assumptions concerning the evolution of habit consumption, our
model predicts a persistent behavioural effect from an intervention, albeit the effect does
disappear eventually (i.e., there is no permanent effect). In this sense, we highlight the role
of self comparison as an additional explanatory factor (to those so far considered in the
literature) in accounting for post-intervention compliance behaviour.
The best empirical evidence on habit effects is from the (behavioural) literature on the de-
terminants of wellbeing, where Di Tella et al. (2010) report adaptation effects to income
16
changes persisting for four years. For this part of the analysis, therefore, periods are inter-
preted explicitly as years. Accordingly, we here generalise habit consumption from being
just the first lag of consumption to being an autoregressive function of the first four lags of
realised consumption, with decreasing psychological weights, wt−1 > . . . > wt−4, attached
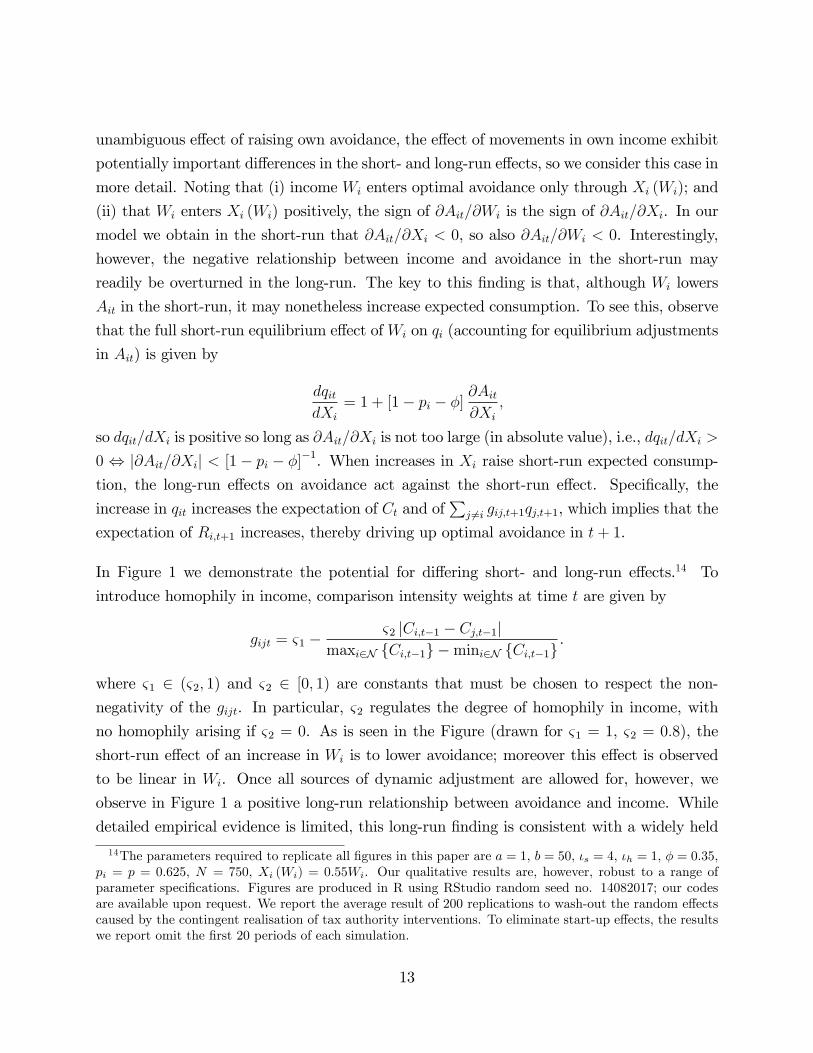
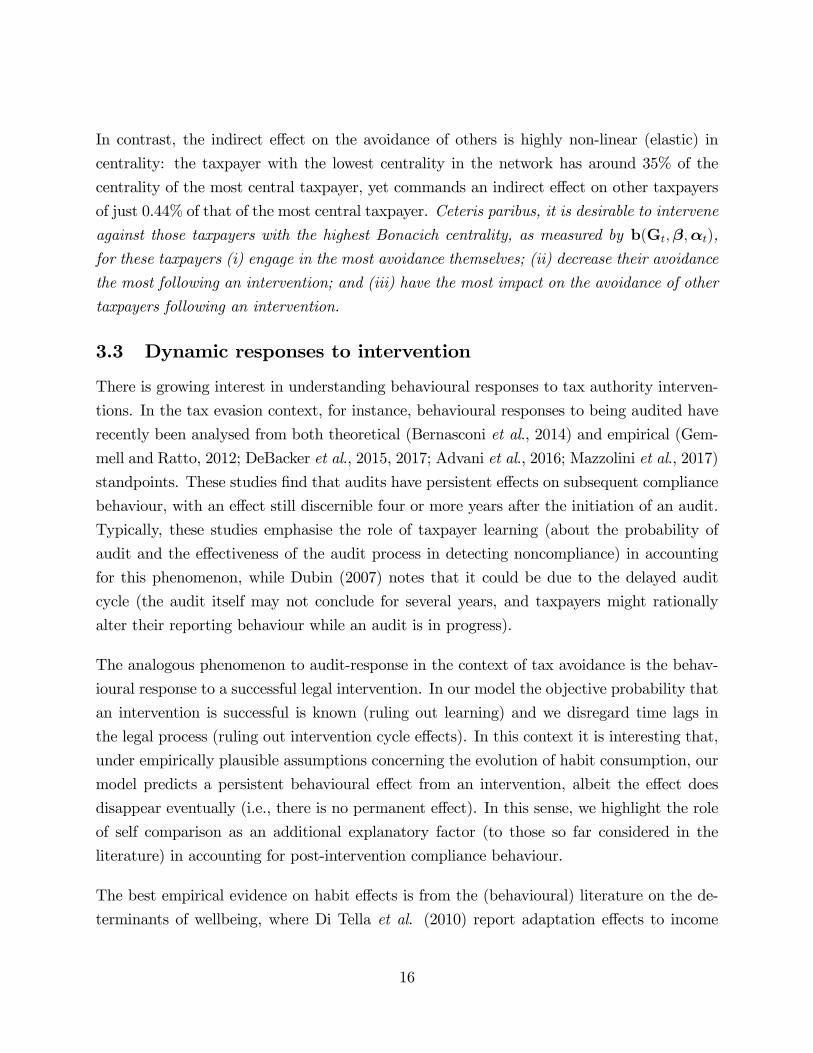
to each lag. Figure 3 reports the temporal profile of the change in avoidance (own effect)
following an intervention relative to a baseline simulation in which the intervention does not
take place. The weights used to draw Figure 3 exhibit exponential decay for longer lags
(specifically, we set wt−k = 0.5k, k = 0, . . . , 4). Avoidance is seen to fall sharply in the year
immediately after an intervention by the tax authority, as would be expected, but then to
return to approximately its baseline level in the fifth year post intervention. The indirect
effect on the avoidance behaviour of other taxpayers has a very similar dynamic profile, so
is omitted from the Figure for visual clarity.
4 Conclusion
Tax avoidance is estimated to cost, e.g., the German government, up to 34 percent of income
taxes paid (Lang et al., 1997). We link the tax avoidance decision with a large literature
on the role in individual decision-making of self and social comparison. In our model, tax-
payers compare their consumption with others in their social network, and also to their own
consumption in the recent past. Unlike earlier models that allow only for social compar-
isons at the aggregate level, each taxpayer makes “local”comparisons on their part of the
social network. Engaging in tax avoidance is a tool by which taxpayers can seek to raise
their consumption relative to others, and to their own prior consumption. In this setting,
we show that a linear-quadratic specification of utility yields a unique solution for optimal
avoidance corresponding to a weighted Bonacich centrality measure on a social network: by
this measure, taxpayers that are more central in the social network avoid more.
Our model provides a rich framework for understanding how a variety of variables, some
under the control of the tax authority, will influence avoidance behaviour. Although optimal
avoidance depends in quite a complex way on the underlying parameters, we are able in
many cases to sign unambiguously its comparative statics. We also simulated the model
to investigate its implications for intervention policy and for the dynamics of behavioural
responses to tax authority interventions. Our results show that there are objective grounds
for tax authorities to target taxpayers who are central in the network. In particular, the
revenue raised from other taxpayers following an intervention displays increasing returns
17
as a function of network centrality. We also show how the lagged adjustment of habit
consumption can lead tax authority interventions to have a relatively persistent effect on
avoidance behaviour, which does not return to baseline until around five years after the
intervention has taken place.
We finish with some possible avenues for future research. First, the comparative statics
exercises we have performed are by no means exhaustive: it would, for instance, also be of
interest to investigate systematically the effects of adding or removing links within the social
network. Second, while we have focused on tax avoidance, it seems straightforward to extend
the model to consider tax evasion behaviour, or indeed criminal activity more generally.
While these extensions must await a dedicated treatment, we hope our contribution at least
clarifies the role of self and social comparison in driving tax avoidance behaviour.
References
Addison, S. and Mueller, F. (2015). “The dark side of professions: The Big Four and tax
avoidance”, Accounting, Auditing & Accountability Journal 28(8), pp. 1263—1290.
Advani, A., Elming, W., and Shaw, J. (2016). “The dynamic effects of tax audits”. Paper
presented at the Royal Economic Society Annual Conference, Bristol, UK.
Allingham, M.G. and Sandmo, A. (1972). “Income tax evasion: A theoretical analysis”,
Journal of Public Economics 1(3-4), pp. 323—338.
Alm, J. (1988). “Compliance costs and the tax avoidance-tax evasion decision”, Public Fi-
nance Review 16(1), pp. 31—66.
Alm, J., Bahl, R., and Murray, M.N. (1990). “Tax structure and tax compliance”, Review of
Economics and Statistics 72(4), pp. 603—613.
Alm, J., Bloomquist, K.M., and McKee, M. (2017). “When you know your neighbour pays
taxes: Information, peer effects and tax compliance”, Fiscal Studies, doi: 10.1111/1475-
5890.12111
Alm, J. and McCallin, N.J. (1990). “Tax avoidance and tax evasion as a joint portfolio
choice”, Public Finance / Finances Publiques 45(2), pp. 193—200.
18
Alm, J. and Yunus, M. (2009). “Spatiality and persistence in U.S. individual income tax
compliance”, National Tax Journal 62(1), pp. 101—124.
Andrei, A.L., Comer, K., and Koelher, M. (2014). “An agent-based model of network effects
on tax compliance and evasion”, Journal of Economic Psychology 40(1), pp. 119—133.
Baldwin, R. and McKenna, A. (2014) “Well connected”, Taxation 174 (4467).
Ballester, C., Calvó-Armengol, A., and Zenou, Y. (2006). “Who’s who in networks. Wanted:
the key player”, Econometrica 74(5), pp. 1403—1417.
Barabási, A.-L. and Albert, R. (1999). “Emergence of scaling in random networks”, Science
286 (5439), pp. 509—512.
Becker, G., Murphy, K., and Werning, I. (2005). “The equilibrium distribution of income
and the market for status”, Journal of Political Economy 113(2), pp. 282—310.
Bernasconi, M., Corazzini, L., and Seri, R. (2014). “Reference dependent preferences, hedonic
adaptation and tax evasion: Does the tax burden matter?”, Journal of Economic Psychology,
40(1), pp. 103—118.
Bernasconi, M., Levaggi, R., and Menoncin, F. (2016). “Dynamic tax evasion with habit
formation”, Working Paper No. 31, Department of Economics, Ca’Foscari University of
Venice.
Blaufus, K., Bob, J., Hundsdoerfer, J., Sielaff, C., Kiesewetter, D., and Weimann, J. (2015).
“Perception of income tax rates: evidence from Germany”, European Journal of Law and
Economics 40(3), pp. 457—478.
Bloomquist, M.K. (2011). “Tax compliance as an evolutionary coordination game: An agent-
based approach”, Public Finance Review 39(1), pp. 25—49.
Bonacich, P. (1987). “Power and centrality: A family of measures”, American Journal of
Sociology 92(5), pp. 1170—1182.
Boskin, M. and Sheshinski, E. (1978). “Optimal redistributive taxation when individual
welfare depends upon relative income”, Quarterly Journal of Economics 92(4), pp. 589—601.
Bramoullé, Y. and Kranton, R. (2007). “Public goods and networks”, Journal of Economic
Theory 135(1), pp. 478—494.
19
Calvó-Armengol, A. and Jackson, M.O. (2004). “The effects of social networks on employ-
ment and inequality”, American Economic Review 94(3), pp. 426—454.
Carroll, C.D., Overland, J., and Weil, D.N. (2000). “Saving and growth with habit forma-
tion”, American Economic Review 90(3), pp. 341—355.
Carroll, C.D. and Weil, D.N. (1994), “Saving and growth: a reinterpretation”, Carnegie-
Rochester Conference Series on Public Policy 40(1), pp. 133—192.
Chapman, D.A. (1998). “Habit formation and aggregate consumption”, Econometrica 66(5),
pp. 1223—1230.
Clark, A.E., Frijters, P., and Shields, M.A. (2008). “Relative income, happiness, and utility:
An explanation for the Easterlin paradox and other puzzles”, Journal of Economic Literature
46(1), pp. 95—144.
Clark, A.E. and Senik, C. (2010). “Who compares to whom? The anatomy of income
comparisons in Europe”, Economic Journal 120(544), pp. 573—594.
Committee of Public Accounts (2013). Tax Avoidance: Tackling Marketed Avoidance
Schemes, HC 788. London: The Stationery Offi ce.
Constantinides, G.M. (1990). “Habit formation: a resolution of the equity premium puzzle”,
Journal of Political Economy 98(3), pp. 519—543.
Cowell, F.A. (1990). “Tax sheltering and the cost of evasion”, Oxford Economic Papers 42(1),
pp. 231—243.
Davis, J.S., Hecht, G., and Perkins, J.D. (2003). “Social behaviours, enforcement, and tax
compliance dynamics”, Accounting Review 78(1), pp. 39—69.
DeBacker, J., Heim, B.T., Tran, A., and Yuskavage, A. (2015). “Once bitten, twice shy? The
lasting impact of IRS audits on individual tax reporting”. Paper presented at the NBER
Public Economics Program Meeting, Cambridge, MA.
DeBacker, J., Heim, B.T., Tran, A., and Yuskavage, A. (2017). “The effects of IRS audits
on EITC claimants”, Mimeo.
Dell’Anno, R. (2009). “Tax evasion, tax morale and policy maker’s effectiveness”, Journal
of Socio-Economics 38(6), pp. 988—997.
20

Di Tella, R., Haisken-DeNew, J., and MacCulloch, R. (2010). “Happiness adaptation to
income and to status in an individual panel”, Journal of Economic Behavior & Organization
76(3), pp. 834—852.
Dubin, J.A. (2007). “Criminal investigation enforcement activities and taxpayer noncompli-
ance”, Public Finance Review 35(4), pp. 500—529.
Dybvig, P.H. (1995). “Duesenberry’s ratcheting of consumption: Optimal dynamic con-
sumption and investment given intolerance for any decline in standard of living”, Review of
Economic Studies 62(2), pp. 287—313.
Edlin, A.S. and Shannon, C. (1998). “Strict monotonicity in comparative statics”, Journal
of Economic Theory 81(1), pp. 201—219.
Ferrer-i-Carbonell, A. (2005). “Income and well-being: an empirical analysis of the compar-
ison income effect”, Journal of Public Economics 89(5-6), pp. 997—1019.
Fortin, B., Lacroix, G., and Villeval, M.-C. (2007). “Tax evasion and social interactions”,
Journal of Public Economics 91(11-12), pp. 2089—2112.
Frank, R.H. and Hutchens, R.M. (1993). “Wages, seniority, and the demand for rising con-
sumption profiles”, Journal of Economic Behavior & Organization 21(3), pp. 251—276.
Frey, B.S. and Stutzer, A. (2002). Happiness and Economics, Princeton: Princeton Univer-
sity Press.
Fuhrer, J.C. (2000). “Habit formation in consumption and its implications for monetary-
policy models”, American Economic Review 90(3), pp. 367—390.
Galí, J. (1994). “Keeping up with the Joneses: consumption externalities, portfolio choice,
and asset prices”, Journal of Money, Credit, and Banking 26(1), pp. 1—8.
Gamannossi degl’Innocenti, D. and Rablen, M.D. (2016). “Income tax avoidance and evasion:
A narrow bracketing approach”, Public Finance Review, doi:10.1177/1091142116676362
Gemmell, N. and Ratto, M. (2012). “Behavioral responses to taxpayer audits: Evidence from
random taxpayer inquiries”, National Tax Journal 65(1), pp. 33—58.
Gideon, M. (2017). “Do individuals perceive income tax rates correctly?”, Public Finance
Review 45(1), pp. 97—117.
21
Glaeser, E., Sacerdote, B., and Scheinkman, J. (1996). “Crime and social interactions”,
Quarterly Journal of Economics 111, pp. 507—548.
Goerke, L. (2013). “Relative consumption and tax evasion”, Journal of Economic Behavior
& Organization 87(1), pp. 52—65.
Gordon, J.P.P. (1989). “Individual morality and reputation costs as deterrents to tax eva-
sion”, European Economic Review 33(4), pp. 797—805.
Gruber, J. and Saez, E. (2002). “The elasticity of taxable income: evidence and implications”,
Journal of Public Economics 84(1), pp. 1—32.
Guariglia, A. and Rossi, M. (2002), “Consumption, habit formation, and precautionary
saving: evidence from the British Household Panel Survey”, Oxford Economic Papers 54(1),
pp. 1—19.
Hashimzade, N., Myles, G.D., Page, F., and Rablen, M.D. (2014). “Social networks and oc-
cupational choice: The endogenous formation of attitudes and beliefs about tax compliance”,
Journal of Economic Psychology 40(1), 134—146.
Hashimzade, N., Myles, G.D., and Rablen, M.D. (2016). “Predictive analytics and the tar-
geting of audits”, Journal of Economic Behavior & Organization 124(1), pp. 130—145.
H.M. Revenue and Customs (2016). Measuring Tax Gaps 2016 Edition: Tax Gap Estimates
for 2014-15. London: H.M. Revenue and Customs.
H.M. Treasury and H.M. Revenue and Customs (2011). Tackling Tax Avoidance. London:
H.M. Treasury and H.M. Revenue and Customs.
Hokamp, S. (2014). “Dynamics of tax evasion with back auditing, social norm updating, and
public goods provision —an agent-based simulation”, Journal of Economic Psychology 40(1),
pp. 187—199.
Hokamp, S. and Pickhardt, M. (2010). “Income tax evasion in a society of heterogeneous
agents —evidence from an agent-based model”, International Economic Journal 24(4), pp.
541—553.
Ioannides, Y. (2012). From Neighborhoods to Nations: The Economics of Social Interactions,
Princeton: Princeton University Press.
22
Jackson, M.O., Rogers, B.W., and Zenou, Y. (2017). “The economic consequences of social-
network structure”, Journal of Economic Literature 55(1), pp. 49—95.
Jackson, M.O. and Zenou, Y. (2015). Games on networks. In P. Young and S. Zamir (Eds.),
Handbook of Game Theory, Vol. 4, pp. 34—61, Amsterdam: Elsevier.
Kim, Y. (2003). “Income distribution and equilibrium multiplicity in a stigma-based model
of tax evasion”, Journal of Public Economics 87(7-8), pp. 1591—1616.
Kirchler, E., Maciejovsky, B., and Schneider, F. (2003). “Everyday representations of tax
avoidance, tax evasion, and tax flight: do legal differences matter?”, Journal of Economic
Psychology 24(4), pp. 535—553.
Koehne, S. and Kuhn, M. (2015). “Optimal taxation in a habit formation economy”, Journal
of Public Economics 122(1), pp. 31—39.
Korobow, A., Johnson, C., and Axtell, R. (2007). “An agent-based model of tax compliance
with social networks”, National Tax Journal 60(3), pp. 589—610.
Lang, O., Nöhrbaß, K.-H., and Stahl, K. (1997). “On income tax avoidance: the case of
Germany”, Journal of Public Economics 66(2), pp. 327—347.
Layard, R. (1980). “Human satisfactions and public policy”, Economic Journal 90(360), pp.
737—750.
Layard, R. (2005). Happiness. Lessons from a New Science, London: Allen Lane.
Levaggi, R. and Menoncin, F. (2012). “Tax audits, fines and optimal taxation in a dynamic
context”, Economics Letters 117(1), pp. 318—321.
Levaggi, R. and Menoncin, F. (2013). “Optimal dynamic tax evasion”, Journal of Economic
Dynamics and Control 37(11), pp. 2157—2167.
Ljungqvist, L. and Uhlig, H. (2000). “Tax policy and aggregate demand management under
catching up with the Joneses”, American Economic Review 90(3), pp. 356—366.
Loewenstein, G. and Sicherman, N. (1991). “Do workers prefer increasing wage profiles?”,
Journal of Labor Economics 9(1), pp. 67—84.
Luttmer, E.F.P. (2005). “Neighbors as negatives: Relative earnings and well-being”, Quar-
terly Journal of Economics 120(3), pp. 963—1002.
23
Manski, C.F. (1991). “Nonparametric estimation of expectations in the analysis of discrete
choice under uncertainty”. In Nonparametric and Semiparametric Methods in Econometrics
and Statistics: Proceedings of the Fifth International Symposium in Economic Theory and
Econometrics, pp. 259—275, Melbourne: Cambridge University Press.
Mazzolini, G., Pagani, L., and Santoro, A. (2017). “The deterrence effect of real-world
operational tax audits”, DEMS Working Paper no. 359, University of Milan-Bicocca.
McFadden, D. (2006). “Free markets and fettered consumers”, American Economic Review
96(1), pp. 5—29.
McPherson, M., Smith-Lovin, L, and Cook, J.M. (2001). “Birds of a feather: homophily in
social networks”, Annual Review of Sociology 27(1), pp. 415—444.
Mittone, L. and Patelli, P. (2000). “Imitative behaviour in tax evasion”. In F. Luna and B.
Stefansson (Eds.), Economic Modelling with Swarm, Ch. 5, Amsterdam: Kluwer.
Muellbauer, J. (1988), “Habits, rationality, and myopia in the life cycle consumption func-
tion”, Annals of Economics and Statistics 9(1), pp. 47—70.
Mujcic, R. and Frijters, P. (2013). “Economic choices and status: measuring preferences for
income rank”, Oxford Economic Papers 65(1), pp. 47—73.
Myles, G.D., and Naylor, R.A. (1996). “A model of tax evasion with group conformity and
social customs”, European Journal of Political Economy 12(1), pp. 49—66.
Neck, R., Wächter, J.U., and Schneider, F. (2012). “Tax avoidance versus tax evasion: On
some determinants of the shadow economy”, International Tax and Public Finance 19(1),
pp. 104—117.
Neumark, D. and Postlewaite, A. (1998). “Relative income concerns and the rise in married
women’s employment”, Journal of Public Economics 70(1), pp. 157—183.
Panadés, J. (2004). “Tax evasion and relative tax contribution”, Public Finance Review
32(2), pp. 183—195.
Piketty, T., Saez, E., and Stantcheva, S. (2014). “Optimal taxation of top labor incomes: A
tale of three elasticities”, American Economic Journal : Economic Policy 6(1), pp. 230—271.
24
Postlewaite, A. (1998). “The social basis of interdependent preferences”, European Economic
Review 42(3-5), pp. 779—800.
Quah, J.K.-H. (2007). “The comparative statics of constrained optimization problems”,
Econometrica 75(2), pp. 401—443.
Rablen, M.D. (2008). “Relativity, rank and the utility of income”, Economic Journal
118(528), pp. 801—821.
Rayo, L. and Becker, G.S. (2007). “Evolutionary effi ciency and happiness”, Journal of Po-
litical Economy 115(2), pp. 302—337.
Rigney, P. (2016). The All Seeing Eye —An HMRC Success Story? London: Institute of
Financial Accountants.
Samuelson, L. (2004). “Information-based relative consumption effects”, Econometrica 72(1),
pp. 93—118.
Sen, A. (1983). “Poor, relatively speaking”, Oxford Economic Papers 35(2), pp. 153—169.
Sikka, P. (2012). “The tax avoidance industry”, Radical Statistics 107, pp. 15—30.
Slemrod, J. (1995). “Income creation or income shifting? Behavioral responses to the tax
reform act of 1986”, American Economic Review 85(2), pp. 175—180.
Slemrod, J. (2001). A general model of the behavioral response to taxation. International
Tax and Public Finance, 8(2), pp. 119—128.
Slemrod, J. and Kopczuk, W. (2002). “The optimal elasticity of taxable income”, Journal
of Public Economics 84(1), pp. 91—112.
Srinivasan, T.N. (1973). “Tax evasion: A model”, Journal of Public Economics 2(4), pp.
339—346.
Stark, O. and Taylor, J. (1991). “Migration incentives, migration types: the role of relative
deprivation”, Economic Journal 101(408), pp. 1163—1178.
Suter, L. (2017). Taxman Unleashes Snooper Computer: What Information Does it Have on
You?, 7th January, London: Telegraph Media Group.
25
Traxler, C. (2010). “Social norms and conditional cooperative taxpayers”, European Journal
of Political Economy 26(1), pp. 89—103.
Tremblay, C.H. and Tremblay, V.J. (2010). “The neglect of monotone comparative statics
methods”, Journal of Economic Education 41(2), pp. 177—193.
Yitzhaki, S. (1974). “A note on ‘Income tax evasion: A theoretical analysis’”, Journal of
Public Economics 3(2), pp. 201—202.
Zaklan, G., Lima, F.W.S., and Westerhoff, F. (2008). “Controlling tax evasion fluctuations”,
Physica A: Statistical Mechanics and Its Applications 387(23), pp. 5857—5861.
26
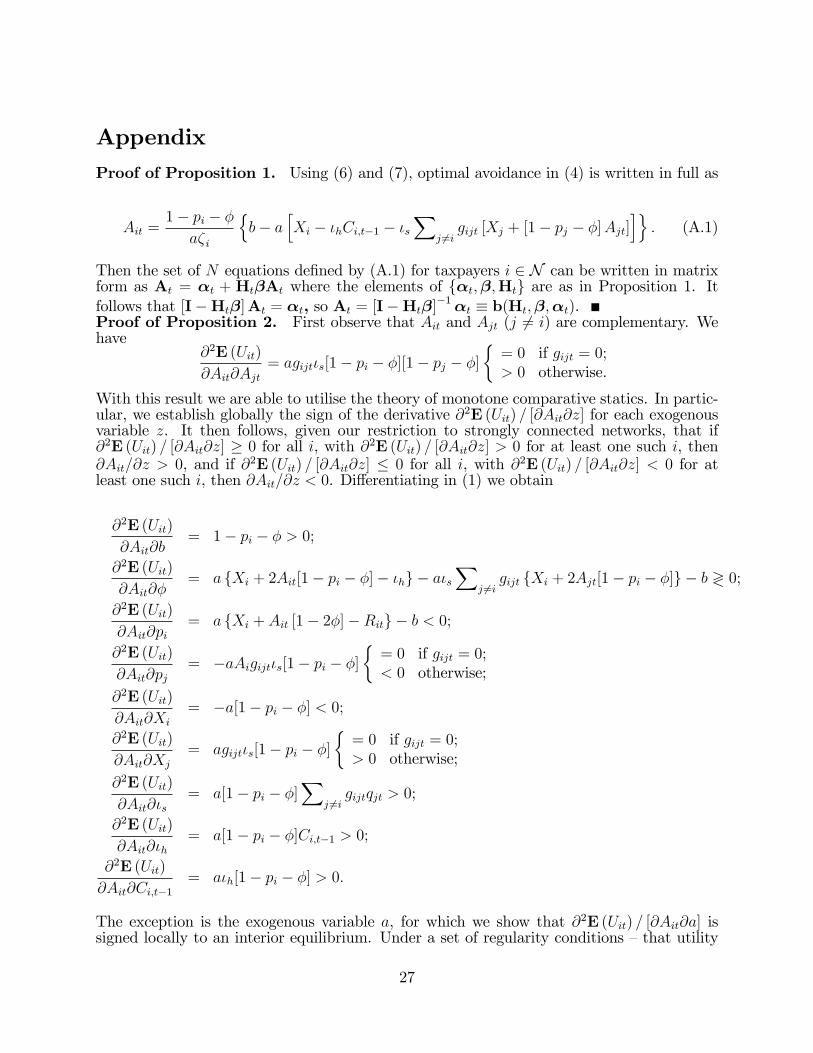
AppendixProof of Proposition 1. Using (6) and (7), optimal avoidance in (4) is written in full as
Ait =1− pi − φ
aζ i
{b− a
[Xi − ιhCi,t−1 − ιs
∑j 6=i
gijt [Xj + [1− pj − φ]Ajt]]}
. (A.1)
Then the set of N equations defined by (A.1) for taxpayers i ∈ N can be written in matrixform as At = αt + HtβAt where the elements of {αt,β,Ht} are as in Proposition 1. Itfollows that [I−Htβ]At = αt, so At = [I−Htβ]
−1αt ≡ b(Ht,β,αt).Proof of Proposition 2. First observe that Ait and Ajt (j 6= i) are complementary. Wehave
∂2E (Uit)
∂Ait∂Ajt= agijtιs[1− pi − φ][1− pj − φ]
{= 0 if gijt = 0;> 0 otherwise.
With this result we are able to utilise the theory of monotone comparative statics. In partic-ular, we establish globally the sign of the derivative ∂2E (Uit) / [∂Ait∂z] for each exogenousvariable z. It then follows, given our restriction to strongly connected networks, that if∂2E (Uit) / [∂Ait∂z] ≥ 0 for all i, with ∂2E (Uit) / [∂Ait∂z] > 0 for at least one such i, then∂Ait/∂z > 0, and if ∂2E (Uit) / [∂Ait∂z] ≤ 0 for all i, with ∂2E (Uit) / [∂Ait∂z] < 0 for atleast one such i, then ∂Ait/∂z < 0. Differentiating in (1) we obtain
∂2E (Uit)
∂Ait∂b= 1− pi − φ > 0;
∂2E (Uit)
∂Ait∂φ= a {Xi + 2Ait[1− pi − φ]− ιh} − aιs
∑j 6=i
gijt {Xi + 2Ajt[1− pi − φ]} − b ≷ 0;
∂2E (Uit)
∂Ait∂pi= a {Xi + Ait [1− 2φ]−Rit} − b < 0;
∂2E (Uit)
∂Ait∂pj= −aAigijtιs[1− pi − φ]
{= 0 if gijt = 0;< 0 otherwise;
∂2E (Uit)
∂Ait∂Xi
= −a[1− pi − φ] < 0;
∂2E (Uit)
∂Ait∂Xj
= agijtιs[1− pi − φ]{= 0 if gijt = 0;> 0 otherwise;
∂2E (Uit)
∂Ait∂ιs= a[1− pi − φ]
∑j 6=i
gijtqjt > 0;
∂2E (Uit)
∂Ait∂ιh= a[1− pi − φ]Ci,t−1 > 0;
∂2E (Uit)
∂Ait∂Ci,t−1= aιh[1− pi − φ] > 0.
The exception is the exogenous variable a, for which we show that ∂2E (Uit) / [∂Ait∂a] issigned locally to an interior equilibrium. Under a set of regularity conditions —that utility
27

is C2 and concave, U (.) > 0 for positive values of the argument, and that the problem has aunique solution that obeys the first order conditions and varies smoothly with the variableof interest (a here) —Quah (2007, p. 420) shows that signing ∂2E (Uit) / [∂Ait∂a] local tothe (unique) interior maximum is suffi cient to determine the equilibrium sign of ∂Ait/∂a. Asthese regularity conditions hold in the current context, we utilise this approach to establishthe equilibrium sign of ∂Ait/∂a. We obtain
∂2E (Uit)
∂Ait∂a
∣∣∣∣∂EUit/∂Ait=0
= − [1− pi − φ] ba
< 0.
We prove the ambiguity in sign of ∂E (∂Ai,t+1) /∂Xi ≷ 0 by example within the main text.
28
Figures
W
A
Short−run
Long−run
Figure 1: Short- and long-run comparative statics effects of an increase in taxpayer wealth.
29
●
●
●
●
●
●●
●
●
●●●●●●●●●●●●●●●●●●●●●●●●●●●●●●●●●●●●●●●●●●●●●●●●●●●●●●●●●●●●●●●●●●●●●●●●●●●●●●●●●●●●●●●●●●●●●●●●●●●●●●●●●●●●●●●●●●●●●●●●●●●●●●●●●●●●●●●●●●●●●●●●●●●●●●●●●●●●●●●●●●●●●●●●●●●●●●●●●●●●●●●●●●●●●●●●●●●●●●●●●●●●●●●●●●●●●●●●●●●●●●●●●●●●●●●●●●●●●●●●●●●●●●●●●●●●●●●●●●●●●●●●●●●●●●●●●●●●●●●●●●●●●●●●●●●●●●●●●●●●●●●●●●●●●●●●●●●●●●●●●●●●●●●●●●●●●●●●●●●●●●●●●●●●●●●●●●●●●●●●●●●●●●●●●●●●●●●●●●●●●●●●●●●●●●●●●●●●●●●●●●●●●●●●●●●●●●●●●●●●●●●●●●●●●●●●●●●●●●●●●●●●●●●●●●●●●●●●●●●●●●●●●●●●●●●●●●●●●●●●●●●●●●●●●●●●●●●●●●●●●●●●●●●●●●●●●●●●●●●●●●●●●●●●●●●●●●●●●●●●●●●●●●●●●●●●●●●●●●●●●●●●●●●●●●●●●●●●●●●●●●●●●●●●●●●●●●●●●●●●●●●●●●●●●●●●●●●●●●●●●●●●●●●●●●●●●●●●●●●●●●●●●●●●●●●●●●●●●●●●●●●●●●●●●●●●●●●●●●●●●●●●●●●●●●●●●●●●●●●●●●●●●●●●●●●●●●●●●●●●●●●●●●●●●●●●●●●●●●●●●
0
1
0
Centrality
● Own direct
Own indirect
Others
Figure 2: Marginal revenue effects of one additional intervention for taxpayers at each levelof network centrality (avoidance)
●
●
●
●
●
●
●
●
●
●
●
●
●
●
●
●
●
●
●
●
●
●
●
●
●
●
●
●
●
●
●
●
●
●
●
●
●
●
●
●
●
●
●
●
●
●
●
●
●
●
●
●
●
●
●
●
●
●
●
●
●
●
●
●
●
●
●
●
●
●
●
●
●
●
●
●
●
●
●
●
●
●
●
●
●
●
●
●
●
●
−5 −4 −3 −2 −1 0 1 2 3 4 5 6 7 8 9 10
0
Time post audit
∆A
Figure 3: Temporal profile of the change in avoidance behaviour following an intervention.
30