TAX AGENTS SEMINAR Fazrul Rahman Acting General Manager ... · TAX AGENTS SEMINAR Fazrul Rahman...
17
TAX AGENTS SEMINAR Fazrul Rahman Acting General Manager Taxation FRCA
-
Upload
truonglien -
Category
Documents
-
view
223 -
download
3
Transcript of TAX AGENTS SEMINAR Fazrul Rahman Acting General Manager ... · TAX AGENTS SEMINAR Fazrul Rahman...
TAX AGENTS SEMINAR
Fazrul Rahman Acting General Manager Taxation
FRCA

Objective
The objectives of this presentation are to provide an overview of tax policy reforms and explain policy intentions behind the new Income Tax Act.
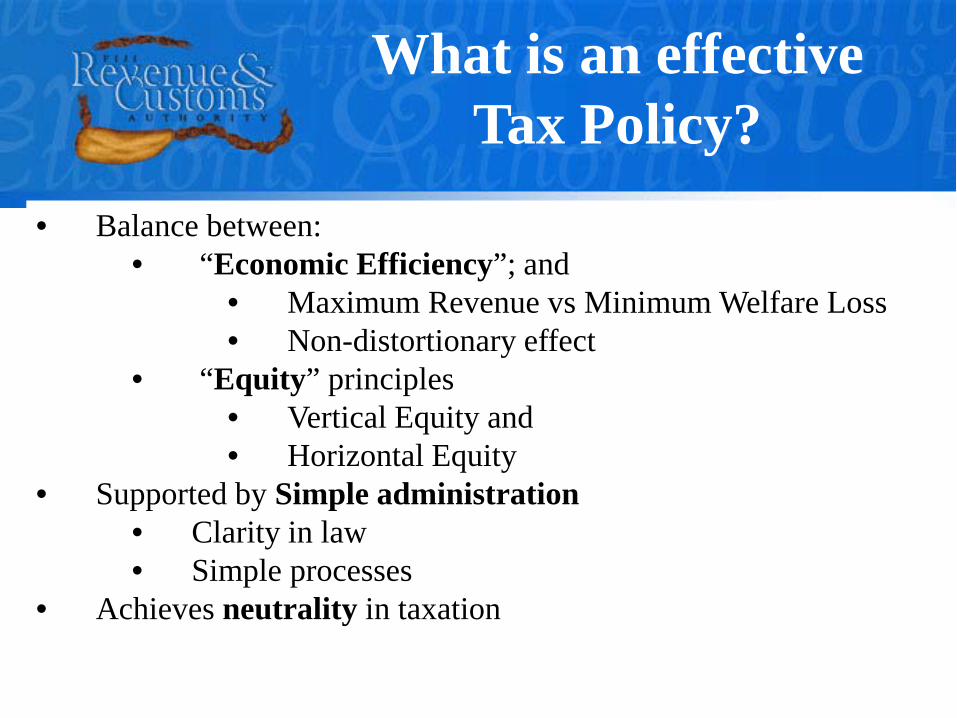
• Balance between: • “Economic Efficiency”; and
• Maximum Revenue vs Minimum Welfare Loss • Non-distortionary effect
• “Equity” principles • Vertical Equity and • Horizontal Equity
• Supported by Simple administration • Clarity in law • Simple processes
• Achieves neutrality in taxation
What is an effective Tax Policy?
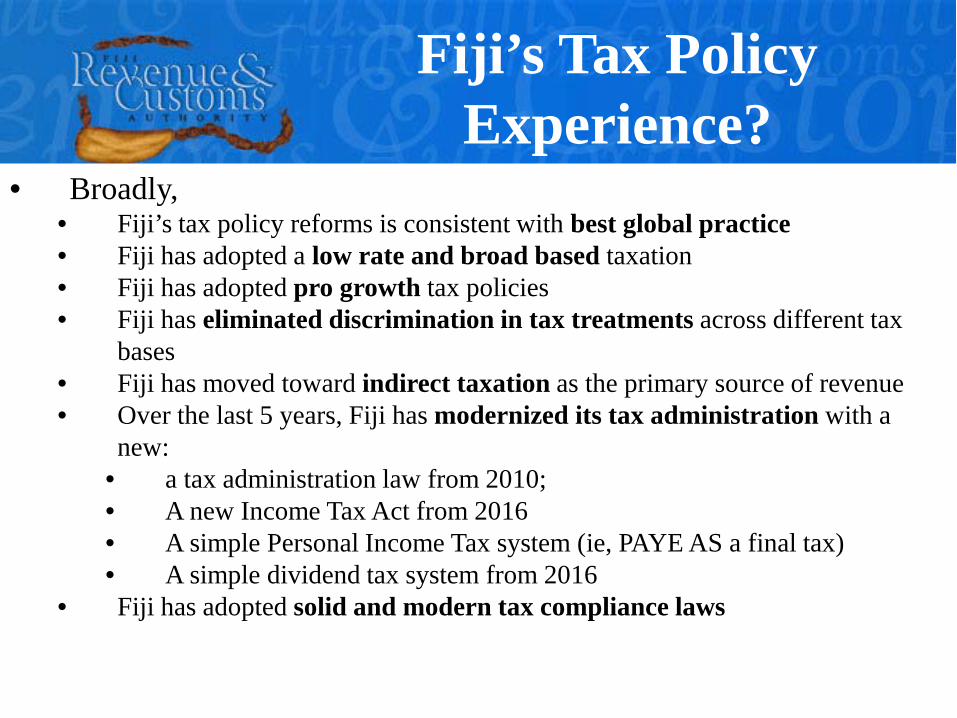
• Broadly, • Fiji’s tax policy reforms is consistent with best global practice • Fiji has adopted a low rate and broad based taxation • Fiji has adopted pro growth tax policies • Fiji has eliminated discrimination in tax treatments across different tax
bases • Fiji has moved toward indirect taxation as the primary source of revenue • Over the last 5 years, Fiji has modernized its tax administration with a
new: • a tax administration law from 2010; • A new Income Tax Act from 2016 • A simple Personal Income Tax system (ie, PAYE AS a final tax) • A simple dividend tax system from 2016
• Fiji has adopted solid and modern tax compliance laws
Fiji’s Tax Policy Experience?
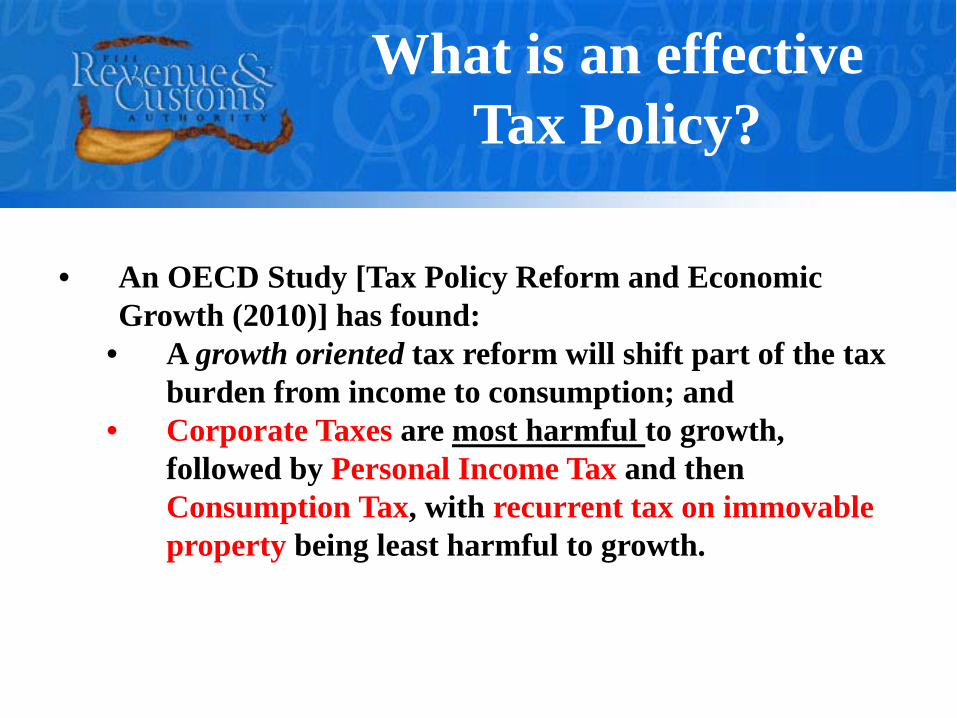
• An OECD Study [Tax Policy Reform and Economic Growth (2010)] has found:
• A growth oriented tax reform will shift part of the tax burden from income to consumption; and
• Corporate Taxes are most harmful to growth, followed by Personal Income Tax and then Consumption Tax, with recurrent tax on immovable property being least harmful to growth.
What is an effective Tax Policy?
0
1,000,000,000
2,000,000,000
3,000,000,000
4,000,000,000
5,000,000,000
6,000,000,000
7,000,000,000
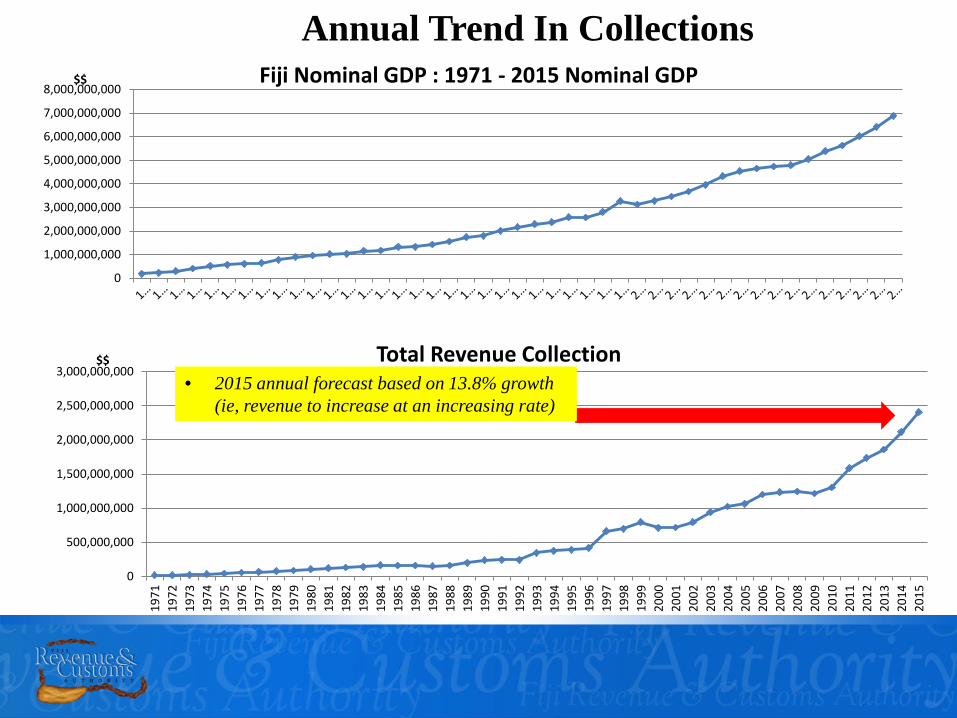
8,000,000,000$$ Fiji Nominal GDP : 1971 - 2015 Nominal GDP
0
500,000,000
1,000,000,000
1,500,000,000
2,000,000,000
2,500,000,000
3,000,000,000
1971
1972
1973
1974
1975
1976
1977
1978
1979
1980
1981
1982
1983
1984
1985
1986
1987
1988
1989
1990
1991
1992
1993
1994
1995
1996
1997
1998
1999
2000
2001
2002
2003
2004
2005
2006
2007
2008
2009
2010
2011
2012
2013
2014
2015
$$ Total Revenue Collection
Annual Trend In Collections
• 2015 annual forecast based on 13.8% growth (ie, revenue to increase at an increasing rate)

YEAR Income Tax VAT Customs Others Total 1982 58.2 41.8 100 1992 44.6 16.5 38.9 - 100 1993 36.5 29.3 34.2 - 100 2002 34.1 34.8 31.1 - 100 2010 32.7 38.0 26.9 2.4 100 2012 27.3 38.7 21.2 12.8 100
Fiji Tax Trends (10 year intervals)

Tax Mix (last 15 years)
Income Tax
40.3%
VAT 29.2%
Trade 30.5%
Revenue Mix 2000
Income Tax 31%
VAT 40%
Trade Taxes 29%
Revenue Mix 2004
21%
37% 24%
3% 6% 2% 7%
Re venue Mix 2015
Income Tax VAT Trade Taxes
STT Departure tax Resouce Tax
Others

20%
Global average: 30.6%
0%
10%
20%
30%
40%
50%
60%
70%
Finl
and
Japa
nN
orw
ayIc
elan
dA
ustra
liaU
nite
d K
ingd
omZi
mba
bwe
Luxe
mbo
rgM
ali
Sout
h A
fric
aSw
itzer
land
Kor
ea (S
outh
)A
rgen
tina
Bar
bado
sIn
dia
New
Zea
land
Indo
nesi
aM
exic
oC
anad
aB
razi
lSa
moa
Nig
eria
Fiji
Sing
apor
eTo
nga
Ukr
aine
Mau
ritiu
sY
emen
Jord
anTi
mor
Les
teK
azah
ksta
nM
onte
negr
oG
uate
mal
a
Personal Income Tax Rate

• Tax system is made truly progressive
Personal Income Tax
Chargeable Income Tax Payable 1992
0 -4,500 Nil
4,501 – 7,000 Nil + 15% of excess of $4,500
7,001 – 15,000 375 + 25% of excess of $7,000
15,001 2,375 + 35% of excess of $15,000
Chargeable Income ($) Tax Payable 2011
0-15,000 Nil 15,001-15,600 Nil + 15% of excess of $4,500 15,601-22,000 375 + 25% of excess of $7,000
22,001+ 2,375 + 35% of excess of $15,000

2014 Tax Table
Fiji’s Tax Policy Experience?
Chargeable Income ($) PAYE Tax Payable ($) Social Responsibility Tax (SRT) Payable
0-16,000 Nil
16,001 – 22,000 7% of excess over $16,000
22,001– 50,000 420 +18% of excess over $22,000
50,001 – 270,000 5,460 +20% of excess over $50,000
270,001 - 300,000 49,460 + 20% of excess over $270,000 23% of excess over $270,000
300,001 - 350,000 55,460 +20% of excess over $300,000 6,900 + 24% of excess over $300,000
350,001 - 400,000 65,460 + 20% of excess over $350,000 18,900 + 25% of excess over $350,000
400,001 - 450,000 75,460 + 20% of excess over $400,000 31,400 + 26% of excess over $400,000
450,001 – 500,000 85,460 + 20% of excess over $450,000 44,400 + 27% of excess over $450,000
500, 001 – 1,000,000 95,460 + 20% of excess over $500,000 57,900 + 28% of excess over $500,000
1,000,001 + 195,460 + 20% of excess over $1,000,000 197,900 + 29% of excess over $1,000,000
• What has changed? Tax threshold increased by more than 3 fold and SRT applies on high income.

Fiji’s Tax Policy Experience?
0.00%5.00%
10.00%15.00%20.00%25.00%30.00%35.00%40.00%45.00%50.00%
1974 1976 1978 1980 1982 1984 1986 1988 1990 1992 1994 1996 1998 2000 2002 2004 2006 2008 2010 2012 2014
Resident Corporate Income Tax rate Resident Personal Income Tax rate
0
2000
4000
6000
8000
10000
12000
14000
16000
1974
1975
1976
1977
1978
1979
1980
1981
1982
1983
1984
1985
1986
1987
1988
1989
1990
1991
1992
1993
1994
1995
1996
1997
1998
1999
2000
2001
2002
2003
2004
2005
2006
2007
2008
2009
2010
2011
2012
2013
2014
Income Tax Exemption Threshold ($)
• Tax Rates Coming Down
• Income Tax Exemption Threshold going up

20%
Global Average: 24%
0%
5%
10%
15%
20%
25%
30%
35%
40%
45%
50%
Uni
ted
Stat
esJa
pan
Arg
entin
aSu
dan
Zam
bia
Sint
Maa
rten
Ven
ezue
laIn
dia
Fran
ceIta
lyA
ustra
liaM
ali
Mex
ico
Nig
eria
New
Zea
land
Sout
h A
fric
aSr
i Lan
kaSa
moa
Can
ada
Zim
babw
eB
arba
dos
Bra
zil
Indo
nesi
aTo
nga
Indo
nesi
aK
orea
(Sou
th)
Uni
ted
Kin
gdom Fi
jiSw
itzer
land
Sing
apor
eR
oman
iaM
aurit
ius
Tim
or L
este
Qat
arPa
raqu
ay
Corporate Tax Rate

14
Year Tariff Structure Bands
2009 - 2012 0, 5%,15%,32% 4
2008 0,5%,15%,27% 4
2006 & 2007 0,3%,15%,27% 4
2005 0%,3%,15%,27% 4
2004 0%, 3%, 15%, 27% 4
2003 0%, 3%, 10%, 15%, 20%, 27% 6
2002 0%, 3%, 10%, 15%, 20%, 27% 6
2001 0%, 3%, 10%, 15%, 20%, 27% 6
2000 0%, 10%, 15%, 27% 4
1999 0%, 10%, 15%, 27% 4
1998 0% 10%, 20%, 22.5%, 35%, 60%, 75% Note: Due to Devaluation, the bands were temporarily restructured as follows:-
0%, 9.5%, 15%, 30%, 45%, 62%
7 6
1997 0%, 10%, 22.5%, 35%, 60%,75% 6
1996 0%, 5%, 10%, 15%, 17.5%, 22.5%, 30%, 35%, 50%, 60% 10
1995 0%, 10%, 20%, 22.5%, 60%, 80% 6
1994 0%,5%, 10%, 20%, 25%, 65%, 35%, 30%, 25%, 10%, 50%, 60%, 80% 13
1993 0%,5%,7.5%, 10%, 25%, 65%, 35%, 30%, 25%, 10%, 60%, 100% 11
1992 0%, 5%, 7.5%, 10%, 15%, 20%, 25%, 30, 35%, 70%, 75% 11
1991 0%,5%,7.5%, 10%, 25%, 30%, 40%, 50% 6
1990 0%,5%,7.5%, 15%,20%,25%, 30%,40%, 50%,60%,80%,190% 12
1989 0%,5%, 7.5%,10%,15%, 20%,25%,30%,35%,40%,45%,50%,55%, 60%,70%,80%90%,200%, 18
1988 0%, 7.5%, 20%,25%,30%,35%,40%, 50%,60%,80%,70%,75%,185% 13

• Tax Administration Decree • First part of legislative reform • Harmonized the administrative provisions
• New Income Tax Act • Second part of the legislative reform • A rewrite of the substantive provision • A simple single tax code covering income tax, capital gains tax
and fringe benefits tax with harmonized rules • Based on modern drafting language
Fiji’s Tax Policy Experience?

• New Income Tax Act • Supports both domestic and foreign investment with clear rules
• Internalized the foreign tax credit • Clear source and residency rules • Closer alignment with treaty rules such as PE • Depreciation options • Amortization on intangibles deductions allowed • Mining Provisions
• Supports SMEs • Presumptive tax regime
• Improves tax compliance • Thin capitalization • Transfer Pricing rules • Trust rules
Fiji’s Tax Policy Experience?

Thank You