Taunton & S Somerset viab · Affordable Housing Site Viability Study Page ii 8. The sites were...
157
Taunton & South Somerset Housing Market Areas Strategic Housing Land Viability Assessment February 2009 Final Report
Transcript of Taunton & S Somerset viab · Affordable Housing Site Viability Study Page ii 8. The sites were...

Taunton & South Somerset
Housing Market Areas
Strategic Housing Land
Viability Assessment
February 2009
Final Report


Execut ive Summary
Page i
Executive Summary
1. Fordham Research was commissioned by the four Councils to carry out a study of
affordable housing viability in the two Housing Market Areas (HMAs) of Taunton & South
Somerset. The viability study formed part of a wider Strategic Housing Market Assessment
for these areas. It was intended to inform ongoing work on the preparation of Local
Development Frameworks, by examining the impact on housing viability of alternative
levels of affordable housing requirement.
2. The study involved preparing financial appraisals for a number of actual (permitted or
proposed) and notional housing sites in the two HMAs. The appraisals were designed to
assess the impact on development viability of alternative requirements for affordable
housing provision. Viability would be examined for a range of sites in a variety of
development situations. A ‘modelling’ approach was taken, using bespoke spreadsheet
software.
3. In discussions the four Councils had developed a nine-category site typology. Using this
they identified a combination of twelve ‘actual’ sites together with seven notional sites
(identical to an actual site but located elsewhere), for testing. The sites ranged in size from
two to 300+ dwellings.
4. Of the actual sites, eight had been permitted and reached construction stage; three others
were permitted or otherwise resolved to permit. An application for the remaining site was
expected imminently. Reflecting the selection typology, the sites were a mixture of
greenfield, and previously developed land.
5. The twelve actual sites provided just over 800 dwellings, at densities ranging from 20 to
104 dwellings per ha.
6. All of the actual sites (except one) were subject to a comparatively recent planning
application, the details of the development proposals were used in carrying out appraisals.
For the site with no application, a schedule of proposed accommodation which had been
made available in advance was used.
7. The development proposals provide for a considerable mixture of development types and
situations. We normally find that development densities (measured in terms of sq ft per acre
or sq m per ha point to a ‘baseline’ urban density of around 15,000-15,500 sq ft per acre
(3,450-3,550 sq m per ha). In fact, three of the actual sites produce densities in this range;
three more rural/edge of town sites have densities a little below this range, and five a little
above; one site has a significantly higher, inner urban density reflecting a three storey
apartment built form.

Affordable Hous ing Si te Viab i l i ty Study
Page ii
8. The sites were tested with no affordable housing, and for options of 15%, 30%, and 45%
affordable housing. In each case the affordable housing was assumed to be a combination
of social rented and intermediate housing; options for a 60/40 split and 80/20 split were
both tested. The intermediate housing was expected to achieve the target outgoings for
intermediate housing being proposed in the parallel SHMA study.
9. The affordable housing was to be provided on the basis of zero Social Housing Grant.
Advice was sought from Councils’ partner RSLs about appropriate selling prices with zero
grant. We also considered appropriate levels for the total cost of other planning gain
contributions which might apply for each of the sites, using a combination of the actual
contributions secured or sought - where available - and an assessment of what might be
sought today. As an alternative to this approach we also considered a tariff type approach,
with the overall figure being set at two levels of £13,000 and £20,000 per dwelling
respectively.
10. The local market for residential development was examined. There is a fair supply of
newbuild housing across the area as a whole. Prices vary quite widely within the area,
being highest in some of the smaller towns and villages, and lowest in all or parts of the
main towns. Prices in the most expensive areas are more than half again of those in the
cheapest. Taking into account current selling prices on schemes across the Market Area,
we determined price levels for flats and houses on each site.
11. We also looked at evidence in respect of land values for appropriate alternative uses for the
sites.
12. We considered assumptions in respect of development costs and the other financial and
site assumptions required to carry out appraisals. Abnormal costs were expected to arise
on several sites. Appropriate assumptions to determine the building programme for each
site were determined.
13. Appraisals for each site were produced in respect of all of the affordable options. They used
a bespoke spreadsheet based financial analysis package. The approach was to determine
the residual land value, i.e. what value the site would have after taking into account the
costs of development, the likely income from sales and/or rents, and an appropriate amount
of developer’s profit. In order for the proposed development to be viable, the residual value
must exceed the value from a valid alternative use.
14. The appraisals showed that with no requirement for affordable housing, the sites delivered
land values between about £100k and £1.2 m per acre (£250k-£3.0m per ha). These
results were somewhat below what VOA published data and information on locally available
small plots suggested local values for ‘oven ready’ land would be. The appraisals are
therefore felt much more likely to present a ‘worst case’ than to be unduly optimistic.

Execut ive Summary
Page iii
15. As increasing amounts of affordable housing are introduced, the land value falls away.
About half of the sites still achieved a positive land value with the highest requirement of
45% affordable housing. However on some sites, those with highest densities, land value
falls away much more quickly as the affordable contribution increases. On such sites the
land value, the main source of the affordable contribution, is a much lower proportion of the
scheme’s total cost. Since land value is the main means of providing ‘developer subsidy,’
this means that it cannot go as far on high density schemes as with a low density
development.
16. Whether each individual option produces a viable outcome will depend on the land value
from alternative uses. For the identified sites the alternative use was normally either
industrial, agricultural or garden land. Of these, industrial use was assumed to have the
highest alternative use value, ranging from £285k per acre (£600k per ha) in the three
larger towns down to £175k per acre (£430k per ha) in the two smaller settlements where it
applied. Agricultural use was the least valuable at £25k per ha/£10k per acre. Unused
garden land was assumed to be worth £100k per acre (£250k per ha). One site, a former
car park, was assumed to have a comparatively high existing use value of £300k per acre
(£750k per ha).
17. This information, adjusted for any abnormal development costs that would still arise in the
alternative use, was used to deduce whether the individual sites were viable at different
levels of affordable housing provision. The results showed that one notional site was
unviable even with 100% market housing. Of the 19 sites i.e. including the latter, 13 could
produce 15% affordable housing and remain viable, plus two which were classed as
marginal because although there was a surplus over alternative use value, this did not
provide a sufficient ‘cushion’ to bring the site forward. At 30% this and two additional sites
became unviable, and one more became marginal. By 45%, only four sites remained viable
(plus four marginals).
18. Alternative appraisals were prepared assuming developer contributions at £13k and £20k
per dwelling. The greater financial burden these imposed impacted on viability, particularly
for the smaller sites; with the lower rate only six sites were fully viable at 30% affordable,
falling to five for the higher rate.
19. Councils will need to consider these findings carefully in formulating policy targets in
emerging Local Development Documents. Their impact is considered further in Chapter 29
of the main SHMA study, where practical proposals for appropriate targets are set out.
20. Stakeholders contributed to the production of the study, and their contribution was
invaluable. There were disagreements in some areas and where this was so, we have
endeavoured to highlight the issue. A key area of disagreement was with how much
account should be taken of the costs of bringing land forward for development, which under
the former Local Plan system could at times be quite considerable.

Affordable Hous ing Si te Viab i l i ty Study
Page iv

Table of Con tents
Page i
TABLE OF CONTENTS
Executive Summary ........................................................................................................... i
List of abbreviations ........................................................................................................ iii
Preamble ............................................................................................................................1
1. Introduction....................................................................................................................3
National guidance ....................................................................................................................................... 3
Housing market downturn........................................................................................................................... 4
Fordham Research ..................................................................................................................................... 5
Structure of this report ................................................................................................................................ 5
2. Individual development sites........................................................................................7
Introduction ................................................................................................................................................. 7
Two market areas ....................................................................................................................................... 7
Identifying a range of sites.......................................................................................................................... 7
The actual sites........................................................................................................................................... 9
Development assumptions ....................................................................................................................... 11
3. Affordable housing and other developer contributions...........................................13
Introduction ............................................................................................................................................... 13
Affordable housing assumptions............................................................................................................... 13
Other developer contributions................................................................................................................... 17
4. Local market conditions .............................................................................................19
Introduction ............................................................................................................................................... 19
Issues to consider ..................................................................................................................................... 19
The residential market .............................................................................................................................. 20
Price assumptions for financial appraisals ............................................................................................... 23
Land values............................................................................................................................................... 24
Current and alternative use values ........................................................................................................... 26
5. Assumptions for viability analysis.............................................................................31
Introduction ............................................................................................................................................... 31
Development costs ................................................................................................................................... 31
Financial and other appraisal assumptions .............................................................................................. 35
Site acquisition and disposal costs ........................................................................................................... 37
Alternative use value comparison............................................................................................................. 38

Affordable Hous ing Si te Viab i l i ty Study
Page ii
6. Results of viability analysis........................................................................................39
Introduction ............................................................................................................................................... 39
Financial appraisal approach and assumptions ....................................................................................... 39
Appraisal results: ...................................................................................................................................... 39
Alternative use benchmarks ..................................................................................................................... 41
Comparison results ................................................................................................................................... 45
Community Infrastructure Levy................................................................................................................. 47
7. Implications of results.................................................................................................49
Our approach ............................................................................................................................................ 49
Implications of appraisal results................................................................................................................ 50
Individual Council areas: guidance ........................................................................................................... 52
Appendices ......................................................................................................................53
Appendix 1. Newbuild schemes .....................................................................................55
Appendix 2. House price variations...............................................................................59
Appendix 3. Additional appraisals : 35% target............................................................63
Appendix 4. Variant appraisals : community infrastructure levy ................................65
Appendix 5. Financial appraisal summaries .................................................................69

Lis t o f abbrev ia t ions
Page i i i
List of abbreviations
£ k thousand pounds
£ m million pounds
dw dwelling
dwgs dwellings
ft foot
ha hectare
m metre
Q1 Quarter 1
sq square


Preamble
Page 1
Preamble
1. It is a requirement of Planning Policy Statement 3 (PPS3) that a target is set for the proportion
of affordable housing to be delivered through new developments. This target should reflect not
only the need for affordable housing but also the impact on the viability of new development of
including affordable housing. This study responds to that requirement. It uses a methodological
approach which is easily ‘updatable’, allowing the targets to be periodically revisited and
reviewed.
2. This work is part of a wider study, Strategic Housing Market Assessments (SHMAs) for the two
housing market areas of Taunton & South Somerset. The SHMAs will now provide input into
ongoing work on preparation of Local Development Frameworks for each of the Districts.
3. Based on an assessment of the balance between the need for market housing and the need for
affordable housing, the SHMAs found the levels of need suggested targets for the amounts of
affordable housing to be provided in new projects of around 35% in the South Somerset
Housing Market Area (HMA) and 40% in the Taunton HMA. However, these targets do not take
account of the commercial factors of what it is viable and realistic for developers to be asked to
provide. The 35% and 40% targets are the correct targets to balance the overall housing
market over time – but may not be the appropriate targets now.
4. The purpose of this viability study is to enable the councils to set robust targets for affordable
housing policy which reflect current commercial circumstances. It is important to note that the
actual amount of affordable housing to be achieved on any specific site must be assessed for
that actual site, and will take into the particular factors of developing that site at that point of the
economic cycle. Any such assessment will not only take into account the normal costs of
developing that site (including on one hand S106 and Community Infrastructure Levy (CIL)
payments and on the other the availability of grants and subsidies), but also the abnormal costs
(such as off-site highways works etc).
5. The availability and cost of land is at the core of the viability of any development of new
houses. The fact that a developer has ‘over paid’ for a site will not excuse them from providing
affordable housing – and likewise the fact that they have underpaid will not require him to
provide more. It has been recognised by stakeholders that in the current development and
planning regime the cost of meeting S106 requirements and the provision of affordable housing
is a factor in development appraisals and does impact on land values.

Taunton & South Somerset Af fordable Hous ing Si te Viab i l i ty Study
Page 2
6. This study is to inform the setting the current target in a robust way. Since the work was first
commissioned, it has become clear that the targets which are set in Local Development
Frameworks (LDFs) will need to be reviewed regularly to reflect changes in the general viability
of development. The housing market has declined markedly since early 2008, and continues to
do so, which makes it absolutely essential that the findings are regularly reviewed. At the
conclusion of the study the financial software package is to be made available to the four
Councils, with training. This will enable the study results to be reviewed and updated regularly,
in house, so as to ensure ongoing support for the emerging and eventual plan policies.
7. We would like to take this opportunity to thank all the stakeholders that have contributed to this
report (and the SHMA process generally). During the preparation of this report a wide range of
views were expressed. The contribution of all stakeholders, especially the house builders has
been invaluable. Where agreement was not reached on substantive points we have made a
judgement, and highlighted the various views expressed. Agreement was reached on all points
other than around that of land prices used in the viability study where differences remain over
how much account should be taken of the costs of promoting, assembling and bringing land
forward for development. It has not been possible to reach agreement on several substantive
matters affecting viability and in these cases the text of this report represents the Fordham
Research’s considered opinion. We have identified these areas of disagreement in the text of
the report.
8. Part of the reason for the diversity of views in this area is due to the change from the old local
plan system to the new Local Development Framework system. We acknowledge that in the
past the business of promoting land through the local plan system could often be protracted
and expensive. The new LDF system is less complicated, and whilst the costs of land
assembly will remain, the costs – and therefore the risks – of promoting will be substantially
less. We have taken the view that it is correct to base this study on the LDF system rather than
the historic local plan system. Several land promoters in the Partnership expressed the view
that this assumption had yet to be proved. They pointed out that all previous changes to the
Planning System, ostensibly made with the intention of speeding the process and reducing
costs for applicants, had actually had the opposite effect, and they contend that there is no
basis for the assumption made.

1. In t roduct ion
Page 3
1. Introduction
1.1 Fordham Research was commissioned by the four Councils in April 2008, to produce
guidance on the financial viability implications of alternative targets and size thresholds for
affordable housing provision within the combined area. This study is structured so as to be
easily updatable so to allow the targets to be periodically revised.
1.2 This work formed part of a wider study, Strategic Housing Market Assessments (SHMAs)
for the two housing market areas of Taunton & South Somerset. The SHMAs were being
carried out in parallel, to develop an understanding of local housing markets in this sub-
region, to build a picture of housing needs and requirements, and to suggest appropriate
targets for housing provision based on this analysis. The SHMAs will provide input into
ongoing work on preparation of Local Development Frameworks for each of the Districts.
1.3 The viability study will ensure that advice on targets in the main SHMAs are supported by
rigorous analysis showing that the targets can be achieved without undermining site
viability and imperilling the delivery of housing provision overall. Like the main study, it is
being produced with the benefit of involvement from stakeholders.
1.4 This study is to inform the setting the current target in a robust way. This target will need to
be reviewed regularly to reflect changes in the profitability of development. The housing
market has declined markedly during the period of this study – and continues to do so, it is
therefore essential that the findings are regularly reviewed.
National guidance
1.5 Guidance on affordable housing policy issues is now provided by PPS3.
1.6 Whilst from 2000 onwards the earlier guidance, Planning Policy Guidance 3 (PPG3),
recognised the need to take into account the economics of development when setting
affordable housing targets and negotiating contributions from developers, PPS3 further
reinforces this message. It suggests that Local Development Documents (LDDs) should set
an overall target for the amount of affordable housing to be provided, which should:
‘&.reflect an assessment of the likely economic viability of land for housing within the area,
taking account of the risks to delivery and drawing on informed assessments of the likely
levels of finance available for affordable housing, including public subsidy and the level of
developer contribution that can reasonably be secured.’ (S29)

Taunton & South Somerset Af fordable Hous ing Si te Viab i l i ty Study
Page 4
1.7 LDDs should also set out the range of circumstances in which affordable housing will be
required. The national indicative minimum size threshold is to be 15 dwellings However,
Local Planning Authorities (LPAs) may:
‘&set lower minimum thresholds, where viable and practicable, including in rural areas.
This could include setting different proportions of affordable housing to be sought for a
series of site-size thresholds over the plan area. LPAs will need to undertake an informed
assessment of the economic viability of any thresholds and proportions of affordable
housing proposed&.’ (S29)
1.8 The analysis in the present study is designed to be consistent with the above requirements.
However it also needs to address the particular implications of the dramatic downturn in the
housing market that set in from early 2008.
Housing market downturn
1.9 The normal approach in a viability study of this kind is to prepare financial appraisals for a
range of sites representative of development in the area as a whole, testing varying
alternative levels of affordable housing provision. The work would involve deciding what
form of development would be expected on each site; as is conventional with such
appraisals, they would use current figures for build costs and house prices, making
sensible assumptions about other developer contributions(‘planning gain’), and a variety of
other technical matters.
1.10 By the spring of 2008 it had become clear that the onset of a ‘credit crunch’, which
emerged during the previous autumn, had triggered a serious downturn in the housing
market. A severe reduction in the availability of mortgages led to a reduction in prices,
which have impacted in turn on purchaser confidence. At the time of calculating the
information for this report, July 2008, it has become clear that, after a very long interval in
historical terms, during which house prices have been rising almost continuously, we have
now entered a period of adjustment. A similar adjustment was precipitated in the early 90s,
after rapid price rises in the period 1986-89. During that previous adjustment house prices
fell back considerably over a number of years. However at that time significant economic
problems, and historically high interest rates, contributed to the need for a very substantial
price adjustment.
1.11 The trigger for the present conditions within the housing market lay outside the housing
market. The underlying demand/supply relationship remains, with an increasing need for
more homes due to demographic changes, so it is more than likely that growth will return to
the market at some time in the future. As and when that will be, and to what extent, are not
a matter for this study. As prices appear still to be falling, and it is not possible to
determine where or when they might stabilise, a study based on today’s prices only, is
going to be of limited use and will require regular review.

1. In t roduct ion
Page 5
1.12 We have considered whether the proposed study approach should be modified to take
account of this unusual situation. Clearly, continued and regular monitoring of the
development situation will be required. Fortunately, the existing agreed arrangement to
pass the appraisal software to the Councils at the end of the study will conveniently provide
for this to happen. However, it will be necessary to subject appraisals to price sensitivity
tests, and to frame policy advice from an appropriate starting point in price terms.
Fordham Research
1.13 Fordham Research has been providing advice to Councils in respect of planning gain and
development viability since the late 1980s. The firm’s approach throughout this time has
involved the preparation of financial appraisals. Over the last few years in particular,
Councils have increasingly commissioned the firm to evaluate financial appraisals which
have been prepared by developers in order to support a case for a reduced affordable
housing contribution, for enabling development, and so on.
1.14 Since 1993 Fordham Research has become a leading consultancy in carrying out Housing
Needs Surveys (and more recently the more wide ranging Strategic Housing Market
Assessments that have largely replaced them) and advising Councils on affordable housing
policy issues. Since that time we have assisted Councils on very many occasions by
providing expert witness services at Local Plan and S78 Inquiries, in order to successfully
support housing need and affordable housing policies. Particularly in recent years, this has
regularly included evidence in respect of viability issues.
Structure of this report
1.15 The remainder of the report covers the following topics:
Chapter 2 - The individual development sites
Chapter 3 - Affordable housing and developer contributions assumptions
Chapter 4 - Local market conditions
Chapter 5 - Assumptions for viability analysis
Chapter 6 - Results of viability analysis
Chapter 7 - Implications of viability results

Taunton & South Somerset Af fordable Hous ing Si te Viab i l i ty Study
Page 6

2. Ind iv idual development s i tes
Page 7
2. Individual development sites
Introduction
2.1 This Section deals with the sites identified for study, first outlining the key characteristics of
each site, and then considering the assumptions made about proposed development upon
each site for the purpose of producing a financial appraisal.
2.2 The individual sites chosen were visited at an early stage in the work.
Two market areas
2.3 The four Councils together provide an area of some diversity, geographically as well as in
terms of market conditions. The South Somerset area comprises a range of substantial
settlements, much the largest centre at Yeovil, spread across an area of undulating
topography with many attractive villages. The three other districts look to a principal centre
at Taunton, but there are other sizeable centres at Bridgwater, Burnham/Highbridge, and
Minehead. Much of Sedgemoor is flat fen country, though hills border it east and northward,
and the town of Cheddar lies within the boundary.
2.4 The areas of attractive landscape and/or building character, and access to the coast, mean
that many parts of both HMAs are popular with incoming households, particularly those
moving to retire or those anticipating future retirement. There are therefore areas of high
house prices and housing pressures, whilst in other areas, less attractive or with less
favourable local economic circumstances, prices are a little less.
2.5 In order for the present study to address development viability across the combined
Councils’ area it will need to deal with the variety of built form and density that is currently
to be found.
Identifying a range of sites
2.6 It was decided at an early stage that the study should consider a combination of actual and
notional sites in order to provide the most useful guidance across the two housing market
areas. In discussion with the steering group, it was decided that a total of 19 sites would be
required, comprising a total of twelve actual sites, and seven notional sites, the notional
sites being developments identical to one of the actual sites, but theoretically transposed to
an alternative location.

Taunton & South Somerset Af fordable Hous ing Si te Viab i l i ty Study
Page 8
2.7 The site selection process involved a typology with nine categories of site, giving a
minimum of eighteen sites (nine actual, nine notional) in total to cover the two HMAs. In
practice twelve ‘actual’ sites were chosen, doubling up actual sites in three of the
categories. Two of these pairings were split across the two HMAs, removing the need for
the corresponding notional, but the third was not, requiring an additional notional in the
other HMA.
2.8 The typology categories were developed by the Councils in discussion, before the study
formally commenced. They were designed to cover the range of development
circumstances that required testing, and accordingly focused on larger and smaller centres,
where viability was anticipated to be more marginal than in the villages and rural areas,
where prices tend to be higher. The twelve ‘actual’ sites were selected in discussion from a
larger initial shortlist of sites. The typology is set out below.
Table 2.1 Site selection typology
No Description No of dwgs
1 Large greenfield site in town 75+
2 Large previously developed site in town 75+
3 Medium greenfield site in town 25-74
4 Medium previously developed site in town 25-74
5 Medium greenfield site in small market town 25-74
6 Medium previously developed site in small market town 25-74
7 Small greenfield site 4-15
8 Small previously developed site 4-15
9 Very small site 1-4
Source: Strategic Housing Viability Study
2.9 The twelve actual sites chosen to represent this typology are set out below, with the nine
notionals added for completeness. The twelve range in size from two to circa 350
dwellings, although in reflecting the local development situation ten of the twelve contain
fewer than 60 dwellings. All the sites were envisaged as wholly residential.

2. Ind iv idual development s i tes
Page 9
Table 2.2 Site selection typology
S Somerset HMA Taunton HMA Ref
no Location No
dwgs Location
No
dwgs LA
1 1A - Deanesley Way,
Wincanton 212 (1N) (212)
2 (2N) (350) 2A Gerber Factory, Bridgwater 350 SDC
3 3A – Touches, Chard 24 (3N) (24)
4A - 2 Priory Ave Taunton 24 TDBC 4 (4N) (24/48)
4B - Clanville Grange Minehead 48 WSC
5 5A - St Michael’s Gdns South
Petherton 55 5B - Haddons Field Stogursey 59 WSC
6 (6N) (32) 6A - Kings Yard Bishops Lydeard 32 TDBC
7 (7N) (11) 7A - Dabinett Cl Norton Fitzwarren 11 TDBC
8 (8N) (10) 8A - Opposite rail station Bridgwater 10 SDC
9 9A - Ilchester Rd Yeovil 2 9B - Pittacre House Bridgwater 2 SDC
Source: Strategic Housing Viability Study
2.10 Appropriate shadow locations for the nine ‘notional’ sites were selected. These were as
follows:
Table 2.3 Notional sites – locations
South Somerset HMA Taunton HMA
1N North Taunton
2N Eastern Yeovil
3N Bridgwater
4N Chard
6N Castle Cary
7N Langport
8N Yeovil
Source: Strategic Housing Viability Study
2.11 Site 4N could of course be based on two alternative models, sites 4A or 4B; after
discussion it was agreed that site 4B (Clanville Grange Minehead) was the preferred
model.
The actual sites
2.12 Summary details of the twelve actual sites identified by the Councils are set out in the table
below. The sites were at various stages in the planning process, though a clear majority,
eight, had reached construction stage; three of these were now completed. Three were
subject to planning applications which were to some degree resolved to permit, whilst for
one, the largest site, an application was imminently awaited.

Taunton & South Somerset Af fordable Hous ing Si te Viab i l i ty Study
Page 10
2.13 Information available from the various planning applications was clearly important in
considering the appropriate development forms to use in our appraisals. However we would
normally also take into account other recent schemes currently being developed, in
formulating development assumptions.
2.14 The table below shows both total site area, and for those sites including an open space or
similar non-residential component, the net residential area. The overall density using this
latter measure, is 46.1 dwellings per ha; two sites are at densities significantly above this
figure. One site with a density below 30 dw/ha, comprises bungalows on a particularly
awkwardly shaped and accessed plot. The rest are broadly within the range 30-50 dw/ha.
2.15 The sites accommodate just over 800 dwellings in total.
Table 2.4 Actual site details
Area ha Density Site
no Site
gross net Dw net
(dw/ha)
Planning status
1A Deanesley Way, Wincanton 7.23 4.83 212 43.9 Permission rescinded,
application
2A Gerber Factory, Bridgwater 6.00 NA 330 55.0 Application imminent
3A Touches, Chard 0.60 NA 24 40.0 Under construction
4A 2 Priory Ave Taunton 0.23 NA 24 104.3 Completed all occupied
4B Clanville Grange Minehead 1.33 0.89 48 53.9 Completed
5A St Michael’s Gdns S Petherton 1.70 NA 55 32.4 Under construction
5B Haddons Field Stogursey 3.23 1.95 59 30.3 Under construction
6A Kings Yard Bishops Lydeard 0.66 NA 32 48.5 Outline approved, reserved
matters minded to approve
7A Dabinett Cl N Fitzwarren 0.33 NA 11 33.3 Completed all occupied
8A Opp rail station Bridgwater 0.14 NA 10 71.4 Appln - minded to approve
9A Ilchester Rd Yeovil 0.10 NA 2 20.0 Under construction
9B Pittacre House Bridgwater 0.04 NA 2 50.0 Under construction
Total 21.6 17.5 809 46.1
Source: Strategic Housing Viability Study
2.16 The sites were chosen so as to test development viability fully, in a variety of situations
across the area. Reflecting the chosen selection typology they include both urban and more
suburban locations and a mixture of greenfield and previously developed land. The
previously developed uses include manufacturing (2A), garage (4A), car parking (4B),
repair of HGVs & machinery (6A), and unused residential garden land (9A/9B). The site at
8A is vacant land whose previous use was not fully clear.

2. Ind iv idual development s i tes
Page 11
Development assumptions
2.17 The Strategic Housing Land Viability Assessment has not considered within its site
typology strategic housing urban extension sites (typically in excess of 500 dwellings). Past
experience in South Somerset indicates that for the South Somerset sub-regional Housing
Market Area such sites would merit specific consideration in relation to abnormal promotion
costs that are usually incurred in the light of their size, complexity and nature.
2.18 In arriving at appropriate assumptions for residential development on each site, the
development form in an approved planning application would always be an important
consideration. All but one of the sites are in fact subject to an application which has been
approved or is likely to be approved subject to specific matters, (though it is possible that
one or two of the applications are now relatively historic and that an application today might
look slightly different, to reflect emerging market patterns).
2.19 For the one site without an application, 2A Gerber Factory, we have considered the
Development Brief and also a proposed accommodation schedule which was provided in
anticipation of the formal application.
2.20 In general, the details accord with our experience from a wide variety of development
situations in other parts of the country. In recent years, as development proposals have
engaged with the various implications of PPG3, but aided by rising land values, a common
development format has emerged for significant sized sites located within urban areas and
increasingly also in smaller centres.
2.21 This format provides for a majority of houses (with perhaps 15-30% flats) in a mixture of
two storey and two and a half to three storey form, with some rectangular emphasis to the
layout. It generates a floorspace density of around 15,000-15,500 sq ft per acre (3,550 sq
m/ha) on a substantial or sensibly shaped smaller site. Typical dwelling density would be
40-45 dwellings per ha.
2.22 Alongside this, of course, in appropriate, more urban locations - and indeed sometimes
elsewhere - there have been large numbers of higher density schemes providing largely or
wholly apartments, in blocks of three storeys and often rather higher. These provide
floorspace density from around 30,000 sq ft per acre (6,900 sq m/ha) upwards, at densities
of 100 dw/ha plus.
2.23 A development form which is somewhat more intensified or urban than the baseline, with
more flats or a stronger emphasis otherwise on three storey units might produce densities
of around 19,000 or so sq ft per acre (4,350 sq m/ha).

Taunton & South Somerset Af fordable Hous ing Si te Viab i l i ty Study
Page 12
2.24 On the other hand, of course, there are situations where, for planning reasons, in rural or
edge of settlement locations perhaps, schemes with densities below the baseline density
will come forward. Typically this situation might give a density of 12,500 sq ft per acre
(2,875 sq m/ha).Very small or awkwardly shaped sites might also make it difficult to
achieve fully the baseline density figure.
2.25 As suggested, the built form details for the twelve sites broadly fit with these observations,
as the table below indicates.
Table 2.5 Typology of development form
Category Ref Location net sq
ft/acre
net
sq m/ha
Dwgs
per ha
Rural/town 5B Stogursey 11,700 2,670 30
edge 5A South Petherton 12,200 2,800 32
9A Ilchester Rd Yeovil 12,650 2,900 20
Base 7A Norton Fitzwarren 14,700 3,375 33
9B Pittacre Ho B’water 14,800 3,400 50
3A Chard 14,850 3,410 40
Urban 4B Minehead 16,700 3,840 54
1A Wincanton 17,750 4,075 44
2A Gerber B’water 18,550 4,260 55
6A Bishops Lydeard 21,250 4,880 48
8A Station B’water 21,950 5,040 71
High 4A Taunton 38,700 8,900 104
Source: Strategic Housing Viability Study
2.26 The table shows three sites in the baseline category. There are three in the lower density
more rural group, and five in the higher density more urban group. Two of these are only a
little above the baseline:
• The Wincanton scheme is perhaps borderline, a broadly baseline mix which
benefits from a linear form designed to address the sloping nature of this large,
edge of town site.
• At Clanville Grange, the very steeply sloping site constrains the achievement of a
density to fully match the type mix.
2.27 There is one site, comprising wholly flats or coach houses, in the higher density category.
The Ilchester Rd site, being very small, awkwardly shaped and comprising two bungalows
might otherwise have been expected to make the baseline density.
2.28 The table is also felt to demonstrate quite well the comparatively loose relationship
between floorspace and dwelling density, reflecting variations in the average dwelling size.

3. Af fordable hous ing and other developer contr ibut ions
Page 13
3. Affordable housing and other developer
contributions
Introduction
3.1 This Section considers the assumptions used to test a range of affordable housing
scenarios for the individual sites, and similarly the developer contributions assumed for
each site.
Affordable housing assumptions
3.2 We undertook appraisals for a number of development scenarios which involved varying
proportions of affordable housing, and tenure split. The assumptions in respect of
proportions, and the financial terms on which they are to be provided, are considered
below.
3.3 The approach to seeking affordable housing will inevitably vary in detail between individual
Councils, reflecting its historical evolution, local choices and circumstances, and so on.
However, in order to reduce the appraisal work (and results) to a manageable task, a single
common approach was assumed to apply across the whole of the study area, and for all
sites. The use of a common approach is consistent with the overview perspective provided
in a SHMA. The differences in approach are not very great, and it is not felt that the use of
a common approach will undermine the validity of the appraisal results.
(i) Affordable proportions
3.4 Following discussions with the Councils we tested the following options1:
• NO affordable housing
• 15% affordable
• 30% affordable
• 45% affordable
1 Note that following the testing of these options, the Taunton & South Somerset Housing Market Partnership requested
that the Draft Regional Spatial Strategy proposed delivery of 35% affordable housing was subsequently tested; the
results are set out at Appendix 3.

Taunton & South Somerset Af fordable Hous ing Si te Viab i l i ty Study
Page 14
3.5 The four Councils currently operate policies seeking varying affordable housing
proportions, some site specific, but all lying broadly between 20% and 35%. However
higher proportions might be proposed in emerging Local Development Framework
Documents, though this will be subject to the ongoing SHMA work and more specifically will
be informed by the results of the present study.
(ii) Tenure split
3.6 We understand that all the Councils currently seek a balance of social rented and
intermediate housing. After discussion and consideration, all the affordable target options
were tested with two tenure split scenarios; the first a 60/40 split between social rented and
intermediate housing, and the second at 80/20.
3.7 In principle intermediate tenure could constitute a wide range of different housing
propositions, reflecting variations in individual Councils’ current policies and approaches.
However the Strategic Housing Market Assessment, proceeding a little in advance of the
viability study, has provided guidance on appropriate outgoings for affordable intermediate
housing and it would be sensible to follow these. They are set out in Tables 9.5 to 9.8 of the
SHMA Report, but for convenience are summarised below.
Table 3.1 Table of target outgoings for intermediate housing
Weekly outgoings £ as at May 2008
South Somerset Sedgemoor West Somerset Taunton Deane
1 bed 71 75 76 76
2 bed 95 86 95 96
3 bed 106 104 113 116
4 bed 118 125 132 132
Source: Taunton and South Somerset SHMA Report
3.8 After consideration, it was decided to consider two options; firstly intermediate rent housing
set to achieve the guidance outgoings for each Council area, and secondly shared
ownership on a corresponding basis.
(iii) Size profile
3.9 In practice the four Councils would be expected to seek a range of preferred bedroom
profiles for affordable housing provision, and the emerging SHMA will provide further
guidance. It was not practical in a study of this nature to address the requirements in detail,
with a limited number of sites in each District.

3. Af fordable hous ing and other developer contr ibut ions
Page 15
3.10 Instead, it was agreed that we should assume that the mix of affordable housing on each
site should broadly follow the market housing, achieving an average dwelling size (i.e. net
sq ft) in line with that of the market housing. This assumption also ensures that as the
affordable housing proportion varies between the options being tested, the floorspace
density remains constant - a desirable aim if the appraisals are to constitute a realistic
development scenario, consistently, across the options.
(iv) Financial terms
3.11 The financial terms on which a developer would make affordable dwellings he has
constructed available to an RSL will depend critically on the availability of public subsidy, as
acknowledged in PPS3 s29 (quoted above at 1.7). Where the availability of grant support is
expected to be quite limited it is common for appraisals to be prepared assuming zero
availability for Social Housing Grant (SHG) such an approach assumes that such grant as
is available, is to be used to support particular initiatives, strategic aims, and sites with
particular problems - or to support a more stringent mix where this was justified by local
considerations.
3.12 The zero grant assumption has become a common starting point or default position for
exercises of this kind, though it is by no means a universal one. It has the further
advantage that grant requirements can more easily be calculated from a zero grant starting
point than one which already assumes some level of grant. After discussion this approach
was the one adopted for the study.
3.13 It was necessary to seek advice from the Councils’ partner RSLs about the terms on which
properties of various sizes, would be purchased from the developer in order to achieve the
‘zero grant’ scenario. We sought information from ten Associations in respect of social
rented housing, and intermediate housing. As discussed above prices were sought on two
bases: intermediate rented housing to match the SHMA target outgoings guidance; and for
25% and 50% shared ownership, provided at rent levels of 2% on the unsold equity. To
assist with this, indicative guideline Open Market Values (OMVs) were provided for each
dwelling size.
3.14 Four of the RSLs (Knightstone, Magna, Raglan and South Somerset Homes) provided
figures in time for inclusion in our work. Not all RSLs were able to provide figures for every
option for every Council area; nevertheless a reasonable degree of coverage was
achieved. The figures show some variations in estimated ‘offer prices’ for affordable
dwellings on the basis described above, though they are not particularly great. Such
variations could, in practice, result from a number of factors, including the individual
organisation’s assumed level of contribution to the development from reserves. Given the
pattern of the RSL data it was felt reasonable to take an average from the figures provided
in each case.

Taunton & South Somerset Af fordable Hous ing Si te Viab i l i ty Study
Page 16
3.15 The question of which of the alternative bases for intermediate housing to use was
considered. Information had been provided for intermediate rent designed to meet the
SHMA guidance outgoings, and for shared ownership at 25% & 50% share, with rent
limited to 2%.
3.16 From the information provided it appeared that the 25% shared ownership option would
achieve the target outgoings for the smaller dwellings, but exceed it slightly for the larger
units. However we had more reliable data for shared ownership than for intermediate rent,
where only two RSLs provided responses. Even so, the purchase price ‘offer’ was not
greatly different between the options; the intermediate rent price was slightly higher for the
smaller units and a little lower for the larger units. Accordingly we took an average for the
two, halfway for the smaller units, but for the larger units, weighted somewhat more
towards the lower intermediate offer.
3.17 This process led to estimated for overall £ per sq ft prices for flats and houses in the four
Council areas under zero SHG as shown in Table 3.2. The figures for social rented homes
vary between Districts whilst those for intermediate housing apply throughout.
Table 3.2 Selling prices: zero grant basis
£ per sq ft (sq m)
Sedgemoor South
Somerset
Taunton
Deane
West
Somerset
Social rented Flat 73 75 75 77
House 65.5 68 68 70
Flat (785) (807) (807) (829)
House (705) (732) (732) (753)
Intermediate rent Flat 106 106 106 106
House 96 96 96 96
Flat (1,141) (1,141) (1,141) (1,141)
House (1,033) (1,033) (1,033) (1,033)
Source: data from RSLs

3. Af fordable hous ing and other developer contr ibut ions
Page 17
Other developer contributions
3.18 Aside from affordable housing, developer contributions could potentially be sought by the
District and County Councils under a number of headings and these need to be taken into
account. As with affordable housing, each District has in practice its own policies, protocol
and arrangements for determining the nature and hence cost of any developer
contributions - although the County elements should in principle be common. The four
individual approaches are also evolving, over time and with the emerging option of a
Community Infrastructure Levy. What was actually sought or secured on the ‘actual’ sites in
the past is therefore, though helpful, not a completely sound guide to what contributions
should be assumed if the sites were to be developed in say a few months from the present
time.
3.19 In fact, carrying out the detailed assessment required to assess impact and determine the
appropriate contribution for each of the sites was beyond the scope of the study.
Furthermore, since the ‘notional’ sites had only broad indicative locations this would not in
any case deliver meaningful results for them. We obtained varying amounts of information
from each Council on what they would seek currently from the site. The information we
received was incorporated into a ‘modelling’ approach to arrive at a view of the total £ per
dwelling cost of contributions. In doing this we relied, in part only, on the firm’s considerable
experience over a number of years from assessing developer contributions requirements
for Councils in respect of major residential projects.
3.20 The results are set out below. The main areas where contributions arise are Open space &
Recreation for the District, and for the County, Education & Transport where an appropriate
impact would arise. As dwellings numbers decline and thresholds come into play,
contributions for the latter drop out, reducing the overall total £ per dwelling figures
appreciably. The figures are designed to be broadly consistent across the Housing Market
Area, with the figures for South Somerset, in a separate HMA from the other three, set
higher to reflect the contributions now to be sought from a newly emerging Planning
Obligations Calculator produced by the Council.

Taunton & South Somerset Af fordable Hous ing Si te Viab i l i ty Study
Page 18
Table 3.3 Developer contributions base scenario
Size group Ref Location No
dwgs
£ per
dwelling
100 dwgs + 2A Gerber Bridgwater 330 £8,000
2N (Yeovil East) 330 £9,500
1A Wincanton 212 £4,500
1N (North Taunton) 212 £8,000
50-99 dwgs 5B Stogursey 59 £6,000
5A South Petherton 55 £6,300
25-49 dwgs 4B Minehead 44 £4,500
4N (Chard) 44 £6,000
6A Bishops Lydeard 32 £3,300
6N (Castle Cary) 32 £5,500
10-24 dwgs 4A Taunton 24 £3,000
3A Chard 24 £4,500
3N (Bridgwater) 24 £3,000
7A Norton Fitzwarren 11 £3,000
7N (Langport) 11 £4,500
8A Station Bridgwater 10 £2,000
8N (Yeovil) 10 £4,000
Under 10 dwgs 9B Pittacre Ho Bridgwater 2 £2,000
9A Yeovil 2 £4,000
Source: Strategic Housing Viability Study
3.21 The figures set out above should not be regarded as in any sense definitive. They are
simply a way of arriving at a plausible £ per dwelling scenario, using a combination of
known information and judgement. The figures cannot be assumed to constitute the
contributions that would arise in practice. These will depend on the current (or historic)
policies and approach of each Council, and indeed on the outcome of the negotiation
process.
3.22 Proposals to reflect the emerging Community Infrastructure Levy initiative are at various
stages across the four Councils, and indeed detailed proposals for a Taunton Deane
Infrastructure Tariff have been published. Looking at the figures in the table, it is clear that
generally speaking tariff proposals are likely to place an appreciably heavier burden on
viability, particularly for the smaller sites since they will apply universally. Nevertheless we
were asked to prepare appraisals with alternative contributions options, with figures at
£13,000 and £20,000 per dwelling, in lieu of the S106 costs identified in Table 3.3.

4. Local market condi t ions
Page 19
4. Local market conditions
Introduction
4.1 This Section sets out an assessment of the local housing market in the four Districts,
providing a basis for the assumptions on house prices and costs to be used in financial
appraisals for the 19 sites tested in the study.
4.2 As well as house prices, however, land values are also considered. They are required in
order to form a view of likely alternative use values for all of the sites, and it is such values
that will represent a minimum viability threshold when appraisals are prepared for the range
of affordable housing scenarios.
4.3 Before looking at the results from the market assessments, there are some general points
arising from the nature of the exercise.
Issues to consider
4.4 It is necessary to assess property market conditions in the study area in order to provide a
reasonable guide as to likely values to use in evaluating different development proposals.
4.5 Although development schemes do have similarities, every scheme is unique to some
degree, even schemes on neighbouring sites. While market conditions in general will
broadly reflect a combination of national economic circumstances and local supply/demand
factors, even within a town there will be particular localities, and ultimately site specific
factors, that generate different values and costs. There are indeed quite significant value
variations in different parts of the study area.
4.6 Property market forces are in a constant state of flux and assessments of viability can
change over relatively short periods of time, in response to broader economic fluctuations
such as the impact of changes in interest rates on the costs of borrowing. Equally
significant, sub-area market conditions are often changed by local factors.
4.7 Most crucially, as previously discussed at 1.11 onwards, we have now clearly entered a
period of downwards price adjustment. This resulted from external financial issues which
severely constrained the supply of mortgage finance, although the resulting price falls have
adversely affected the attractiveness of house purchase.

Taunton & South Somerset Af fordable Hous ing Si te Viab i l i ty Study
Page 20
The residential market
4.8 The housing market across the four Districts, to some extent, reflects national trends but
there are local factors that underpin the market including;
• A predominantly rural area containing many attractive settlements and individual
buildings of great character, popular with incoming households.
• A considerable length of coastline, providing a variety of opportunities and
environments, but also meaning that several larger settlements in particular are
either in need of, or undergoing regeneration in response to the reduction in holiday
and water related activity.
• Major employment centres at Taunton and Yeovil, generating housing demand in
the immediately adjoining rural areas
• A number of attractive smaller centres
• Rolling topography, some more dramatic, over much of the two Market Areas,
creating tourist potential and interest, including part of a National Park (Exmoor) and
three Areas of Outstanding Natural Beauty (AONBs) (Mendips, Quantock and
Blackdown Hills)
• A flatter area of low lying historic fenland to the north and centred on Bridgwater,
with consequent flooding issues
• Good transportation - westward into the peninsula and north east to Bristol and the
Midlands, or towards London – for localities close to the M5 motorway and to some
degree the A303. Comparative remoteness in and around Exmoor.
4.9 We analysed various sources of market information but the most relevant are the prices of
units on new developments. A list setting out details of some relevant new developments in
the area, as at July 2008, is provided in Appendix 1.
4.10 Analysis of these, and other schemes in the study area, shows that prices for newbuild
homes vary quite widely across the area, ranging between approximately £160 and £300
per square foot (£1,720 - £3,225 per square metre). This is the range for individual
properties; averaged over the complete scheme the degree of variation will of course be
somewhat less than this. However it is clear that the price per sq ft will vary considerably
between the 19 sites in the study. (As in other parts of the country, the smaller units and
apartments in particular show a price premium per square foot compared to larger houses).
4.11 Land Registry data confirms that there are significant variations in house prices across the
area. Table 4.1 shows average prices for the four Council areas. It suggests that, on
average, prices are appreciably higher in West Somerset than in the other three areas.
These are all broadly similar, except that prices for detached homes are at something of a
premium in South Somerset & Taunton Deane, whilst Taunton Deane also shows a
premium for flats compared to the other two.

4. Local market condi t ions
Page 21
4.12 Although the Land Registry data covers both second-hand and newbuild prices, the former
will predominate. The average prices in the table are compared to a corresponding England
& Wales figure and expressed as indices.
Table 4.1 Average house prices by Council area Q4 2007
Ave price (£k & % index) Area
Detached Semi Terrace Flat
Sedgemoor £k £301.3 £183.0 £154.2 £126.0
Index 97% 97% 96% 92%
South Somerset £k £347.1 £180.8 £156.9 £120.2
Index 111% 96% 98% 87%
Taunton Deane £k £350.6 £189.1 £153.2 £147.6
Index 113% 100% 96% 107%
West Somerset £k £419.7 £215.1 £159.0 £158.9
Index 135% 114% 99% 116%
Source: Land Registry data.
Index compares LA’s figure to the median LA value across England & Wales for house type.
4.13 However it is also clear that within a Council area there can be considerable variations in
price, larger than those between Councils. Land Registry house price data at postcode
sector level helps to illuminate these variations. Because the number of sales in individual
postcode areas in a single quarter can be quite small, we looked at information for two
separate quarters (Q2 2007 & Q4 2007). The data has been expressed as an index – as a
percentage of the nationwide average postcode price level - and standardised, to allow for
variations in type mix.

Taunton & South Somerset Af fordable Hous ing Si te Viab i l i ty Study
Page 22
Fig 4.1 Postcode price indices
Source: Land Registry data.
4.14 Appendix 2 provides a worked example of the index calculation, and sets out the resulting
price index figures for the two quarters examined. It can be seen that variations between
the two quarters’ indices are in many cases relatively slight. They are greater for rural areas
and town centres, which are mostly numerically smaller and more diverse, than for urban
areas generally, where postcode sectors are larger numerically and can often be more
uniform.
4.15 The figures show quite clearly that the lowest prices, between about 80% and 95% of
national average, are concentrated in the main towns – Bridgwater, Yeovil and Taunton - or
in Burnham/Highbridge, and Chard. (Yeovil and Bridgwater are wholly in this group, except
for the west of Bridgwater; Taunton however has several higher priced sectors). The
highest prices relate closely to the areas of attractive landscape – Exmoor, the Quantocks,
Mendips & Blackdown Hills.
4.16 The majority of the postcodes, including most rural areas but also some of the smaller
towns, have prices above the national average. In the most expensive areas prices are as
much as 50% higher than the national average. Among the locations for our sites
Stogursey, Bishops Lydeard, South Petherton and Minehead all have prices well above
average.

4. Local market condi t ions
Page 23
4.17 Looking at the map in Figure 4.1, it is clear that areas of higher and lower prices are quite
well distributed across the area as a whole. Three of the four districts contain a good
mixture of higher, middle, and lower prices; it is because West Somerset has no significant
lower priced urban areas that its overall average price is higher than the other three.
Price assumptions for financial appraisals
4.18 It is necessary to form a view about the appropriate prices for the 19 individual schemes to
be appraised in the study. The information suggests that there will be significant variations
in selling prices across the area. However on the whole the sites are mostly in towns, or
otherwise locations of low to medium price level. This is a sensible approach as the areas
of highest prices have mainly been avoided.
4.19 It is also clear that we must allow for differences between apartments and houses,
particularly in locations where flats are going to be attractive. Finally, in drawing on the
newbuild price data we have to bear in mind that the prices at which homes are offered can
sometimes include appreciable discounts, such as deposit paid for first time purchasers, or
stamp duty. Discounts can be particularly significant at the very end of the scheme’s life
when only one or two units are left unsold; however such ‘bargains’ cannot form a basis for
selling prices across the whole scheme .
4.20 Taking these points into consideration we arrived at a set of sale prices for flats and for
houses on each of the 19 sites. The two were then combined on the basis of the
proportions of flats and houses in each scheme, to produce a single composite average
price. The resulting figures are set out in Table 4.2 below.
Table 4.2 Price bands
Price £ per Price £ per Site/location
Sq ft Sq m Site/location
Sq ft Sq m
1A Wincanton 207 2,230 1N Taunton N 200 2,147
2A Bridgwater W 206 2,217 2N Yeovil E 190 2,039
3A Chard 190 2,044 3N Bridgwater N 195 2,098
4A Taunton C 225 2,421 4B Minehead 238 2,559
4N Chard 196 2,113 191 2,044
5A S Petherton 230 2,475 5B Stogursey 216 2,322
6A Bishops Lydeard 241 2,589 6N Castle Cary 211 2,269
7A Norton Fitzwarren 190 2,044 7N Langport 210 2,260
8A Bridgwater E 195 2,098 8N Yeovil 185 1,991
9A Yeovil NE 240 2,582 9B Bridgwater E 185 1,991
Source: Strategic Housing Viability Study
Taunton & South Somerset Af fordable Hous ing Si te Viab i l i ty Study
Page 24
4.21 The figures cover a range from £185 per sq ft in Yeovil, to approx £240 in Minehead &
Bishops Lydeard. This is somewhat less than the spread of prices we saw in the Land
Registry data for second-hand prices, but partly reflects the sites’ concentration in the lower
to medium priced locations. It should be emphasised that the figures are intended to be
relatively realistic selling prices, and should not include major discounts.
4.22 It is necessary to consider whether the presence of affordable housing would have a
discernible impact on sales prices. In fact affordable housing will be present on many of the
sites whose selling prices have informed our analysis. Our view is that in any case any
impact can and should be minimised through an appropriate quality design solution.
Land values
4.23 In considering land values we have not only looked at the evidence of transactions in the
market but have also considered how developers source land. Developers do buy land that
has the benefit of planning consent and is ready for development (and the requirements for
S106 contributions and affordable housing are known and reflected in the price) but much
land that is also brought forward that has been promoted through the planning system –
historically often over many years and at significant expense to the developer or land
owner. There is an allowance for this cost in the Fees heading (see 5.19) but it would
certainly not cover every case which has been brought to our attention. Depending on
where a site is in the planning process we must also recognise that it may have developed
an amount of ‘Hope Value’ – at least in the eyes of the owner.
4.24 The availability and cost of land is at the core of the viability of any development of new
houses. The fact that a developer has over paid for a site will not excuse them from
providing affordable housing – and likewise the fact that they have underpaid will not
require them to provide more. It has been recognised by stakeholders (including builders
and developers) that in the current development and planning regime the cost of meeting
S106 requirements and delivering an amount of affordable housing is a factor in
development appraisals and does impact on land values.
4.25 The land price element of a viability appraisal has caused much debate. This study does
not try to set land values – that will always be a private matter between buyers and sellers
and is not a matter for the planning authority. This study does not attempt to predict when
a landowner may sell the land, if at all, as all land owners have very different
circumstances. It may be for example that in circumstances such as at present, in the
current economic climate, some landowners (particularly the long term holders of land such
as farmers and estate owners) will decide not to sell land for the time being. That being
said, the value of land can only be assessed for a study of this type by reference to the
prevailing planning framework. The provision of affordable housing and other requirements
under S106 are a reality of planning, and do impact on the value of land.

4. Local market condi t ions
Page 25
4.26 In our consideration around what a landowner may or may not accept the promoters of land
raised the ‘cost’ of taxation. The sale of land is subject to Capital Gains Tax. We have
wrestled with how to deal with this however the circumstances of individual owners is so
very different that we have not made specific reference to it. We do however acknowledge
that promoters of strategic land are likely to have substantial tax bills following very large
sales of land and farmers and long term landowners lesser bills.
4.27 We firmly believe that the notion of the open market value of land with planning consent for
housing, but no requirement for affordable housing or any of the other factors that may be
introduced under S106 has no direct relevance; if landowners have an expectation of
receiving values that do not reflect the provision of affordable housing and other legitimate
contributions, that view should be regarded as naïve and misguided.
4.28 We have considered general figures from the Valuation Office Agency (VOA) relating to
residential land values. Land values vary dramatically depending upon the development
characteristics (size and nature of the site, density permitted etc.) and any affordable or
other development contribution.
4.29 The VOA figures for residential land published in the Property Market Report cover the
South West Region as a whole, and major towns like Taunton and Exeter.
4.30 These values can only provide broad guidance because it is possible that they incorporate,
to some degree, allowances for developer contributions and/or affordable housing
requirements. They can therefore be only indicative, and it may be that values for ‘oven
ready’ land with no affordable provision or other contribution, or servicing requirement, are
in fact a little higher. We would highlight that these figures are somewhat historic and do
not truly reflect the current downturn.
Table 4.3 Residential Land Values
Land Value £m per acre (hectare) Area
Small sites Bulk sites Land for apartments
South West Region £1.31m
(£3.25m)
£1.14m
(£2.80m)
£1.50m
(£3.71m)
Taunton £1.21m
(£3.00m)
£1.13m
(£2.75m)
£1.42m
(£3.50m)
Exeter £1.62m
(£4.00m)
£1.21m
(£3.00m)
£1.62m
(£4.00m)
Bristol £1.50m
(£3.70m)
£1.21m
(£3.00m)
£1.62m
(£4.00m)
Source: VOA Property Market Report Jan 2008

Taunton & South Somerset Af fordable Hous ing Si te Viab i l i ty Study
Page 26
4.31 Values in Taunton are fairly close to the average for the region, though the value premium
for flatted schemes is smaller; by comparison, the major cities show a substantial premium
for apartment land – and also for small sites. These values will take no real account of the
changes to the national housing market since the beginning of the year. It is also difficult to
assess how much provision is made in the reported values, for affordable housing or for
other developer contributions. It is therefore necessary to seek information about values
from residential land currently on sale in the Borough.
4.32 An examination of small land plots currently available – in mostly rural locations - points in
the main to values in the range of about £800-1,250k per acre (£1,975-2,965k per ha) for
oven ready land. This does suggest that the VOA figures might be a little high, and are not
particularly heavily discounted.
Current and alternative use values
4.33 In order to assess development viability the appropriate starting point must be an analysis
is of current and alternative use values. Current use values refer to the value of the land in
its current use, for example, as agricultural land. Alternative use values refer to any
potential use for the site. For example, a brownfield site may have an alternative use as
industrial land.
4.34 We would recognise that for some greenfield sites and occasionally otherwise, depending
on where a site is in the planning process it may have developed an amount of ‘Hope
Value’ – at least in the eyes of the owner. This is a matter which must be taken into
account in due course. However current and alternative use value has to be the starting
point.
4.35 To assess viability, the value of the land for the particular residential scheme adopted
needs to be compared to the alternative use value, to determine if there is another use
which would derive more revenue for the landowner. If the assessed value does not exceed
the alternative use value, then the development is not viable.
4.36 For the purpose of the present study, it is necessary to take a comparatively simplistic
approach to determining the alternative use value. In practice a wide range of
considerations could influence the precise value that should apply in each case, and at the
end of extensive analysis the outcome might still be contentious.
4.37 Our ‘model’ approach is outlined below for the twelve actual sites (but would apply to the
corresponding notionals):
i) For five sites previously in agricultural use, then agricultural land represents the
existing use value.

4. Local market condi t ions
Page 27
ii) Where the development is on former industrial or similar land, then the alternative
use value is considered to be industrial. An average value of industrial land for the
area is therefore adopted as the alternative use value for three sites.
iii) One site was previously in use as a public car park convenient for the main retail
centre at Minehead (site 4B).
iv) The remaining sites are on unused garden land, or land otherwise adjoining a
residential use. Whilst such land is going to have previously developed status, it is
unlikely that an alternative use other than residential would be available. In practice
the value is a matter for individual negotiation.
4.38 The VOA’s typical industrial land values for the region and nearby towns are set out in the
table below.
Table 4.4 Industrial Land Values
Land Value per acre (hectare) Area
Low High Typical
South West Region £120k (£300k) £565k (£1,400k) £1,119k(£305k)
Yeovil £190k (£475k) £375k (£925k) £285k (£700k)
Exeter £285k (£700k) £385k (£950k) £345k (£850k)
Bristol £310k (£770k) £461k (£1,140k) £385k (£955k)
Source: VOA Property Market Report July 2007
4.39 The South West Region as a whole shows a considerable range of values. However the
region includes some major centres together with other places which are relatively remote,
and where values are accordingly quite low. The figures from Yeovil point to typical land
values for industrial and warehousing land, of around £285k per acre. Figures for the big
centres such as Exeter and Bristol are somewhat higher. In practice it is likely that whilst
values of £285K might be obtained in Yeovil and possibly Taunton and Bridgwater, with
reasonable access to the motorway network, values would be somewhat lower in the
smaller towns and the rural hinterland.
4.40 We have found very limited evidence of values in the area, and in the absence of such
information we would accept the £285k figure for the three major settlements.
4.41 Outside these settlements the value is assumed to fall away quite appreciably. We have
assumed a figure of £175k for the sites in Castle Cary and Bishops Lydeard, and suspect
that a figure for Minehead would be lower still, perhaps £150 per acre.
4.42 Agricultural values have risen lately, after a long period of stability. They are around £15-
25k per hectare depending upon the specific use. A benchmark of £10k per acre (£25k per
ha) is assumed to apply here.
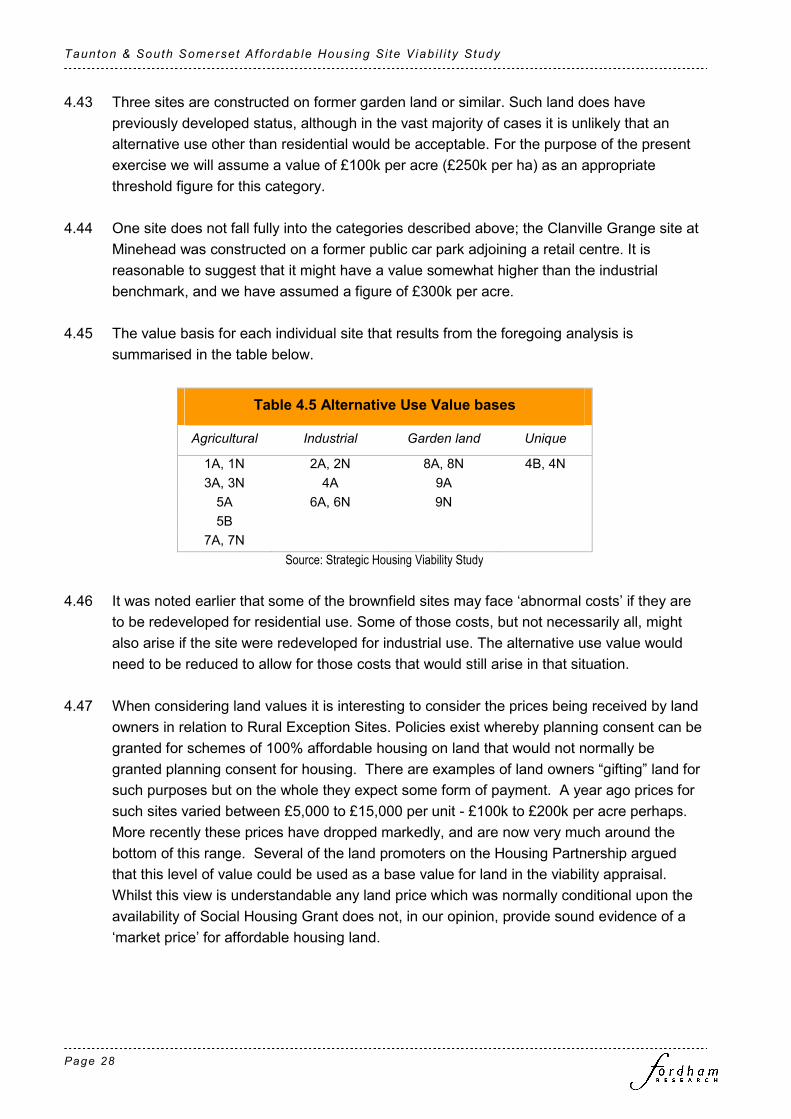
Taunton & South Somerset Af fordable Hous ing Si te Viab i l i ty Study
Page 28
4.43 Three sites are constructed on former garden land or similar. Such land does have
previously developed status, although in the vast majority of cases it is unlikely that an
alternative use other than residential would be acceptable. For the purpose of the present
exercise we will assume a value of £100k per acre (£250k per ha) as an appropriate
threshold figure for this category.
4.44 One site does not fall fully into the categories described above; the Clanville Grange site at
Minehead was constructed on a former public car park adjoining a retail centre. It is
reasonable to suggest that it might have a value somewhat higher than the industrial
benchmark, and we have assumed a figure of £300k per acre.
4.45 The value basis for each individual site that results from the foregoing analysis is
summarised in the table below.
Table 4.5 Alternative Use Value bases
Agricultural Industrial Garden land Unique
1A, 1N 2A, 2N 8A, 8N 4B, 4N
3A, 3N 4A 9A
5A 6A, 6N 9N
5B
7A, 7N
Source: Strategic Housing Viability Study
4.46 It was noted earlier that some of the brownfield sites may face ‘abnormal costs’ if they are
to be redeveloped for residential use. Some of those costs, but not necessarily all, might
also arise if the site were redeveloped for industrial use. The alternative use value would
need to be reduced to allow for those costs that would still arise in that situation.
4.47 When considering land values it is interesting to consider the prices being received by land
owners in relation to Rural Exception Sites. Policies exist whereby planning consent can be
granted for schemes of 100% affordable housing on land that would not normally be
granted planning consent for housing. There are examples of land owners “gifting” land for
such purposes but on the whole they expect some form of payment. A year ago prices for
such sites varied between £5,000 to £15,000 per unit - £100k to £200k per acre perhaps.
More recently these prices have dropped markedly, and are now very much around the
bottom of this range. Several of the land promoters on the Housing Partnership argued
that this level of value could be used as a base value for land in the viability appraisal.
Whilst this view is understandable any land price which was normally conditional upon the
availability of Social Housing Grant does not, in our opinion, provide sound evidence of a
‘market price’ for affordable housing land.

4. Local market condi t ions
Page 29
4.48 The costs arising from development/redevelopment of the 19 sites are considered in the
next Section, along with the other financial and technical assumptions required to prepare
financial appraisals for each of the sites.

Taunton & South Somerset Af fordable Hous ing Si te Viab i l i ty Study
Page 30

5. Assumpt ions for v iab i l i ty analys is
Page 31
5. Assumptions for viability analysis
Introduction
5.1 This Section considers the costs and other assumptions required to produce financial
appraisals for the 12 actual and seven notional sites.
Development costs
(i) Construction costs
5.2 Drawing upon our own experience, and taking into account published Building Cost
Information Service (BCIS) data, we have developed a set of base per sq ft construction
costs for different built forms of residential development. The costs are specific to different
built forms (flats v houses; number of storeys). Reflecting the practice with BCIS, these
costs include prelims, but do not allow for externals, which are considered immediately
below, or contingency. Floor area is measured as gross internal area.
5.3 On the basis of these cost figures, it is possible to draw up appropriate cost levels for
constructing market housing in Somerset at a base date of Q2 2008.
5.4 The question arises as to what extent the Code for Sustainable Homes (CSH) should
impact on build costs in the study. Whilst from April 2008 the Code’s Level 3 will be a
requirement for all homes commissioned by RSLs, that would not necessarily be the case
for affordable homes built by developers for disposal to an RSL. However, guidance
emerging from Government after the study commenced has indicated that Level 3 will
apply to all newbuild housing (i.e. will be incorporated in Building Regulations) from 2010,
with higher levels intended to be triggered from 2013 onwards. On this basis it seems
appropriate for the present study to assume that Level 3 applies to both market and
affordable housing on the sites being appraised.
5.5 Guidance on the impact of Level 3 is available from a Report commissioned by the Housing
Corporation & English Partnerships (A Code For Sustainable Development, 2007) in
respect of the impact of Level 3 on construction costs. This Report estimates (Table S2) the
increase in costs arising for different house types under various scenarios. On average,
current build costs would need to increase by 4.2% to achieve Level 3.
5.6 Adjusting the calculated cost figures by this 4.2% premium, we drew up appropriate cost
levels for constructing market housing for the various built forms in the study, taking into
account the mix of house types on each. These are set out in the table below.

Taunton & South Somerset Af fordable Hous ing Si te Viab i l i ty Study
Page 32
Table 5.1 Construction costs: market housing
Build cost £ per Build cost £ per Site/location
sq ft sq m Site/location
sq ft sq m
1A Wincanton 84.67 911 1N Taunton N 84.67 911
2A Bridgwater W 87.72 944 2N Yeovil E 87.72 944
3A Chard 81.43 876 3N Bridgwater N 81.43 876
4A Taunton C 99.02 1,065 4B Minehead 94.17 1,013
4N Chard 94.17 1,013 78.80 2,044
5A S Petherton 81.84 881 5B Stogursey 82.85 892
6A Bishops Lydeard 85.70 922 6N Castle Cary 85.70 922
7A Norton Fitzwarren 81.43 876 7N Langport 81.43 876
8A Bridgwater E 85.09 916 8N Yeovil 85.09 916
9A Yeovil NE 81.43 876 9B Bridgwater E 81.43 876
Source: Fordham Research derived from analysis of BCIS cost data
5.7 Since the mid-1990s, planning guidance on affordable housing has been based on a view
that construction costs were appreciably higher for smaller sites, with the consequence
that, as site size declined, an unchanging affordable percentage requirement would
eventually render the development uneconomic. Hence the need for a ‘site size threshold’,
below which the requirement would not be sought.
5.8 It is not clear to us that this view is completely justified. Whilst, other things held equal,
build costs would increase for smaller sites, other things are not normally equal, and there
are other factors which may offset the increase. The nature of the development will change.
The nature of the developer will also change, as small local firms with lower central
overheads replace the regional and national house builders. Furthermore, very small sites
may be able to secure a ‘non estate’ price premium, which we have not allowed for.
5.9 Even so, five of the sites (four actual and one notional) in our study are of 11 dwellings or
less, and it is necessary to make some allowance for the economics of the smallest sites in
preparing financial appraisals. Cost premiums have therefore been estimated for these very
small sites, and are shown below.
Table 5.2 Cost adjustments for small sites
Site size 11 dwgs 10 dwgs 2 dwgs
Build cost premium (+4%) (+5%) (+20%)
Source: Fordham Research
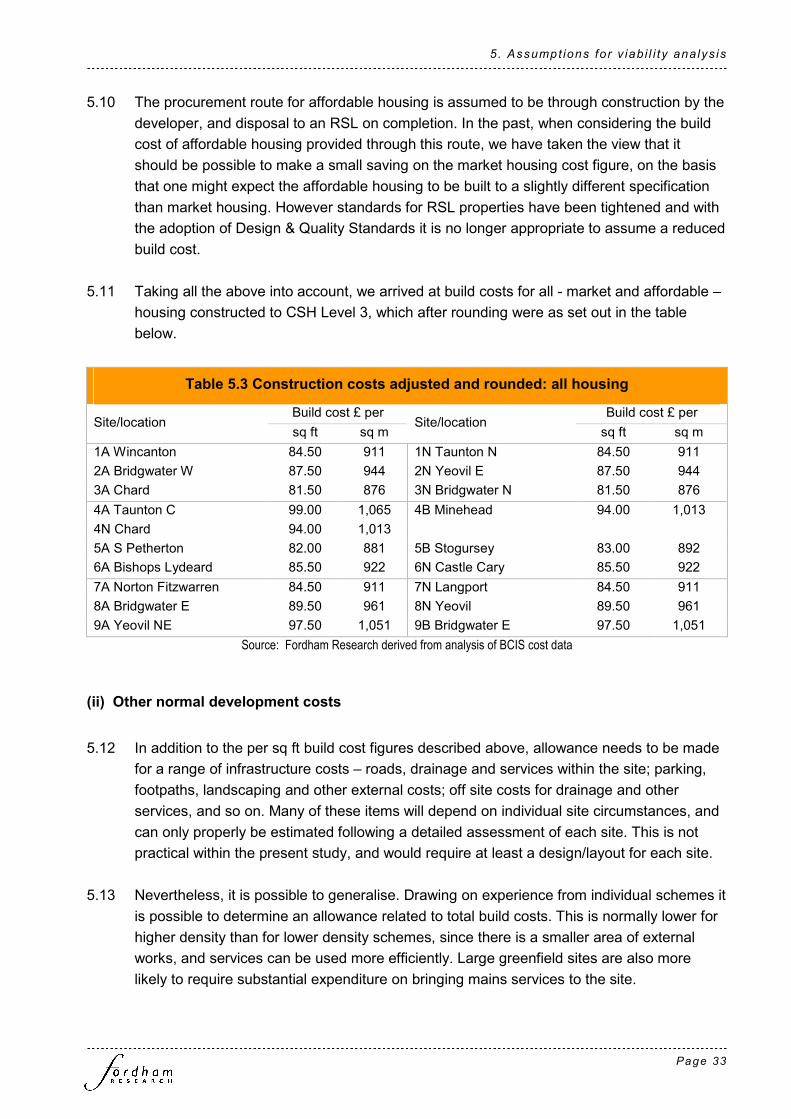
5. Assumpt ions for v iab i l i ty analys is
Page 33
5.10 The procurement route for affordable housing is assumed to be through construction by the
developer, and disposal to an RSL on completion. In the past, when considering the build
cost of affordable housing provided through this route, we have taken the view that it
should be possible to make a small saving on the market housing cost figure, on the basis
that one might expect the affordable housing to be built to a slightly different specification
than market housing. However standards for RSL properties have been tightened and with
the adoption of Design & Quality Standards it is no longer appropriate to assume a reduced
build cost.
5.11 Taking all the above into account, we arrived at build costs for all - market and affordable –
housing constructed to CSH Level 3, which after rounding were as set out in the table
below.
Table 5.3 Construction costs adjusted and rounded: all housing
Build cost £ per Build cost £ per Site/location
sq ft sq m Site/location
sq ft sq m
1A Wincanton 84.50 911 1N Taunton N 84.50 911
2A Bridgwater W 87.50 944 2N Yeovil E 87.50 944
3A Chard 81.50 876 3N Bridgwater N 81.50 876
4A Taunton C 99.00 1,065 4B Minehead 94.00 1,013
4N Chard 94.00 1,013
5A S Petherton 82.00 881 5B Stogursey 83.00 892
6A Bishops Lydeard 85.50 922 6N Castle Cary 85.50 922
7A Norton Fitzwarren 84.50 911 7N Langport 84.50 911
8A Bridgwater E 89.50 961 8N Yeovil 89.50 961
9A Yeovil NE 97.50 1,051 9B Bridgwater E 97.50 1,051
Source: Fordham Research derived from analysis of BCIS cost data
(ii) Other normal development costs
5.12 In addition to the per sq ft build cost figures described above, allowance needs to be made
for a range of infrastructure costs – roads, drainage and services within the site; parking,
footpaths, landscaping and other external costs; off site costs for drainage and other
services, and so on. Many of these items will depend on individual site circumstances, and
can only properly be estimated following a detailed assessment of each site. This is not
practical within the present study, and would require at least a design/layout for each site.
5.13 Nevertheless, it is possible to generalise. Drawing on experience from individual schemes it
is possible to determine an allowance related to total build costs. This is normally lower for
higher density than for lower density schemes, since there is a smaller area of external
works, and services can be used more efficiently. Large greenfield sites are also more
likely to require substantial expenditure on bringing mains services to the site.

Taunton & South Somerset Af fordable Hous ing Si te Viab i l i ty Study
Page 34
5.14 In the light of these considerations we have developed a scale of allowances ranging from
20% of build costs for the largest greenfield type site, the major urban extension at
Wincanton, down to 10% for the smallest two dwelling sites. The table below sets out the
individual site assumptions.
Table 5.3 Development cost allowances
Site/location % of build costs Site/location % of build costs
1A Wincanton 20% 1N Taunton N 20%
2A Bridgwater W 17.5% 2N Yeovil E 17.5%
3A Chard 13% 3N Bridgwater N 13%
4A Taunton C 11% 4B Minehead 12%
4N Chard 12%
5A S Petherton 16% 5B Stogursey 16%
6A Bishops Lydeard 13% 6N Castle Cary 13%
7A Norton Fitzwarren 12% 7N Langport 12%
8A Bridgwater E 10% 8N Yeovil 10%
9A Yeovil NE 10% 9B Bridgwater E 10%
Source: Fordham Research
(iii) Abnormal development costs
5.15 In some cases where the site involves redevelopment of land which was previously
developed, there is the potential for abnormal costs to be incurred. Abnormal development
costs might include demolition of substantial existing structures; piling or flood prevention
measures at waterside locations; remediation of any land contamination; remodelling of
land levels, and so on.
5.16 The majority of the sites are on previously developed land. On several sites, based upon
the information made available to us, and also the site visits, it appears that exceptional or
abnormal development costs would need to be taken into account in preparing appraisals.
As pointed out in the previous Section (4.44) some abnormal costs would also arise in the
event of the site’s redevelopment with an alternative use.
5.17 The schedule below sets out the abnormal costs considered to apply in each case where
they arise.

5. Assumpt ions for v iab i l i ty analys is
Page 35
Table 5.5 Abnormal development costs
Residential Industrial No Site Item
Cost £k Cost £k £k per acre
1A Wincanton Sloping ground £250k n/app -
2A Gerber Possible contamination,
large scale demolition £250k £150k £10k
4A County Garage Previous garage uses £150k £50k £90k
4B Clanville Grange Steep slope £200k n/app -
6A Bishops Lydeard Contamination £75k £50k £30k
Source: Fordham Research
5.18 The table also shows where applicable the adjustment needed to ensure that an alternative
land value reflects the costs incurred in developing an alternative use.
(iii) Fees
5.19 We have assumed professional fees amount to 10% of build costs. This would include all
the costs associated with submitting a planning consent, preparing working drawings and
supervising the build – but not necessarily all of the historic costs of promoting sites
through the local plan process, in every case. Fees on infrastructure works use a lower
figure of 8%.
(iv) Contingency
5.20 For previously undeveloped and otherwise straightforward sites, we would normally allow a
contingency of 2.5%, with a higher figure of 5% on more risky types of development,
previously developed land and central locations. We used 2.5% on the undeveloped sites
5% where the land was previously developed and an intermediate rate on the Bridgwater
site whose previous use was unclear.
Financial and other appraisal assumptions
(i) VAT
5.21 For simplicity it has been assumed throughout that either VAT does not arise, or its effect
can be ignored.
(ii) Interest rate
5.22 Our appraisals assume 7.5% pa (Minimum Lending Rate April 2008 plus 2.5%) for interest
on both outgoings and receipts. The latter would in practice only arise for a short period at
the end of the scheme.

Taunton & South Somerset Af fordable Hous ing Si te Viab i l i ty Study
Page 36
(iii) Developers profit
5.23 We normally assume that the developer requires a return of 20% on Total Costs (or 16.7%
of the Net Development Value) to reflect the risk of undertaking the development. That
assumes that the costs are estimates of costs, as they are indeed here intended to be,
rather than contract prices which would include a profit element.
5.24 However, where a guaranteed sale applies, the developer’s profit margin ought to be
reduced, in order to reflect the reduction in risk. The affordable units will be sold at an
agreed price and programme. With a range of affordable provision being tested, it was felt
appropriate to reflect the resulting variations in risk with variations in the developer’s profit.
Consequently a sliding scale of profit margins was used, as shown below. It should be
noted that residential developers commonly use a more conservative profit margin of 15%
on income, which equates to about 17.5% on costs.
Table 5.6 Profit margins
% affordable Profit % on costs
0% 20%
15% 19.25%
30% 18.5%
45% 17.75%
Source: Fordham Research
(iv) Void
5.25 On a scheme comprising mainly individual houses, one would normally assume only a
nominal void period, as the housing would not be progressed if there was no demand. In
the case of apartments in large blocks, this flexibility is reduced. Whilst these may provide
scope for early marketing, the ability to tailor construction pace to market demand is more
limited. For the purpose of the present study a three month void period is assumed for all
sites.
(v) Phasing and timetable
5.26 The appraisals are assumed to have been prepared using prices and costs at a base date
of May 2008, with an immediate start on site. A pre-construction period of six months is
assumed for most sites but it is extended to nine months to allow adequately for site
clearance and preparation work on the Gerber Foods site. Dwellings are built over a 12
month period.
5.27 The phasing programme for an individual site will reflect market take-up, and would in
practice be carefully estimated taking into account the site characteristics and, in particular,
size and the expected level of market demand. We have developed a suite of modelled
assumptions to reflect site size and development type, as set out in Table 5.7 below.

5. Assumpt ions for v iab i l i ty analys is
Page 37
Table 5.7 Market pace assumptions
Site No of dwgs Ceiling level of
completions per qtr
2A Gerber site Bridgwater 320 14
1A Deanesly Way Wincanton 212 12
5B Stogursey 59 10
5A South Petherton 55 10
4B Clanville Gr Minehead 44 8
6A Kings Yd Bishops Lydeard 32 7
4A County Garage Taunton 24 12
4B Touches Chard 24 5
7A Dabinetts Cl Norton Fitzwarren 11 3
8A opp rail station Bridgwater 10 3
9A Ilchester Rd Yeovil 2 2
9B Pittacre Ho Bridgwater 2 2
Source: Fordham Research
Site acquisition and disposal costs
(i) Site holding costs and receipts
5.28 Each site is assumed to proceed immediately and so, other than interest on the site cost
during construction, there is no allowance for holding costs, or indeed income, arising from
ownership of the site.
(ii) Acquisition costs
5.29 Acquisition costs include stamp duty at 4% on site values of £0.5 million and above
(reduced below this level), together with an allowance of 2.75% for acquisition agents’ and
legal fees.
(iii) Disposal costs
5.30 For the market housing, sales/promotion and legal fees are assumed to amount to some
3.5% of receipts, i.e. allowing for a relatively modest amount of discounting and
promotional activity. For disposals of affordable housing these figures can be reduced
significantly as sales costs for this housing should not normally arise: we have assumed
total allowances of 0.5% for social rented housing.

Taunton & South Somerset Af fordable Hous ing Si te Viab i l i ty Study
Page 38
Alternative use value comparison
5.31 In the previous chapter we identified alternative use values to be used as benchmarks in
determining viability for each site. As we saw above, these values would need to be
adjusted in some cases to allow for abnormal costs that would arise if the alternative use
were implemented. The values in Chapter 4 are adjusted to net off these abnormals in the
table below.
Table 5.8 Alternative use value figures
Alternative use value £k per acre
No Site Item Gross
Abnormal
cost adj
Net of
abnormals
1A Wincanton Agricultural £10k - £10k
1N Taunton North Agricultural £10k - £10k
2A Bridgwater W Industrial £285k £10k £275k
2N Yeovil E Industrial £285k £10k £275k
3A Chard Agricultural £10k - £10k
3N Bridgwater E Agricultural £10k - £10k
4A Taunton C Industrial £285k £90k £195k
4B Minehead Unique £300k - £300k
4N Chard Unique £300k £300k
5A S Petherton Agricultural £10k - £10k
5B Stogursey Agricultural £10k - £10k
6A Bishops Lydeard Industrial £175k £30k £145k
6N Castle Cary Industrial £175k £30k £145k
7A Norton Fitzwarren Agricultural £10k - £10k
7N Langport Agricultural £10k - £10k
8A Bridgwater E Garden land £100k - £100k
8N Yeovil Garden land £100k - £100k
9A Yeovil NE Garden land £100k - £100k
9B Bridgwater E Garden land £100k - £100k
Source: Fordham Research

6. Resul ts o f v iab i l i ty analys is
Page 39
6. Results of viability analysis
Introduction
6.1 This Section considers the results of financial appraisals carried out for the identified sites.
Financial appraisal approach and assumptions
6.2 Using the assumptions set out in Section 5, we prepared financial appraisals for each of the
identified sites, using a bespoke spreadsheet-based financial analysis package.
6.3 The appraisals use the residual valuation approach – that is, they are designed to assess
the value of the site after taking into account the costs of development, the likely income
from sales and/or rents, and an appropriate amount of developer’s profit. The resulting
valuation is commonly expressed in £s per hectare (or acre) and is known as the ‘residual
value’. In order for the proposed development to be described as viable, it is necessary for
this value to exceed the value from a valid alternative use. We have already seen that, for a
greenfield site, where the only alternative use is likely to be agricultural, this figure may be
very modest. However, today an increasing proportion of sites that come forward will have
been previously developed, and therefore may have a more substantial existing or
competing alternative use value.
6.4 As outlined in Section 3, our appraisals considered three options for the amount and type of
affordable housing provision - assuming this is a mix of social rented and intermediate
housing with a split of 60/40 or alternatively, 80/20 - plus a zero affordable option.
6.5 Several developer members of the Partnership proposed an alternative model for dealing
with the situation where the total burden of planning gain put the viability of a particular site
in question. This model was based upon a formula that allocated the available value
between the landowner/developer and the total burden of Planning Gain.
6.6 Following a meeting of a Partnership sub-group to discuss this approach and consideration
of a subsequent paper prepared by the developers it was not possible to reach agreement
on the proposed approach.
Appraisal results:
6.7 We produced financial appraisals based on the stated build, abnormal, and infrastructure
costs, and financial assumptions for the various options (six affordable options, plus all-
market).

Taunton & South Somerset Af fordable Hous ing Si te Viab i l i ty Study
Page 40
6.8 Detailed appraisal printouts for all the sites are provided as Appendix 4 to this report. To
keep to a manageable document, only the 15% option has been provided.
6.9 The resulting residual land values for the four (3 + 1) options at 60/40 are set out in Table
6.1.
Table 6.1 Appraisal results for four affordable options at 60/40
Zero grant
Residual value £k per acre for affordable option: No Site
No aff 15% 30% 45%
1A Wincanton 544 358 171 (-20)
1N Taunton 470 284 118 (-62)
2A Gerber Bridgwater 372 189 5 (-189)
2N Yeovil E 205 48 (-114) (-279)
3A Chard 485 338 191 40
3N Bridgwater N 534 378 222 62
4A Taunton 578 89 (-424) (-946)
4B Minehead 576 348 119 (-121)
4N Chard 97 (-73) (-246) (-422)
5A South Petherton 775 583 388 192
5B Stogursey 613 458 300 140
6A Bishops Lydeard 1,231 922 607 292
6N Castle Cary 780 530 279 20
7A Norton Fitzwarren 473 325 180 27
7N Langport 644 474 301 119
8A opp station Bridgwater 674 438 199 (-87)
8N Yeovil 475 267 47 (-172)
9A Yeovil 704 508 310 110
9B Pittacre Ho Bridgwater 255 105 (-47) (-202)
Source: Strategic Housing Viability Study
6.10 Table 6.1 shows that with no requirement for affordable housing the sites deliver a wide
range of residual land values, ranging from around £100k per acre (£250k per ha) to £1.23
m per ha (£3.04 m per ha).
6.11 After adjusting for additional development costs and our planning gain assumptions, values
are mostly somewhat below what the VOA figures and other sources indicate for ‘oven
ready’ land in Taunton, and a little below what was suggested by small sites actually on the
market. This confirms that our appraisal assumptions are, taken as a whole, unlikely to be
unduly optimistic, although our figures will take more account of the current market situation
than other historic sources can.

6. Resul ts o f v iab i l i ty analys is
Page 41
6.12 Table 6.1 confirms that, as increasing amounts of affordable housing are introduced, the
land value falls away. In each case the impact is progressive, but at a broadly linear rate. At
the maximum affordable contribution, 45%, about half of the schemes still deliver a positive
land value, although in most cases it is quite a low figure.
6.13 However, it is clear that land value falls away more quickly for some schemes, than for
others. It is the most densely developed sites – site 4A County Garage, and to a slightly
lesser extent sites 6A and 8A - where affordable housing has the greatest negative impact
upon land value. This is because the land value is the primary source of any developer
subsidy. With the high density schemes, land value is a much lower proportion of the total
value of the development, and is therefore used up more quickly. To put it another way,
broadly the same amount of land value would be available to subsidise affordable units on
a scheme of 120 flats on one hectare, as on 35 houses occupying the same land. Clearly,
that sum will ‘buy’ a higher percentage of the houses, than of the flats.
6.14 In order to draw out the implications of these results for the Councils’ proposed affordable
housing policies, as has already been suggested, it will be necessary to consider values
from alternative uses for each. This step follows below.
Alternative use benchmarks
6.15 The results from Table 6.1 would need to be compared with the alternative use values set
out in Table 5.8 in order to form a view about the likely viability of the affordable options for
each site.
6.16 However it does not automatically follow that if the residual value produces a surplus over
the alternative use value benchmark, the site is viable. The surplus needs to be sufficiently
large both (a) to provide an incentive to the landowner to release the site and (b) to cover
any other costs necessary to bring the site forward for development. We therefore have to
consider how large such a ‘cushion’ should be for each of our sites.
6.17 The point has been made to us in local discussion that in some cases the total size of the
cushion required to cover both elements, and particularly (b), may really be quite large. Our
attention was drawn to the exceptionally long gestation period for the South Somerset
Local Plan. Examples were provided to show that some potential greenfield allocations in
particular had involved years of promotion, consultancy work, successive option payments,
and so on, as well as a risk that this expenditure could ultimately prove abortive. Even
without this added difficulty, the costs of site assembly, or on brownfield sites, the costs of
relocating an employer, could all be considerable.

Taunton & South Somerset Af fordable Hous ing Si te Viab i l i ty Study
Page 42
6.18 Whilst this information was noted, it did not provide a basis for deriving an appropriate
allowance for each site to apply in a strategic study like the present one from the
information available. Each site’s history is unique. It is possible to argue that some sites
are pursued against the grain of policy.
6.19 The changes made to the planning system in the move to LDFs, the involvement of
stakeholders in exercises like the present one, the Strategic Housing Land Availability
Assessments (SHLAAs) and the SHMA, are all designed to ensure greater flexibility and
shorter Plan preparation periods, and to avoid the pursuit at length of inappropriate site
proposals. The costs under (b) of sites coming forward from now on should not therefore be
based on the costs incurred in the past.
6.20 Even if these points did not apply, we would suggest that the professional fee assumptions
in Chapter 5 are somewhat generous, say, for a site with outline residential permission.
They would in fact allow for a degree of preliminary consultancy work of the kind
envisaged, and particularly on larger sites. The extent of this ‘allowance’ might equate to
£30-35k per acre typically, and even more on higher density sites.
6.21 After consideration appropriate figures were determined for the size of a combined cushion
to provide an incentive to the landowner and to allow for expenses in bringing the site
forward. The figures are set out below and combined with the net alternative use values
from Table 5.8 to show the resulting benchmark thresholds for viability.
6.22 A group of land promoters and developers, who formed part of the Housing Market
Partnership which worked on this report, were not able to agree that the size of the
proposed combined cushion would be sufficient to ensure adequate supply of land for
development to meet the assumptions made elsewhere in the SHMA. The Housing Market
Partnership was not able to reach agreement on the quantum of the combined cushion
proposed in this report. The Partnership has approved this report on the basis that this
difference of opinion remains unresolved

6. Resul ts o f v iab i l i ty analys is
Page 43
Table 6.2 Viability cushion & threshold values
Ref Site no of
dwgs
Cushion
£ per acre
Threshold
£ per acre
Greenfield
1A Deanesley Way Wincanton 212 £115k £125k
5A St Michael’s Gdns S Petherton 55 £90k £100k
5B Paddons Field Stogursey 59 £90k £100k
3A Touches Chard 24 £75k £85k
7A Dabinett Cl Norton Fitzwarren 11 £65k £75k
Garden land
8A Opp rail station Bridgwater 10 £60k £160k
9A Ilchester Rd Yeovil 2 £40k £140k
Brownfield
2A Gerber Factory Bridgwater 330 £90k £365k
4A Priory Ave Taunton 24 £75k £270k
4B Clanville Grange Minehead 48 £75k £375k
6A Kings Yard Bishops Lydeard 32 £75k £220k
Source: Strategic Housing Viability Study
6.23 It must be emphasised that these figures are simply a view of what it is reasonable to
assume as a minimum residual value for the purposes of assessing viability. The figures do
not represent what a landowner or promoter might actually receive. This will quite often be
rather more: at any given affordable target some sites will be generate a higher value, and
it is not unreasonable to expect at least some of the surplus to benefit the landowner/
promoter, rather than passing to the developer.
6.24 Table 6.3 below shows the results of comparing the figures in the two previous tables
(Table 6.1 appraisals results and 6.2 viability benchmark values).

Taunton & South Somerset Af fordable Hous ing Si te Viab i l i ty Study
Page 44
Table 6.3 Appraisal outcomes – 60/40
Value £k per acre
No Site Alt use value/
threshold 15% 30% 45%
1A Wincanton 10/125 358
VIABLE
171
VIABLE
(-20)
NOT VIABLE
1N Taunton 10/125 284
VIABLE
118
MARGINAL
(-62)
NOT VIABLE
2A Gerber Bridgwater 275/365 189
NOT VIABLE
5
NOT VIABLE
(-189)
NOT VIABLE-
2N Yeovil E 275/365 48
NOT VIABLE
(-114)
NOT VIABLE
(-279)
NOT VIABLE
3A Chard 10/85 338
VIABLE
191
VIABLE
40
MARGINAL
3N Bridgwater N 10/85 378
VIABLE
222
VIABLE
62
MARGINAL
4A Taunton 185/260 89
NOT VIABLE
(-424)
NOT VIABLE
(-946)
NOT VIABLE
4B Minehead 300/375 348
MARGINAL
119
NOT VIABLE
(-121)
NOT VIABLE
4N Chard 300/375 (-73)
NOT VIABLE
(-246)
NOT VIABLE
(-422)
NOT VIABLE
5A South Petherton 10/100 583
VIABLE
388
VIABLE
192
VIABLE
5B Stogursey 10/100 458
VIABLE
300
VIABLE
140
VIABLE
6A Bishops Lydeard 145/220 922
VIABLE
607
VIABLE
292
VIABLE-
6N Castle Cary 145/220 530
VIABLE
279
VIABLE
20
NOT VIABLE
7A Norton Fitzwarren 10/75 325
VIABLE
180
VIABLE
27
MARGINAL
7N Langport 10/75 474
VIABLE
301
VIABLE
119
VIABLE
8A Opp station Bridgwater 100/160 438
VIABLE
199
VIABLE
(-44)
NOT VIABLE
8N Yeovil 100/160 267
VIABLE
47
NOT VIABLE
(-172)
NOT VIABLE
9A Yeovil 100/140 508
VIABLE
310
VIABLE
110
MARGINAL
9B Pittacre Ho Bridgwater 100/140 105
MARGINAL
(-47)
NOT VIABLE
(-202)
NOT VIABLE
Source: Strategic Housing Viability Study

6. Resul ts o f v iab i l i ty analys is
Page 45
Comparison results
6.25 The results of the zero option have been omitted for simplicity. With zero affordable
housing, one site is in fact not viable – a notional development using a built form from a
relatively high priced area. Residential development as 100% market housing is of course a
relatively profitable development option, and the sites should not be proposed for
development otherwise. In this situation we may have done better with an alternative built
form; Clanville Grange would have been quite a difficult site.
6.26 Turning to the various levels of affordable contribution, at 15% 14 of the 19 sites are viable.
One further site produces a surplus over the alternative use value benchmark, but not to
the full value of the required cushion; in these circumstances we would describe viability as
marginal. Four sites are unviable.
6.27 Increasing to 30%, the marginal site becomes unviable, and two others become unviable.
However 12 out of the 19 are viable. Moving to 45%, four more sites become unviable, and
a further four sites become marginal, leaving only four sites viable.
6.28 A corresponding table has been produced with the 80/20 tenure split. The higher social
rented numbers reduce the land value, by increasing amounts as the affordable proportion
increases. At 15%, the impact is to reduce land value typically by about £10k per acre,
which will have a relatively minor impact; however, by 45% the difference is three times as
much.

Taunton & South Somerset Af fordable Hous ing Si te Viab i l i ty Study
Page 46
Table 6.4 Appraisal outcomes – 80/20
Value £k per acre
No Site Alt use value/
threshold 15% 30% 45%
1A Wincanton 10/125 349
VIABLE
152
VIABLE
(-50)
NOT VIABLE
1N Taunton 10/125 286
VIABLE
99
MARGINAL
(-93)
NOT VIABLE
2A Gerber Bridgwater 275/365 179
NOT VIABLE
(-16)
NOT VIABLE
(-220)
NOT VIABLE-
2N Yeovil E 275/365 39
NOT VIABLE
(-133)
NOT VIABLE
-(-309)
NOT VIABLE
3A Chard 10/85 333
VIABLE
174
VIABLE
14
MARGINAL
3N Bridgwater N 10/85 369
VIABLE
204
VIABLE
34
MARGINAL
4A Taunton 185/260 63
NOT VIABLE
(-476)
NOT VIABLE
(-1,021)
NOT VIABLE
4B Minehead 300/375 339
MARGINAL
103
NOT VIABLE
(-149)
NOT VIABLE
4N Chard 300/375 (-83)
NOT VIABLE
(-267)
NOT VIABLE
(-452)
NOT VIABLE
5A South Petherton 10/100 575
VIABLE
373
VIABLE
169
VIABLE
5B Stogursey 10/100 452
VIABLE
288
VIABLE
122
VIABLE
6A Bishops Lydeard 145/220 909
VIABLE
582
VIABLE
255
VIABLE-
6N Castle Cary 145/220 517
VIABLE
254
VIABLE
(-18)
NOT VIABLE
7A Norton Fitzwarren 10/75 318
VIABLE
163
VIABLE
1
NOT VIABLE
7N Langport 10/75 466
VIABLE
285
VIABLE
94
VIABLE
8A opp station Bridgwater 100/160 424
VIABLE
171
VIABLE
(-87)
NOT VIABLE
8N Yeovil 100/160 250
VIABLE
23
NOT VIABLE
(-210)
NOT VIABLE
9A Yeovil 100/140 501
VIABLE
295
VIABLE
87
NOT VIABLE
9B Pittacre Ho Bridgwater 100/140 95
NOT VIABLE
(-67)
NOT VIABLE
(-231)
NOT VIABLE
Source: Strategic Housing Viability Study

6. Resul ts o f v iab i l i ty analys is
Page 47
6.29 The material impact of the switch to 80/20 is really very slight. At 15% one site marginal at
60/40 becomes unviable; at 30% there is no change; at 45% two marginals become
unviable. However it is possible that if other percentage options had been tested, more
movement than this would occur.
6.30 We address the implications of these results for future policy in the final Section of this
document. However before doing so we provide alternative appraisals allowing the
introduction of a Community Infrastructure Levy at £13,000 and £20,000 per dwelling.
Community Infrastructure Levy
6.31 Alternative appraisals were prepared assuming Community Infrastructure Levy (CIL) based
developer contributions at £13k and £20k per dwelling across the board, rather than the
site by site contributions set out in Table 3.3 and used in the base appraisals discussed
above. Tables setting out the results as in Table 6.3 for the base appraisals are provided in
Appendix 3.
6.32 The contributions figures increase by between £3.5k/£10.5k respectively per dwelling (site
2N) and £11k/£18k (sites 8A and 9B), and hence bear especially heavily on the smaller
sites. As might be expected, the impact on viability is quite considerable. The results are
summarised in the table below.
Table 6.5 CIL appraisal summary
No of sites viable with affordable %
15% 30% 45%
Base appraisals
Viable 13 11 4
Marginal 2 1 4
Not viable 4 7 11
CIL £13k
Viable 11 6 1
Marginal 1 3 2
Not viable 7 10 16
CIL £20k
Viable 10 5 0
Marginal 1 0 1
Not viable 8 14 18
Source: Strategic Housing Viability Study

Taunton & South Somerset Af fordable Hous ing Si te Viab i l i ty Study
Page 48
6.33 With no affordable housing and a £13k CIL, three sites are unviable and two marginal. If
the CIL increased to £20k, seven of the sites would become unviable (none marginal). It is
clear this level of contribution would place a considerable burden on viability.
6.34 Any proposals for a Community Infrastructure Levy remain un-quantified at this stage. For
the purpose of comparison, a tariff with a figure of £17.5k (indexed) already operates in
Milton Keynes. The £20k option tested here is equivalent to the quoted broad additional
cost of moving to Level 6 of the Code for Sustainable Dwellings. The impact of Level 6 will
be quite considerable, unless the additional costs can be recovered through significantly
enhanced sales values.

7. Impl icat ions of resu l ts
Page 49
7. Implications of results
Our approach
7.1 The purpose of the Viability Study was to assess the impact of alternative affordable
housing requirements upon development viability. In order to provide appropriate guidance,
we have produced financial appraisals in respect of residential developments on a range of
sites, in this case through a combination of ‘actual’ and ‘notional’ sites selected in
discussions between the four Councils. Our approach has involved the use of ‘model’
developments for the sites, to a greater or lesser extent, in conjunction with a bespoke
financial appraisal package, to arrive at residual valuations for each site under a series of
affordable housing options.
7.2 In order to prepare financial appraisals, whether for a general study like this, or on behalf of
a landowner or developer proposing a specific development, it is necessary to make quite a
considerable number of assumptions. We believe that in general the assumptions we have
made are fair and reasonable. They reflect considerable experience drawn from a variety of
development situations and are designed to reflect the circumstances of each site which,
over a substantial area like the study area, combining a substantial urban area with a
predominantly rural hinterland, are going to be diverse. The appraisal results would
produce open market land values which compared to other information about values in the
area, are if anything somewhat lower. This strongly suggests that the package of
development assumptions is not, taken as a whole, unduly optimistic.
7.3 The relatively low land values emerging also reflect two other factors which we will need to
take into account when reflecting on the appraisal results:
• The assumption of Level 3 of the Sustainability Code for both market and affordable
homes, without any offsetting uplift in values.
• The onset of what was, as the study got under way, recognised to be a dramatic
market downturn.
7.4 A key set of assumptions are those in respect of the range of developer contributions,
financial and in kind, that would be required from each of the developments. The
assumptions needed to be, firstly, consistent across the whole area, so as to provide a
strategic view at HMA level. Secondly, they had to be defensible; appraisals must not
underestimate the true contributions burden.

Taunton & South Somerset Af fordable Hous ing Si te Viab i l i ty Study
Page 50
7.5 The financial appraisals produce a series of residual values showing the value generated
for each site, under various affordable scenarios. In an exercise of this nature, the figures
have to be interpreted in order to draw conclusions for LDF policies. We have suggested a
basis for interpretation which draws on indicative alternative use values. Again, as a broad
brush approach, we believe this to be reasonable; producing detailed assessments and
valuations for each site would involve resources well beyond the scope of the current
exercise, and we suspect would probably still leave room for disputation.
7.6 There are considerable variations in house prices in different parts of the study area. Many
of the chosen sites are, it appears, in lower to medium priced areas, though not all of them.
We feel, again, that we have covered the ‘worst case’, by fully including locations in which
viability is (other things equal) likely to be worst. The range of sites includes both smaller
and larger sites, straightforward and complex development situations, greenfield sites and
previously developed land.
7.7 In estimating the values which developers would be likely to achieve from affordable
housing, we have drawn on information provided by locally active RSLs. Although we
received responses from only four RSLs these showed a degree of consensus and we
think that a fuller response would be unlikely to affect our values significantly.
7.8 Our study forms an element of the ongoing work of a Strategic Housing Market
Assessment for the area covered by the four Councils and, being prepared alongside that
work to some extent, could not take full account of the end results of that study. We have
taken a strategic approach, rather than seeking to reflect specific variations in the policy
detail, the arrangements and procedures which individual Councils use in negotiating
affordable housing (and other S106 matters) site by site, which at this time may in any case
be generally subject to review.
Implications of appraisal results
7.9 The viability study tested affordable target proportions up to a maximum of 40%, reflecting
the highest proportion which is currently being considered within the study area. The
Strategic Housing Market Assessment has established that the levels of identified housing
need would justify affordable targets well in excess of 40%, across the whole study area.
7.10 The results from the appraisals suggest that under zero grant conditions, a proportion of
30% could reasonably be sought in many parts of the study area. Indeed several sites
would be viable at 45%, whether with a tenure split of 60/40 or one of 80/20, in that they
deliver a residual value comfortably in excess of the site’s value in an alternative use.
Bearing in mind that the sites have focussed to some degree on the towns, which are on
the whole the lower to medium priced locations, that is a satisfactory outcome.

7. Impl icat ions of resu l ts
Page 51
7.11 There are of course parts of the two housing market areas where house prices are
significantly below average, and where consequently at the present price level a target of
much over 30% would not be sensible.
7.12 Viability varies from site to site for other reasons than price variations. For instance, we are
aware that on higher density schemes of mainly or wholly flats, it is more difficult to deliver
high proportions of affordable housing whilst achieving a viable development. The appraisal
results display this pattern. It comes about primarily because the affordable housing
subsidy comes from land value, and there is proportionately much less land value available
on such higher density schemes than on a more suburban density development.
7.13 Viability is also crucially dependent on the alternative use value. Where there is a valid
alternative use for a previously developed site as industrial/warehousing, or some other
commercial activity, the value in that use sets the bar rather higher than for a greenfield or
otherwise undeveloped site. Whilst undeveloped sites, more especially the larger ones, will
face higher development costs, the appraisals suggest that it is somewhat easier to
achieve viability on these sites. Small rural sites, without major infrastructure requirements,
do very well because the ‘bar’ is so low (and because present S106 requirements are light),
indicating that these sorts of site could carry a very low size threshold fairly comfortably.
7.14 In considering the implications for an individual Council’s affordable housing policy of
studies like the present one, we must recognise the complexity and diversity of the
development process in reality. There will always be sites and development proposals
which, because of exceptional circumstances – abnormal development costs associated
with the site; particularly onerous development contribution requirements; an exceptionally
high alternative user value; low market prices in a particular locality, and so on - cannot
deliver a full affordable housing requirement and remain viable.
7.15 The appraisals assume that all dwellings, market and affordable, will be built to Level 3.
Given that Level 3 is to be a national requirement from 2010, it seems a sensible
assumption to be making at this point. However Level 3 imposes additional build costs
which we have assumed cannot be recovered from enhanced values.
7.16 Furthermore, it is the Government’s intention that Level 4 would apply from 2013 and Level
6, from 2016. With what is currently known about technology, the additional costs of these
further changes are going to be more considerable. They may well push developers to
focus rather more on premium and niche products where the additional costs can be,
wholly or at least partially, recovered in enhanced prices, though with the present
regulatory framework it is difficult to see how that could apply to the affordable elements.
Whatever happens, the impact on viability following the changes is a matter for concern.

Taunton & South Somerset Af fordable Hous ing Si te Viab i l i ty Study
Page 52
7.17 A further issue which emerged as the appraisal work was nearing completion was clear
evidence of a serious market downturn. Whilst commentators in recent years have
repeatedly argued that the imbalance between prices and affordability suggested a
significant downwards adjustment in price levels was imminent, until now no such
adjustment has been forthcoming. However at the time of writing (July 2008) it has become
apparent that nationally, a shortage of mortgage supply and general lack of confidence are
impacting quite seriously on sales, and hence on prices. The price downturn is in our view
reflected in our appraisal results.
7.18 Viability is likely to continue to deteriorate in the short term. On the other hand, the view is
widely held that the supply of homes in total is falling short of demand, so that upward
movement in prices is likely to resume sooner rather than later. However, realistically no
study such as this can provide more than a snapshot. It cannot predict what is going to
happen, and the appropriate course is to revisit the figures at regular intervals to index and
update them. The unfolding situation will have to be borne in mind in formulating policy
targets, whilst recognising that any new targets informed by the present study are likely to
remain in place for a considerable period of time.
Individual Council areas: guidance
7.19 Implications for individual Councils’ policies are examined in the main SHMA study report,
which brings together the evidence of need and demand with the viability work and other
evidence, to develop suggestions for affordable housing policy and practice.

Appendices
Page 53
Appendices

Taunton & South Somerset Af fordable Hous ing Si te Viab i l i ty Study
Page 54

Appendix 1 . Newbui ld schemes
Page 55
Appendix 1. Newbuild schemes
A1.1 The schedule overleaf provides details of a number of current newbuild developments in
the study area.

Taunton & South Somerset Af fordable Hous ing Si te Viab i l i ty Study
Page 56
Table A1.1 Newbuild schemes
Site/location Builder no of
dwgs Range of dwgs
Prices
currently
available
Taunton Area
Urban Retreat Pollard Way Gadd 57 2 bed flats, 2 3 & 4 bed
houses
£149-
£220k
Old Cider Works
Norton Fitzwarren Barratt 50 +
2 bed flats 3 & 4 bed
houses
£148-
£206k
The Grove Woodstock Rd Gadd 4 3 & 4 bed houses £272-
£293k
Aspect Corporation St Gadd 50 studio & 1 bed flats £89k
Firepool Lock Gadd 104 1 2 & 3 bed flats 4 & 5
bed houses £125k
Regency Mews Strongvox 23 1 3 & 4 bed houses £188-
£425k
Trevelyan Court Wiltson St na 2 bed flat £179k
One Twenty Two East Reach Strongvox na 2 bed flat £156k
Stogumber Gadd 9 3 & 5 bed houses £275k-
£540k
Trinity, Trinity St Bouge na studio & 1 bed flats £99-£125k
Brendon Court Greatworth 12 1 & 2 bed flats £117k
East Eleven Summerfield 11 1 & 2 bed flats £119k
Hunts Court Corporation St CS Williams 7 1 & 2 bed flats £125k
Bridgwater Area
Festival Barratt na 1 & 2 bed flats 2 3 & 4
bed houses £98-£140k
Stockmoor Parade N Petherton Barratt na 2 bed flats 3 & 4 bed
houses
£132-
£299k
Rio Barratt na 2 bed flats £98k
The Gates Bloor Homes na 2 3 4 & 5 bed houses £139-
£345k
Yeovil
Mosaic Gleeson na 1 2 3 & 4 bed homes £215-
£220k
Wyndham Court McCarthy &
Stone 69 1 & 2 bed retirement
£129-
£149k
Ilchester Rd Pearce 2 3 bed bungalows £319-
£345k

Appendix 1 . Newbui ld schemes
Page 57
Other South Somerset
Glebelands Court S Petherton Persimmon 2 3 & 4 bed houses £165-289k
Hardings Court S Petherton ? 4 bed houses £425-
£439k
The Gables Chard Morrish 24 2 & 3 bed houses £145-
£189k
Furndale Park Chard Persimmon 67 1 2 3 & 4 bed houses £144-
£199k
Balsam Gardens Wincanton Bloor 15 3 4 & 5 bed houses £159-
£384k
Minehead area
Clanville Grange Barratt 48 1 & 2 bed flats 3 bed
houses
£155-
£209k
Premier Court Alcombe 14 2 3 & 4 bed houses £185-
£210k
Source: Strategic Housing Viability Study

Taunton & South Somerset Af fordable Hous ing Si te Viab i l i ty Study
Page 58

Appendix 2 . House pr ice var ia t ions
Page 59
Appendix 2. House price variations
A2.1 The indices in the table which follows compare prices in each postcode sector in the four
Districts with an England & Wales ‘average’ figure – actually the median postcode value.
The indices are standardised, to eliminate the effect of variations in type mix; separate
indices for each house type are combined with weightings based on the mix of overall
sales.
Table A2.1 Price variations by postcode sector
Postcode
sector LAs Areas covered Q4 2007 Q2 2007
TA6 4 S Bridgwater N & E 80% 74%
TA6 5 S Bridgwater SE 82% 82%
TA20 1 SS Chard 87% 88%
BA21 4 SS Yeovil N Central 92% 84%
BA20 1 SS Yeovil Central 86% 94%
TA1 2 TD Taunton E 89% 92%
TA6 3 S Bridgwater Central 90% 91%
BA21 3 SS Yeovil NW 91% 92%
BA21 5 SS Yeovil NE 88% 96%
TA8 1 S Burnham South 92% 92%
TA6 6 S Petherton 94% 90%
TA9 3 S Highbridge 95% 90%
BA20 2 SS Yeovil SW 90% 96%
TA20 2 SS Tatworth 105% 82%
TA2 7 TD Taunton N Central 101% 87%
TA8 2 S Berrow, Bream 95% 95%
TA2 6 TD Norton Fitzwarren 95% 96%
TA7 8 S Woolavington 99% 94%
TA21 9 TD Ford Street 88% 105%
TA18 8 SS Crewkerne NE, Chinnocks 104% 90%
TA18 7 SS Crewkerne 106% 89%
TA4 4 WS Williton, Crowcombe 105% 90%
TA23 0 WS Watchet, Washford 101% 95%
BA9 9 SS Wincanton, Cucklington 87% 110%
TA21 8 TD Wellington 101% 98%
TA6 7 S Bridgwater W, Wembdon 103% 104%
BA22 8 SS Ilchester, Tintinhull 96% 114%
TA12 6 SS Martock 109% 102%

Taunton & South Somerset Af fordable Hous ing Si te Viab i l i ty Study
Page 60
Table A2.1 (cont) Price variations by postcode sector
Postcode
sector LAs Areas covered Q4 2007 Q2 2007
BS25 1 S Shipham (+Winscombe) 94% 119%
TA7 0 S Westonzoyland 105% 109%
TA1 4 TD Taunton SW 98% 116%
TA10 9 SS Ham, Langport 102% 113%
BA7 7 SS Castle Cary 121% 96%
TA19 9 SS Horton, Puckington 109% 111%
TA2 8 TD Kingston St Mary 111% 109%
TA11 6 SS Somerton W, Dundon 108% 113%
TA16 5 SS Merriott 111% 111%
BS27 3 S Cheddar 105% 120%
TA24 8 WS Porlock 111% 114%
TA4 2 TD/WS Wivelscombe, Upton 117% 108%
BA10 0 SS Bruton, Cole 111% 115%
TA1 5 TD Taunton W 112% 116%
TA15 6 SS Montacute 122%
TA21 0 TD Thorne St Margaret 111% 118%
TA20 4 SS Chaffcombe, Cricket St Thomas 121% 109%
TA24 5 WS Minehead 117% 113%
BA8 0 SS Henstridge, Cheriton 123% 108%
TA1 1 TD Taunton Central 123% 108%
TA24 6 WS Dunster, Blue Anchor 123% 111%
TA7 9 S Edington 117% 116%
TA5 2 S Cannington 129% 106%
TA24 7 WS Simonsbath, Edgcott 96% 139%
TA4 1 TD Milverton 115% 120%
TA13 5 SS South Petherton 112% 125%
DT9 5 SS Milborne Port (+Alveston) 118% 120%
BA22 9 SS Hardingtons, Stoford 121% 118%
TA19 0 SS Ilminster, Cudworth 115% 129%
TA10 0 SS Drayton, Hambridge 124% 124%
TA1 3 TD Taunton S Central 129% 123%
BA22 7 SS Sparkford, Gilhampton 115% 138%
TA9 4 S Brent 114% 138%
TA14 6 SS Chiselborough 121% 134%
TA4 3 TD/WS Bishops Lydeard, Stogumber 127% 136%
DT9 4 SS Charlton Horethorne (+Sherborne N) 133% 131%
TA3 5 TD Creeches 130% 134%
TA11 7 SS Somerton E, Charlton 155% 113%
TA3 7 TD Blagdon 160% 115%
TA22 9 WS Dulverton 163% 113%
TA20 3 SS Buckland St Mary 106% 171%
TA5 1 S Nether Stowey, Stogursey 120% 158%
BA9 8 SS Wincanton W, Yarlington, Penselwood 167% 115%
BS26 2 S Allerton 144% 139%

Appendix 2 . House pr ice var ia t ions
Page 61
Table A2.1 (cont) Price variations by postcode sector
Postcode
sector LAs Areas covered Q4 2007 Q2 2007
TA3 6 SS/TD Curry Mallet, Curry 123% 172%
BS24 0 S Lympsham 157% 144%
BS28 4 S Wedmore 156% 146%
Source: Analysis of Land Registry data
1. Where a postcode sector includes areas inside and outside the Borough, the areas outside are
shown in brackets, as (+ Winscombe)
2. Data has been mix adjusted to remove differences in house type mix between postcode sectors;
individual indices have been calculated for each house type, and combined using weights
reflecting the nation-wide type mix. A worked example is provided below.
Table A2.2 Worked example for TA6 4 at Q4 2007
Land Registry data Q4 2007
Detached Semi Terraced Flat Total
England & Wales – median price £300,742 £186,364 £159,070 £151,707
England & Wales - no of sales 52,027 71,522 80,184 52,426 256,159
TA6 4 – ave price £275,875 £154,544 £126,315 £98,207
TA6 4 price as % E & W median
value 91.7% 82.9% 79.4% 64.7%
[ (52027 x 91.7%)+(71522 x 82.9%)+(80184 x
79.4%)+(52426 x 64.7%) ] / 256,159
Weighted average index for TA6 4 =
= 79.9%
Source: Strategic Housing Viability Study
Taunton & South Somerset Af fordable Hous ing Si te Viab i l i ty Study
Page 62

Appendix 3 . Addi t ional appra isa ls : 35% ta rget
Page 63
Appendix 3. Additional appraisals : 35%
target
A3.1 The Tables overleaf add the results from appraisals for a 35% affordable requirement tot eh
figures set out in Table 6.2

Taunton & South Somerset Af fordable Hous ing Si te Viab i l i ty Study
Page 64
Table A3.1 Appraisal outcomes – 60/40 (AUGMENTED)
Value £k per acre
No Site Alt use
value/
threshold
15% 30%
35% 45%
1A Wincanton 10/125 358
VIABLE
171
VIABLE
107
MARGINAL
(-20)
NOT VIABLE
1N Taunton 10/125 284
VIABLE
118
MARGINAL
58
NOT VIABLE
(-62)
NOT VIABLE
2A Gerber
Bridgwater 275/365
189
NOT VIABLE
5
NOT VIABLE
(-59)
NOT VIABLE
(-189)
NOT VIABLE-
2N Yeovil E 275/365 48
NOT VIABLE
(-114)
NOT VIABLE
(-169)
NOT VIABLE
(-279)
NOT VIABLE
3A Chard 10/85 338
VIABLE
191
VIABLE
143
VIABLE
40
MARGINAL
3N Bridgwater N 10/85 378
VIABLE
222
VIABLE
169
VIABLE
62
MARGINAL
4A Taunton 185/260 89
NOT VIABLE
(-424)
NOT VIABLE
(-597)
NOT VIABLE
(-946)
NOT VIABLE
4B Minehead 300/375 348
MARGINAL
119
NOT VIABLE
40
NOT VIABLE
(-121)
NOT VIABLE
4N Chard 300/375 (-73)
NOT VIABLE
(-246)
NOT VIABLE
(-306)
NOT VIABLE
(-422)
NOT VIABLE
5A South
Petherton 10/100
583
VIABLE
388
VIABLE
323
VIABLE 192
VIABLE
5B Stogursey 10/100 458
VIABLE
300
VIABLE
246
VIABLE
140
VIABLE
6A Bishops
Lydeard 145/220
922
VIABLE
607
VIABLE
500
VIABLE 292
VIABLE-
6N Castle Cary 145/220 530
VIABLE
279
VIABLE
192
MARGINAL
20
NOT VIABLE
7A Norton
Fitzwarren 10/75
325
VIABLE
180
VIABLE
128
VIABLE 27
MARGINAL
7N Langport 10/75 474
VIABLE
301
VIABLE
241
VIABLE
119
VIABLE
8A Opp station
Bridgwater 100/160
438
VIABLE
199
VIABLE
120
MARGINAL (-44)
NOT VIABLE
8N Yeovil 100/160 267
VIABLE
47
NOT VIABLE
(-24)
NOT VIABLE
(-172)
NOT VIABLE
9A Yeovil 100/140 508
VIABLE
310
VIABLE
244
VIABLE
110
MARGINAL
9B Pittacre Ho
Bridgwater 100/140
105
MARGINAL
(-47)
NOT VIABLE
(-99)
NOT VIABLE (-202)
NOT VIABLE
Source: Strategic Housing Viability Study

Appendix 4 . Var iant appra isa ls : communi ty in f ras t ruc ture levy
Page 65
Appendix 4. Variant appraisals : community
infrastructure levy
A4.1 The tables overleaf provide the results from variant appraisals which assume developer
contributions are paid at a flat rate levy of £13,000 and alternatively £20,000 per dwelling,
on every site.

Taunton & South Somerset Af fordable Hous ing Si te Viab i l i ty Study
Page 66
Table A4.1 Appraisal outcomes with CIL @ £13k – 60/40 tenure split
Value £k per acre
No Site Alt use value/
threshold 15% 30% 45%
1A Wincanton 10/125 240
VIABLE
53
MARGINAL
(-143)
NOT VIABLE
1N Taunton 10/125 176
VIABLE
(-1)
NOT VIABLE
(-186)
NOT VIABLE
2A Gerber Bridgwater 275/365 110
NOT VIABLE
(-77)
NOT VIABLE
(-270)
NOT VIABLE-
2N Yeovil E 275/365 (-31)
NOT VIABLE
(-195)
NOT VIABLE
-(-361)
NOT VIABLE
3A Chard 10/85 220
VIABLE
73
MARGINAL
(-84)
NOT VIABLE
3N Bridgwater N 10/85 261
VIABLE
104
VIABLE
(-62)
NOT VIABLE
4A Taunton 185/260 (-304)
NOT VIABLE
(-817)
NOT VIABLE
(-1,336)
NOT VIABLE
4B Minehead 300/375 190
NOT VIABLE
(-44)
NOT VIABLE
(-287)
NOT VIABLE
4N Chard 300/375 (-211)
NOT VIABLE
(-383)
NOT VIABLE
(-558)
NOT VIABLE
5A South Petherton 10/100 508
VIABLE
312
VIABLE
118
VIABLE
5B Stogursey 10/100 383
VIABLE
226
VIABLE
67
MARGINAL
6A Bishops Lydeard 145/220 757
VIABLE
443
VIABLE
128
NOT VIABLE-
6N Castle Cary 145/220 402
VIABLE
153
MARGINAL
(--112)
NOT VIABLE
7A Norton Fitzwarren 10/75 210
VIABLE
59
NOT VIABLE
(-96)
NOT VIABLE
7N Langport 10/75 373
VIABLE
199
VIABLE
16
MARGINAL
8A opp station
Bridgwater 100/160
154
MARGINAL
(-87)
NOT VIABLE
(-332)
NOT VIABLE
8N Yeovil 100/160 32
NOT VIABLE
(-187)
NOT VIABLE
(-407)
NOT VIABLE
9A Yeovil 100/140 440
VIABLE
243
VIABLE
42
NOT VIABLE
9B Pittacre Ho
Bridgwater 100/140
(-104)
NOT VIABLE
(-256)
NOT VIABLE
(-411)
NOT VIABLE
Source: Strategic Housing Viability Study

Appendix 4 . Var iant appra isa ls : communi ty in f ras t ruc ture levy
Page 67
Table A3.2 Appraisal outcomes with CIL @ £20k – 60/40 tenure split
Value £k per acre
No Site Alt use value/
threshold 15% 30% 45%
1A Wincanton 10/125 143
VIABLE
(-47)
NOT VIABLE
(-243)
NOT VIABLE
1N Taunton 10/125 80
MARGINAL
(-101)
NOT VIABLE
(-286)
NOT VIABLE
2A Gerber Bridgwater 275/365 1
NOT VIABLE
(-190)
NOT VIABLE
(-384)
NOT VIABLE-
2N Yeovil E 275/365 (-145)
NOT VIABLE
(-309)
NOT VIABLE
(-475)
NOT VIABLE
3A Chard 10/85 125
VIABLE
(-30)
NOT VIABLE
(-186)
NOT VIABLE
3N Bridgwater N 10/85 164
VIABLE
1
NOT VIABLE
(-164)
NOT VIABLE
4A Taunton 185/260 (-580)
NOT VIABLE
(-1,093)
NOT VIABLE
(-1,612)
NOT VIABLE
4B Minehead 300/375 58
NOT VIABLE
(-182)
NOT VIABLE
(-424)
NOT VIABLE
4N Chard 300/375 (-347)
NOT VIABLE
(-521)
NOT VIABLE
(-695)
NOT VIABLE
5A South Petherton 10/100 429
VIABLE
235
VIABLE
39
MARGINAL
5B Stogursey 10/100 310
VIABLE
152
VIABLE
(-8)
NOT VIABLE
6A Bishops Lydeard 145/220 636
VIABLE
323
VIABLE
4
NOT VIABLE-
6N Castle Cary 145/220 286
VIABLE
30
NOT VIABLE
(-238)
NOT VIABLE
7A Norton Fitzwarren 10/75 125
VIABLE
(-27)
NOT VIABLE
(-183)
NOT VIABLE
7N Langport 10/75 294
VIABLE
113
VIABLE
(-70)
NOT VIABLE
8A opp station
Bridgwater 100/160
(-30)
NOT VIABLE
(-271)
NOT VIABLE
(-516)
NOT VIABLE
8N Yeovil 100/160 (-150)
NOT VIABLE
(-371)
NOT VIABLE
(-591)
NOT VIABLE
9A Yeovil 100/140 388
VIABLE
191
VIABLE
(-12)
NOT VIABLE
9B Pittacre Ho
Bridgwater 100/140
(-237)
NOT VIABLE
(-389)
NOT VIABLE
(-544)
NOT VIABLE
Source: Strategic Housing Viability Study

Taunton & South Somerset Af fordable Hous ing Si te Viab i l i ty Study
Page 68

Appendix 5 . F inanc ia l appra isa l summar ies
Page 69
Appendix 5. Financial appraisal summaries
A4.1 The development viability summaries contained in the following pages set out the
assumptions and outputs of the viability appraisals for a 30% affordable ‘zero grant’
scenario.

Taunton & South Somerset Af fordable Hous ing Si te Viab i l i ty Study
Page 70

Appendix 5 . F inanc ia l appra isa l summar ies
Page 71
SITE 1A: Deanesly Way Wincanton

Taunton & South Somerset Af fordable Hous ing Si te Viab i l i ty Study
Page 72
Input assumptions
Scenario & option
Afford
able
15%
= 9
% s
ocia
l re
nte
d &
6%
inte
rmedia
te
South Somerset & Taunton HMAs
Dwellings
Site details
ave
flo
or
sp
ace
bu
ildsa
les
Site
1A Deanesley Way
Dwellings
gro
ss
ne
tco
st
va
lue
Location
Wincanton
sq
ft
sq f
tpe
r sq
ft
pe
r sq f
t
Are
a ha
4.8
3M
ark
et housin
g180.2
85.0
0%
1,0
17
1,0
00
84.5
0207.0
0
acre
s11.9
30.0
%
No d
wgs
212
Afford
able
soc rent
19.1
9.0
0%
1,0
17
1,0
00
84.5
069.0
0
Density d
w/h
a43.9
0.0
%
Afford
able
sh o
ship
12.7
6.0
0%
1,0
17
1,0
00
84.5
098.0
0
0.0
%
Aff o
ther A
0.0
0.0
0%
00
0.0
00.0
0
0.0
%
Aff o
ther B
0.0
0.0
0%
00
0.0
00.0
0
£k
Contingency
Tota
l212.0
100.0
0%
215,6
04
212,0
00
£18,2
18,5
38
£39,8
64,4
80
allo
wance
2.5
0%
455
Flo
ors
pace d
ensity
=17,7
63
net sq ft per acre
Development costs
sta
ndard
% b
uild
20.0
0%
3,7
35
Other costs
Pla
nnin
g414
£ p
er dw
elli
ng
Surv
ey
200
£ p
er dw
elli
ng
plu
s a
bnorm
als
1.1
%200
Mark
eting
0£ p
er dw
elli
ng
Tota
l21%
Design fees
on b
uild
costs
10.0
%1,8
67
Interest
% p
er annum
7.5
0%
on d
ev c
osts
0%
Notes
Planning gain
£ p
er dw
elli
ng
4,5
00
954
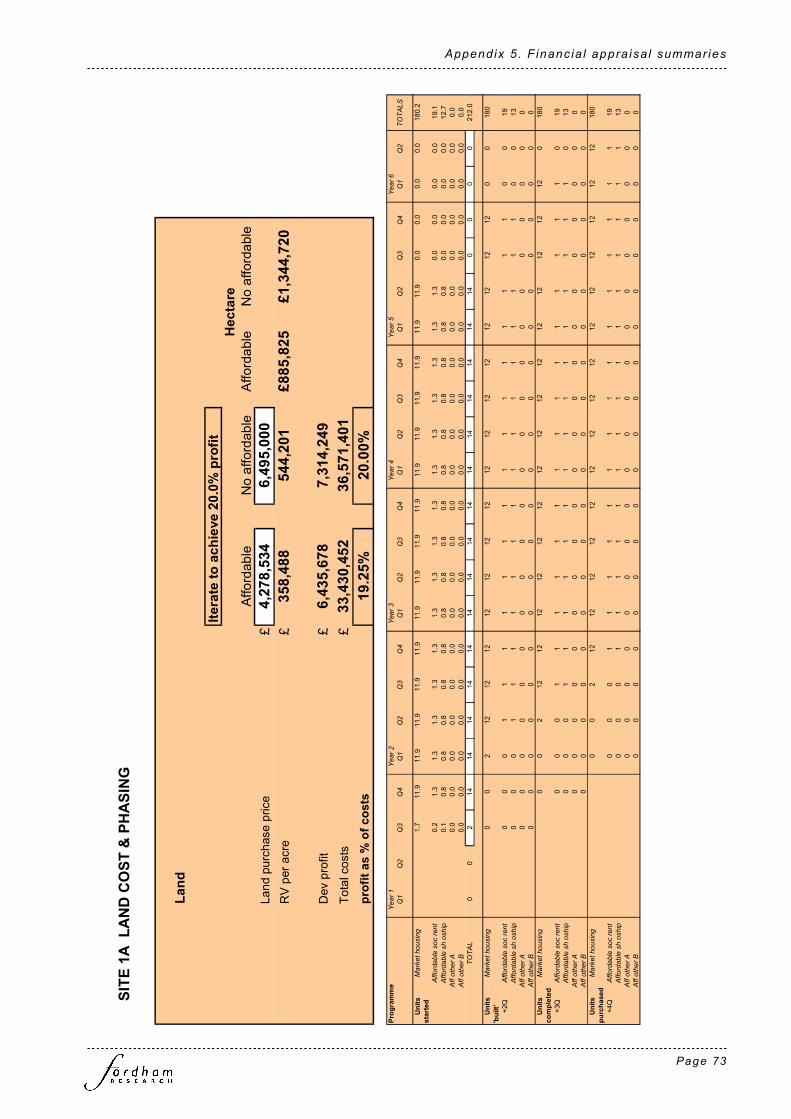
Appendix 5 . F inanc ia l appra isa l summar ies
Page 73
Land
Iterate to achieve 20.0% profit
Afford
able
No a
fford
able
Afford
able
No a
fford
able
Land p
urc
hase p
rice
£4,278,534
6,495,000
RV
per acre
£358,488
544,201
£885,825
£1,344,720
Dev p
rofit
£6,435,678
7,314,249
Tota
l costs
£33,430,452
36,571,401
profit as % of costs
19.25%
20.00%
Hectare
Programme
Ye
ar
1Y
ear
2Y
ea
r 3
Ye
ar
4Y
ea
r 5
Ye
ar
6
Q1
Q2
Q3
Q4
Q1
Q2
Q3
Q4
Q1
Q2
Q3
Q4
Q1
Q2
Q3
Q4
Q1
Q2
Q3
Q4
Q1
Q2
TO
TA
LS
Units
Ma
rke
t ho
usin
g1.7
11.9
11.9
11.9
11.9
11.9
11.9
11.9
11.9
11.9
11.9
11.9
11.9
11.9
11.9
11.9
0.0
0.0
0.0
0.0
180.2
started
Affo
rda
ble
so
c r
en
t0.2
1.3
1.3
1.3
1.3
1.3
1.3
1.3
1.3
1.3
1.3
1.3
1.3
1.3
1.3
1.3
0.0
0.0
0.0
0.0
19.1
Aff
ord
ab
le s
h o
sh
ip0.1
0.8
0.8
0.8
0.8
0.8
0.8
0.8
0.8
0.8
0.8
0.8
0.8
0.8
0.8
0.8
0.0
0.0
0.0
0.0
12.7
Aff
oth
er
A0.0
0.0
0.0
0.0
0.0
0.0
0.0
0.0
0.0
0.0
0.0
0.0
0.0
0.0
0.0
0.0
0.0
0.0
0.0
0.0
0.0
Aff
oth
er
B0.0
0.0
0.0
0.0
0.0
0.0
0.0
0.0
0.0
0.0
0.0
0.0
0.0
0.0
0.0
0.0
0.0
0.0
0.0
0.0
0.0
TO
TA
L0
02
14
14
14
14
14
14
14
14
14
14
14
14
14
14
14
00
00
212.0
Units
Ma
rke
t ho
usin
g0
02
12
12
12
12
12
12
12
12
12
12
12
12
12
12
12
00
180
'built'
+2Q
Affo
rda
ble
so
c r
en
t0
00
11
11
11
11
11
11
11
10
019
Aff
ord
ab
le s
h o
sh
ip0
00
11
11
11
11
11
11
11
10
013
Aff
oth
er
A0
00
00
00
00
00
00
00
00
00
00
Aff
oth
er
B0
00
00
00
00
00
00
00
00
00
00
Units
Ma
rke
t ho
usin
g0
02
12
12
12
12
12
12
12
12
12
12
12
12
12
12
12
0180
completed
+3Q
Affo
rda
ble
so
c r
en
t0
00
11
11
11
11
11
11
11
10
19
Aff
ord
ab
le s
h o
sh
ip0
00
11
11
11
11
11
11
11
10
13
Aff
oth
er
A0
00
00
00
00
00
00
00
00
00
0
Aff
oth
er
B0
00
00
00
00
00
00
00
00
00
0
Units
Ma
rke
t ho
usin
g0
02
12
12
12
12
12
12
12
12
12
12
12
12
12
12
12
180
purchased
+4Q
Affo
rda
ble
so
c r
en
t0
00
11
11
11
11
11
11
11
119
Aff
ord
ab
le s
h o
sh
ip0
00
11
11
11
11
11
11
11
113
Aff
oth
er
A0
00
00
00
00
00
00
00
00
00
Aff
oth
er
B0
00
00
00
00
00
00
00
00
00
SITE 1A LAND COST & PHASING

Taunton & South Somerset Af fordable Hous ing Si te Viab i l i ty Study
Page 74
Ye
ar
1Y
ear
2Y
ear
3Y
ear
4Y
ear
5Y
ear
6
rate
Q1
Q2
Q3
Q4
Q1
Q2
Q3
Q4
Q1
Q2
Q3
Q4
Q1
Q2
Q3
Q4
Q1
Q2
Q3
Q4
Q1
Q2
Q3
Q4
TO
TA
LS
INCOME
Housing sales
Mark
et h
ou
sin
g0
00
00
0352
2,4
63
2,4
63
2,4
63
2,4
63
2,4
63
2,4
63
2,4
63
2,4
63
2,4
63
2,4
63
2,4
63
2,4
63
2,4
63
2,4
63
2,4
63
00
37,3
01
Affo
rda
ble
so
c r
ent
00
00
00
12
87
87
87
87
87
87
87
87
87
87
87
87
87
87
87
00
1,3
17
Affo
rda
ble
sh
oship
00
00
00
12
82
82
82
82
82
82
82
82
82
82
82
82
82
82
82
00
1,2
47
Aff o
the
r A
00
00
00
00
00
00
00
00
00
00
00
00
0
Aff o
the
r B
00
00
00
00
00
00
00
00
00
00
00
00
0
Sa
les fee
s0
00
00
0-1
2-8
7-8
7-8
7-8
7-8
7-8
7-8
7-8
7-8
7-8
7-8
7-8
7-8
7-8
7-8
70
0-1
,325
Total income
00
00
00
376
2,633
2,633
2,633
2,633
2,633
2,633
2,633
2,633
2,633
2,633
2,633
2,633
2,633
2,633
2,633
00
39,864
COSTS
Land
Land
acqu
isitio
n4,2
79
4,2
79
Sta
mp d
uty
171
171
Pu
rch
ase fe
es
118
118
Total
4,567
Build costs
Mark
et h
ou
sin
g0
00
0146
1,0
23
1,0
23
1,0
23
1,0
23
1,0
23
1,0
23
1,0
23
1,0
23
1,0
23
1,0
23
1,0
23
1,0
23
1,0
23
1,0
23
1,0
23
00
00
15,4
86
Affo
rda
ble
so
c r
ent
00
00
15
108
108
108
108
108
108
108
108
108
108
108
108
108
108
108
00
00
1,6
40
Affo
rda
ble
sh
oship
00
00
10
72
72
72
72
72
72
72
72
72
72
72
72
72
72
72
00
00
1,0
93
Aff o
the
r A
00
00
00
00
00
00
00
00
00
00
00
00
0
Aff o
the
r B
00
00
00
00
00
00
00
00
00
00
00
00
0
Bu
ild c
ontin
ge
ncy
2.5
%0
00
04
30
30
30
30
30
30
30
30
30
30
30
30
30
30
30
00
00
455
Total
18,674
Dev costs
Up
fron
t1
0.0
%467
467
467
467
1,8
67
Bu
ild r
ela
ted
10.0
%0
018
123
123
123
123
123
123
123
123
123
123
123
123
123
123
123
00
00
00
1,8
67
Ab
norm
als
1%
100
100
200
Total
3,935
Fees
Fe
es o
n b
uild
co
sts
10.0
%0
00
018
123
123
123
123
123
123
123
123
123
123
123
123
123
123
123
00
00
1,8
67
Fe
es o
n d
ev c
osts
0.0
%0
00
00
00
00
00
00
00
00
00
00
00
00
Total
1,867
PG
Pla
nn
ing
ga
in9
63
63
63
63
63
63
63
63
63
63
63
63
63
63
63
00
00
00
954
Total
954
Other
Pla
nn
ing
£41
429
29
29
88
Su
rve
y£20
042
42
Mark
eting
£0
00
00
00
00
00
00
00
00
00
00
00
0
Total
130
Sales fees
b/forw
ard
fro
m a
bove
00
00
00
12
87
87
87
87
87
87
87
87
87
87
87
87
87
87
87
00
1,325
Total costs
5,206
596
523
653
380
1,543
1,555
1,630
1,630
1,630
1,630
1,630
1,630
1,630
1,630
1,630
1,630
1,630
1,444
1,444
87
87
00
31,452
Net profit/loss from quarter
-5,206
-596
-523
-653
-380
-1,543
-1,179
1,002
1,002
1,002
1,002
1,002
1,002
1,002
1,002
1,002
1,002
1,002
1,189
1,189
2,545
2,545
00
8,412
Profit/loss bf from last quarter
0-5
,303
-6,0
10
-6,6
55
-7,4
45
-7,9
72
-9,6
93
-11,0
76
-10,2
63
-9,4
34
-8,5
90
-7,7
30
-6,8
53
-5,9
61
-5,0
51
-4,1
25
-3,1
81
-2,2
20
-1,2
40
-52
1,1
57
3,7
72
6,4
36
6,4
36
Cumulative profit/loss
-5,2
06
-5,8
99
-6,5
33
-7,3
08
-7,8
25
-9,5
15
-10,8
72
-10,0
74
-9,2
60
-8,4
32
-7,5
87
-6,7
27
-5,8
51
-4,9
58
-4,0
49
-3,1
23
-2,1
79
-1,2
17
-52
1,1
36
3,7
03
6,3
17
6,4
36
6,4
36
Interest
Ch
arg
ed a
t7
.50
%7.5
0%
7.5
0%
7.5
0%
7.5
0%
7.5
0%
7.5
0%
7.5
0%
7.5
0%
7.5
0%
7.5
0%
7.5
0%
7.5
0%
7.5
0%
7.5
0%
7.5
0%
7.5
0%
7.5
0%
7.5
0%
7.5
0%
7.5
0%
7.5
0%
7.5
0%
0.0
0%
0.0
0%
To
tal
-98
-111
-122
-137
-147
-178
-204
-189
-174
-158
-142
-126
-110
-93
-76
-59
-41
-23
-121
69
118
00
-1,978
Cumulative developer profit
-5,303
-6,010
-6,655
-7,445
-7,972
-9,693
-11,076
-10,263
-9,434
-8,590
-7,730
-6,853
-5,961
-5,051
-4,125
-3,181
-2,220
-1,240
-52
1,157
3,772
6,436
6,436
6,436
6,434
carried forward to RV calc
SITE 1A CASH FLOW AFFORDABLE

Appendix 5 . F inanc ia l appra isa l summar ies
Page 75
SITE 1N: notional site Taunton

Taunton & South Somerset Af fordable Hous ing Si te Viab i l i ty Study
Page 76
Input assumptions
Scenario & option
Afford
able
15%
= 9
% s
ocia
l re
nte
d &
6%
inte
rmedia
te
South Somerset & Taunton HMAs
Dwellings
Site details
ave
flo
or
sp
ace
bu
ildsa
les
Site
1N notional as 1A
Dwellings
gro
ss
ne
tco
st
va
lue
Location
Taunton
sq
ft
sq f
tpe
r sq
ft
pe
r sq f
t
Are
a ha
4.8
3M
ark
et housin
g180.2
85.0
0%
1,0
17
1,0
00
84.5
0200.0
0
acre
s11.9
30.0
%
No d
wgs
212
Afford
able
soc rent
19.1
9.0
0%
1,0
17
1,0
00
84.5
069.0
0
Density d
w/h
a43.9
0.0
%
Afford
able
sh o
ship
12.7
6.0
0%
1,0
17
1,0
00
84.5
098.0
0
0.0
%
Aff o
ther A
0.0
0.0
0%
00
0.0
00.0
0
0.0
%
Aff o
ther B
0.0
0.0
0%
00
0.0
00.0
0
£k
Contingency
Tota
l212.0
100.0
0%
215,6
04
212,0
00
£18,2
18,5
38
£38,6
03,0
80
allo
wance
2.5
0%
455
Flo
ors
pace d
ensity
=17,7
63
net sq ft per acre
Development costs
sta
ndard
% b
uild
20.0
0%
3,7
35
Other costs
Pla
nnin
g414
£ p
er dw
elli
ng
Surv
ey
200
£ p
er dw
elli
ng
plu
s a
bnorm
als
1.1
%200
Mark
eting
0£ p
er dw
elli
ng
Tota
l21%
Design fees
on b
uild
costs
10.0
%1,8
67
Interest
% p
er annum
7.5
0%
on d
ev c
osts
0%
Notes
Planning gain
£ p
er dw
elli
ng
4,5
00
954

Appendix 5 . F inanc ia l appra isa l summar ies
Page 77
SITE 1N LAND COST & PHASING
Programme
Ye
ar
1Y
ear
2Y
ea
r 3
Ye
ar
4Y
ea
r 5
Ye
ar
6
Q1
Q2
Q3
Q4
Q1
Q2
Q3
Q4
Q1
Q2
Q3
Q4
Q1
Q2
Q3
Q4
Q1
Q2
Q3
Q4
Q1
Q2
TO
TA
LS
Units
Ma
rke
t ho
usin
g1.7
11.9
11.9
11.9
11.9
11.9
11.9
11.9
11.9
11.9
11.9
11.9
11.9
11.9
11.9
11.9
0.0
0.0
0.0
0.0
180.2
started
Affo
rda
ble
so
c r
en
t0.2
1.3
1.3
1.3
1.3
1.3
1.3
1.3
1.3
1.3
1.3
1.3
1.3
1.3
1.3
1.3
0.0
0.0
0.0
0.0
19.1
Aff
ord
ab
le s
h o
sh
ip0.1
0.8
0.8
0.8
0.8
0.8
0.8
0.8
0.8
0.8
0.8
0.8
0.8
0.8
0.8
0.8
0.0
0.0
0.0
0.0
12.7
Aff
oth
er
A0.0
0.0
0.0
0.0
0.0
0.0
0.0
0.0
0.0
0.0
0.0
0.0
0.0
0.0
0.0
0.0
0.0
0.0
0.0
0.0
0.0
Aff
oth
er
B0.0
0.0
0.0
0.0
0.0
0.0
0.0
0.0
0.0
0.0
0.0
0.0
0.0
0.0
0.0
0.0
0.0
0.0
0.0
0.0
0.0
TO
TA
L0
02
14
14
14
14
14
14
14
14
14
14
14
14
14
14
14
00
00
212.0
Units
Ma
rke
t ho
usin
g0
02
12
12
12
12
12
12
12
12
12
12
12
12
12
12
12
00
180
'built'
+2Q
Affo
rda
ble
so
c r
en
t0
00
11
11
11
11
11
11
11
10
019
Aff
ord
ab
le s
h o
sh
ip0
00
11
11
11
11
11
11
11
10
013
Aff
oth
er
A0
00
00
00
00
00
00
00
00
00
00
Aff
oth
er
B0
00
00
00
00
00
00
00
00
00
00
Units
Ma
rke
t ho
usin
g0
02
12
12
12
12
12
12
12
12
12
12
12
12
12
12
12
0180
completed
+3Q
Affo
rda
ble
so
c r
en
t0
00
11
11
11
11
11
11
11
10
19
Aff
ord
ab
le s
h o
sh
ip0
00
11
11
11
11
11
11
11
10
13
Aff
oth
er
A0
00
00
00
00
00
00
00
00
00
0
Aff
oth
er
B0
00
00
00
00
00
00
00
00
00
0
Units
Ma
rke
t ho
usin
g0
02
12
12
12
12
12
12
12
12
12
12
12
12
12
12
12
180
purchased
+4Q
Affo
rda
ble
so
c r
en
t0
00
11
11
11
11
11
11
11
119
Aff
ord
ab
le s
h o
sh
ip0
00
11
11
11
11
11
11
11
113
Aff
oth
er
A0
00
00
00
00
00
00
00
00
00
Aff
oth
er
B0
00
00
00
00
00
00
00
00
00
Land
Iterate to achieve 20.0% profit
Afford
able
No a
fford
able
Afford
able
No a
fford
able
Land p
urc
hase p
rice
£3,394,391
5,603,416
RV
per acre
£284,408
469,497
£702,773
£1,160,127
Dev p
rofit
£6,437,044
7,077,171
Tota
l costs
£32,167,686
35,324,479
profit as % of costs
20.01%
20.03%
Hectare

Taunton & South Somerset Af fordable Hous ing Si te Viab i l i ty Study
Page 78
SITE 1N CASH FLOW AFFORDABLE
Ye
ar
1Y
ea
r 2
Yea
r 3
Yea
r 4
Yea
r 5
Yea
r 6
rate
Q1
Q2
Q3
Q4
Q1
Q2
Q3
Q4
Q1
Q2
Q3
Q4
Q1
Q2
Q3
Q4
Q1
Q2
Q3
Q4
Q1
Q2
TO
TA
LS
INCOME
Housing sales
Ma
rke
t ho
usin
g0
00
00
0340
2,3
80
2,3
80
2,3
80
2,3
80
2,3
80
2,3
80
2,3
80
2,3
80
2,3
80
2,3
80
2,3
80
2,3
80
2,3
80
2,3
80
2,3
80
36,0
40
Aff
ord
able
soc r
en
t0
00
00
012
87
87
87
87
87
87
87
87
87
87
87
87
87
87
87
1,3
17
Aff
ord
able
sh o
ship
00
00
00
12
82
82
82
82
82
82
82
82
82
82
82
82
82
82
82
1,2
47
Aff
oth
er
A0
00
00
00
00
00
00
00
00
00
00
00
Aff
oth
er
B0
00
00
00
00
00
00
00
00
00
00
00
Sa
les f
ee
s0
00
00
0-1
2-8
5-8
5-8
5-8
5-8
5-8
5-8
5-8
5-8
5-8
5-8
5-8
5-8
5-8
5-8
5-1
,280
Total income
00
00
00
364
2,549
2,549
2,549
2,549
2,549
2,549
2,549
2,549
2,549
2,549
2,549
2,549
2,549
2,549
2,549
38,603
COSTS
Land
La
nd a
cqu
isitio
n3,3
94
3,3
94
Sta
mp
du
ty136
136
Pu
rcha
se
fe
es
93
93
Total
3,624
Build costs
Ma
rke
t ho
usin
g0
00
0146
1,0
23
1,0
23
1,0
23
1,0
23
1,0
23
1,0
23
1,0
23
1,0
23
1,0
23
1,0
23
1,0
23
1,0
23
1,0
23
1,0
23
1,0
23
00
15,4
86
Aff
ord
able
soc r
en
t0
00
015
108
108
108
108
108
108
108
108
108
108
108
108
108
108
108
00
1,6
40
Aff
ord
able
sh o
ship
00
00
10
72
72
72
72
72
72
72
72
72
72
72
72
72
72
72
00
1,0
93
Aff
oth
er
A0
00
00
00
00
00
00
00
00
00
00
00
Aff
oth
er
B0
00
00
00
00
00
00
00
00
00
00
00
Bu
ild c
ontin
ge
ncy
2.5
%0
00
04
30
30
30
30
30
30
30
30
30
30
30
30
30
30
30
00
455
Total
18,674
Dev costs
Up
fron
t1
0.0
%467
467
467
467
1,8
67
Bu
ild r
ela
ted
10.0
%0
018
123
123
123
123
123
123
123
123
123
123
123
123
123
123
123
00
00
1,8
67
Ab
norm
als
1%
100
100
200
Total
3,935
Fees
Fe
es o
n b
uild
co
sts
10.0
%0
00
018
123
123
123
123
123
123
123
123
123
123
123
123
123
123
123
00
1,8
67
Fe
es o
n d
ev c
osts
0.0
%0
00
00
00
00
00
00
00
00
00
00
00
Total
1,867
PG
Pla
nn
ing g
ain
963
63
63
63
63
63
63
63
63
63
63
63
63
63
63
00
00
954
Total
954
Other
Pla
nn
ing
£4
14
29
29
29
88
Su
rvey
£2
00
42
42
Ma
rke
tin
g£
00
00
00
00
00
00
00
00
00
00
00
Total
130
Sales fees
b/f
orw
ard
fro
m a
bo
ve
00
00
00
12
85
85
85
85
85
85
85
85
85
85
85
85
85
85
85
1,280
Total costs
4,262
596
523
653
380
1,543
1,555
1,627
1,627
1,627
1,627
1,627
1,627
1,627
1,627
1,627
1,627
1,627
1,441
1,441
85
85
30,464
Net profit/loss from quarter
-4,262
-596
-523
-653
-380
-1,543
-1,191
922
922
922
922
922
922
922
922
922
922
922
1,108
1,108
2,465
2,465
8,139
Profit/loss bf from last quarter
0-4
,342
-5,0
30
-5,6
57
-6,4
28
-6,9
36
-8,6
38
-10,0
13
-9,2
61
-8,4
96
-7,7
16
-6,9
21
-6,1
12
-5,2
87
-4,4
47
-3,5
91
-2,7
19
-1,8
31
-926
186
1,3
18
3,8
54
Cumulative profit/loss
-4,2
62
-4,9
38
-5,5
53
-6,3
10
-6,8
09
-8,4
79
-9,8
29
-9,0
91
-8,3
39
-7,5
74
-6,7
94
-5,9
99
-5,1
90
-4,3
65
-3,5
25
-2,6
69
-1,7
97
-909
182
1,2
94
3,7
83
6,3
18
Interest
Ch
arg
ed
at
7.5
0%
7.5
0%
7.5
0%
7.5
0%
7.5
0%
7.5
0%
7.5
0%
7.5
0%
7.5
0%
7.5
0%
7.5
0%
7.5
0%
7.5
0%
7.5
0%
7.5
0%
7.5
0%
7.5
0%
7.5
0%
7.5
0%
7.5
0%
7.5
0%
7.5
0%
7.5
0%
To
tal
-80
-93
-104
-118
-128
-159
-184
-170
-156
-142
-127
-112
-97
-82
-66
-50
-34
-17
324
71
118
-1,704
Cumulative developer profit
-4,342
-5,030
-5,657
-6,428
-6,936
-8,638
-10,013
-9,261
-8,496
-7,716
-6,921
-6,112
-5,287
-4,447
-3,591
-2,719
-1,831
-926
186
1,318
3,854
6,437
6,435
carried forward to RV calc

Appendix 5 . F inanc ia l appra isa l summar ies
Page 79
SITE 2A: Gerber Factory Bridgwater

Taunton & South Somerset Af fordable Hous ing Si te Viab i l i ty Study
Page 80
Input assumptions
Scenario & option
Afford
able
15%
= 9
% s
ocia
l re
nte
d &
6%
inte
rmedia
te
South Somerset & Taunton HMAs
Dwellings
Site details
ave
flo
or
sp
ace
bu
ildsa
les
Site
2A Gerber Factory
Dwellings
gro
ss
ne
tco
st
va
lue
Location
Bridgwater West
sq
ft
sq f
tpe
r sq
ft
pe
r sq f
t
Are
a ha
6.0
0M
ark
et housin
g272.0
85.0
0%
889
860
87.5
0206.0
0
acre
s14.8
30.0
%
No d
wgs
320
Afford
able
soc rent
28.8
9.0
0%
889
860
87.5
068.0
0
Density d
w/h
a53.3
0.0
%
Afford
able
sh o
ship
19.2
6.0
0%
889
860
87.5
099.0
0
0.0
%
Aff o
ther A
0.0
0.0
0%
00
0.0
00.0
0
0.0
%
Aff o
ther B
0.0
0.0
0%
00
0.0
00.0
0
£k
Contingency
Tota
l320.0
100.0
0%
284,4
80
275,2
00
£24,8
92,0
00
£51,5
06,4
32
allo
wance
5.0
0%
1,2
45
Flo
ors
pace d
ensity
=18,5
62
net sq ft per acre
Development costs
sta
ndard
% b
uild
17.5
0%
4,5
74
Other costs
Pla
nnin
g441
£ p
er dw
elli
ng
Surv
ey
500
£ p
er dw
elli
ng
plu
s a
bnorm
als
1.3
%340
Mark
eting
0£ p
er dw
elli
ng
Tota
l19%
Design fees
on b
uild
costs
10.0
%2,6
14
Interest
% p
er annum
7.5
0%
on d
ev c
osts
0%
Notes
Planning gain
£ p
er dw
elli
ng
8,0
00
2,5
60

Appendix 5 . F inanc ia l appra isa l summar ies
Page 81
SITE 2A LAND COST & PHASING
Programme
Ye
ar
1Y
ea
r 2
Ye
ar
3Y
ea
r 4
Ye
ar
5Y
ea
r 6
Ye
ar
7Y
ear
8
Q1
Q2
Q3
Q4
Q1
Q2
Q3
Q4
Q1
Q2
Q3
Q4
Q1
Q2
Q3
Q4
Q1
Q2
Q3
Q4
Q1
Q2
Q3
Q4
Q1
Q2
Q3
Q4
Q1
Q2
TO
TA
LS
Units
Ma
rke
t h
ousin
g0.0
10.2
11.9
11.9
11.9
11.9
11.9
11.9
11.9
11.9
11.9
11.9
11.9
11.9
11.9
11.9
11.9
11.9
11.9
11.9
11.9
11.9
11.9
11.9
0.0
0.0
272.0
started
Aff
ord
ab
le s
oc r
en
t0.0
1.1
1.3
1.3
1.3
1.3
1.3
1.3
1.3
1.3
1.3
1.3
1.3
1.3
1.3
1.3
1.3
1.3
1.3
1.3
1.3
1.3
1.3
1.3
0.0
0.0
28.8
Aff
ord
ab
le s
h o
sh
ip0.0
0.7
0.8
0.8
0.8
0.8
0.8
0.8
0.8
0.8
0.8
0.8
0.8
0.8
0.8
0.8
0.8
0.8
0.8
0.8
0.8
0.8
0.8
0.8
0.0
0.0
19.2
Aff
oth
er
A0.0
0.0
0.0
0.0
0.0
0.0
0.0
0.0
0.0
0.0
0.0
0.0
0.0
0.0
0.0
0.0
0.0
0.0
0.0
0.0
0.0
0.0
0.0
0.0
0.0
0.0
0.0
Aff
oth
er
B0.0
0.0
0.0
0.0
0.0
0.0
0.0
0.0
0.0
0.0
0.0
0.0
0.0
0.0
0.0
0.0
0.0
0.0
0.0
0.0
0.0
0.0
0.0
0.0
0.0
0.0
0.0
TO
TA
L0
00
12
14
14
14
14
14
14
14
14
14
14
14
14
14
14
14
14
14
14
14
14
14
14
00
320.0
Units
Ma
rke
t h
ousin
g0
00
10
12
12
12
12
12
12
12
12
12
12
12
12
12
12
12
12
12
12
12
12
12
12
00
272
'built'
+2Q
Aff
ord
ab
le s
oc r
en
t0
00
11
11
11
11
11
11
11
11
11
11
11
10
029
Aff
ord
ab
le s
h o
sh
ip0
00
11
11
11
11
11
11
11
11
11
11
11
10
019
Aff
oth
er
A0
00
00
00
00
00
00
00
00
00
00
00
00
00
00
Aff
oth
er
B0
00
00
00
00
00
00
00
00
00
00
00
00
00
00
Units
Ma
rke
t h
ousin
g0
00
10
12
12
12
12
12
12
12
12
12
12
12
12
12
12
12
12
12
12
12
12
12
12
0272
completed
+3Q
Aff
ord
ab
le s
oc r
en
t0
00
11
11
11
11
11
11
11
11
11
11
11
10
29
Aff
ord
ab
le s
h o
sh
ip0
00
11
11
11
11
11
11
11
11
11
11
11
10
19
Aff
oth
er
A0
00
00
00
00
00
00
00
00
00
00
00
00
00
0
Aff
oth
er
B0
00
00
00
00
00
00
00
00
00
00
00
00
00
0
Units
Ma
rke
t h
ousin
g0
00
10
12
12
12
12
12
12
12
12
12
12
12
12
12
12
12
12
12
12
12
12
12
12
272
purchased
+4Q
Aff
ord
ab
le s
oc r
en
t0
00
11
11
11
11
11
11
11
11
11
11
11
129
Aff
ord
ab
le s
h o
sh
ip0
00
11
11
11
11
11
11
11
11
11
11
11
119
Aff
oth
er
A0
00
00
00
00
00
00
00
00
00
00
00
00
00
Aff
oth
er
B0
00
00
00
00
00
00
00
00
00
00
00
00
00
Land
Iterate to achieve 20.0% profit
Afford
able
No a
fford
able
Afford
able
No a
fford
able
Land p
urc
hase p
rice
£2,799,152
5,509,196
RV
per acre
£188,800
371,590
£466,525
£918,199
Dev p
rofit
£8,323,413
9,449,258
Tota
l costs
£43,185,269
47,244,192
profit as % of costs
19.27%
20.00%
Hectare

Taunton & South Somerset Af fordable Hous ing Si te Viab i l i ty Study
Page 82
SITE 2A CASH FLOW AFFORDABLE
Ye
ar
1Y
ear
2Y
ear
3Y
ear
4Y
ear
5Y
ear
6Y
ea
r 7
Year
8
rate
Q1
Q2
Q3
Q4
Q1
Q2
Q3
Q4
Q1
Q2
Q3
Q4
Q1
Q2
Q3
Q4
Q1
Q2
Q3
Q4
Q1
Q2
Q3
Q4
Q1
Q2
Q3
Q4
Q1
Q2
TO
TA
LS
INCOME
Housing sales
Ma
rke
t hou
sin
g0
00
00
00
1,8
07
2,1
08
2,1
08
2,1
08
2,1
08
2,1
08
2,1
08
2,1
08
2,1
08
2,1
08
2,1
08
2,1
08
2,1
08
2,1
08
2,1
08
2,1
08
2,1
08
2,1
08
2,1
08
2,1
08
2,1
08
2,1
08
2,1
08
48,1
88
Afford
able
soc r
ent
00
00
00
063
74
74
74
74
74
74
74
74
74
74
74
74
74
74
74
74
74
74
74
74
74
74
1,6
84
Afford
able
sh o
ship
00
00
00
061
72
72
72
72
72
72
72
72
72
72
72
72
72
72
72
72
72
72
72
72
72
72
1,6
35
Aff o
the
r A
00
00
00
00
00
00
00
00
00
00
00
00
00
00
00
0
Aff o
the
r B
00
00
00
00
00
00
00
00
00
00
00
00
00
00
00
0
Sale
s fee
s0
00
00
00
-64
-75
-75
-75
-75
-75
-75
-75
-75
-75
-75
-75
-75
-75
-75
-75
-75
-75
-75
-75
-75
-75
-75
-1,7
11
Total income
00
00
00
01,931
2,253
2,253
2,253
2,253
2,253
2,253
2,253
2,253
2,253
2,253
2,253
2,253
2,253
2,253
2,253
2,253
2,253
2,253
2,253
2,253
2,253
2,253
51,506
COSTS
Land
Land a
cqu
isitio
n2,7
99
2,7
99
Sta
mp d
uty
112
112
Purc
hase
fees
77
77
Total
2,988
Build costs
Ma
rke
t hou
sin
g0
00
00
793
926
926
926
926
926
926
926
926
926
926
926
926
926
926
926
926
926
926
926
926
926
926
00
21,1
58
Afford
able
soc r
ent
00
00
084
98
98
98
98
98
98
98
98
98
98
98
98
98
98
98
98
98
98
98
98
98
98
00
2,2
40
Afford
able
sh o
ship
00
00
056
65
65
65
65
65
65
65
65
65
65
65
65
65
65
65
65
65
65
65
65
65
65
00
1,4
94
Aff o
the
r A
00
00
00
00
00
00
00
00
00
00
00
00
00
00
00
0
Aff o
the
r B
00
00
00
00
00
00
00
00
00
00
00
00
00
00
00
0
Build
continge
ncy
5.0
%0
00
00
47
54
54
54
54
54
54
54
54
54
54
54
54
54
54
54
54
54
54
54
54
54
54
00
1,2
45
Total
26,137
Dev costs
Up
fro
nt
8.8
%572
572
572
572
2,2
87
Build
rela
ted
8.8
%0
00
86
100
100
100
100
100
100
100
100
100
100
100
100
100
100
100
100
100
100
100
100
100
100
00
00
2,2
87
Abnorm
als
1%
170
170
340
Total
4,914
Fees
Fee
s o
n b
uild
co
sts
10.0
%0
00
00
98
114
114
114
114
114
114
114
114
114
114
114
114
114
114
114
114
114
114
114
114
114
114
00
2,6
14
Fee
s o
n d
ev c
osts
0.0
%0
00
00
00
00
00
00
00
00
00
00
00
00
00
00
00
Total
2,614
PG
Pla
nn
ing g
ain
096
112
112
112
112
112
112
112
112
112
112
112
112
112
112
112
112
112
112
112
112
112
112
00
00
2,5
60
Total
2,560
Other
Pla
nn
ing
£4
41
47
47
47
141
Surv
ey
£5
00
160
160
Ma
rke
tin
g£0
00
00
00
00
00
00
00
00
00
00
00
00
00
00
0Total
301
Sales fees
b/forw
ard
fro
m a
bove
00
00
00
064
75
75
75
75
75
75
75
75
75
75
75
75
75
75
75
75
75
75
75
75
75
75
1,711
Total costs
3,937
789
619
753
212
1,290
1,470
1,534
1,545
1,545
1,545
1,545
1,545
1,545
1,545
1,545
1,545
1,545
1,545
1,545
1,545
1,545
1,545
1,545
1,545
1,545
1,333
1,333
75
75
41,224
Net profit/loss from quarter
-3,937
-789
-619
-753
-212
-1,290
-1,470
397
709
709
709
709
709
709
709
709
709
709
709
709
709
709
709
709
709
709
921
921
2,179
2,179
10,282
Profit/loss bf from last quarter
0-4
,011
-4,8
89
-5,6
11
-6,4
84
-6,8
21
-8,2
64
-9,9
16
-9,6
97
-9,1
57
-8,6
06
-8,0
46
-7,4
74
-6,8
93
-6,3
00
-5,6
96
-5,0
81
-4,4
54
-3,8
15
-3,1
65
-2,5
02
-1,8
27
-1,1
39
-439
275
1,0
02
1,7
43
2,7
14
3,7
03
5,9
92
Cumulative profit/loss
-3,9
37
-4,7
99
-5,5
08
-6,3
65
-6,6
96
-8,1
12
-9,7
33
-9,5
18
-8,9
88
-8,4
48
-7,8
98
-7,3
37
-6,7
66
-6,1
84
-5,5
91
-4,9
87
-4,3
72
-3,7
45
-3,1
07
-2,4
56
-1,7
94
-1,1
18
-431
270
984
1,7
11
2,6
64
3,6
35
5,8
81
8,1
70
Interest
Ch
arg
ed a
t7.5
0%
7.5
0%
7.5
0%
7.5
0%
7.5
0%
7.5
0%
7.5
0%
7.5
0%
7.5
0%
7.5
0%
7.5
0%
7.5
0%
7.5
0%
7.5
0%
7.5
0%
7.5
0%
7.5
0%
7.5
0%
7.5
0%
7.5
0%
7.5
0%
7.5
0%
7.5
0%
7.5
0%
7.5
0%
7.5
0%
7.5
0%
7.5
0%
7.5
0%
7.5
0%
7.5
0%
Tota
l-7
4-9
0-1
03
-119
-126
-152
-183
-178
-169
-158
-148
-138
-127
-116
-105
-94
-82
-70
-58
-46
-34
-21
-85
18
32
50
68
110
153
-1,961
Cumulative developer profit
-4,011
-4,889
-5,611
-6,484
-6,821
-8,264
-9,916
-9,697
-9,157
-8,606
-8,046
-7,474
-6,893
-6,300
-5,696
-5,081
-4,454
-3,815
-3,165
-2,502
-1,827
-1,139
-439
275
1,002
1,743
2,714
3,703
5,992
8,323
8,321
carried forward to RV calc

Appendix 5 . F inanc ia l appra isa l summar ies
Page 83
SITE 2N notional site Yeovil

Taunton & South Somerset Af fordable Hous ing Si te Viab i l i ty Study
Page 84
Input assumptions
Scenario & option
Afford
able
15%
= 9
% s
ocia
l re
nte
d &
6%
inte
rmedia
te
South Somerset & Taunton HMAs
Dwellings
Site details
ave
flo
or
sp
ace
bu
ildsa
les
Site
2N notional as 2A
Dwellings
gro
ss
ne
tco
st
va
lue
Location
Yeovil East
sq
ft
sq f
tpe
r sq
ft
pe
r sq f
t
Are
a ha
6.0
0M
ark
et housin
g272.0
85.0
0%
889
860
87.5
0190.0
0
acre
s14.8
30.0
%
No d
wgs
320
Afford
able
soc rent
28.8
9.0
0%
889
860
87.5
070.0
0
Density d
w/h
a53.3
0.0
%
Afford
able
sh o
ship
19.2
6.0
0%
889
860
87.5
099.0
0
0.0
%
Aff o
ther A
0.0
0.0
0%
00
0.0
00.0
0
0.0
%
Aff o
ther B
0.0
0.0
0%
00
0.0
00.0
0
£k
Contingency
Tota
l320.0
100.0
0%
284,4
80
275,2
00
£24,8
92,0
00
£47,8
13,2
48
allo
wance
5.0
0%
1,2
45
Flo
ors
pace d
ensity
=18,5
62
net sq ft per acre
Development costs
sta
ndard
% b
uild
17.5
0%
4,5
74
Other costs
Pla
nnin
g441
£ p
er dw
elli
ng
Surv
ey
500
£ p
er dw
elli
ng
plu
s a
bnorm
als
1.3
%340
Mark
eting
0£ p
er dw
elli
ng
Tota
l19%
Design fees
on b
uild
costs
10.0
%2,6
14
Interest
% p
er annum
7.5
0%
on d
ev c
osts
0%
Notes
Planning gain
£ p
er dw
elli
ng
8,0
00
2,5
60

Appendix 5 . F inanc ia l appra isa l summar ies
Page 85
SITE 2N LAND COST & PHASING
Programme
Ye
ar
1Y
ea
r 2
Ye
ar
3Y
ea
r 4
Ye
ar
5Y
ea
r 6
Ye
ar
7
Q1
Q2
Q3
Q4
Q1
Q2
Q3
Q4
Q1
Q2
Q3
Q4
Q1
Q2
Q3
Q4
Q1
Q2
Q3
Q4
Q1
Q2
Q3
Q4
Q1
Q2
Q3
Q4
TO
TA
LS
Units
Ma
rke
t h
ou
sin
g0.0
10.2
11.9
11.9
11.9
11.9
11.9
11.9
11.9
11.9
11.9
11.9
11.9
11.9
11.9
11.9
11.9
11.9
11.9
11.9
11.9
11.9
11.9
11.9
0.0
0.0
272.0
started
Aff
ord
ab
le s
oc r
ent
0.0
1.1
1.3
1.3
1.3
1.3
1.3
1.3
1.3
1.3
1.3
1.3
1.3
1.3
1.3
1.3
1.3
1.3
1.3
1.3
1.3
1.3
1.3
1.3
0.0
0.0
28.8
Affo
rda
ble
sh
osh
ip0.0
0.7
0.8
0.8
0.8
0.8
0.8
0.8
0.8
0.8
0.8
0.8
0.8
0.8
0.8
0.8
0.8
0.8
0.8
0.8
0.8
0.8
0.8
0.8
0.0
0.0
19.2
Aff
oth
er
A0.0
0.0
0.0
0.0
0.0
0.0
0.0
0.0
0.0
0.0
0.0
0.0
0.0
0.0
0.0
0.0
0.0
0.0
0.0
0.0
0.0
0.0
0.0
0.0
0.0
0.0
0.0
Aff
oth
er
B0.0
0.0
0.0
0.0
0.0
0.0
0.0
0.0
0.0
0.0
0.0
0.0
0.0
0.0
0.0
0.0
0.0
0.0
0.0
0.0
0.0
0.0
0.0
0.0
0.0
0.0
0.0
TO
TA
L0
00
12
14
14
14
14
14
14
14
14
14
14
14
14
14
14
14
14
14
14
14
14
14
14
00
320.0
Units
Ma
rke
t h
ou
sin
g0
00
10
12
12
12
12
12
12
12
12
12
12
12
12
12
12
12
12
12
12
12
12
12
12
272
'built'
+2Q
Aff
ord
ab
le s
oc r
ent
00
01
11
11
11
11
11
11
11
11
11
11
11
29
Affo
rda
ble
sh
osh
ip0
00
11
11
11
11
11
11
11
11
11
11
11
119
Aff
oth
er
A0
00
00
00
00
00
00
00
00
00
00
00
00
00
Aff
oth
er
B0
00
00
00
00
00
00
00
00
00
00
00
00
00
Units
Ma
rke
t h
ou
sin
g0
00
10
12
12
12
12
12
12
12
12
12
12
12
12
12
12
12
12
12
12
12
12
12
272
completed
+3Q
Aff
ord
ab
le s
oc r
ent
00
01
11
11
11
11
11
11
11
11
11
11
129
Affo
rda
ble
sh
osh
ip0
00
11
11
11
11
11
11
11
11
11
11
11
19
Aff
oth
er
A0
00
00
00
00
00
00
00
00
00
00
00
00
0
Aff
oth
er
B0
00
00
00
00
00
00
00
00
00
00
00
00
0
Units
Ma
rke
t h
ou
sin
g0
00
10
12
12
12
12
12
12
12
12
12
12
12
12
12
12
12
12
12
12
12
12
272
purchased
+4Q
Aff
ord
ab
le s
oc r
ent
00
01
11
11
11
11
11
11
11
11
11
11
29
Affo
rda
ble
sh
osh
ip0
00
11
11
11
11
11
11
11
11
11
11
119
Aff
oth
er
A0
00
00
00
00
00
00
00
00
00
00
00
00
Aff
oth
er
B0
00
00
00
00
00
00
00
00
00
00
00
00
Land
Iterate to achieve 20.0% profit
Afford
able
No a
fford
able
Afford
able
No a
fford
able
Land p
urc
hase p
rice
£718,000
3,038,236
RV
per acre
£48,428
204,926
£119,667
£506,373
Dev p
rofit
£7,722,425
8,711,315
Tota
l costs
£40,093,073
43,578,935
profit as % of costs
19.26%
19.99%
Hectare

Taunton & South Somerset Af fordable Hous ing Si te Viab i l i ty Study
Page 86
SITE 2N CASH FLOW AFFORDABLE
Ye
ar
1Y
ear
2Y
ear
3Y
ear
4Y
ear
5Y
ear
6Y
ea
r 7
Year
8
rate
Q1
Q2
Q3
Q4
Q1
Q2
Q3
Q4
Q1
Q2
Q3
Q4
Q1
Q2
Q3
Q4
Q1
Q2
Q3
Q4
Q1
Q2
Q3
Q4
Q1
Q2
Q3
Q4
Q1
Q2
TO
TA
LS
INCOME
Housing sales
Ma
rke
t hou
sin
g0
00
00
00
1,6
67
1,9
44
1,9
44
1,9
44
1,9
44
1,9
44
1,9
44
1,9
44
1,9
44
1,9
44
1,9
44
1,9
44
1,9
44
1,9
44
1,9
44
1,9
44
1,9
44
1,9
44
1,9
44
1,9
44
1,9
44
1,9
44
1,9
44
44,4
45
Afford
able
soc r
ent
00
00
00
065
76
76
76
76
76
76
76
76
76
76
76
76
76
76
76
76
76
76
76
76
76
76
1,7
34
Afford
able
sh o
ship
00
00
00
061
72
72
72
72
72
72
72
72
72
72
72
72
72
72
72
72
72
72
72
72
72
72
1,6
35
Aff o
the
r A
00
00
00
00
00
00
00
00
00
00
00
00
00
00
00
0
Aff o
the
r B
00
00
00
00
00
00
00
00
00
00
00
00
00
00
00
0
Sale
s fee
s0
00
00
00
-59
-69
-69
-69
-69
-69
-69
-69
-69
-69
-69
-69
-69
-69
-69
-69
-69
-69
-69
-69
-69
-69
-69
-1,5
81
Total income
00
00
00
01,793
2,092
2,092
2,092
2,092
2,092
2,092
2,092
2,092
2,092
2,092
2,092
2,092
2,092
2,092
2,092
2,092
2,092
2,092
2,092
2,092
2,092
2,092
47,813
COSTS
Land
Land a
cqu
isitio
n718
718
Sta
mp d
uty
29
29
Purc
hase
fees
20
20
Total
766
Build costs
Ma
rke
t hou
sin
g0
00
00
793
926
926
926
926
926
926
926
926
926
926
926
926
926
926
926
926
926
926
926
926
926
926
00
21,1
58
Afford
able
soc r
ent
00
00
084
98
98
98
98
98
98
98
98
98
98
98
98
98
98
98
98
98
98
98
98
98
98
00
2,2
40
Afford
able
sh o
ship
00
00
056
65
65
65
65
65
65
65
65
65
65
65
65
65
65
65
65
65
65
65
65
65
65
00
1,4
94
Aff o
the
r A
00
00
00
00
00
00
00
00
00
00
00
00
00
00
00
0
Aff o
the
r B
00
00
00
00
00
00
00
00
00
00
00
00
00
00
00
0
Build
continge
ncy
5.0
%0
00
00
47
54
54
54
54
54
54
54
54
54
54
54
54
54
54
54
54
54
54
54
54
54
54
00
1,2
45
Total
26,137
Dev costs
Up
fro
nt
8.8
%572
572
572
572
2,2
87
Build
rela
ted
8.8
%0
00
86
100
100
100
100
100
100
100
100
100
100
100
100
100
100
100
100
100
100
100
100
100
100
00
00
2,2
87
Abnorm
als
1%
170
170
340
Total
4,914
Fees
Fee
s o
n b
uild
co
sts
10.0
%0
00
00
98
114
114
114
114
114
114
114
114
114
114
114
114
114
114
114
114
114
114
114
114
114
114
00
2,6
14
Fee
s o
n d
ev c
osts
0.0
%0
00
00
00
00
00
00
00
00
00
00
00
00
00
00
00
Total
2,614
PG
Pla
nn
ing g
ain
096
112
112
112
112
112
112
112
112
112
112
112
112
112
112
112
112
112
112
112
112
112
112
00
00
2,5
60
Total
2,560
Other
Pla
nn
ing
£4
41
47
47
47
141
Surv
ey
£5
00
160
160
Ma
rke
tin
g£0
00
00
00
00
00
00
00
00
00
00
00
00
00
00
0Total
301
Sales fees
b/forw
ard
fro
m a
bove
00
00
00
059
69
69
69
69
69
69
69
69
69
69
69
69
69
69
69
69
69
69
69
69
69
69
1,581
Total costs
1,715
789
619
753
212
1,290
1,470
1,529
1,539
1,539
1,539
1,539
1,539
1,539
1,539
1,539
1,539
1,539
1,539
1,539
1,539
1,539
1,539
1,539
1,539
1,539
1,327
1,327
69
69
38,872
Net profit/loss from quarter
-1,715
-789
-619
-753
-212
-1,290
-1,470
264
553
553
553
553
553
553
553
553
553
553
553
553
553
553
553
553
553
553
765
765
2,023
2,023
8,941
Profit/loss bf from last quarter
0-1
,747
-2,5
83
-3,2
62
-4,0
91
-4,3
83
-5,7
80
-7,3
86
-7,2
55
-6,8
28
-6,3
93
-5,9
50
-5,4
98
-5,0
38
-4,5
69
-4,0
91
-3,6
05
-3,1
09
-2,6
04
-2,0
90
-1,5
66
-1,0
32
-488
66
631
1,2
06
1,7
92
2,6
04
3,4
33
5,5
58
Cumulative profit/loss
-1,7
15
-2,5
36
-3,2
02
-4,0
16
-4,3
03
-5,6
74
-7,2
50
-7,1
22
-6,7
03
-6,2
75
-5,8
40
-5,3
97
-4,9
45
-4,4
85
-4,0
16
-3,5
39
-3,0
52
-2,5
56
-2,0
51
-1,5
37
-1,0
13
-479
65
619
1,1
83
1,7
58
2,5
56
3,3
69
5,4
55
7,5
80
Interest
Ch
arg
ed a
t7.5
0%
7.5
0%
7.5
0%
7.5
0%
7.5
0%
7.5
0%
7.5
0%
7.5
0%
7.5
0%
7.5
0%
7.5
0%
7.5
0%
7.5
0%
7.5
0%
7.5
0%
7.5
0%
7.5
0%
7.5
0%
7.5
0%
7.5
0%
7.5
0%
7.5
0%
7.5
0%
7.5
0%
7.5
0%
7.5
0%
7.5
0%
7.5
0%
7.5
0%
7.5
0%
7.5
0%
Tota
l-3
2-4
8-6
0-7
5-8
1-1
06
-136
-134
-126
-118
-110
-101
-93
-84
-75
-66
-57
-48
-38
-29
-19
-91
12
22
33
48
63
102
142
-1,221
Cumulative developer profit
-1,747
-2,583
-3,262
-4,091
-4,383
-5,780
-7,386
-7,255
-6,828
-6,393
-5,950
-5,498
-5,038
-4,569
-4,091
-3,605
-3,109
-2,604
-2,090
-1,566
-1,032
-488
66
631
1,206
1,792
2,604
3,433
5,558
7,722
7,720
carried forward to RV calc

Appendix 5 . F inanc ia l appra isa l summar ies
Page 87
SITE 3A: Touches Chard

Taunton & South Somerset Af fordable Hous ing Si te Viab i l i ty Study
Page 88
Input assumptions
Scenario & option
Afford
able
15%
= 9
% s
ocia
l re
nte
d &
6%
inte
rmedia
te
Site details
Dwellings
ave f
loo
r sp
ace
bu
ildsa
les
Site
3A Touches
no
of
%g
ross
ne
tco
st
va
lue
Location
Chard
dw
gs
sq
ft
sq
ft
pe
r sq
ft
pe
r sq
ft
Are
a ha
0.6
01.2
6M
ark
et housin
g20.4
085%
917
917
81.5
0190.0
018,7
07
acre
s1.4
80.0
%
No d
wgs
24
0.1
3A
fford
able
soc rent
2.1
69.0
%917
917
81.5
068.0
01,9
81
Density d
w/h
a40.0
0.0
%
0.0
9A
ff s
h o
ship
1.4
46.0
%917
917
81.5
096.0
01,3
20
Tota
l24.0
100%
22,0
08
22,0
08
£1,7
93,6
52
£3,8
15,7
47
22,0
08
net:
gro
ss=
10
0%
Flo
ors
pace d
ensity
=14,8
44
net sq ft per acre
£k
Contingency
18706.8
allo
wance
2.5
0%
45
0
1980.7
2 0
1320.4
8
22008
Development costs
Other costs
sta
ndard
% b
uild
13.0
%239
Pla
nnin
g415
£ p
er dw
elli
ng
Surv
ey
200
£ p
er dw
elli
ng
plu
s a
bnorm
als
0.0
%0
Mark
eting
0£ p
er dw
elli
ng
Tota
l13%
Interest
Design fees
% p
er annum
7.5
0%
-155
on b
uild
costs
10.0
%184
on d
ev c
osts
0%
Notes
Planning gain
£ p
er dw
elling
4,5
00
108
South Somerset & Taunton HMAs

Appendix 5 . F inanc ia l appra isa l summar ies
Page 89
SITE 3A LAND COST & PHASING
Programme
Ye
ar
1Y
ea
r 2
Ye
ar
3Y
ea
r 4
Q1
Q2
Q3
Q4
Q1
Q2
Q3
Q4
Q1
Q2
Q3
Q4
Q1
Q2
Q3
Q4
TO
TA
LS
Units
Ma
rke
t h
ou
sin
g3.4
4.3
4.3
4.3
4.3
0.0
0.0
0.0
0.0
0.0
20.4
started
Aff
ord
ab
le s
oc r
en
t0.4
0.5
0.5
0.5
0.5
0.0
0.0
0.0
0.0
0.0
2.2
Aff
sh
osh
ip0.2
0.3
0.3
0.3
0.3
0.0
0.0
0.0
0.0
0.0
1.4
TO
TA
L0
04
55
55
00
00
024.0
Units
Ma
rke
t h
ou
sin
g0
03
44
44
00
00
00
020
'built'
+2Q
Aff
ord
ab
le s
oc r
en
t0
00
00
00
00
00
00
02
Aff
sh
osh
ip0
00
00
00
00
00
00
01
Units
Ma
rke
t h
ou
sin
g0
03
44
44
00
00
00
20
completed
+3Q
Aff
ord
ab
le s
oc r
en
t0
00
00
00
00
00
00
2
Aff
sh
osh
ip0
00
00
00
00
00
00
1
Units
Ma
rke
t h
ou
sin
g0
03
44
44
00
00
020
purchased
+4Q
Aff
ord
ab
le s
oc r
en
t0
00
00
00
00
00
02
Aff
sh
osh
ip0
00
00
00
00
00
01
Land
Iterate to achieve 20.0% profit
Afford
able
No a
fford
able
Land p
urc
hase p
rice
£501,000
719,617
RV
per acre
£337,920
485,375
RV
per hecta
re£
835,000
1,199,362
Dev p
rofit
£616,622
696,949
Tota
l costs
£3,200,025
3,485,471
profit as % of costs
19.27%
20.00%

Taunton & South Somerset Af fordable Hous ing Si te Viab i l i ty Study
Page 90
SITE 3A CASH FLOW AFFORDABLE
Year
1Y
ear
2Y
ear
3Y
ear
4
rate
Q1
Q2
Q3
Q4
Q1
Q2
Q3
Q4
Q1
Q2
Q3
Q4
Q1
Q2
Q3
Q4
TO
TA
LS
INCOME
Housing sales
Mark
et h
ousin
g0
00
00
0592
740
740
740
740
00
00
03,5
54
Afford
able
soc r
ent
00
00
00
22
28
28
28
28
00
00
0135
Aff s
h o
ship
00
00
00
21
26
26
26
26
00
00
0127
0
Sa
les fees
00
00
00
-21
-26
-26
-26
-26
00
00
0-1
26
Total income
00
00
00
636
795
795
795
795
00
00
03,816
COSTS
Land
La
nd a
cquis
itio
n501
501
Sta
mp
du
ty20
20
Pu
rch
ase fees
14
14
Total
535
Build costs
Mark
et h
ousin
g0
00
0254
318
318
318
318
00
00
00
01,5
25
Afford
able
soc r
ent
00
00
27
34
34
34
34
00
00
00
0161
Aff s
h o
ship
00
00
18
22
22
22
22
00
00
00
0108
Bu
ild c
on
ting
ency
2.5
%0
00
07
99
99
00
00
00
045
Total
1,838
Dev costs
Upfr
ont
6.5
%30
30
30
30
120
Bu
ild r
ela
ted
6.5
%0
020
25
25
25
25
00
00
00
0120
Ab
norm
als
0%
00
0
Total
239
Fees
Fees o
n b
uild
costs
10
.0%
00
00
31
38
38
38
38
00
00
00
0184
Fees o
n d
ev c
osts
0.0
%0
00
00
00
00
00
00
00
00
Total
184
PG
Pla
nnin
g g
ain
18
23
23
23
23
00
00
00
00
0108
Total
108
Other
Pla
nnin
g£41
53
33
10
Su
rve
y£20
05
5
Mark
eting
£0
00
00
00
00
00
00
00
0
Total
15
Sales fees
b/fo
rward
fro
m a
bove
00
00
00
21
26
26
26
26
00
00
0126
Total costs
573
33
71
77
384
469
490
448
448
26
26
00
00
03,045
Net profit/loss from quarter
-573
-33
-71
-77
-384
-469
146
347
347
769
769
00
00
0770
Profit/loss bf from last quarter
0-5
83
-628
-712
-804
-1,2
11
-1,7
11
-1,5
94
-1,2
70
-940
-175
605
605
605
617
617
Cumulative profit/loss
-573
-617
-699
-790
-1,1
89
-1,6
80
-1,5
65
-1,2
47
-923
-171
594
605
605
605
617
617
Interest
Charg
ed a
t7.5
0%
7.5
0%
7.5
0%
7.5
0%
7.5
0%
7.5
0%
7.5
0%
7.5
0%
7.5
0%
7.5
0%
7.5
0%
7.5
0%
0.0
0%
0.0
0%
7.5
0%
0.0
0%
0.0
0%
Tota
l-1
1-1
2-1
3-1
5-2
2-3
1-2
9-2
3-1
7-3
11
00
11
00
-155
Cumulative developer profit
-583
-628
-712
-804
-1,211
-1,711
-1,594
-1,270
-940
-175
605
605
605
617
617
617
616
carried forward to RV calc

Appendix 5 . F inanc ia l appra isa l summar ies
Page 91
SITE 3N notional site Bridgwater

Taunton & South Somerset Af fordable Hous ing Si te Viab i l i ty Study
Page 92
Input assumptions
Scenario & option
Afford
able
15%
= 9
% s
ocia
l re
nte
d &
6%
inte
rmedia
te
Site details
Dwellings
ave f
loo
r sp
ace
bu
ildsa
les
Site
3N notional as 3A
no
of
%g
ross
ne
tco
st
va
lue
Location
Bridgwater N
dw
gs
sq
ft
sq
ft
pe
r sq
ft
pe
r sq
ft
Are
a ha
0.6
01.2
6M
ark
et housin
g20.4
085%
917
917
81.5
0195.0
018,7
07
acre
s1.4
80.0
%
No d
wgs
24
0.1
3A
fford
able
soc rent
2.1
69.0
%917
917
81.5
066.0
01,9
81
Density d
w/h
a40.0
0.0
%
0.0
9A
ff s
h o
ship
1.4
46.0
%917
917
81.5
096.0
01,3
20
Tota
l24.0
100%
22,0
08
22,0
08
£1,7
93,6
52
£3,9
05,3
20
22,0
08
net:
gro
ss=
10
0%
Flo
ors
pace d
ensity
=14,8
44
net sq ft per acre
£k
Contingency
18706.8
allo
wance
2.5
0%
45
0
1980.7
2 0
1320.4
8
22008
Development costs
Other costs
sta
ndard
% b
uild
13.0
%239
Pla
nnin
g415
£ p
er dw
elli
ng
Surv
ey
200
£ p
er dw
elli
ng
plu
s a
bnorm
als
0.0
%0
Mark
eting
0£ p
er dw
elli
ng
Tota
l13%
Interest
Design fees
% p
er annum
7.5
0%
-164
on b
uild
costs
10.0
%184
on d
ev c
osts
0%
Notes
Planning gain
£ p
er dw
elling
4,5
00
108
South Somerset & Taunton HMAs

Appendix 5 . F inanc ia l appra isa l summar ies
Page 93
SITE 3N LAND COST & PHASING
Programme
Ye
ar
1Y
ea
r 2
Ye
ar
3Y
ea
r 4
Q1
Q2
Q3
Q4
Q1
Q2
Q3
Q4
Q1
Q2
Q3
Q4
Q1
Q2
Q3
Q4
TO
TA
LS
Units
Ma
rke
t h
ou
sin
g3.4
4.3
4.3
4.3
4.3
0.0
0.0
0.0
0.0
0.0
20.4
started
Aff
ord
ab
le s
oc r
en
t0.4
0.5
0.5
0.5
0.5
0.0
0.0
0.0
0.0
0.0
2.2
Aff
sh
osh
ip0.2
0.3
0.3
0.3
0.3
0.0
0.0
0.0
0.0
0.0
1.4
TO
TA
L0
04
55
55
00
00
024.0
Units
Ma
rke
t h
ou
sin
g0
03
44
44
00
00
00
020
'built'
+2Q
Aff
ord
ab
le s
oc r
en
t0
00
00
00
00
00
00
02
Aff
sh
osh
ip0
00
00
00
00
00
00
01
Units
Ma
rke
t h
ou
sin
g0
03
44
44
00
00
00
20
completed
+3Q
Aff
ord
ab
le s
oc r
en
t0
00
00
00
00
00
00
2
Aff
sh
osh
ip0
00
00
00
00
00
00
1
Units
Ma
rke
t h
ou
sin
g0
03
44
44
00
00
020
purchased
+4Q
Aff
ord
ab
le s
oc r
en
t0
00
00
00
00
00
02
Aff
sh
osh
ip0
00
00
00
00
00
01
Land
Iterate to achieve 20.0% profit
Afford
able
No a
fford
able
Land p
urc
hase p
rice
£560,124
790,031
RV
per acre
£377,798
532,868
RV
per hecta
re£
933,540
1,316,718
Dev p
rofit
£630,610
717,253
Tota
l costs
£3,275,609
3,575,207
profit as % of costs
19.25%
20.06%

Taunton & South Somerset Af fordable Hous ing Si te Viab i l i ty Study
Page 94
Year
1Y
ear
2Y
ear
3Y
ear
4
rate
Q1
Q2
Q3
Q4
Q1
Q2
Q3
Q4
Q1
Q2
Q3
Q4
Q1
Q2
Q3
Q4
TO
TA
LS
INCOME
Housing sales
Mark
et h
ousin
g0
00
00
0608
760
760
760
760
00
00
03,6
48
Afford
able
soc r
ent
00
00
00
22
27
27
27
27
00
00
0131
Aff s
h o
ship
00
00
00
21
26
26
26
26
00
00
0127
0
Sa
les fees
00
00
00
-22
-27
-27
-27
-27
00
00
0-1
30
Total income
00
00
00
651
814
814
814
814
00
00
03,905
COSTS
Land
La
nd a
cquis
itio
n560
560
Sta
mp
du
ty22
22
Pu
rch
ase fees
15
15
Total
598
Build costs
Mark
et h
ousin
g0
00
0254
318
318
318
318
00
00
00
01,5
25
Afford
able
soc r
ent
00
00
27
34
34
34
34
00
00
00
0161
Aff s
h o
ship
00
00
18
22
22
22
22
00
00
00
0108
Bu
ild c
on
ting
ency
2.5
%0
00
07
99
99
00
00
00
045
Total
1,838
Dev costs
Upfr
ont
6.5
%30
30
30
30
120
Bu
ild r
ela
ted
6.5
%0
020
25
25
25
25
00
00
00
0120
Ab
norm
als
0%
00
0
Total
239
Fees
Fees o
n b
uild
costs
10
.0%
00
00
31
38
38
38
38
00
00
00
0184
Fees o
n d
ev c
osts
0.0
%0
00
00
00
00
00
00
00
00
Total
184
PG
Pla
nnin
g g
ain
18
23
23
23
23
00
00
00
00
0108
Total
108
Other
Pla
nnin
g£41
53
33
10
Su
rve
y£20
05
5
Mark
eting
£0
00
00
00
00
00
00
00
0
Total
15
Sales fees
b/fo
rward
fro
m a
bove
00
00
00
22
27
27
27
27
00
00
0130
Total costs
636
33
71
77
384
469
490
448
448
27
27
00
00
03,112
Net profit/loss from quarter
-636
-33
-71
-77
-384
-469
161
365
365
787
787
00
00
0794
Profit/loss bf from last quarter
0-6
48
-694
-779
-872
-1,2
80
-1,7
82
-1,6
51
-1,3
10
-963
-179
619
619
619
631
631
Cumulative profit/loss
-636
-681
-765
-856
-1,2
57
-1,7
49
-1,6
21
-1,2
86
-945
-176
607
619
619
619
631
631
Interest
Charg
ed a
t7.5
0%
7.5
0%
7.5
0%
7.5
0%
7.5
0%
7.5
0%
7.5
0%
7.5
0%
7.5
0%
7.5
0%
7.5
0%
7.5
0%
0.0
0%
0.0
0%
7.5
0%
0.0
0%
0.0
0%
Tota
l-1
2-1
3-1
4-1
6-2
4-3
3-3
0-2
4-1
8-3
11
00
12
00
-164
Cumulative developer profit
-648
-694
-779
-872
-1,280
-1,782
-1,651
-1,310
-963
-179
619
619
619
631
631
631
630
carried forward to RV calc
SITE 3N CASH FLOW AFFORDABLE

Appendix 5 . F inanc ia l appra isa l summar ies
Page 95
SITE 4A: Priory Ave Taunton

Taunton & South Somerset Af fordable Hous ing Si te Viab i l i ty Study
Page 96
Input assumptions
Scenario & option
Afford
able
15%
= 9
% s
ocia
l re
nte
d &
6%
inte
rmedia
te
Site details
Dwellings
ave f
loo
r sp
ace
bu
ildsa
les
Site
4A County Garage
no
of
%g
ross
ne
tco
st
va
lue
Location
Taunton
dw
gs
sq
ft
sq
ft
pe
r sq
ft
pe
r sq
ft
Are
a ha
0.2
30.4
8M
ark
et housin
g20.4
085%
1,0
42
917
99.0
0225.0
021,2
57
acre
s0.5
70.0
%
No d
wgs
24
0.0
5A
fford
able
soc rent
2.1
69.0
%1,0
42
917
99.0
075.0
02,2
51
Density d
w/h
a104.3
0.0
%
0.0
3A
ff s
h o
ship
1.4
46.0
%1,0
42
917
99.0
0106.0
01,5
00
Tota
l24.0
100%
25,0
08
22,0
08
£2,4
75,7
92
£4,4
97,5
55
25,0
08
net:
gro
ss=
88
%
Flo
ors
pace d
ensity
=38,7
24
net sq ft per acre
£k
Contingency
18706.8
allo
wance
5.0
0%
124
0
1980.7
2 0
1320.4
8
22008
Development costs
Other costs
sta
ndard
% b
uild
11.0
%286
Pla
nnin
g415
£ p
er dw
elli
ng
Surv
ey
500
£ p
er dw
elli
ng
plu
s a
bnorm
als
7.0
%182
Mark
eting
0£ p
er dw
elli
ng
Tota
l18%
Interest
Design fees
% p
er annum
7.5
0%
-149
on b
uild
costs
10.0
%260
on d
ev c
osts
0%
Notes
Planning gain
£ p
er dw
elling
3,0
00
72
South Somerset & Taunton HMAs

Appendix 5 . F inanc ia l appra isa l summar ies
Page 97
SITE 4A LAND COST & PHASING
Programme
Ye
ar
1Y
ea
r 2
Ye
ar
3Y
ea
r 4
Q1
Q2
Q3
Q4
Q1
Q2
Q3
Q4
Q1
Q2
Q3
Q4
Q1
Q2
Q3
Q4
TO
TA
LS
Units
Ma
rke
t h
ou
sin
g10.2
10.2
0.0
0.0
0.0
0.0
0.0
0.0
0.0
0.0
20.4
started
Aff
ord
ab
le s
oc r
en
t1.1
1.1
0.0
0.0
0.0
0.0
0.0
0.0
0.0
0.0
2.2
Aff
sh
osh
ip0.7
0.7
0.0
0.0
0.0
0.0
0.0
0.0
0.0
0.0
1.4
TO
TA
L0
012
12
00
00
00
00
24.0
Units
Ma
rke
t h
ou
sin
g0
010
10
00
00
00
00
00
20
'built'
+2Q
Aff
ord
ab
le s
oc r
en
t0
01
10
00
00
00
00
02
Aff
sh
osh
ip0
01
10
00
00
00
00
01
Units
Ma
rke
t h
ou
sin
g0
010
10
00
00
00
00
020
completed
+3Q
Aff
ord
ab
le s
oc r
en
t0
01
10
00
00
00
00
2
Aff
sh
osh
ip0
01
10
00
00
00
00
1
Units
Ma
rke
t h
ou
sin
g0
010
10
00
00
00
00
20
purchased
+4Q
Aff
ord
ab
le s
oc r
en
t0
01
10
00
00
00
02
Aff
sh
osh
ip0
01
10
00
00
00
01
Land
Iterate to achieve 20.0% profit
Afford
able
No a
fford
able
Land p
urc
hase p
rice
£50,514
339,580
RV
per acre
£88,882
597,505
RV
per hecta
re£
219,626
1,476,435
Dev p
rofit
£725,880
823,847
Tota
l costs
£3,772,275
4,128,553
profit as % of costs
19.24%
19.95%

Taunton & South Somerset Af fordable Hous ing Si te Viab i l i ty Study
Page 98
SITE 4A CASH FLOW AFFORDABLE
Year
1Y
ear
2Y
ear
3Y
ear
4
rate
Q1
Q2
Q3
Q4
Q1
Q2
Q3
Q4
Q1
Q2
Q3
Q4
Q1
Q2
Q3
Q4
TO
TA
LS
INCOME
Housing sales
Mark
et h
ousin
g0
00
00
02,1
05
2,1
05
00
00
00
00
4,2
09
Afford
able
soc r
ent
00
00
00
74
74
00
00
00
00
149
Aff s
h o
ship
00
00
00
70
70
00
00
00
00
140
0
Sa
les fees
00
00
00
-75
-75
00
00
00
00
-149
Total income
00
00
00
2,249
2,249
00
00
00
00
4,498
COSTS
Land
La
nd a
cquis
itio
n51
51
Sta
mp
du
ty0
0
Pu
rch
ase fees
11
Total
52
Build costs
Mark
et h
ousin
g0
00
01,0
52
1,0
52
00
00
00
00
00
2,1
04
Afford
able
soc r
ent
00
00
111
111
00
00
00
00
00
223
Aff s
h o
ship
00
00
74
74
00
00
00
00
00
149
Bu
ild c
on
ting
ency
5.0
%0
00
062
62
00
00
00
00
00
124
Total
2,600
Dev costs
Upfr
ont
5.5
%36
36
36
36
143
Bu
ild r
ela
ted
5.5
%0
071
71
00
00
00
00
00
143
Ab
norm
als
7%
91
91
182
Total
468
Fees
Fees o
n b
uild
costs
10
.0%
00
00
130
130
00
00
00
00
00
260
Fees o
n d
ev c
osts
0.0
%0
00
00
00
00
00
00
00
00
Total
260
PG
Pla
nnin
g g
ain
36
36
00
00
00
00
00
00
72
Total
72
Other
Pla
nnin
g£41
53
33
10
Su
rve
y£50
012
12
Mark
eting
£0
00
00
00
00
00
00
00
0
Total
22
Sales fees
b/fo
rward
fro
m a
bove
00
00
00
75
75
00
00
00
00
149
Total costs
194
130
147
143
1,430
1,430
75
75
00
00
00
00
3,623
Net profit/loss from quarter
-194
-130
-147
-143
-1,430
-1,430
2,174
2,174
00
00
00
00
875
Profit/loss bf from last quarter
0-1
98
-334
-489
-644
-2,1
13
-3,6
09
-1,4
62
726
726
726
726
726
726
726
726
Cumulative profit/loss
-194
-328
-480
-632
-2,0
74
-3,5
42
-1,4
35
712
726
726
726
726
726
726
726
726
Interest
Charg
ed a
t7.5
0%
7.5
0%
7.5
0%
7.5
0%
7.5
0%
7.5
0%
7.5
0%
7.5
0%
7.5
0%
0.0
0%
0.0
0%
0.0
0%
0.0
0%
0.0
0%
0.0
0%
0.0
0%
0.0
0%
Tota
l-4
-6-9
-12
-39
-66
-27
13
00
00
00
00
-149
Cumulative developer profit
-198
-334
-489
-644
-2,113
-3,609
-1,462
726
726
726
726
726
726
726
726
726
725
carried forward to RV calc
Appendix 5 . F inanc ia l appra isa l summar ies
Page 99
SITE 4B: Clanville Grange Minehead

Taunton & South Somerset Af fordable Hous ing Si te Viab i l i ty Study
Page 100
Input assumptions
Scenario & option
Afford
able
15%
= 9
% s
ocia
l re
nte
d &
6%
inte
rmedia
te
Site details
Dwellings
ave f
loo
r sp
ace
bu
ildsa
les
Site
4B Clanville Grange
no
of
%g
ross
ne
tco
st
va
lue
Location
Minehead
dw
gs
sq
ft
sq
ft
pe
r sq
ft
pe
r sq
ft
Are
a ha
0.8
91.8
7M
ark
et housin
g40.8
085%
839
766
94.0
0238.0
034,2
31
acre
s2.2
00.0
%
No d
wgs
48
0.2
0A
fford
able
soc rent
4.3
29.0
%839
766
94.0
075.0
03,6
24
Density d
w/h
a53.9
0.0
%
0.1
3A
ff s
h o
ship
2.8
86.0
%839
766
94.0
0102.0
02,4
16
Tota
l48.0
100%
40,2
72
36,7
68
£3,7
85,5
68
£7,9
11,3
71
40,2
72
net:
gro
ss=
91
%
Flo
ors
pace d
ensity
=16,7
19
net sq ft per acre
£k
Contingency
31252.8
allo
wance
5.0
0%
189
0
3309.1
2 0
2206.0
8
36768
Development costs
Other costs
sta
ndard
% b
uild
12.0
%477
Pla
nnin
g415
£ p
er dw
elli
ng
Surv
ey
500
£ p
er dw
elli
ng
plu
s a
bnorm
als
3.2
%125
Mark
eting
0£ p
er dw
elli
ng
Tota
l15%
Interest
Design fees
% p
er annum
7.5
0%
-319
on b
uild
costs
10.0
%397
on d
ev c
osts
0%
Notes
Planning gain
£ p
er dw
elling
4,5
00
216
South Somerset & Taunton HMAs

Appendix 5 . F inanc ia l appra isa l summar ies
Page 101
SITE 4B LAND COST & PHASING
Programme
Ye
ar
1Y
ea
r 2
Ye
ar
3Y
ea
r 4
Q1
Q2
Q3
Q4
Q1
Q2
Q3
Q4
Q1
Q2
Q3
Q4
Q1
Q2
Q3
Q4
TO
TA
LS
Units
Ma
rke
t h
ou
sin
g6.8
6.8
6.8
6.8
6.8
6.8
0.0
0.0
0.0
0.0
40.8
started
Aff
ord
ab
le s
oc r
en
t0.7
0.7
0.7
0.7
0.7
0.7
0.0
0.0
0.0
0.0
4.3
Aff
sh
osh
ip0.5
0.5
0.5
0.5
0.5
0.5
0.0
0.0
0.0
0.0
2.9
TO
TA
L0
08
88
88
80
00
048.0
Units
Ma
rke
t h
ou
sin
g0
07
77
77
70
00
00
041
'built'
+2Q
Aff
ord
ab
le s
oc r
en
t0
01
11
11
10
00
00
04
Aff
sh
osh
ip0
00
00
00
00
00
00
03
Units
Ma
rke
t h
ou
sin
g0
07
77
77
70
00
00
41
completed
+3Q
Aff
ord
ab
le s
oc r
en
t0
01
11
11
10
00
00
4
Aff
sh
osh
ip0
00
00
00
00
00
00
3
Units
Ma
rke
t h
ou
sin
g0
07
77
77
70
00
041
purchased
+4Q
Aff
ord
ab
le s
oc r
en
t0
01
11
11
10
00
04
Aff
sh
osh
ip0
00
00
00
00
00
03
Land
Iterate to achieve 20.0% profit
Afford
able
No a
fford
able
Land p
urc
hase p
rice
£765,555
1,267,489
RV
per acre
£348,108
576,344
RV
per hecta
re£
860,174
1,424,145
Dev p
rofit
£1,277,897
1,459,209
Tota
l costs
£6,634,373
7,292,475
profit as % of costs
19.26%
20.01%

Taunton & South Somerset Af fordable Hous ing Si te Viab i l i ty Study
Page 102
SITE 4B CASH FLOW AFFORDABLE
Year
1Y
ear
2Y
ear
3Y
ear
4
rate
Q1
Q2
Q3
Q4
Q1
Q2
Q3
Q4
Q1
Q2
Q3
Q4
Q1
Q2
Q3
Q4
TO
TA
LS
INCOME
Housing sales
Mark
et h
ousin
g0
00
00
01,2
40
1,2
40
1,2
40
1,2
40
1,2
40
1,2
40
00
00
7,4
38
Afford
able
soc r
ent
00
00
00
41
41
41
41
41
41
00
00
248
Aff s
h o
ship
00
00
00
38
38
38
38
38
38
00
00
225
0
Sa
les fees
00
00
00
-44
-44
-44
-44
-44
-44
00
00
-264
Total income
00
00
00
1,319
1,319
1,319
1,319
1,319
1,319
00
00
7,911
COSTS
Land
La
nd a
cquis
itio
n766
766
Sta
mp
du
ty31
31
Pu
rch
ase fees
21
21
Total
817
Build costs
Mark
et h
ousin
g0
00
0536
536
536
536
536
536
00
00
00
3,2
18
Afford
able
soc r
ent
00
00
57
57
57
57
57
57
00
00
00
341
Aff s
h o
ship
00
00
38
38
38
38
38
38
00
00
00
227
Bu
ild c
on
ting
ency
5.0
%0
00
032
32
32
32
32
32
00
00
00
189
Total
3,975
Dev costs
Upfr
ont
6.0
%60
60
60
60
238
Bu
ild r
ela
ted
6.0
%0
040
40
40
40
40
40
00
00
00
238
Ab
norm
als
3%
63
63
125
Total
602
Fees
Fees o
n b
uild
costs
10
.0%
00
00
66
66
66
66
66
66
00
00
00
397
Fees o
n d
ev c
osts
0.0
%0
00
00
00
00
00
00
00
00
Total
397
PG
Pla
nnin
g g
ain
36
36
36
36
36
36
00
00
00
00
216
Total
216
Other
Pla
nnin
g£41
57
77
20
Su
rve
y£50
024
24
Mark
eting
£0
00
00
00
00
00
00
00
0
Total
44
Sales fees
b/fo
rward
fro
m a
bove
00
00
00
44
44
44
44
44
44
00
00
264
Total costs
970
129
142
135
804
804
848
848
773
773
44
44
00
00
6,315
Net profit/loss from quarter
-970
-129
-142
-135
-804
-804
470
470
546
546
1,275
1,275
00
00
1,596
Profit/loss bf from last quarter
0-9
88
-1,1
38
-1,3
04
-1,4
66
-2,3
13
-3,1
76
-2,7
57
-2,3
29
-1,8
17
-1,2
95
-20
1,2
78
1,2
78
1,2
78
1,2
78
Cumulative profit/loss
-970
-1,1
17
-1,2
80
-1,4
39
-2,2
71
-3,1
18
-2,7
06
-2,2
86
-1,7
83
-1,2
71
-20
1,2
54
1,2
78
1,2
78
1,2
78
1,2
78
Interest
Charg
ed a
t7.5
0%
7.5
0%
7.5
0%
7.5
0%
7.5
0%
7.5
0%
7.5
0%
7.5
0%
7.5
0%
7.5
0%
7.5
0%
7.5
0%
7.5
0%
0.0
0%
0.0
0%
0.0
0%
0.0
0%
Tota
l-1
8-2
1-2
4-2
7-4
3-5
8-5
1-4
3-3
3-2
40
24
00
00
-319
Cumulative developer profit
-988
-1,138
-1,304
-1,466
-2,313
-3,176
-2,757
-2,329
-1,817
-1,295
-20
1,278
1,278
1,278
1,278
1,278
1,277
carried forward to RV calc

Appendix 5 . F inanc ia l appra isa l summar ies
Page 103
SITE 4N: notional site Chard

Taunton & South Somerset Af fordable Hous ing Si te Viab i l i ty Study
Page 104
Input assumptions
Scenario & option
Afford
able
15%
= 9
% s
ocia
l re
nte
d &
6%
inte
rmedia
te
Site details
Dwellings
ave f
loo
r sp
ace
bu
ildsa
les
Site
4N notional as 4B
no
of
%g
ross
ne
tco
st
va
lue
Location
Chard
dw
gs
sq
ft
sq
ft
pe
r sq
ft
pe
r sq
ft
Are
a ha
0.8
91.8
7M
ark
et housin
g40.8
085%
839
766
94.0
0196.0
034,2
31
acre
s2.2
00.0
%
No d
wgs
48
0.2
0A
fford
able
soc rent
4.3
29.0
%839
766
94.0
073.0
03,6
24
Density d
w/h
a53.9
0.0
%
0.1
3A
ff s
h o
ship
2.8
86.0
%839
766
94.0
0102.0
02,4
16
Tota
l48.0
100%
40,2
72
36,7
68
£3,7
85,5
68
£6,5
92,1
35
40,2
72
net:
gro
ss=
91
%
Flo
ors
pace d
ensity
=16,7
19
net sq ft per acre
£k
Contingency
31252.8
allo
wance
5.0
0%
189
0
3309.1
2 0
2206.0
8
36768
Development costs
Other costs
sta
ndard
% b
uild
12.0
%477
Pla
nnin
g415
£ p
er dw
elli
ng
Surv
ey
500
£ p
er dw
elli
ng
plu
s a
bnorm
als
3.2
%125
Mark
eting
0£ p
er dw
elli
ng
Tota
l15%
Interest
Design fees
% p
er annum
7.5
0%
-171
on b
uild
costs
10.0
%397
on d
ev c
osts
0%
Notes
Planning gain
£ p
er dw
elling
6,0
00
288
South Somerset & Taunton HMAs

Appendix 5 . F inanc ia l appra isa l summar ies
Page 105
SITE 4N LAND COST & PHASING
Programme
Ye
ar
1Y
ea
r 2
Ye
ar
3Y
ea
r 4
Q1
Q2
Q3
Q4
Q1
Q2
Q3
Q4
Q1
Q2
Q3
Q4
Q1
Q2
Q3
Q4
TO
TA
LS
Units
Ma
rke
t h
ou
sin
g6.8
6.8
6.8
6.8
6.8
6.8
0.0
0.0
0.0
0.0
40.8
started
Aff
ord
ab
le s
oc r
en
t0.7
0.7
0.7
0.7
0.7
0.7
0.0
0.0
0.0
0.0
4.3
Aff
sh
osh
ip0.5
0.5
0.5
0.5
0.5
0.5
0.0
0.0
0.0
0.0
2.9
TO
TA
L0
08
88
88
80
00
048.0
Units
Ma
rke
t h
ou
sin
g0
07
77
77
70
00
00
041
'built'
+2Q
Aff
ord
ab
le s
oc r
en
t0
01
11
11
10
00
00
04
Aff
sh
osh
ip0
00
00
00
00
00
00
03
Units
Ma
rke
t h
ou
sin
g0
07
77
77
70
00
00
41
completed
+3Q
Aff
ord
ab
le s
oc r
en
t0
01
11
11
10
00
00
4
Aff
sh
osh
ip0
00
00
00
00
00
00
3
Units
Ma
rke
t h
ou
sin
g0
07
77
77
70
00
041
purchased
+4Q
Aff
ord
ab
le s
oc r
en
t0
01
11
11
10
00
04
Aff
sh
osh
ip0
00
00
00
00
00
03
Land
Iterate to achieve 20.0% profit
Afford
able
No a
fford
able
Land p
urc
hase p
rice
£-161,000
214,676
RV
per acre
£-73,209
97,616
RV
per hecta
re£
-180,899
241,209
Dev p
rofit
£1,063,655
1,200,549
Tota
l costs
£5,529,379
6,006,879
profit as % of costs
19.24%
19.99%

Taunton & South Somerset Af fordable Hous ing Si te Viab i l i ty Study
Page 106
SITE 4N CASH FLOW AFFORDABLE
Year
1Y
ear
2Y
ear
3Y
ear
4
rate
Q1
Q2
Q3
Q4
Q1
Q2
Q3
Q4
Q1
Q2
Q3
Q4
Q1
Q2
Q3
Q4
TO
TA
LS
INCOME
Housing sales
Mark
et h
ousin
g0
00
00
01,0
21
1,0
21
1,0
21
1,0
21
1,0
21
1,0
21
00
00
6,1
26
Afford
able
soc r
ent
00
00
00
40
40
40
40
40
40
00
00
242
Aff s
h o
ship
00
00
00
38
38
38
38
38
38
00
00
225
0
Sa
les fees
00
00
00
-36
-36
-36
-36
-36
-36
00
00
-218
Total income
00
00
00
1,099
1,099
1,099
1,099
1,099
1,099
00
00
6,592
COSTS
Land
La
nd a
cquis
itio
n-1
61
-161
Sta
mp
du
ty0
0
Pu
rch
ase fees
-4-4
Total
-165
Build costs
Mark
et h
ousin
g0
00
0536
536
536
536
536
536
00
00
00
3,2
18
Afford
able
soc r
ent
00
00
57
57
57
57
57
57
00
00
00
341
Aff s
h o
ship
00
00
38
38
38
38
38
38
00
00
00
227
Bu
ild c
on
ting
ency
5.0
%0
00
032
32
32
32
32
32
00
00
00
189
Total
3,975
Dev costs
Upfr
ont
6.0
%60
60
60
60
238
Bu
ild r
ela
ted
6.0
%0
040
40
40
40
40
40
00
00
00
238
Ab
norm
als
3%
63
63
125
Total
602
Fees
Fees o
n b
uild
costs
10
.0%
00
00
66
66
66
66
66
66
00
00
00
397
Fees o
n d
ev c
osts
0.0
%0
00
00
00
00
00
00
00
00
Total
397
PG
Pla
nnin
g g
ain
48
48
48
48
48
48
00
00
00
00
288
Total
288
Other
Pla
nnin
g£41
57
77
20
Su
rve
y£50
024
24
Mark
eting
£0
00
00
00
00
00
00
00
0
Total
44
Sales fees
b/fo
rward
fro
m a
bove
00
00
00
36
36
36
36
36
36
00
00
218
Total costs
-13
129
154
147
816
816
853
853
765
765
36
36
00
00
5,359
Net profit/loss from quarter
13
-129
-154
-147
-816
-816
246
246
334
334
1,062
1,062
00
00
1,233
Profit/loss bf from last quarter
013
-118
-277
-432
-1,2
72
-2,1
28
-1,9
17
-1,7
02
-1,3
94
-1,0
80
-18
1,0
64
1,0
64
1,0
64
1,0
64
Cumulative profit/loss
13
-116
-272
-425
-1,2
49
-2,0
89
-1,8
82
-1,6
71
-1,3
69
-1,0
61
-18
1,0
44
1,0
64
1,0
64
1,0
64
1,0
64
Interest
Charg
ed a
t7.5
0%
7.5
0%
7.5
0%
7.5
0%
7.5
0%
7.5
0%
7.5
0%
7.5
0%
7.5
0%
7.5
0%
7.5
0%
7.5
0%
7.5
0%
0.0
0%
0.0
0%
0.0
0%
0.0
0%
Tota
l0
-2-5
-8-2
3-3
9-3
5-3
1-2
6-2
00
20
00
00
-171
Cumulative developer profit
13
-118
-277
-432
-1,272
-2,128
-1,917
-1,702
-1,394
-1,080
-18
1,064
1,064
1,064
1,064
1,064
1,063
carried forward to RV calc

Appendix 5 . F inanc ia l appra isa l summar ies
Page 107
SITE 5A: St Michaels Gardens South
Petherton

Taunton & South Somerset Af fordable Hous ing Si te Viab i l i ty Study
Page 108
Input assumptions
Scenario & option
Afford
able
15%
= 9
% s
ocia
l re
nte
d &
6%
inte
rmedia
te
Site details
Dwellings
ave f
loo
r sp
ace
bu
ildsa
les
Site
5A St Michael's Gardens
no
of
%g
ross
ne
tco
st
va
lue
Location
South Petherton
dw
gs
sq
ft
sq
ft
pe
r sq
ft
pe
r sq
ft
Are
a ha
1.7
03.5
7M
ark
et housin
g46.7
585%
1,0
87
1,0
87
82.0
0230.0
050,8
17
acre
s4.2
00.0
%
No d
wgs
55
0.3
8A
fford
able
soc rent
4.9
59.0
%1,0
87
1,0
87
82.0
068.0
05,3
81
Density d
w/h
a32.4
0.0
%
0.2
5A
ff s
h o
ship
3.3
06.0
%1,0
87
1,0
87
82.0
096.0
03,5
87
Tota
l55.0
100%
59,7
85
59,7
85
£4,9
02,3
70
£12,3
98,2
13
59,7
85
net:
gro
ss=
10
0%
Flo
ors
pace d
ensity
=14,2
32
net sq ft per acre
£k
Contingency
50817.2
5
allo
wance
2.5
0%
123
0
5380.6
5 0
3587.1
59785
Development costs
Other costs
sta
ndard
% b
uild
16.0
%804
Pla
nnin
g181
£ p
er dw
elli
ng
Surv
ey
200
£ p
er dw
elli
ng
plu
s a
bnorm
als
0.0
%0
Mark
eting
0£ p
er dw
elli
ng
Tota
l16%
Interest
Design fees
% p
er annum
7.5
0%
-668
on b
uild
costs
10.0
%502
on d
ev c
osts
0%
Notes
Planning gain
£ p
er dw
elling
6,3
00
347
South Somerset & Taunton HMAs

Appendix 5 . F inanc ia l appra isa l summar ies
Page 109
SITE 5A LAND COST & PHASING
Programme
Ye
ar
1Y
ea
r 2
Ye
ar
3Y
ea
r 4
Q1
Q2
Q3
Q4
Q1
Q2
Q3
Q4
Q1
Q2
Q3
Q4
Q1
Q2
Q3
Q4
TO
TA
LS
Units
Ma
rke
t h
ou
sin
g4.3
8.5
8.5
8.5
8.5
8.5
0.0
0.0
0.0
0.0
46.8
started
Aff
ord
ab
le s
oc r
en
t0.5
0.9
0.9
0.9
0.9
0.9
0.0
0.0
0.0
0.0
5.0
Aff
sh
osh
ip0.3
0.6
0.6
0.6
0.6
0.6
0.0
0.0
0.0
0.0
3.3
TO
TA
L0
05
10
10
10
10
10
00
00
55.0
Units
Ma
rke
t h
ou
sin
g0
04
99
99
90
00
00
047
'built'
+2Q
Aff
ord
ab
le s
oc r
en
t0
00
11
11
10
00
00
05
Aff
sh
osh
ip0
00
11
11
10
00
00
03
Units
Ma
rke
t h
ou
sin
g0
04
99
99
90
00
00
47
completed
+3Q
Aff
ord
ab
le s
oc r
en
t0
00
11
11
10
00
00
5
Aff
sh
osh
ip0
00
11
11
10
00
00
3
Units
Ma
rke
t h
ou
sin
g0
04
99
99
90
00
047
purchased
+4Q
Aff
ord
ab
le s
oc r
en
t0
00
11
11
10
00
05
Aff
sh
osh
ip0
00
11
11
10
00
03
Land
Iterate to achieve 20.0% profit
Afford
able
No a
fford
able
Land p
urc
hase p
rice
£2,450,631
3,252,424
RV
per acre
£583,386
774,258
RV
per hecta
re£
1,441,547
1,913,190
Dev p
rofit
£2,001,612
2,298,558
Tota
l costs
£10,397,501
11,452,892
profit as % of costs
19.25%
20.07%

Taunton & South Somerset Af fordable Hous ing Si te Viab i l i ty Study
Page 110
SITE 5A CASH FLOW AFFORDABLE
Year
1Y
ear
2Y
ear
3Y
ear
4
rate
Q1
Q2
Q3
Q4
Q1
Q2
Q3
Q4
Q1
Q2
Q3
Q4
Q1
Q2
Q3
Q4
TO
TA
LS
INCOME
Housing sales
Mark
et h
ousin
g0
00
00
01,0
63
2,1
25
2,1
25
2,1
25
2,1
25
2,1
25
00
00
11,6
88
Afford
able
soc r
ent
00
00
00
33
67
67
67
67
67
00
00
366
Aff s
h o
ship
00
00
00
31
63
63
63
63
63
00
00
344
0
Sa
les fees
00
00
00
-38
-75
-75
-75
-75
-75
00
00
-414
Total income
00
00
00
1,127
2,254
2,254
2,254
2,254
2,254
00
00
12,398
COSTS
Land
La
nd a
cquis
itio
n2,4
51
2,4
51
Sta
mp
du
ty98
98
Pu
rch
ase fees
67
67
Total
2,616
Build costs
Mark
et h
ousin
g0
00
0379
758
758
758
758
758
00
00
00
4,1
67
Afford
able
soc r
ent
00
00
40
80
80
80
80
80
00
00
00
441
Aff s
h o
ship
00
00
27
53
53
53
53
53
00
00
00
294
Bu
ild c
on
ting
ency
2.5
%0
00
011
22
22
22
22
22
00
00
00
123
Total
5,025
Dev costs
Upfr
ont
8.0
%100
100
100
100
402
Bu
ild r
ela
ted
8.0
%0
037
73
73
73
73
73
00
00
00
402
Ab
norm
als
0%
00
0
Total
804
Fees
Fees o
n b
uild
costs
10
.0%
00
00
46
91
91
91
91
91
00
00
00
502
Fees o
n d
ev c
osts
0.0
%0
00
00
00
00
00
00
00
00
Total
502
PG
Pla
nnin
g g
ain
32
63
63
63
63
63
00
00
00
00
347
Total
347
Other
Pla
nnin
g£18
13
33
10
Su
rve
y£20
011
11
Mark
eting
£0
00
00
00
00
00
00
00
0
Total
21
Sales fees
b/fo
rward
fro
m a
bove
00
00
00
38
75
75
75
75
75
00
00
414
Total costs
2,731
104
172
237
639
1,141
1,179
1,216
1,080
1,080
75
75
00
00
9,729
Net profit/loss from quarter
-2,731
-104
-172
-237
-639
-1,141
-52
1,038
1,174
1,174
2,179
2,179
00
00
2,669
Profit/loss bf from last quarter
0-2
,782
-2,9
40
-3,1
70
-3,4
70
-4,1
86
-5,4
27
-5,5
81
-4,6
28
-3,5
19
-2,3
89
-214
2,0
02
2,0
02
2,0
02
2,0
02
Cumulative profit/loss
-2,7
31
-2,8
86
-3,1
12
-3,4
07
-4,1
09
-5,3
27
-5,4
78
-4,5
43
-3,4
55
-2,3
45
-210
1,9
65
2,0
02
2,0
02
2,0
02
2,0
02
Interest
Charg
ed a
t7.5
0%
7.5
0%
7.5
0%
7.5
0%
7.5
0%
7.5
0%
7.5
0%
7.5
0%
7.5
0%
7.5
0%
7.5
0%
7.5
0%
7.5
0%
0.0
0%
0.0
0%
0.0
0%
0.0
0%
Tota
l-5
1-5
4-5
8-6
4-7
7-1
00
-103
-85
-65
-44
-437
00
00
-668
Cumulative developer profit
-2,782
-2,940
-3,170
-3,470
-4,186
-5,427
-5,581
-4,628
-3,519
-2,389
-214
2,002
2,002
2,002
2,002
2,002
2,001
carried forward to RV calc

Appendix 5 . F inanc ia l appra isa l summar ies
Page 111
SITE 5B Paddons Field Stogursey

Taunton & South Somerset Af fordable Hous ing Si te Viab i l i ty Study
Page 112
Input assumptions
Scenario & option
Afford
able
15%
= 9
% s
ocia
l re
nte
d &
6%
inte
rmedia
te
Site details
Dwellings
ave f
loo
r sp
ace
bu
ildsa
les
Site
5B Paddons Field
no
of
%g
ross
ne
tco
st
va
lue
Location
Stogursey
dw
gs
sq
ft
sq
ft
pe
r sq
ft
pe
r sq
ft
Are
a ha
1.9
54.1
0M
ark
et housin
g50.1
585%
963
955
83.0
0230.0
048,2
94
acre
s4.8
20.0
%
No d
wgs
59
0.4
3A
fford
able
soc rent
5.3
19.0
%963
955
83.0
071.0
05,1
14
Density d
w/h
a30.3
0.0
%
0.2
9A
ff s
h o
ship
3.5
46.0
%963
955
83.0
097.0
03,4
09
Tota
l59.0
100%
56,8
17
56,3
45
£4,7
15,8
11
£11,7
03,4
20
56,8
17
net:
gro
ss=
99
%
Flo
ors
pace d
ensity
=11,6
94
net sq ft per acre
£k
Contingency
47893.2
5
allo
wance
2.5
0%
118
0
5071.0
5 0
3380.7
56345
Development costs
Other costs
sta
ndard
% b
uild
16.0
%773
Pla
nnin
g203
£ p
er dw
elli
ng
Surv
ey
200
£ p
er dw
elli
ng
plu
s a
bnorm
als
0.0
%0
Mark
eting
0£ p
er dw
elli
ng
Tota
l16%
Interest
Design fees
% p
er annum
7.5
0%
-601
on b
uild
costs
10.0
%483
on d
ev c
osts
0%
Notes
Planning gain
£ p
er dw
elling
6,0
00
354
South Somerset & Taunton HMAs

Appendix 5 . F inanc ia l appra isa l summar ies
Page 113
SITE 5B LAND COST & PHASING
Programme
Ye
ar
1Y
ea
r 2
Ye
ar
3Y
ea
r 4
Q1
Q2
Q3
Q4
Q1
Q2
Q3
Q4
Q1
Q2
Q3
Q4
Q1
Q2
Q3
Q4
TO
TA
LS
Units
Ma
rke
t h
ou
sin
g7.7
8.5
8.5
8.5
8.5
8.5
0.0
0.0
0.0
0.0
50.2
started
Aff
ord
ab
le s
oc r
en
t0.8
0.9
0.9
0.9
0.9
0.9
0.0
0.0
0.0
0.0
5.3
Aff
sh
osh
ip0.5
0.6
0.6
0.6
0.6
0.6
0.0
0.0
0.0
0.0
3.5
TO
TA
L0
09
10
10
10
10
10
00
00
59.0
Units
Ma
rke
t h
ou
sin
g0
08
99
99
90
00
00
050
'built'
+2Q
Aff
ord
ab
le s
oc r
en
t0
01
11
11
10
00
00
05
Aff
sh
osh
ip0
01
11
11
10
00
00
04
Units
Ma
rke
t h
ou
sin
g0
08
99
99
90
00
00
50
completed
+3Q
Aff
ord
ab
le s
oc r
en
t0
01
11
11
10
00
00
5
Aff
sh
osh
ip0
01
11
11
10
00
00
4
Units
Ma
rke
t h
ou
sin
g0
08
99
99
90
00
050
purchased
+4Q
Aff
ord
ab
le s
oc r
en
t0
01
11
11
10
00
05
Aff
sh
osh
ip0
01
11
11
10
00
04
Land
Iterate to achieve 20.0% profit
Afford
able
No a
fford
able
Land p
urc
hase p
rice
£2,206,137
2,957,369
RV
per acre
£457,852
613,759
RV
per hecta
re£
1,131,352
1,516,599
Dev p
rofit
£1,889,084
2,159,626
Tota
l costs
£9,815,236
10,800,624
profit as % of costs
19.25%
20.00%

Taunton & South Somerset Af fordable Hous ing Si te Viab i l i ty Study
Page 114
SITE 5B CASH FLOW AFFORDABLE
Year
1Y
ear
2Y
ear
3Y
ear
4
rate
Q1
Q2
Q3
Q4
Q1
Q2
Q3
Q4
Q1
Q2
Q3
Q4
Q1
Q2
Q3
Q4
TO
TA
LS
INCOME
Housing sales
Mark
et h
ousin
g0
00
00
01,6
80
1,8
67
1,8
67
1,8
67
1,8
67
1,8
67
00
00
11,0
15
Afford
able
soc r
ent
00
00
00
55
61
61
61
61
61
00
00
360
Aff s
h o
ship
00
00
00
50
56
56
56
56
56
00
00
328
0
Sa
les fees
00
00
00
-60
-66
-66
-66
-66
-66
00
00
-391
Total income
00
00
00
1,785
1,984
1,984
1,984
1,984
1,984
00
00
11,703
COSTS
Land
La
nd a
cquis
itio
n2,2
06
2,2
06
Sta
mp
du
ty88
88
Pu
rch
ase fees
61
61
Total
2,355
Build costs
Mark
et h
ousin
g0
00
0611
679
679
679
679
679
00
00
00
4,0
08
Afford
able
soc r
ent
00
00
65
72
72
72
72
72
00
00
00
424
Aff s
h o
ship
00
00
43
48
48
48
48
48
00
00
00
283
Bu
ild c
on
ting
ency
2.5
%0
00
018
20
20
20
20
20
00
00
00
118
Total
4,834
Dev costs
Upfr
ont
8.0
%97
97
97
97
387
Bu
ild r
ela
ted
8.0
%0
059
66
66
66
66
66
00
00
00
387
Ab
norm
als
0%
00
0
Total
773
Fees
Fees o
n b
uild
costs
10
.0%
00
00
74
82
82
82
82
82
00
00
00
483
Fees o
n d
ev c
osts
0.0
%0
00
00
00
00
00
00
00
00
Total
483
PG
Pla
nnin
g g
ain
54
60
60
60
60
60
00
00
00
00
354
Total
354
Other
Pla
nnin
g£20
34
44
12
Su
rve
y£20
012
12
Mark
eting
£0
00
00
00
00
00
00
00
0
Total
24
Sales fees
b/fo
rward
fro
m a
bove
00
00
00
60
66
66
66
66
66
00
00
391
Total costs
2,468
101
214
222
937
1,027
1,086
1,093
967
967
66
66
00
00
9,214
Net profit/loss from quarter
-2,468
-101
-214
-222
-937
-1,027
699
891
1,016
1,016
1,917
1,917
00
00
2,490
Profit/loss bf from last quarter
0-2
,514
-2,6
63
-2,9
31
-3,2
12
-4,2
26
-5,3
52
-4,7
40
-3,9
21
-2,9
59
-1,9
80
-63
1,8
89
1,8
89
1,8
89
1,8
89
Cumulative profit/loss
-2,4
68
-2,6
14
-2,8
77
-3,1
53
-4,1
49
-5,2
53
-4,6
53
-3,8
49
-2,9
05
-1,9
43
-62
1,8
54
1,8
89
1,8
89
1,8
89
1,8
89
Interest
Charg
ed a
t7.5
0%
7.5
0%
7.5
0%
7.5
0%
7.5
0%
7.5
0%
7.5
0%
7.5
0%
7.5
0%
7.5
0%
7.5
0%
7.5
0%
7.5
0%
0.0
0%
0.0
0%
0.0
0%
0.0
0%
Tota
l-4
6-4
9-5
4-5
9-7
8-9
8-8
7-7
2-5
4-3
6-1
35
00
00
-601
Cumulative developer profit
-2,514
-2,663
-2,931
-3,212
-4,226
-5,352
-4,740
-3,921
-2,959
-1,980
-63
1,889
1,889
1,889
1,889
1,889
1,888
carried forward to RV calc

Appendix 5 . F inanc ia l appra isa l summar ies
Page 115
SITE 6A: Kings Yard Bishops Lydeard

Taunton & South Somerset Af fordable Hous ing Si te Viab i l i ty Study
Page 116
Input assumptions
Scenario & option
Afford
able
15%
= 9
% s
ocia
l re
nte
d &
6%
inte
rmedia
te
Site details
Dwellings
ave f
loo
r sp
ace
bu
ildsa
les
Site
6A Kings Yard
no
of
%g
ross
ne
tco
st
va
lue
Location
Bishops Lydeard
dw
gs
sq
ft
sq
ft
pe
r sq
ft
pe
r sq
ft
Are
a ha
0.6
61.3
9M
ark
et housin
g27.2
085%
1,0
94
1,0
84
85.0
0241.0
029,7
57
acre
s1.6
30.0
%
No d
wgs
32
0.1
5A
fford
able
soc rent
2.8
89.0
%1,0
94
1,0
84
85.0
068.0
03,1
51
Density d
w/h
a48.5
0.0
%
0.1
0A
ff s
h o
ship
1.9
26.0
%1,0
94
1,0
84
85.0
097.0
02,1
00
Tota
l32.0
100%
35,0
08
34,6
88
£2,9
75,6
80
£7,5
20,0
12
35,0
08
net:
gro
ss=
99
%
Flo
ors
pace d
ensity
=21,2
70
net sq ft per acre
£k
Contingency
29484.8
allo
wance
5.0
0%
149
0
3121.9
2 0
2081.2
8
34688
Development costs
Other costs
sta
ndard
% b
uild
13.0
%406
Pla
nnin
g415
£ p
er dw
elli
ng
Surv
ey
500
£ p
er dw
elli
ng
plu
s a
bnorm
als
2.4
%75
Mark
eting
0£ p
er dw
elli
ng
Tota
l15%
Interest
Design fees
% p
er annum
7.5
0%
-398
on b
uild
costs
10.0
%312
on d
ev c
osts
0%
Notes
Planning gain
£ p
er dw
elling
3,3
00
106
South Somerset & Taunton HMAs

Appendix 5 . F inanc ia l appra isa l summar ies
Page 117
SITE 6A LAND COST & PHASING
Programme
Ye
ar
1Y
ea
r 2
Ye
ar
3Y
ea
r 4
Q1
Q2
Q3
Q4
Q1
Q2
Q3
Q4
Q1
Q2
Q3
Q4
Q1
Q2
Q3
Q4
TO
TA
LS
Units
Ma
rke
t h
ou
sin
g3.4
6.0
6.0
6.0
6.0
0.0
0.0
0.0
0.0
0.0
27.2
started
Aff
ord
ab
le s
oc r
en
t0.4
0.6
0.6
0.6
0.6
0.0
0.0
0.0
0.0
0.0
2.9
Aff
sh
osh
ip0.2
0.4
0.4
0.4
0.4
0.0
0.0
0.0
0.0
0.0
1.9
TO
TA
L0
04
77
77
00
00
032.0
Units
Ma
rke
t h
ou
sin
g0
03
66
66
00
00
00
027
'built'
+2Q
Aff
ord
ab
le s
oc r
en
t0
00
11
11
00
00
00
03
Aff
sh
osh
ip0
00
00
00
00
00
00
02
Units
Ma
rke
t h
ou
sin
g0
03
66
66
00
00
00
27
completed
+3Q
Aff
ord
ab
le s
oc r
en
t0
00
11
11
00
00
00
3
Aff
sh
osh
ip0
00
00
00
00
00
00
2
Units
Ma
rke
t h
ou
sin
g0
03
66
66
00
00
027
purchased
+4Q
Aff
ord
ab
le s
oc r
en
t0
00
11
11
00
00
03
Aff
sh
osh
ip0
00
00
00
00
00
02
Land
Iterate to achieve 20.0% profit
Afford
able
No a
fford
able
Land p
urc
hase p
rice
£1,503,002
2,008,376
RV
per acre
£921,601
1,231,482
RV
per hecta
re£
2,277,276
3,042,993
Dev p
rofit
£1,214,089
1,394,394
Tota
l costs
£6,306,747
6,966,239
profit as % of costs
19.25%
20.02%

Taunton & South Somerset Af fordable Hous ing Si te Viab i l i ty Study
Page 118
SITE 6B CASH FLOW AFFORDABLE
Year
1Y
ear
2Y
ear
3Y
ear
4
rate
Q1
Q2
Q3
Q4
Q1
Q2
Q3
Q4
Q1
Q2
Q3
Q4
Q1
Q2
Q3
Q4
TO
TA
LS
INCOME
Housing sales
Mark
et h
ousin
g0
00
00
0888
1,5
54
1,5
54
1,5
54
1,5
54
00
00
07,1
06
Afford
able
soc r
ent
00
00
00
27
46
46
46
46
00
00
0212
Aff s
h o
ship
00
00
00
25
44
44
44
44
00
00
0202
0
Sa
les fees
00
00
00
-31
-55
-55
-55
-55
00
00
0-2
52
Total income
00
00
00
940
1,645
1,645
1,645
1,645
00
00
07,520
COSTS
Land
La
nd a
cquis
itio
n1,5
03
1,5
03
Sta
mp
du
ty60
60
Pu
rch
ase fees
41
41
Total
1,604
Build costs
Mark
et h
ousin
g0
00
0316
553
553
553
553
00
00
00
02,5
29
Afford
able
soc r
ent
00
00
33
59
59
59
59
00
00
00
0268
Aff s
h o
ship
00
00
22
39
39
39
39
00
00
00
0179
Bu
ild c
on
ting
ency
5.0
%0
00
019
33
33
33
33
00
00
00
0149
Total
3,124
Dev costs
Upfr
ont
6.5
%51
51
51
51
203
Bu
ild r
ela
ted
6.5
%0
025
44
44
44
44
00
00
00
0203
Ab
norm
als
2%
37
37
75
Total
481
Fees
Fees o
n b
uild
costs
10
.0%
00
00
39
68
68
68
68
00
00
00
0312
Fees o
n d
ev c
osts
0.0
%0
00
00
00
00
00
00
00
00
Total
312
PG
Pla
nnin
g g
ain
13
23
23
23
23
00
00
00
00
0106
Total
106
Other
Pla
nnin
g£41
54
44
13
Su
rve
y£50
016
16
Mark
eting
£0
00
00
00
00
00
00
00
0
Total
29
Sales fees
b/fo
rward
fro
m a
bove
00
00
00
31
55
55
55
55
00
00
0252
Total costs
1,713
93
94
118
497
819
851
807
807
55
55
00
00
05,909
Net profit/loss from quarter
-1,713
-93
-94
-118
-497
-819
89
838
838
1,590
1,590
00
00
01,611
Profit/loss bf from last quarter
0-1
,745
-1,8
72
-2,0
03
-2,1
61
-2,7
08
-3,5
93
-3,5
70
-2,7
83
-1,9
81
-398
1,2
14
1,2
14
1,2
14
1,2
14
1,2
14
Cumulative profit/loss
-1,7
13
-1,8
38
-1,9
66
-2,1
21
-2,6
58
-3,5
27
-3,5
04
-2,7
31
-1,9
45
-391
1,1
92
1,2
14
1,2
14
1,2
14
1,2
14
1,2
14
Interest
Charg
ed a
t7.5
0%
7.5
0%
7.5
0%
7.5
0%
7.5
0%
7.5
0%
7.5
0%
7.5
0%
7.5
0%
7.5
0%
7.5
0%
7.5
0%
0.0
0%
0.0
0%
0.0
0%
0.0
0%
0.0
0%
Tota
l-3
2-3
4-3
7-4
0-5
0-6
6-6
6-5
1-3
6-7
22
00
00
0-398
Cumulative developer profit
-1,745
-1,872
-2,003
-2,161
-2,708
-3,593
-3,570
-2,783
-1,981
-398
1,214
1,214
1,214
1,214
1,214
1,214
1,213
carried forward to RV calc
Appendix 5 . F inanc ia l appra isa l summar ies
Page 119
SITE 6N notional site Castle Cary

Taunton & South Somerset Af fordable Hous ing Si te Viab i l i ty Study
Page 120
Input assumptions
Scenario & option
Afford
able
15%
= 9
% s
ocia
l re
nte
d &
6%
inte
rmedia
te
Site details
Dwellings
ave f
loo
r sp
ace
bu
ildsa
les
Site
6N notional as 6A
no
of
%g
ross
ne
tco
st
va
lue
Location
Castle Cary
dw
gs
sq
ft
sq
ft
pe
r sq
ft
pe
r sq
ft
Are
a ha
0.6
61.3
9M
ark
et housin
g27.2
085%
1,0
94
1,0
84
85.0
0211.0
029,7
57
acre
s1.6
30.0
%
No d
wgs
32
0.1
5A
fford
able
soc rent
2.8
89.0
%1,0
94
1,0
84
85.0
068.0
03,1
51
Density d
w/h
a48.5
0.0
%
0.1
0A
ff s
h o
ship
1.9
26.0
%1,0
94
1,0
84
85.0
097.0
02,1
00
Tota
l32.0
100%
35,0
08
34,6
88
£2,9
75,6
80
£6,6
35,4
68
35,0
08
net:
gro
ss=
99
%
Flo
ors
pace d
ensity
=21,2
70
net sq ft per acre
£k
Contingency
29484.8
allo
wance
5.0
0%
149
0
3121.9
2 0
2081.2
8
34688
Development costs
Other costs
sta
ndard
% b
uild
13.0
%406
Pla
nnin
g415
£ p
er dw
elli
ng
Surv
ey
500
£ p
er dw
elli
ng
plu
s a
bnorm
als
2.4
%75
Mark
eting
0£ p
er dw
elli
ng
Tota
l15%
Interest
Design fees
% p
er annum
7.5
0%
-281
on b
uild
costs
10.0
%312
on d
ev c
osts
0%
Notes
Planning gain
£ p
er dw
elling
13,0
00
416
South Somerset & Taunton HMAs
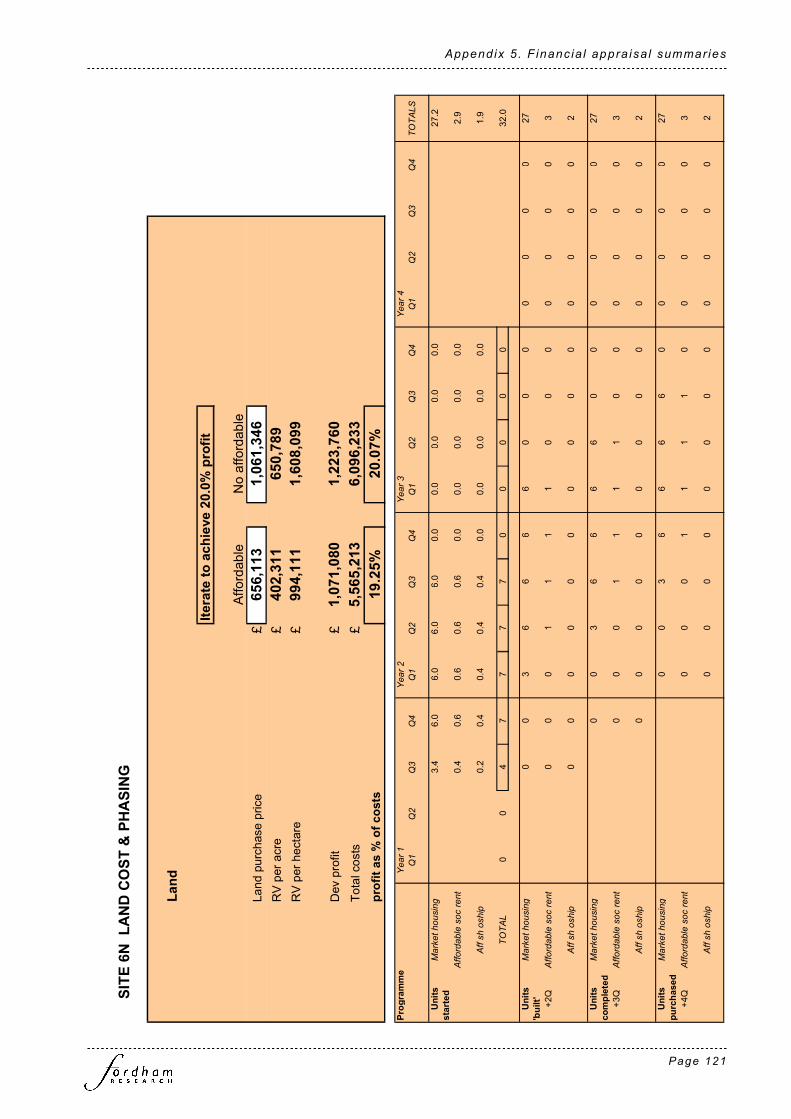
Appendix 5 . F inanc ia l appra isa l summar ies
Page 121
SITE 6N LAND COST & PHASING
Programme
Ye
ar
1Y
ea
r 2
Ye
ar
3Y
ea
r 4
Q1
Q2
Q3
Q4
Q1
Q2
Q3
Q4
Q1
Q2
Q3
Q4
Q1
Q2
Q3
Q4
TO
TA
LS
Units
Ma
rke
t h
ou
sin
g3.4
6.0
6.0
6.0
6.0
0.0
0.0
0.0
0.0
0.0
27.2
started
Aff
ord
ab
le s
oc r
en
t0.4
0.6
0.6
0.6
0.6
0.0
0.0
0.0
0.0
0.0
2.9
Aff
sh
osh
ip0.2
0.4
0.4
0.4
0.4
0.0
0.0
0.0
0.0
0.0
1.9
TO
TA
L0
04
77
77
00
00
032.0
Units
Ma
rke
t h
ou
sin
g0
03
66
66
00
00
00
027
'built'
+2Q
Aff
ord
ab
le s
oc r
en
t0
00
11
11
00
00
00
03
Aff
sh
osh
ip0
00
00
00
00
00
00
02
Units
Ma
rke
t h
ou
sin
g0
03
66
66
00
00
00
27
completed
+3Q
Aff
ord
ab
le s
oc r
en
t0
00
11
11
00
00
00
3
Aff
sh
osh
ip0
00
00
00
00
00
00
2
Units
Ma
rke
t h
ou
sin
g0
03
66
66
00
00
027
purchased
+4Q
Aff
ord
ab
le s
oc r
en
t0
00
11
11
00
00
03
Aff
sh
osh
ip0
00
00
00
00
00
02
Land
Iterate to achieve 20.0% profit
Afford
able
No a
fford
able
Land p
urc
hase p
rice
£656,113
1,061,346
RV
per acre
£402,311
650,789
RV
per hecta
re£
994,111
1,608,099
Dev p
rofit
£1,071,080
1,223,760
Tota
l costs
£5,565,213
6,096,233
profit as % of costs
19.25%
20.07%

Taunton & South Somerset Af fordable Hous ing Si te Viab i l i ty Study
Page 122
SITE 6N CASH FLOW AFFORDABLE
Year
1Y
ear
2Y
ear
3Y
ear
4
rate
Q1
Q2
Q3
Q4
Q1
Q2
Q3
Q4
Q1
Q2
Q3
Q4
Q1
Q2
Q3
Q4
TO
TA
LS
INCOME
Housing sales
Mark
et h
ousin
g0
00
00
0778
1,3
61
1,3
61
1,3
61
1,3
61
00
00
06,2
21
Afford
able
soc r
ent
00
00
00
27
46
46
46
46
00
00
0212
Aff s
h o
ship
00
00
00
25
44
44
44
44
00
00
0202
0
Sa
les fees
00
00
00
-28
-48
-48
-48
-48
00
00
0-2
21
Total income
00
00
00
829
1,452
1,452
1,452
1,452
00
00
06,635
COSTS
Land
La
nd a
cquis
itio
n656
656
Sta
mp
du
ty26
26
Pu
rch
ase fees
18
18
Total
700
Build costs
Mark
et h
ousin
g0
00
0316
553
553
553
553
00
00
00
02,5
29
Afford
able
soc r
ent
00
00
33
59
59
59
59
00
00
00
0268
Aff s
h o
ship
00
00
22
39
39
39
39
00
00
00
0179
Bu
ild c
on
ting
ency
5.0
%0
00
019
33
33
33
33
00
00
00
0149
Total
3,124
Dev costs
Upfr
ont
6.5
%51
51
51
51
203
Bu
ild r
ela
ted
6.5
%0
025
44
44
44
44
00
00
00
0203
Ab
norm
als
2%
37
37
75
Total
481
Fees
Fees o
n b
uild
costs
10
.0%
00
00
39
68
68
68
68
00
00
00
0312
Fees o
n d
ev c
osts
0.0
%0
00
00
00
00
00
00
00
00
Total
312
PG
Pla
nnin
g g
ain
52
91
91
91
91
00
00
00
00
0416
Total
416
Other
Pla
nnin
g£41
54
44
13
Su
rve
y£50
016
16
Mark
eting
£0
00
00
00
00
00
00
00
0
Total
29
Sales fees
b/fo
rward
fro
m a
bove
00
00
00
28
48
48
48
48
00
00
0221
Total costs
809
93
133
186
565
887
915
800
800
48
48
00
00
05,285
Net profit/loss from quarter
-809
-93
-133
-186
-565
-887
-85
651
651
1,403
1,403
00
00
01,351
Profit/loss bf from last quarter
0-8
24
-934
-1,0
87
-1,2
96
-1,8
96
-2,8
36
-2,9
76
-2,3
68
-1,7
49
-352
1,0
71
1,0
71
1,0
71
1,0
71
1,0
71
Cumulative profit/loss
-809
-917
-1,0
67
-1,2
73
-1,8
62
-2,7
84
-2,9
21
-2,3
24
-1,7
17
-346
1,0
51
1,0
71
1,0
71
1,0
71
1,0
71
1,0
71
Interest
Charg
ed a
t7.5
0%
7.5
0%
7.5
0%
7.5
0%
7.5
0%
7.5
0%
7.5
0%
7.5
0%
7.5
0%
7.5
0%
7.5
0%
7.5
0%
0.0
0%
0.0
0%
0.0
0%
0.0
0%
0.0
0%
Tota
l-1
5-1
7-2
0-2
4-3
5-5
2-5
5-4
4-3
2-6
20
00
00
0-281
Cumulative developer profit
-824
-934
-1,087
-1,296
-1,896
-2,836
-2,976
-2,368
-1,749
-352
1,071
1,071
1,071
1,071
1,071
1,071
1,070
carried forward to RV calc
Appendix 5 . F inanc ia l appra isa l summar ies
Page 123
SITE 7A: Dabinetts Close Norton Fitzwarren
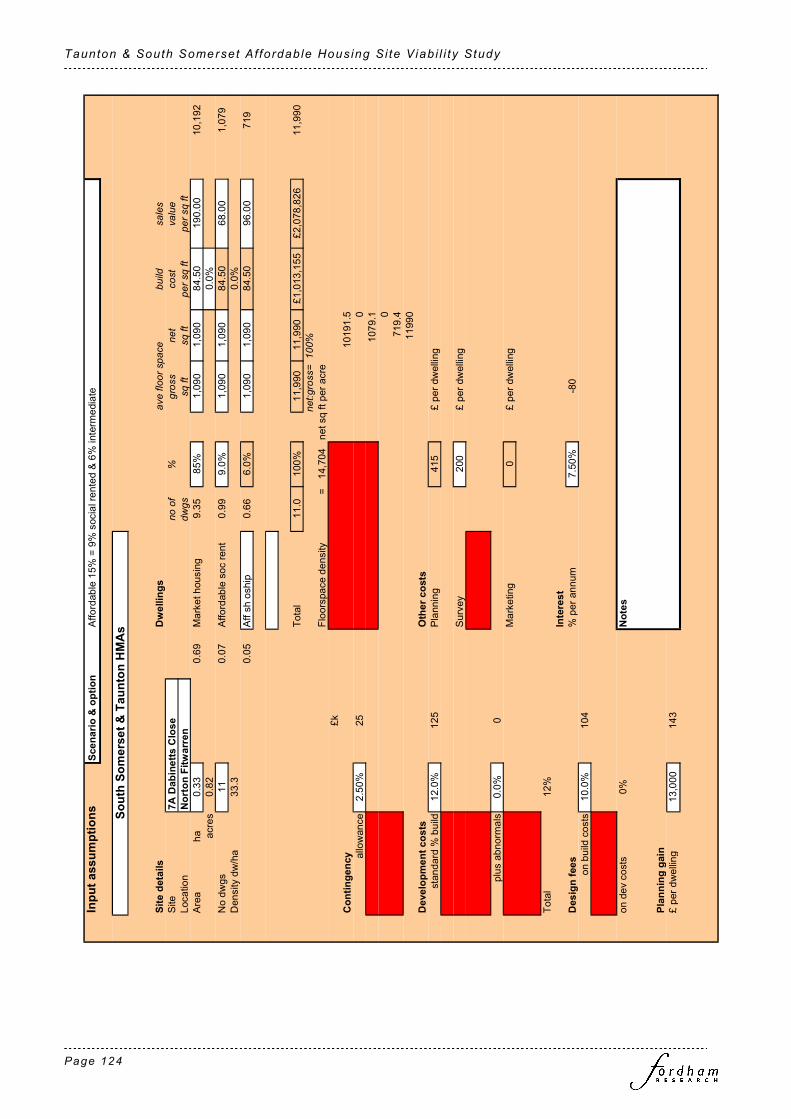
Taunton & South Somerset Af fordable Hous ing Si te Viab i l i ty Study
Page 124
Input assumptions
Scenario & option
Afford
able
15%
= 9
% s
ocia
l re
nte
d &
6%
inte
rmedia
te
Site details
Dwellings
ave f
loo
r sp
ace
bu
ildsa
les
Site
7A Dabinetts Close
no
of
%g
ross
ne
tco
st
va
lue
Location
Norton Fitwarren
dw
gs
sq
ft
sq
ft
pe
r sq
ft
pe
r sq
ft
Are
a ha
0.3
30.6
9M
ark
et housin
g9.3
585%
1,0
90
1,0
90
84.5
0190.0
010,1
92
acre
s0.8
20.0
%
No d
wgs
11
0.0
7A
fford
able
soc rent
0.9
99.0
%1,0
90
1,0
90
84.5
068.0
01,0
79
Density d
w/h
a33.3
0.0
%
0.0
5A
ff s
h o
ship
0.6
66.0
%1,0
90
1,0
90
84.5
096.0
0719
Tota
l11.0
100%
11,9
90
11,9
90
£1,0
13,1
55
£2,0
78,8
26
11,9
90
net:
gro
ss=
10
0%
Flo
ors
pace d
ensity
=14,7
04
net sq ft per acre
£k
Contingency
10191.5
allo
wance
2.5
0%
25
0
1079.1 0
719.4
11990
Development costs
Other costs
sta
ndard
% b
uild
12.0
%125
Pla
nnin
g415
£ p
er dw
elli
ng
Surv
ey
200
£ p
er dw
elli
ng
plu
s a
bnorm
als
0.0
%0
Mark
eting
0£ p
er dw
elli
ng
Tota
l12%
Interest
Design fees
% p
er annum
7.5
0%
-80
on b
uild
costs
10.0
%104
on d
ev c
osts
0%
Notes
Planning gain
£ p
er dw
elling
13,0
00
143
South Somerset & Taunton HMAs

Appendix 5 . F inanc ia l appra isa l summar ies
Page 125
SITE 7A LAND COST & PHASING
Programme
Ye
ar
1Y
ea
r 2
Ye
ar
3Y
ea
r 4
Q1
Q2
Q3
Q4
Q1
Q2
Q3
Q4
Q1
Q2
Q3
Q4
Q1
Q2
Q3
Q4
TO
TA
LS
Units
Ma
rke
t h
ou
sin
g1.7
2.6
2.6
2.6
0.0
0.0
0.0
0.0
0.0
0.0
9.4
started
Aff
ord
ab
le s
oc r
en
t0.2
0.3
0.3
0.3
0.0
0.0
0.0
0.0
0.0
0.0
1.0
Aff
sh
osh
ip0.1
0.2
0.2
0.2
0.0
0.0
0.0
0.0
0.0
0.0
0.7
TO
TA
L0
02
33
30
00
00
011.0
Units
Ma
rke
t h
ou
sin
g0
02
33
30
00
00
00
09
'built'
+2Q
Aff
ord
ab
le s
oc r
en
t0
00
00
00
00
00
00
01
Aff
sh
osh
ip0
00
00
00
00
00
00
01
Units
Ma
rke
t h
ou
sin
g0
02
33
30
00
00
00
9
completed
+3Q
Aff
ord
ab
le s
oc r
en
t0
00
00
00
00
00
00
1
Aff
sh
osh
ip0
00
00
00
00
00
00
1
Units
Ma
rke
t h
ou
sin
g0
02
33
30
00
00
09
purchased
+4Q
Aff
ord
ab
le s
oc r
en
t0
00
00
00
00
00
01
Aff
sh
osh
ip0
00
00
00
00
00
01
Land
Iterate to achieve 20.0% profit
Afford
able
No a
fford
able
Land p
urc
hase p
rice
£171,234
294,116
RV
per acre
£209,993
360,688
RV
per hecta
re£
518,892
891,261
Dev p
rofit
£336,348
379,698
Tota
l costs
£1,743,228
1,899,152
profit as % of costs
19.29%
19.99%

Taunton & South Somerset Af fordable Hous ing Si te Viab i l i ty Study
Page 126
SITE 7A CASH FLOW AFFORDABLE
Year
1Y
ear
2Y
ear
3Y
ear
4
rate
Q1
Q2
Q3
Q4
Q1
Q2
Q3
Q4
Q1
Q2
Q3
Q4
Q1
Q2
Q3
Q4
TO
TA
LS
INCOME
Housing sales
Mark
et h
ousin
g0
00
00
0352
528
528
528
00
00
00
1,9
36
Afford
able
soc r
ent
00
00
00
13
20
20
20
00
00
00
73
Aff s
h o
ship
00
00
00
13
19
19
19
00
00
00
69 0
Sa
les fees
00
00
00
-13
-19
-19
-19
00
00
00
-69
Total income
00
00
00
378
567
567
567
00
00
00
2,079
COSTS
Land
La
nd a
cquis
itio
n171
171
Sta
mp
du
ty2
2
Pu
rch
ase fees
55
Total
178
Build costs
Mark
et h
ousin
g0
00
0157
235
235
235
00
00
00
00
861
Afford
able
soc r
ent
00
00
17
25
25
25
00
00
00
00
91
Aff s
h o
ship
00
00
11
17
17
17
00
00
00
00
61
Bu
ild c
on
ting
ency
2.5
%0
00
05
77
70
00
00
00
025
Total
1,038
Dev costs
Upfr
ont
6.0
%16
16
16
16
62
Bu
ild r
ela
ted
6.0
%0
011
17
17
17
00
00
00
00
62
Ab
norm
als
0%
00
0
Total
125
Fees
Fees o
n b
uild
costs
10
.0%
00
00
19
28
28
28
00
00
00
00
104
Fees o
n d
ev c
osts
0.0
%0
00
00
00
00
00
00
00
00
Total
104
PG
Pla
nnin
g g
ain
26
39
39
39
00
00
00
00
00
143
Total
143
Other
Pla
nnin
g£41
52
22
5
Su
rve
y£20
02
2
Mark
eting
£0
00
00
00
00
00
00
00
0
Total
7
Sales fees
b/fo
rward
fro
m a
bove
00
00
00
13
19
19
19
00
00
00
69
Total costs
197
17
54
72
264
368
324
330
19
19
00
00
00
1,663
Net profit/loss from quarter
-197
-17
-54
-72
-264
-368
54
237
548
548
00
00
00
416
Profit/loss bf from last quarter
0-2
01
-222
-281
-359
-635
-1,0
21
-985
-762
-218
336
336
336
336
336
336
Cumulative profit/loss
-197
-218
-276
-353
-623
-1,0
02
-967
-748
-214
330
336
336
336
336
336
336
Interest
Charg
ed a
t7.5
0%
7.5
0%
7.5
0%
7.5
0%
7.5
0%
7.5
0%
7.5
0%
7.5
0%
7.5
0%
7.5
0%
7.5
0%
0.0
0%
0.0
0%
0.0
0%
0.0
0%
0.0
0%
0.0
0%
Tota
l-4
-4-5
-7-1
2-1
9-1
8-1
4-4
60
00
00
0-80
Cumulative developer profit
-201
-222
-281
-359
-635
-1,021
-985
-762
-218
336
336
336
336
336
336
336
336
carried forward to RV calc

Appendix 5 . F inanc ia l appra isa l summar ies
Page 127
SITE 7N: notional site Langport

Taunton & South Somerset Af fordable Hous ing Si te Viab i l i ty Study
Page 128
Input assumptions
Scenario & option
Afford
able
15%
= 9
% s
ocia
l re
nte
d &
6%
inte
rmedia
te
Site details
Dwellings
ave f
loo
r sp
ace
bu
ildsa
les
Site
7N notional as 7A
no
of
%g
ross
ne
tco
st
va
lue
Location
Langport
dw
gs
sq
ft
sq
ft
pe
r sq
ft
pe
r sq
ft
Are
a ha
0.3
30.6
9M
ark
et housin
g9.3
585%
1,0
90
1,0
90
84.5
0210.0
010,1
92
acre
s0.8
20.0
%
No d
wgs
11
0.0
7A
fford
able
soc rent
0.9
99.0
%1,0
90
1,0
90
84.5
068.0
01,0
79
Density d
w/h
a33.3
0.0
%
0.0
5A
ff s
h o
ship
0.6
66.0
%1,0
90
1,0
90
84.5
096.0
0719
Tota
l11.0
100%
11,9
90
11,9
90
£1,0
13,1
55
£2,2
82,6
56
11,9
90
net:
gro
ss=
10
0%
Flo
ors
pace d
ensity
=14,7
04
net sq ft per acre
£k
Contingency
10191.5
allo
wance
2.5
0%
25
0
1079.1 0
719.4
11990
Development costs
Other costs
sta
ndard
% b
uild
12.0
%125
Pla
nnin
g415
£ p
er dw
elli
ng
Surv
ey
200
£ p
er dw
elli
ng
plu
s a
bnorm
als
0.0
%0
Mark
eting
0£ p
er dw
elli
ng
Tota
l12%
Interest
Design fees
% p
er annum
7.5
0%
-101
on b
uild
costs
10.0
%104
on d
ev c
osts
0%
Notes
Planning gain
£ p
er dw
elling
13,0
00
143
South Somerset & Taunton HMAs

Appendix 5 . F inanc ia l appra isa l summar ies
Page 129
SITE 7N LAND COST & PHASING
Programme
Ye
ar
1Y
ea
r 2
Ye
ar
3Y
ea
r 4
Q1
Q2
Q3
Q4
Q1
Q2
Q3
Q4
Q1
Q2
Q3
Q4
Q1
Q2
Q3
Q4
TO
TA
LS
Units
Ma
rke
t h
ou
sin
g1.7
2.6
2.6
2.6
0.0
0.0
0.0
0.0
0.0
0.0
9.4
started
Aff
ord
ab
le s
oc r
en
t0.2
0.3
0.3
0.3
0.0
0.0
0.0
0.0
0.0
0.0
1.0
Aff
sh
osh
ip0.1
0.2
0.2
0.2
0.0
0.0
0.0
0.0
0.0
0.0
0.7
TO
TA
L0
02
33
30
00
00
011.0
Units
Ma
rke
t h
ou
sin
g0
02
33
30
00
00
00
09
'built'
+2Q
Aff
ord
ab
le s
oc r
en
t0
00
00
00
00
00
00
01
Aff
sh
osh
ip0
00
00
00
00
00
00
01
Units
Ma
rke
t h
ou
sin
g0
02
33
30
00
00
00
9
completed
+3Q
Aff
ord
ab
le s
oc r
en
t0
00
00
00
00
00
00
1
Aff
sh
osh
ip0
00
00
00
00
00
00
1
Units
Ma
rke
t h
ou
sin
g0
02
33
30
00
00
09
purchased
+4Q
Aff
ord
ab
le s
oc r
en
t0
00
00
00
00
00
01
Aff
sh
osh
ip0
00
00
00
00
00
01
Land
Iterate to achieve 20.0% profit
Afford
able
No a
fford
able
Land p
urc
hase p
rice
£304,157
445,858
RV
per acre
£373,002
546,777
RV
per hecta
re£
921,688
1,351,086
Dev p
rofit
£368,529
421,231
Tota
l costs
£1,914,877
2,097,419
profit as % of costs
19.25%
20.08%

Taunton & South Somerset Af fordable Hous ing Si te Viab i l i ty Study
Page 130
SITE 7N CASH FLOW AFFORDABLE
Year
1Y
ear
2Y
ear
3Y
ear
4
rate
Q1
Q2
Q3
Q4
Q1
Q2
Q3
Q4
Q1
Q2
Q3
Q4
Q1
Q2
Q3
Q4
TO
TA
LS
INCOME
Housing sales
Mark
et h
ousin
g0
00
00
0389
584
584
584
00
00
00
2,1
40
Afford
able
soc r
ent
00
00
00
13
20
20
20
00
00
00
73
Aff s
h o
ship
00
00
00
13
19
19
19
00
00
00
69 0
Sa
les fees
00
00
00
-14
-21
-21
-21
00
00
00
-76
Total income
00
00
00
415
623
623
623
00
00
00
2,283
COSTS
Land
La
nd a
cquis
itio
n304
304
Sta
mp
du
ty9
9
Pu
rch
ase fees
88
Total
322
Build costs
Mark
et h
ousin
g0
00
0157
235
235
235
00
00
00
00
861
Afford
able
soc r
ent
00
00
17
25
25
25
00
00
00
00
91
Aff s
h o
ship
00
00
11
17
17
17
00
00
00
00
61
Bu
ild c
on
ting
ency
2.5
%0
00
05
77
70
00
00
00
025
Total
1,038
Dev costs
Upfr
ont
6.0
%16
16
16
16
62
Bu
ild r
ela
ted
6.0
%0
011
17
17
17
00
00
00
00
62
Ab
norm
als
0%
00
0
Total
125
Fees
Fees o
n b
uild
costs
10
.0%
00
00
19
28
28
28
00
00
00
00
104
Fees o
n d
ev c
osts
0.0
%0
00
00
00
00
00
00
00
00
Total
104
PG
Pla
nnin
g g
ain
26
39
39
39
00
00
00
00
00
143
Total
143
Other
Pla
nnin
g£41
52
22
5
Su
rve
y£20
02
2
Mark
eting
£0
00
00
00
00
00
00
00
0
Total
7
Sales fees
b/fo
rward
fro
m a
bove
00
00
00
14
21
21
21
00
00
00
76
Total costs
341
17
54
72
264
368
325
332
21
21
00
00
00
1,814
Net profit/loss from quarter
-341
-17
-54
-72
-264
-368
90
290
602
602
00
00
00
468
Profit/loss bf from last quarter
0-3
47
-371
-433
-514
-793
-1,1
82
-1,1
13
-838
-240
369
369
369
369
369
369
Cumulative profit/loss
-341
-364
-426
-505
-778
-1,1
60
-1,0
92
-822
-236
362
369
369
369
369
369
369
Interest
Charg
ed a
t7.5
0%
7.5
0%
7.5
0%
7.5
0%
7.5
0%
7.5
0%
7.5
0%
7.5
0%
7.5
0%
7.5
0%
7.5
0%
0.0
0%
0.0
0%
0.0
0%
0.0
0%
0.0
0%
0.0
0%
Tota
l-6
-7-8
-9-1
5-2
2-2
0-1
5-4
70
00
00
0-101
Cumulative developer profit
-347
-371
-433
-514
-793
-1,182
-1,113
-838
-240
369
369
369
369
369
369
369
368
carried forward to RV calc

Appendix 5 . F inanc ia l appra isa l summar ies
Page 131
SITE 8A: Opposite rail station Bridgwater

Taunton & South Somerset Af fordable Hous ing Si te Viab i l i ty Study
Page 132
Input assumptions
Scenario & option
Afford
able
15%
= 9
% s
ocia
l re
nte
d &
6%
inte
rmedia
te
Site details
Dwellings
ave f
loo
r sp
ace
bu
ildsa
les
Site
8A opp rail station
no
of
%g
ross
ne
tco
st
va
lue
Location
Bridgwater
dw
gs
sq
ft
sq
ft
pe
r sq
ft
pe
r sq
ft
Are
a ha
0.1
40.2
9M
ark
et housin
g8.5
085%
759
759
89.5
0195.0
06,4
52
acre
s0.3
50.0
%
No d
wgs
10
0.0
3A
fford
able
soc rent
0.9
09.0
%759
759
89.5
066.0
0683
Density d
w/h
a71.4
0.0
%
0.0
2A
ff s
h o
ship
0.6
06.0
%759
759
89.5
096.0
0455
Tota
l10.0
100%
7,5
90
7,5
90
£679,3
05
£1,3
46,8
46
7,5
90
net:
gro
ss=
10
0%
Flo
ors
pace d
ensity
=21,9
40
net sq ft per acre
£k
Contingency
6451.5
allo
wance
3.7
5%
25
0
683.1 0
455.4
7590
Development costs
Other costs
sta
ndard
% b
uild
10.0
%70
Pla
nnin
g415
£ p
er dw
elli
ng
Surv
ey
350
£ p
er dw
elli
ng
plu
s a
bnorm
als
0.0
%0
Mark
eting
0£ p
er dw
elli
ng
Tota
l10%
Interest
Design fees
% p
er annum
7.5
0%
-47
on b
uild
costs
10.0
%70
on d
ev c
osts
0%
Notes
Planning gain
£ p
er dw
elling
13,0
00
130
South Somerset & Taunton HMAs

Appendix 5 . F inanc ia l appra isa l summar ies
Page 133
SITE 8A LAND COST & PHASING
Programme
Ye
ar
1Y
ea
r 2
Ye
ar
3Y
ea
r 4
Q1
Q2
Q3
Q4
Q1
Q2
Q3
Q4
Q1
Q2
Q3
Q4
Q1
Q2
Q3
Q4
TO
TA
LS
Units
Ma
rke
t h
ou
sin
g0.9
2.6
2.6
2.6
0.0
0.0
0.0
0.0
0.0
0.0
8.5
started
Aff
ord
ab
le s
oc r
en
t0.1
0.3
0.3
0.3
0.0
0.0
0.0
0.0
0.0
0.0
0.9
Aff
sh
osh
ip0.1
0.2
0.2
0.2
0.0
0.0
0.0
0.0
0.0
0.0
0.6
TO
TA
L0
01
33
30
00
00
010.0
Units
Ma
rke
t h
ou
sin
g0
01
33
30
00
00
00
09
'built'
+2Q
Aff
ord
ab
le s
oc r
en
t0
00
00
00
00
00
00
01
Aff
sh
osh
ip0
00
00
00
00
00
00
01
Units
Ma
rke
t h
ou
sin
g0
01
33
30
00
00
00
9
completed
+3Q
Aff
ord
ab
le s
oc r
en
t0
00
00
00
00
00
00
1
Aff
sh
osh
ip0
00
00
00
00
00
00
1
Units
Ma
rke
t h
ou
sin
g0
01
33
30
00
00
09
purchased
+4Q
Aff
ord
ab
le s
oc r
en
t0
00
00
00
00
00
01
Aff
sh
osh
ip0
00
00
00
00
00
01
Land
Iterate to achieve 20.0% profit
Afford
able
No a
fford
able
Land p
urc
hase p
rice
£53,413
135,791
RV
per acre
£154,401
392,528
RV
per hecta
re£
381,525
969,936
Dev p
rofit
£217,286
246,743
Tota
l costs
£1,130,310
1,234,057
profit as % of costs
19.22%
19.99%

Taunton & South Somerset Af fordable Hous ing Si te Viab i l i ty Study
Page 134
SITE 8A CASH FLOW AFFORDABLE
Year
1Y
ear
2Y
ear
3Y
ear
4
rate
Q1
Q2
Q3
Q4
Q1
Q2
Q3
Q4
Q1
Q2
Q3
Q4
Q1
Q2
Q3
Q4
TO
TA
LS
INCOME
Housing sales
Mark
et h
ousin
g0
00
00
0126
377
377
377
00
00
00
1,2
58
Afford
able
soc r
ent
00
00
00
514
14
14
00
00
00
45
Aff s
h o
ship
00
00
00
413
13
13
00
00
00
44 0
Sa
les fees
00
00
00
-4-1
3-1
3-1
30
00
00
0-4
5
Total income
00
00
00
135
404
404
404
00
00
00
1,347
COSTS
Land
La
nd a
cquis
itio
n53
53
Sta
mp
du
ty0
0
Pu
rch
ase fees
11
Total
55
Build costs
Mark
et h
ousin
g0
00
058
173
173
173
00
00
00
00
577
Afford
able
soc r
ent
00
00
618
18
18
00
00
00
00
61
Aff s
h o
ship
00
00
412
12
12
00
00
00
00
41
Bu
ild c
on
ting
ency
3.8
%0
00
03
88
80
00
00
00
025
Total
705
Dev costs
Upfr
ont
5.0
%9
99
935
Bu
ild r
ela
ted
5.0
%0
04
11
11
11
00
00
00
00
35
Ab
norm
als
0%
00
0
Total
70
Fees
Fees o
n b
uild
costs
10
.0%
00
00
721
21
21
00
00
00
00
70
Fees o
n d
ev c
osts
0.0
%0
00
00
00
00
00
00
00
00
Total
70
PG
Pla
nnin
g g
ain
13
39
39
39
00
00
00
00
00
130
Total
130
Other
Pla
nnin
g£41
51
11
4
Su
rve
y£35
04
4
Mark
eting
£0
00
00
00
00
00
00
00
0
Total
8
Sales fees
b/fo
rward
fro
m a
bove
00
00
00
413
13
13
00
00
00
45
Total costs
69
10
27
58
127
282
237
246
13
13
00
00
00
1,083
Net profit/loss from quarter
-69
-10
-27
-58
-127
-282
-102
158
391
391
00
00
00
264
Profit/loss bf from last quarter
0-7
0-8
1-1
10
-172
-304
-597
-713
-565
-177
217
217
217
217
217
217
Cumulative profit/loss
-69
-80
-108
-168
-299
-586
-700
-555
-174
213
217
217
217
217
217
217
Interest
Charg
ed a
t7.5
0%
7.5
0%
7.5
0%
7.5
0%
7.5
0%
7.5
0%
7.5
0%
7.5
0%
7.5
0%
7.5
0%
7.5
0%
0.0
0%
0.0
0%
0.0
0%
0.0
0%
0.0
0%
0.0
0%
Tota
l-1
-1-2
-3-6
-11
-13
-10
-34
00
00
00
-47
Cumulative developer profit
-70
-81
-110
-172
-304
-597
-713
-565
-177
217
217
217
217
217
217
217
217
carried forward to RV calc

Appendix 5 . F inanc ia l appra isa l summar ies
Page 135
SITE 8N notional site Yeovil

Taunton & South Somerset Af fordable Hous ing Si te Viab i l i ty Study
Page 136
Input assumptions
Scenario & option
Afford
able
15%
= 9
% s
ocia
l re
nte
d &
6%
inte
rmedia
te
Site details
Dwellings
ave f
loo
r sp
ace
bu
ildsa
les
Site
8N notional as 8A
no
of
%g
ross
ne
tco
st
va
lue
Location
Yeovil
dw
gs
sq
ft
sq
ft
pe
r sq
ft
pe
r sq
ft
Are
a ha
0.1
40.2
9M
ark
et housin
g8.5
085%
759
759
89.5
0185.0
06,4
52
acre
s0.3
50.0
%
No d
wgs
10
0.0
3A
fford
able
soc rent
0.8
08.0
%759
759
89.5
068.0
0607
Density d
w/h
a71.4
0.0
%
0.0
2A
ff s
h o
ship
0.7
07.0
%759
759
89.5
096.0
0531
Tota
l10.0
100%
7,5
90
7,5
90
£679,3
05
£1,2
85,8
22
7,5
90
net:
gro
ss=
10
0%
Flo
ors
pace d
ensity
=21,9
40
net sq ft per acre
£k
Contingency
6451.5
allo
wance
3.7
5%
25
0
607.2 0
531.3
7590
Development costs
Other costs
sta
ndard
% b
uild
10.0
%70
Pla
nnin
g415
£ p
er dw
elli
ng
Surv
ey
350
£ p
er dw
elli
ng
plu
s a
bnorm
als
0.0
%0
Mark
eting
0£ p
er dw
elli
ng
Tota
l10%
Interest
Design fees
% p
er annum
7.5
0%
-41
on b
uild
costs
10.0
%70
on d
ev c
osts
0%
Notes
Planning gain
£ p
er dw
elling
13,0
00
130
South Somerset & Taunton HMAs

Appendix 5 . F inanc ia l appra isa l summar ies
Page 137
SITE 8N LAND COST & PHASING
Programme
Ye
ar
1Y
ea
r 2
Ye
ar
3Y
ea
r 4
Q1
Q2
Q3
Q4
Q1
Q2
Q3
Q4
Q1
Q2
Q3
Q4
Q1
Q2
Q3
Q4
TO
TA
LS
Units
Ma
rke
t h
ou
sin
g0.9
2.6
2.6
2.6
0.0
0.0
0.0
0.0
0.0
0.0
8.5
started
Aff
ord
ab
le s
oc r
en
t0.1
0.2
0.2
0.2
0.0
0.0
0.0
0.0
0.0
0.0
0.8
Aff
sh
osh
ip0.1
0.2
0.2
0.2
0.0
0.0
0.0
0.0
0.0
0.0
0.7
TO
TA
L0
01
33
30
00
00
010.0
Units
Ma
rke
t h
ou
sin
g0
01
33
30
00
00
00
09
'built'
+2Q
Aff
ord
ab
le s
oc r
en
t0
00
00
00
00
00
00
01
Aff
sh
osh
ip0
00
00
00
00
00
00
01
Units
Ma
rke
t h
ou
sin
g0
01
33
30
00
00
00
9
completed
+3Q
Aff
ord
ab
le s
oc r
en
t0
00
00
00
00
00
00
1
Aff
sh
osh
ip0
00
00
00
00
00
00
1
Units
Ma
rke
t h
ou
sin
g0
01
33
30
00
00
09
purchased
+4Q
Aff
ord
ab
le s
oc r
en
t0
00
00
00
00
00
01
Aff
sh
osh
ip0
00
00
00
00
00
01
Land
Iterate to achieve 20.0% profit
Afford
able
No a
fford
able
Land p
urc
hase p
rice
£10,991
84,350
RV
per acre
£31,772
243,828
RV
per hecta
re£
78,509
602,500
Dev p
rofit
£208,490
234,077
Tota
l costs
£1,078,082
1,170,823
profit as % of costs
19.34%
19.99%

Taunton & South Somerset Af fordable Hous ing Si te Viab i l i ty Study
Page 138
SITE 8N CASH FLOW AFFORDABLE
Year
1Y
ear
2Y
ear
3Y
ear
4
rate
Q1
Q2
Q3
Q4
Q1
Q2
Q3
Q4
Q1
Q2
Q3
Q4
Q1
Q2
Q3
Q4
TO
TA
LS
INCOME
Housing sales
Mark
et h
ousin
g0
00
00
0119
358
358
358
00
00
00
1,1
94
Afford
able
soc r
ent
00
00
00
412
12
12
00
00
00
41
Aff s
h o
ship
00
00
00
515
15
15
00
00
00
51 0
Sa
les fees
00
00
00
-4-1
3-1
3-1
30
00
00
0-4
2
Total income
00
00
00
129
386
386
386
00
00
00
1,286
COSTS
Land
La
nd a
cquis
itio
n11
11
Sta
mp
du
ty0
0
Pu
rch
ase fees
00
Total
11
Build costs
Mark
et h
ousin
g0
00
058
173
173
173
00
00
00
00
577
Afford
able
soc r
ent
00
00
516
16
16
00
00
00
00
54
Aff s
h o
ship
00
00
514
14
14
00
00
00
00
48
Bu
ild c
on
ting
ency
3.8
%0
00
03
88
80
00
00
00
025
Total
705
Dev costs
Upfr
ont
5.0
%9
99
935
Bu
ild r
ela
ted
5.0
%0
04
11
11
11
00
00
00
00
35
Ab
norm
als
0%
00
0
Total
70
Fees
Fees o
n b
uild
costs
10
.0%
00
00
721
21
21
00
00
00
00
70
Fees o
n d
ev c
osts
0.0
%0
00
00
00
00
00
00
00
00
Total
70
PG
Pla
nnin
g g
ain
13
39
39
39
00
00
00
00
00
130
Total
130
Other
Pla
nnin
g£41
51
11
4
Su
rve
y£35
04
4
Mark
eting
£0
00
00
00
00
00
00
00
0
Total
8
Sales fees
b/fo
rward
fro
m a
bove
00
00
00
413
13
13
00
00
00
42
Total costs
25
10
27
58
127
282
237
245
13
13
00
00
00
1,037
Net profit/loss from quarter
-25
-10
-27
-58
-127
-282
-108
140
373
373
00
00
00
249
Profit/loss bf from last quarter
0-2
5-3
6-6
4-1
25
-256
-548
-669
-538
-168
208
208
208
208
208
208
Cumulative profit/loss
-25
-36
-63
-122
-252
-538
-657
-529
-165
205
208
208
208
208
208
208
Interest
Charg
ed a
t7.5
0%
7.5
0%
7.5
0%
7.5
0%
7.5
0%
7.5
0%
7.5
0%
7.5
0%
7.5
0%
7.5
0%
7.5
0%
0.0
0%
0.0
0%
0.0
0%
0.0
0%
0.0
0%
0.0
0%
Tota
l0
-1-1
-2-5
-10
-12
-10
-34
00
00
00
-41
Cumulative developer profit
-25
-36
-64
-125
-256
-548
-669
-538
-168
208
208
208
208
208
208
208
208
carried forward to RV calc

Appendix 5 . F inanc ia l appra isa l summar ies
Page 139
SITE 9A: Ilchester Rd Yeovil

Taunton & South Somerset Af fordable Hous ing Si te Viab i l i ty Study
Page 140
Input assumptions
Scenario & option
Afford
able
15%
= 9
% s
ocia
l re
nte
d &
6%
inte
rmedia
te
Site details
Dwellings
ave f
loo
r sp
ace
bu
ildsa
les
Site
9A Ilchester Rd
no
of
%g
ross
ne
tco
st
va
lue
Location
Yeovil
dw
gs
sq
ft
sq
ft
pe
r sq
ft
pe
r sq
ft
Are
a ha
0.1
00.2
1M
ark
et housin
g1.7
085%
1,5
66
1,5
66
97.5
0240.0
02,6
62
acre
s0.2
50.0
%
No d
wgs
20.0
2A
fford
able
soc rent
0.1
89.0
%1,5
66
1,5
66
97.5
068.0
0282
Density d
w/h
a20.0
0.0
%
0.0
1A
ff s
h o
ship
0.1
26.0
%1,5
66
1,5
66
97.5
096.0
0188
Tota
l2.0
100%
3,1
32
3,1
32
£305,3
70
£676,1
36
3,1
32
net:
gro
ss=
10
0%
Flo
ors
pace d
ensity
=12,6
75
net sq ft per acre
£k
Contingency
2662.2
allo
wance
2.5
0%
80
281.8
8 0
187.9
2
3132
Development costs
Other costs
sta
ndard
% b
uild
10.0
%31
Pla
nnin
g415
£ p
er dw
elli
ng
Surv
ey
200
£ p
er dw
elli
ng
plu
s a
bnorm
als
0.0
%0
Mark
eting
0£ p
er dw
elli
ng
Tota
l10%
Interest
Design fees
% p
er annum
7.5
0%
-29
on b
uild
costs
10.0
%31
on d
ev c
osts
0%
Notes
Planning gain
£ p
er dw
elling
13,0
00
26
South Somerset & Taunton HMAs

Appendix 5 . F inanc ia l appra isa l summar ies
Page 141
SITE 9A LAND COST & PHASING
Programme
Ye
ar
1Y
ea
r 2
Ye
ar
3Y
ea
r 4
Q1
Q2
Q3
Q4
Q1
Q2
Q3
Q4
Q1
Q2
Q3
Q4
Q1
Q2
Q3
Q4
TO
TA
LS
Units
Ma
rke
t h
ou
sin
g1.7
0.0
0.0
0.0
0.0
0.0
0.0
0.0
0.0
0.0
1.7
started
Aff
ord
ab
le s
oc r
en
t0.2
0.0
0.0
0.0
0.0
0.0
0.0
0.0
0.0
0.0
0.2
Aff
sh
osh
ip0.1
0.0
0.0
0.0
0.0
0.0
0.0
0.0
0.0
0.0
0.1
TO
TA
L0
02
00
00
00
00
02.0
Units
Ma
rke
t h
ou
sin
g0
02
00
00
00
00
00
02
'built'
+2Q
Aff
ord
ab
le s
oc r
en
t0
00
00
00
00
00
00
00
Aff
sh
osh
ip0
00
00
00
00
00
00
00
Units
Ma
rke
t h
ou
sin
g0
02
00
00
00
00
00
2
completed
+3Q
Aff
ord
ab
le s
oc r
en
t0
00
00
00
00
00
00
0
Aff
sh
osh
ip0
00
00
00
00
00
00
0
Units
Ma
rke
t h
ou
sin
g0
02
00
00
00
00
02
purchased
+4Q
Aff
ord
ab
le s
oc r
en
t0
00
00
00
00
00
00
Aff
sh
osh
ip0
00
00
00
00
00
00
Land
Iterate to achieve 20.0% profit
Afford
able
No a
fford
able
Land p
urc
hase p
rice
£108,756
157,174
RV
per acre
£440,130
636,076
RV
per hecta
re£
1,087,561
1,571,743
Dev p
rofit
£109,340
125,352
Tota
l costs
£567,321
626,853
profit as % of costs
19.27%
20.00%

Taunton & South Somerset Af fordable Hous ing Si te Viab i l i ty Study
Page 142
SITE 9A CASH FLOW AFFORDABLE
Year
1Y
ear
2Y
ear
3Y
ear
4
rate
Q1
Q2
Q3
Q4
Q1
Q2
Q3
Q4
Q1
Q2
Q3
Q4
Q1
Q2
Q3
Q4
TO
TA
LS
INCOME
Housing sales
Mark
et h
ousin
g0
00
00
0639
00
00
00
00
0639
Afford
able
soc r
ent
00
00
00
19
00
00
00
00
019
Aff s
h o
ship
00
00
00
18
00
00
00
00
018 0
Sa
les fees
00
00
00
-23
00
00
00
00
0-2
3
Total income
00
00
00
676
00
00
00
00
0676
COSTS
Land
La
nd a
cquis
itio
n109
109
Sta
mp
du
ty1
1
Pu
rch
ase fees
33
Total
113
Build costs
Mark
et h
ousin
g0
00
0260
00
00
00
00
00
0260
Afford
able
soc r
ent
00
00
27
00
00
00
00
00
027
Aff s
h o
ship
00
00
18
00
00
00
00
00
018
Bu
ild c
on
ting
ency
2.5
%0
00
08
00
00
00
00
00
08
Total
313
Dev costs
Upfr
ont
5.0
%4
44
416
Bu
ild r
ela
ted
5.0
%0
016
00
00
00
00
00
016
Ab
norm
als
0%
00
0
Total
31
Fees
Fees o
n b
uild
costs
10
.0%
00
00
31
00
00
00
00
00
031
Fees o
n d
ev c
osts
0.0
%0
00
00
00
00
00
00
00
00
Total
31
PG
Pla
nnin
g g
ain
26
00
00
00
00
00
00
026
Total
26
Other
Pla
nnin
g£41
50
00
1
Su
rve
y£20
00
0
Mark
eting
£0
00
00
00
00
00
00
00
0
Total
1
Sales fees
b/fo
rward
fro
m a
bove
00
00
00
23
00
00
00
00
023
Total costs
117
446
4344
023
00
00
00
00
0538
Net profit/loss from quarter
-117
-4-46
-4-344
0653
00
00
00
00
0138
Profit/loss bf from last quarter
0-1
20
-126
-175
-182
-536
-546
109
109
109
109
109
109
109
109
109
Cumulative profit/loss
-117
-124
-172
-179
-526
-536
107
109
109
109
109
109
109
109
109
109
Interest
Charg
ed a
t7.5
0%
7.5
0%
7.5
0%
7.5
0%
7.5
0%
7.5
0%
7.5
0%
7.5
0%
0.0
0%
0.0
0%
0.0
0%
0.0
0%
0.0
0%
0.0
0%
0.0
0%
0.0
0%
0.0
0%
Tota
l-2
-2-3
-3-1
0-1
02
00
00
00
00
0-29
Cumulative developer profit
-120
-126
-175
-182
-536
-546
109
109
109
109
109
109
109
109
109
109
109
carried forward to RV calc

Appendix 5 . F inanc ia l appra isa l summar ies
Page 143
SITE 9B: Pittacre House Bridgwater

Taunton & South Somerset Af fordable Hous ing Si te Viab i l i ty Study
Page 144
Input assumptions
Scenario & option
Afford
able
15%
= 9
% s
ocia
l re
nte
d &
6%
inte
rmedia
te
Site details
Dwellings
ave f
loo
r sp
ace
bu
ildsa
les
Site
9B Pittacre House
no
of
%g
ross
ne
tco
st
va
lue
Location
Yeovil
dw
gs
sq
ft
sq
ft
pe
r sq
ft
pe
r sq
ft
Are
a ha
0.0
40.0
8M
ark
et housin
g1.7
085%
732
732
97.5
0185.0
01,2
44
acre
s0.1
00.0
%
No d
wgs
20.0
1A
fford
able
soc rent
0.1
89.0
%732
732
97.5
066.0
0132
Density d
w/h
a50.0
0.0
%
0.0
1A
ff s
h o
ship
0.1
26.0
%732
732
97.5
096.0
088
Tota
l2.0
100%
1,4
64
1,4
64
£142,7
40
£247,3
43
1,4
64
net:
gro
ss=
10
0%
Flo
ors
pace d
ensity
=14,8
12
net sq ft per acre
£k
Contingency
1244.4
allo
wance
2.5
0%
40
131.7
6 0
87.8
4
1464
Development costs
Other costs
sta
ndard
% b
uild
10.0
%15
Pla
nnin
g415
£ p
er dw
elli
ng
Surv
ey
200
£ p
er dw
elli
ng
plu
s a
bnorm
als
0.0
%0
Mark
eting
0£ p
er dw
elli
ng
Tota
l10%
Interest
Design fees
% p
er annum
7.5
0%
-7
on b
uild
costs
10.0
%15
on d
ev c
osts
0%
Notes
Planning gain
£ p
er dw
elling
13,0
00
26
South Somerset & Taunton HMAs

Appendix 5 . F inanc ia l appra isa l summar ies
Page 145
SITE 9B LAND COST & PHASING
Programme
Ye
ar
1Y
ea
r 2
Ye
ar
3Y
ea
r 4
Q1
Q2
Q3
Q4
Q1
Q2
Q3
Q4
Q1
Q2
Q3
Q4
Q1
Q2
Q3
Q4
TO
TA
LS
Units
Ma
rke
t h
ou
sin
g1.7
0.0
0.0
0.0
0.0
0.0
0.0
0.0
0.0
0.0
1.7
started
Aff
ord
ab
le s
oc r
en
t0.2
0.0
0.0
0.0
0.0
0.0
0.0
0.0
0.0
0.0
0.2
Aff
sh
osh
ip0.1
0.0
0.0
0.0
0.0
0.0
0.0
0.0
0.0
0.0
0.1
TO
TA
L0
02
00
00
00
00
02.0
Units
Ma
rke
t h
ou
sin
g0
02
00
00
00
00
00
02
'built'
+2Q
Aff
ord
ab
le s
oc r
en
t0
00
00
00
00
00
00
00
Aff
sh
osh
ip0
00
00
00
00
00
00
00
Units
Ma
rke
t h
ou
sin
g0
02
00
00
00
00
00
2
completed
+3Q
Aff
ord
ab
le s
oc r
en
t0
00
00
00
00
00
00
0
Aff
sh
osh
ip0
00
00
00
00
00
00
0
Units
Ma
rke
t h
ou
sin
g0
02
00
00
00
00
02
purchased
+4Q
Aff
ord
ab
le s
oc r
en
t0
00
00
00
00
00
00
Aff
sh
osh
ip0
00
00
00
00
00
00
Land
Iterate to achieve 20.0% profit
Afford
able
No a
fford
able
Land p
urc
hase p
rice
£-10,265
4,600
RV
per acre
£-103,850
46,544
RV
per hecta
re£
-256,614
115,011
Dev p
rofit
£40,000
45,225
Tota
l costs
£207,868
226,140
profit as % of costs
19.24%
20.00%

Taunton & South Somerset Af fordable Hous ing Si te Viab i l i ty Study
Page 146
SITE 9B CASH FLOW AFFORDABLE
Year
1Y
ear
2Y
ear
3Y
ear
4
rate
Q1
Q2
Q3
Q4
Q1
Q2
Q3
Q4
Q1
Q2
Q3
Q4
Q1
Q2
Q3
Q4
TO
TA
LS
INCOME
Housing sales
Mark
et h
ousin
g0
00
00
0230
00
00
00
00
0230
Afford
able
soc r
ent
00
00
00
90
00
00
00
00
9
Aff s
h o
ship
00
00
00
80
00
00
00
00
8 0
Sa
les fees
00
00
00
-80
00
00
00
00
-8
Total income
00
00
00
247
00
00
00
00
0247
COSTS
Land
La
nd a
cquis
itio
n-1
0-1
0
Sta
mp
du
ty0
0
Pu
rch
ase fees
00
Total
-11
Build costs
Mark
et h
ousin
g0
00
0121
00
00
00
00
00
0121
Afford
able
soc r
ent
00
00
13
00
00
00
00
00
013
Aff s
h o
ship
00
00
90
00
00
00
00
00
9
Bu
ild c
on
ting
ency
2.5
%0
00
04
00
00
00
00
00
04
Total
146
Dev costs
Upfr
ont
5.0
%2
22
27
Bu
ild r
ela
ted
5.0
%0
07
00
00
00
00
00
07
Ab
norm
als
0%
00
0
Total
15
Fees
Fees o
n b
uild
costs
10
.0%
00
00
15
00
00
00
00
00
015
Fees o
n d
ev c
osts
0.0
%0
00
00
00
00
00
00
00
00
Total
15
PG
Pla
nnin
g g
ain
26
00
00
00
00
00
00
026
Total
26
Other
Pla
nnin
g£41
50
00
1
Su
rve
y£20
00
0
Mark
eting
£0
00
00
00
00
00
00
00
0
Total
1
Sales fees
b/fo
rward
fro
m a
bove
00
00
00
80
00
00
00
00
8
Total costs
-82
35
2161
08
00
00
00
00
0200
Net profit/loss from quarter
8-2
-35
-2-161
0239
00
00
00
00
047
Profit/loss bf from last quarter
08
6-3
0-3
2-1
96
-200
40
40
40
40
40
40
40
40
40
Cumulative profit/loss
86
-29
-31
-193
-196
39
40
40
40
40
40
40
40
40
40
Interest
Charg
ed a
t7.5
0%
7.5
0%
7.5
0%
7.5
0%
7.5
0%
7.5
0%
7.5
0%
7.5
0%
0.0
0%
0.0
0%
0.0
0%
0.0
0%
0.0
0%
0.0
0%
0.0
0%
0.0
0%
0.0
0%
Tota
l0
0-1
-1-4
-41
00
00
00
00
0-7
Cumulative developer profit
86
-30
-32
-196
-200
40
40
40
40
40
40
40
40
40
40
39
carried forward to RV calc

Appendix 5 . F inanc ia l appra isa l summar ies
Page 147