TAU Parallel Performance System DOD UGC 2004 Tutorial Part 1: TAU Overview and Architecture.
52
TAU Parallel Performance System DOD UGC 2004 Tutorial Part 1: TAU Overview and Architecture
-
date post
21-Dec-2015 -
Category
Documents
-
view
218 -
download
1
Transcript of TAU Parallel Performance System DOD UGC 2004 Tutorial Part 1: TAU Overview and Architecture.

TAU Parallel Performance System
DOD UGC 2004 Tutorial
Part 1: TAU Overview and Architecture
TAU Parallel Performance System DOD HPCMP UGC 20042
Research Motivation
Tools for performance problem solving Empirical-based performance optimization process Performance technology concerns
characterization
PerformanceTuning
PerformanceDiagnosis
PerformanceExperimentation
PerformanceObservation
hypotheses
properties
• Instrumentation• Measurement• Analysis• Visualization
PerformanceTechnology
• Experimentmanagement
• Performancedatabase
PerformanceTechnology

TAU Parallel Performance System DOD HPCMP UGC 20043
Complex Parallel Systems
Complexity in computing system architecture Diverse parallel system architectures
shared / distributed memory, cluster, hybrid, NOW, … Sophisticated processor and memory architectures Advanced network interface and switching architecture
Complexity in parallel software environment Diverse parallel programming paradigms
shared memory multi-threading, message passing, hybrid Hierarchical, multi-level software architectures Optimizing compilers and sophisticated runtime systems Advanced numerical libraries and application frameworks

TAU Parallel Performance System DOD HPCMP UGC 20044
Complexity Challenges for Performance Tools
Computing system environment complexity Observation integration and optimization Access, accuracy, and granularity constraints Diverse/specialized observation capabilities/technology Restricted modes limit performance problem solving
Sophisticated software development environments Programming paradigms and performance models Performance data mapping to software abstractions Uniformity of performance abstraction across platforms Rich observation capabilities and flexible configuration Common performance problem solving methods
TAU Parallel Performance System DOD HPCMP UGC 20045
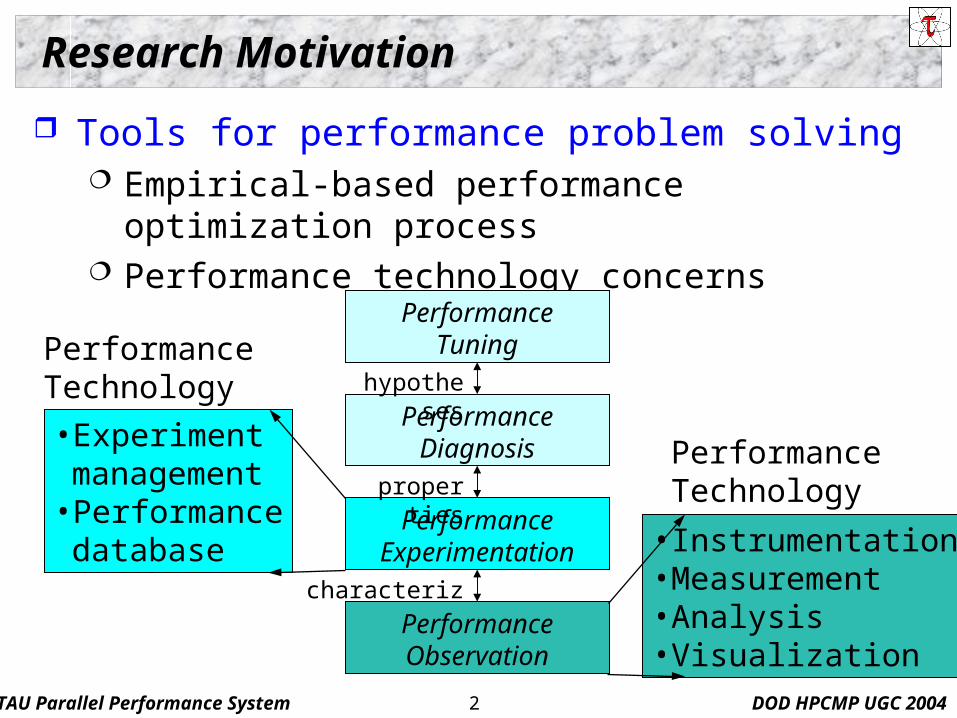
Performance Needs Performance Technology
Diverse performance observability requirements Multiple levels of software and hardware Different types and detail of performance data Alternative performance problem solving methods Multiple targets of software and system application
Demands more robust performance technology Broad scope of performance observation Flexible and configurable mechanisms Technology integration and extension Cross-platform portability Open, layered, and modular framework architecture

TAU Parallel Performance System DOD HPCMP UGC 20046
Parallel Performance Technology
Performance instrumentation tools Different program code levels Different system levels
Performance measurement (observation) tools Profiling and tracing of SW/HW performance events Different software (SW) and hardware (HW) levels
Performance analysis tools Performance data analysis and presentation Online and offline tools
Performance experimentation Performance modeling and prediction tools

TAU Parallel Performance System DOD HPCMP UGC 20047
Application Problem Domain
DOD defines leading edge parallel systems and software Large-scale systems and heterogeneous platforms Multi-model simulation Complex, multi-layered software integration Multi-language programming Mixed-model parallelism
Problem domain challenges System diversity demands tool portability Need for cross- and multi-language support Coverage of alternative parallel computation models Operate at scale

TAU Parallel Performance System DOD HPCMP UGC 20048
General Problems
How do we create robust and ubiquitous performance technology for the analysis and tuning of parallel and distributed software and systems in the presence of (evolving) complexity challenges?
How do we apply performance technology effectively for the variety and diversity of performance problems
that arise in the context of complex parallel and distributed computer systems.
TAU Parallel Performance System DOD HPCMP UGC 20049
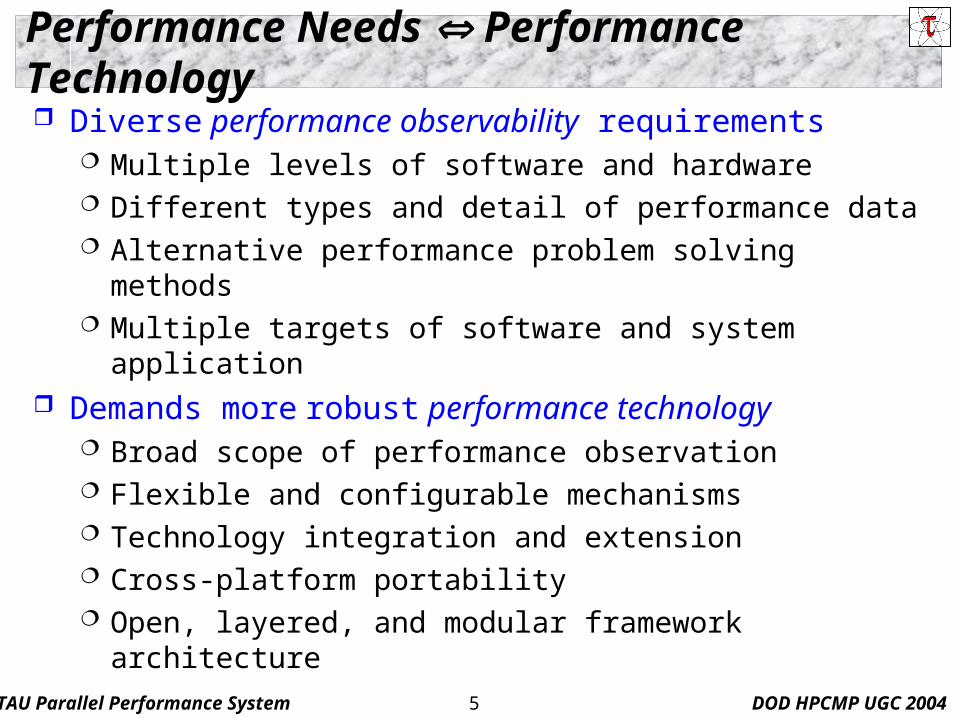
Definitions: Instrumentation
Inserting extra code (hooks) into program Source code instrumentation
Manual Automatic by compiler or source-to-source translator
Object code instrumentation “Re-writing” the executable to insert hooks
Dynamic code instrumentation Object code instrumentation while program is running
Pre-instrumented library Typically used for MPI and PVM program analysis
Passive vs. active instrumentation

TAU Parallel Performance System DOD HPCMP UGC 200410
Definitions: Measurement
Capturing performance data about system and software Triggered by events
Active and passive Obtain execution control to make measurement
Profile-based Trace-based Multiple performance data
Execution time System and hardware statistics
Runtime vs. online access

TAU Parallel Performance System DOD HPCMP UGC 200411
Definitions: Measurement – Profiling
Profiling Recording of summary information during execution
inclusive, exclusive time, # calls, hardware statistics, … Reflects performance behavior of program entities
functions, loops, basic blocks user-defined “semantic” entities
Very good for low-cost performance assessment Helps to expose performance bottlenecks and hotspots Implemented through
sampling: periodic OS interrupts or hardware counter traps instrumentation: direct insertion of measurement code
TAU Parallel Performance System DOD HPCMP UGC 200412
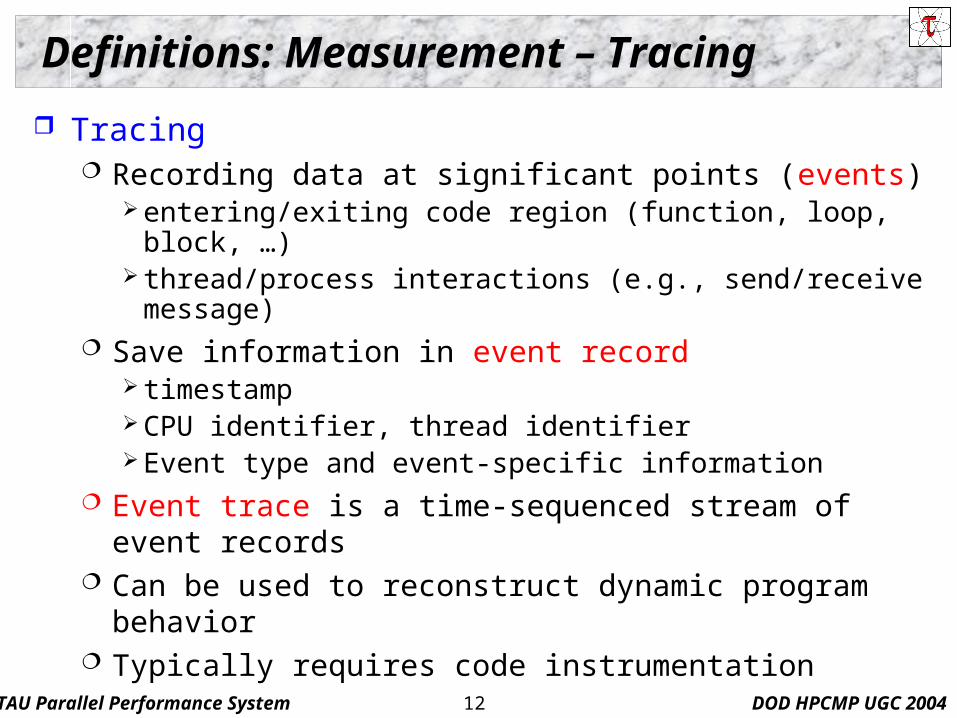
Definitions: Measurement – Tracing
Tracing Recording data at significant points (events)
entering/exiting code region (function, loop, block, …) thread/process interactions (e.g., send/receive message)
Save information in event record timestamp CPU identifier, thread identifier Event type and event-specific information
Event trace is a time-sequenced stream of event records Can be used to reconstruct dynamic program behavior Typically requires code instrumentation

TAU Parallel Performance System DOD HPCMP UGC 200413
Event Tracing: Instrumentation, Monitor, Trace
1 master
2 slave
3 ...
void slave { trace(ENTER, 2); ... recv(A, tag, buf); trace(RECV, A); ... trace(EXIT, 2);}
void master { trace(ENTER, 1); ... trace(SEND, B); send(B, tag, buf); ... trace(EXIT, 1);}
MONITOR 58 A ENTER 1
60 B ENTER 2
62 A SEND B
64 A EXIT 1
68 B RECV A
...
69 B EXIT 2
...
CPU A:
CPU B:
Event definition
timestamp
TAU Parallel Performance System DOD HPCMP UGC 200414
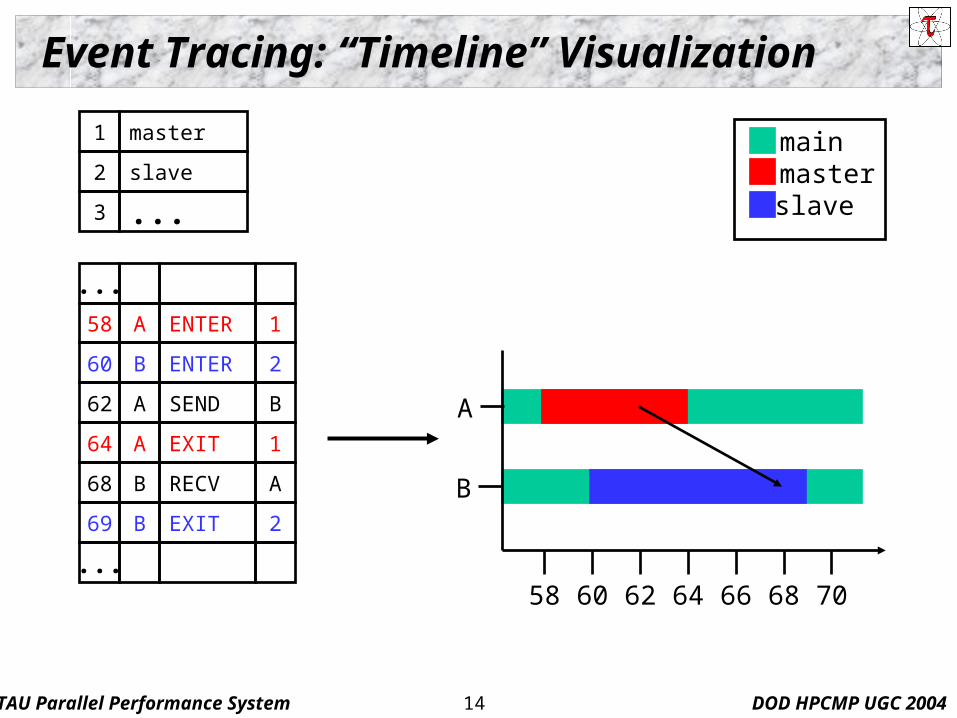
Event Tracing: “Timeline” Visualization
1 master
2 slave
3 ...
58 A ENTER 1
60 B ENTER 2
62 A SEND B
64 A EXIT 1
68 B RECV A
...
69 B EXIT 2
...
mainmasterslave
58 60 62 64 66 68 70
B
A

TAU Parallel Performance System DOD HPCMP UGC 200415
Unix Profiling Tools (prof)
Classical Unix profiling tools: prof and gprof prof
Sample-based measurement Samples program counter (PC) at timer interrupts or traps Match PC with code sections (routines) using symbol table
Keeps time histogram Assumes all time since last sample spent in routine Accumulates time per routine
Needs large enough samples to obtain statistical accuracy Requires program to be compiled for profiling
Need to produce symbol table

TAU Parallel Performance System DOD HPCMP UGC 200416
Unix Profiling Tools (gprof) Interested in seeing routine calling relationships
Callpath profiling gprof
Sample-based measurement Samples program counter (PC) at timer interrupts or traps Match PC with code sections (routines) using symbol table Looks on stack for calling PC and matches to calling routine
Keeps time histogram Assumes all time since last sample spent in routine Accumulates time per routine and caller
Needs large enough samples to obtain statistical accuracy Requires program to be compiled for profiling
TAU Parallel Performance System DOD HPCMP UGC 200417
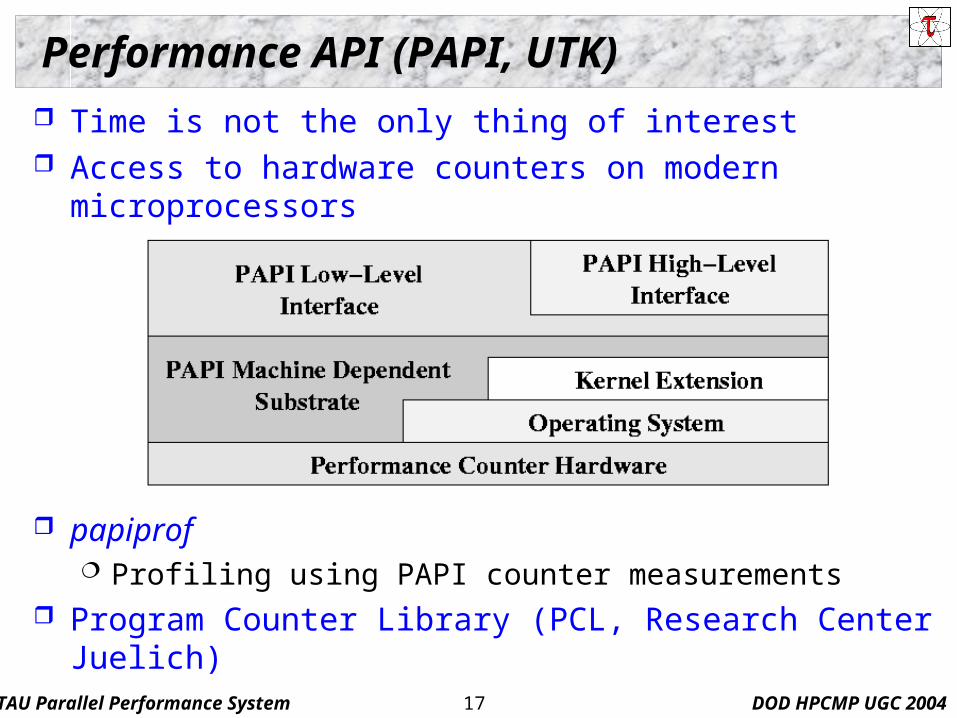
Performance API (PAPI, UTK)
Time is not the only thing of interest Access to hardware counters on modern microprocessors
papiprof Profiling using PAPI counter measurements
Program Counter Library (PCL, Research Center Juelich)
TAU Parallel Performance System DOD HPCMP UGC 200418
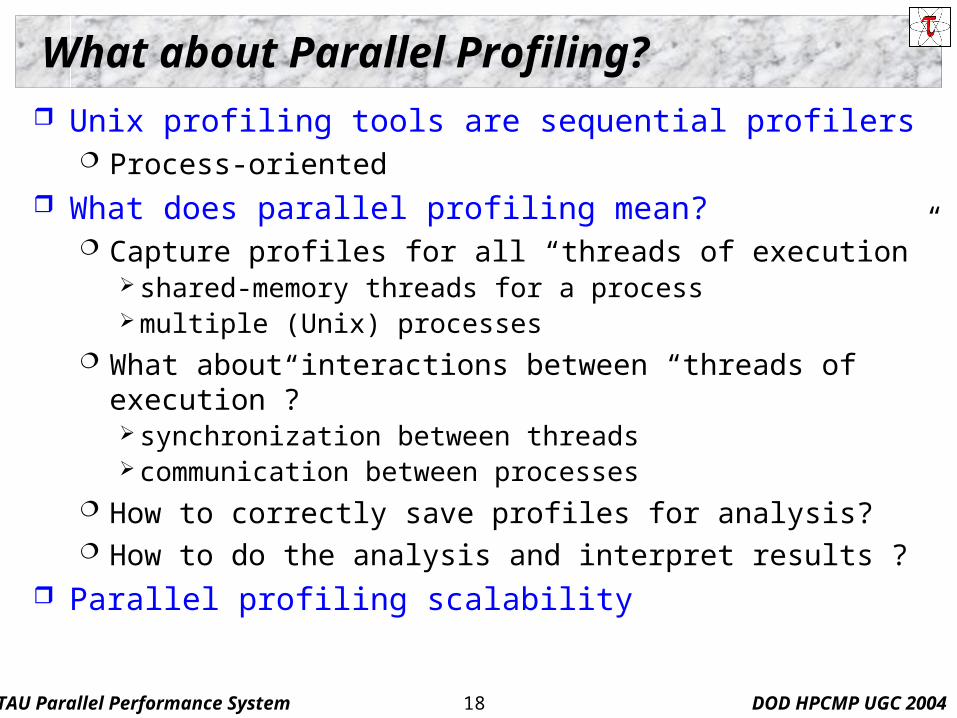
What about Parallel Profiling?
Unix profiling tools are sequential profilers Process-oriented
What does parallel profiling mean? Capture profiles for all “threads of execution”
shared-memory threads for a process multiple (Unix) processes
What about interactions between “threads of execution”? synchronization between threads communication between processes
How to correctly save profiles for analysis? How to do the analysis and interpret results ?
Parallel profiling scalability
TAU Parallel Performance System DOD HPCMP UGC 200419
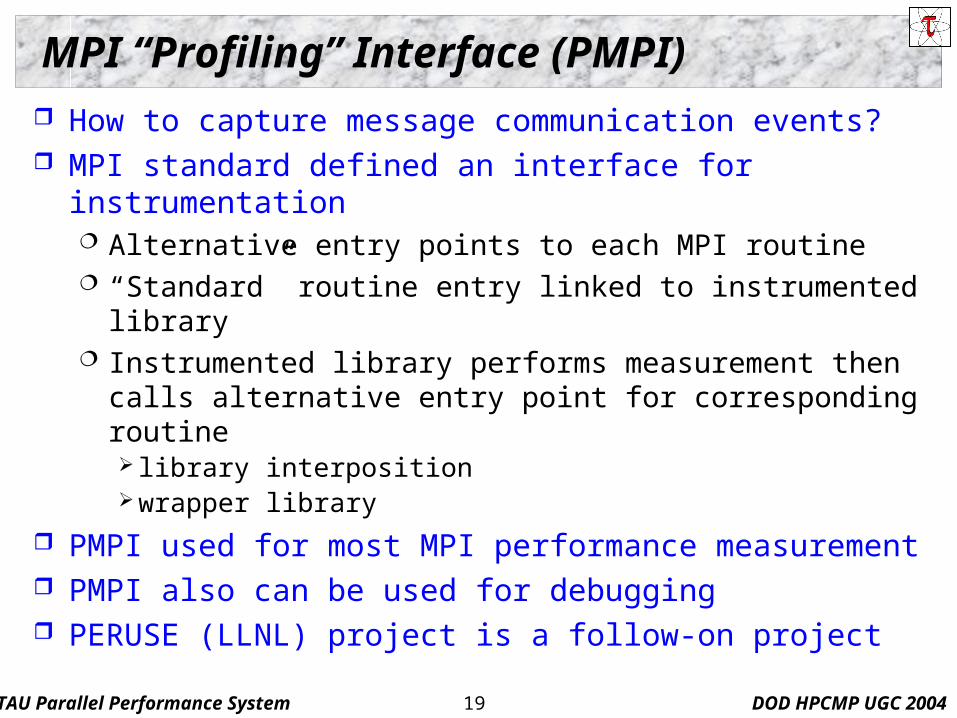
MPI “Profiling” Interface (PMPI)
How to capture message communication events? MPI standard defined an interface for instrumentation
Alternative entry points to each MPI routine “Standard” routine entry linked to instrumented library Instrumented library performs measurement then calls
alternative entry point for corresponding routine library interposition wrapper library
PMPI used for most MPI performance measurement PMPI also can be used for debugging PERUSE (LLNL) project is a follow-on project

TAU Parallel Performance System DOD HPCMP UGC 200420
Computation Model for Performance Technology
How to address dual performance technology goals? Robust capabilities + widely available methods Contend with problems of system diversity Flexible tool composition/configuration/integration
Approaches Restrict computation types / performance problems
machines, languages, instrumentation technique, … limited performance technology coverage and application
Base technology on abstract computation model general architecture and software execution features map features/methods to existing complex system types develop capabilities that can be adapted and optimized
TAU Parallel Performance System DOD HPCMP UGC 200421
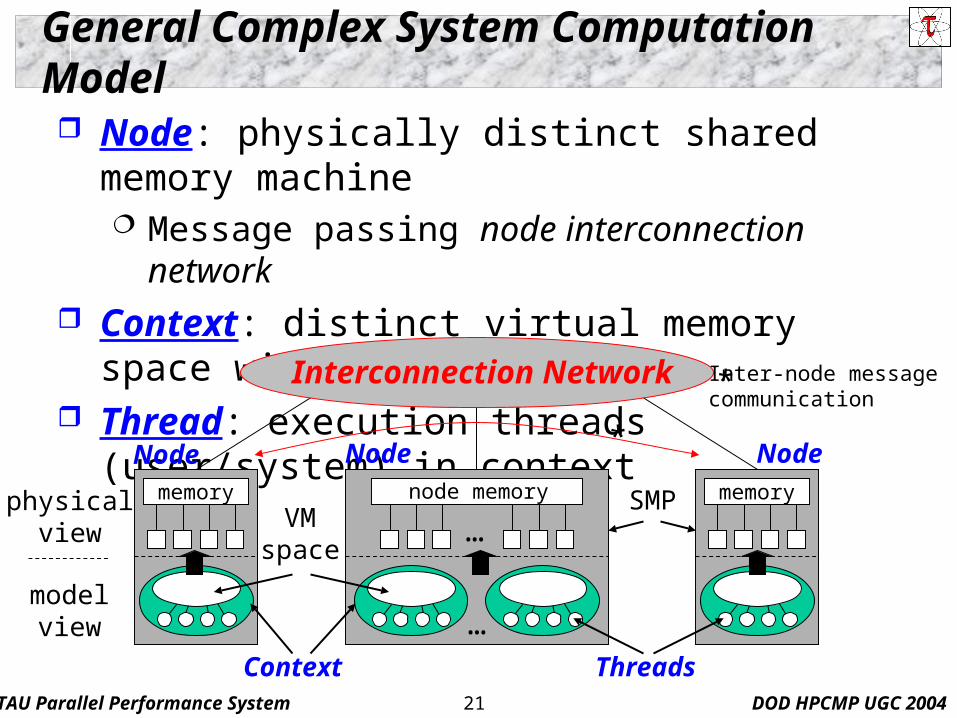
General Complex System Computation Model
Node: physically distinct shared memory machine Message passing node interconnection network
Context: distinct virtual memory space within node Thread: execution threads (user/system) in context
memory memory
Node Node Node
VMspace
Context
SMP
Threads
node memory
…
…
Interconnection Network Inter-node messagecommunication
*
*
physicalview
modelview
TAU Parallel Performance System DOD HPCMP UGC 200422
TAU Performance System
Tuning and Analysis Utilities (12+ year project effort) Performance system framework for scalable parallel and
distributed high-performance computing Targets a general complex system computation model
nodes / contexts / threads Multi-level: system / software / parallelism Measurement and analysis abstraction
Integrated toolkit for performance instrumentation, measurement, analysis, and visualization Portable performance profiling and tracing facility Open software approach with technology integration
University of Oregon , Forschungszentrum Jülich, LANL
TAU Parallel Performance System DOD HPCMP UGC 200423
TAU Performance Systems Goals
Multi-level performance instrumentation Multi-language automatic source instrumentation
Flexible and configurable performance measurement Widely-ported parallel performance profiling system
Computer system architectures and operating systems Different programming languages and compilers
Support for multiple parallel programming paradigms Multi-threading, message passing, mixed-mode, hybrid
Support for performance mapping Support for object-oriented and generic programming Integration in complex software systems and applications

TAU Parallel Performance System DOD HPCMP UGC 200424
TAU Performance System Architecture
EPILOG
Paraver

TAU Parallel Performance System DOD HPCMP UGC 200425
Definitions: Instrumentation
Instrumentation Insertion of extra code (hooks) into program Source instrumentation
done by compiler, source-to-source translator, or manually+ portable+ links back to program code– re-compile is necessary for (change in) instrumentation– requires source to be available– hard to use in standard way for mix-language programs– source-to-source translators hard to develop (e.g., C++, F90)
Object code instrumentation “re-writing” the executable to insert hooks
TAU Parallel Performance System DOD HPCMP UGC 200426
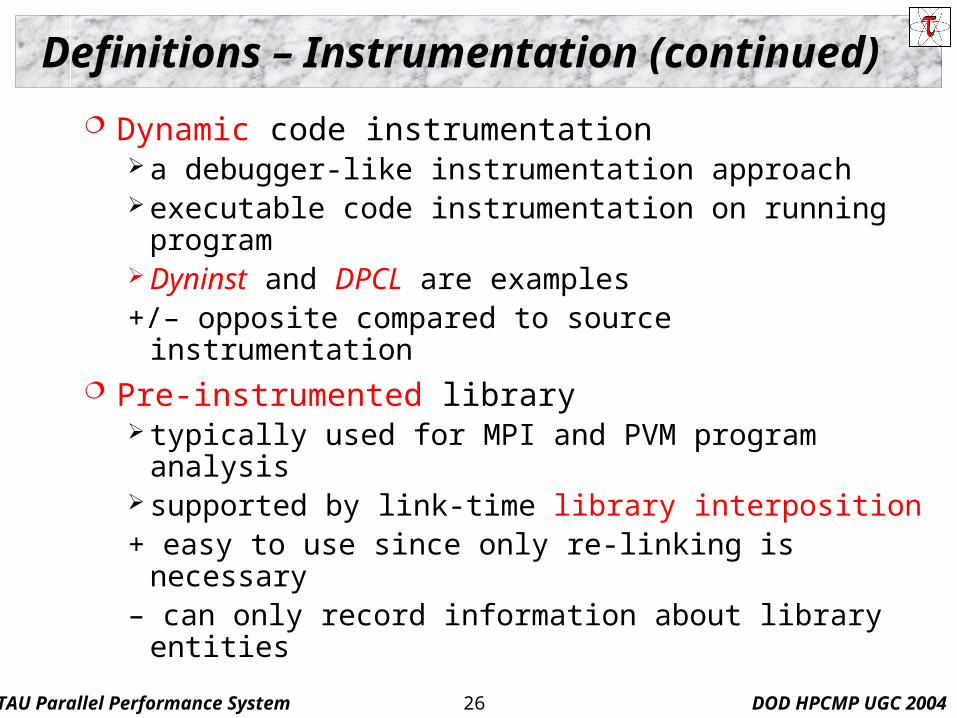
Definitions – Instrumentation (continued)
Dynamic code instrumentation a debugger-like instrumentation approach executable code instrumentation on running program Dyninst and DPCL are examples+/– opposite compared to source instrumentation
Pre-instrumented library typically used for MPI and PVM program analysis supported by link-time library interposition + easy to use since only re-linking is necessary– can only record information about library entities
TAU Parallel Performance System DOD HPCMP UGC 200427
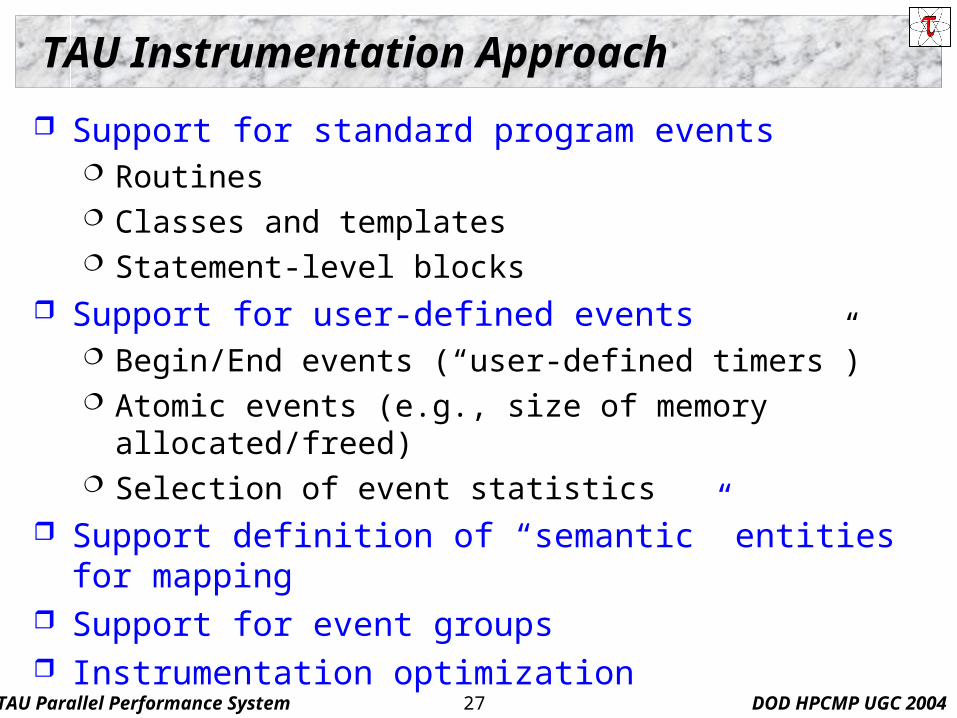
TAU Instrumentation Approach
Support for standard program events Routines Classes and templates Statement-level blocks
Support for user-defined events Begin/End events (“user-defined timers”) Atomic events (e.g., size of memory allocated/freed) Selection of event statistics
Support definition of “semantic” entities for mapping Support for event groups Instrumentation optimization
TAU Parallel Performance System DOD HPCMP UGC 200428
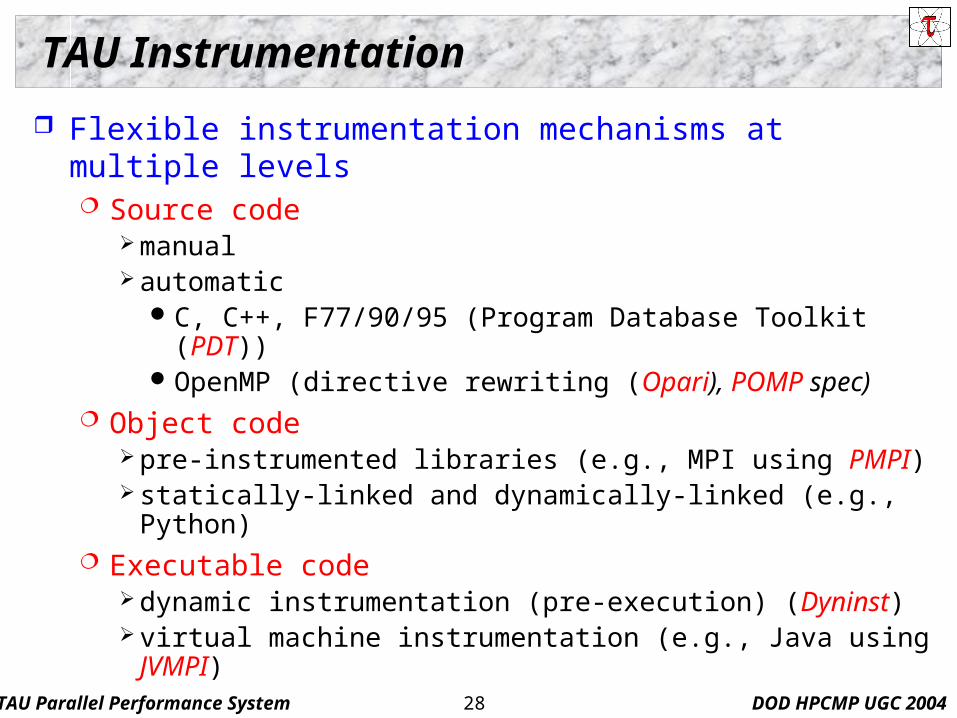
TAU Instrumentation
Flexible instrumentation mechanisms at multiple levels Source code
manual automatic
C, C++, F77/90/95 (Program Database Toolkit (PDT))OpenMP (directive rewriting (Opari), POMP spec)
Object code pre-instrumented libraries (e.g., MPI using PMPI) statically-linked and dynamically-linked (e.g., Python)
Executable code dynamic instrumentation (pre-execution) (Dyninst) virtual machine instrumentation (e.g., Java using JVMPI)

TAU Parallel Performance System DOD HPCMP UGC 200429
Multi-Level Instrumentation
Targets common measurement interface TAU API
Multiple instrumentation interfaces Simultaneously active
Information sharing between interfaces Utilizes instrumentation knowledge between levels
Selective instrumentation Available at each level Cross-level selection
Targets a common performance model Presents a unified view of execution
Consistent performance events

TAU Parallel Performance System DOD HPCMP UGC 200430
Code Transformation and Instrumentation
Program information flows through stages of compilation/linking/execution Different information is accessible at different stages Each level poses different constraints and opportunities
for extracting information
Where should performance instrumentation be done? At what level? Instrumentation at different levels Cooperative

TAU Parallel Performance System DOD HPCMP UGC 200431
Code Transformation Levels and Instrumentation
instrumentation
instrumentation
instrumentation
instrumentation
instrumentation
instrumentation
instrumentation
source code
source code
object code
executable
runtime image
Performance Data
preprocessor
compiler
linker
OS
VM
libraries
run
Instrumentation relevant tocode aspects
Captureknowledgeof coderelationships
Relate performance data to source-level view
TAU Parallel Performance System DOD HPCMP UGC 200432
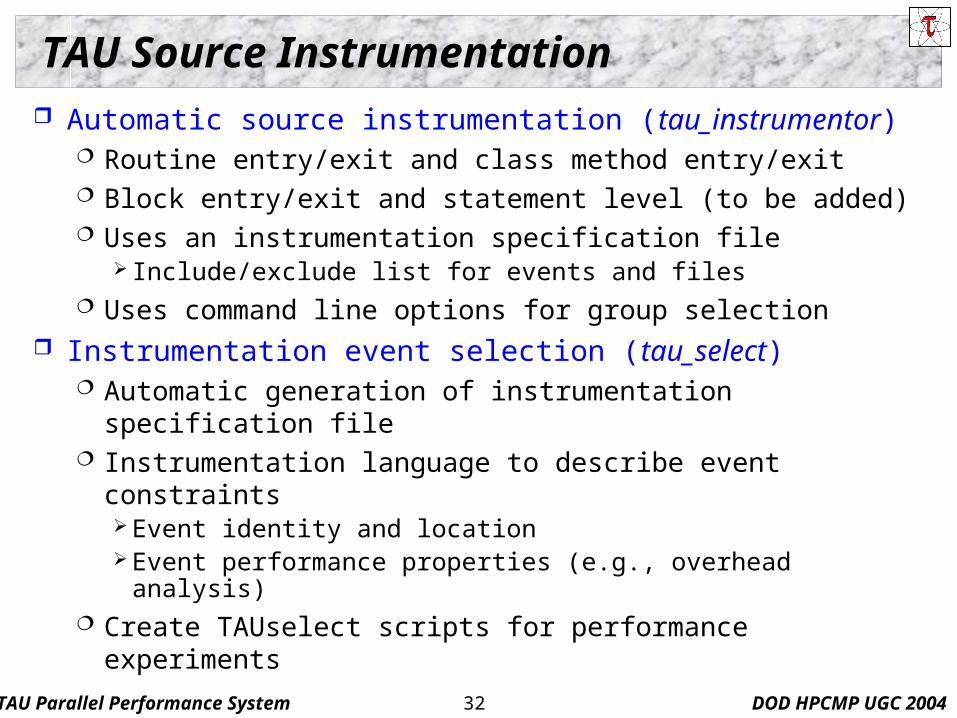
TAU Source Instrumentation
Automatic source instrumentation (tau_instrumentor) Routine entry/exit and class method entry/exit Block entry/exit and statement level (to be added) Uses an instrumentation specification file
Include/exclude list for events and files Uses command line options for group selection
Instrumentation event selection (tau_select) Automatic generation of instrumentation specification file Instrumentation language to describe event constraints
Event identity and location Event performance properties (e.g., overhead analysis)
Create TAUselect scripts for performance experiments

TAU Parallel Performance System DOD HPCMP UGC 200433
TAU Performance Measurement
TAU supports profiling and tracing measurement Robust timing and hardware performance support Support for online performance monitoring
Profile and trace performance data export to file system Selective exporting
Extension of TAU measurement for multiple counters Creation of user-defined TAU counters Access to system-level metrics
Support for callpath measurement Integration with system-level performance data
Operating system statistics (e.g., /proc file system)
TAU Parallel Performance System DOD HPCMP UGC 200434
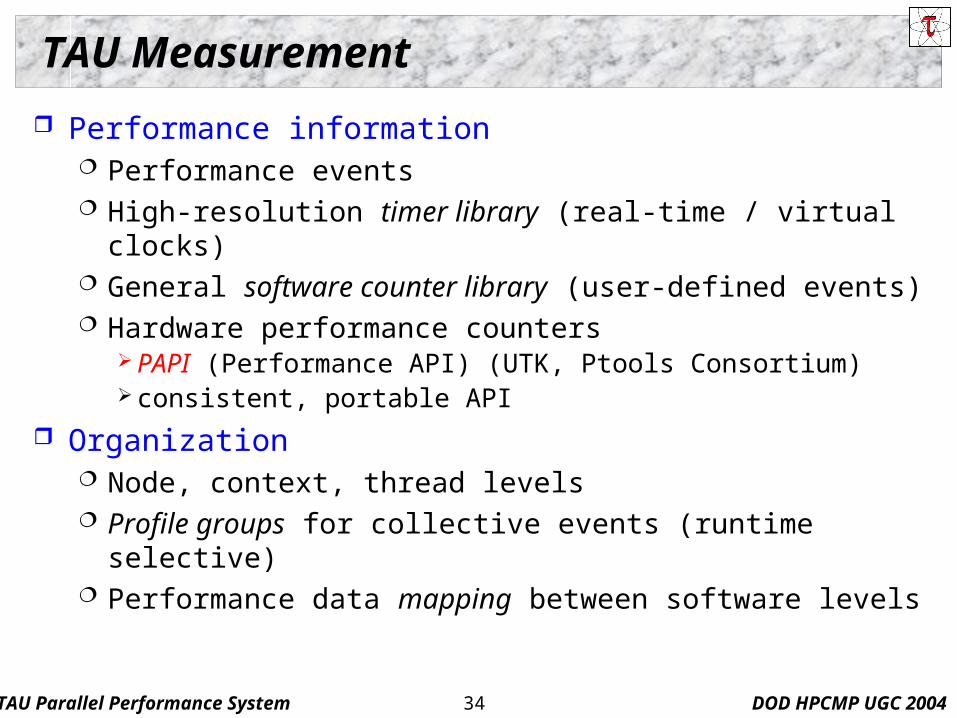
TAU Measurement
Performance information Performance events High-resolution timer library (real-time / virtual clocks) General software counter library (user-defined events) Hardware performance counters
PAPI (Performance API) (UTK, Ptools Consortium) consistent, portable API
Organization Node, context, thread levels Profile groups for collective events (runtime selective) Performance data mapping between software levels
TAU Parallel Performance System DOD HPCMP UGC 200435
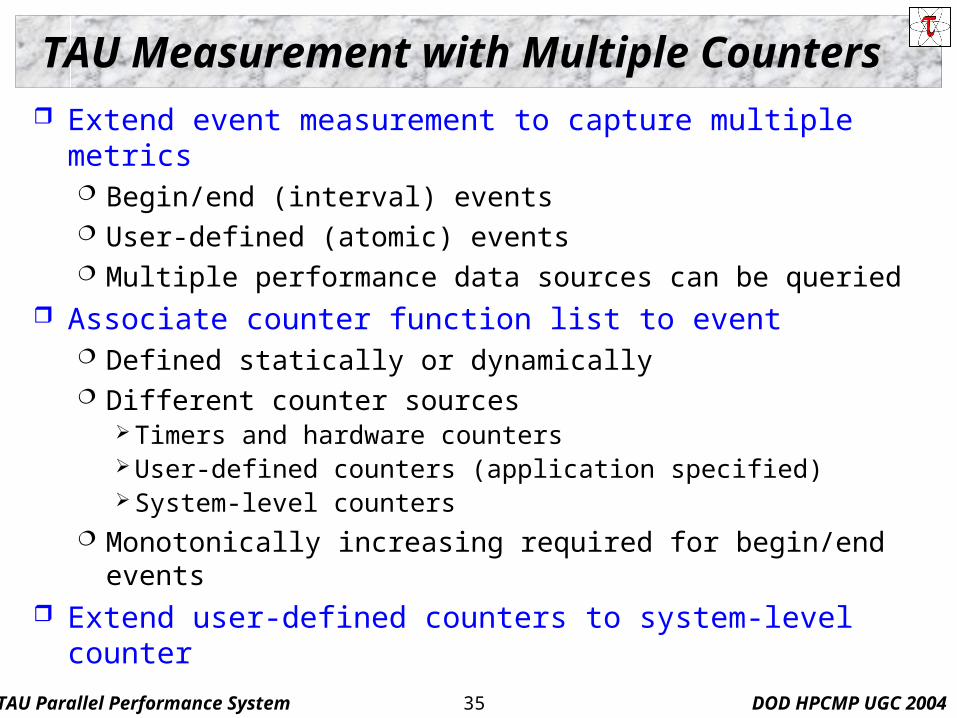
TAU Measurement with Multiple Counters
Extend event measurement to capture multiple metrics Begin/end (interval) events User-defined (atomic) events Multiple performance data sources can be queried
Associate counter function list to event Defined statically or dynamically Different counter sources
Timers and hardware counters User-defined counters (application specified) System-level counters
Monotonically increasing required for begin/end events Extend user-defined counters to system-level counter

TAU Parallel Performance System DOD HPCMP UGC 200436
TAU Measurement Options
Parallel profiling Function-level, block-level, statement-level Supports user-defined events TAU parallel profile data stored during execution Hardware counts values and support for multiple counters Support for callgraph and callpath profiling
Tracing All profile-level events Inter-process communication events Trace merging and format conversion
Configurable measurement library

TAU Parallel Performance System DOD HPCMP UGC 200437
Grouping Performance Data in TAU
Profile Groups A group of related routines forms a profile group Statically defined
TAU_DEFAULT, TAU_USER[1-5], TAU_MESSAGE, TAU_IO, …
Dynamically defined group name based on string, such as “mpi” or “particles” runtime lookup in a map to get unique group identifier uses tau_instrumentor to instrument
Ability to change group names at runtime Group-based instrumentation and measurement control
TAU Parallel Performance System DOD HPCMP UGC 200438
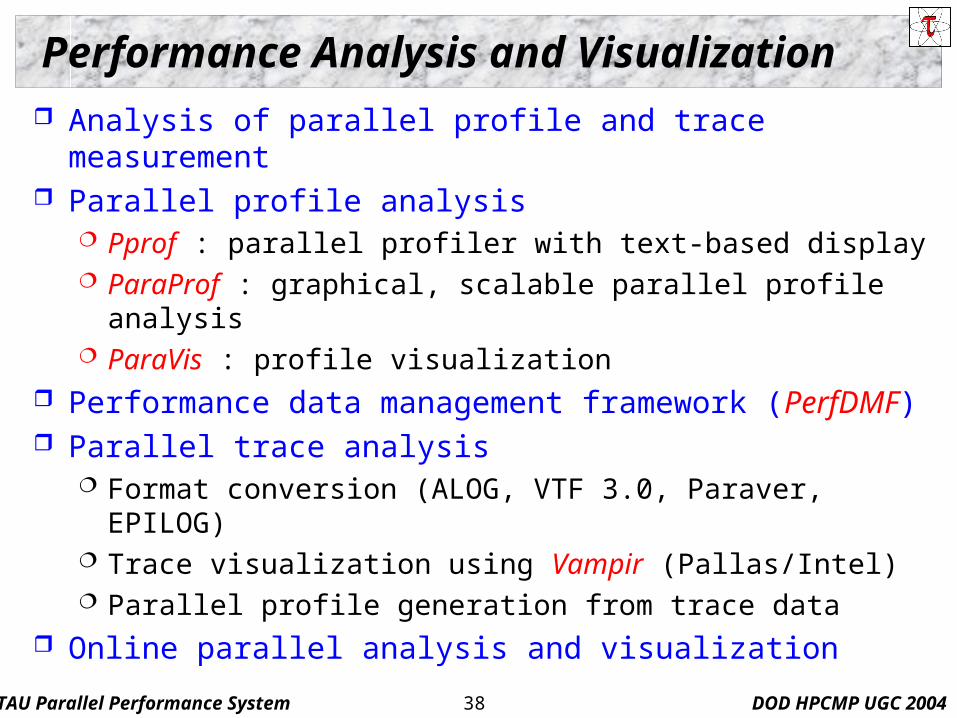
Performance Analysis and Visualization
Analysis of parallel profile and trace measurement Parallel profile analysis
Pprof : parallel profiler with text-based display ParaProf : graphical, scalable parallel profile analysis ParaVis : profile visualization
Performance data management framework (PerfDMF) Parallel trace analysis
Format conversion (ALOG, VTF 3.0, Paraver, EPILOG) Trace visualization using Vampir (Pallas/Intel) Parallel profile generation from trace data
Online parallel analysis and visualization

TAU Parallel Performance System DOD HPCMP UGC 200439
Pprof Command pprof [-c|-b|-m|-t|-e|-i] [-r] [-s] [-n num] [-f file] [-l] [nodes]
-c Sort according to number of calls -b Sort according to number of subroutines called -m Sort according to msecs (exclusive time total) -t Sort according to total msecs (inclusive time
total) -e Sort according to exclusive time per call -i Sort according to inclusive time per call -v Sort according to standard deviation (exclusive
usec) -r Reverse sorting order -s Print only summary profile information -n num Print only first number of functions -f file Specify full path and filename without node ids -l List all functions and exit
TAU Parallel Performance System DOD HPCMP UGC 200440
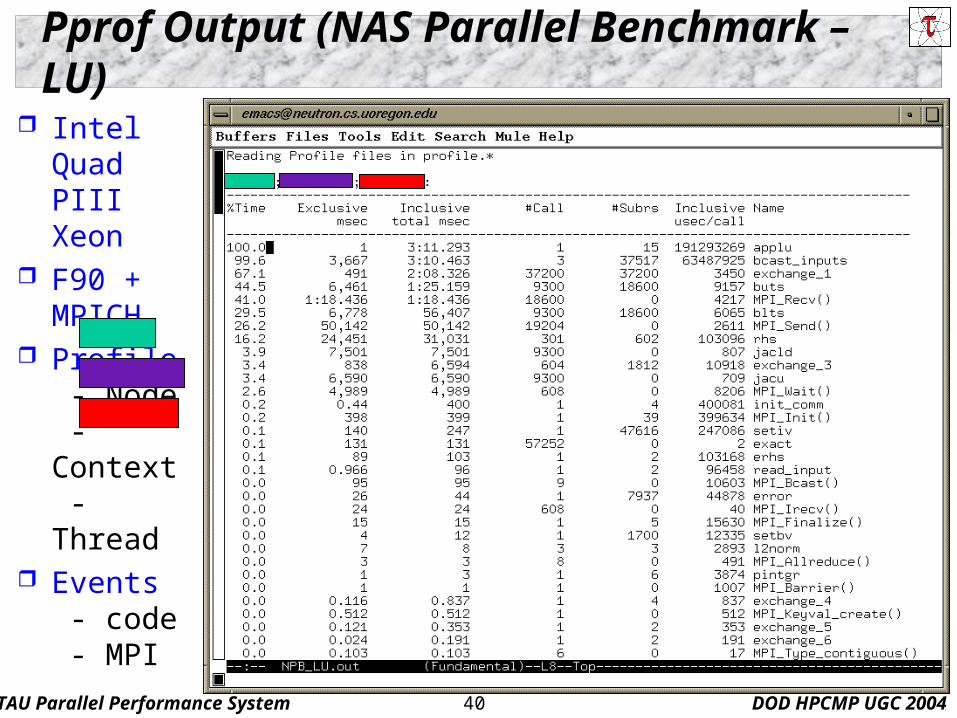
Pprof Output (NAS Parallel Benchmark – LU)
Intel QuadPIII Xeon
F90 + MPICH
Profile - Node - Context - Thread
Events - code - MPI

TAU Parallel Performance System DOD HPCMP UGC 200441
Profile Terminology – Example
Routine “int main( )” Inclusive time
100 secs Exclusive time
100-20-50-20=10 secs #Calls
1 call #Subrs
Child routines called 3
Inclusive time/call 100secs
int main( )
{ /* takes 100 secs */
f1(); /* takes 20 secs */
f2(); /* takes 50 secs */
f1(); /* takes 20 secs */
/* other work */
}
/*
Time can be replaced by counts */
TAU Parallel Performance System DOD HPCMP UGC 200442
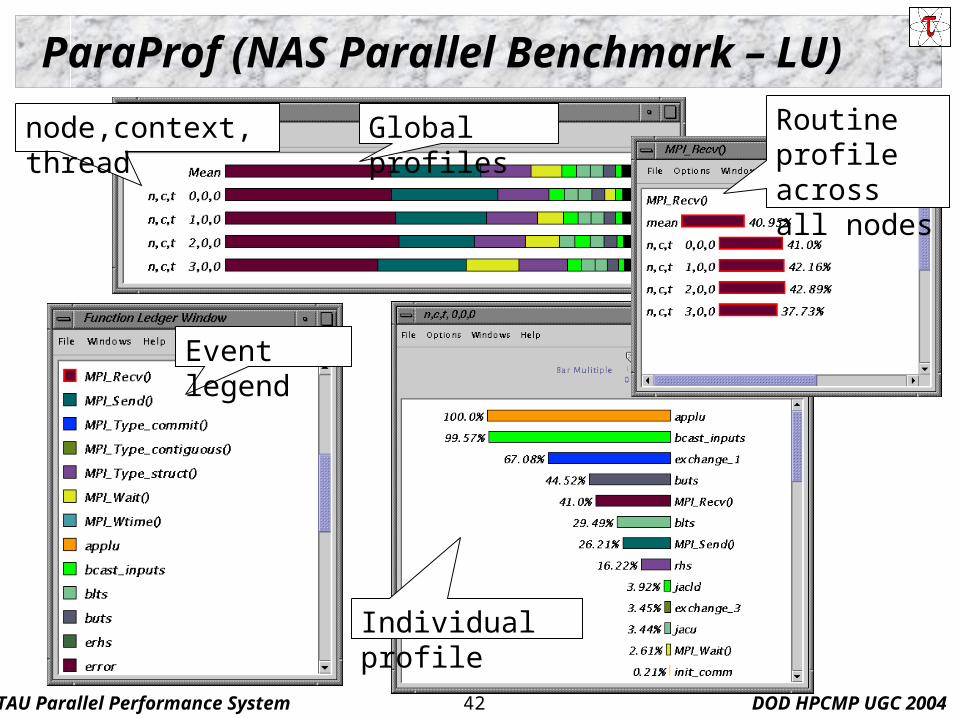
ParaProf (NAS Parallel Benchmark – LU)
node,context, thread Global profiles Routine profile across all nodes
Event legend
Individual profile
TAU Parallel Performance System DOD HPCMP UGC 200443
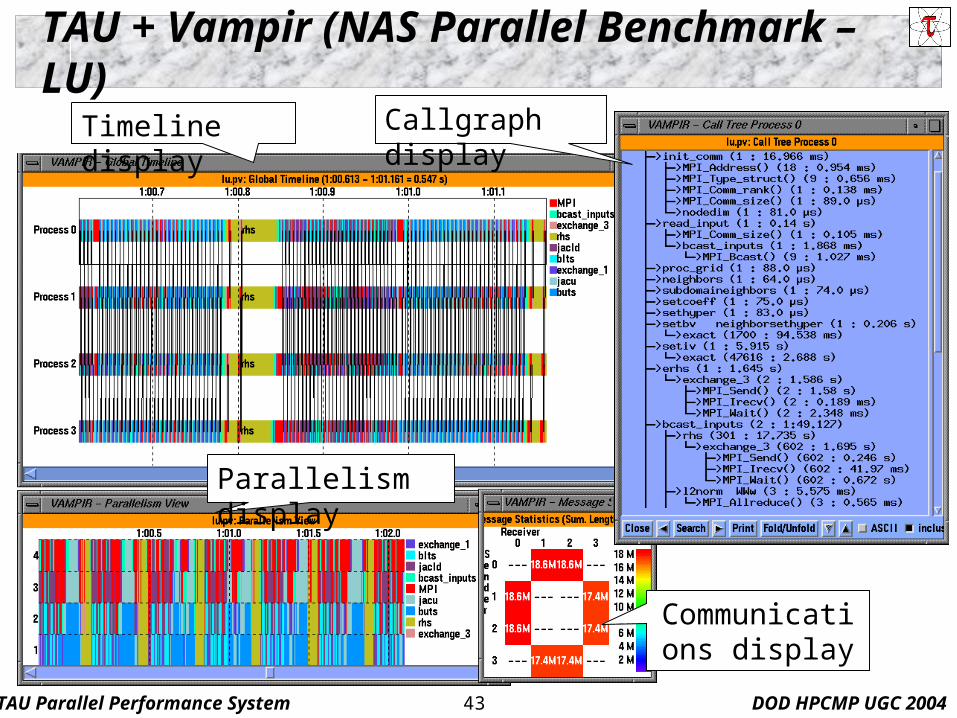
TAU + Vampir (NAS Parallel Benchmark – LU)
Timeline display Callgraph display
Parallelism display
Communications display

TAU Parallel Performance System DOD HPCMP UGC 200444
Semantic Performance Mapping
instrumentation
instrumentation
instrumentation
instrumentation
instrumentation
instrumentation
instrumentation
source code
source code
object code
executable
runtime image
Performance Data
preprocessor
compiler
linker
OS
VM
libraries
run
user-level anddomain-levelabstractions
Associateperformancemeasurementswith high-levelsemanticabstractions

TAU Parallel Performance System DOD HPCMP UGC 200445
Strategies for Empirical Performance Evaluation
Empirical performance evaluation as a series of performance experiments Experiment trials describing instrumentation and
measurement requirements Where/When/How axes of empirical performance space
where are performance measurements made in program when is performance instrumentation done how are performance measurement/instrumentation chosen
Strategies for achieving flexibility and portability goals Limited performance methods restrict evaluation scope Non-portable methods force use of different techniques Integration and combination of strategiesn

TAU Parallel Performance System DOD HPCMP UGC 200446
TAU Performance System Status
Computing platforms (selected) IBM SP / pSeries, SGI Origin 2K/3K, Cray T3E / SV-1 /
X1, HP (Compaq) SC (Tru64), Sun, Hitachi SR8000, NEC SX-5/6, Linux clusters (IA-32/64, Alpha, PPC, PA-RISC, Power, Opteron), Apple (G4/5, OS X), Windows
Programming languages C, C++, Fortran 77/90/95, HPF, Java, OpenMP, Python
Thread libraries pthreads, SGI sproc, Java,Windows, OpenMP
Compilers (selected) Intel KAI (KCC, KAP/Pro), PGI, GNU, Fujitsu, Sun,
Microsoft, SGI, Cray, IBM (xlc, xlf), Compaq, NEC, Intel
TAU Parallel Performance System DOD HPCMP UGC 200447
Selected Applications of TAU
Center for Simulation of Accidental Fires and Explosion University of Utah, ASCI ASAP Center, C-SAFE Uintah Computational Framework (UCF) (C++)
Center for Simulation of Dynamic Response of Materials California Institute of Technology, ASCI ASAP Center Virtual Testshock Facility (VTF) (Python, Fortran 90)
Los Alamos National Lab Monte Carlo transport (MCNP)
Full code automatic instrumentation and profiling ASCI Q validation and scaling
SAIC’s Adaptive Grid Eulerian (SAGE) Fortran 90 automatic instrumentation and profiling
TAU Parallel Performance System DOD HPCMP UGC 200448
Selected Applications of TAU (continued)
Lawrence Livermore National Lab Overture object-oriented PDE package (C++) Radiation diffusion (KULL)
C++ automatic instrumentation, callpath profiling
Sandia National Lab DOE CCTTSS SciDAC project Common component architecture (CCA) integration Combustion code (C++, Fortran 90, GrACE, MPI)
Center for Astrophysical Thermonuclear Flashes University of Chicago / Argonne, ASCI ASAP Center FLASH code (C, Fortran 90, MPI)
TAU Parallel Performance System DOD HPCMP UGC 200449
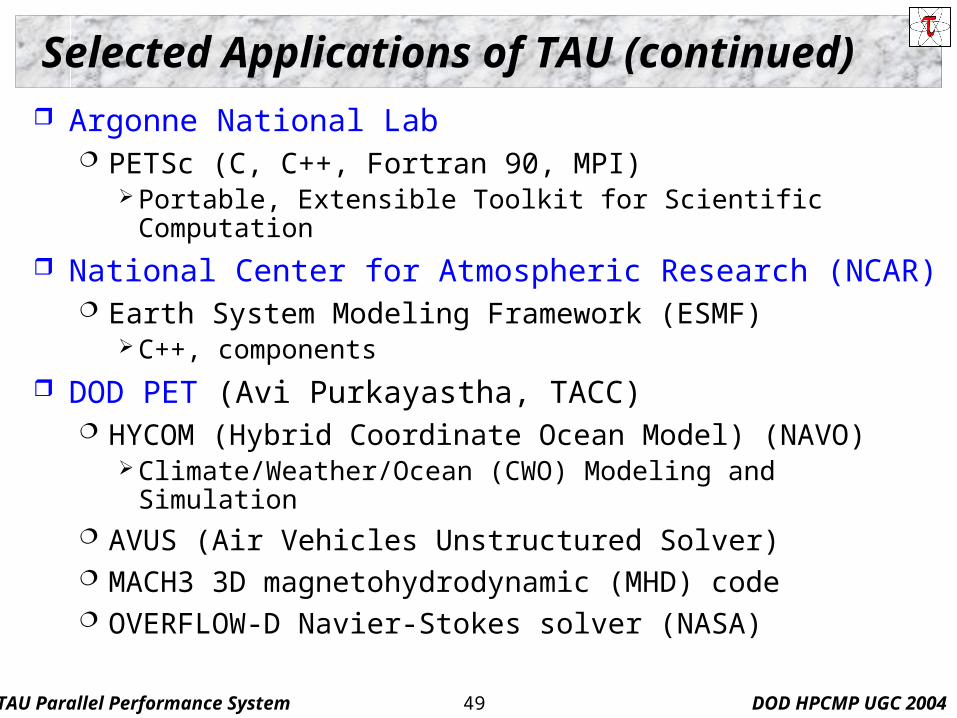
Selected Applications of TAU (continued)
Argonne National Lab PETSc (C, C++, Fortran 90, MPI)
Portable, Extensible Toolkit for Scientific Computation
National Center for Atmospheric Research (NCAR) Earth System Modeling Framework (ESMF)
C++, components
DOD PET (Avi Purkayastha, TACC) HYCOM (Hybrid Coordinate Ocean Model) (NAVO)
Climate/Weather/Ocean (CWO) Modeling and Simulation AVUS (Air Vehicles Unstructured Solver) MACH3 3D magnetohydrodynamic (MHD) code OVERFLOW-D Navier-Stokes solver (NASA)

TAU Parallel Performance System DOD HPCMP UGC 200450
Concluding Remarks
Complex parallel systems and software pose challenging performance analysis problems that require robust methodologies and tools
To build more sophisticated performance tools, existing proven performance technology must be utilized
Performance tools must be integrated with software and systems models and technology Performance engineered software Function consistently and coherently in software and
system environments TAU performance system offers robust performance
technology that can be broadly integrated

TAU Parallel Performance System DOD HPCMP UGC 200451
Supporting Agencies
Department of Energy (DOE) Office of Advanced Scientific Computing
Research (OASCR), MICS Division DOE 2000 ACTS contract “Performance Technology for Tera-class
Parallel Computer Systems: Evolution of the TAU Performance System”
“Performance Analysis of Parallel Component Software”
National Nuclear Security Administration (NNSA), Office of Advanced Simulation and Computing (ASC) University of Utah DOE ASCI Level 1 sub-
contract DOE ASCI Level 3 (LANL, LLNL)

TAU Parallel Performance System DOD HPCMP UGC 200452
Supporting (continued)
National Science Foundation NSF National Young Investigator (NYI)
award Research Centre Juelich
John von Neumann Institute for Computing Dr. Bernd Mohr
Los Alamos National Laboratory
University of Oregon