Taste Sensory Discrimination Study: Brenda, you did a very ...
14
Taste Sensory Discrimination Study: A Preference for Aquafina over Tap Water Brenda, you did a very nice job. There were a few issues with your hypotheses and your analysis, but overall the study looks good. Please see my comments throughout your paper. Grade=91% Brenda C. Ledford MGMT 650-9040 Professor Dowell
Transcript of Taste Sensory Discrimination Study: Brenda, you did a very ...
Taste Sensory Discrimination Study:
A Preference for Aquafina over Tap Water
Brenda, you did a very nice job. There were a few issues with your hypotheses and your analysis, but overall the study looks good. Please see my comments throughout your paper.
Grade=91%
Brenda C. Ledford
MGMT 650-9040
Professor Dowell

Ledford 2
November 20, 2011
Purpose of Study
The purpose of this study is to test if a test subject is able to tell the difference between
Aquafina and tap water, and whether or not this ability to discern equals the population
proportion or not. Americans spend almost 4 billion dollars annually on bottled water (Natural
Resources Defense Council, 2011). A four-year study by the Natural Resources Defense Council
(2011) reveals that regulation of the bottled water industry is ambiguous at best and that
government resources confirm that nearly one fourth of bottled water consumed in the
United States (U.S.) is tap water (para. 5). This taste sensory discrimination study offers many
benefits to both individual consumers and businesses that market bottled water. Benefits
include potential economic savings for individuals on the expenditure of bottled water if the
outcome of the study reveals that there is no preference. Businesses on the other hand may
gain valuable knowledge that will assist in both marketing and product improvements.
Although many brands of bottled water exist, this study focuses on Aquafina because
the test subject claims to be able to tell difference between Aquafina and tap water. Aquafina’s
self-proclaimed statement of quality boasts that Aquafina’s purification process meets the U.S.
Food and Drug Administration’s (FDA) standards and that water sources include “rivers, lakes,
streams, ponds, reservoirs, springs, and wells” (Aquafina, 2011, para2). This study utilizes tap
water from the Maquoketa, Iowa municipal water source. The City of Maquoketa recognizes
that the water meets FDA standards for quality (City of Maquoketa, 2011). The City of
Comment [O1]: Good item to test.

Ledford 3
Maquoketa reports that three active public wells serve as the source for its municipal water
supply (City of Maquoketa, 2011).
The null hypothesis for this study states that the test subject cannot tell the difference
between tap water and Aquafina and his skill is random in which he will be able to ‘guess’ right
exactly half of the time based on our trial run study:
H0: p = .50
The alternative hypothesis for this study is that the test subject can tell the difference between
tap water and Aquafina in which case his ability will produce a preference that is either more
than half right or less than:
H1: p ≠ .50
This hypothesis represents the proportion outcomes of the trial study recommended by
Levine, Stephan, Krehbiel, and Berenson (2011) as a guide for population hypothesis testing (p.
298). This hypothesis was developed from the results of the trial study. The trial study yielded
that the trial test subject identified Aquafina 3 out of 6 times. Therefore with respect to the trial
study, n= 6 (total number of events) and x (the number of times the test subject selected
Aquafina) = 3. p = x / n, or p = 3 / 6. p = .50 this is the value represented in H0 (Levine, Stephan,
Krehbiel, & Berenson, 2011, p. 267).
Method
Participants of the Study. The participants of this study must be individuals who drink
water for hydration. The population frame for this study is:
participants who prefer Aquafina
participants who prefer tap water
Comment [O2]: Here, if he is an expert we not only want his guesses to not equal 50%, but we want
him to get MORE than 50% correct (if he gets less than 50% this would not indicate that he can tell the
difference). So, your alternative hypothesis should
be H1>50%. Your null, then should include all other possibilities, so H0<=50%.

Ledford 4
The participants for this study were selected because they were self-proclaimed experts in
being able to identify Aquafina over tap water. The first participant (trial run) was my son , he
was available for the trial run and has expressed a preference for Aquafina over tap water. The
main participant was my husband, who claims to be able to tell the difference between
Aquafina and tap water. This study uses probability sampling because research reveals that
“probability samples should be used whenever possible” (Levine et al., 2011, p.224).
Assignment limitations dictate that the one participant be used for the study, therefore,
random sampling method was selected over systematic, stratified, or cluster sampling methods.
The participants were individuals that the study administrator knows personally and were the
first individuals thought of who met one of the frame criteria and agreed to participate in the
study.
Experiment Design. This study employs a blind sampling design because it was
desirable that the participants not recognize which water they were drinking. The trials were
paired, presenting one of each type of water at the same time and the test subject was told to
identify which one is tap water or which is Aquafina. The cups were marked A or B with the
distribution schedule noted in Table B1 found in Appendix B. The test subject was asked to
taste cup A first then taste B. The Sample Space for this study is:
All Possible Events Probability percentage
Selecting A when Aquafina is A 1 / 4 = .25
Selecting B when Aquafina is B 1/ 4 = .25
Selecting A when tap water is A 1/ 4 = .25
Selecting B when tap water is B 1 /4 = .25
Comment [O3]: This is not probability sampling.
This is basically a judgment sample, which is a non-probability sampling method.
Comment [O4]: Write in past tense since this is a report of a study that has already been completed.
Comment [O5]: Good
Comment [O6]: Why did you choose paired trials over independent trials?

Ledford 5
Total .25 + .25 + .25 + .25 = 1.00
One of each water type will be presented at each event so the probability of selecting
Aquafina during any trial will be 1 out of 2 or 1 / 2 or .50 or 50% probability (based on Levine et
al., 2011, p. 134). Additional factors were taken into consideration to make sure that each trial
remained independent:
To ensure that the random variables in the two water products was as neutral as possible precautions were taken with the tap water. The tap water utilized for this study has a tendency to smell like chlorine when it comes out of the tap, so to avoid this, the tap water was collected days earlier and let it sit out on the counter to let the smell dissipate
To prevent temperature change in the product both products were set out on the same counter for at least a day prior to testing so that they would be the same temperature
To alleviate the tendency in tasting trials of the flavors blurring together research was conducted to evaluate an appropriate palate cleanser. Two options were found to be affordable choices for this study, cracker, or bread .The palate cleanser was chewed between each sample tasting. It was decided to use bread because the crackers available were salted and it was speculated that this would influence the outcome negatively.
Step-by-Step Procedure. The procedure followed for this study was:
1. Gather two identical glasses, and the means to wash the glasses after each use 2. Gather reusable sticky note labels and mark “A” or “B” on two 3. Gather 2 glass liquid measuring cups, such as Pyrex 4. Cut two slices of bread of choice into 1” cubes and place in a sandwich baggie 5. Pour 32oz. of Aquafina into a container and set out to achieve a room
temperature 6. Pour 32oz. of tap water into a container and set out to achieve a room
temperature
Sampling procedure.
1. Pour 1/3 cup of tap water and 1/3 cup of Aquafina into the glasses. Place the labels on the glasses and note in a data table, which is which.
Comment [O7]: Good!

Ledford 6
2. Present the glasses marked “A” and “B” to the test subject and explain the tasting procedure of sipping or drinking all of the first sample of choice and then chewing a cube of bread to cleanse the palate prior to sampling the second sample. The test subject was asked to taste “A” before “B” at each trial.
3. Ask the test subject to indentify “A” or “B” as Aquafina or tap water and record the selection or choice in the data table.
4. Repeat until twelve trials are completed then precede with the Data Analysis steps. For this study it was determined that the 12 trials would span a day to comply with the test subjects time constraints.
The data table for this study may be found within Table B1 in Appendix B of this report. The
table reveals the labeling and product distribution for this study.
Data Analysis
The Null Hypothesis and Alternative Hypothesis both are non-directional statements.
This indicates for a 95% confidence level that the remaining 5% could be split between the
lower and upper tails. Indicating that .025 region of rejection could fall in the lower tail- if the
test subject is not an expert but that the remaining .025 might fall within the upper tail if the
test subject indeed has a skill. Therefore, a two-tailed test is appropriate for this situation.
Although the test subject professes to be an expert in detecting the difference between
Aquafina and tap water, the research indicates that a significant portion of bottled water is tap
water. Therefore, this study administrator felt the outcome of expertise was not certain enough
to be directional. The data analysis implements the Z Test of Hypothesis for the Proportion
because this study is interested in the proportion of preference for tap water among the
population that either is below or above the .50 value stated in H0. The steps in calculating the
data analysis are as follows:
1. Define the hypothesis:
H0: p =.50
Comment [O8]: Actually, your hypotheses should have been directional, indicating that you
should use a one-tailed test and all of the rejection
region is in the upper tail.

Ledford 7
H1: p ≠ .50
2. Determine the sample size, n = 12 . This number was selected because the course text
notes that it is always better to overestimate rather than underestimate the sample
size. Since the text states that a statistic test “will “follo[w] a standardized normal
distribution [if] the number of events of interest and the number of events not of
interest are each at least 5” (Levine et al., 2011, p. 321). That number would have been
10 trials to provide for an even split of 5 for each event of interest. Twelve exceeds this
estimation.
3. Because the Null Hypothesis will be rejected if the population prefers tap water less
than half or more than half of the time a two-tale test is sufficient for determination.
The Z Test of the Hypothesis for the Proportion was selected. The Level of Significance,
α = .05. The Decision Rule for this study is:
Reject the H0 if ZSTAT < - 1.96 or if ZSTAT > + 1.96;
Otherwise, do not reject H0
4. Because the Trial Study indicated that tap water was preferred 3 out of 6 trials, (p) = .50
5. Excel was used to calculate the Sample Proportion by using the respective formula
found within the Excel table in Appendix D, Table D1
6. Then calculate Standard Error, Z Test, Lower and upper Critical Values and the p-Value
following the formulas presented in Appendix D, Table D1
7. The results for the previous values are: Sample Proportion: 1, Standard Error: .1443, Z
Test Statistic: 3.4641, Lower Critical Value: -1.96, Upper Critical Value: 1.96, p-Value:
.000532. These values can be seen in table format within table C1 in Appendix C. Note
Comment [O9]: tail
Comment [O10]: With a one-tailed test, the
critical value is 1.65

Ledford 8
that the Standard Error, Z Test were formatted to 4 decimal places while the Lower and
Upper Critical Values were formatted to two decimal places. The last step was creating
the conditional assessment to either accept or reject the Null Hypothesis as dictated by
the Decision Rule stated previously by implementing the formula within Table D1 in
Appendix D.
Discussion
The calculations of the study data reveal a Z Test Statistic of 3.4641; which is greater
than the upper critical value of + 1.96. This means that the proportion of the study falls within
the upper tail of the distribution that is within a region of rejection. Therefore, the Null
Hypothesis is rejected. Rejection of the Null Hypothesis shows that the test subject exhibits a
high proportion preference for Aquafina and may indeed have expertise to tell the difference
between Aquafina and tap water. This may indicate that the batch of Aquafina utilized was
from a source other than a public well or that the purification processes employed by the
provider masked the taste of well water enough to skew results. The conclusion that can be
drawn from the tests subject’s perfect score is that a sampling error has occurred. Two areas of
sampling errors might be involved: coverage error and/or sampling error. If a coverage error
occurred this would be a reason to examine the frame descriptions and to examine if the test
subject represents the population or if selection bias has occurred (Levine et al., 2011, p. 229).
A sampling error may have occurred because the sampling size was too small (Levine et al.,
2011, p. 230).
Changes that might be considered if the test could be redone include increasing the
number of test subjects to include more random individuals outside the study administrators

Ledford 9
home and increasing the sample size. Increasing the number of test subjects was not detected
at the trial run because the assignment instructions limited the test subjects to one person.
The sample size perhaps was not sufficient because the number of trials used in the trial run
were random. The actual study trials were selected given information in the text. Perhaps if the
trial run had consisted of the ten suggested trials and the actual study had doubled that size the
results would have been different. Additional elements to consider would be to raise the
confidence level to 99%. 95% was selected because the Levine et al. (2011) text indicates this is
the most common confidence level selected. The oversights and uncertainty in this study most
certainly can be attributed to the study administrator’s lack of skill and understanding of
running a study. This was the first such study ever attempted; perhaps future studies would
yield better initial selections and choices.

Ledford 10
References
Aquafina. (2011). Bottled water information statements required under California law. Water
Quality and Information Page. Retrieved from: http://www.aquafina.com/
Levine, D.M., Stephan, D.F., Krehbiel, T.C., & Berenson, M.L. (2011). Statistics for managers
using Microsoft Excel. Boston: Prentice Hall.
Maquoketa, City of. (2011). Water quality report. Chamber of Commerce Home Page. Retrieved
from: http://www.maquoketachamber.com/city/utilityinfo_water.html
Natural Resources Defense Council. (2011). Bottled water pure drink or pure hype? Water Main
Page. Retrieved from: http://www.nrdc.org/water/drinking/bw/exesum.asp

Ledford 11
Appendix A
Table A1
Trial Study Data
Trial # Cup A Cup B Choice
1 Aquafina Tap B
2 Tap Aquafina B
3 Tap Aquafina A
4 Aquafina Tap B
5 Tap Aquafina B
6 Aquafina Tap A
Results:
Aquafina 3/6 = .50 or 50%
Tap Water 3/6= .50 or 50%

Ledford 12
Appendix B
Table B1
Actual Study Data
Trial # Cup A Cup B Choice
1 Aquafina Tap A
2 Tap Aquafina B
3 Aquafina Tap A
4 Aquafina Tap A
5 Tap Aquafina B
6 Tap Aquafina B
7 Aquafina Tap A
8 Tap Aquafina B
9 Aquafina Tap A
10 Aquafina Tap A
11 Tap Aquafina B
12 Tap Aquafina B
Results=
Aquafina 10/10 = 1.0 or 100%
Tap Water 0/10 = 0%

Ledford 13
Appendix C
Table C1
Excel Calculation for the Z Test for the Hypothesis of the Proportion
Z test for the Hypothesis of the Proportion
Data
Null Hypothesis p= 0.5
Level of Significance α= 0.05
Number of items of Interest 12
Sample size 12
Intermediate Calculations
Sample proportion 1
Standard error 0.1443
Z Test Statistic 3.4641
Lower-Tail Test
Lower Critical Value -1.96
Upper Critical Value 1.96
p-Value 0.000532006
reject the null hypothesis
Ledford 14
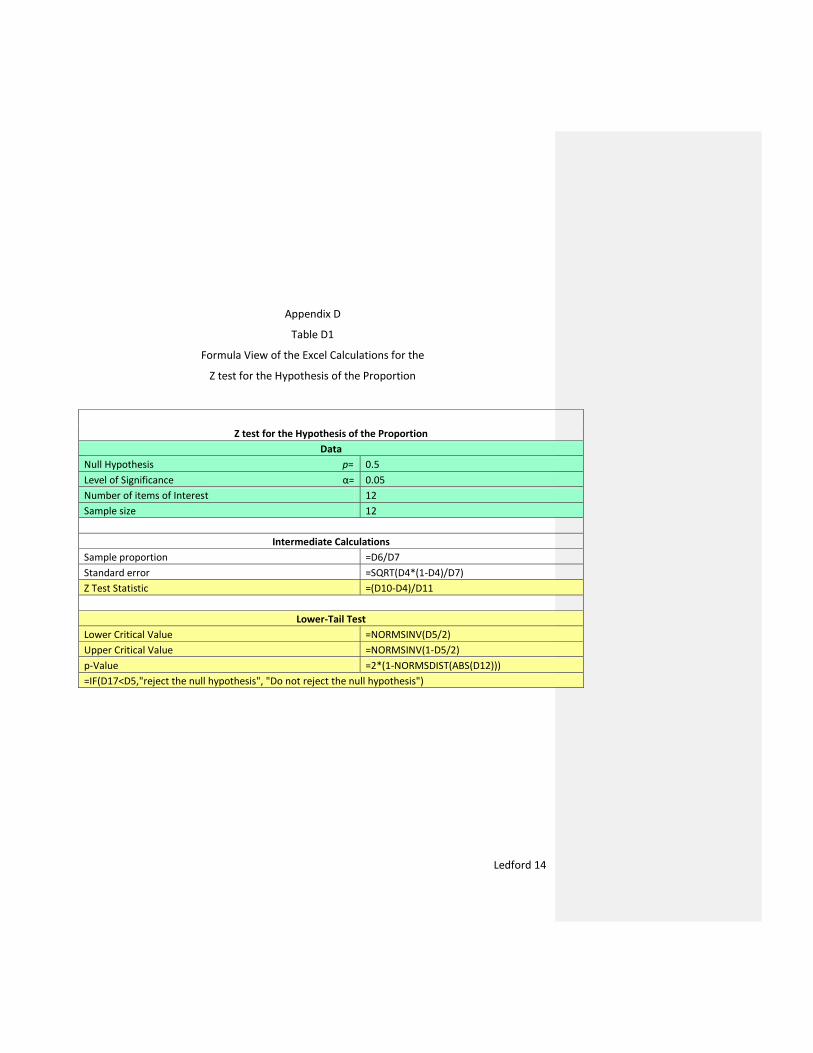
Appendix D
Table D1
Formula View of the Excel Calculations for the
Z test for the Hypothesis of the Proportion
Z test for the Hypothesis of the Proportion
Data
Null Hypothesis p= 0.5
Level of Significance α= 0.05
Number of items of Interest 12
Sample size 12
Intermediate Calculations
Sample proportion =D6/D7
Standard error =SQRT(D4*(1-D4)/D7)
Z Test Statistic =(D10-D4)/D11
Lower-Tail Test
Lower Critical Value =NORMSINV(D5/2)
Upper Critical Value =NORMSINV(1-D5/2)
p-Value =2*(1-NORMSDIST(ABS(D12)))
=IF(D17<D5,"reject the null hypothesis", "Do not reject the null hypothesis")